attachment e - handley - a note on the historical equity risk premium
TRANSCRIPT

Report prepared for the
Australian Energy Regulator
A Note on the
Historical Equity Risk Premium
John C. Handley
University of Melbourne
Final
17 October 2008

2
1. INTRODUCTION
Pursuant to the National Electricity Rules, the Australian Energy Regulator (AER) is
currently undertaking a review of the weighted average cost of capital (WACC)
parameters to be adopted in determinations for electricity transmission and distribution
network service providers. In this regard, the AER has sought advice on the following
matters in relation to the expected market risk premium:
● an estimate of historical excess returns for the 1958-2007 period, relative to 10
year Commonwealth Government Securities (CGS) and bills, including gross up
for a gamma of 0.5 and 1.0 and compare the results to those in Officer and
Bishop (2008). Include standard errors and 95% confidence intervals;
● an estimate of historical excess returns to include “latest 2008 data available”
and for a range of start dates (including 1883-2008, 1958-2008, 1988-2008),
relative to 10 year CGS and bills, including gross up for a gamma of 0.5 and 1.0.
Include standard errors and 95% confidence intervals;
● an estimate of historical excess returns based on 5 year CGS using the longest
data available, including gross up for a gamma of 0.5 and 1.0. Include standard
errors and 95% confidence intervals;
● the approach applied by Officer and Bishop (2008) to gross up historical excess
returns to account for imputation credits; and
● the appropriateness of using an effective tax rate (instead of the statutory
corporate tax rate) to gross up historical excess returns to account for imputation
credits.

3
2. ESTIMATION OF HISTORICAL EXCESS RETURNS OVER THE
PERIOD 1883 - 2007
2.1 Data and Approach
In this paper, estimates of historical excess returns (or equivalently, estimates of the
historical equity risk premium) over the period 1883 to 2007 are based on the study by
Brailsford, Handley and Maheswaran (2008). BHM (2008) present a set of estimates of
the historical equity risk premium in Australia over a number of sample periods from
January 1883 to December 2005.
Annual stock return, (10 year) bond return and bill return data for each calendar year
from 1883 to 2005 and imputation credit yield data for each calendar year from 1988 to
2005 is sourced from BHM (2008).1 This is supplemented with two years of additional
data for the calendar years 2006 and 2007, using sources and methodologies consistent
with BHM (2008). In particular:
● Stock Returns: daily closing values of the All Ordinaries Accumulation Index
during 2006 and 2007 are obtained from the Australian Stock Exchange (via
IRESS). The annual Historical Stock Accumulation Index Series of BHM
(2008) is then extended for two years by setting the 2006 value of the series
equal to the average value of the All Ordinaries Accumulation Index in
December 2006 and setting the 2007 value of the series equal to the average
value of the All Ordinaries Accumulation Index in December 2007. This leads
to an annual series of (discrete) stock returns – attributable to dividends and
capital gains/losses – for the 125 calendar years from 1883 to 2007.
● 10 Year Bond Returns: daily yields on 10 year Commonwealth Government
treasury bonds during 2006 and 2007 are obtained from the Reserve Bank of
Australia (RBA) website. The annual Historical Bond Return Series of BHM
(2008) is then extended for two years by setting the 2006 value of the series
1 See BHM (2008) for details of data sources and return series construction.

4
equal to the yield at the end of December 2006 and setting the 2007 value of the
series equal to the yield at the end of December 2007.
● Bill Returns: daily yields on 90 day Bank Accepted Bills during 2006 and 2007
are obtained from the RBA website. The annual Historical Bill Return Series of
BHM (2008) is then extended for two years by setting the 2006 value of the
series equal to the geometric average of the bill yields at the end of December
2005, March 2006, June 2006 and September 2006 and setting the 2007 value of
the series equal to the geometric average of the bill yields at the end of
December 2006, March 2007, June 2007 and September 2007. This reflects the
annual return on a rolling investment in bills assuming reinvestment on a
quarterly basis.2
● Imputation Credit Yields: average imputation credit yields on the All Ordinaries
Index during 2006 and 2007 are sourced from the Australian Taxation Office
(ATO) website. The annual imputation credit yield series of BHM (2008) is
then extended for two years by setting the 2006 value of the series equal to
(weighted) average imputation credit yield for the 12 months ending December
2006 and setting the 2007 value of the series equal to (weighted) average
imputation credit yield for the 12 months ending December 2007.
In addition, a new 5 year historical bond return series is constructed along similar lines
to the 10 year bond return series. Yields on 5 year Commonwealth Government
treasury bonds appear to be first available from July 1969. For July 1969 to December
1971, the data is sourced from the RBA Statistical Bulletin.3 For 1972–2007, data is
sourced from the RBA website. An annual return series for the period 1969 to 2007 is
constructed by taking the yields on the 5 year treasury bonds at the end of December of
each calendar year.
2 As noted in BHM (2008, p.84), yields on 90 day Bank Accepted Bills have been used since the Commonwealth Government suspended issues of three month treasury notes in December 2002. Whilst these yields will contain some small default premium it will likely be small when averaged over the sample periods. 3 Reserve Bank of Australia, Statistical Bulletin Financial Supplement, September 1972, page 67. There is some data dating back to 1937, relating to CGS with a maturity of between 5 years and under 10 but this has not been used here.

5
2.2 Results
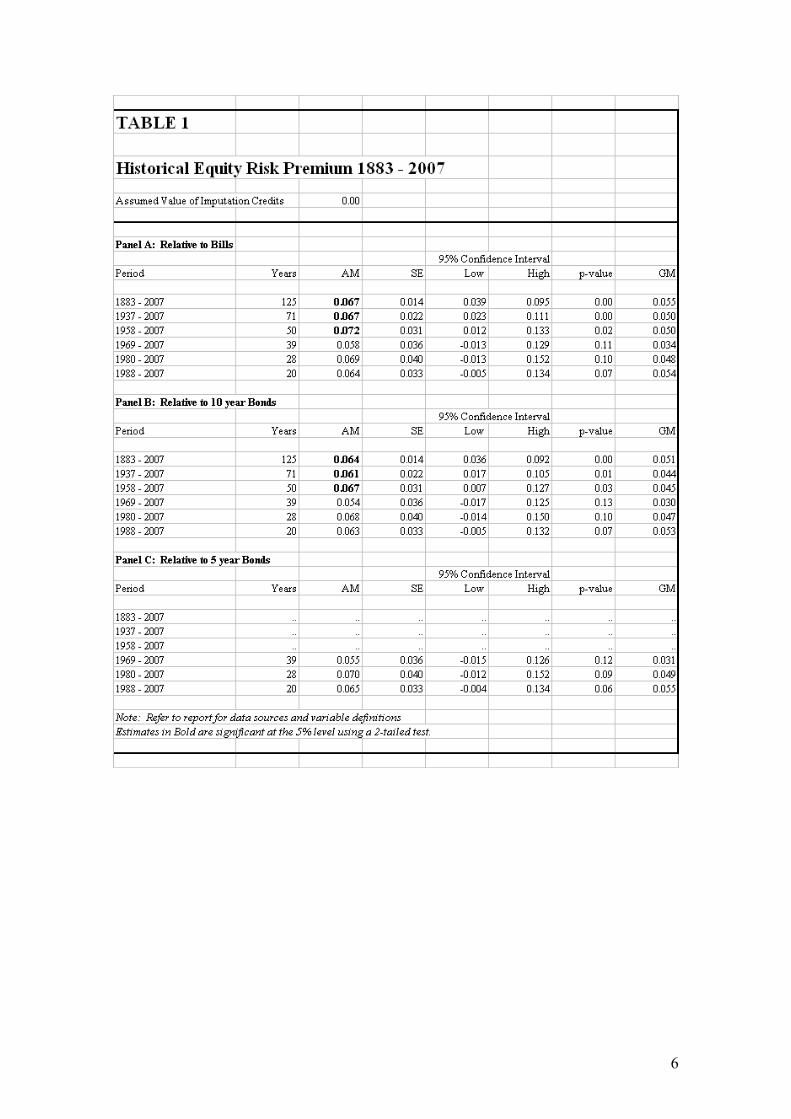
Table 1 sets out various statistics of the historical equity risk premium in Australia over
a number of sample periods from January 1883 to December 2007. The differing start
dates of 1883, 1937, 1958 and 1980 correspond to periods of increasing data quality but
decreasing sample size. The start date of 1969 reflects the availability of data on 5 year
treasury bonds. The start date of 1988 reflects the introduction of the dividend
imputation tax system in Australia. AM is the arithmetic mean, SE is the standard error,
Low and High define the 95% confidence interval for the “true” but unobservable value
of the mean, p-value is the (2-tail) significance level of AM and GM is the geometric
mean. The equity premium is defined as the (simple) difference between the stock
return and the relevant proxy for the risk free rate – bills in panel A, 10 year bonds in
panel B and 5 year bonds in panel C. Calculations are based on nominal, discrete
returns and the stock return takes into account cash dividends and capital gains/losses
only.
Relative to 10 year bonds (bills), the equity risk premium has averaged 6.4% p.a. (6.7%
p.a.) over 1883–2007.
BHM (2008) document concerns about data quality the further back into the past one
looks and in particular suggest there are sufficient question marks over the quality of
data prior to 1958 to warrant any estimates based thereon to be treated with caution.
Relative to 10 year bonds (bills), the equity risk premium has averaged 6.7% p.a. (7.2%
p.a.) over 1958–2007, which is a period of relatively good data quality.
Relative to 5 year bonds, the equity risk premium has averaged 5.5% p.a. over 1969–
2007. This compares to 5.4% p.a. (5.8% p.a.) relative to 10 year bonds (bills) over the
same period – but all three estimates are statistically insignificant at the 5% level.
6

7
Tables 2 sets out similar statistics of the historical equity risk premium in Australia
assuming (distributed) imputation credits are valued at 50 cents in the dollar.4
Relative to 10 year bonds (bills), the grossed-up equity risk premium has averaged 6.5%
p.a. (6.9% p.a.) over 1883–2007.
Relative to 10 year bonds (bills), the grossed-up equity risk premium has averaged 7.1%
p.a. (7.6% p.a.) over 1958–2007, which is a period of relatively good data quality.
Relative to 5 year bonds, the grossed-up equity risk premium has averaged 6.0% p.a.
over 1969–2007. This compares to 5.9% p.a. (6.3% p.a.) relative to 10 year bonds
(bills) over the same period – but all three estimates are statistically insignificant at the
5% level.
Table 3 presents corresponding results assuming (distributed) imputation credits are
fully valued.
The estimates over the period 1883–2007 are higher than the corresponding estimates
over 1883–2005 that appear in BHM (2008) primarily due to the strong stock market
performance during 2006 and 2007.
A plot of the annual series of historical equity risk premium from 1883 to 2007 appears
in Chart 1. Of note is the well known substantial degree of volatility in the series.
4 In this case, the stock return takes into account cash dividends, the value of imputation credits attached to those dividends and capital gains/losses.

8

9

10
Chart 1Historical Equity Risk Premium in Australia
1883 - 2007
-50%
-40%
-30%
-20%
-10%
0%
10%
20%
30%
40%
50%
60%
1880 1900 1920 1940 1960 1980 2000

11
3. ESTIMATION OF HISTORICAL EXCESS RETURNS OVER THE
PERIOD 1883 - 2008
3.1 Data and Approach
Recent events in stock and bond markets suggest inclusion of returns for the 2008
calendar year in the estimation period will likely lead to lower estimates than those
appearing in Tables 1, 2 and 3. Unfortunately, complete data for 2008 is not yet
available. However, in order to obtain a preliminary indication of the impact of recent
market events, the various return and yield series for 1883 to 2007 is supplemented by
one additional “year” of data as follows:
● Stock Returns: daily closing values of the All Ordinaries Accumulation Index
during 2008 to date are obtained from the Australian Stock Exchange (via
IRESS). The annual stock return series from section 2.1 above is then extended
by setting the 2008 value of the series equal to the average value of the All
Ordinaries Accumulation Index over the month ending 15 October 2008.
● 10 Year Bond Returns: daily yields on 10 year Commonwealth Government
treasury bonds during 2008 to date are obtained from the RBA website. The
annual 10 year bond return series from section 2.1 above is then extended by
setting the 2008 value of the series equal to the yield as at 15 October 2008.
● Bill Returns: daily yields on 90 day Bank Accepted Bills during 2008 to date
are obtained from the RBA website. The annual bill return series from section
2.1 above is then extended by setting the 2008 value of the series equal to the
geometric average of the bill yields at the end of December 2007, March 2008,
June 2008 and September 2008.
● Imputation Credit Yields: average imputation credit yields on the All Ordinaries
Index during 2008 to date are sourced from the ATO website. The annual
imputation credit yield series from section 2.1 above is then extended by setting
the 2008 value of the series equal to (weighted) average imputation credit yield
for the 12 months ending June 2008 – the latest available.
12
It is stressed that estimates based on this extended 1883–2008 return series should be
considered preliminary only and treated with caution as a complete set of data for 2008
will only become available at year end.
3.2 Results
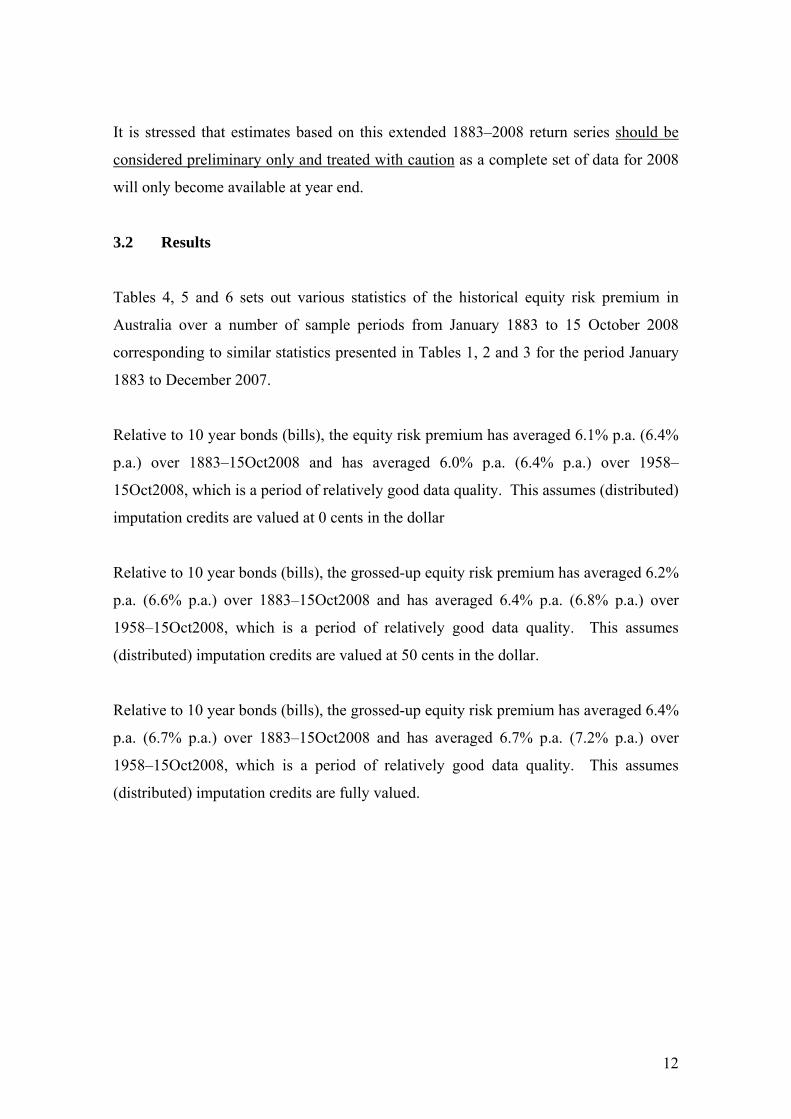
Tables 4, 5 and 6 sets out various statistics of the historical equity risk premium in
Australia over a number of sample periods from January 1883 to 15 October 2008
corresponding to similar statistics presented in Tables 1, 2 and 3 for the period January
1883 to December 2007.
Relative to 10 year bonds (bills), the equity risk premium has averaged 6.1% p.a. (6.4%
p.a.) over 1883–15Oct2008 and has averaged 6.0% p.a. (6.4% p.a.) over 1958–
15Oct2008, which is a period of relatively good data quality. This assumes (distributed)
imputation credits are valued at 0 cents in the dollar
Relative to 10 year bonds (bills), the grossed-up equity risk premium has averaged 6.2%
p.a. (6.6% p.a.) over 1883–15Oct2008 and has averaged 6.4% p.a. (6.8% p.a.) over
1958–15Oct2008, which is a period of relatively good data quality. This assumes
(distributed) imputation credits are valued at 50 cents in the dollar.
Relative to 10 year bonds (bills), the grossed-up equity risk premium has averaged 6.4%
p.a. (6.7% p.a.) over 1883–15Oct2008 and has averaged 6.7% p.a. (7.2% p.a.) over
1958–15Oct2008, which is a period of relatively good data quality. This assumes
(distributed) imputation credits are fully valued.

13

14
15
16
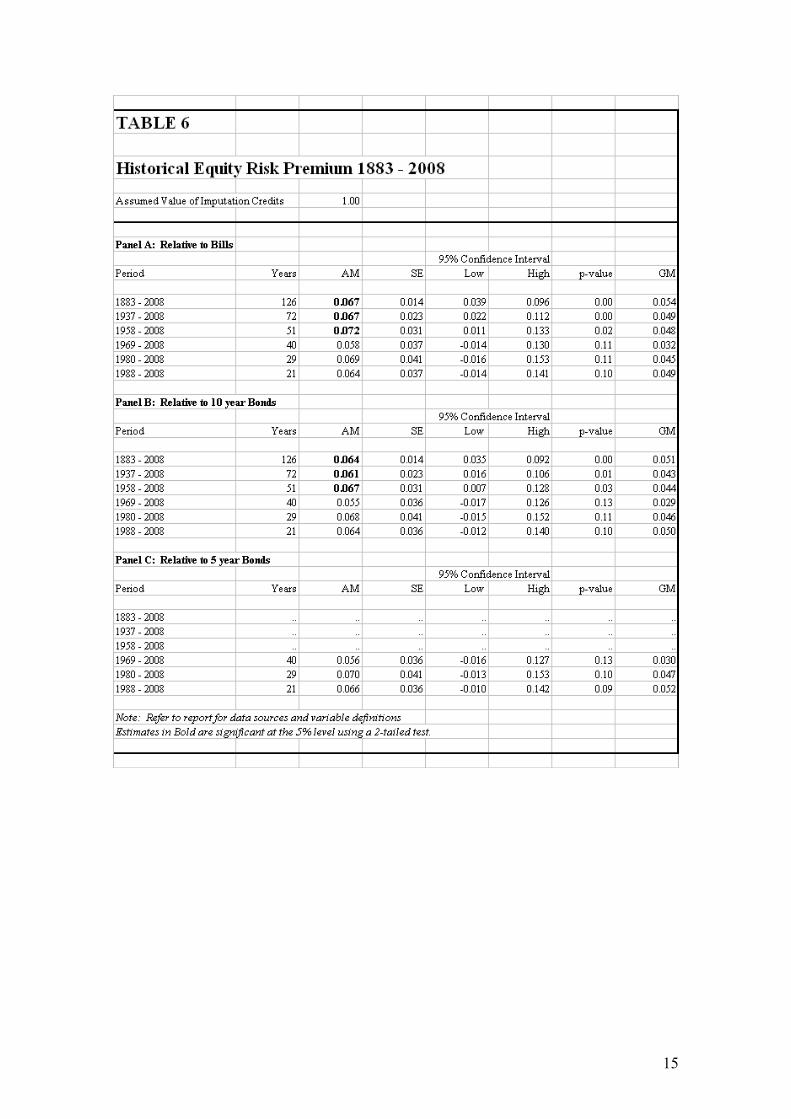
3.3 Comparison of Results with Estimates in Officer and Bishop (2008)
A comparison of the estimates presented in sections 2.2 and 3.2 above with those
appearing in Officer and Bishop (2008)5 is set out in Table 7 below:
TABLE 7 Historical Equity Risk Premium 1883 – 2007 (Relative to 10 year Bonds)
Period Officer and Bishop (2008) This Report
Years AM SE Years AM SE Assuming (distributed) imputation credits have no value 1883-2007 125 7.5 1.5 125 6.4 1.4 1958-2007 50 6.7 3.1 50 6.7 3.1 Assuming (distributed) imputation credits are valued at 50 cents in the dollar 1883-2007 125 7.6 n.a. 125 6.5 1.4 1958-2007 50 7.1 n.a. 50 7.1 3.1 Assuming (distributed) imputation credits are fully valued 1883-2007 125 7.8 n.a. 125 6.7 1.4 1958-2007 50 7.4 n.a. 50 7.5 3.1
The results for the period 1958 to 2007 are consistent.
The difference in results for the period 1883 to 2007 is likely largely explained by
differences between the pre-1958 annual stock return data used by BHM (2008) – on
which estimates in this report are based – and the pre-1958 annual stock return data
used by Officer (1989) – on which estimates in Officer and Bishop (2008) are based. In
particular, BHM (2008 p.92) suggest the difference between their results and those of
Officer (1989) is largely explained by their estimate of lower stock returns which in turn
appears to be largely explained by differences in the dividend yield series used in the
retrospective construction of the underlying stock accumulation index for the period
prior to 1958.
5 See Tables 6 and 7 of Officer and Bishop (2008).
17
Finally, the methodology used by Officer and Bishop (2008) to gross up historical stock
returns (for a given assumed value of imputation credits) is generally consistent with
that of BHM (2008) – both of which follows Officer’s (1994) general definition for a
grossed-up return.6 It is noted, however, that Officer and Bishop (2008) estimate an
imputation credit yield for the entire 1988 to 2007 period. In comparison, in this report
the series of (weighted) average imputation credit yields on the All Ordinaries Index, for
each calendar year since 1998, is sourced from the ATO website.
REFERENCES
Brailsford, T.J., J.C. Handley and K. Maheswaran, 2008, Re-examination of the Historical Equity Risk Premium in Australia, Accounting and Finance, 48, 73–97. Officer, R.R., 1989, Rates of Return to Shares, Bond Yields and Inflation Rates: An Historical Perspective, in: Ball, R., P. Brown, F. Finn and R.R. Officer. eds., Share Markets and Portfolio Theory (2nd Edition, University of Queensland Press). Officer, R.R., 1994, The Cost of Capital under an Imputation Tax System. Accounting and Finance, 34, 1–17. Officer, R.R. and S. Bishop, 2008, Market Risk Premium – A Review Paper, Prepared for Energy Networks Association, Australian Pipeline Industry Association and Grid Australia, ValueAdviserAssociates, Melbourne, August.
6 In estimating imputation credit yields, the statutory corporate tax rate rather than the effective corporate tax rate is the appropriate rate to use since imputation credits represent tax paid by the company at the statutory rate.