attachment a operations and maintenance master plan for ... · pdf fileattachment a operations...
TRANSCRIPT
Attachment A
Operations and Maintenance Master Plan for Aquifer Restoration and Wastewater Treatment
Fernald Preserve

This page intentionally left blank
U.S. Department of Energy Comprehensive Legacy Management and Institutional Controls Plan Doc. No. S03496-4.0—Final Attachment A—Operations and Maintenance Master Plan April 2010 Page i
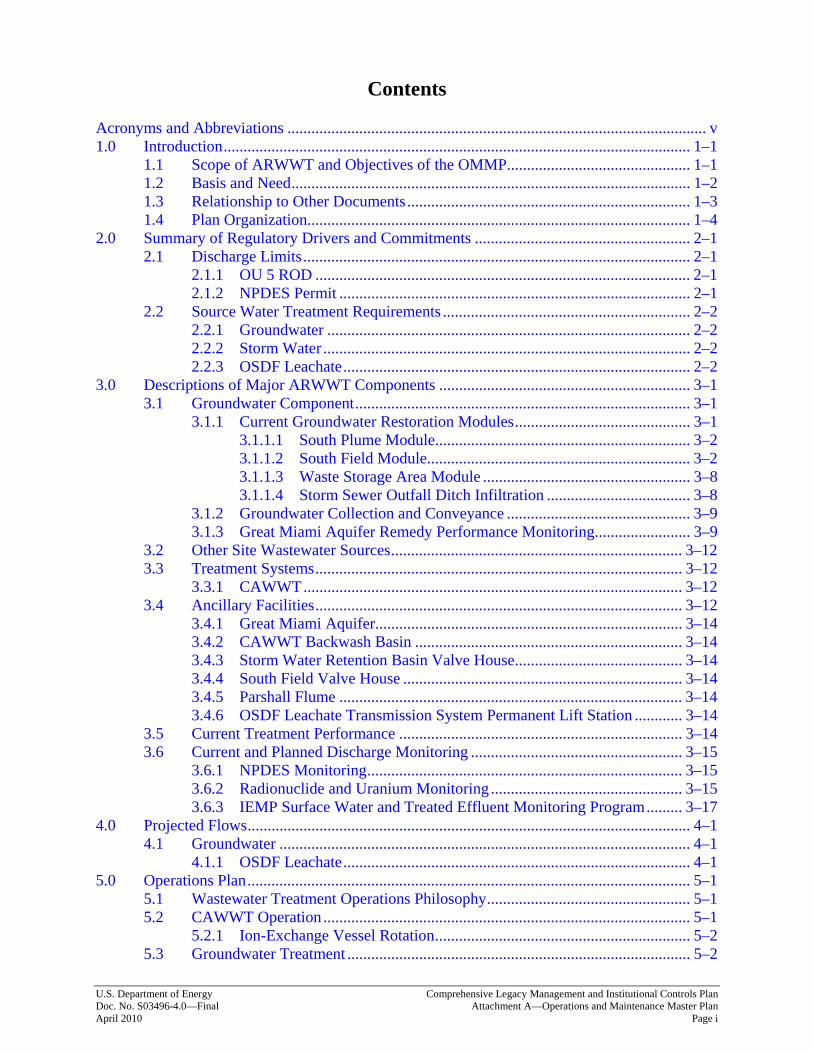
Contents Acronyms and Abbreviations ......................................................................................................... v 1.0 Introduction..................................................................................................................... 1–1
1.1 Scope of ARWWT and Objectives of the OMMP.............................................. 1–1 1.2 Basis and Need.................................................................................................... 1–2 1.3 Relationship to Other Documents....................................................................... 1–3 1.4 Plan Organization................................................................................................ 1–4
2.0 Summary of Regulatory Drivers and Commitments ...................................................... 2–1 2.1 Discharge Limits................................................................................................. 2–1
2.1.1 OU 5 ROD .............................................................................................. 2–1 2.1.2 NPDES Permit ........................................................................................ 2–1
2.2 Source Water Treatment Requirements .............................................................. 2–2 2.2.1 Groundwater ........................................................................................... 2–2 2.2.2 Storm Water ............................................................................................ 2–2 2.2.3 OSDF Leachate....................................................................................... 2–2
3.0 Descriptions of Major ARWWT Components ............................................................... 3–1 3.1 Groundwater Component.................................................................................... 3–1
3.1.1 Current Groundwater Restoration Modules............................................ 3–1 3.1.1.1 South Plume Module................................................................ 3–2 3.1.1.2 South Field Module.................................................................. 3–2 3.1.1.3 Waste Storage Area Module .................................................... 3–8 3.1.1.4 Storm Sewer Outfall Ditch Infiltration .................................... 3–8
3.1.2 Groundwater Collection and Conveyance .............................................. 3–9 3.1.3 Great Miami Aquifer Remedy Performance Monitoring........................ 3–9
3.2 Other Site Wastewater Sources......................................................................... 3–12 3.3 Treatment Systems............................................................................................ 3–12
3.3.1 CAWWT............................................................................................... 3–12 3.4 Ancillary Facilities............................................................................................ 3–12
3.4.1 Great Miami Aquifer............................................................................. 3–14 3.4.2 CAWWT Backwash Basin ................................................................... 3–14 3.4.3 Storm Water Retention Basin Valve House.......................................... 3–14 3.4.4 South Field Valve House ...................................................................... 3–14 3.4.5 Parshall Flume ...................................................................................... 3–14 3.4.6 OSDF Leachate Transmission System Permanent Lift Station ............ 3–14
3.5 Current Treatment Performance ....................................................................... 3–14 3.6 Current and Planned Discharge Monitoring ..................................................... 3–15
3.6.1 NPDES Monitoring............................................................................... 3–15 3.6.2 Radionuclide and Uranium Monitoring ................................................ 3–15 3.6.3 IEMP Surface Water and Treated Effluent Monitoring Program......... 3–17
4.0 Projected Flows............................................................................................................... 4–1 4.1 Groundwater ....................................................................................................... 4–1
4.1.1 OSDF Leachate....................................................................................... 4–1 5.0 Operations Plan............................................................................................................... 5–1
5.1 Wastewater Treatment Operations Philosophy................................................... 5–1 5.2 CAWWT Operation ............................................................................................ 5–1
5.2.1 Ion-Exchange Vessel Rotation................................................................ 5–2 5.3 Groundwater Treatment ...................................................................................... 5–2

Comprehensive Legacy Management and Institutional Controls Plan U.S. Department of Energy Attachment A—Operations and Maintenance Master Plan Doc. No. S03496-4.0—Final Page ii April 2010
5.3.1 Groundwater Treatment Prioritization vs. Bypassing............................. 5–2 5.4 Well Field Operational Objectives...................................................................... 5–2 5.5 Operational Maintenance Priorities .................................................................... 5–5 5.6 Operations Controlling Documents .................................................................... 5–5 5.7 Management and Flow of Operations Information............................................. 5–5 5.8 Management of Treatment Residuals ................................................................. 5–6
6.0 Operations Performance Monitoring and Maintenance.................................................. 6–1 6.1 Management Systems ......................................................................................... 6–1
6.1.1 Maintenance and Support ....................................................................... 6–1 6.1.2 Operations ............................................................................................... 6–2
6.1.2.1 Process Control ........................................................................ 6–2 6.1.2.2 Standard Operating Procedures................................................ 6–2 6.1.2.3 Conduct of Operations ............................................................. 6–3 6.1.2.4 Training.................................................................................... 6–3
6.2 Restoration Well Performance Monitoring and Maintenance ............................ 6–4 6.2.1 Restoration Well Descriptions ................................................................ 6–4
6.2.1.1 South Plume Extraction Wells ................................................. 6–4 6.2.1.2 South Field and Waste Storage Area Extraction Wells ........... 6–5
6.2.2 Factors Affecting System Operation....................................................... 6–7 6.2.3 Maintenance and Operational Monitoring .............................................. 6–9
6.2.3.1 Maintenance of the Pumps, Piping, and Controls.................. 6–10 6.3 Treatment Facilities Performance Monitoring and Maintenance ..................... 6–13
6.3.1 Treatment Facilities Performance Monitoring...................................... 6–13 6.3.2 Treatment Facilities Maintenance Practices ......................................... 6–14
6.4 Regulatory Issues .............................................................................................. 6–14 7.0 Organizational Roles, Responsibilities, and Communications ....................................... 7–1
7.1 Organization Roles and Responsibilities ............................................................ 7–1 7.1.1 DOE Office of Legacy Management Fernald......................................... 7–1 7.1.2 Operating Contractor .............................................................................. 7–1
7.2 Regulatory Agency Interaction ........................................................................... 7–3 8.0 References....................................................................................................................... 8–1
Figures Figure 3–1. ARWWT Facilities Locations Map......................................................................... 3–3 Figure 3–2. ARWWT Timeline .................................................................................................. 3–5 Figure 3–3. Extraction Wells for the Groundwater Remedy ...................................................... 3–6 Figure 3–4. Current Groundwater Remediation/Treatment Schematic .................................... 3–10 Figure 3–5. Groundwater Certification Process and Stages ..................................................... 3–11 Figure 3–6. CAWWT Process Flow Diagram .......................................................................... 3–13 Figure 3–7. Monthly Average Uranium Concentration in the Effluent to the Great Miami
River (through December 2008)............................................................................ 3–16 Figure 6–1. South Plume Module Extraction Well Installation Details ..................................... 6–6 Figure 6–2. South Field Module and Waste Storage Area Extraction Well Installation Details 6–8

U.S. Department of Energy Comprehensive Legacy Management and Institutional Controls Plan Doc. No. S03496-4.0—Final Attachment A—Operations and Maintenance Master Plan April 2010 Page iii
Tables Table 3–1. Well Field Operating Status...................................................................................... 3–7 Table 4–1. Target Extraction Rate Schedule .............................................................................. 4–2 Table 5–1. Well Field Operational Objectives ........................................................................... 5–3 Table 6–1. Planned Outages of the South Plume Module Wells.............................................. 6–10 Table 6–2. Planned Outages of the South Field and Waste Storage Area Module Wells ........ 6–10

Comprehensive Legacy Management and Institutional Controls Plan U.S. Department of Energy Attachment A—Operations and Maintenance Master Plan Doc. No. S03496-4.0—Final Page iv April 2010
This page intentionally left blank

U.S. Department of Energy Comprehensive Legacy Management and Institutional Controls Plan Doc. No. S03496-4.0—Final Attachment A—Operations and Maintenance Master Plan April 2010 Page v
Acronyms and Abbreviations
ARWWP Aquifer Restoration Wastewater Project
ARWWT Aquifer Restoration and Wastewater Treatment
AWWT Advanced Wastewater Treatment Facility
CAWWT Converted Advanced Wastewater Treatment Facility
D&D decontamination and demolition
DOE U.S. Department of Energy
EW extraction well
LM U.S. Department of Energy Office of Legacy Management
EPA U.S. Environmental Protection Agency
ESD Explanation of Significant Differences
EW extraction well
FFCA Federal Facilities Compliance Agreement
FRL final remediation level
gpm gallons per minute
HMI Human-Machine Interface
IEMP Integrated Environmental Monitoring Plan
lbs/yr pounds per year
LMICP Legacy Management and Institutional Controls Plan
LTS Leachate Transmission System
NPDES National Pollutant Discharge Elimination System
OAC Ohio Administrative Code
OEPA Ohio Environmental Protection Agency
OMMP Operations and Maintenance Master Plan
OSDF On-Site Disposal Facility
OU5 Operable Unit 5
PCS process control station
PLS permanent lift station
ppb parts per billion
RA remedial action
ROD Record of Decision
RW recovery well
SWRB storm water retention basin
Comprehensive Legacy Management and Institutional Controls Plan U.S. Department of Energy Attachment A—Operations and Maintenance Master Plan Doc. No. S03496-4.0—Final Page vi April 2010
µg/L micrograms per liter
VFD variable frequency drive
WSA waste storage area

U.S. Department of Energy Comprehensive Legacy Management and Institutional Controls Plan Doc. No. S03496-4.0—Final Attachment A—Operations and Maintenance Master Plan April 2010 Page 1–1
1.0 Introduction
This document is the Operations and Maintenance Master Plan (OMMP) for Aquifer Restoration and Wastewater Treatment (ARWWT) at the U.S. Department of Energy’s (DOE’s) Fernald Preserve. The OMMP is a formal remedial design deliverable, originally prepared to fulfill Task 2 of the Operable Unit 5 Remedial Design Work Plan (DOE 1996a). It was first issued in November 1997. The OMMP has undergone several revisions and became part of the Comprehensive Legacy Management and Institutional Controls Plan (LMICP) in January 2006. 1.1 Scope of ARWWT and Objectives of the OMMP The scope of ARWWT includes the operation and maintenance of the site’s groundwater and the On-Site Disposal Facility’s (OSDF’s) leachate management facilities. The fundamental objectives of the OMMP are to guide and coordinate the extraction, collection, conveyance, treatment, and discharge of all groundwater and leachate during the post-closure period. Compliance with discharge limits includes a plan of the commitments, performance goals, operating schedule, treated water flow rates, direct discharge flow rates, and other operating priorities. This plan also provides the approach for the management of treatment residuals (e.g., backwash basin sediments, spent resins/filtration media) that are byproducts of the Fernald Preserve’s wastewater treatment processes. The OMMP serves as a comprehensive statement of management policy to ensure that planned modes of operation and maintenance for ARWWT are consistent with regulatory requirements and satisfy the Fernald Preserve’s remedy performance commitments for groundwater restoration and wastewater treatment. The plan establishes the decision logic and priorities for the major flow and water treatment decisions needed to maintain compliance with the Fernald Preserve’s National Pollutant Discharge Elimination System (NPDES) permit and Record of Decision (ROD)-based surface water discharge limits. The plan also provides the overall management philosophy and decision parameters to implement the day-to-day flow routing, critical-component maintenance, and treatment priority decisions. It is not intended to provide detailed, specific operating or maintenance procedures for ARWWT. The plan also serves to inform the U.S. Environmental Protection Agency (EPA) and the Ohio Environmental Protection Agency (OEPA) of the planned operational approaches and strategies that are intended to meet the regulatory agreements made during the Operable Unit 5 (OU5) remedial investigation/feasibility study (DOE 1995b, DOE 1995a) process and documented in the OU5 decision documents: the Record of Decision for Remedial Actions at OU5 (DOE 1996b) (OU5 ROD), the Explanation of Significant Differences for Operable Unit 5 (DOE 2001a), and the Remedial Design Fact Sheet for Operable Unit 5 Wastewater Treatment Updates (DOE 2004b). The plan provides the basis for development of more-detailed internal operating procedure documents (e.g., standard operating procedures, standing orders, preventive maintenance plans) that are required for execution of work at the Fernald Preserve. The existing detailed procedural documents that govern the performance of water-related operations and maintenance activities at the Fernald Preserve are expected to be updated (revised, combined, or eliminated) as required to conform to the general strategies, guidelines, and decision parameters defined in this plan.

Comprehensive Legacy Management and Institutional Controls Plan U.S. Department of Energy Attachment A—Operations and Maintenance Master Plan Doc. No. S03496-4.0—Final Page 1–2 April 2010
1.2 Basis and Need The need for the OMMP arose in the mid 1990s, as DOE and regulators realized that the various water and wastewater flows that originate from Fernald Site remediation activities were in direct competition with one another for treatment resources. The wastewater treatment capacities at the Fernald Site had to be prioritized so that (1) discharge limits could be maintained, (2) a range of flow conditions at various time intervals could be accommodated, and (3) the detrimental effects of exceptional operating circumstances could be effectively managed. The need for treatment (and the accompanying hierarchy of treatment priorities) has varied over the span of the site remedy as new projects came on line, other projects were completed, and aquifer restoration activities progressed. During development of the OU5 ROD, it was recognized that the monthly average concentration discharge limit for total uranium (established at 20 parts-per-billion [ppb] in the OU5 ROD and revised to 30 ppb in the OU5 Explanation of Significant Differences) could probably be met under average operating conditions, but that maintaining the limit may not be achievable during periods of exceptional operating conditions. It was further recognized that the application of the discharge limit was not considered as a required component of the remedy to ensure protectiveness, but rather as an appropriate performance-based objective that appeared reasonably attainable through the application of an appropriate level of water treatment. It was recognized that the performance-based discharge limit must be able to accommodate exceptional operating conditions expected to occur over the duration of the remedy. Two exceptional operating conditions were actually cited in the OU5 ROD; it would permit relief allowances from the total uranium monthly average concentration discharge limit, when necessary, for (1) storm water bypasses during high-precipitation events and (2) periodic reductions in treatment plant operating capacity that are necessary to accommodate scheduled maintenance activities. Since storm water treatment is no longer required (other than a portion of the Converted Advanced Wastewater Treatment Facility [CAWWT] footprint), storm water bypasses are no longer required. At the time the ROD was signed, it was recognized that the OMMP would define the operating philosophy for (1) the extraction/re-injection and treatment systems, (2) the establishment of operational constraints and conditions for given systems, and (3) the establishment of the process for reporting and instituting corrective measures to address exceedances of discharge limits. The OMMP also contains detailed information about the manner in which exceptional operating conditions are to be accommodated and reported in the demonstration of discharge limit compliance. The OMMP will be modified during the course of the remedy to accommodate changes to the treatment and well field systems or the retirement of individual restoration modules from service, once area-specific cleanup levels are achieved. The plan is intended to serve as a living guidance document to instruct operations staff in implementing required adjustments to the system over time. The OMMP will thus be evaluated periodically to ensure that the most recent instructions regarding treatment priorities and flow-routing decisions are available to system operators. Proper notifications for reporting maintenance shutdowns of the system, and the reporting and application of corrective measures to address exceedances of discharge limits, are also identified in the OMMP. Prior to site closure in 2006, water treatment flows were reduced to groundwater and leachate from the OSDF. Elimination of remediation wastewater, impacted storm water, and sanitary

U.S. Department of Energy Comprehensive Legacy Management and Institutional Controls Plan Doc. No. S03496-4.0—Final Attachment A—Operations and Maintenance Master Plan April 2010 Page 1–3
sewer wastewater provided an opportunity to reduce the size of the water treatment facility remaining to service the aquifer restoration and leachate treatment after site closure. Reducing the size of the treatment facility prior to site closure in 2006 reduced the amount of impacted materials that may need future off-site disposal. Between October 2003 and March 2004, DOE conducted a series of meetings with public stakeholders, EPA, and the Fernald Citizens Advisory Board to identify a more cost-effective water treatment facility that would serve as a long-term replacement for the existing Advanced Wastewater Treatment (AWWT) facility. The interactions led to support for a plan to carve down the AWWT facility to permit the 1,800-gallons-per-minute (gpm) Phase III expansion system to remain as the long-term groundwater treatment facility. The 1,800-gpm CAWWT provided a 1,200-gpm capacity for groundwater and about 600 gpm of storm water capacity (including carbon treatment) to handle the last remaining storm water and remediation wastewater flows prior to site closure. Since those flows have ceased, the CAWWT now provides a dedicated long-term groundwater treatment capacity of up to 1,800 gpm. In addition to the decrease in the size of the water treatment facility, operational approaches to the aquifer remedy were reevaluated and resulted in the elimination of well-based groundwater re-injection, since it was determined that this was not a cost-effective approach to aquifer restoration at Fernald. This OMMP reflects the aquifer restoration design provided in the Waste Storage Area Phase II Aquifer Restoration Design Report (DOE 2005b). 1.3 Relationship to Other Documents The OMMP functions in tandem with several other major ARWWT design documents and support plans, such as Attachment D, Integrated Environmental Monitoring Plan (IEMP); various aquifer restoration module design packages; the Remedial Action [RA] Work Plan (DOE 1997b); and the Fernald Groundwater Certification Plan (DOE 2006a). The environmental monitoring and reporting activities conducted in support of aquifer restoration performance decisions are specified in the IEMP. Information obtained through the IEMP will be used to (1) appraise groundwater restoration progress, (2) assess the need for changing groundwater extraction flow rates, and (3) assess the durations of groundwater extraction activities over the life of the remedy. The initial design flow rates, planned installation sequence, detailed design basis, and overall restoration strategy for the aquifer restoration modules that constitute the groundwater remedy were developed in the Baseline Remedial Strategy Report, Remedial Design for Aquifer Restoration (DOE 1997a). The overall restoration strategy has been modified as a result of information gained from the ongoing remedy performance/operations monitoring and pre-design monitoring conducted in support of the Waste Storage Area (WSA) (Phases I and II) Modules and the South Field Extraction System (Phase II) Module. The RA Work Plan (submitted to EPA and OEPA as Task 10 of the OU5 Remedial Design Work Plan) conveyed the enforceable RA construction schedule for the initial restoration modules brought online in 1998 (the Re-injection Demonstration Module, the South Field Extraction System Module, and the South Plume Optimization Module). It also contained the planning-level RA construction schedule for the remaining modules to be brought online in later years. With the
Comprehensive Legacy Management and Institutional Controls Plan U.S. Department of Energy Attachment A—Operations and Maintenance Master Plan Doc. No. S03496-4.0—Final Page 1–4 April 2010
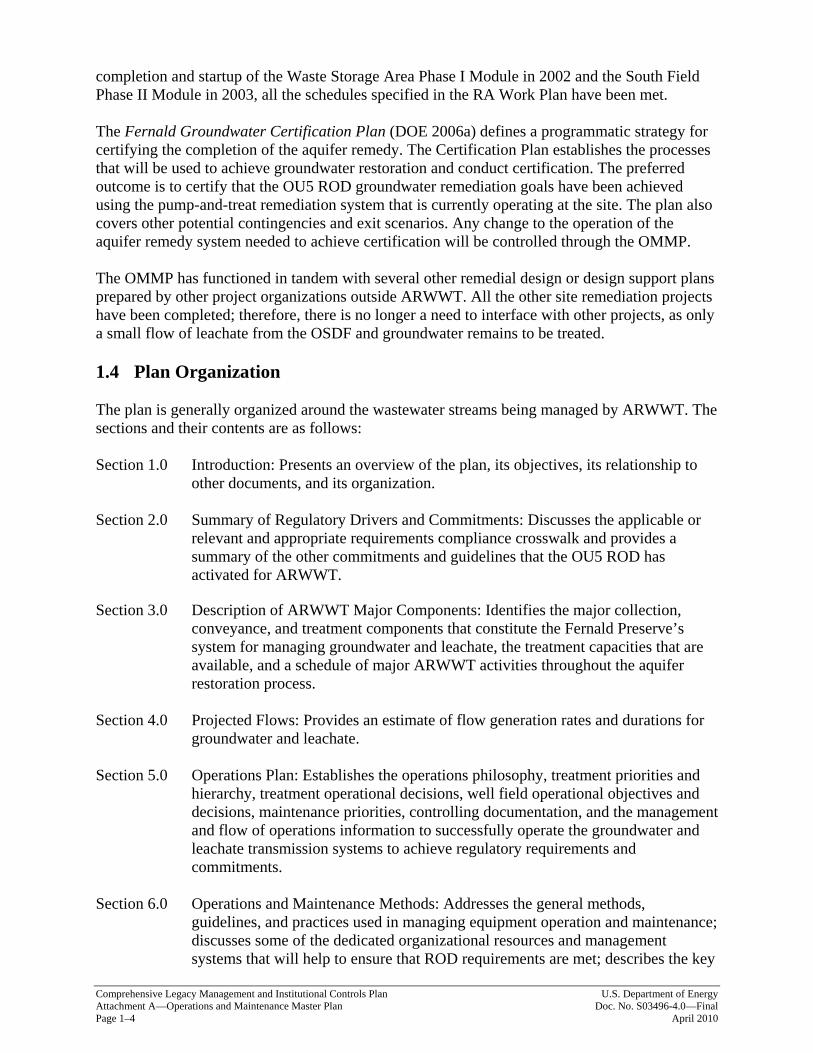
completion and startup of the Waste Storage Area Phase I Module in 2002 and the South Field Phase II Module in 2003, all the schedules specified in the RA Work Plan have been met. The Fernald Groundwater Certification Plan (DOE 2006a) defines a programmatic strategy for certifying the completion of the aquifer remedy. The Certification Plan establishes the processes that will be used to achieve groundwater restoration and conduct certification. The preferred outcome is to certify that the OU5 ROD groundwater remediation goals have been achieved using the pump-and-treat remediation system that is currently operating at the site. The plan also covers other potential contingencies and exit scenarios. Any change to the operation of the aquifer remedy system needed to achieve certification will be controlled through the OMMP. The OMMP has functioned in tandem with several other remedial design or design support plans prepared by other project organizations outside ARWWT. All the other site remediation projects have been completed; therefore, there is no longer a need to interface with other projects, as only a small flow of leachate from the OSDF and groundwater remains to be treated. 1.4 Plan Organization The plan is generally organized around the wastewater streams being managed by ARWWT. The sections and their contents are as follows: Section 1.0 Introduction: Presents an overview of the plan, its objectives, its relationship to
other documents, and its organization. Section 2.0 Summary of Regulatory Drivers and Commitments: Discusses the applicable or
relevant and appropriate requirements compliance crosswalk and provides a summary of the other commitments and guidelines that the OU5 ROD has activated for ARWWT.
Section 3.0 Description of ARWWT Major Components: Identifies the major collection,
conveyance, and treatment components that constitute the Fernald Preserve’s system for managing groundwater and leachate, the treatment capacities that are available, and a schedule of major ARWWT activities throughout the aquifer restoration process.
Section 4.0 Projected Flows: Provides an estimate of flow generation rates and durations for
groundwater and leachate. Section 5.0 Operations Plan: Establishes the operations philosophy, treatment priorities and
hierarchy, treatment operational decisions, well field operational objectives and decisions, maintenance priorities, controlling documentation, and the management and flow of operations information to successfully operate the groundwater and leachate transmission systems to achieve regulatory requirements and commitments.
Section 6.0 Operations and Maintenance Methods: Addresses the general methods,
guidelines, and practices used in managing equipment operation and maintenance; discusses some of the dedicated organizational resources and management systems that will help to ensure that ROD requirements are met; describes the key

U.S. Department of Energy Comprehensive Legacy Management and Institutional Controls Plan Doc. No. S03496-4.0—Final Attachment A—Operations and Maintenance Master Plan April 2010 Page 1–5
parameters used to monitor the performance of the groundwater and wastewater facilities; and describes the principal features and maintenance needs of the overall operation.
Section 7.0 Organizational Roles, Responsibilities, and Communications: Presents the
organizational roles and responsibilities with respect to implementation of this OMMP; also presents the communications protocol for coordinating with EPA and OEPA.

Comprehensive Legacy Management and Institutional Controls Plan U.S. Department of Energy Attachment A—Operations and Maintenance Master Plan Doc. No. S03496-4.0—Final Page 1–6 April 2010
This page intentionally left blank
U.S. Department of Energy Comprehensive Legacy Management and Institutional Controls Plan Doc. No. S03496-4.0—Final Attachment A—Operations and Maintenance Master Plan April 2010 Page 2–1
2.0 Summary of Regulatory Drivers and Commitments
Regulatory drivers and commitments, as they pertain to the successful operation of the CAWWT and associated groundwater extraction systems, involve source water treatment requirements and the specific effluent limits that need to be met. Other regulatory requirements, legal agreements, and agency commitments apply to the site as a whole, and those may apply to the CAWWT. However, these general Fernald Preserve drivers and commitments are not discussed further in this section. 2.1 Discharge Limits The discharges from the Fernald Preserve to the Great Miami River are primarily associated with the groundwater remedy involving the treated effluent (primarily groundwater) from the CAWWT and extracted groundwater that is discharged without treatment. A small amount of leachate from the OSDF is also managed through the CAWWT. The combined effluent from the CAWWT is discharged to the Great Miami River through the Parshall Flume Building, which is the final monitoring point before effluent reaches the Great Miami River. The required effluent limits for this discharge are governed by the OU5 ROD for the uranium component of the discharge and by the NPDES permit (Permit No. 1IO00004*HD) for the non-uranium parameters. 2.1.1 OU 5 ROD
Treatment will be applied to all discharges to the Great Miami River, to the extent necessary, to limit the total mass of uranium discharged through the Fernald Preserve outfall to the Great Miami River to no more than 600 pounds per year (lbs/yr). This mass-based discharge limit became effective upon the issuance of the OU5 ROD. Additionally, the necessary treatment will be applied to limit the concentration of total uranium in the blended effluent to the Great Miami River to no greater than 30 ppb. The 30 ppb discharge limit for uranium will be based on a monthly flow-weighted average concentration. This limit became effective December 1, 2001, based on the Explanation of Significant Differences for Operable Unit 5 (DOE 2001c), which replaced the original 20 ppb standard that applied to the Fernald Site beginning January 1, 1998. The OU5 ROD stipulates specific circumstances that necessitate relief from the concentration limit. Relief can be requested for maintenance activities. EPA approval must be obtained in advance by notification of these planned maintenance periods. The notification must be accompanied by a request for the uranium concentrations in the discharge not to be considered in the monthly averaging performed to demonstrate compliance with the 30 ppb total uranium discharge limit. Uranium contained in these bypass events will only be counted in the annually discharged mass, not in the monthly average concentration calculations. 2.1.2 NPDES Permit
Under the Clean Water Act, as amended, the Fernald Preserve is governed by NPDES regulations that require the control of discharges of nonradiological pollutants to waters of the State of Ohio. The NPDES permit, issued by the State of Ohio, specifies discharge and sample locations, sampling and reporting schedules, and discharge limits. The Fernald Preserve submits

Comprehensive Legacy Management and Institutional Controls Plan U.S. Department of Energy Attachment A—Operations and Maintenance Master Plan Doc. No. S03496-4.0—Final Page 2–2 April 2010
monthly reports on NPDES activities to OEPA. The Fernald Preserve’s current NPDES permit, No. 1IO00004*HD, became effective on April 1, 2009, and will expire on March 31, 2014. 2.2 Source Water Treatment Requirements Three sources of wastewater have specific management requirements: groundwater, OSDF leachate, and storm water. 2.2.1 Groundwater
Groundwater treatment decisions are based on uranium concentrations in individual wells. Groundwater extracted from the higher-concentration wells goes to treatment, and water from the lower-concentration wells bypasses treatment and is discharged directly to the Great Miami River outfall line. The piping networks that convey on-property extracted groundwater have double headers, one connected to the main line to treatment and the other to the main discharge line. This design feature is not applicable to the off-property South Plume Module. The extracted groundwater from the South Plume Module is sent to either the treatment facilities or directly to the discharge outfall, depending on the uranium concentration in the combined flow from the six wells that this module comprises. The combined treated and untreated discharge will comply with the 30 ppb discharge limit and the 600-lb/yr mass-based limit as described in Section 2.1, “Discharge Limits.” 2.2.2 Storm Water
It is not expected that any storm water will require treatment, since soil remediation and certification has been completed. Storm water treatment can be provided on a limited basis. 2.2.3 OSDF Leachate
Ohio Administrative Code (OAC) 3745-27-19, “Operational Criteria for a Sanitary Landfill Facility,” requires the treatment of leachate. Leachate from the OSDF is a minimal flow and will likely have no bearing on operational decisions. However, it is required that leachate be treated through the CAWWT prior to discharge to the Great Miami River until the CAWWT is no longer needed. Prior to the cessation of CAWWT operations, DOE will have proposed and negotiated the future management of leachate with EPA and OEPA.

U.S. Department of Energy Comprehensive Legacy Management and Institutional Controls Plan Doc. No. S03496-4.0—Final Attachment A—Operations and Maintenance Master Plan April 2010 Page 3–1
3.0 Descriptions of Major ARWWT Components
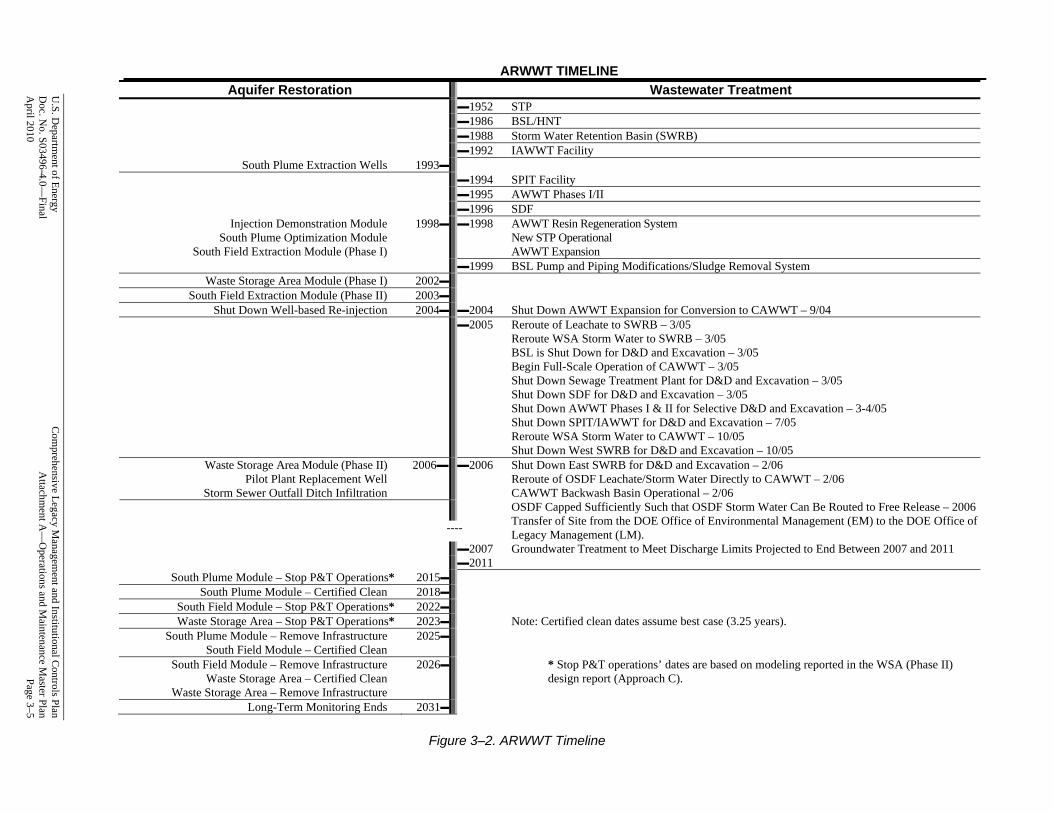
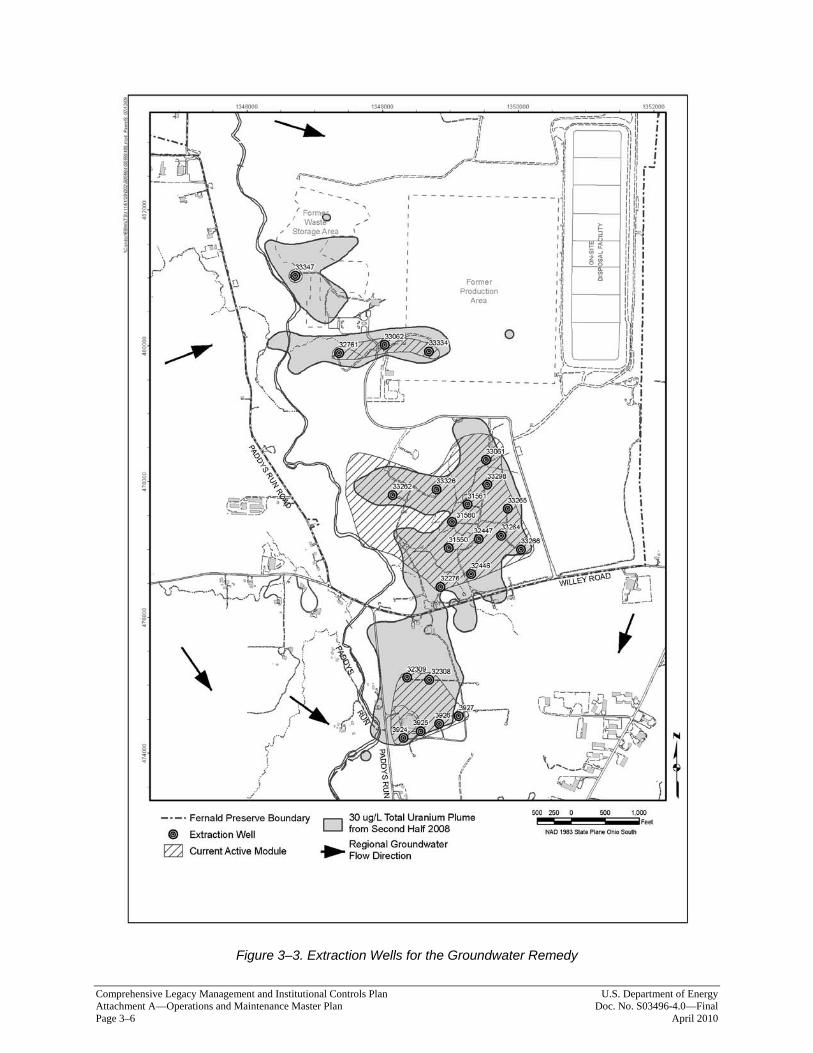
This section describes the major operating system components required to accomplish aquifer remedy commitments and goals. The site conveyance and treatment system components for managing the major wastewater streams are identified, as are treatment capacities. This section also describes key linkages between the components. Figure 3−1 depicts the facilities as well as groundwater wells on a projected view of the site. Figure 3−2 provides a timeline of major activities that have occurred and those that are projected to occur throughout the aquifer restoration process. 3.1 Groundwater Component Remediation of the Great Miami Aquifer will be achieved by completing area-specific groundwater restoration modules. These modules were specified in the following documents:
• Remedial Design/Remedial Action work plans for OU5.
• Baseline Remedial Strategy Report, Remedial Design for Aquifer Restoration.
• Design for the Remediation of the Great Miami Aquifer in the Waste Storage and Plant 6 Areas (DOE 2001a).
• Design for Remediation of the Great Miami Aquifer South Field (Phase II) Module (DOE 2002).
• Waste Storage Area (Phase II) Design Report (DOE 2005b). During 2003, new information became available (refer to the Comprehensive Groundwater Strategy Report [Fluor Fernald Inc. 2003]) that allowed for more refined groundwater modeling predictions of when aquifer restoration would be completed. The updated modeling predictions and groundwater remedy performance monitoring data both indicated that the aquifer restoration time frame would likely be extended beyond the dates previously predicted. The updated modeling also indicated that the use of groundwater re-injection via wells did not significantly reduce the time required to remediate the aquifer. As reflected in Figure 3−2, aquifer restoration activities are predicted to be necessary beyond the year 2020. In 2005, EPA approved the Fernald Groundwater Certification Plan (DOE 2006a), a programmatic strategy for certifying the completion of the aquifer remedy. The Certification Plan established the processes that will be used to achieve groundwater restoration and conduct certification of the aquifer remedy. The Certification Plan relies on the IEMP and the OMMP for implementation of that process. 3.1.1 Current Groundwater Restoration Modules
Three groundwater restoration modules are currently in operation:
• South Plume
• South Field (Phases I and II)
• Waste Storage Area (Phases I and II) Figure 3−3 shows the geographical locations of each of these modules and associated wells. Subsections 3.1.1.1–3.1.1.3 provide descriptions of each of the modules.

Comprehensive Legacy Management and Institutional Controls Plan U.S. Department of Energy Attachment A—Operations and Maintenance Master Plan Doc. No. S03496-4.0—Final Page 3–2 April 2010
3.1.1.1 South Plume Module
Five extraction wells were installed in 1993 at the leading edge of the off-property South Plume, as part of the South Plume removal action, to gain an early start on groundwater restoration. The South Plume removal action well system began pumping in August 1993. The primary intent of the original five-well system was to prevent further off-property migration of contamination within the groundwater plume. Two additional extraction wells came online in August 1998 for the active restoration of the central portion of the off-property plume. These two new wells, known as the South Plume Optimization Module have now been incorporated into the South Plume Module for remedy performance tracking and reporting. Figure 3−3 shows the locations of the wells, and Table 3−1 provides the operating status of the South Plume Module. 3.1.1.2 South Field Module
The South Field Module was installed in two phases. South Field Extraction System Phase I Module includes 10 extraction wells. In 1996, as part of an EPA-approved early-start initiative, the 10 extraction wells were installed on Fernald Site property near the south field/storm sewer outfall ditch. These wells are removing groundwater contamination in an on-property area of the southern uranium plume. Since the installation of the 10 original extraction wells of the South Field Extraction Phase I Module, three new extraction wells were added to the module, three of the original wells were shut down, and one of the original wells was converted to a re-injection well. The three extraction wells that were shut down are all located in the upgradient area of the plume where total uranium concentrations in the Great Miami Aquifer are now below the final remediation level (FRL). An additional consideration in removing two of these three wells was to accommodate soil remedial activities near the wells. The three new wells added to the South Field Phase I Module were installed at locations where total uranium concentrations were considerably above the groundwater FRL, in the eastern, downgradient portion of the South Field plume. Two of the three new wells were installed in late 1999 and began pumping in February 2000. The third well was installed in 2001 and became operational in 2002. Phase II components of the South Field became operational in 2003. The components include:
• Four additional extraction wells, one in the southern waste unit area and three along the eastern edge of the on-property portion of the southern uranium plume.
• One additional re-injection well in the southern waste unit area. All re-injection wells have been removed from service.
• A converted extraction well, which was converted into a re-injection well. All re-injection wells have been removed from service.
• An injection pond, which is located in the western portion of the Southern Waste Units Excavations. The injection pond was removed from service along with all re-injection wells.
Table 3−1 provides the operational status of the currently configured South Field Extraction System Module (Phase I and Phase II components).

U.S. Department of Energy Comprehensive Legacy Management and Institutional Controls Plan Doc. No. S03496-4.0—Final Attachment A—Operations and Maintenance Master Plan April 2010 Page 3–3
Figure 3–1. ARWWT Facilities Locations Map

Comprehensive Legacy Management and Institutional Controls Plan U.S. Department of Energy Attachment A—Operations and Maintenance Master Plan Doc. No. S03496-4.0—Final Page 3–4 April 2010
This page intentionally left blank
U.S. D
epartment of Energy
Com
prehensive Legacy Managem
ent and Institutional Controls Plan
Doc. N
o. S03496-4.0—Final
Attachm
ent A—
Operations and M
aintenance Master Plan
April 2010
Page 3–5
ARWWT TIMELINE Aquifer Restoration Wastewater Treatment
▬1952 STP ▬1986 BSL/HNT ▬1988 Storm Water Retention Basin (SWRB) ▬1992 IAWWT Facility
South Plume Extraction Wells 1993▬ ▬1994 SPIT Facility ▬1995 AWWT Phases I/II ▬1996 SDF
Injection Demonstration Module South Plume Optimization Module
South Field Extraction Module (Phase I)
1998▬ ▬1998 AWWT Resin Regeneration System New STP Operational AWWT Expansion
▬1999 BSL Pump and Piping Modifications/Sludge Removal System Waste Storage Area Module (Phase I) 2002▬
South Field Extraction Module (Phase II) 2003▬ Shut Down Well-based Re-injection 2004▬ ▬2004 Shut Down AWWT Expansion for Conversion to CAWWT – 9/04
▬2005 Reroute of Leachate to SWRB – 3/05 Reroute WSA Storm Water to SWRB – 3/05 BSL is Shut Down for D&D and Excavation – 3/05 Begin Full-Scale Operation of CAWWT – 3/05 Shut Down Sewage Treatment Plant for D&D and Excavation – 3/05 Shut Down SDF for D&D and Excavation – 3/05 Shut Down AWWT Phases I & II for Selective D&D and Excavation – 3-4/05 Shut Down SPIT/IAWWT for D&D and Excavation – 7/05 Reroute WSA Storm Water to CAWWT – 10/05 Shut Down West SWRB for D&D and Excavation – 10/05
Waste Storage Area Module (Phase II) Pilot Plant Replacement Well
Storm Sewer Outfall Ditch Infiltration
2006▬
▬2006
----
Shut Down East SWRB for D&D and Excavation – 2/06 Reroute of OSDF Leachate/Storm Water Directly to CAWWT – 2/06 CAWWT Backwash Basin Operational – 2/06 OSDF Capped Sufficiently Such that OSDF Storm Water Can Be Routed to Free Release – 2006Transfer of Site from the DOE Office of Environmental Management (EM) to the DOE Office of Legacy Management (LM).
▬2007 Groundwater Treatment to Meet Discharge Limits Projected to End Between 2007 and 2011 ▬2011
South Plume Module – Stop P&T Operations* 2015▬ South Plume Module – Certified Clean 2018▬
South Field Module – Stop P&T Operations* 2022▬ Waste Storage Area – Stop P&T Operations* 2023▬ Note: Certified clean dates assume best case (3.25 years).
South Plume Module – Remove Infrastructure South Field Module – Certified Clean
2025▬
South Field Module – Remove Infrastructure Waste Storage Area – Certified Clean
Waste Storage Area – Remove Infrastructure
2026▬ * Stop P&T operations’ dates are based on modeling reported in the WSA (Phase II) design report (Approach C).
Long-Term Monitoring Ends 2031▬
Figure 3–2. ARWWT Timeline
Comprehensive Legacy Management and Institutional Controls Plan U.S. Department of Energy Attachment A—Operations and Maintenance Master Plan Doc. No. S03496-4.0—Final Page 3–6 April 2010
Figure 3–3. Extraction Wells for the Groundwater Remedy
U.S. Department of Energy Comprehensive Legacy Management and Institutional Controls Plan Doc. No. S03496-4.0—Final Attachment A—Operations and Maintenance Master Plan April 2010 Page 3–7
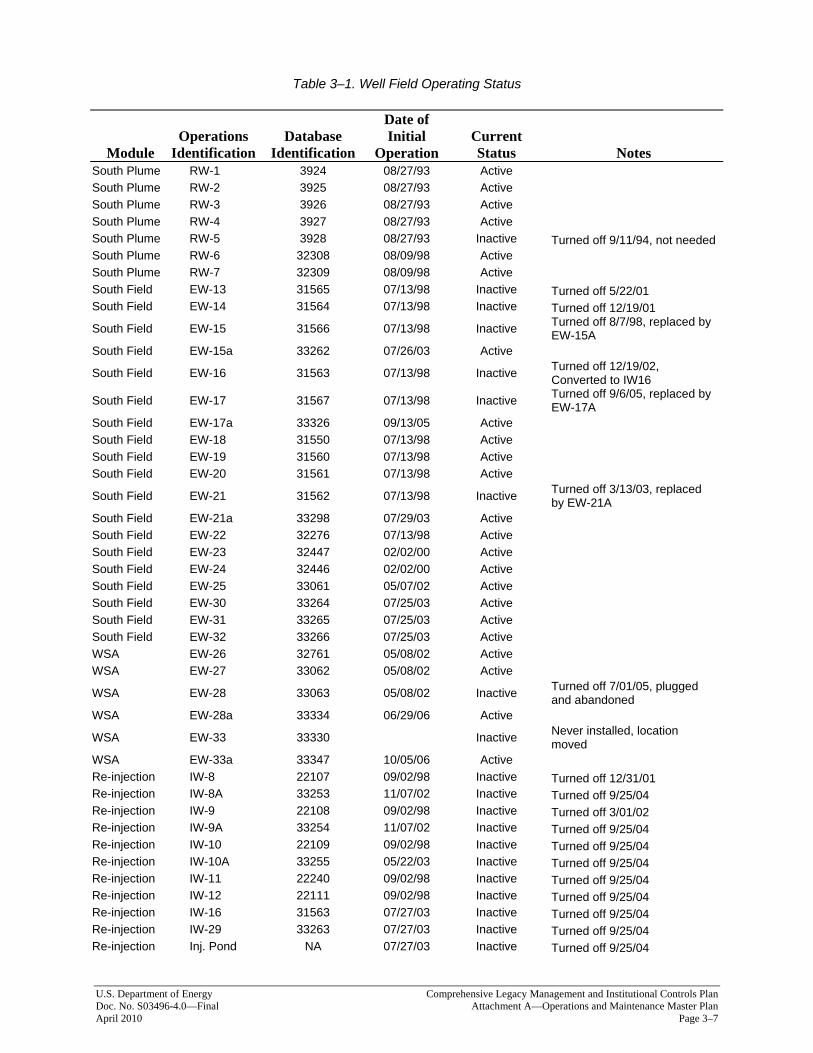
Table 3–1. Well Field Operating Status
Module Operations
Identification Database
Identification
Date of Initial
Operation Current Status Notes
South Plume RW-1 3924 08/27/93 Active South Plume RW-2 3925 08/27/93 Active South Plume RW-3 3926 08/27/93 Active South Plume RW-4 3927 08/27/93 Active South Plume RW-5 3928 08/27/93 Inactive Turned off 9/11/94, not needed South Plume RW-6 32308 08/09/98 Active South Plume RW-7 32309 08/09/98 Active South Field EW-13 31565 07/13/98 Inactive Turned off 5/22/01 South Field EW-14 31564 07/13/98 Inactive Turned off 12/19/01
South Field EW-15 31566 07/13/98 Inactive Turned off 8/7/98, replaced by EW-15A
South Field EW-15a 33262 07/26/03 Active
South Field EW-16 31563 07/13/98 Inactive Turned off 12/19/02, Converted to IW16
South Field EW-17 31567 07/13/98 Inactive Turned off 9/6/05, replaced by EW-17A
South Field EW-17a 33326 09/13/05 Active South Field EW-18 31550 07/13/98 Active South Field EW-19 31560 07/13/98 Active South Field EW-20 31561 07/13/98 Active
South Field EW-21 31562 07/13/98 Inactive Turned off 3/13/03, replaced by EW-21A
South Field EW-21a 33298 07/29/03 Active South Field EW-22 32276 07/13/98 Active South Field EW-23 32447 02/02/00 Active South Field EW-24 32446 02/02/00 Active South Field EW-25 33061 05/07/02 Active South Field EW-30 33264 07/25/03 Active South Field EW-31 33265 07/25/03 Active South Field EW-32 33266 07/25/03 Active WSA EW-26 32761 05/08/02 Active WSA EW-27 33062 05/08/02 Active
WSA EW-28 33063 05/08/02 Inactive Turned off 7/01/05, plugged and abandoned
WSA EW-28a 33334 06/29/06 Active
WSA EW-33 33330 Inactive Never installed, location moved
WSA EW-33a 33347 10/05/06 Active Re-injection IW-8 22107 09/02/98 Inactive Turned off 12/31/01 Re-injection IW-8A 33253 11/07/02 Inactive Turned off 9/25/04 Re-injection IW-9 22108 09/02/98 Inactive Turned off 3/01/02 Re-injection IW-9A 33254 11/07/02 Inactive Turned off 9/25/04 Re-injection IW-10 22109 09/02/98 Inactive Turned off 9/25/04 Re-injection IW-10A 33255 05/22/03 Inactive Turned off 9/25/04 Re-injection IW-11 22240 09/02/98 Inactive Turned off 9/25/04 Re-injection IW-12 22111 09/02/98 Inactive Turned off 9/25/04 Re-injection IW-16 31563 07/27/03 Inactive Turned off 9/25/04 Re-injection IW-29 33263 07/27/03 Inactive Turned off 9/25/04 Re-injection Inj. Pond NA 07/27/03 Inactive Turned off 9/25/04
Comprehensive Legacy Management and Institutional Controls Plan U.S. Department of Energy Attachment A—Operations and Maintenance Master Plan Doc. No. S03496-4.0—Final Page 3–8 April 2010
3.1.1.3 Waste Storage Area Module
The Waste Storage Area Module was designed and installed in two phases. The Waste Storage Area Extraction System targets contaminants in the Great Miami Aquifer underlying the former Waste Storage Area (OU1 and OU4). Figure 3−3 shows the geographical location of the area. The Design for Remediation of the Great Miami Aquifer in the Waste Storage and Plant 6 Areas (DOE 2001a) defines the Phase I design. Phase I addresses the plume of contamination defined in the vicinity of the Pilot Plant Drainage Ditch. The Waste Storage Area (Phase II) Design Report (DOE 2005b) defines the Phase II design. Phase II addresses the plume of contamination defined in the vicinity of the former Waste Pit Area. Phase I of the Waste Storage Area Module consists of one 12-inch diameter well and two 16-inch-diameter extraction wells complete with submersible pumps with variable speed drives, well houses, electrical power, instrumentation and controls, fiber optic communications, and dual discharge headers (one for treatment and one for direct discharge). Operation of this phase of the module began on May 8, 2002. The easternmost well in the Phase I design (extraction well [EW] 33063 or EW-28) was taken out of service, then plugged and abandoned in July 2004 to make way for soil remediation activities. The well was replaced in 2005 and was brought online in 2006 prior to the site’s transition from the DOE Office of Environmental Management (EM) to the DOE Office of Legacy Management (LM). The Design for Remediation of the Great Miami Aquifer in the Waste Storage Area and Plant 6 Area (DOE 2001a) concluded that uranium concentrations in the Great Miami Aquifer beneath Plant 6 had naturally attenuated to concentrations below 20 ppb. While the current data indicate that no extraction wells and infrastructure will be needed for the former Plant 6 Area, monitoring of the area will continue until aquifer restoration certification is completed and approved by EPA and OEPA. Phase II of the Waste Storage Area Module consists of one 16-inch-diameter well with a submersible pump, a variable speed drive, a well house, electrical power, instrumentation and controls, fiber optic communications, and a dual-discharge header. 3.1.1.4 Storm Sewer Outfall Ditch Infiltration
A test was conducted in 2005 to gauge seasonal flow of water in the storm sewer outfall ditch (SSOD) and to determine if recharge to the Great Miami Aquifer through the SSOD at a rate of 500 gpm was feasible (DOE 2005a). As reported in the Groundwater Remedy Evaluation and Field Verification Plan (DOE 2004a), infiltration through the SSOD at a rate of 500 gpm was predicted to decrease the cleanup time by 1 year. The study concluded, though, that the operation would not be cost effective. Subsequent discussions with EPA and OEPA in 2006 led to an agreement to proceed with a scaled-down version of the operation. Clean groundwater is being pumped into the SSOD to supplement natural storm water runoff in an attempt to accelerate remediation of the South Plume. Three wells on the east side of the site are being utilized to deliver as much clean groundwater as is needed to maintain a flow of approximately 500 gpm into the SSOD. This supplemental pumping will continue until the wells, pumps, or motors are no longer serviceable. At that time, the operation will be suspended, pending a determination that the remedy is benefiting from the operation.

U.S. Department of Energy Comprehensive Legacy Management and Institutional Controls Plan Doc. No. S03496-4.0—Final Attachment A—Operations and Maintenance Master Plan April 2010 Page 3–9
3.1.2 Groundwater Collection and Conveyance
An extensive system of collection and conveyance piping is required for the remediation of the Great Miami Aquifer. These piping systems were specified in the various module-specific design documents. Figure 3−4 provides an overview of the current well-field piping. As described in Section 2, the piping network that conveys on-property extracted groundwater from the individual extraction wells has double headers, one connected to the main line to treatment and the other to the main discharge line as shown in Figure 3−4. The double headers allow for treatment/bypass decisions to be made on an individual-well basis for the on-property wells. This design feature is not applicable to the off-property South Plume Module, which was largely in place prior to the design of the on-property piping network. Since individual well bypass/treatment lines are not available on the South Plume wells, treatment/bypass decisions for the six wells in this system are made on the basis of uranium concentration in the combined flow from all of the wells, as indicated in Figure 3−4. 3.1.3 Great Miami Aquifer Remedy Performance Monitoring
Section 3 of the IEMP provides for the routine remedy-performance monitoring of the Great Miami Aquifer. Details of how the remedy performance data are being evaluated and the associated decision-making process are located in Section 3.7 of the IEMP. Figure 3−5 illustrates the groundwater certification process for the aquifer remedy. As illustrated in Figure 3−5, remedy performance monitoring is being conducted to assess the efficiency of mass removal and to gauge performance in meeting remediation objectives. If it is determined that aquifer restoration program expectations (as identified in the IEMP) are not being met, the design and operation of the aquifer restoration system will be evaluated to determine if a change needs to be implemented. A change to the operation of the aquifer restoration system would be implemented by a modification to this OMMP. A groundwater monitoring change, if found to be necessary, would be implemented through the IEMP review and approval process. If additional characterization data are needed (e.g., to determine the nature of a newly detected FRL exceedance), a modification to the IEMP would be implemented, or a new sampling plan would be prepared, depending on the anticipated size of the activity. Before any required new extraction wells are put into operation, additional monitoring wells are installed to help monitor the performance of the new wells. The new extraction wells are also monitored for uranium concentration on a frequent basis just after startup. The sitewide groundwater data collected via the IEMP are used to assess the performance of the sitewide groundwater remedy. The data derived from the additional monitoring wells and new extraction well uranium monitoring are integrated with the IEMP groundwater monitoring such that area-wide interpretations can be made. Changes to the scope of the routine monitoring identified in the IEMP may be necessary based on the results of sampling conducted in the new monitoring and extraction wells. These changes would be accommodated as necessary through the prescribed IEMP review process.

Comprehensive Legacy Management and Institutional Controls Plan U.S. Department of Energy Attachment A—Operations and Maintenance Master Plan Doc. No. S03496-4.0—Final Page 3–10 April 2010
Figure 3–4. Current Groundwater Remediation/Treatment Schematic

U.S. Department of Energy Comprehensive Legacy Management and Institutional Controls Plan Doc. No. S03496-4.0—Final Attachment A—Operations and Maintenance Master Plan April 2010 Page 3–11
Figure 3–5. Groundwater Certification Process and Stages

Comprehensive Legacy Management and Institutional Controls Plan U.S. Department of Energy Attachment A—Operations and Maintenance Master Plan Doc. No. S03496-4.0—Final Page 3–12 April 2010
Details of the annual reporting of groundwater remedy performance are also provided in the IEMP, Section 3.7. The reporting subsection provides the specific information to be reported in the comprehensive Sitewide Environmental Report. 3.2 Other Site Wastewater Sources Leachate from the OSDF is the only other significant source of wastewater to be treated. Small amounts of wastewater from the extraction well rehabilitation process are generated periodically. This wastewater is also treated. A small amount of storm water from portions of the CAWWT footprint will be collected and treated as necessary. 3.3 Treatment Systems As noted in Section 1, with site closure in 2006, several water treatment flows were eliminated (remediation and sanitary wastewater) or greatly reduced (storm water runoff) from the scope of the treatment operation. The elimination or reduction of these flow streams provided an opportunity to reduce the size of the water treatment facility that remained to service the aquifer restoration after site closure. The various facility shutdown dates are provided in Figure 3−2. 3.3.1 CAWWT
As noted in Section 1, the AWWT expansion system was “converted” to the long-term groundwater treatment facility. The CAWWT provides a dedicated long-term groundwater treatment capacity of up to 1,800 gpm. The CAWWT process flow diagram is provided in Figure 3−6. The unit processes of the CAWWT system include granular multimedia filtration and ion exchange on all three trains. Operating the CAWWT to meet uranium discharge limits will most likely no longer be required after 2011 because it is projected that uranium discharge limits will be met without treatment. The test pump model is used to predict how long groundwater treatment will be required in order to meet uranium discharge limits. This model uses a spreadsheet to calculate a flow-weighted discharge concentration based on predefined pumping rates of the extraction wells, predefined treatment capabilities, and uranium concentrations measured in water pumped from the extraction wells. The current prediction of how long treatment will be needed is based on constant pumping rates defined for Modeling Approach C, treatment capabilities defined in the OMMP, and uranium concentration data collected at the extraction wells through 2004. The 2011 prediction is based on trending the 95 percent upper confidence level of actual concentration data collected at extraction wells. 3.4 Ancillary Facilities A number of facilities support the operation of aquifer restoration and the treatment system. These facilities include headworks for equalizing flow, groundwater flow routing facilities, wastewater collection and transfer facilities, and discharge monitoring facilities.

U.S. D
epartment of Energy
Com
prehensive Legacy Managem
ent and Institutional Controls Plan
Doc. N
o. S03496-4.0—Final
Attachm
ent A—
Operations and M
aintenance Master Plan
April 2010
Page 3–13
Figure 3–6. CAWWT Process Flow Diagram

Comprehensive Legacy Management and Institutional Controls Plan U.S. Department of Energy Attachment A—Operations and Maintenance Master Plan Doc. No. S03496-4.0—Final Page 3–14 April 2010
3.4.1 Great Miami Aquifer
No specific headworks exist for groundwater. However, because this flow can be adjusted by regulating the extraction wells, the aquifer itself serves as the headworks for groundwater. 3.4.2 CAWWT Backwash Basin
The CAWWT includes a backwash basin. This basin is an aboveground, lined basin measuring 100 ft × 100 ft × 6 ft deep. It was installed December 2005 through January 2006 and became operational the week of January 30, 2006. The basin was designed to contain the last remaining impacted storm water prior to site closure and to serve as the facility to contain backwash water from the CAWWT multimedia filters and ion exchange vessels for the duration of CAWWT operations. The basin has an approximate working capacity of up to 400,000 gallons to allow for a minimum of 6 inches of freeboard at all times. The basin contains a baffle to separate the influent from the effluent and allow any solids backwashed from the filters and ion exchange vessels to settle prior to discharge back into the CAWWT treatment system. 3.4.3 Storm Water Retention Basin Valve House
The Storm Water Retention Basin (SWRB) Valve House contains pipes that direct groundwater flow to the CAWWT for treatment. This facility also serves as the point of convergence for the effluent from the treatment system prior to discharge through the Fernald Preserve outfall pipeline. 3.4.4 South Field Valve House
As part of the South Field Extraction System Phase I construction, a new South Field Valve House was constructed, upstream of the SWRB Valve House. The primary purpose of this valve house is to receive the combined South Plume Recovery System groundwater. It directs all or portions of the combined flow toward treatment or toward untreated discharge prior to its being combined with other groundwater flows. 3.4.5 Parshall Flume
Downstream of the SWRB Valve House, the combined flows pass through the Parshall Flume and an associated outfall monitoring station for Fernald Preserve discharge flow measurement and monitoring. 3.4.6 OSDF Leachate Transmission System Permanent Lift Station
Leachate from the OSDF drains by gravity to the valve houses located on the west side of each cell. From the valve houses, the leachate is routed to the leachate transmission system (LTS) Permanent Lift Station (PLS). When sufficient leachate collects in the PLS, it is pumped to the CAWWT for treatment. 3.5 Current Treatment Performance The performance of the ARWWT systems measured against the overriding goal of meeting OU5 ROD discharge standards relative to uranium as well as NPDES effluent limits has been satisfactory. The uranium mass loading limit of 600 lbs/yr has been met every year since the

U.S. Department of Energy Comprehensive Legacy Management and Institutional Controls Plan Doc. No. S03496-4.0—Final Attachment A—Operations and Maintenance Master Plan April 2010 Page 3–15
requirement became effective in January 1998. As depicted in Figure 3−7, the monthly average concentration has been met every month since January 1998 with the exception of 5 months. The Fernald Preserve has been in compliance with NPDES effluent limits well in excess of 99 percent of the time since January 1995, the date the AWWT Phases I and II were placed into service. 3.6 Current and Planned Discharge Monitoring Currently, discharge monitoring is completed under two sampling programs. Conventional pollutants are monitored under the NPDES permit. Radionuclides and total uranium are monitored under the OU5 ROD and the Federal Facilities Compliance Agreement (FFCA) (EPA 1986). These two programs have been incorporated into the IEMP sampling program as described in Section 4 of the IEMP. These monitoring programs are described briefly in the Subsections 3.6.1 and 3.6.2. 3.6.1 NPDES Monitoring
Five locations are monitored under the current NPDES permit. Three of the locations relate to permitted Fernald Preserve wastewater/storm water discharge outfalls to State of Ohio waters (biowetlands overflow, Parshall Flume, storm sewer outfall ditch) and two relate to upstream and downstream monitoring (relative to the Fernald Preserve outfall line) of the Great Miami River. The permit (Ohio EPA Permit No. 1IO00004*HD) is administered by OEPA and granted to DOE at the Fernald Preserve. The effluent pollutant limitations, monitoring requirements, and reporting requirements are specified in the permit for each of the five monitored locations. 3.6.2 Radionuclide and Uranium Monitoring
The Fernald Preserve conducts a surface water sampling and analytical program for specific radionuclides that are potentially present in the regulated liquid effluent and in the uncontrolled storm water runoff from the site. Details of this program are provided in Section 4 of the IEMP. The daily total uranium analysis of the site effluent to the Great Miami River is used to track compliance with OU5 ROD established limits. The Fernald Preserve is obligated to limit the total mass of uranium discharged through the outfall line to the Great Miami River to 600 lbs/yr while not exceeding a monthly average of 30 ppb.

Com
prehensive Legacy Managem
ent and Institutional Controls Plan
U.S. D
epartment of Energy
Attachm
ent A—
Operations and M
aintenance Master Plan
Doc. N
o. S03496-4.0—Final
Page 3–16 A
pril 2010
Figure 3-7Monthly Average Uranium Concentration in the Effluent to the Great Miami River
(Through Dec 2008)
0
5
10
15
20
25
30
35
O-96D-96F-97A-97 J-97
A-97O-97D-97F-98A-98 J-98
A-98O-98D-98F-99A-99 J-99
A-99O-99D-99F-00A-00 J-00
A-00O-00D-00F-01A-01 J-01
A-01O-01D-01F-02A-02 J-02
A-02O-02D-02F-03A-03 J-03
A-03O-03D-03F-04A-04 J-04
A-04O-04D-04F-05A-05 J-05
A-05O-05D-05F-06A-06 J-06
A-06O-06D-06F-07A-07 J-07
A-07O-07D-07F-08A-08 J-08
A-08O-08D-08
Date
Ura
nium
Con
cent
ratio
n (u
g/L)
Average Total Uranium Concentration Discharged (ug/L) Monthly Average Limit for Total Uranium Concentration Discharged (ug/L) per ROD
Phase II clarifier upset
Storm Water
Eluate from regen. & STP
20 ppb limitin effect,01/1998
30 ppb limitin effect
Figure 3–7. Monthly Average Uranium Concentration in the Effluent to the Great Miami River (through December 2008)
U.S. Department of Energy Comprehensive Legacy Management and Institutional Controls Plan Doc. No. S03496-4.0—Final Attachment A—Operations and Maintenance Master Plan April 2010 Page 3–17
This daily effluent uranium analysis is also used to demonstrate compliance with the monthly average uranium concentration of 30 ppb uranium in the site discharge to the river. The original requirement for compliance with a monthly average concentration became effective on January 1, 1998, as established in the OU5 ROD. The OU5 ROD established this concentration at 20 ppb uranium, which was the compliance standard from January 1998 through November 2001. The monthly average concentration limit changed from 20 ppb to 30 ppb beginning December 1, 2001, as a result of EPA approval of the Explanation of Significant Differences [ESD] for Operable Unit 5 in November 2001. This OU5 ESD changed the total uranium groundwater FRL from 20 ppb to 30 ppb and established the new monthly average concentration discharge standard. The 600-lbs/yr limit was unaffected by this ESD and remains in effect. The monthly average uranium concentration is calculated by multiplying each daily flow by the uranium concentration of the flow-weighted composite sample for that day. The sum of the values obtained by multiplying the flow times by the concentration is then divided by the sum of the flows for the month. The result is a flow-weighted average monthly uranium concentration. The daily flow-weighted concentrations are then multiplied by 8.35 lbs/gallon to obtain the daily pounds of uranium discharged. The sum of the daily masses for the year is used to compare against the 600 lbs/yr limit. If the monthly average uranium concentration exceeds the 30 ppb limit, the exceedance will be reported to the agencies. If a sequence of months (i.e., not a random occurrence) indicates an exceedance of the 30-ppb monthly average, then corrective measures will need to be evaluated. Depending on the reason for the sequence of exceedances, corrective actions could include replacement of resin in CAWWT ion exchange vessels, segregation of the South Plume Optimization wells discharged from the combined South Plume Optimization/South Plume Recovery System header to reduce the concentration of uranium in flow bypassing treatment or other such actions. If corrective measures are deemed necessary, the situation will be outlined to the EPA and OEPA to reach consensus regarding what action (if any) is required. 3.6.3 IEMP Surface Water and Treated Effluent Monitoring Program
Significant portions of the current and past programs (NPDES and FFCA) have been incorporated into the IEMP. Section 4 of the IEMP describes these two programs in more detail and also how these two programs have been integrated into the IEMP surface water and treated effluent sampling program. The IEMP also provides for additional monitoring above that required by the NPDES permit and the FFCA. This additional monitoring is performed as a supplement to monitor surface water and treated effluent for potential site impacts to various receptors during aquifer remediation. In addition to identifying the sampling program requirements, the IEMP provides a comprehensive data evaluation and associated decision-making and reporting strategy for surface-water and treated effluent.

Comprehensive Legacy Management and Institutional Controls Plan U.S. Department of Energy Attachment A—Operations and Maintenance Master Plan Doc. No. S03496-4.0—Final Page 3–18 April 2010
This page intentionally left blank

U.S. Department of Energy Comprehensive Legacy Management and Institutional Controls Plan Doc. No. S03496-4.0—Final Attachment A—Operations and Maintenance Master Plan April 2010 Page 4–1
4.0 Projected Flows
This section addresses the latest understanding of flows for groundwater and OSDF leachate. 4.1 Groundwater Extracted groundwater is the primary wastewater flow requiring treatment. Groundwater extraction rates can be controlled. Groundwater flows are defined such that discharge limits at the Parshall Flume, and capture of the 30 micrograms per liter (µg/L) uranium plume, are achieved. The objective is to pump as aggressively as possible without exceeding discharge limits. The individual groundwater remediation modules that currently constitute the aquifer remedy are presented in Section 3.1. Figure 3−3 depicts the locations of all existing extraction wells. Table 4−1 provides the target extraction rate schedule for each of the wells currently operating. The combined modeled target pumping rate is approximately 4,775 gpm. Throughout the duration of groundwater remediation, the pumping rates may be modified within system design and operational constraints, as necessary. These rate modifications will be made to maintain, to the degree possible, the aquifer restoration objectives outlined in the remedy design. An operational rate of 10 percent over the modeled pumping rates is being targeted to provide for anticipated and unanticipated downtime. 4.1.1 OSDF Leachate
As of June 2009, the total leachate flow from all eight cells of the OSDF had declined to about 3,700 gallons per week, or about 0.4 gpm. This flow stream is expected to continue to decline since the facility was completely capped in late 2006. The leachate collects in the PLS pump sump and from there is pumped to the CAWWT for treatment.

Comprehensive Legacy Management and Institutional Controls Plan U.S. Department of Energy Attachment A—Operations and Maintenance Master Plan Doc. No. S03496-4.0—Final Page 4–2 April 2010
Table 4–1. Target Extraction Rate Schedule
System ID Location
Operations Identification
Database Identification
Target Extraction Rates (gpm)
11/06 to 04/01/15
Target Extraction Rates (gpm)
04/01/15 to End
I Waste Pits EW-26 32761 300 500
I Waste Pits EW-27 33062 200 200
I Waste Pits EW-28a 33334 200 200
I Waste Pits EW-33a 33347 300 300
System Totals Pumped 1,000 1,200
II South Field EW-15a 33262 200 300
II South Field EW-17 31567 175 175
II South Field EW-18 31550 100 100
II South Field EW-19 31560 100 100
II South Field EW-20 31561 100 400
II South Field EW-21a 33298 200 300
II South Field EW-22 32276 300 400
II South Field EW-23 32447 300 400
II South Field EW-24 32446 300 300
II South Field EW-25 33061 100 100
II South Field EW-30 33264 200 400
II South Field EW-31 33265 300 400
II South Field EW-32 33266 200 200
System Totals Pumped 2,575 3,575
IV South Plume RW-1 3924 200 0
IV South Plume RW-2 3925 200 0
IV South Plume RW-3 3926 200 0
IV South Plume RW-4 3927 200 0
IV South Plume RW-6 32308 200 0
IV South Plume RW-7 32309 200 0
System Totals Pumped 1,200 0
Total Extraction 4,775 4,775

U.S. Department of Energy Comprehensive Legacy Management and Institutional Controls Plan Doc. No. S03496-4.0—Final Attachment A—Operations and Maintenance Master Plan April 2010 Page 5–1
5.0 Operations Plan
This section contains the operations philosophy, treatment priorities, hierarchy of decisions, management and flow of operations information, and management of treatment residuals necessary to successfully operate the groundwater extraction and treatment systems to achieve regulatory requirements and commitments. 5.1 Wastewater Treatment Operations Philosophy The primary goals of wastewater treatment operations and maintenance are to (1) meet effluent discharge requirements, (2) provide sufficient treatment capacity such that the desired groundwater pumping rates can be maintained, and (3) provide for leachate treatment. In keeping with the principles of “as low as reasonably achievable,” correct decisions in applying treatment are required to maximize the quantity of uranium removed from wastewater prior to its discharge to the Great Miami River. Maximizing uranium removal should result in compliance uranium discharge limits. Other regulatory discharge requirements, such as NPDES, must also be met. Influent streams to treatment and effluent streams from treatment as well as other process control sampling around specific unit operations (e.g., ion exchangers) is completed for uranium and other appropriate constituents as necessary to provide information needed to help ensure that the goals are met. Sampling under the NPDES permit and the IEMP is performed to verify that requirements and effluent limits for discharges to the Great Miami River are met. 5.2 CAWWT Operation As discussed in Section 3, the only remaining treatment system is the CAWWT. The effluent from this system and bypassed (untreated) groundwater combine at the Parshall Flume to form the Fernald Preserve’s regulated discharge to the Great Miami River. The priority for treatment will always be OSDF leachate and the extraction wells with the highest uranium concentrations. Groundwater sent to treatment typically contains a uranium concentration of 45 to 65 ppb. Groundwater is fed to two treatment systems at the CAWWT. The 1,200-gpm system treats only groundwater. The 600-gpm system treats groundwater, leachate from the OSDF, and water from the CAWWT backwash basin. The CAWWT backwash basin collects backwash from all CAWWT ion exchange vessels and multimedia filters, water from the CAWWT sump, and water from well and pump rehabilitations. Water from the basin is pumped to the 600-gpm treatment system at a flow rate adequate to ensure that the basin level does not reach 5 ft. Groundwater flow to the 600-gpm system is reduced as necessary to maintain a low level in the basin. The basin will maintain at least 6 inches of freeboard at all times. Shift supervision is provided as necessary, 365 days per year. As the supervisor of all operations and maintenance activities that occur on a particular shift, the shift supervisors are responsible for ensuring that treatment and monitoring equipment is operated, maintained, and repaired so that the necessary treatment throughput is achieved. Operations and maintenance are performed in accordance with all appropriate standard operating procedures, standards, and specifications. Additionally, process engineering support personnel are on call to provide assistance in problem solving.

Comprehensive Legacy Management and Institutional Controls Plan U.S. Department of Energy Attachment A—Operations and Maintenance Master Plan Doc. No. S03496-4.0—Final Page 5–2 April 2010
5.2.1 Ion-Exchange Vessel Rotation
The CAWWT ion exchange system has trains of two ion-exchange vessels operating in series: lead and lag. When the ion exchange resin in both vessels is new, the majority of uranium is removed in the lead vessel. As the lead vessel becomes loaded with uranium, more passes through into the lag vessel. As the lag vessel becomes loaded, more uranium passes into the discharge stream. When the uranium concentration in the discharge from a lead ion exchange vessel approaches or equals the concentration of the influent, the resin is removed from the vessel and replaced with new resin. The lag vessel is moved into lead, and the vessel containing new resin is placed in lag. 5.3 Groundwater Treatment The CAWWT provides up to 1,800 gpm treatment for groundwater. Wells are pumped to treatment or bypass as described in the next section. The set points at which the wells are pumped are typically set to approximately 10 percent more than the groundwater remedy target set point to account for downtime. 5.3.1 Groundwater Treatment Prioritization vs. Bypassing
Treatment of groundwater well discharges are prioritized in order of uranium concentration; the highest uranium concentration wells are routed to treatment until the treatment capacity necessary to meet the site’s uranium discharge limit is utilized. Remaining well discharges are bypassed around treatment to the Parshall Flume. As shown schematically in Figure 3−4, treatment/bypass decisions for the Southfield and Waste Storage Area extraction wells are made on a well-by-well basis. The existing four South Plume off-property leading-edge wells, combined with the two wells of the South Plume Optimization Project, are routed as a group either for treatment, full bypass, or partial bypass, since piping does not exist for well-by-well treatment/bypass decision. The off-property South Plume wells are typically routed directly to bypass at the South Field Valve House, since their combined uranium concentration is very near or less than 30 ppb uranium. 5.4 Well Field Operational Objectives Several objectives must be considered when well field operational decisions are made. These objectives are listed in Table 5−1 along with the anticipated actions required to achieve each objective. At times the objectives conflict; therefore, operational decisions are generally made by ARWWP management. Decisions that affect well field operations are communicated to EPA and OEPA in the IEMP reports. Changes in groundwater restoration well pumping set points are transmitted to shift supervisors by the ARWWP manager. In addition to the objectives listed in Table 5−1, uranium concentration rebound will be measured annually. Uranium contamination bound to aquifer sediments in the unsaturated portion of the Great Miami Aquifer has been identified under some source areas at the site. Uranium bound to unsaturated aquifer sediments will remain bound unless water levels rise and saturate the sediments, allowing the uranium to dissolve into the groundwater.

U.S. Department of Energy Comprehensive Legacy Management and Institutional Controls Plan Doc. No. S03496-4.0—Final Attachment A—Operations and Maintenance Master Plan April 2010 Page 5–3
Table 5–1. Well Field Operational Objectives
Objectives Actions Required Operate individual wells within constraints imposed by system design and equipment. Key constraints include: • Pumping equipment is limited to a range of
flows that will dictate the flexibility of extraction rates for individual wells.
• Hydraulic capacity of the piping limits extraction rates.
• Control range of flow control valves and variable frequency drives (VFDs) for pump motors bound the range of extraction rates for individual wells.
• Capacity of existing electrical service to each well.
• Average entrance velocity of water moving into the screen should not exceed 0.1 ft per second.
Operate well pumps and motors according to manufacturer recommendations. Operate extraction well systems within design constraints.
Perform necessary equipment/well maintenance in accordance with established schedules.
According to OMMP, Section 6.
Maintain compliance with the discharge limits of 30 µg/L monthly average uranium concentration and 600 lbs/yr for the combined site water discharged to the Great Miami River.
Monitor discharge concentrations. Modify well set points as necessary to maintain compliance with discharge limits. Evaluate well set points and treatment routing monthly. Use flow-weighted average-concentration calculations to predict how changes to set points and routing will affect discharge concentrations. Compare predictions with actual measurements to evaluate if/how predictions can be improved. Maintain well set points to the degree possible.
Minimize impact to the Paddys Run Road Site plume.
Pumping from well 3924 (RW-1) should not exceed 300 gpm. Pumping from well 3925 (RW-2) should not exceed 300 gpm (if well 3924 is pumping) and 400 gpm (if well 3924 is not pumping).Pumping from well 3926 (RW-3) should not exceed 500 gpm if either well 3924 or well 3925 goes down. If the actual capture zone differs significantly from that defined via previous modeling, it may be determined that the pumping rates noted above require modification to maintain this objective. Required modifications will be made based on additional modeling projections and verified based on field data.

Table 5–1 (continued). Well Field Operational Objectives
Comprehensive Legacy Management and Institutional Controls Plan U.S. Department of Energy Attachment A—Operations and Maintenance Master Plan Doc. No. S03496-4.0—Final Page 5–4 April 2010
Maintain capture of the 30 µg/L uranium plume along the southern administrative boundary.
The following pumping rates for each South Plume well provides for the capture (within system constraints) of the uranium plume along the administrative boundary:
well 3924 at 200 gpm well 3925 at 200 gpm well 3926 at 200 gpm well 3927 at 200 gpm
Adjust the pumping rates of the remaining operable wells in the South Plume module to maintain capture along the administrative boundary when (1) any single South Plume Module well outage for 1 week or more occurs or (2) multiple well outages occur for 3 days or more. If the actual capture zone differs significantly from that defined via previous modeling, it may be determined that the pumping rates noted above require modification to maintain this objective. Required modifications will be made based on additional modeling projections and verified based on field data.
Maintain hydraulic capture of the remaining portions of the 30 µg/L uranium plume (within areas of active modules).
Establish pumping rates based on model predictions of required pumping rates to maintain a desired area of capture. Determine the actual area of capture created when the wells are operating at the modeled rates based on groundwater elevation contour maps derived from field measurements. Adjust pumping rates within system design and operational constraints, if warranted, when the actual area of capture is not consistent with the modeled area of capture. This will be done in an effort to establish an area of capture consistent with the desired area of capture, as modeled.
Minimize duration of cleanup time for off-property portion of the 30 µg/L uranium plume.
Give priority to keeping South Plume and South Plume Optimization wells online when other wells have to be shut down. Maximize pumping rates within the following constraints and considerations: system design and equipment, hydraulic capacity of the aquifer, regulatory limits, interaction with other modules, and remedy performance.
Minimize duration of cleanup time for on-property portions of the uranium plume.
Maximize pumping rates within the following constraints and considerations: system design and equipment, hydraulic capacity of the aquifer, regulatory limits, interaction with other modules.
Minimize migration of on-property portion of the plume to off-property areas.
Balance pumping from the South Field Extraction and South Plume Modules such that the stagnation zone is at or south of Willey Road.
Minimize drawdown in off-property areas. Do not exceed 110 percent of the points defined in Table 4−1 unless directed by ARWWP management.
Annual shutdown of all extraction wells (with the exception of the four leading-edge South Plume recovery wells) is conducted to allow water levels within the aquifer to rise. An evaluation of aquifer water levels collected since 1988 indicates that seasonal water levels are usually at their highest level during June and July. Shutting down the extraction wells when seasonal water levels are high will maximize the saturation of as much of the aquifer sediments as possible. Water levels will be measured at key locations (by hand and downhole transducer/data logger) before, during, and after the shutdown to record the resulting water level change. The uranium concentration in the pumped groundwater immediately after the wells are restarted will be compared to pre-shutdown concentrations to determine the amount of concentration rebound that occurred. Shutdown times are subject to change.

U.S. Department of Energy Comprehensive Legacy Management and Institutional Controls Plan Doc. No. S03496-4.0—Final Attachment A—Operations and Maintenance Master Plan April 2010 Page 5–5
The well field downtime period will also be used to conduct well field and water treatment system maintenance. 5.5 Operational Maintenance Priorities Maintaining the treatment facilities online includes ensuring that all equipment is operating properly, that adequate personnel are assigned to operate the treatment systems safely, and that the combined treatment and bypassing systems are used to maintain uranium concentrations below 30 ppb as measured in the site effluent at the Parshall Flume. Following is a list of operational maintenance priorities in their order of importance:
1. Keep the Parshall Flume discharge point and sampling system online. If the discharge monitoring system were to become nonoperational, discharge monitoring of effluent to the river from the Fernald Preserve would have to be collected manually. The sampling system must be operational so that accurate reports of uranium and NPDES contaminant levels can be made.
2. Keep the CAWWT treatment trains operating at the capacity necessary to maintain compliance with the site’s uranium discharge limits.
3. Keep South Plume recovery wells 1 through 4 operating at desired set points.
4. Keep all extraction wells operating at the desired set points.
Section 6.0 provides more-specific details of managing equipment operation and maintenance. 5.6 Operations Controlling Documents Operations at the wastewater treatment facilities are controlled directly by standing orders and standard operating procedures described in Legacy Management Fernald Operating Procedures (DOE 2006b). Standing orders translate the DOE orders, conduct of operations principles, guidelines, and procedures into performance requirements for personnel involved in operating the wastewater treatment facilities. The standing orders were written to ensure that all operations are conducted in full conformance with DOE conduct of operations requirements. Section 6.1.2 provides a more extensive discussion of standard operating procedures and standing orders. Standing orders and standard operating procedures implement the requirements of this plan. The OMMP is not intended to replace standing orders or standard operating procedures. 5.7 Management and Flow of Operations Information Samples are taken from each of the CAWWT trains on a regular basis to ensure that uranium is still being removed by the resin. Project personnel review the results of sample analysis as necessary to evaluate system performance and determine if any of the treatment system ion exchange vessels need to be removed from service for resin replacement. The project issues monthly operations reports that summarize flow rates and flow totals as well as uranium concentrations from the CAWWT and the wells. Information on required well pumping rates is communicated from the manager of the ARWWP to the operations personnel as

Comprehensive Legacy Management and Institutional Controls Plan U.S. Department of Energy Attachment A—Operations and Maintenance Master Plan Doc. No. S03496-4.0—Final Page 5–6 April 2010
specified in the Legacy Management Support Conduct of Operations Manual (LMS/POL/S04374). 5.8 Management of Treatment Residuals Treatment residuals consist of exhausted ion exchange resin and used multimedia filters. These materials will ultimately be disposed of off site at a licensed disposal facility. They will be transported using a subcontractor qualified to transport radioactive materials. Unused tankage at the CAWWT may be used for interim storage of treatment residuals until the CAWWT is decommissioned.
U.S. Department of Energy Comprehensive Legacy Management and Institutional Controls Plan Doc. No. S03496-4.0—Final Attachment A—Operations and Maintenance Master Plan April 2010 Page 6–1
6.0 Operations Performance Monitoring and Maintenance
This section describes the general methods, guidelines, and practices used in managing equipment operation and maintenance and presents planned maintenance and monitoring requirements for the groundwater restoration wells to support successful long-term operation of the groundwater restoration system. Managing equipment operation and maintenance in the context of this document includes not only routine control panel monitoring and repair work, but also the preventive, predictive, and proactive actions used to maximize equipment operating efficiency and capacities. This section presents some of the management systems that will help to ensure that the OU5 ROD requirements continue to be met, describes the key parameters used to monitor performance of the groundwater and wastewater facilities, and describes the principal features and maintenance needs of the overall operation. The treatment system and restoration well system performance parameters and maintenance requirements have unique differences. The treatment system is designed and built with redundant features and equipment to reduce potential downtime (e.g., installed spare pumps and lead-lag ion exchange units). Those features are not economically practical for the well systems. The equipment in the treatment systems has more easily discernible indicators of equipment condition and is more easily accessed for monitoring by operating personnel walk-through than the underground well system. The methods used to measure the equipment condition and the specific measurable goals for the two systems also are different. The activities described in this section also provide the basis for routine maintenance of the system and for monitoring the system performance to determine if more extensive maintenance activities are required. Regularly scheduled maintenance minimizes system downtime. Continuous operation of the well system, within practical limitations, is required to maintain groundwater restoration objectives at the Fernald Preserve. This plan describes monitoring and maintenance activities and their frequencies, based on current projections. The need for and frequency of these activities may change based on future experience gained through the operation, maintenance, and monitoring of the extraction wells that are currently operating. Parameter monitoring frequency may change as well. This plan will be revised as necessary during the life of the groundwater restoration process. 6.1 Management Systems 6.1.1 Maintenance and Support
A qualified subcontractor under the direction of LM personnel will provide maintenance for the well field and treatment system. Preventive maintenance will be performed on the schedule recommended by the equipment manufacturer. The technical staff directly supports facility operation and maintenance. The technical staff members work together to resolve issues and improve operations. They also provide troubleshooting and technical assistance to the day-to-day operations and maintenance groups.

Comprehensive Legacy Management and Institutional Controls Plan U.S. Department of Energy Attachment A—Operations and Maintenance Master Plan Doc. No. S03496-4.0—Final Page 6–2 April 2010
The facilities consist of standard high-capacity filter-packed water wells and conventional water and wastewater treatment unit processes that are typical for the industry. The equipment is expected to continue to have good reliability and has well-documented maintenance guidelines. Routine maintenance practices, as documented by the original equipment manufacturer’s maintenance manuals, have been used to provide the basis for maintenance procedures and practices. Maintenance feedback and component manufacturer suggestions have been used to develop a spare parts list and stock inventories of the most frequently used parts. The availability of spare parts will assist in minimizing downtimes associated with all maintenance activities. 6.1.2 Operations
Operating personnel play an important role in maximizing equipment operating efficiency and capacity. One significant duty of the facility operating personnel is to identify and report existing and potential future equipment problems. Operating personnel perform routine scheduled checks, inspections, and walk-throughs of the facilities and systems. Potential problems and maintenance needs are reported to supervisors, and maintenance work orders are initiated. Operating personnel maintain shift logbooks that document activities and specific actions taken during each shift. Information in the logbooks is used as the basis for transfer of duty from one shift to the next. The logbooks are kept as a historical record of operational activities. Management and technical staff periodically review the logbooks and roundsheets as additional assurance that the systems are being operated effectively. 6.1.2.1 Process Control
Facilities are staffed by operating personnel daily. The operating personnel at CAWWT monitor the process using a computerized control system located in the control room. The control system receives input from process meters (e.g., tank level and process flow meters) and from devices that indicate equipment status (e.g., valve position limit switches and motor run relays). The control system outputs control signals to regulate the process (e.g., control valve positioning and motor start/stop control). The control system uses desktop-style computer equipment (monitors, keyboards, and pointing devices) to provide a graphic human-machine interface (HMI) for the process monitoring and control. The control system HMI includes various process graphics screens that depict portions of the treatment system in piping and instrumentation diagram format and provide real-time process measurements and information. The control system has graphic process trending capabilities, process alert and alarm management, and a historical database of all operating personnel input and process alert/alarms. The control system also provides an interface with all well systems to provide enhanced real-time monitoring and remote controls. The operating personnel at CAWWT also access process and equipment information by making “walking rounds” of all equipment in the process. 6.1.2.2 Standard Operating Procedures
Each operation is performed in accordance with approved standard operating procedures that are developed by the technical staff with the assistance of operations personnel. Standard operating procedures can be found in the Legacy Management Fernald Operating Procedures (DOE 2006b). The standard operating procedures are reviewed periodically and revised as necessary for the safe and consistent operation of treatment processes.

U.S. Department of Energy Comprehensive Legacy Management and Institutional Controls Plan Doc. No. S03496-4.0—Final Attachment A—Operations and Maintenance Master Plan April 2010 Page 6–3
Standard operating procedures provide step-by-step instructions for performing wastewater treatment operations activities. They also contain health and safety precautions that employees must follow while performing the steps in the procedure. The procedures are written from the perspective of the operating personnel who will be performing the steps. Standard operating procedures also contain instructions as to when management must be notified of nonroutine operating conditions or events and to whom in management these conditions must be reported. Standard operating procedures include such activities as:
• Horiba water quality meter calibration, operation, and maintenance.
• IEMP surface water sampling.
• NPDES sampling.
• Daily operations at the Parshall Flume.
• Enhanced permanent LTS operation.
• CAWWT system operations.
• Recovery and extraction well fields.
• DPD method for free and total chlorine test.
• Soluble uranium by kinetic phosphorescence analyzer (KPA).
• Standing orders for Wastewater Treatment Operations. 6.1.2.3 Conduct of Operations
DOE Order 5480.19, Conduct of Operations Standards, is implemented for operations and maintenance through standing orders. The standing orders spell out the specific methods used by the project for the implementation of all 18 chapters of DOE Order 5480.19. The chapter titles (which are indicative of the important operational protocol) are “Operations, Organization, and Administration,” “Shift Routines and Operating Practices,” “Control Area Activities,” “Communications,” “Control of On-Shift Training,” “Investigation of Abnormal Events,” “Notifications,” “Control of Equipment and System Status,” “Lockouts and Tagouts,” “Independent Verification,” “Log Keeping,” “Operations Turnover,” “Operations Aspects of Facility Chemistry and Unique Processes,” “Required Reading,” “Timely Orders to Operators,” “Operations Procedures,” “Operator Aid Postings and Equipment,” and “Piping Labeling.” Implementation of the standing orders helps to ensure clarity, consistency, and a common purpose in the day-to-day activities. 6.1.2.4 Training
A training and qualification program is in place to ensure that all operating personnel involved in treating wastewater are qualified and competent for their positions. The goal of the training and qualification program is to prepare personnel for the operations team and to continually improve the team’s knowledge and capabilities.

Comprehensive Legacy Management and Institutional Controls Plan U.S. Department of Energy Attachment A—Operations and Maintenance Master Plan Doc. No. S03496-4.0—Final Page 6–4 April 2010
6.2 Restoration Well Performance Monitoring and Maintenance This section describes the key performance monitoring and maintenance guidelines for the groundwater restoration well systems. To complete the aquifer restoration within the model-predicted time frames, a high level of on-stream time at the modeled pumping rates is needed for each well. Actual target pumping rates are set at around 110 percent of the modeled target pumping rates to provide for downtime. Some well downtime is expected and can be accommodated. However, lengthy outages can adversely impact the planned goals. An upgraded well maintenance program has been developed to address this issue. More frequent component preventive maintenance checks along with periodic formal performance testing and well and pump cleaning were identified and included as major program elements to improve well operating efficiency. 6.2.1 Restoration Well Descriptions
This section provides a general description of the extraction wells that constitute the active groundwater restoration modules. The active modules are the South Plume, South Field, and the Waste Storage Area. 6.2.1.1 South Plume Extraction Wells
The South Plume Module includes six wells that are used to pump groundwater from the off-property portion of the Great Miami Aquifer plume to the Fernald Preserve’s South Field Valve House. In the valve house, flow from the following south plume wells is routed to treatment or to the Great Miami River, as necessary, to maintain compliance with discharge limits:
Extraction Well ID Common Well ID Formal Site Well ID EW-1 RW-1 3924 EW-2 RW-2 3925 EW-3 RW-3 3926 EW-4 RW-4 3927 EW-6 RW-6 32308 EW-7 RW-7 32309
Each of the South Plume extraction wells contains a submersible pump/motor assembly and has a pitless-type adapter near the ground surface that transitions the vertical pump discharge piping to the underground force main. The underground force main from wells RW-1, RW-2, RW-3, and RW-4 passes through individual underground valve pits. These valve pits contain several components of the individual well’s control system. RW-6 and RW-7 do not use underground valve pits to contain any control system components. All control components for these two wells are located in the South Plume Valve House building. The design of the flow control systems for each of these six wells is identical; flow is controlled by a flow control loop consisting of a magnetic flow meter, a process control station (PCS), and a motor-operated flow-control valve. Each well can be controlled locally by the PCS or remotely by the computerized control system located at the CAWWT. The normal operational mode is to have the wells operated remotely from the CAWWT computer control system via the local PCS.

U.S. Department of Energy Comprehensive Legacy Management and Institutional Controls Plan Doc. No. S03496-4.0—Final Attachment A—Operations and Maintenance Master Plan April 2010 Page 6–5
Additionally, a local set point is input into the PCS so that the well can automatically revert to local control if communication with the CAWWT computer control system is interrupted. The desired flow rate set point for each is entered into the computer control system and PCS at the CAWWT and the South Plume Valve House, respectively. This value is compared continuously to the actual flow measured by the magnetic flow meter. When required, the CAWWT computer control system or PCS adjusts the position of the flow control valve to maintain the desired flow. Pump “Start” and “Stop” can be controlled by the HMI or the PCS and can also be controlled from the pump starter panel. The starter panels for RW-1 through RW-4 are located at the individual wellheads, and the starter panels for RW-6 and RW-7 are located in the South Plume Valve House. In addition, each South Plume extraction well is equipped with isolation valves, check valves, an air release, and a pressure-indicating transmitter. The pressure-indicating transmitters are tied to process interlocks that will shut the pumps down if high or low pressures are maintained for extended periods, indicating a closed valve or catastrophic system leak, respectively. This interlock is intended to protect the pump/motor assemblies from damage due to closed discharge valves or to shut down the pumps if no system backpressure is sensed. Critical control components are protected by lightning/surge arresters to help prevent damage to the control system during electrical storms. Routine water level monitoring within the well is performed during regularly scheduled performance monitoring or more frequently if required. Installation details of the South Plume extraction wells are shown in Figure 6−1. 6.2.1.2 South Field and Waste Storage Area Extraction Wells
The South Field and Waste Storage Area Modules include 13 and 4 wells, respectively, which are used to pump groundwater from the Great Miami Aquifer to the Fernald Preserve water treatment facilities or to the Great Miami River if treatment is not required to achieve uranium discharge limits. These wells are as follows:
Extraction Well ID EW-15A EW-17A EW-18 EW-19 EW-20
EW-21A EW-22 EW-23 EW-24 EW-25 EW-30 EW-31 EW-32
WSA Well 26 WSA Well 27
WSA Well 28A WSA Well 33A
Common Well ID EW-15A EW-17A EW-18 EW-19 EW-20
EW-21A EW-22 EW-23 EW-24 EW-25 EW-30 EW-31 EW-32 EW-26 EW-27
EW-28A EW-33A
Formal Site Well ID 33262 31567 31550 31560 31561 31562 32276 32447 32446 33061 33264 33265 33266 32761 33062 33334 33347

Com
prehensive Legacy Managem
ent and Institutional Controls Plan
U.S. D
epartment of Energy
Attachm
ent A—
Operations and M
aintenance Master Plan
Doc. N
o. S03496-4.0—Final
Page 6–6 A
pril 2010
Figure 6–1. South Plume Module Extraction Well Installation Details
U.S. Department of Energy Comprehensive Legacy Management and Institutional Controls Plan Doc. No. S03496-4.0—Final Attachment A—Operations and Maintenance Master Plan April 2010 Page 6–7
Each of the 13 South Field and 4 Waste Storage Area extraction wells is of similar design with the exception of the well depth, screen length, and screen slot size. Each contains a submersible pump/motor assembly. Groundwater is pumped from the below-grade pump to the wellhead at the ground surface via the vertical discharge piping. At the wellhead, this piping is routed horizontally through a magnetic flow meter and into the individual well houses. All of the individual well control components are located at these well houses. The flow control system for each of the 17 extraction wells is identical; flow is controlled by a flow-control loop consisting of a magnetic flow meter, a PCS, and a variable frequency drive (VFD). Each extraction well can be controlled locally by the PCS or remotely by the computerized control system located at the CAWWT (HMI). The normal operational mode is to have the wells operated remotely from the CAWWT computer control system, via the local PCS. Additionally, a local set point is input to the PCS so that the well can automatically revert to local control if communication with the CAWWT computer control is interrupted. The desired flow rate set point for each extraction well is entered into the HMI and PCS at the CAWWT and the individual well houses, respectively. This value is compared continuously to the actual flow rate measured by the magnetic flow meter. When required, the CAWWT HMI or PCS adjusts the pump motor speed via the VFD to maintain the desired flow. Pump “Start” and “Stop” can be controlled by the CAWWT HMI or the PCS and can also be controlled at the VFD. In addition, each extraction well is equipped with isolation valves, check valves, an air release, and a pressure-indicating transmitter. Routine water level monitoring within the well is performed during regularly scheduled performance monitoring and more frequently if required. Installation details of the South Field Extraction wells and Waste Storage Area wells are shown in Figure 6–2. 6.2.2 Factors Affecting System Operation
The original five extraction wells of the South Plume groundwater restoration module began operating in August 1993 as part of the OU5 South Plume Removal Action. In the intervening time, valuable operational experience and knowledge has been gained that is being used to optimize long-term operation of extraction wells sitewide. This experience has resulted in identification of factors affecting operation life and efficiency, some of which were unknown at the start of pumping operations. These factors have either already been addressed or are incorporated into planned maintenance. To better understand the factors affecting large-scale groundwater pumping operations, Moody’s of Dayton, a water well maintenance and installation contractor, was consulted. Moody’s has served the water well industry throughout the Great Miami Aquifer for more than 30 years and has extensive experience maintaining large-capacity wells for a number of major water supply systems. Frequencies for routine maintenance and monitoring activities were selected using recommendations from their evaluation of the South Plume Extraction well system and their experience working with systems of similar magnitude in the regional aquifer. Well maintenance protocol was further refined in 2008 based on additional consultation with Smith-Comeskey Groundwater Science LLC.

Com
prehensive Legacy Managem
ent and Institutional Controls Plan
U.S. D
epartment of Energy
Attachm
ent A—
Operations and M
aintenance Master Plan
Doc. N
o. S03496-4.0—Final
Page 6–8 A
pril 2010
Figure 6–2. South Field Module and Waste Storage Area Extraction Well Installation Details

U.S. Department of Energy Comprehensive Legacy Management and Institutional Controls Plan Doc. No. S03496-4.0—Final Attachment A—Operations and Maintenance Master Plan April 2010 Page 6–9
Several factors affect the performance of the extraction wells. In addition, a number of other specific requirements of the Fernald Preserve’s system complicate these factors. All of these factors and requirements were considered in developing this plan. First, all the Fernald Preserve’s extraction wells are placed in and are extracting water from the uppermost portions of the Great Miami Aquifer. This fact complicates both pump/motor cooling and iron fouling of the extraction well screen. Normal water well practice would place the screened section of the well deeply in the aquifer, and the pump/motor assembly would be placed above the screen in a submerged section of blank casing. Since the extraction wells are intended to intercept a plume of contamination located near the top of the aquifer, the screened sections begin near the normal water level. In order to provide the required submergence of the pump/motor assembly, this assembly must be placed within the screened section. The high flow rates required for plume capture combined with the “surgical” removal of the contamination plume have led to difficulties ensuring that the flow of water passing the motor is adequate for cooling. Placement of the pump/motor assembly within a screen that is located near the aquifer water table also complicates the impacts of iron-fouling. Moody’s and Groundwater Science have confirmed that iron fouling is prevalent throughout the regional aquifer and that the details of the Fernald Preserve installation enhance the problem. These conditions and the fact that this region of the Great Miami Aquifer contains some of the highest concentrations of iron and iron-fouling bacteria have resulted in fouling of the well screens and other downstream equipment. Continuous operation of the extraction wells also exacerbates the factors noted above. Normal water well industry practice does not require pumping wells to operate continuously. Typical water supply well systems pump between 6 and 10 hours per day and have spare wells that can be rotated in and out as demand requires (especially when maintenance is required). The Fernald Preserve’s extraction well system, however, runs continuously and has no spare wells to compensate for wells taken out of service for maintenance. In fact, when a well is shut down for an extended period to perform maintenance, the remaining wells may need to increase their flow to continue the planned capture of the plume. 6.2.3 Maintenance and Operational Monitoring
Several routine activities are performed to optimize performance of the extraction wells in the South Plume, South Field, and Waste Storage Area groundwater restoration modules. The following maintenance and operational monitoring activities are described in this section:
• Routine system maintenance, which includes maintenance actions related to valves, instrumentation, and controls associated with each extraction well, and
• Operational monitoring, which includes quarterly monitoring of extraction well capacity and pump/motor assembly performance.
Table 6−1 lists planned outages for the South Plume Module wells, and Table 6−2 lists planned outages for the South Field and Waste Storage Area wells. Routine well/screen maintenance (i.e., superchlorination) is no longer an activity of the OMMP. Advice from the site water well drilling and maintenance subcontractor and Groundwater Science personnel coupled with lessons learned by operating extraction wells at the Fernald Preserve for over 13 years indicate that the superchlorination procedure is not effective and in fact may exacerbate well and pump fouling.

Comprehensive Legacy Management and Institutional Controls Plan U.S. Department of Energy Attachment A—Operations and Maintenance Master Plan Doc. No. S03496-4.0—Final Page 6–10 April 2010
Table 6–1. Planned Outages of the South Plume Module Wells
Item Description Frequency Duration per Event 1 Performance Testing Quarterly 4 hours/well 2 Process Control Station Annually 4 hours/well 3 Pressure Transmitter Calibration Annually 2 hours/well 4 Magnetic Flow Meter Clean and Calibratea Semiannually 4 hours/well 5 Check Valve Inspect/Clean Semiannually 4 hours/well 6 Flow Control Valve and Actuator Cleaning Annually 8 hours/well 7 Rehabilitation Variable 3 weeks 8 Well/Pump Cleaning Variable 1–2 days
aFlow meter calibration may occur as a post-maintenance test using a portable flow meter.
Table 6–2. Planned Outages of the South Field and Waste Storage Area Module Wells
Item Description Frequency Duration per Event 1 Performance Testing Quarterly 4 hours/well 2 Process Control Station Annually 4 hours/well 3 Pressure Transmitter Calibration Annually 2 hours/well 4 Magnetic Flow Meter Clean and Calibratea Semiannually 8 hours/well 5 Check Valve Inspect/Clean Semiannually 4 hours/well 6 Rehabilitation Variable 3 weeks 7 Well/Pump Cleaning Variable 1–2 days
aFlow meter calibration may occur as a post-maintenance test using a portable flow meter. 6.2.3.1 Maintenance of the Pumps, Piping, and Controls
These maintenance activities are directed primarily at the valves, instrumentation, and controls associated with each extraction well. These actions are incorporated into the ARWWT maintenance tracking spreadsheet. This spreadsheet helps to ensure that routine maintenance is performed when required. In addition to formal preventive maintenance activities, several routine system checks are performed by operations personnel, between scheduled preventive maintenance activities, to ensure that equipment is functioning properly. The following is a list of preventive maintenance and operational checks that are routinely performed: Process Control Station: Annual The PCSs for each of the recovery and extractions wells are taken out of service annually. At this time, the operational setup parameters for the specific wells are verified and/or updated to reflect current operating conditions. This is anticipated to require an outage of 4 hours per well. Flow Meters: Clean and Calibrate Semiannually Cleaning and calibration of the flow meter is estimated to require an outage of 4 hours per extraction well in the South Plume and 8 hours for each on-property extraction well.
U.S. Department of Energy Comprehensive Legacy Management and Institutional Controls Plan Doc. No. S03496-4.0—Final Attachment A—Operations and Maintenance Master Plan April 2010 Page 6–11
Check Valves: Inspect and Clean Seat Semiannually Inspection and cleaning of the check valve is estimated to require an outage of 4 hours per extraction well. The piping configuration for extraction wells RW-1 through RW-4 includes two check valves. The original check valve cannot be inspected or maintained without removal from the piping system and, because of its location at the extreme end of the piping run in the valve pit, requires that the entire South Plume extraction well system be shut down and drained. The redundant check valve was installed between isolation valves and is a “swing-check” valve that is equipped with a removable inspection plate. Inspection and cleaning of this check valve requires that the individual extraction well be shut down for approximately 4 hours. Extraction wells RW-6 and RW-7 and all of the on-property extraction wells have a single in-line check valve that is removed, inspected, and cleaned. This maintenance activity is estimated to require each well to be shut down for approximately 4 hours. Flow Control Valves and Actuators: Disassemble and Inspect Annually Extraction wells RW-1 through RW-4, RW-6, and RW-7 each use motor-operated flow control valves. These are required to be inspected and cleaned annually to prevent the buildup of iron-fouling bacteria encrustation. This maintenance activity will require each well to be shut down for approximately 8 hours. Pressure-Indicating Transmitters: Annual Calibration Each extraction well has a pressure-indicating transmitter that is used in performance testing to determine the pump’s discharge head (pressure). Accurate pressure sensing in the full range of pumping pressures is required for accurate testing. Annual testing and calibration of these transmitters is estimated to require an outage of 2 hours per well. Operational Monitoring The main system performance indicators for the South Plume and South Field extraction well modules are gathered and summarized in performance tests conducted quarterly. These tests monitor the specific capacity of each recovery/extraction well and the pump/motor assembly performance. The test results are used to determine the need for well and pump cleaning, well redevelopment, or pump/motor rebuilding. The information helps minimize unscheduled, unplanned emergency maintenance and shortens the duration of well outages. Several of the parameters measured may be monitored more frequently to develop additional system data for trending purposes. Parameters to Be Monitored Extraction well operating parameters that are required to be routinely monitored include the following:
• Water level—static and pumping
• Flow
• Discharge pressure
• Motor amperage draw
Comprehensive Legacy Management and Institutional Controls Plan U.S. Department of Energy Attachment A—Operations and Maintenance Master Plan Doc. No. S03496-4.0—Final Page 6–12 April 2010
Water Level Monitoring Water level, both static and pumping, is perhaps the most critical parameter measured and therefore needs to be measured routinely. The drawdown from static water level to the pumping water level is used to calculate a specific capacity for the well and is a direct indication of the degree of fouling of the well screen and the adjacent formation. The installation depth of the extraction well pump/motor assemblies has been established, based upon an anticipated worst-case drawdown of 10 ft below the seasonal low static water levels. Historical data were reviewed to determine seasonal lows. While each setting has some added submergence to be conservative, pumping levels are monitored routinely to ensure that adequate pump/motor submergence is maintained and to prevent severe component damage. If the pumping water level measured during the quarterly performance testing approaches the top of the pump’s bowl assembly, rehabilitation efforts may be necessary. Rehabilitation efforts include cleaning of the well using dual swab and airlift pumping to remove debris. After cleaning, the well will be acid-treated to break down encrustation on the well screen and within the local formation. This will then be followed by chlorination to inhibit future iron-fouling bacterial growth. These processes may, if necessary, be repeated several times to ensure that the well has been rehabilitated to its optimal condition. Flow Monitoring The ability of an extraction well pump/motor to sustain the desired flow is a key indicator of the health of the flow meter, controls, VFD, well, and pump/motor assembly. Specific testing to determine the ability of a pump/motor assembly to perform as expected will be completed quarterly. Additionally, individual extraction well flow is monitored continuously by the flow controller for each well. The actual flow verses the controller set point is checked by operations personnel from the HMI at the CAWWT at least once per day. Any significant deviation from the flow set point is investigated, and required maintenance actions are determined and carried out. Discharge Pressure Monitoring Pump discharge pressure, coupled with flow, is monitored quarterly to assess the pump/motor assemblies’ performance against the manufacturers published performance. Amperage As with flow and pressure, amperage is a good indicator of how the pump/motor assembly is performing. During performance testing, motor amperage draw is measured on each of the three phases of the electrical supply. Amperage draw is compared to the motor manufacturer’s published specifications. Amperage should be below the manufacturer’s full-load amperage and should be approximately equal across the phases of the motor. An imbalance of greater than 20 percent across the phases indicates a motor or electrical supply situation that triggers more extensive diagnosis. Additional diagnostics and repairs are not within the scope of this plan.

U.S. Department of Energy Comprehensive Legacy Management and Institutional Controls Plan Doc. No. S03496-4.0—Final Attachment A—Operations and Maintenance Master Plan April 2010 Page 6–13
Performance Testing Performance testing of the extraction wells is generally conducted quarterly to assess their condition; this testing requires an outage of approximately 4 hours per well. Static water-level measurements are made prior to each performance test. This measurement serves as the basis for computing drawdown within the extraction well. System flow, discharge pressure, pumping level, and motor amperage per phase are measured at each of three to five different flows for the extraction well. These flows include maximum flow (discharge valve fully open) and zero flow conditions (discharge valve closed). The results of these measurements are used to determine the condition of the pump/motor and of the well. Results are summarized in two ways. First, the flow and discharge head is plotted and compared to the pump manufacturer’s published information and to previously developed head/flow curves. Second, the static water level and pumping levels are used to calculate drawdown and specific capacity within the extraction well at various flows. As plugging of the well screen due to iron fouling and encrustation progresses, drawdown within the well increases for a given flow rate. If the drawdown becomes excessive, well rehabilitation efforts will likely be required. The static water level and pumping levels are used to calculate drawdown and specific capacity (flow rate divided by drawdown) within the recovery/extraction well at various flows. As fouling and encrustation of the well progresses, drawdown within the well increases for a given flow rate (the specific capacity decreases). The need for well screen maintenance activities is triggered by excessive drawdown. Maintenance work will be planned, scheduled, and performed to avoid costly damage to equipment such as well pump/motor assembly and to avoid lengthy outages. Additionally, the amperage draw of the well at various flows is compared to previous readings and pump/motor manufacturers’ published information. 6.3 Treatment Facilities Performance Monitoring and Maintenance This section describes the key performance monitoring parameters and maintenance needs for the wastewater treatment systems and their ancillary facilities. Based on past performance, meeting the Fernald Preserve effluent discharge uranium limit of 30 ppb on a monthly average basis is routinely achievable. 6.3.1 Treatment Facilities Performance Monitoring
The CAWWT uses strong base-anion exchange as the final unit process for uranium removal. The strong base-anion exchange resins have a strong affinity for the uranyl carbonates in the Fernald Preserve’s wastewater. The technology is reliable; however, treatment to the effluent levels required at the Fernald Preserve (i.e., <30 ppb) is not widely practiced in wastewater systems. An expected performance of the CAWWT system has been used in this plan to demonstrate the ability to meet the ROD effluent requirements. The performance expectations are, for the most part, based on historical Fernald Site operating experience, using new resin, as opposed to vendor performance guarantees or widely published data. Measurable parameters for the CAWWT system are the total volume of water treated, the influent and effluent uranium concentrations and mass, and the total mass of uranium removed

Comprehensive Legacy Management and Institutional Controls Plan U.S. Department of Energy Attachment A—Operations and Maintenance Master Plan Doc. No. S03496-4.0—Final Page 6–14 April 2010
by treatment. The Fernald Preserve total effluent flow rate is metered. Flow-weighted composite samples of the effluent are analyzed daily for total uranium. Those two parameters are used to measure compliance with the OU5 ROD requirements for uranium discharge in the Fernald Preserve’s effluent. Additionally, each CAWWT treatment train has flow measurement and control. The individual treatment systems are also routinely sampled at strategic process locations, including the inlet and outlet of each ion exchange vessel. The sample results and treatment flow rates are reported, tracked, and used to determine the need for troubleshooting, process adjustments, and corrective actions. All of the routine uranium analytical work is conducted in a laboratory located within the CAWWT, Building 51A. 6.3.2 Treatment Facilities Maintenance Practices
Because the treatment systems have spare equipment installed along with bypass piping and valving, most of the routine preventive maintenance and repair work in the systems can be accomplished without a unit shutdown. Some planned maintenance activities will result in treatment system outages. The OU5 ROD provides for relief allowances from the effluent discharge limit of a monthly average of 30 ppb uranium concentration during periods of treatment plant scheduled maintenance. Decisions regarding well operations during treatment plant scheduled maintenance will be made on a case-by-case basis. For planned maintenance shutdowns, advance EPA approval will be obtained for relief allowances that may be requested. Some breakdowns will lead to system shutdowns. Loss of utilities or a failure in the CAWWT’s computerized control system would result in a system shutdown. All treatment systems will fail safely on loss of a utility or a major component and are not complicated to restart. 6.4 Regulatory Issues Current extraction well rehabilitation screen- and pump-cleaning efforts require the use of a blend of glycolic and hydrochloric acids (e.g., Cotey Chemicals Liquid Acid Descaler). The hydrochloric acid is used to break down flow-limiting mineral encrustation on the well screen/pump, and the glycolic acid removes fouling caused by bacterial growth. The spent hydrochloric-glycolic acid blend is purged from the well by pumping to a portable tank. The tank is emptied into the CAWWT backwash basin for subsequent treatment at the CAWWT and discharge to the Great Miami River via the Parshall Flume. The use of these acids in well rehabilitation and well and pump cleaning to date has been monitored closely. OEPA has been notified and has approved of the intended chemical additions and subsequent discharges. After the addition of these chemicals, the water pumped initially from the extraction well is turbid, contains iron residual and dissolved scale, and has a low pH. Dilution of this stream in the CAWWT backwash basin is adequate to prevent turbidity and low pH from exceeding NPDES outfall limits.
U.S. Department of Energy Comprehensive Legacy Management and Institutional Controls Plan Doc. No. S03496-4.0—Final Attachment A—Operations and Maintenance Master Plan April 2010 Page 7–1
7.0 Organizational Roles, Responsibilities, and Communications
This section presents the organizational roles and responsibilities with respect to implementation of this OMMP. Also presented are information needs and communications protocol for coordination with other Fernald Preserve project organizations, and interaction with EPA and OEPA. 7.1 Organization Roles and Responsibilities 7.1.1 DOE Office of Legacy Management Fernald
DOE is responsible for providing direction and oversight of all activities at the Fernald Preserve. 7.1.2 Operating Contractor
S.M. Stoller is the Legacy Management Support contractor for the Fernald Preserve. The OMMP falls under the responsibility of the site’s ARWWT project. The ARWWT project is responsible for all engineering, design, and construction activities for the OMMP, which include:
• Engineering functional requirements, design basis, and detailed design drawings and documents.
• Title III engineering support during construction.
• Start-up plans, system operability test procedures, and test supervision.
• Standard start-up review plans and coordinating resolution of operational issues.
• Technical support of well field and water treatment operations.
• Coordination of project-specific activities associated with procurement and management of construction contractors.
The ARWWT project is also responsible for all aquifer restoration planning and defining groundwater monitoring/reporting activities within the project, which include:
• Developing and maintaining the aquifer restoration strategy.
• Defining groundwater remedy performance monitoring requirements.
• Completing groundwater data evaluation and reporting.
• Providing technical input on recovery well operation and maintenance.
• Providing technical input to operations regarding compliance with discharge limits.
• Providing technical input to design and construction of site groundwater extraction systems.
• Preparing required CERCLA documentation (e.g., RA Work Plan, aquifer remedy design documents, the IEMP groundwater section, and various other required reports).

Comprehensive Legacy Management and Institutional Controls Plan U.S. Department of Energy Attachment A—Operations and Maintenance Master Plan Doc. No. S03496-4.0—Final Page 7–2 April 2010
The ARWWT team is also responsible for all operations and maintenance activities within the project, which include:
• Operation of groundwater extraction well systems.
• Operation of all site wastewater conveyance and treatment systems and their ancillary facilities.
• Estimating, planning, and executing corrective and preventive maintenance.
• Training and qualification of operators and supervisors.
• Developing, reviewing, and revising standard operating procedures.
• Sampling of process streams for compliance with operational parameters and established regulatory limits.
Site Environmental Monitoring/Data Management and Reporting personnel are responsible for:
• Collection of groundwater monitoring samples and aquifer water level data.
• Coordination of sample analysis, data management, and preparation of the annual Site Environmental Report.
• Analysis of wastewater treatment operations process control samples. Site Environmental Compliance personnel are responsible for:
• Fulfilling site NPDES reporting requirements.
• Analysis of state and federal regulations to identify project-specific regulatory requirements.
The site Health and Safety team, in conjunction with S.M. Stoller corporate Health and Safety personnel, are responsible for the following Health and Safety activities within the project:
• Development and revision of Health and Safety project matrices for operations, maintenance, and construction.
• Radiological monitoring of activities.
• Industrial health monitoring of activities.
• Oversight of construction and operations safety programs.
• Safety design reviews and technical input. Individual project team members are responsible for the safe execution of the work assigned to them and have the right to stop work if unsafe conditions are observed.

U.S. Department of Energy Comprehensive Legacy Management and Institutional Controls Plan Doc. No. S03496-4.0—Final Attachment A—Operations and Maintenance Master Plan April 2010 Page 7–3
The S.M. Stoller Project Controls and Finance personnel, in conjunction with the ARWWT project manager, are responsible for:
• Project cost and schedule baseline development and maintenance.
• Cost performance and variance reporting.
• Estimate at completion funding analysis and reporting.
• Change proposal and cost-savings coordination.
• Project quality assurance oversight.
7.2 Regulatory Agency Interaction As noted in Sections 1.0 and 3.0, Attachment D (the IEMP) provides for the collection and reporting of groundwater remedy performance (Section 3.0) and treated effluent (Section 4.0) information that supports operational decisions regarding groundwater restoration and water treatment. The current plan is that well field and treatment operational summaries are included in the annual Site Environmental Report. These summaries allow for agency input as ARWWT progress. In addition, the NPDES reporting will continue as outlined in Section 4.0 of Attachment D. The ARWWT participation in meetings and conference calls will continue as necessary.

Comprehensive Legacy Management and Institutional Controls Plan U.S. Department of Energy Attachment A—Operations and Maintenance Master Plan Doc. No. S03496-4.0—Final Page 7–4 April 2010
This page intentionally left blank

U.S. Department of Energy Comprehensive Legacy Management and Institutional Controls Plan Doc. No. S03496-4.0—Final Attachment A—Operations and Maintenance Master Plan April 2010 Page 8–1
8.0 References
DOE Order 5480.19 Change 2, Conduct of Operations Standards, October 23, 2001. DOE (U.S. Department of Energy), 1995a. Feasibility Study Report for OU5, Final, Fernald Environmental Management Project, Cincinnati, Ohio, June. DOE (U.S. Department of Energy), 1995b. Remedial Investigation Report for OU5, Final, Fernald Environmental Management Project, Cincinnati, Ohio, March. DOE (U.S. Department of Energy), 1996a. Remedial Design Work Plan for Remedial Actions at OU5, Final, Fernald Environmental Management Project, Cincinnati, Ohio, August. DOE (U.S. Department of Energy), 1996b. Record of Decision for Remedial Actions at OU5, Final, Fernald Environmental Management Project, Cincinnati, Ohio, January. DOE (U.S. Department of Energy), 1997a. Baseline Remedial Strategy Report, Remedial Design for Aquifer Restoration, 2505-RP-0003, Revision 0, Final, Fernald Environmental Management Project, Cincinnati, Ohio. DOE (U.S. Department of Energy), 1997b. Remedial Action Work Plan for Aquifer Restoration at OU5, 2505-WP-0030, Revision 0, Final, Fernald Environmental Management Project, Cincinnati, Ohio. DOE (U.S. Department of Energy), 2001a. Design for the Remediation of the Great Miami Aquifer in the Waste Storage and Plant 6 Areas, Revision A, Draft Final, Cincinnati, Ohio, April. DOE (U.S. Department of Energy), 2001b. Explanation of Significant Differences for Operable Unit 5, Final, Fernald Environmental Management Project, Fernald Area Office, Cincinnati, Ohio, October. DOE (U.S. Department of Energy), 2002. Design for Remediation of the Great Miami Aquifer South Field (Phase II) Module, 52462-RP-0001, Revision A, Draft Final, Fluor Fernald, Fernald Area Office, Cincinnati, Ohio, May. DOE (U.S. Department of Energy), 2004a. Groundwater Remedy Evaluation and Field Verification Plan, Fernald Closure Project, Cincinnati, Ohio, June. DOE (U.S. Department of Energy), 2004b. Remedial Design Fact Sheet for Operable Unit 5 Wastewater Treatment Updates, Fernald Closure Project, Cincinnati, Ohio. DOE (U.S. Department of Energy), 2005a. Storm Sewer Outfall Ditch, Revision 0, Final, Fernald Closure Project, Cincinnati, Ohio, June. DOE (U.S. Department of Energy), 2005b. Waste Storage Area (Phase II) Design Report, 52424-RP-0004, Revision A, Draft Final, Fernald Closure Project, Cincinnati, Ohio, June.

Comprehensive Legacy Management and Institutional Controls Plan U.S. Department of Energy Attachment A—Operations and Maintenance Master Plan Doc. No. S03496-4.0—Final Page 8–2 April 2010
DOE (U.S. Department of Energy), 2006a. Fernald Groundwater Certification Plan, 51900-PL-0002, Revision 1, Fernald Closure Project, Cincinnati, Ohio, April. DOE (U.S. Department of Energy), 2006b. Legacy Management Fernald Operating Procedures, Revision 0, Office of Legacy Management, Grand Junction, Colorado. EPA (U.S. Environmental Protection Agency), 1986. Federal Facilities Compliance Agreement, Federal Facilities Restoration and Reuse Office. Fluor Fernald Inc., 2003. Comprehensive Groundwater Strategy Report, Final, Revision 0, Fernald Closure Project, U.S. Department of Energy Fernald Area Office, Cincinnati, Ohio, June. LMS/POL/S04374, Conduct of Operations Manual, continually updated. Prepared by S.M. Stoller Corporation for the U.S. Department of Energy Office of Legacy Management, Grand Junction, Colorado. O.A.C. 3745-27, “Ohio Solid Waste and Infectious Waste Regulations,” Ohio Administrative Code, November 1, 2007.