at&t website solutions€¦ · · 2016-07-01we are focused on providing you the very best web...
TRANSCRIPT

1
Welcome to AT&T Website SolutionsSM. We are focused on providing you the very best web products and services including all the tools necessary to establish and maintain a successful website. Analytics allows you to optimize the online presence for your website. Using the Analytics application, you can view your website statistics, manage account information, print reports, and specify how the application should gather information.
.
© 2015 AT&T Intellectual Property. All rights reserved. AT&T and the AT&T logo are trademarks of AT&T Intellectual Property. All other trademarks are the property of their owners. This document is not an offer, commitment, representation or warranty by AT&T and is subject to change. Your Web Hosting service is subject to the Terms and Conditions (T&Cs), which may be found at http://webhosting.att.com/Terms-Conditions.aspx. Service terms and Fees are subject to change without notice. Please read the T&Cs for additional information.
Version 1.0
AT&T Website SolutionsSM Website Analytics
2
Contents
1 WELCOME ...................................................................................................................................................... 4
2 LOCATE YOUR ADVANCED TOOLS AND APPLICATIONS ................................................................................... 4
3 INTRODUCTION TO ANALYTICS ...................................................................................................................... 5
3.1 GETTING STARTED .............................................................................................................................................. 6 3.2 STATISTICS ......................................................................................................................................................... 8 3.3 WEBSITE USAGE ................................................................................................................................................. 9
3.3.1 Visits per page........................................................................................................................................ 9 3.4 DOWNLOADS ................................................................................................................................................... 12 3.5 EVENTS ........................................................................................................................................................... 12 3.6 DURATION PER PAGE ......................................................................................................................................... 13 3.7 DURATION PER PI ............................................................................................................................................. 16 3.8 EXIT PAGES ...................................................................................................................................................... 22 3.9 VISITOR ENGAGEMENT ...................................................................................................................................... 24 3.10 VIEWING THE VISITOR ENGAGEMENT ANALYSIS ...................................................................................................... 25 3.11 CONFIGURING THE ANALYSIS DETAILS ................................................................................................................... 26
3.11.1 Visitors ................................................................................................................................................. 27 3.11.2 Page impression ................................................................................................................................... 27 3.11.3 Visit Overview ...................................................................................................................................... 29
3.12 UNIQUE VISITORS .............................................................................................................................................. 30 3.13 BOUNCE VISITS ................................................................................................................................................. 32 3.14 VISITOR DETAILS ............................................................................................................................................... 34 3.15 RETURNING VISITORS ......................................................................................................................................... 34 3.16 PIS TO AVERAGE ............................................................................................................................................... 36 3.17 VISITS TO AVERAGE ........................................................................................................................................... 37
3.17.1 Origin ................................................................................................................................................... 38 3.17.2 Referrers .............................................................................................................................................. 38
3.18 SEARCH ENGINES .............................................................................................................................................. 40 3.18.1 Search Words ....................................................................................................................................... 42 3.18.2 Geo-Overlay ......................................................................................................................................... 44 3.18.3 Visits by country ................................................................................................................................... 45 3.18.4 Visits by region ..................................................................................................................................... 47 3.18.5 Visits by city ......................................................................................................................................... 47 3.18.6 Visits by domain ................................................................................................................................... 47 3.18.7 Top Providers ....................................................................................................................................... 48 3.18.8 Technology ........................................................................................................................................... 49 3.18.9 Browsers .............................................................................................................................................. 49 3.18.10 Screen resolutions ............................................................................................................................ 51 3.18.11 Connection speeds ........................................................................................................................... 52 3.18.12 Flash ................................................................................................................................................. 53 3.18.13 JavaScript ......................................................................................................................................... 54 3.18.14 Plugins .............................................................................................................................................. 55 3.18.15 Colors/color depth ........................................................................................................................... 56 3.18.16 Java .................................................................................................................................................. 57
3.19 MOBILE .......................................................................................................................................................... 58
3
3.19.1 Mobile Visitors ..................................................................................................................................... 58 3.19.2 Mobile Operating Systems ................................................................................................................... 60 3.19.3 Mobile Devices ..................................................................................................................................... 61
3.20 E-COMMERCE .................................................................................................................................................. 61 3.20.1 Products ............................................................................................................................................... 61 3.20.2 Sales ..................................................................................................................................................... 61 3.20.3 Orders .................................................................................................................................................. 63
3.21 MANAGEMENT ................................................................................................................................................. 64 3.21.1 Management overview ........................................................................................................................ 64 3.21.2 Dashboard ............................................................................................................................................ 64 3.21.3 Configuring the Dashboard Display ..................................................................................................... 65 3.21.4 KPI’s ..................................................................................................................................................... 67
3.22 CAMPAIGNS ..................................................................................................................................................... 67 3.22.1 Campaigns overview ............................................................................................................................ 67 3.22.2 Top Campaigns .................................................................................................................................... 68 3.22.3 Top Milestones ..................................................................................................................................... 68 3.22.4 Sales per Campaign.............................................................................................................................. 68
3.23 REPORT OVERVIEW ........................................................................................................................................... 70 3.23.1 Create new reports .............................................................................................................................. 70 3.23.2 Advanced ............................................................................................................................................. 70
4 WHERE TO FIND HELP/INSTRUCTIONS ......................................................................................................... 72
4.1 HOW TO CONTACT SUPPORT BY EMAIL .................................................................................................................. 72 4.2 HOW TO CONTACT SUPPORT IN YOUR CONTROL PANEL / ONLINE PRESENCE PORTAL ..................................................... 72 4.3 HOW TO CONTACT SUPPORT BY PHONE ................................................................................................................ 72

4
1 Welcome
The control panel, your Online Presence Portal is an intuitive interface, which connects you to the complete suite of business applications and services available with Website Solutions based on your plan— giving you the ability to manage your online presence.
Using the applications and services contained in the portal, you can build websites, with the new Online Presence Builder, based on your plan, operate an online store, manage security, write blogs, create photo albums and chat systems.
2 Locate your Advanced Tools and Applications
Once you log into your Online Presence Portal (control panel) you will find your name in the upper right corner of the blue task bar. When you place your mouse on the blue down arrow, a menu will open; select the Advanced Tools to open a new window with the list of all Advanced Tools that are available with your specific plan.
Edition Issue
5
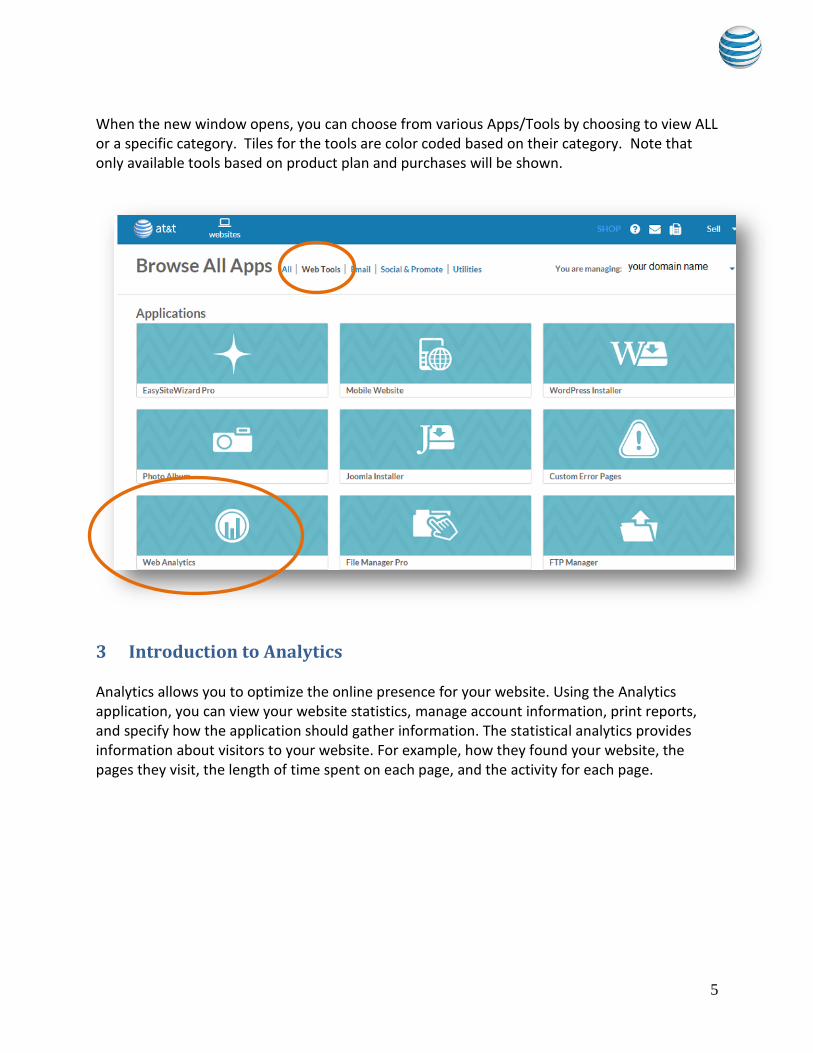
When the new window opens, you can choose from various Apps/Tools by choosing to view ALL or a specific category. Tiles for the tools are color coded based on their category. Note that only available tools based on product plan and purchases will be shown.
3 Introduction to Analytics Analytics allows you to optimize the online presence for your website. Using the Analytics application, you can view your website statistics, manage account information, print reports, and specify how the application should gather information. The statistical analytics provides information about visitors to your website. For example, how they found your website, the pages they visit, the length of time spent on each page, and the activity for each page.

6
3.1 Getting Started The Analytics application is available as part of the WebsiteOS Statistics tool-set. To launch Analytics 1.0:
1. In the WebsiteOS dialog, click Statistics. 2. In the Statistics dialog, click Analytics.
The Welcome Analytics page is displayed.

7
3. Click Start. The Analytics Main Menu page opens in a new window.
o Main Menu
The Main Menu consists of the following sections:
Statistics
Management
Advanced
8
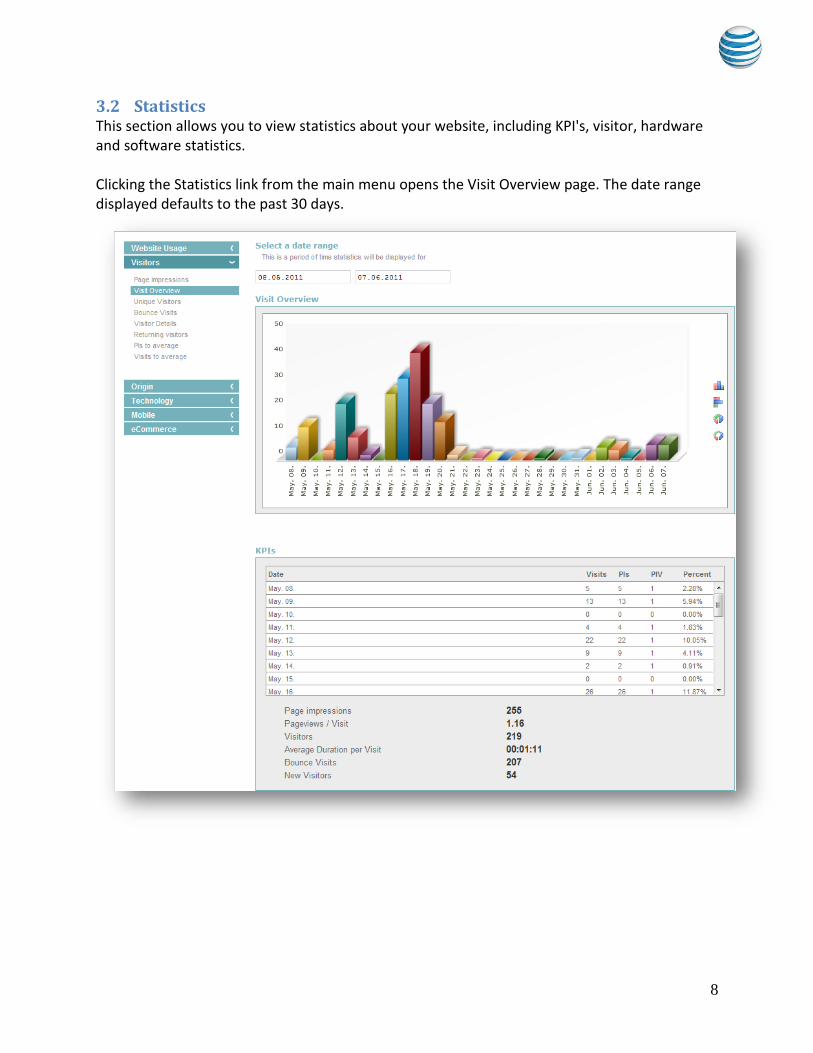
3.2 Statistics This section allows you to view statistics about your website, including KPI's, visitor, hardware and software statistics. Clicking the Statistics link from the main menu opens the Visit Overview page. The date range displayed defaults to the past 30 days.
9
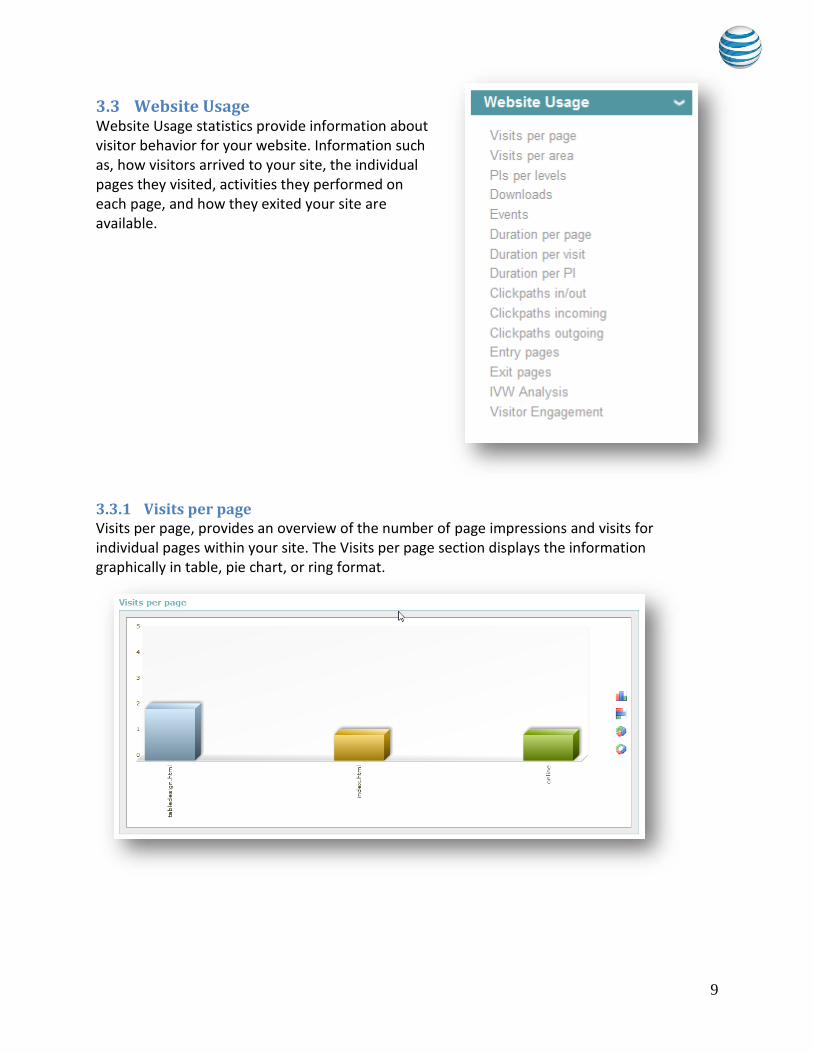
3.3 Website Usage Website Usage statistics provide information about visitor behavior for your website. Information such as, how visitors arrived to your site, the individual pages they visited, activities they performed on each page, and how they exited your site are available.
3.3.1 Visits per page Visits per page, provides an overview of the number of page impressions and visits for individual pages within your site. The Visits per page section displays the information graphically in table, pie chart, or ring format.
10
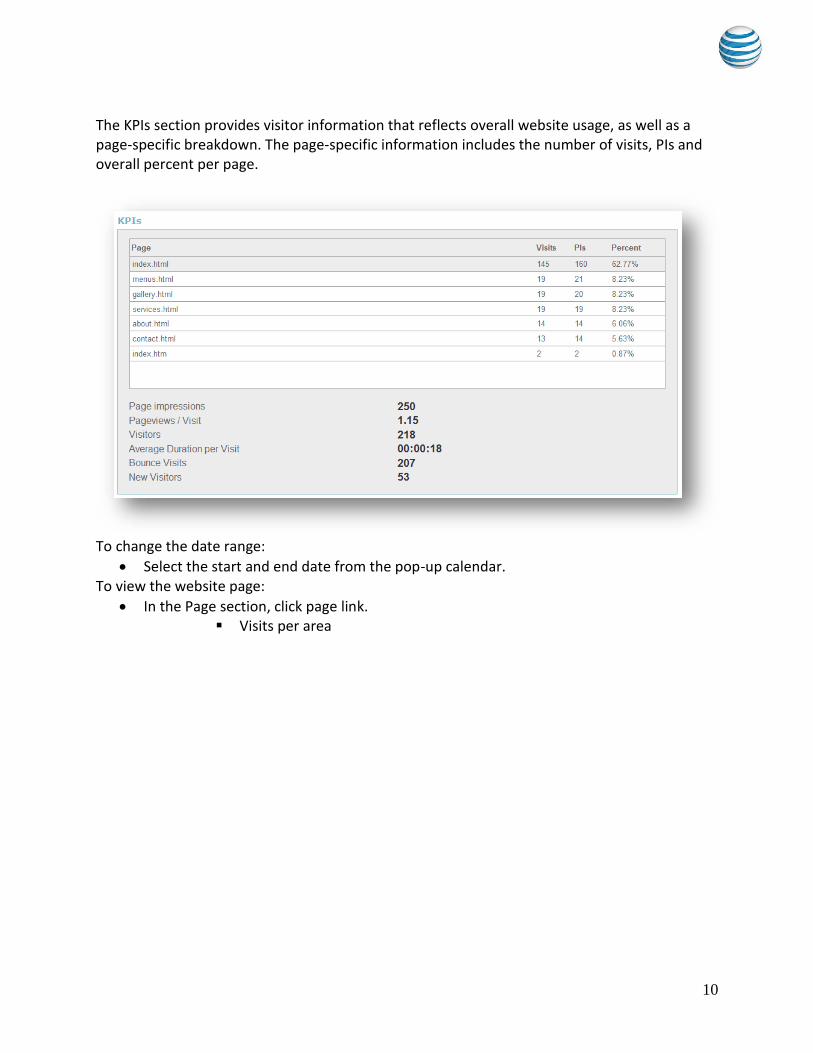
The KPIs section provides visitor information that reflects overall website usage, as well as a page-specific breakdown. The page-specific information includes the number of visits, PIs and overall percent per page.
To change the date range:
Select the start and end date from the pop-up calendar. To view the website page:
In the Page section, click page link. Visits per area

11
This page provides an overview of the number of page impressions and visits for specific areas of an individual page. The Visits per area section displays the information graphically in table, pie chart, or ring format.
The KPIs section provides visitor information that reflects overall website usage, as well as an area-specific breakdown. The area-specific information includes the number of visits, PIs and overall percent per page. To change the date range:
Select the start and end date from the pop-up calendar. To view the website page:
In the Area section, click page link. PIs per levels
12
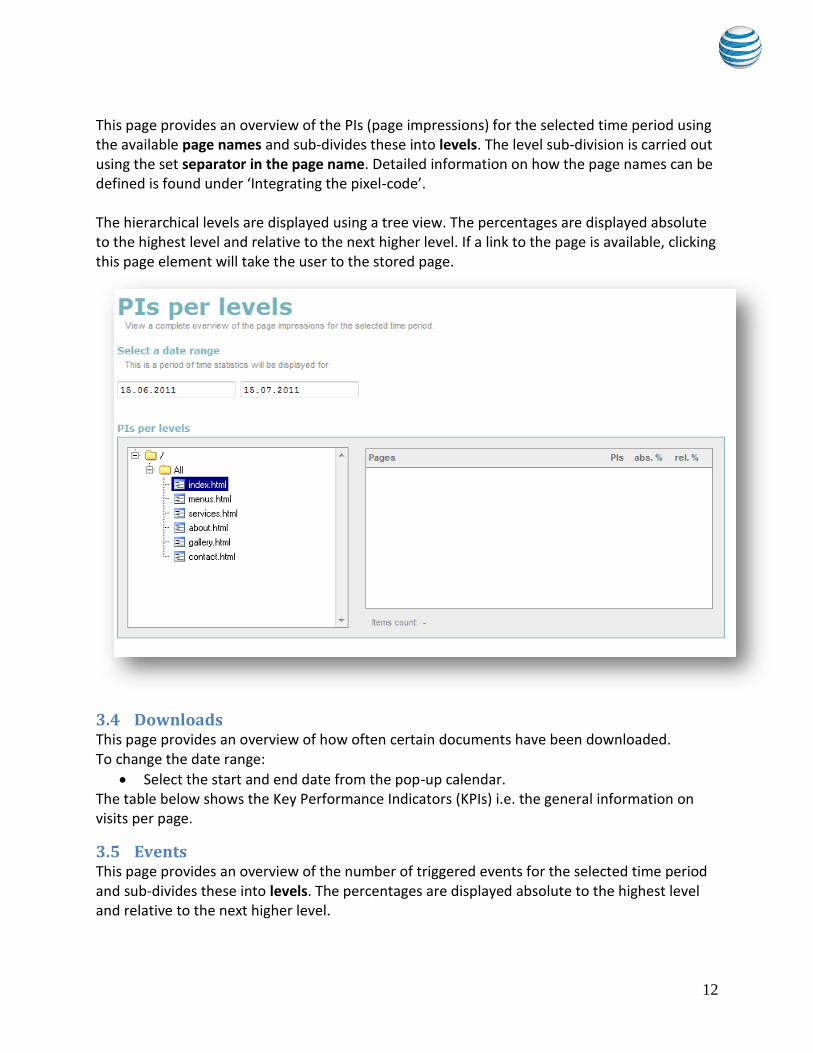
This page provides an overview of the PIs (page impressions) for the selected time period using the available page names and sub-divides these into levels. The level sub-division is carried out using the set separator in the page name. Detailed information on how the page names can be defined is found under ‘Integrating the pixel-code’. The hierarchical levels are displayed using a tree view. The percentages are displayed absolute to the highest level and relative to the next higher level. If a link to the page is available, clicking this page element will take the user to the stored page.
3.4 Downloads This page provides an overview of how often certain documents have been downloaded. To change the date range:
Select the start and end date from the pop-up calendar. The table below shows the Key Performance Indicators (KPIs) i.e. the general information on visits per page.
3.5 Events This page provides an overview of the number of triggered events for the selected time period and sub-divides these into levels. The percentages are displayed absolute to the highest level and relative to the next higher level.

13
3.6 Duration per page This page provides an overview of the time spent (in minutes) on each page for the selected period. The Duration per page section graphically displays the time per page in a table, pie chart or ring format. To change how the information is displayed:
Click the chart type icon.

14
The KPIs section provides general information about visitor behaviour and detailed information about the number of visits, total time spent on each page, and the overall percent based on all pages.
To change the date range:
Select the start and end date from the pop-up calendar. To view the website page:
In the Page section, click page link. Duration per visit
This page provides an overview of the average time spent on each page per visit. The Duration per visit section graphically displays the time per visit for each page in a table, pie chart or ring format. To change how the information is displayed:
Click the chart type icon.
15
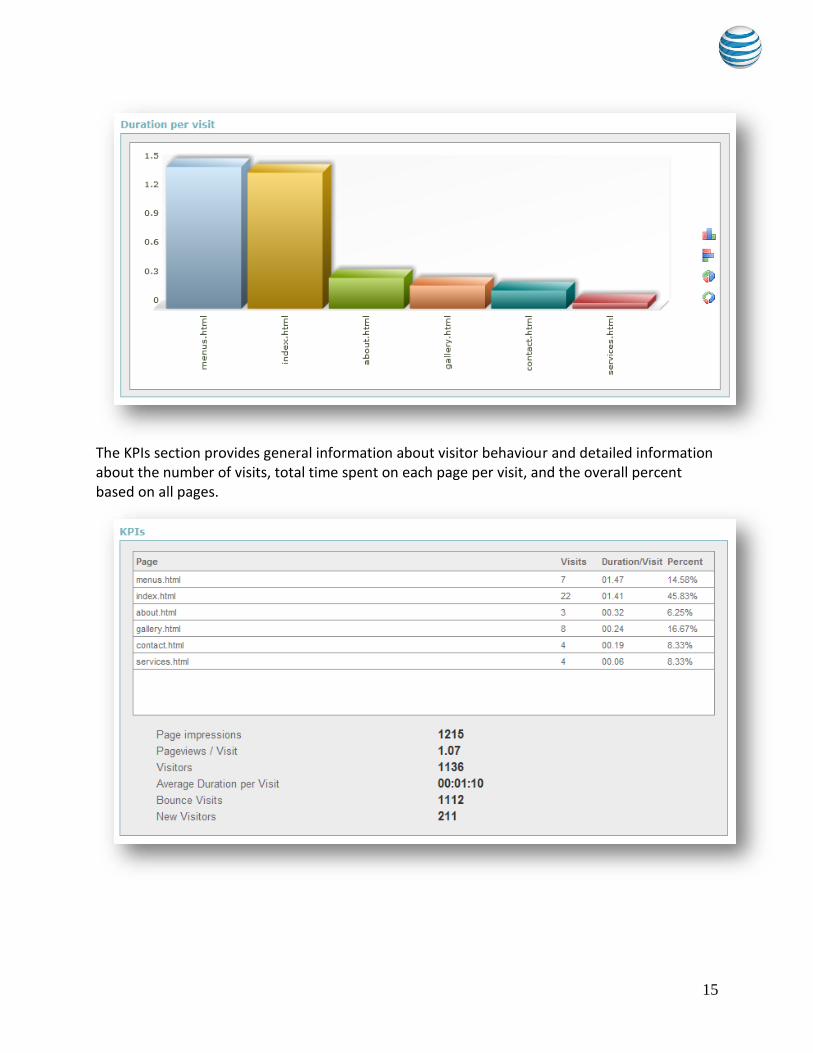
The KPIs section provides general information about visitor behaviour and detailed information about the number of visits, total time spent on each page per visit, and the overall percent based on all pages.
16
To change the date range:
Select the start and end date from the pop-up calendar. To view the website page:
In the Page section, click page link.
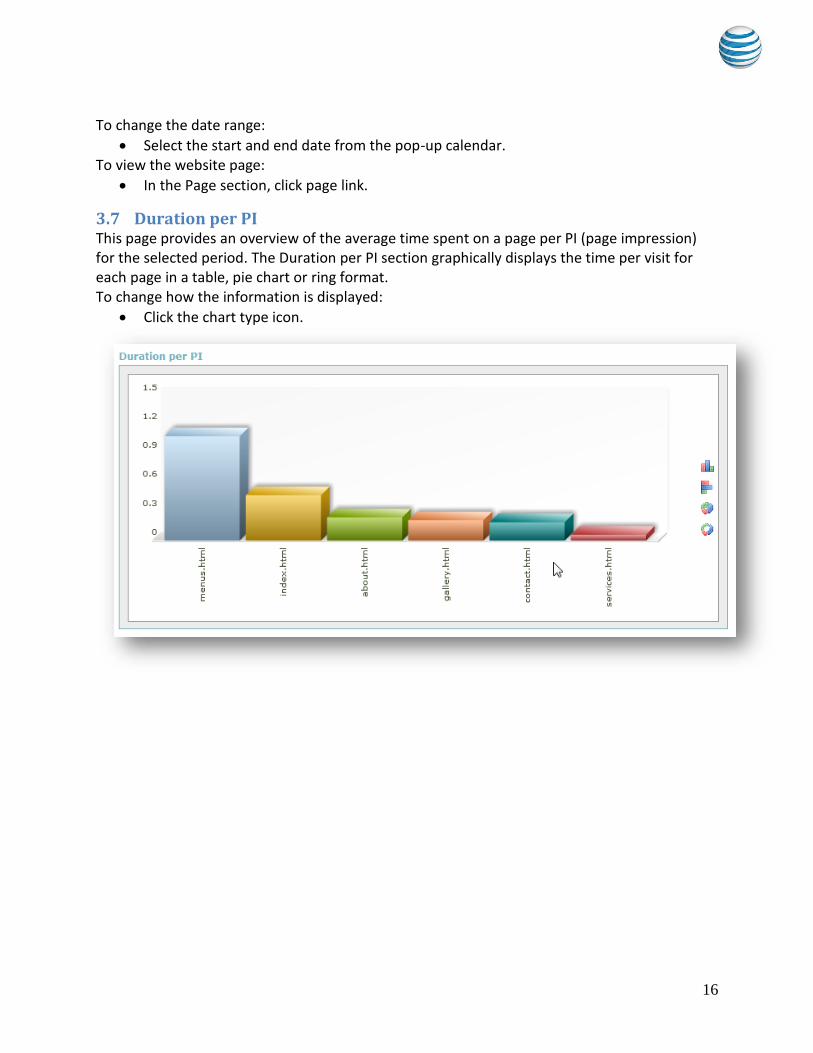
3.7 Duration per PI This page provides an overview of the average time spent on a page per PI (page impression) for the selected period. The Duration per PI section graphically displays the time per visit for each page in a table, pie chart or ring format. To change how the information is displayed:
Click the chart type icon.
17
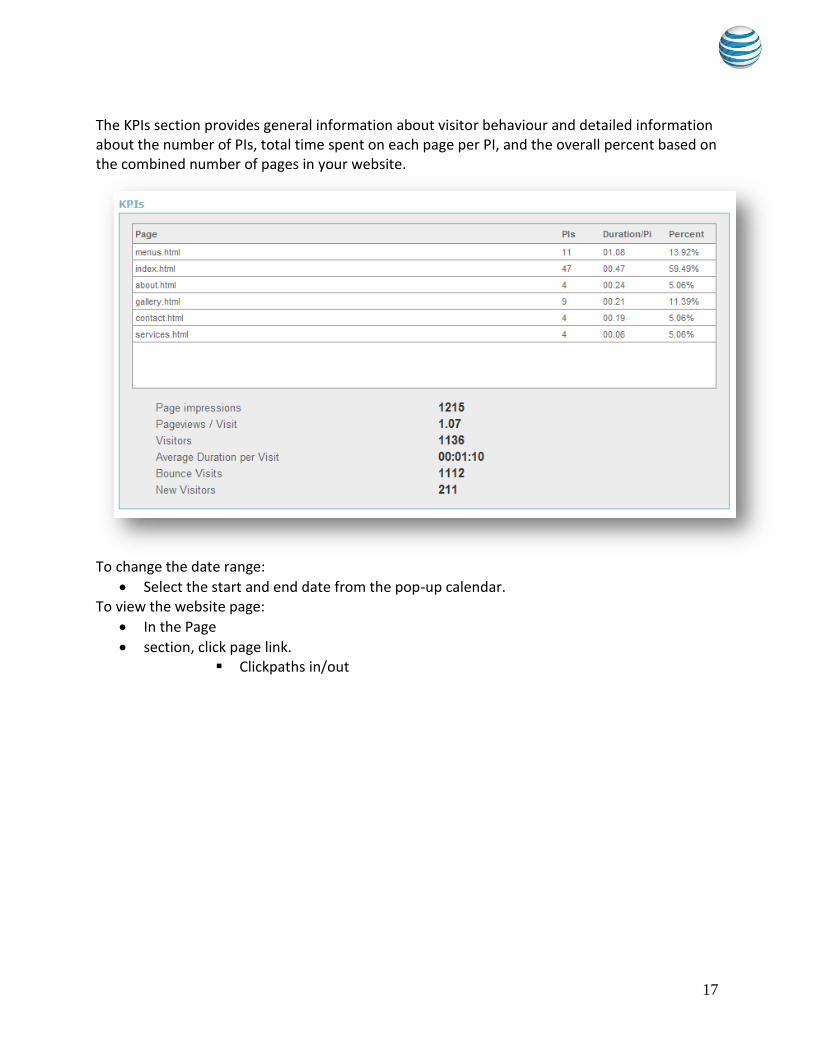
The KPIs section provides general information about visitor behaviour and detailed information about the number of PIs, total time spent on each page per PI, and the overall percent based on the combined number of pages in your website.
To change the date range:
Select the start and end date from the pop-up calendar. To view the website page:
In the Page
section, click page link. Clickpaths in/out
18
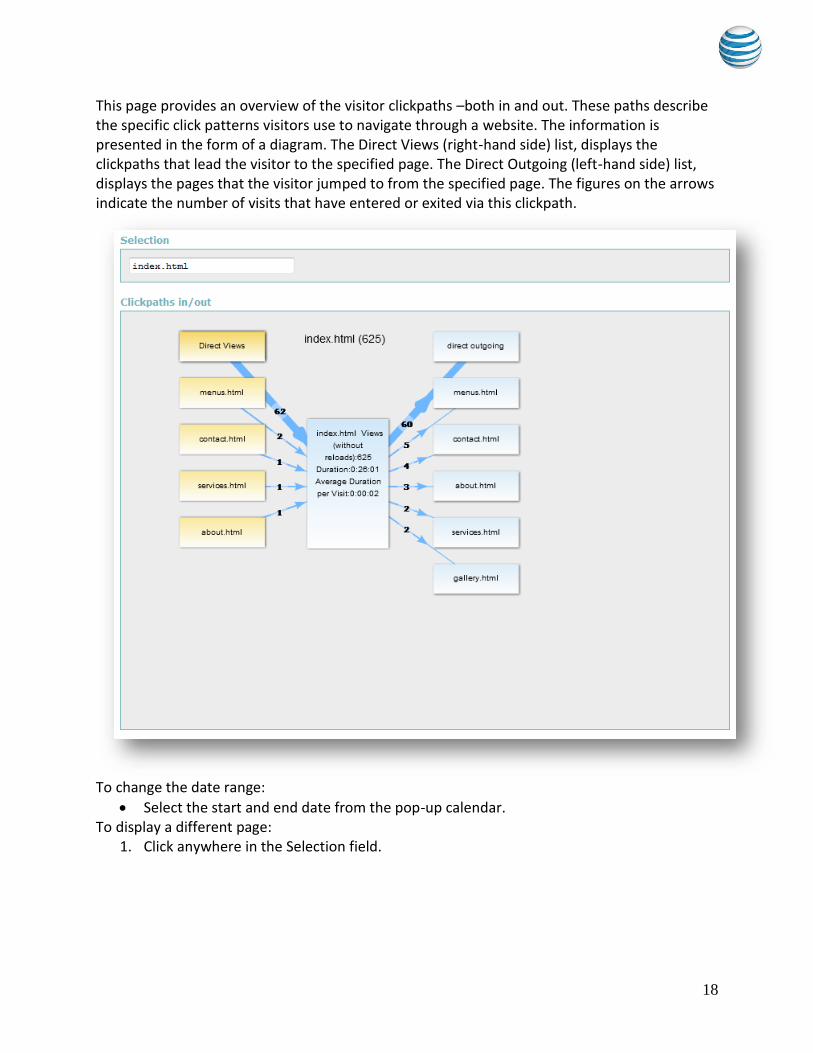
This page provides an overview of the visitor clickpaths –both in and out. These paths describe the specific click patterns visitors use to navigate through a website. The information is presented in the form of a diagram. The Direct Views (right-hand side) list, displays the clickpaths that lead the visitor to the specified page. The Direct Outgoing (left-hand side) list, displays the pages that the visitor jumped to from the specified page. The figures on the arrows indicate the number of visits that have entered or exited via this clickpath.
To change the date range:
Select the start and end date from the pop-up calendar. To display a different page:
1. Click anywhere in the Selection field.

19
2. In the pop-up dialog, click the page you want to view.
To view the visitor details for a clickpath pattern:
Click the number associated with the incoming or outgoing clickpath. Clickpaths incoming
This page provides an overview of incoming clickpaths. Incoming clickpaths provide information about how often each page is visited from another location. The Clickpaths incoming section graphically displays the time per visit for each page in a table, pie chart or ring format. To change how the information is displayed:
Click the chart type icon.

20
The KPIs section provides general information about visitor behaviour and detailed information about the number of visits per page, and the overall percent based on the combined number of pages in your website.
Clickpaths outgoing
This page provides an overview of outgoing clickpaths. These are specific click patterns the visitors use to navigate through the website before leaving. The information is presented in the form of a diagram or a table.
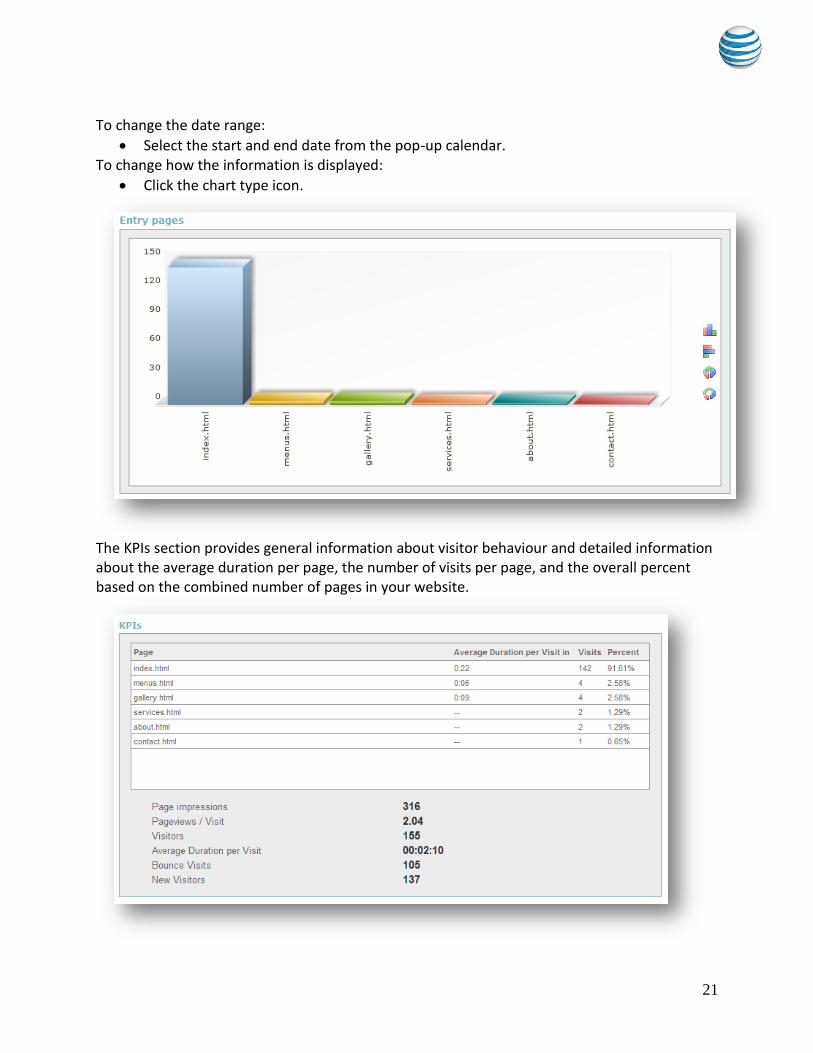
Entry pages This page provides an overview of which page a visitor used to enter the website and how long they stayed. Specifically, it shows which page, was most frequently, the first one used by visitors to the website. The entry pages section graphically displays the time per page in a table, pie chart or ring format.
21
To change the date range:
Select the start and end date from the pop-up calendar. To change how the information is displayed:
Click the chart type icon.
The KPIs section provides general information about visitor behaviour and detailed information about the average duration per page, the number of visits per page, and the overall percent based on the combined number of pages in your website.

22
3.8 Exit pages This page provides an overview of the pages a visitor used to exit the website and how long they stayed. Specifically, it shows which page, was most frequently, the last one used by visitors before they left the website. The Exit pages section graphically displays the time per page in a table, pie chart or ring format. To change the date range:
Select the start and end date from the pop-up calendar. To change how the information is displayed:
Click the chart type icon.

23
The KPIs section provides general information about visitor behaviour and detailed information about the average duration per page, the number of visits per page, and the overall percent based on the combined number of pages in your website.
IVW Analysis
These statistics provide an overview of the data passed in the ‘wm_ivw’ parameter. The time period for the overview can be selected. The information is presented in the form of a diagram or a table. To change the date range:
Select the start and end date from the pop-up calendar. The table below shows the Key Performance Indicators (KPIs) i.e. the general information on visits per page.

24
3.9 Visitor Engagement The Visitor Engagement page allows you to assign virtual values, which measure the intensity of user interaction. The Visitor Engagement Overview section displays a dialog containing two panels. The left-hand panel lists all available profiles in a tree view. You can select a profile from the left-hand panel to display the details in the right-hand panel. Within this section, you can also view the detailed analysis for an existing profile, edit existing profile criteria, or create a new profile.
To view an existing profile:
1. From the left-hand panel, highlight a profile. 2. Click the “Show” button.
The Visitor Engagement page updates with the details for that profile. To edit an existing profile:
1. From the left-hand panel, highlight a profile. 2. Click the “Edit” button.
The Visitor Engagement page updates with the profile details. 3. Edit the required fields.
For detailed configuration information, see Configuring the Analysis Details. 4. Click “Save”.
To create a new profile: 1. In the Visitor Engagement Overview section, click “New Profile”. 2. In the Visitor Engagement section. 3. Edit the required fields.
For detailed configuration information, see Configuring the Analysis Details. 4. Click “Save”.

25
3.10 Viewing the Visitor Engagement Analysis The Analysis of Visitor Engagement page displays the information specified for that particular profile. The settings defined in the profile, such as the configured weightings for particular behavior patterns of visitors, are reflected in the ‘Visitor Engagement’ column. The KPIs displayed for the analysis likewise correspond to those selected in the profile.

26
3.11 Configuring the Analysis Details Configuring profile details allows you to specify what criteria is used during analysis. The profile configuration contains general information, such as the profile name and description.
27
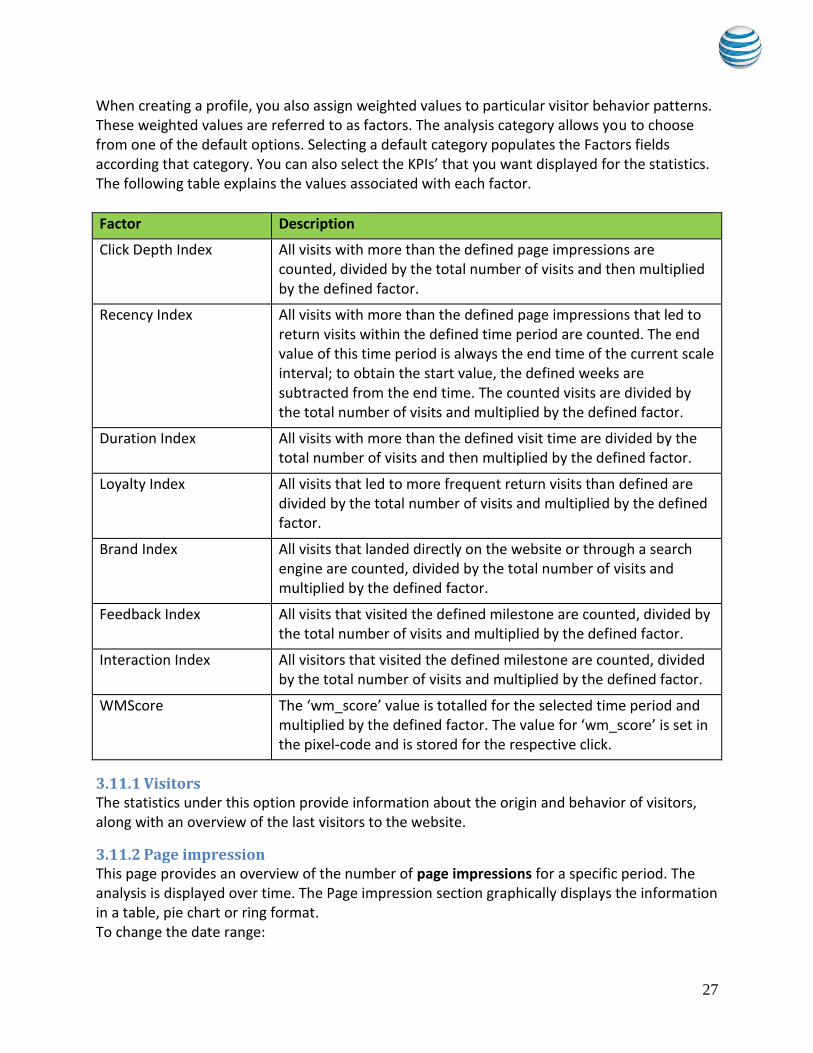
When creating a profile, you also assign weighted values to particular visitor behavior patterns. These weighted values are referred to as factors. The analysis category allows you to choose from one of the default options. Selecting a default category populates the Factors fields according that category. You can also select the KPIs’ that you want displayed for the statistics. The following table explains the values associated with each factor.
Factor Description
Click Depth Index
All visits with more than the defined page impressions are counted, divided by the total number of visits and then multiplied by the defined factor.
Recency Index
All visits with more than the defined page impressions that led to return visits within the defined time period are counted. The end value of this time period is always the end time of the current scale interval; to obtain the start value, the defined weeks are subtracted from the end time. The counted visits are divided by the total number of visits and multiplied by the defined factor.
Duration Index
All visits with more than the defined visit time are divided by the total number of visits and then multiplied by the defined factor.
Loyalty Index
All visits that led to more frequent return visits than defined are divided by the total number of visits and multiplied by the defined factor.
Brand Index
All visits that landed directly on the website or through a search engine are counted, divided by the total number of visits and multiplied by the defined factor.
Feedback Index
All visits that visited the defined milestone are counted, divided by the total number of visits and multiplied by the defined factor.
Interaction Index
All visitors that visited the defined milestone are counted, divided by the total number of visits and multiplied by the defined factor.
WMScore
The ‘wm_score’ value is totalled for the selected time period and multiplied by the defined factor. The value for ‘wm_score’ is set in the pixel-code and is stored for the respective click.
3.11.1 Visitors The statistics under this option provide information about the origin and behavior of visitors, along with an overview of the last visitors to the website.
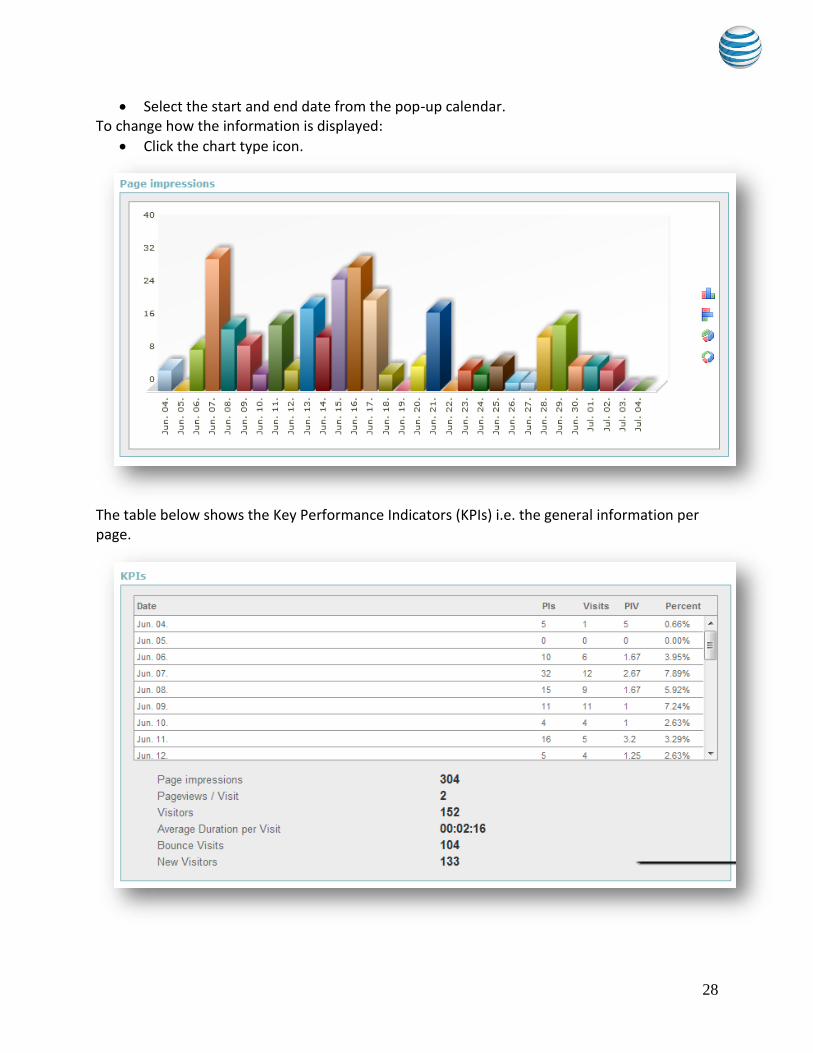
3.11.2 Page impression This page provides an overview of the number of page impressions for a specific period. The analysis is displayed over time. The Page impression section graphically displays the information in a table, pie chart or ring format. To change the date range:
28
Select the start and end date from the pop-up calendar. To change how the information is displayed:
Click the chart type icon.
The table below shows the Key Performance Indicators (KPIs) i.e. the general information per page.

29
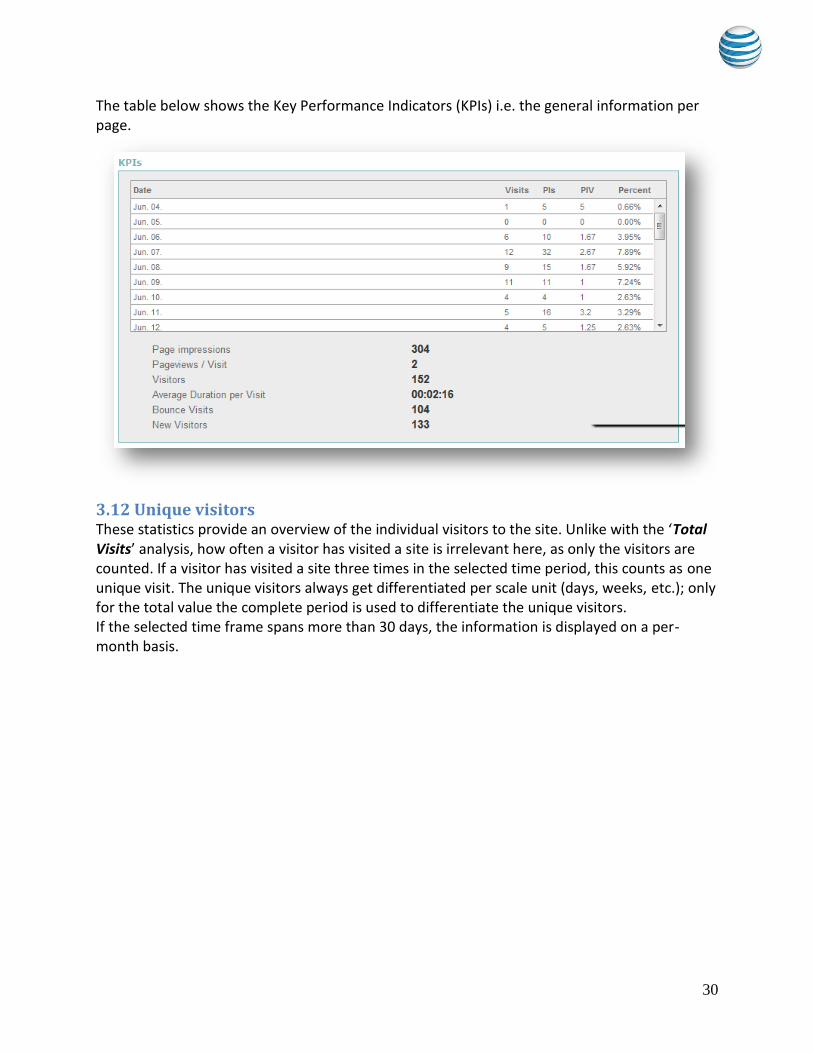
3.11.3 Visit Overview This page provides an overview of the number of visitors to the website per-day, within a specific period. If the time frame spans more than 30-day period, the results are displayed on per-month basis. The analysis is displayed over time. The Visit overview section graphically displays the information in a table, pie chart or ring format. To change the date range:
Select the start and end date from the pop-up calendar. To change how the information is displayed:
Click the chart type icon.
30
The table below shows the Key Performance Indicators (KPIs) i.e. the general information per page.
3.12 Unique visitors These statistics provide an overview of the individual visitors to the site. Unlike with the ‘Total Visits’ analysis, how often a visitor has visited a site is irrelevant here, as only the visitors are counted. If a visitor has visited a site three times in the selected time period, this counts as one unique visit. The unique visitors always get differentiated per scale unit (days, weeks, etc.); only for the total value the complete period is used to differentiate the unique visitors. If the selected time frame spans more than 30 days, the information is displayed on a per-month basis.

31
The Unique visitors section graphically displays the information in a table, pie chart or ring format. To change the date range:
Select the start and end date from the pop-up calendar. To change how the information is displayed:
Click the chart type icon.
Unique visitors are visitors who can be uniquely identified. It is therefore possible to assign several visits (sessions) to a unique visitor. Note: Unique visitors are identified via a cookie. Visitors who do not allow cookies are not included in this analysis.

32
The KPIs table displays the general information on visits per page.
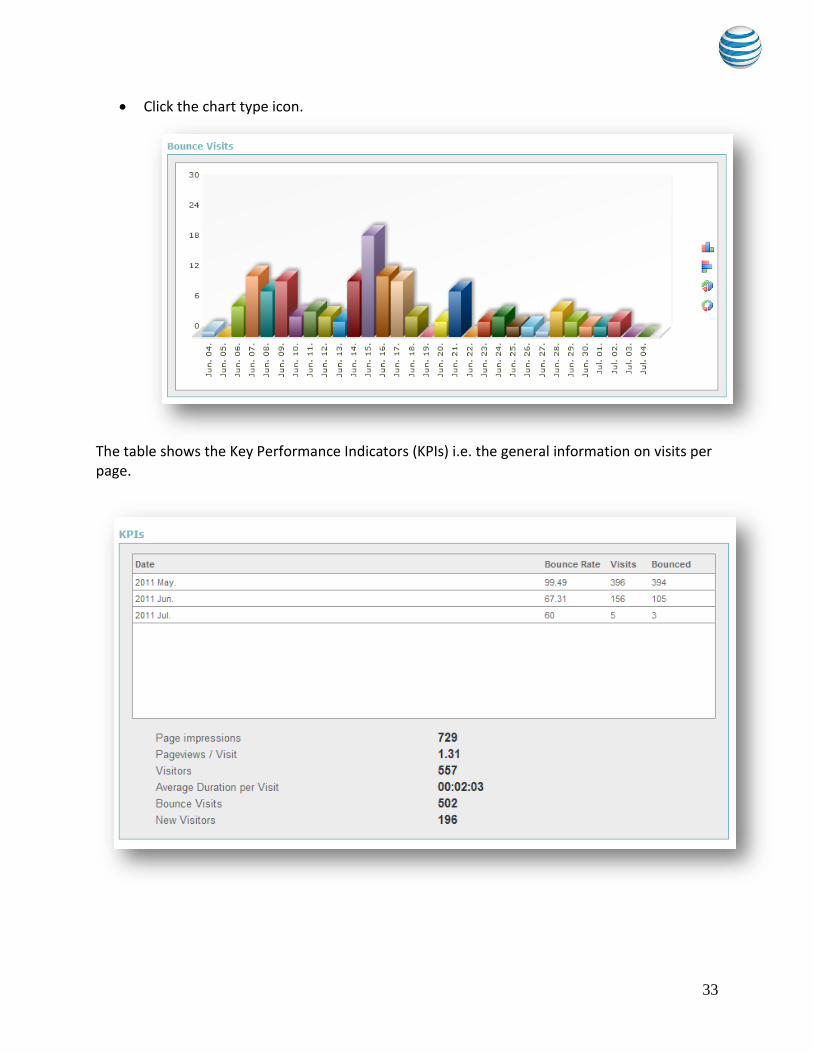
3.13 Bounce visits This page provides an overview of the number of bounced visits to the website within a specific period. The time period can be freely chosen. The Bounce visits section graphically displays the information in a table, pie chart or ring format. To change the date range:
Select the start and end date from the pop-up calendar. To change how the information is displayed:
33
Click the chart type icon.
The table shows the Key Performance Indicators (KPIs) i.e. the general information on visits per page.
34
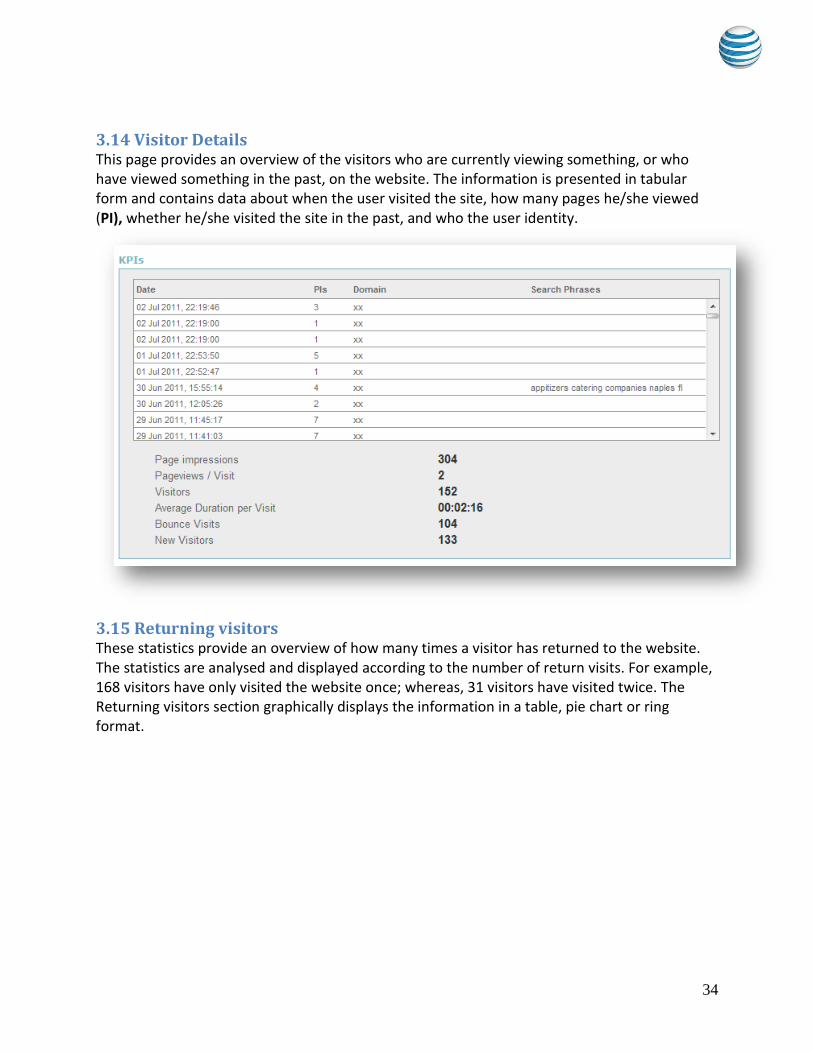
3.14 Visitor Details This page provides an overview of the visitors who are currently viewing something, or who have viewed something in the past, on the website. The information is presented in tabular form and contains data about when the user visited the site, how many pages he/she viewed (PI), whether he/she visited the site in the past, and who the user identity.
3.15 Returning visitors These statistics provide an overview of how many times a visitor has returned to the website. The statistics are analysed and displayed according to the number of return visits. For example, 168 visitors have only visited the website once; whereas, 31 visitors have visited twice. The Returning visitors section graphically displays the information in a table, pie chart or ring format.
35
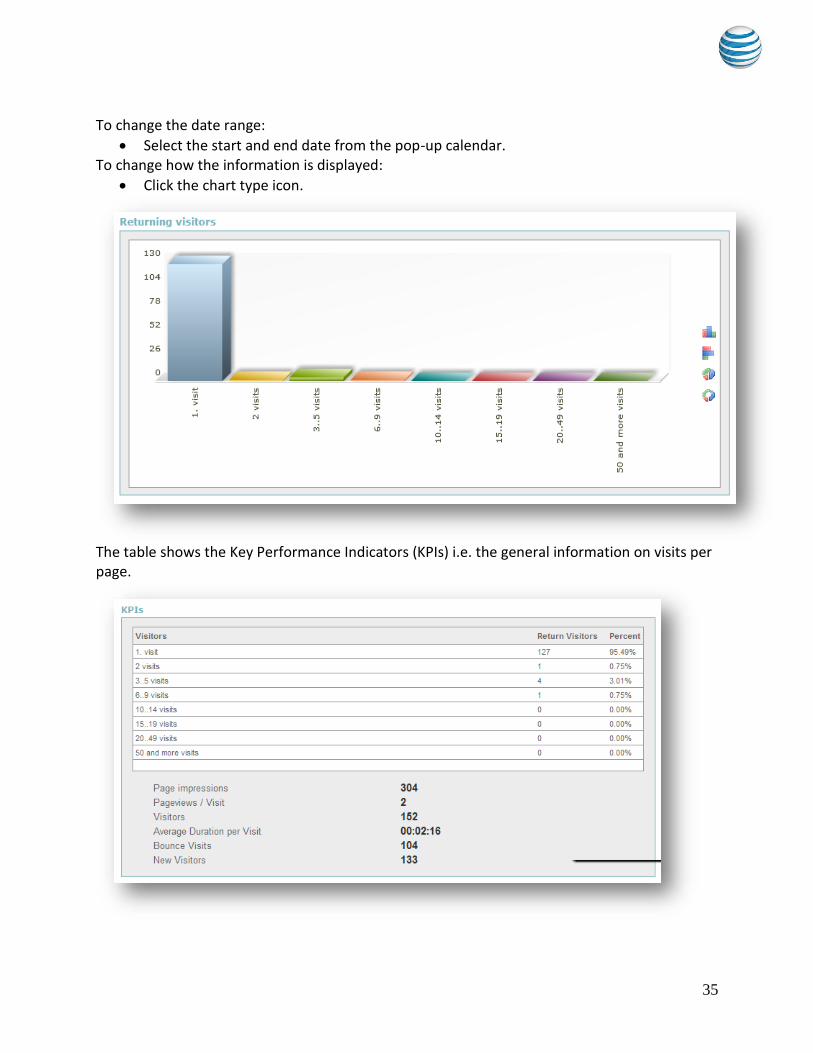
To change the date range:
Select the start and end date from the pop-up calendar. To change how the information is displayed:
Click the chart type icon.
The table shows the Key Performance Indicators (KPIs) i.e. the general information on visits per page.

36
3.16 PIs to average This page provides an overview of how the PI values compare with the average PI values. The average PI (page impressions) is calculated for the selected period and the individual values (e.g. hours or days) are compared with these. The results are expressed as percentages, with 0% representing the average. The PIs to average section graphically displays the information in a table, pie chart or ring format. To change the date range:
Select the start and end date from the pop-up calendar. To change how the information is displayed:
Click the chart type icon.
The table shows the Key Performance Indicators (KPIs) i.e. the general information on visits per
page.
37
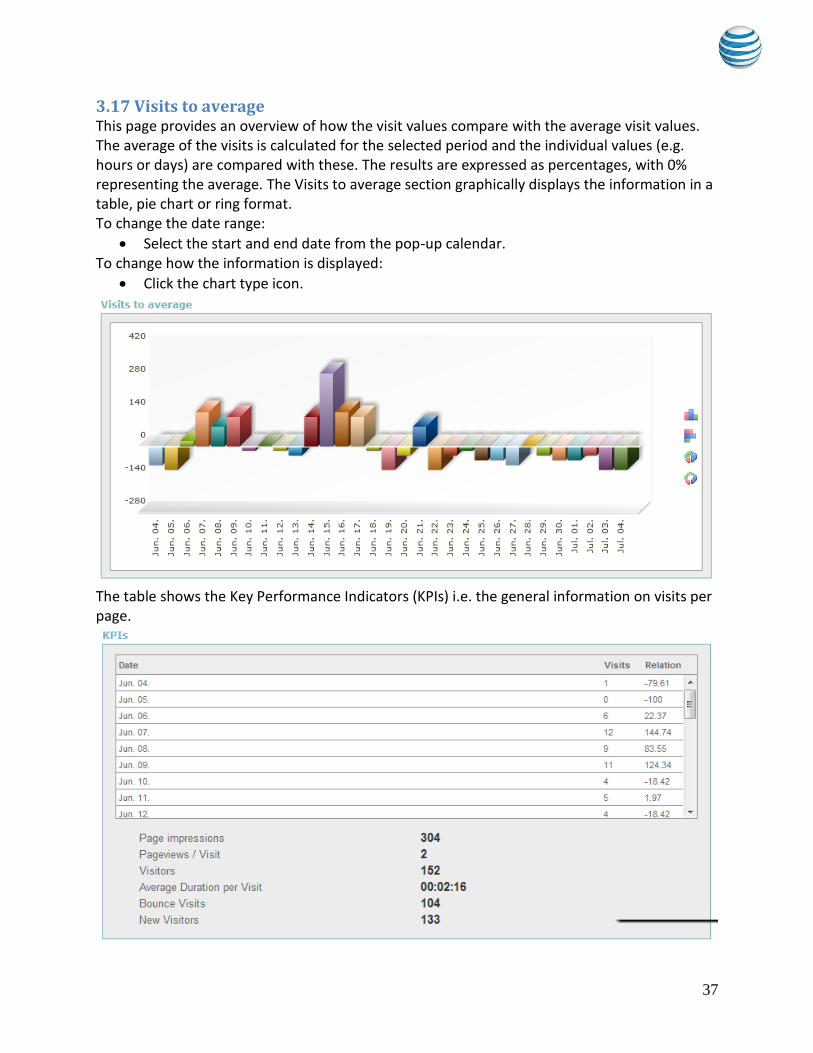
3.17 Visits to average This page provides an overview of how the visit values compare with the average visit values. The average of the visits is calculated for the selected period and the individual values (e.g. hours or days) are compared with these. The results are expressed as percentages, with 0% representing the average. The Visits to average section graphically displays the information in a table, pie chart or ring format. To change the date range:
Select the start and end date from the pop-up calendar. To change how the information is displayed:
Click the chart type icon.
The table shows the Key Performance Indicators (KPIs) i.e. the general information on visits per page.
38
3.17.1 Origin The statistics for this menu item provide information about how the visitors arrived to the website and by what means.
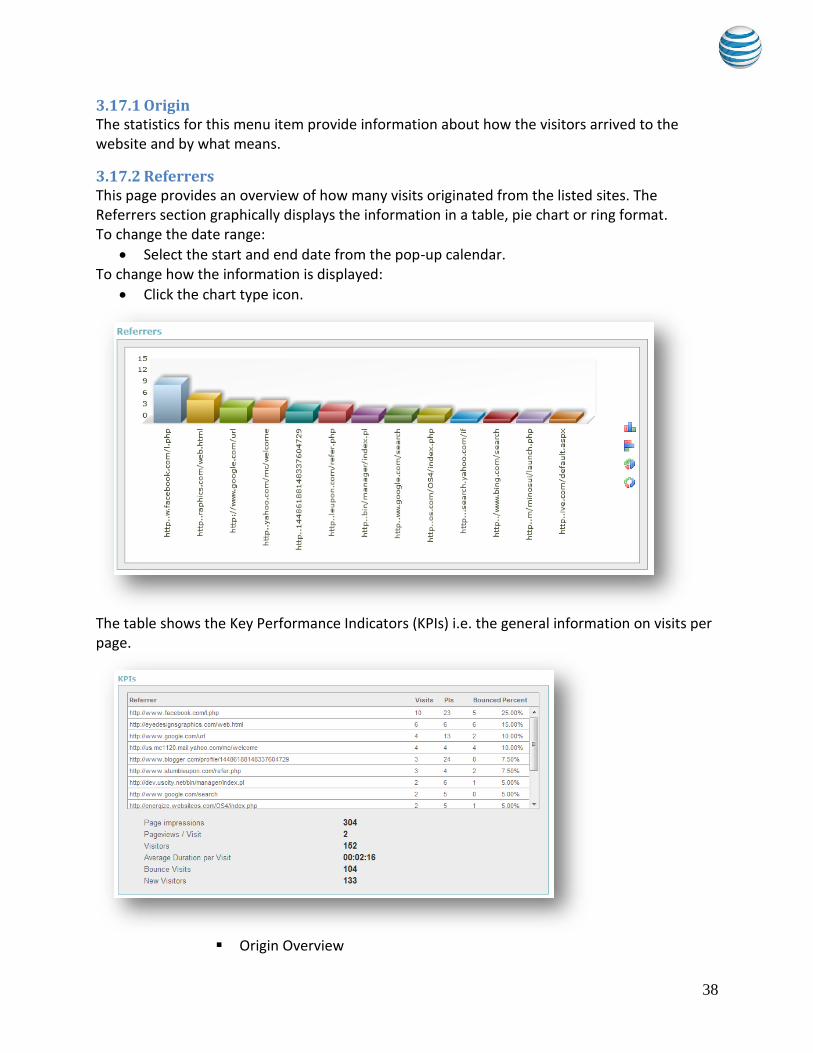
3.17.2 Referrers This page provides an overview of how many visits originated from the listed sites. The Referrers section graphically displays the information in a table, pie chart or ring format. To change the date range:
Select the start and end date from the pop-up calendar. To change how the information is displayed:
Click the chart type icon.
The table shows the Key Performance Indicators (KPIs) i.e. the general information on visits per page.
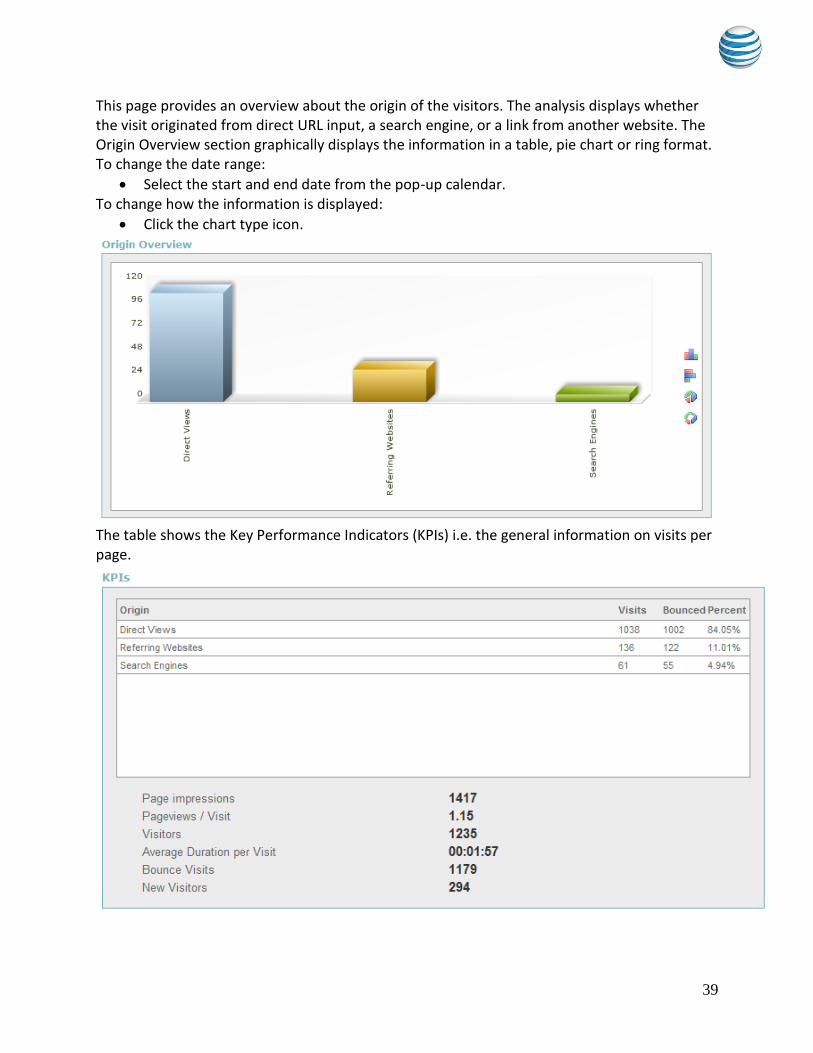
Origin Overview
39
This page provides an overview about the origin of the visitors. The analysis displays whether the visit originated from direct URL input, a search engine, or a link from another website. The Origin Overview section graphically displays the information in a table, pie chart or ring format. To change the date range:
Select the start and end date from the pop-up calendar. To change how the information is displayed:
Click the chart type icon.
The table shows the Key Performance Indicators (KPIs) i.e. the general information on visits per page.

40
3.18 Search Engines This page provides an overview of the search engine types the visitors used to land on the website. The Search Engines section graphically displays the information in a table, pie chart or ring format. To change the date range:
Select the start and end date from the pop-up calendar. To change how the information is displayed:
Click the chart type icon.
The table shows the Key Performance Indicators (KPIs) i.e. the general information on visits per page.
41
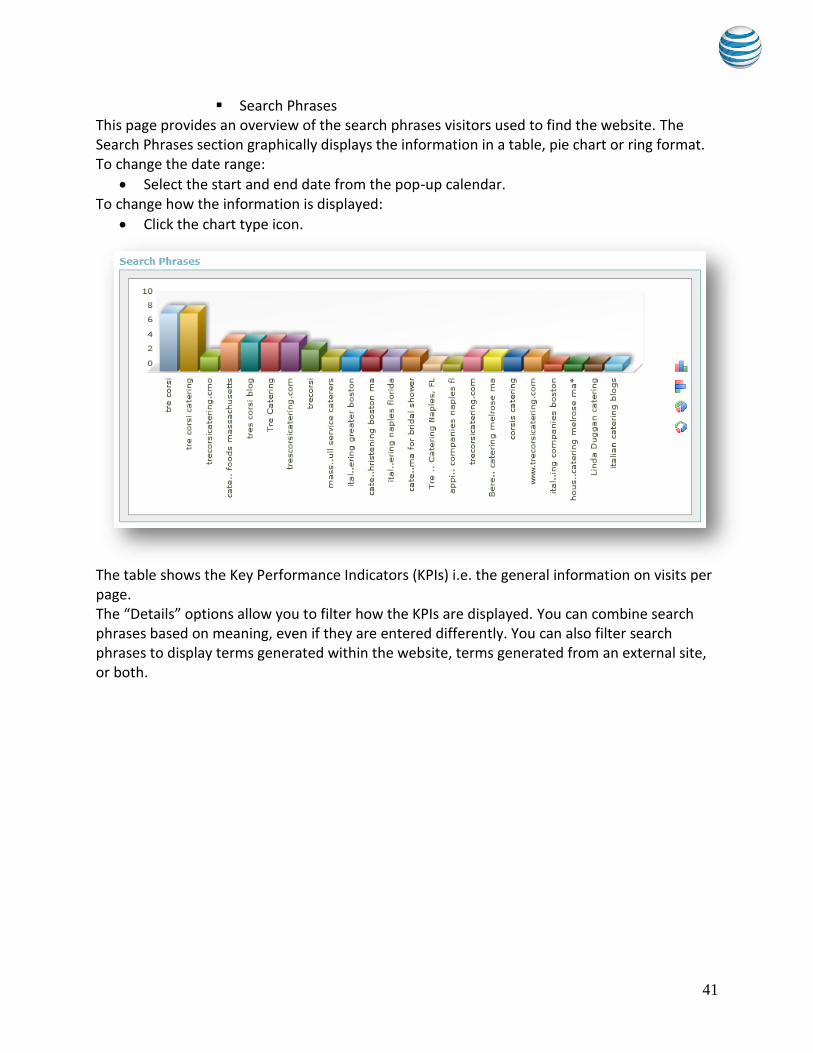
Search Phrases This page provides an overview of the search phrases visitors used to find the website. The Search Phrases section graphically displays the information in a table, pie chart or ring format. To change the date range:
Select the start and end date from the pop-up calendar. To change how the information is displayed:
Click the chart type icon.
The table shows the Key Performance Indicators (KPIs) i.e. the general information on visits per page. The “Details” options allow you to filter how the KPIs are displayed. You can combine search phrases based on meaning, even if they are entered differently. You can also filter search phrases to display terms generated within the website, terms generated from an external site, or both.

42
To combine search phrases:
In the Details section of the KPI table, click “On”. To filter search phrases: In the Details section of the KPI table, select “all”, “extern” or “intern”.
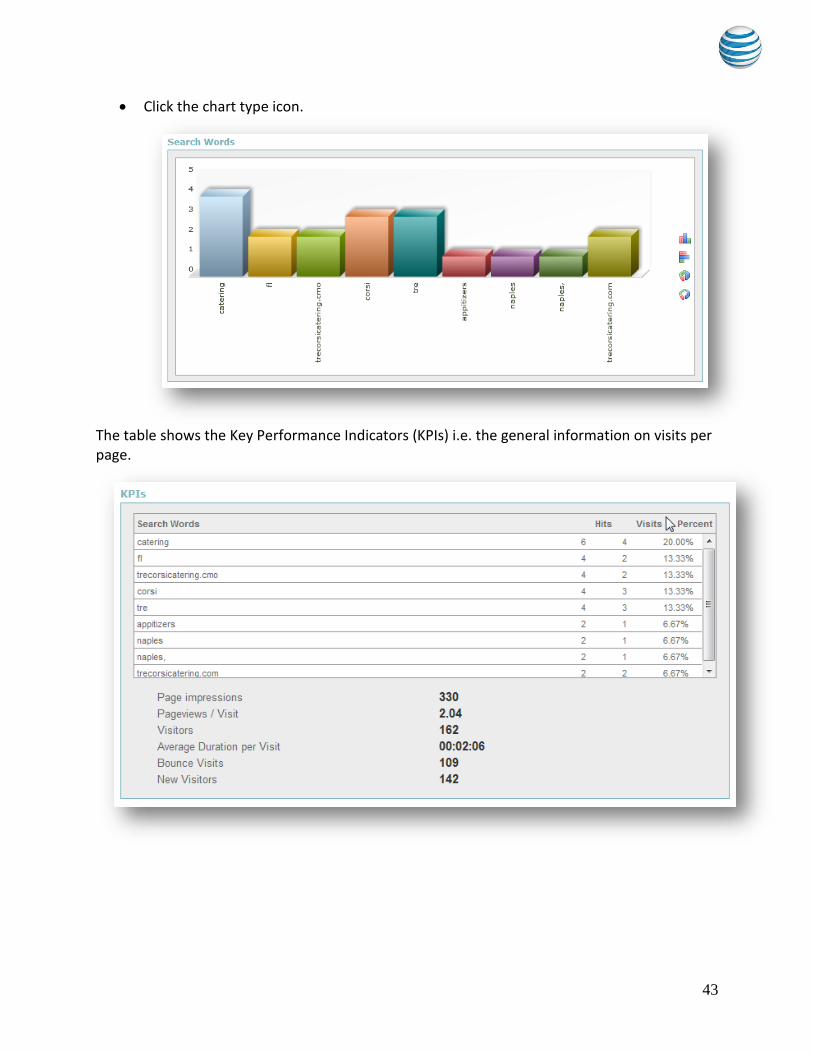
3.18.1 Search Words This page provides an overview of any individual search word that visitors used to find the website. The Search Words section graphically displays the information in a table, pie chart or ring format. To change the date range:
Select the start and end date from the pop-up calendar. To change how the information is displayed:
43
Click the chart type icon.
The table shows the Key Performance Indicators (KPIs) i.e. the general information on visits per page.
44
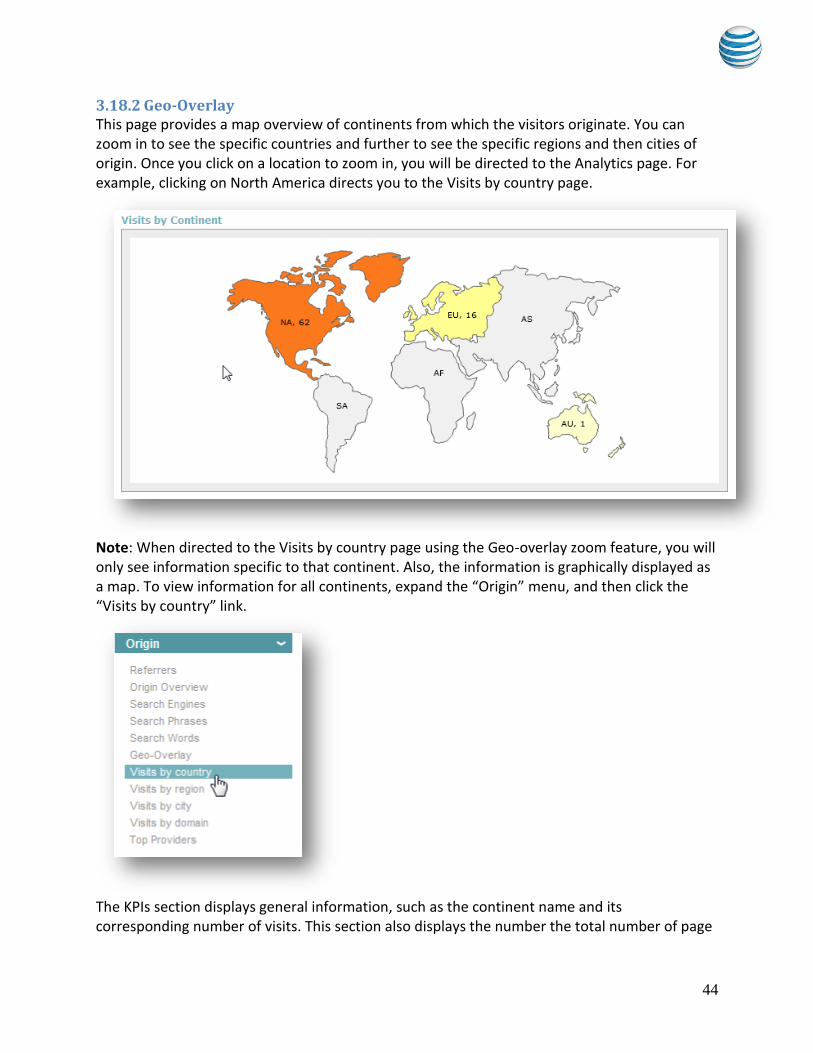
3.18.2 Geo-Overlay This page provides a map overview of continents from which the visitors originate. You can zoom in to see the specific countries and further to see the specific regions and then cities of origin. Once you click on a location to zoom in, you will be directed to the Analytics page. For example, clicking on North America directs you to the Visits by country page.
Note: When directed to the Visits by country page using the Geo-overlay zoom feature, you will only see information specific to that continent. Also, the information is graphically displayed as a map. To view information for all continents, expand the “Origin” menu, and then click the “Visits by country” link.
The KPIs section displays general information, such as the continent name and its corresponding number of visits. This section also displays the number the total number of page

45
impressions, pageviews per visit, the average duaration per visit, the number of bounced visits and new visitors.
3.18.3 Visits by country This page displays a graphical view of the number of visits per county. When accessing this page through left-hand navigation option, the information can be displayed in a table, pie chart or ring format. Note: to display this information in the form of a map, click Geo-overlay, and zoom into the continent. To change the date range:
Select the start and end date from the pop-up calendar. To change how the information is displayed:
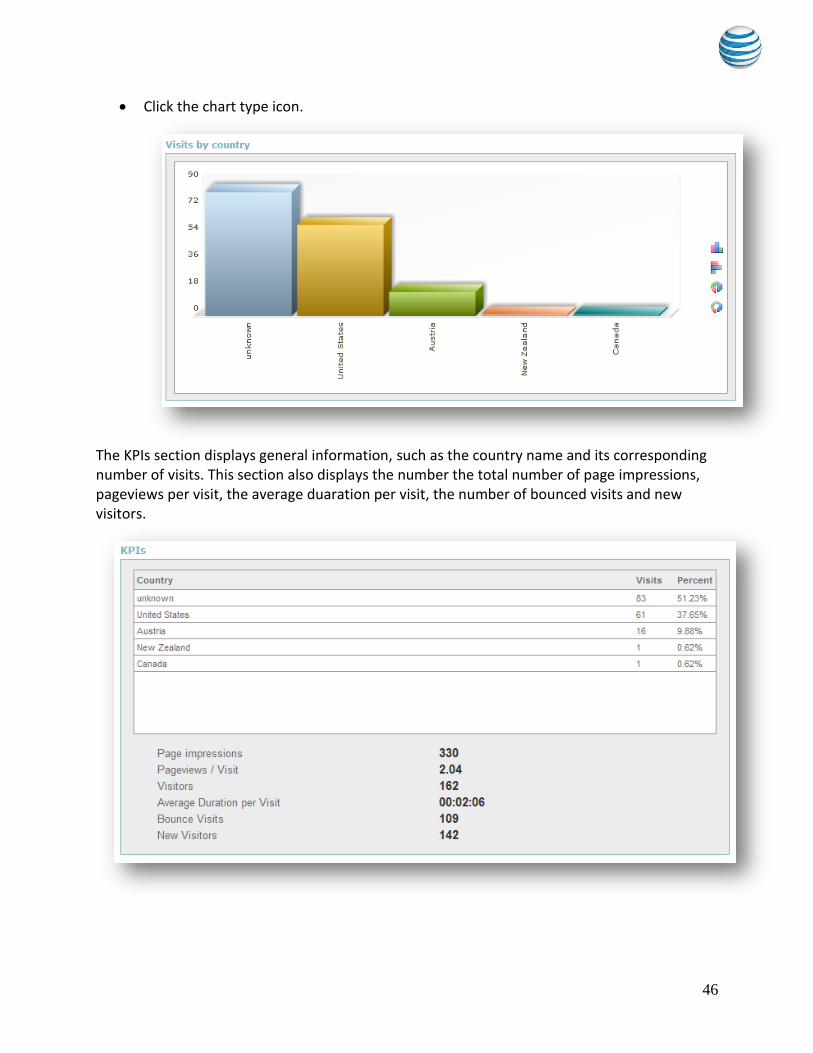
46
Click the chart type icon.
The KPIs section displays general information, such as the country name and its corresponding number of visits. This section also displays the number the total number of page impressions, pageviews per visit, the average duaration per visit, the number of bounced visits and new visitors.

47
3.18.4 Visits by region This page provides an overview by region of the visitor's origin. The information is presented in the form of a diagram or a table. To change the date range:
Select the start and end date from the pop-up calendar. To change how the information is displayed:
Click the chart type icon. The table shows the Key Performance Indicators (KPIs) i.e. the general information on visits per page.
3.18.5 Visits by city This page provides an overview of the cities from which visitors to the website hail. The information is presented in the form of a diagram or a table. To change the date range:
Select the start and end date from the pop-up calendar. To change how the information is displayed:
Click the chart type icon. The table shows the Key Performance Indicators (KPIs) i.e. the general information on visits per page.
3.18.6 Visits by domain This page provides an overview of the domains from which visitors to the website have come. The information is presented in the form of a diagram or a table. To change the date range:
Select the start and end date from the pop-up calendar. To change how the information is displayed:
Click the chart type icon. The table shows the Key Performance Indicators (KPIs) i.e. the general information on visits per page.

48
3.18.7 Top Providers This page provides an overview of which providers the visitors use The Top Providers section graphically displays the information in a table, pie chart or ring format. To change the date range:
Select the start and end date from the pop-up calendar. To change how the information is displayed:
Click the chart type icon.
The KPIs section displays general information, such as the ISP name and its corresponding number of visits. This section also displays the number the total number of page impressions, pageviews per visit, the average duaration per visit, the number of bounced visits and new visitors.
49
3.18.8 Technology The statistics under this menu item provide information about the available technological equipment of visitors to the website.
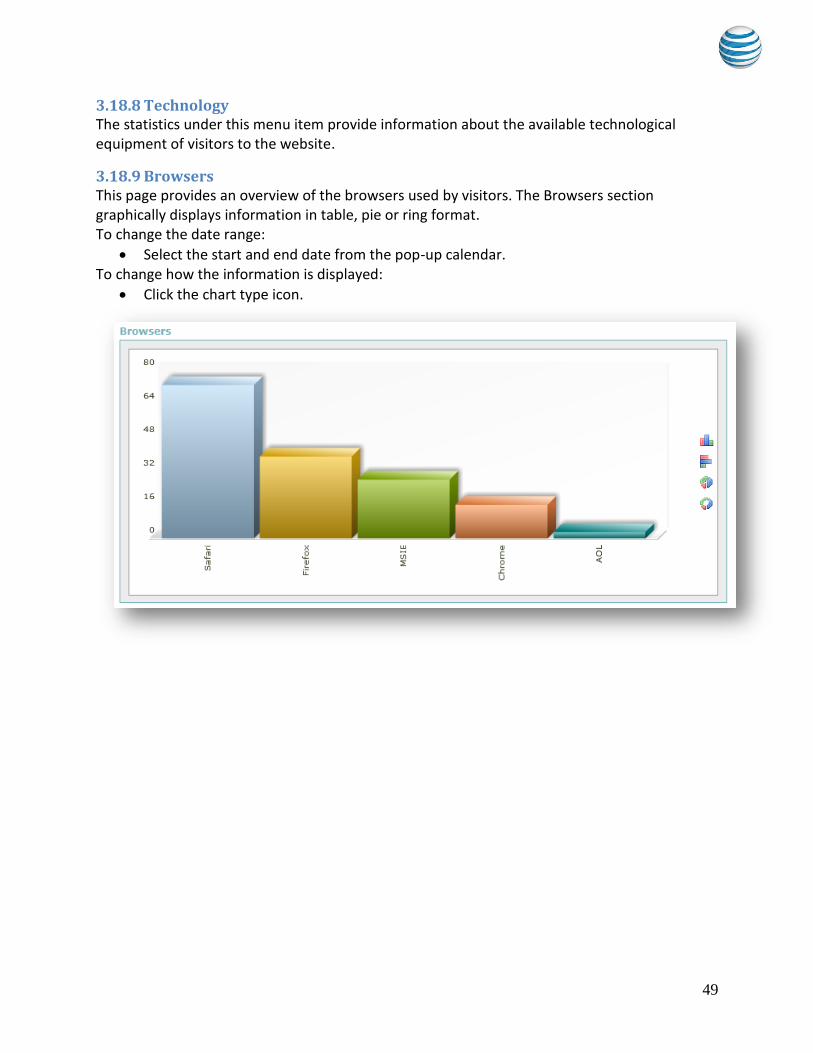
3.18.9 Browsers This page provides an overview of the browsers used by visitors. The Browsers section graphically displays information in table, pie or ring format. To change the date range:
Select the start and end date from the pop-up calendar. To change how the information is displayed:
Click the chart type icon.

50
The KPIs section displays general information, such as the Browser type and its corresponding number of visits. This section also displays the number the total number of page impressions, pageviews per visit, the average duaration per visit, the number of bounced visits and new visitors.
Operating systems
This page provides an overview of the operating system visitors used. The Operating systems section graphically displays information in table, pie or ring format. To change the date range:
Select the start and end date from the pop-up calendar. To change how the information is displayed:
Click the chart type icon.
51
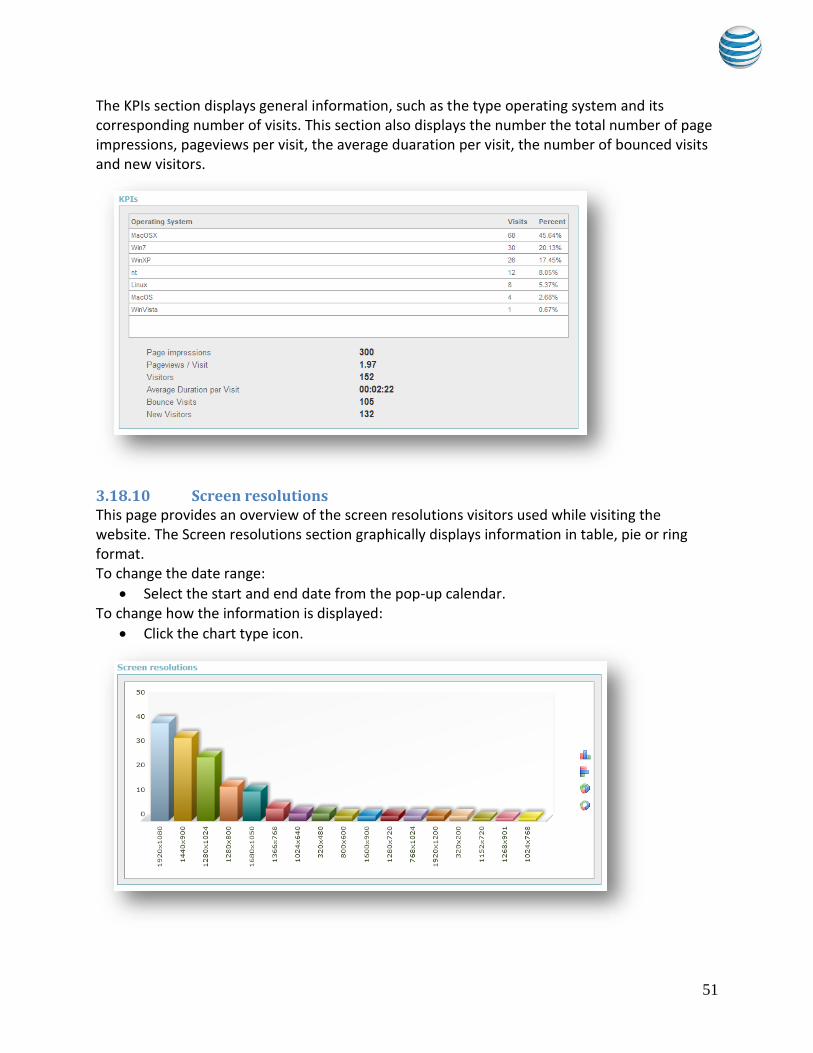
The KPIs section displays general information, such as the type operating system and its corresponding number of visits. This section also displays the number the total number of page impressions, pageviews per visit, the average duaration per visit, the number of bounced visits and new visitors.
3.18.10 Screen resolutions This page provides an overview of the screen resolutions visitors used while visiting the website. The Screen resolutions section graphically displays information in table, pie or ring format. To change the date range:
Select the start and end date from the pop-up calendar. To change how the information is displayed:
Click the chart type icon.
52
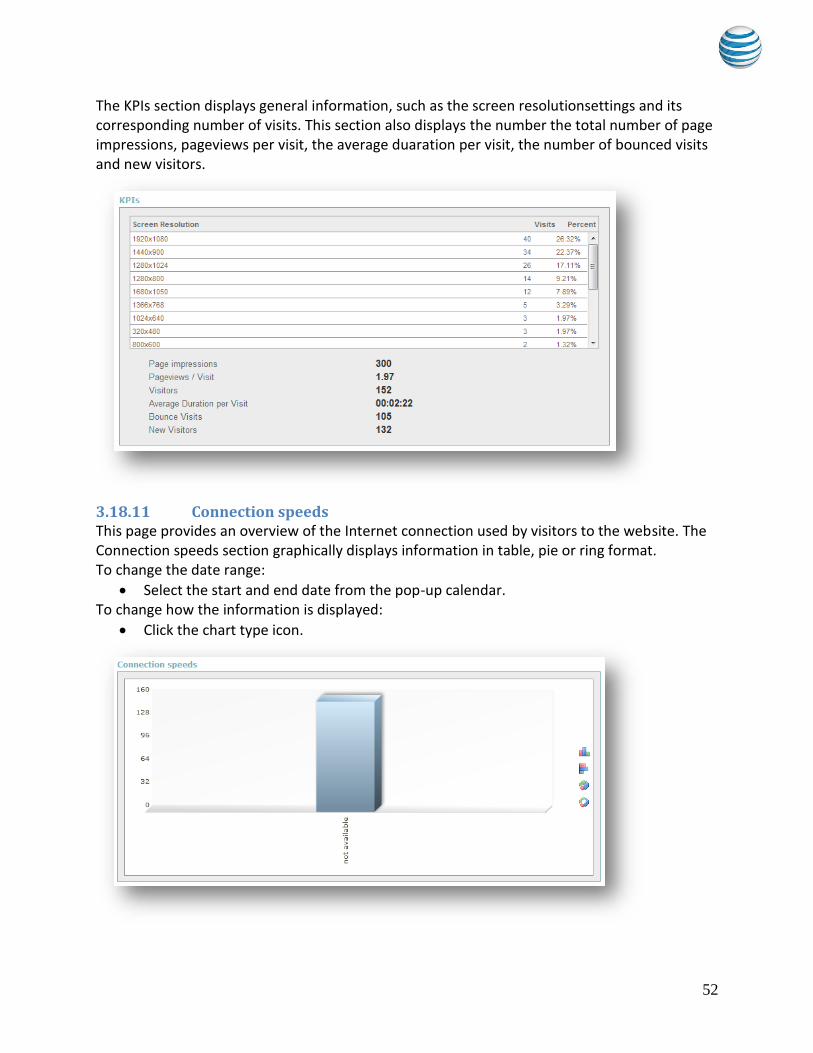
The KPIs section displays general information, such as the screen resolutionsettings and its corresponding number of visits. This section also displays the number the total number of page impressions, pageviews per visit, the average duaration per visit, the number of bounced visits and new visitors.
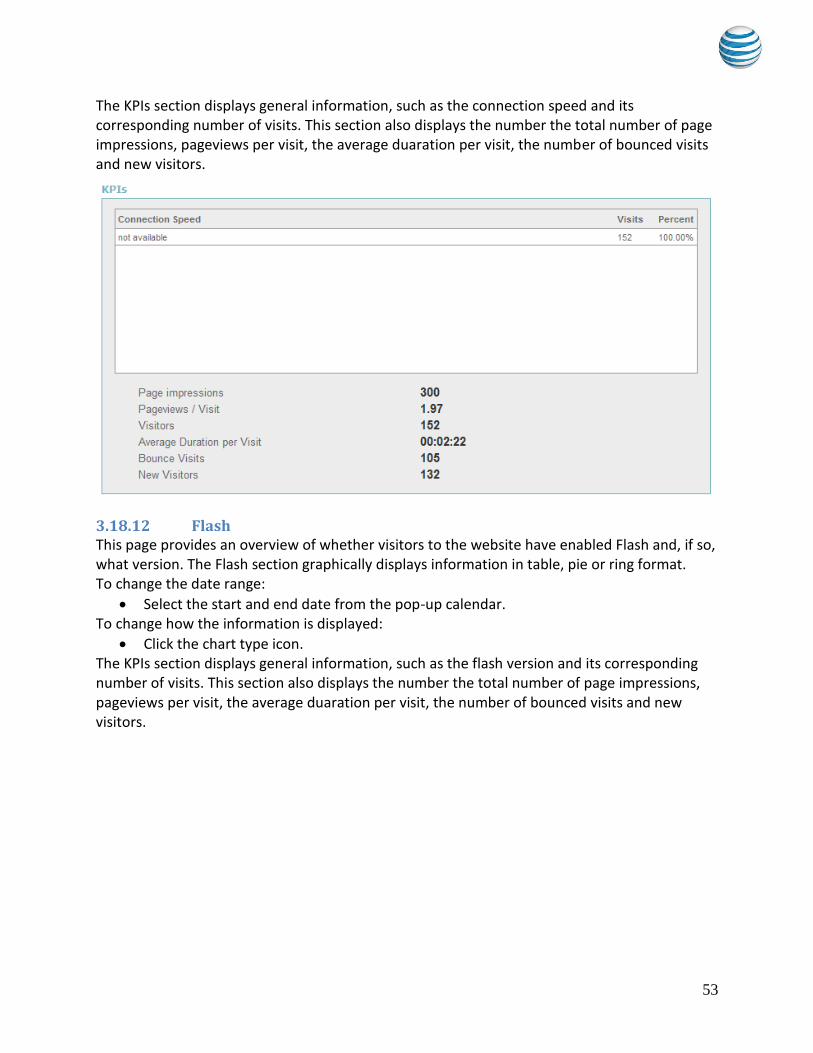
3.18.11 Connection speeds This page provides an overview of the Internet connection used by visitors to the website. The Connection speeds section graphically displays information in table, pie or ring format. To change the date range:
Select the start and end date from the pop-up calendar. To change how the information is displayed:
Click the chart type icon.
53
The KPIs section displays general information, such as the connection speed and its corresponding number of visits. This section also displays the number the total number of page impressions, pageviews per visit, the average duaration per visit, the number of bounced visits and new visitors.
3.18.12 Flash This page provides an overview of whether visitors to the website have enabled Flash and, if so, what version. The Flash section graphically displays information in table, pie or ring format. To change the date range:
Select the start and end date from the pop-up calendar. To change how the information is displayed:
Click the chart type icon. The KPIs section displays general information, such as the flash version and its corresponding number of visits. This section also displays the number the total number of page impressions, pageviews per visit, the average duaration per visit, the number of bounced visits and new visitors.

54
3.18.13 JavaScript This page provides an overview of whether visitors to the website have enabled JavaScript and, if so, which version. The JavaScript section graphically displays information in table, pie or ring format. To change the date range:
Select the start and end date from the pop-up calendar. To change how the information is displayed:
Click the chart type icon.
The KPIs section displays general information, such as the JavaScript version and its corresponding number of visits. This section also displays the number the total number of page impressions, pageviews per visit, the average duaration per visit, the number of bounced visits and new visitors.

55
3.18.14 Plugins This page provides an overview of which plugins the users have installed. The statistics data shows how many of the visitors have installed the displayed plugins. The Plugins section graphically displays information in table, pie or ring format. To change the date range:
Select the start and end date from the pop-up calendar. To change how the information is displayed:
Click the chart type icon.
The KPIs section displays general information, such as the Plugin type and its corresponding number of visits. This section also displays the number the total number of page impressions, pageviews per visit, the average duaration per visit, the number of bounced visits and new visitors.
56
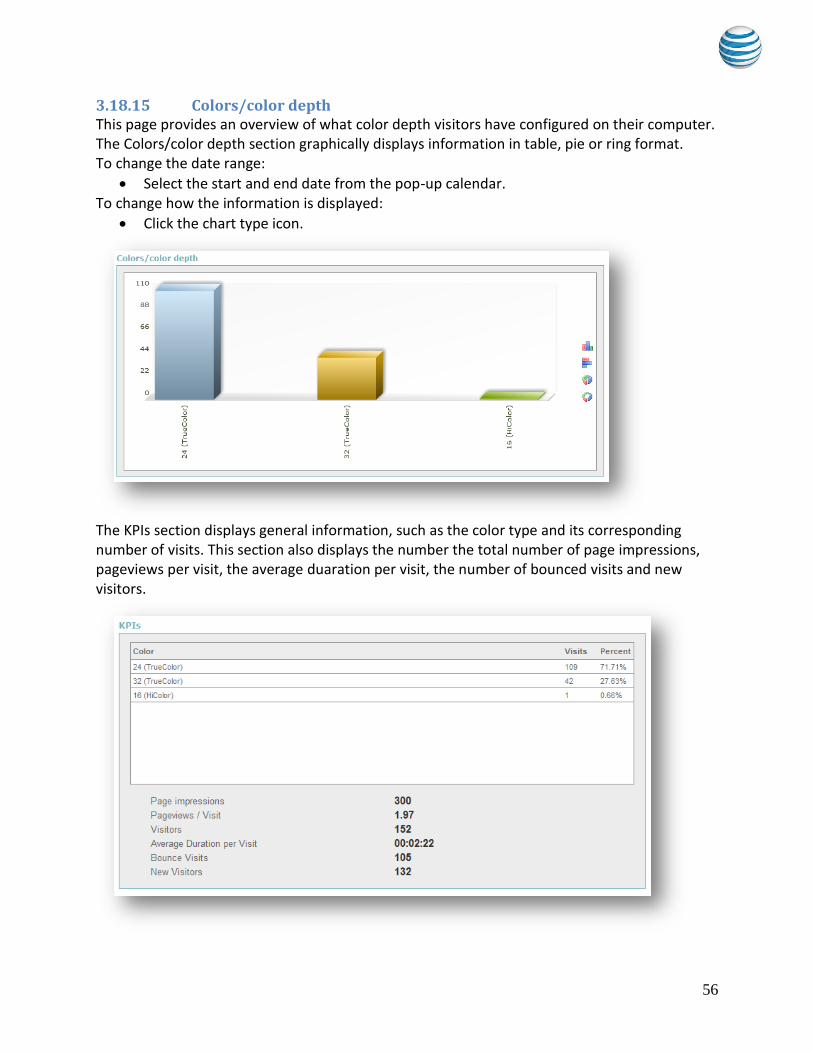
3.18.15 Colors/color depth This page provides an overview of what color depth visitors have configured on their computer. The Colors/color depth section graphically displays information in table, pie or ring format. To change the date range:
Select the start and end date from the pop-up calendar. To change how the information is displayed:
Click the chart type icon.
The KPIs section displays general information, such as the color type and its corresponding number of visits. This section also displays the number the total number of page impressions, pageviews per visit, the average duaration per visit, the number of bounced visits and new visitors.
57
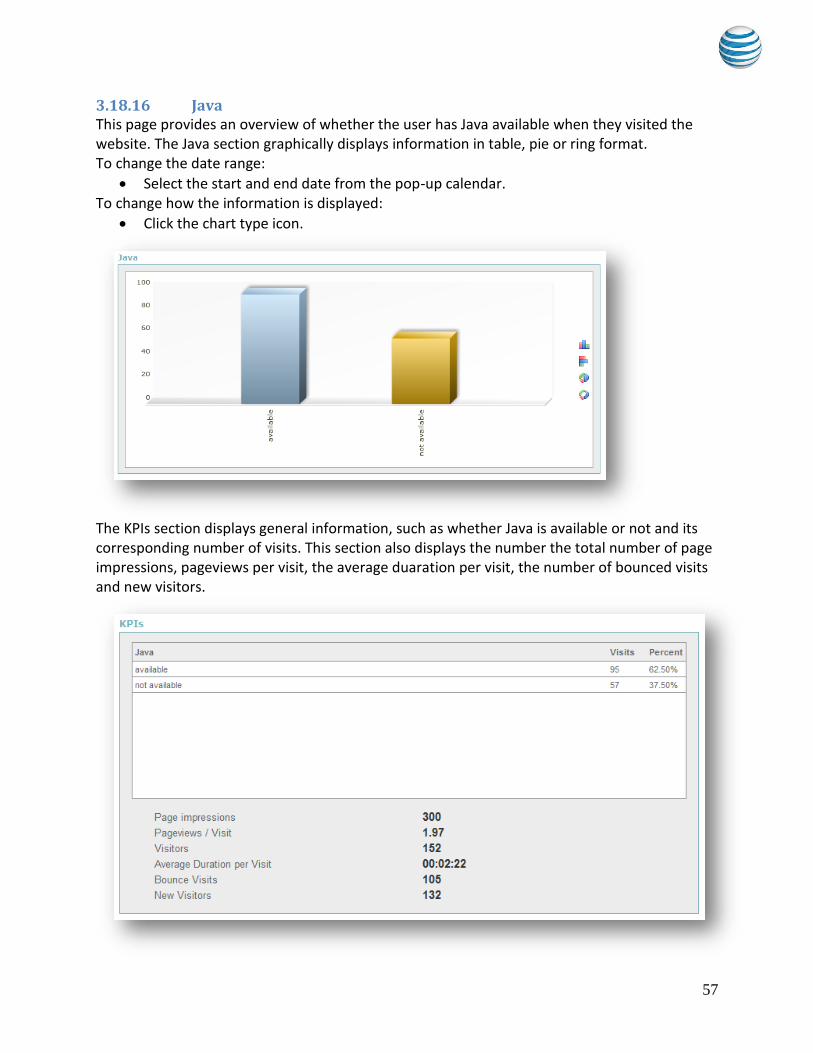
3.18.16 Java This page provides an overview of whether the user has Java available when they visited the website. The Java section graphically displays information in table, pie or ring format. To change the date range:
Select the start and end date from the pop-up calendar. To change how the information is displayed:
Click the chart type icon.
The KPIs section displays general information, such as whether Java is available or not and its corresponding number of visits. This section also displays the number the total number of page impressions, pageviews per visit, the average duaration per visit, the number of bounced visits and new visitors.
58
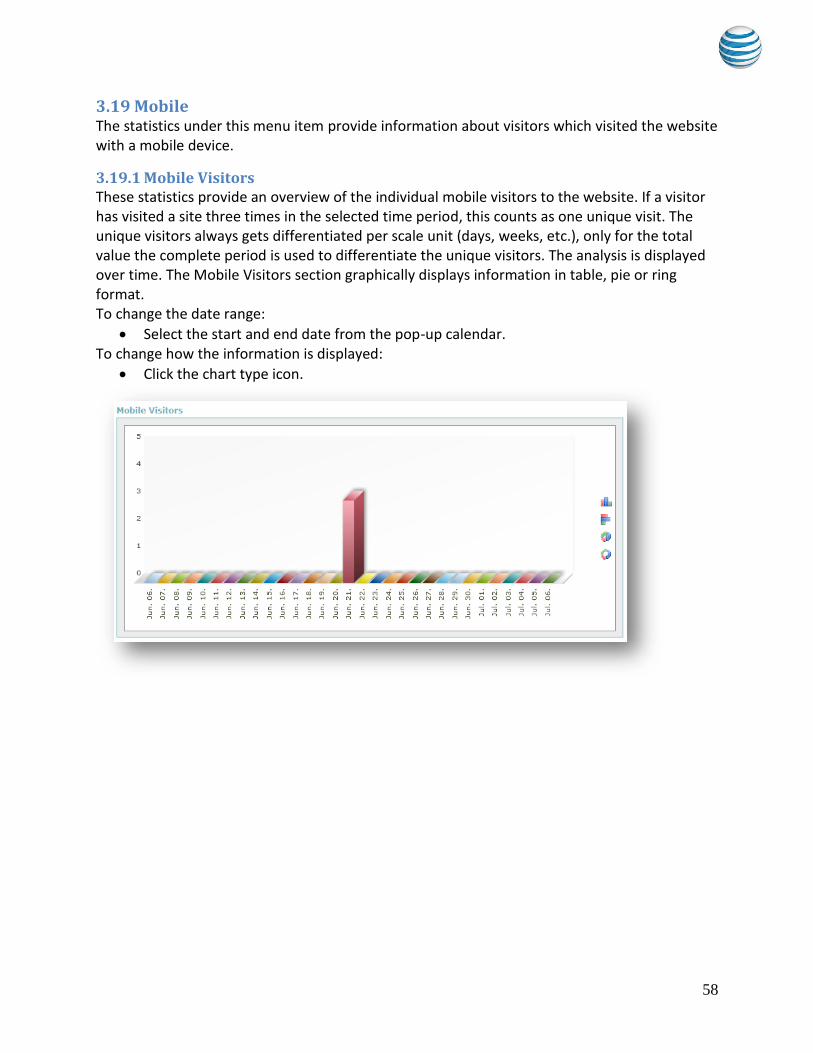
3.19 Mobile The statistics under this menu item provide information about visitors which visited the website with a mobile device.
3.19.1 Mobile Visitors These statistics provide an overview of the individual mobile visitors to the website. If a visitor has visited a site three times in the selected time period, this counts as one unique visit. The unique visitors always gets differentiated per scale unit (days, weeks, etc.), only for the total value the complete period is used to differentiate the unique visitors. The analysis is displayed over time. The Mobile Visitors section graphically displays information in table, pie or ring format. To change the date range:
Select the start and end date from the pop-up calendar. To change how the information is displayed:
Click the chart type icon.
59
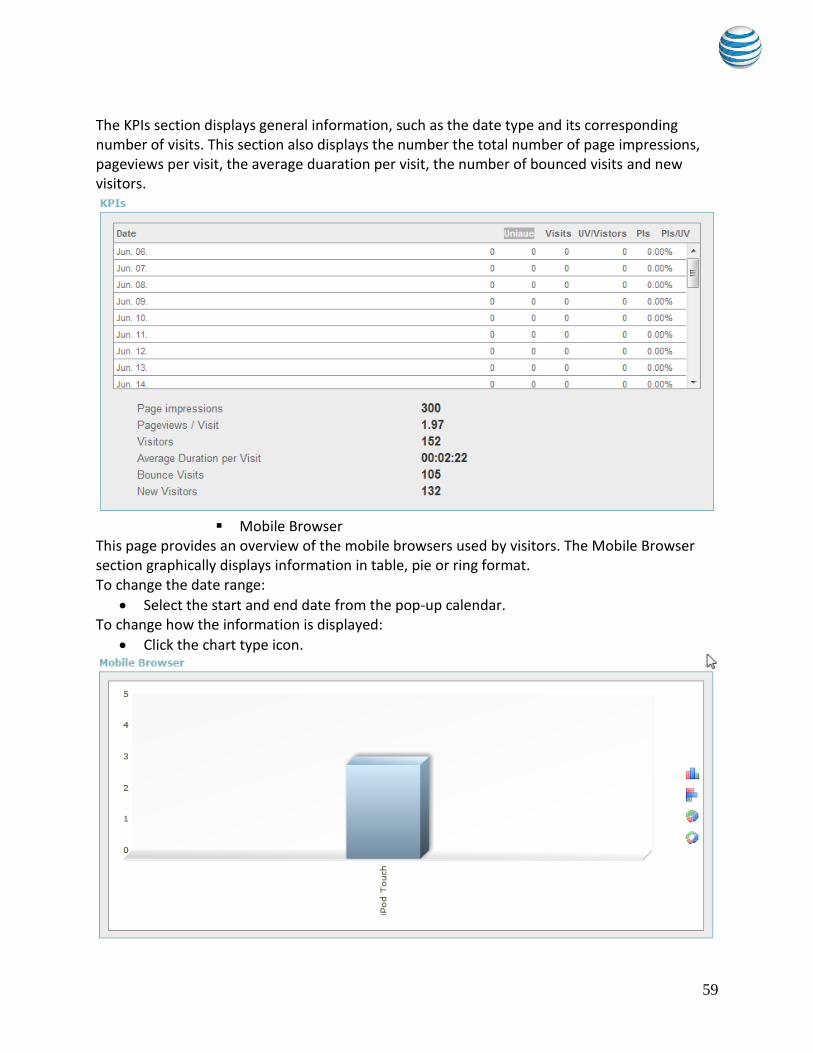
The KPIs section displays general information, such as the date type and its corresponding number of visits. This section also displays the number the total number of page impressions, pageviews per visit, the average duaration per visit, the number of bounced visits and new visitors.
Mobile Browser
This page provides an overview of the mobile browsers used by visitors. The Mobile Browser section graphically displays information in table, pie or ring format. To change the date range:
Select the start and end date from the pop-up calendar. To change how the information is displayed:
Click the chart type icon.
60
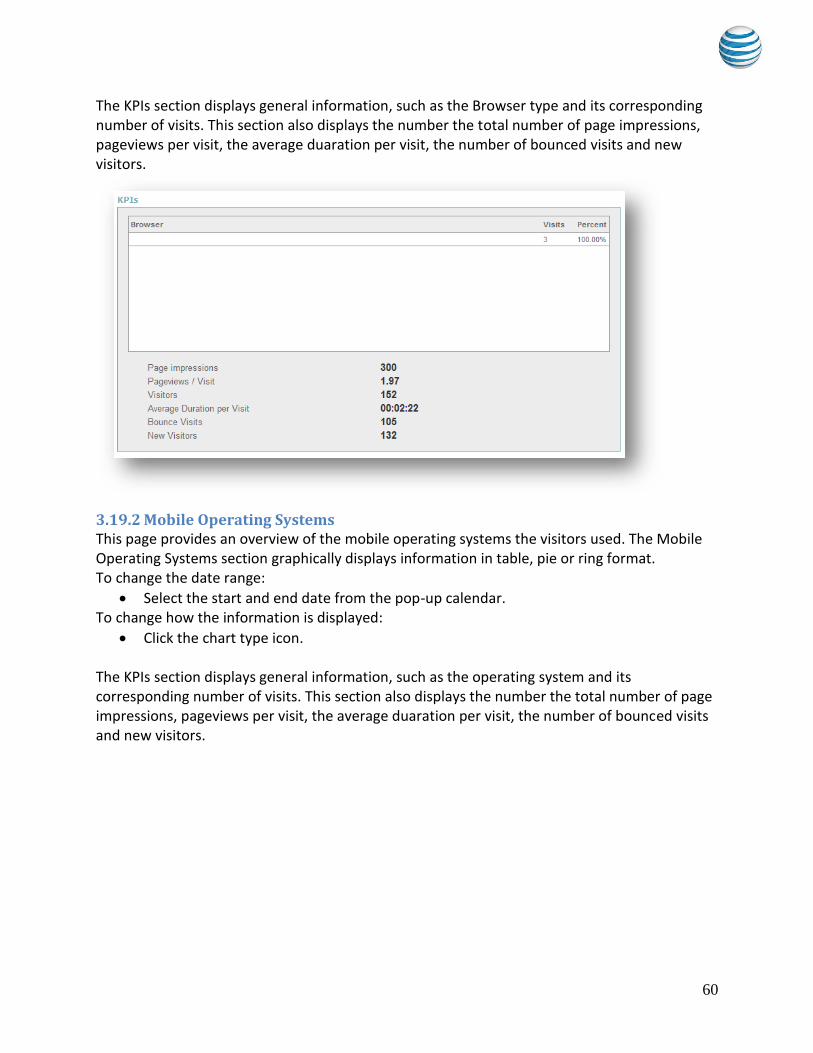
The KPIs section displays general information, such as the Browser type and its corresponding number of visits. This section also displays the number the total number of page impressions, pageviews per visit, the average duaration per visit, the number of bounced visits and new visitors.
3.19.2 Mobile Operating Systems This page provides an overview of the mobile operating systems the visitors used. The Mobile Operating Systems section graphically displays information in table, pie or ring format. To change the date range:
Select the start and end date from the pop-up calendar. To change how the information is displayed:
Click the chart type icon. The KPIs section displays general information, such as the operating system and its corresponding number of visits. This section also displays the number the total number of page impressions, pageviews per visit, the average duaration per visit, the number of bounced visits and new visitors.
61
3.19.3 Mobile Devices This page provides an overview of the mobile devices the visitors used. The Mobile Devices section graphically displays information in table, pie or ring format. To change the date range:
Select the start and end date from the pop-up calendar. To change how the information is displayed:
Click the chart type icon. The KPIs section displays general information, such as the dvevices used and its corresponding number of visits. This section also displays the number the total number of page impressions, pageviews per visit, the average duaration per visit, the number of bounced visits and new visitors.
3.20 E-Commerce This section provides statistical breakdown by product, sales and orders.
3.20.1 Products This page provides an overview of the products purchased. The information is presented in the form of a diagram or a table. They provide information on the following categories: Top Orders; Top Items (the quantity); Top sales. To change the date range:
Select the start and end date from the pop-up calendar. To change how the information is displayed:
Click the chart type icon. The table shows the Key Performance Indicators (KPIs) i.e. the general information per page.
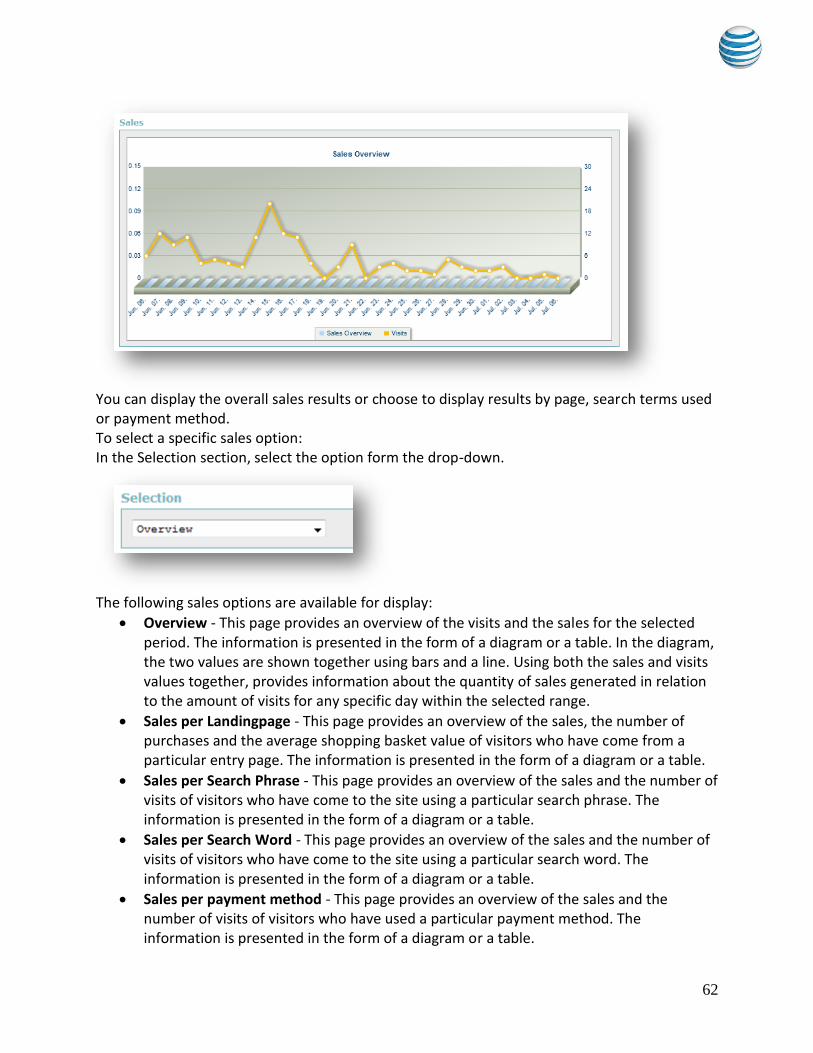
3.20.2 Sales The statistics under this menu item provide an overview of the sales generated. The Sales section graphically displays the sales generated for the specified time frame.
62
You can display the overall sales results or choose to display results by page, search terms used or payment method. To select a specific sales option: In the Selection section, select the option form the drop-down.
The following sales options are available for display:
Overview - This page provides an overview of the visits and the sales for the selected period. The information is presented in the form of a diagram or a table. In the diagram, the two values are shown together using bars and a line. Using both the sales and visits values together, provides information about the quantity of sales generated in relation to the amount of visits for any specific day within the selected range.
Sales per Landingpage - This page provides an overview of the sales, the number of purchases and the average shopping basket value of visitors who have come from a particular entry page. The information is presented in the form of a diagram or a table.
Sales per Search Phrase - This page provides an overview of the sales and the number of visits of visitors who have come to the site using a particular search phrase. The information is presented in the form of a diagram or a table.
Sales per Search Word - This page provides an overview of the sales and the number of visits of visitors who have come to the site using a particular search word. The information is presented in the form of a diagram or a table.
Sales per payment method - This page provides an overview of the sales and the number of visits of visitors who have used a particular payment method. The information is presented in the form of a diagram or a table.

63
Sales per region - This page provides an overview of the sales and the number of visits of visitors who have visited the site from a particular geographical region. The information is presented in the form of a diagram or a table.
The KPIs section displays the following information for each day within the specified time frame:
number of visits
orders
open orders
cancelled orders
number of sales
percent of sales based on total amount sold for the specified time frame
3.20.3 Orders This page provides an overview of orders made within the selected time period. The information is presented in the form of a table. To change the date range:
Select the start and end date from the pop-up calendar. The table shows the Key Performance Indicators (KPIs) i.e. the general information on visits per page. For the individual orders, information such as the date, the visit duration, the sales and the related order number is displayed.

64
3.21 Management The Management section allows you to manage all of the statistical data collected. This section provides information about your campaigns, including the top campaigns and top milestones. Also, this section allows you to view and generate reports.
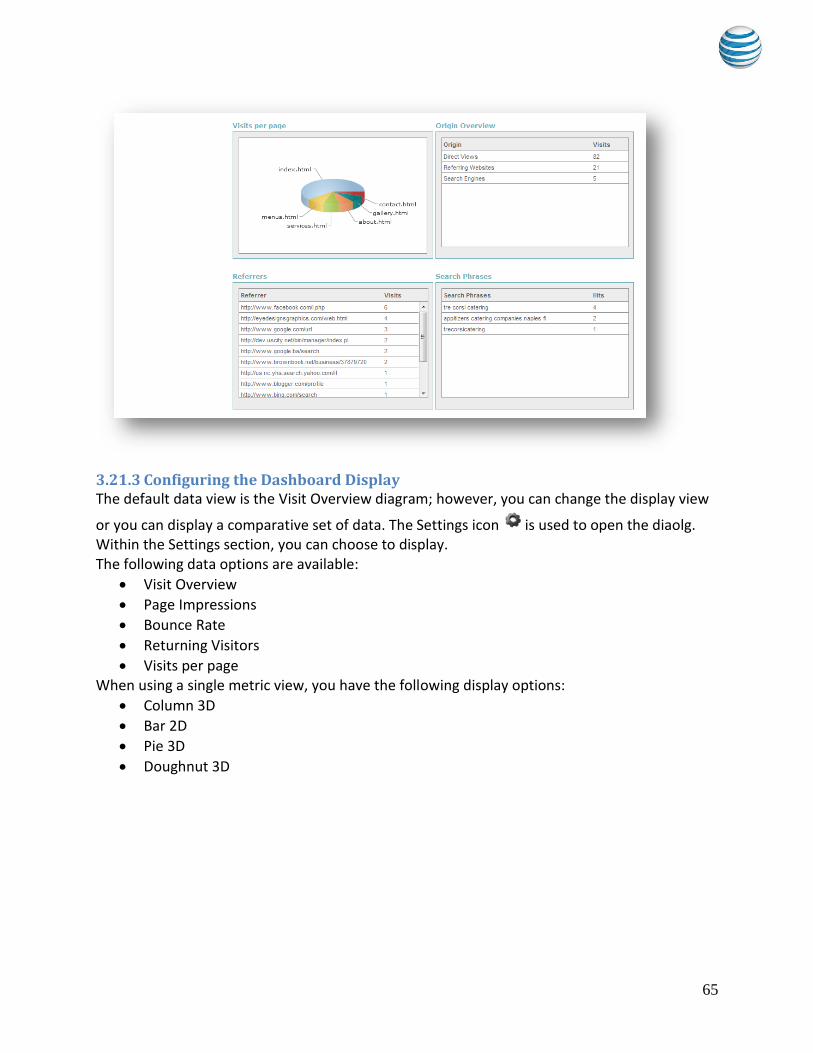
3.21.1 Management overview The Management Overview section provides a dashboard, which displays a graphical representation of the collected data. The dashboard also provides lists for the number of visits per referrer and number of visits per search phrase.
3.21.2 Dashboard The dashboard allows the user to generate a customized overview of selected statistics. To view the analytics, you should select the date range. As well as adding and displaying up to four diagrams of individual statistics, the user can define a diagram for displaying important key figures in various diagram types.
65
3.21.3 Configuring the Dashboard Display The default data view is the Visit Overview diagram; however, you can change the display view
or you can display a comparative set of data. The Settings icon is used to open the diaolg. Within the Settings section, you can choose to display. The following data options are available:
Visit Overview
Page Impressions
Bounce Rate
Returning Visitors
Visits per page When using a single metric view, you have the following display options:
Column 3D
Bar 2D
Pie 3D
Doughnut 3D

66
To change the displayed data:
1. Click the “Settings” icon. 2. If you want to display a single metric, do the following:
Select the “Single metric” radio button.
Select the data that you want to display.
Select the graph type for your data.
Click “OK”. 3. If you want to compare data, do the following:
Select the “Compare metric” radio button.
Select the first data set from the drop-down.
Select the second data set from the drop-down.
Click “OK”.

67
3.21.4 KPI’s These statistics give an overview of important KPIs (Key Performance Indicators). Using the KPIs, you can obtain important information about visitor behavior for their website. To view the statistics, select the date range.
3.22 Campaigns The statistics under this menu item provide information about campaigns and milestones on the website.
3.22.1 Campaigns overview All campaigns created are located into the folders.
68
To create a new campaign: 1. Select the folder to which the new campaign will be placed. 2. Click “New Campaign”. 3. Fill in the necessary fields. 4. Click “Save”.
To create a new folder: 1. Select the folder to which the new folder will be placed 2. Enter the new folder’s name. 3. Click “Save”.
To view the information on any campaign: 1. Select the folder in which the needed campaign is located 2. Click “Show”.
To edit the information on a campaign created: 1. Select the desired profile. 2. Click “Edit”. 3. Correct the information in the given fields. 4. Click “Save”.
3.22.2 Top Campaigns This page provides an overview of the campaigns in the selected period. The information is presented in the form of a diagram or a table. To view the information, select a date range. To change how the information is displayed:
Click the chart type icon.
3.22.3 Top Milestones This page provides an overview of the defined milestones and how many visitors have reached these. The information is presented in the form of a diagram or a table. To view the information, select a date range. To change how the information is displayed:
Click the chart type icon.
3.22.4 Sales per Campaign These statistics provide an overview of the visits and the sales for the individual campaigns in the selected time period. The information is presented in the form of a diagram or a table. In the diagram, the sales and the number of visits are shown together using bars and a line, so that you can easily compare the benefit of one campaign over another. To view the information, select a date range.
69
To change how the information is displayed:
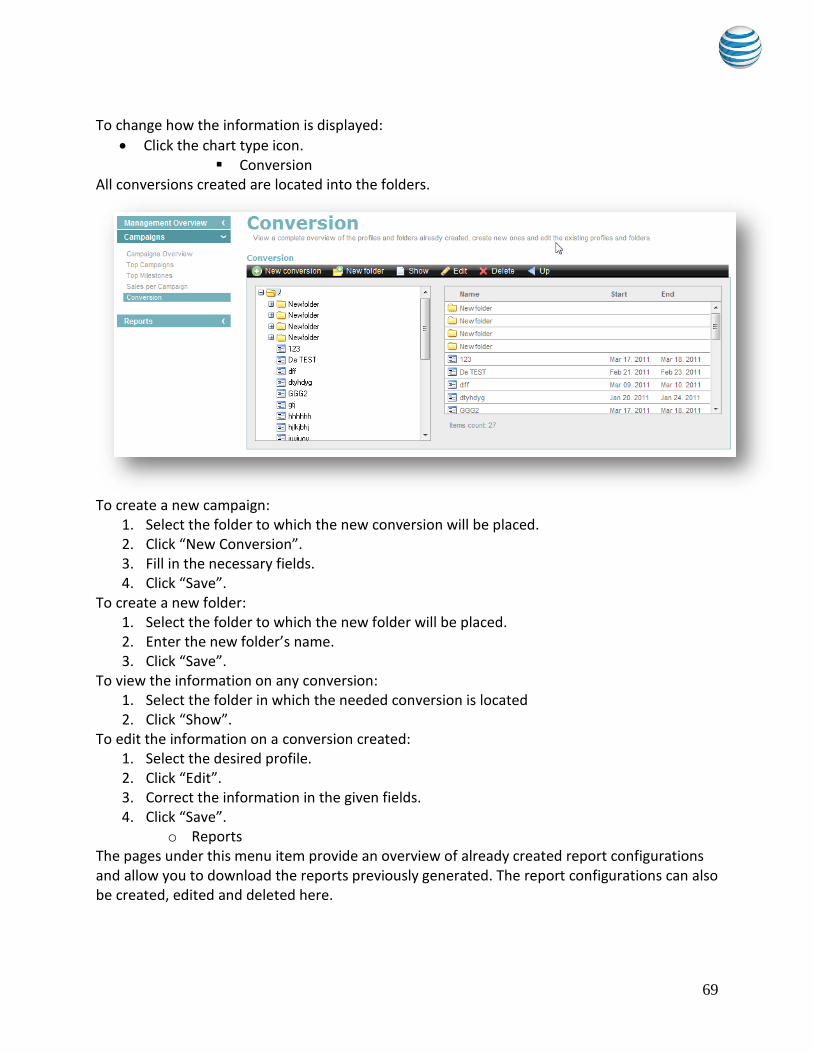
Click the chart type icon. Conversion
All conversions created are located into the folders.
To create a new campaign:
1. Select the folder to which the new conversion will be placed. 2. Click “New Conversion”. 3. Fill in the necessary fields. 4. Click “Save”.
To create a new folder: 1. Select the folder to which the new folder will be placed. 2. Enter the new folder’s name. 3. Click “Save”.
To view the information on any conversion: 1. Select the folder in which the needed conversion is located 2. Click “Show”.
To edit the information on a conversion created: 1. Select the desired profile. 2. Click “Edit”. 3. Correct the information in the given fields. 4. Click “Save”.
o Reports The pages under this menu item provide an overview of already created report configurations and allow you to download the reports previously generated. The report configurations can also be created, edited and deleted here.
70
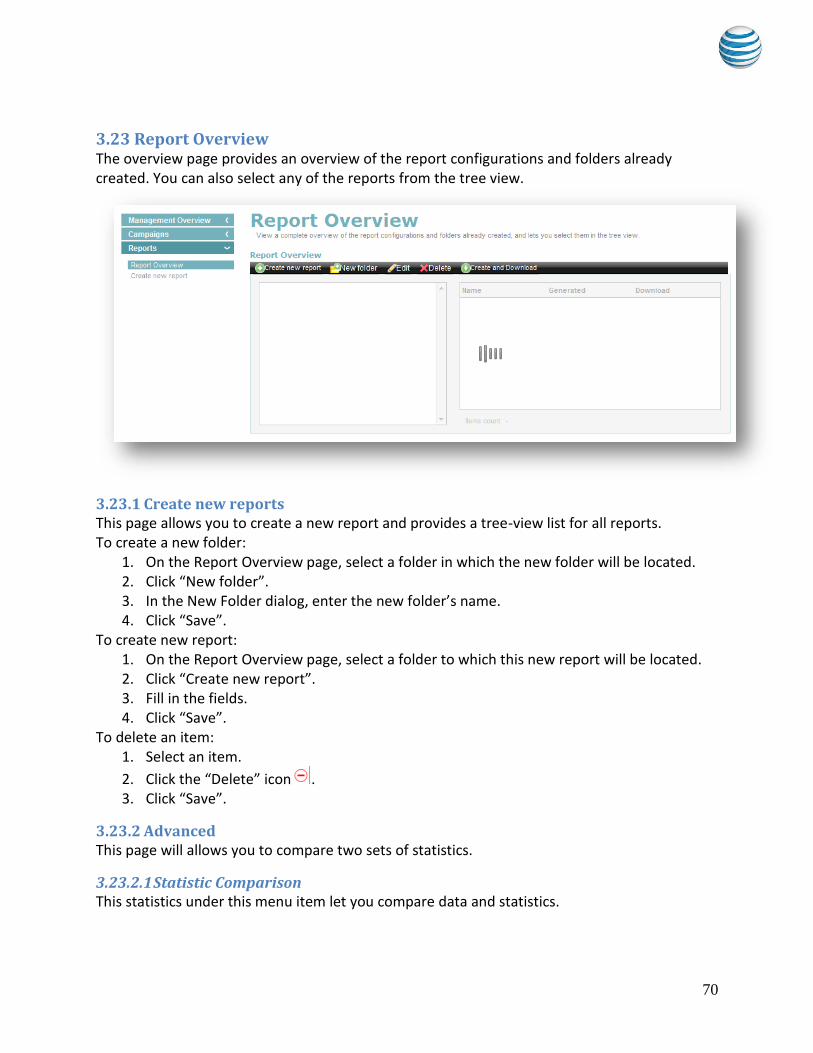
3.23 Report Overview The overview page provides an overview of the report configurations and folders already created. You can also select any of the reports from the tree view.
3.23.1 Create new reports This page allows you to create a new report and provides a tree-view list for all reports. To create a new folder:
1. On the Report Overview page, select a folder in which the new folder will be located. 2. Click “New folder”. 3. In the New Folder dialog, enter the new folder’s name. 4. Click “Save”.
To create new report: 1. On the Report Overview page, select a folder to which this new report will be located. 2. Click “Create new report”. 3. Fill in the fields. 4. Click “Save”.
To delete an item: 1. Select an item.
2. Click the “Delete” icon . 3. Click “Save”.
3.23.2 Advanced This page will allows you to compare two sets of statistics.
3.23.2.1 Statistic Comparison This statistics under this menu item let you compare data and statistics.
71
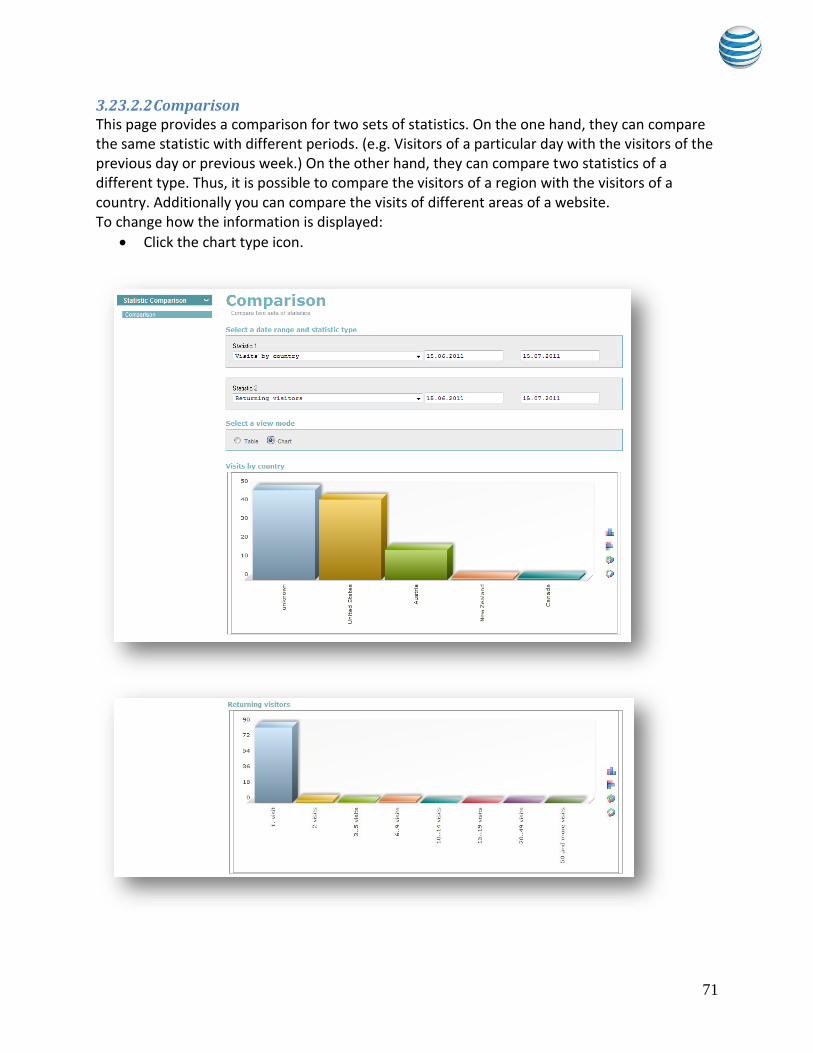
3.23.2.2 Comparison This page provides a comparison for two sets of statistics. On the one hand, they can compare the same statistic with different periods. (e.g. Visitors of a particular day with the visitors of the previous day or previous week.) On the other hand, they can compare two statistics of a different type. Thus, it is possible to compare the visitors of a region with the visitors of a country. Additionally you can compare the visits of different areas of a website. To change how the information is displayed:
Click the chart type icon.
72
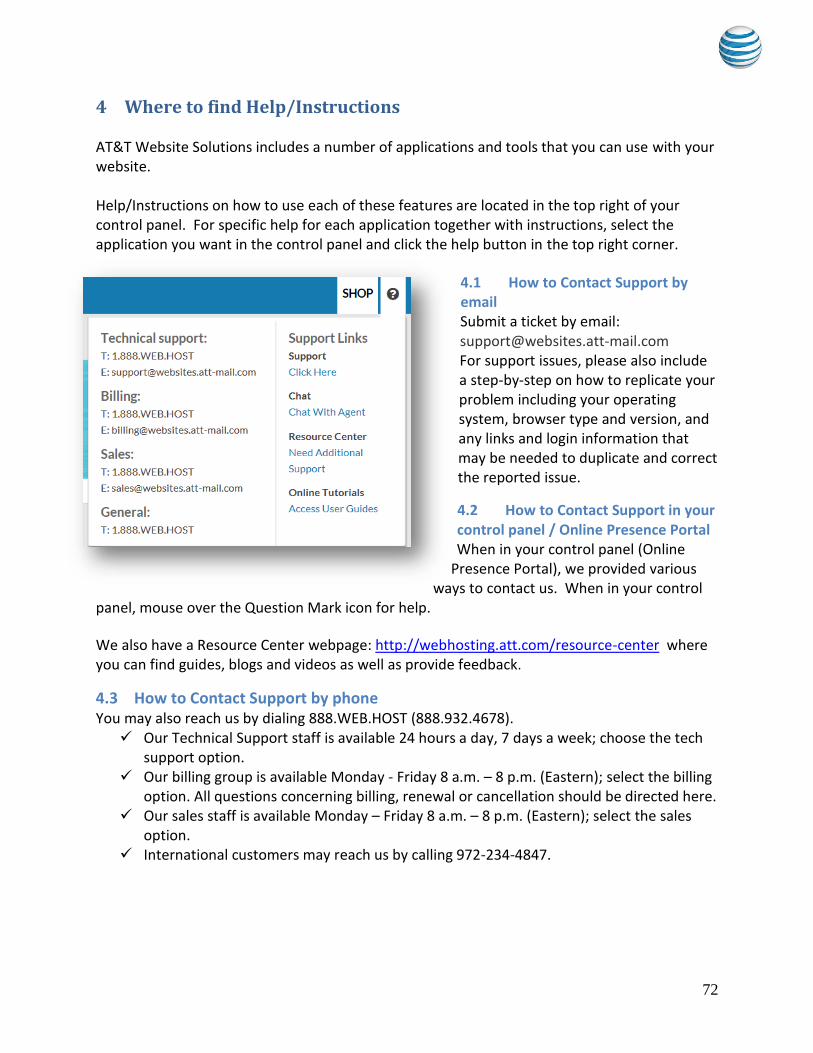
4 Where to find Help/Instructions AT&T Website Solutions includes a number of applications and tools that you can use with your website. Help/Instructions on how to use each of these features are located in the top right of your control panel. For specific help for each application together with instructions, select the application you want in the control panel and click the help button in the top right corner.
4.1 How to Contact Support by email Submit a ticket by email: [email protected] For support issues, please also include a step-by-step on how to replicate your problem including your operating system, browser type and version, and any links and login information that may be needed to duplicate and correct the reported issue.
4.2 How to Contact Support in your control panel / Online Presence Portal When in your control panel (Online
Presence Portal), we provided various ways to contact us. When in your control
panel, mouse over the Question Mark icon for help.
We also have a Resource Center webpage: http://webhosting.att.com/resource-center where you can find guides, blogs and videos as well as provide feedback.
4.3 How to Contact Support by phone You may also reach us by dialing 888.WEB.HOST (888.932.4678).
Our Technical Support staff is available 24 hours a day, 7 days a week; choose the tech support option.
Our billing group is available Monday - Friday 8 a.m. – 8 p.m. (Eastern); select the billing option. All questions concerning billing, renewal or cancellation should be directed here.
Our sales staff is available Monday – Friday 8 a.m. – 8 p.m. (Eastern); select the sales option.
International customers may reach us by calling 972-234-4847.