atomization of liquids relevant to pharmaceutical tablet...
TRANSCRIPT
Atomization of Liquids Relevant to Pharmaceutical Tablet Coating. Experiments and Droplet Size
Modelling
A. Aliseda1, †, E. J. Hopfinger1, J. C. Lasheras1, D. M. Kremer2,*, A. Berchielli2, E. K. Connolly2
1 Department of Mechanical and Aerospace Engineering
University of California, San Diego 9500 Gilman Drive
La Jolla, CA 92093-0411
2 Oral Products Center of Excellence Pfizer, Inc.
Global Research and Development Groton/New London Laboratories Eastern Point Road MS 8156-07
Groton, CT 06340
† Current Address: Department of Mechanical Engineering
University of Washington Stevens Way, Box 352600
Seattle, WA 98195
*Corresponding Author Oral Products Center of Excellence
Pfizer, Inc. Global Research and Development Groton/New London Laboratories Eastern Point Road MS 8156-07
Groton, CT 06340 Phone: (860) 686-2856
Fax: (860) 686-6509 email: [email protected]
Abstract
This paper describes a collaborative theoretical and experimental research effort to investigate the
performance of co-axial atomizers utilized in pharmaceutical tablet coating when atomizing common
tablet coating solutions under typical processing conditions. In pharmaceutically relevant applications, the
liquids being atomized are typically complex, non-Newtonian fluids which may contain polymers,
surfactants and large concentrations of insoluble solids in suspension. The goal of this investigation is to
produce a validated theoretical model capable making timely predictions of atomizer performance in
pharmaceutical tablet coaters. The Rayleigh-Taylor model developed by Varga et al. has been extended to
viscous and non-Newtonian fluids starting with the general dispersion relation developed by Joseph et al.
The theoretical model is validated using droplet diameter data collected with Phase Doppler Particle
Analysis. The primary output from the model is the Sauter Mean Diameter of the atomized droplets,
which is shown to compare favorably with experimental data. Critical model parameters and plans for
additional research are also identified.
Page 1 of 17
1. Introduction
The atomization of a liquid jet by a co-flowing, high-speed gas is a process of considerable
practical interest in many industrial settings. In particular, the atomization of liquids is utilized
extensively in a variety of pharmaceutical manufacturing processes. The role of atomization in
pharmaceutical manufacturing can be organized into two broadly defined categories. Some
pharmaceutical manufacturing processes utilize atomization to alter the in vivo performance of the active
pharmaceutical ingredient (API), often by modifying the bioavailability of the API itself. A common
manufacturing process of this type is spray drying. During spray drying, API and other excipients are
dissolved in solvents and the solution is atomized in a heated gas stream and dried to form powders
(Masters 1976). Research has shown that the size distribution of the atomized droplets coupled with the
operating parameters of the spray dryer can influence the morphology of the dried powder (Lin and Gentry
2003). Additionally, scale-up of the spray drying process is notoriously difficult due to the inability of
models to predict atomizer performance at different scales, especially for pharmaceutically relevant
solutions (Kremer and Hancock 2006; Oakley 2004). Thus, scale-up of this process can result in
unanticipated changes in the size and morphology of the dried powder which can deleteriously impact the
downstream manufacturing steps necessary to produce the final dosage form. Another example of a
pharmaceutical manufacturing process that utilizes atomization to alter the in vivo performance of the API
is spray congealing. In this process, the API is mixed with waxes and atomized, normally via a rotary
atomizer, with the goal of producing very small particles containing encapsulated API (Kawase and De
1982; Mackaplow et al. 2006). Encapsulation can modify the release profile of the API or target
dissolution of the encapsulated particle to specific regions of the gastrointestinal tract.
In the other category of applications, atomization is utilized to modify the appearance or improve
the in vivo performance of the final dosage form. The most common example of this type of process is
tablet coating, with a recent survey indicating that ~30% of pharmaceutical tablets manufactured in 2004
were coated (IMS MIDAS Database 2005). There are a number of reasons why such a large percentage of
pharmaceutical tablets are coated, which adds an additional unit operation to the manufacture of the final
dosage form. Non-functional tablet coatings improve the appearance and handling of tablets and may
protect against counterfeiting by improving brand recognition. Functional tablet coatings are applied to
mask unpleasant taste or alter the tablet dissolution profile either by controlling the rate of dissolution,
normally via semi-permeable membrane coatings, or by protecting the tablet from the acidic environment
of the stomach via enteric coatings. As is the case for spray drying, scale-up of the tablet coating process
is difficult as the operation also involves several coupled physical processes occurring simultaneously. In
addition to atomizing the coating solution, the tablet coating process involves mixing a bed of tablets as
well as drying the coating solution on the surface of the tablets resulting in the final solid coating.
Page 2 of 17
Pharmaceutical researchers have developed thermodynamic models to simulate the tablet coating process
and guide scale-up; however these models, while useful, make no attempt to predict atomizer performance
at different scales (am Ende and Berchielli 2005).
Atomization, and especially of air-blast atomization, is a complex multi-parameter problem. It
has, for this reason, eluded a clear physical understanding and general theoretical predictions of the droplet
size as a function of the injector geometry and fluid properties. A physical mechanism that stands up to
comparison with experimental evidence is a two-stage instability mechanism, a primary shear instability
followed by a Rayleigh-Taylor (R-T) instability of the liquid tongues produced by the primary instability
(Varga et al. 2003). In this scenario, the liquid jet diameter is practically irrelevant; the thickness of the
gas boundary layer at the injector exit determines the wavelength of the primary instability and the
subsequent fluid mass that is suddenly exposed to the gas stream and accelerated. For low viscosity fluids,
the R-T wavelength that determines the ligament size and hence the drop size depends on surface tension,
while viscous effects are negligible.
In pharmaceutically relevant applications, the liquids being atomized are typically complex, non-
Newtonian fluids which may contain polymers, surfactants and high concentrations of insoluble solids in
suspension. Tablet coating, regardless of the nature of the coating, and many pharmaceutical spray drying
operations utilize co-axial air blast atomizers (Muller and Kleinebudde 2006). Although the performance
of co-axial airblast atomizers has been studied extensively (Lasheras and Hopfinger 2000; Varga et al.
2003), very few of these investigations were focused on atomization of highly viscous or non-Newtonian
liquids (Mansour and Chigier 1995). In this paper, we describe a collaborative theoretical and
experimental research effort to investigate the performance of commercial co-axial atomizers utilized in
pharmaceutical tablet coating when atomizing common tablet coating solutions under typical processing
conditions.
As such, the goal of this investigation is to produce a validated theoretical model capable making
timely predictions of atomizer performance in pharmaceutical tablet coaters. Our theoretical study shows
that for viscous or non-Newtonian liquids, like many common tablet coating solutions, the R-T
wavelength is strongly affected by the high viscosity or the non-Newtonian behaviour of the solution.
Joseph et al. (Joseph et al. 2002) demonstrated this very clearly for viscoelastic liquid drops suddenly
exposed to a high-speed gas stream. In this study, The R-T model originally developed by Varga et al.
(Varga et al. 2003) is extended to viscous and non-Newtonian fluids starting with the general dispersion
relation developed by Joseph et al.(Joseph et al. 2002). The theoretical model is validated using data
collected with Phase Doppler Particle Analysis (PDPA). The primary output from the model is the Sauter
Mean Diameter of the atomized droplets, which is shown to compare favorably with experimental data.
Critical model parameters and plans for additional research are also identified.
Page 3 of 17
2. Description of Experiment
2.1 Experimental setup
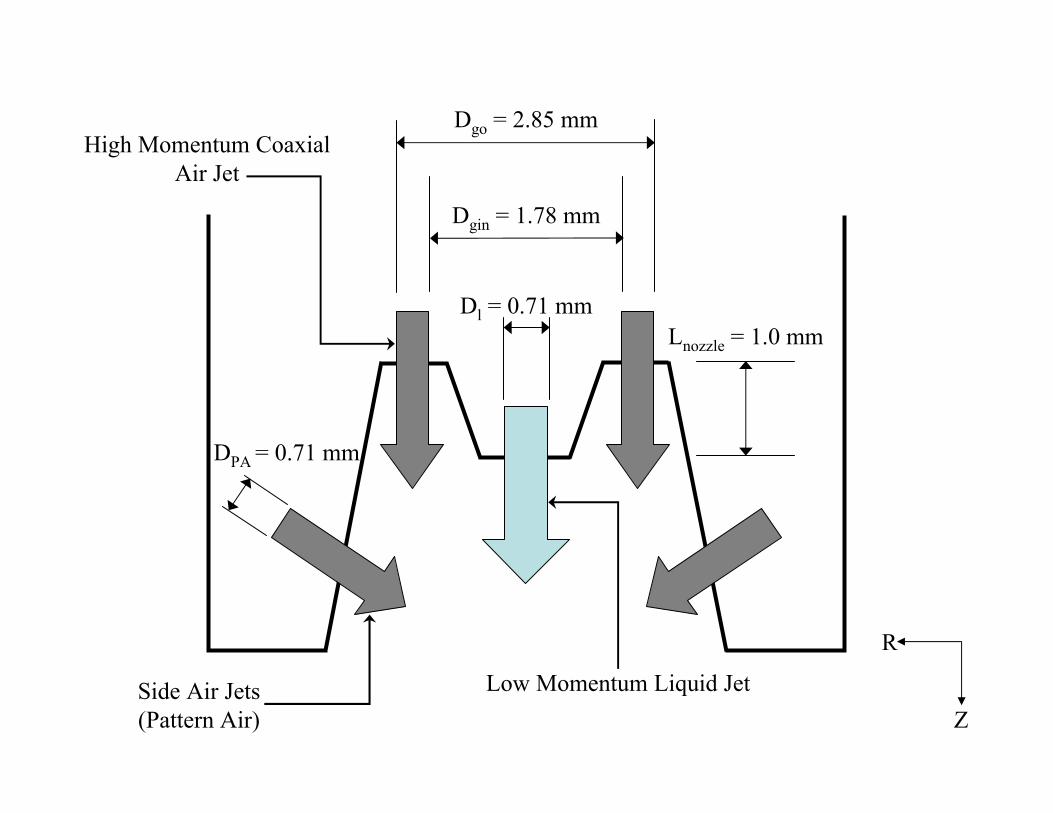
Atomization experiments were carried out using a Spraying Systems injector (1/8 JAC series with
gas cap PA11228-45-C, and liquid nozzle PF28100NB) which has a well-characterized geometry shown
in Fig. 1. The liquid was pressurized in a bladder tank, flowed through a calibrated flow metre and
injected through a small orifice at the centreline of the nozzle. Pressurized air was injected coaxially with
the liquid stream through an annular gap located at the base of the liquid nozzle. Between 10 and 20% of
the pressurized air flowed through auxiliary ports located in the periphery of the gas cap and oriented at a
45° to the main liquid and gas streams (see Fig. 1 for details). This pattern air induces an asymmetry in
the velocity field such that the cross section of the spray becomes elliptical. Additionally, the pattern air
plays an important role in the transport of small liquid droplets inside the spray, which will be discussed in
greater detail below. Further, because the pattern air merges with the main streams at a distance of more
than ten liquid diameters downstream of injection, it plays a negligible role in the liquid atomization
process which is dominated by a series of instabilities which form very close to the liquid nozzle
discharge. A sketch of the atomizer, depicting the relevant characteristics and length scales, is as shown in
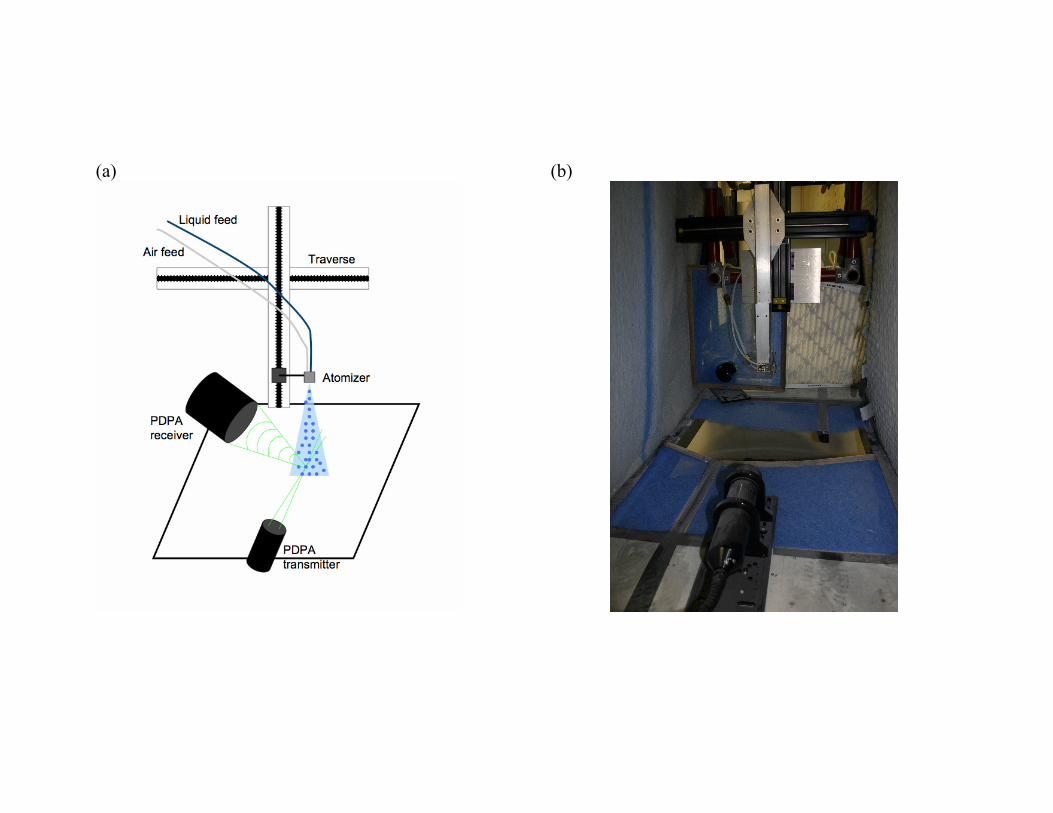
Figure 1 below. The air flow rate was measured by a flow metre and the outlet pressure was measured by
a pressure gage to correct for compressibility effects at the flow-meter outlet. The atomizer was secured
to a two-dimensional traverse system so that it could be precisely positioned with respect to the measuring
point along the radial and axial coordinates of the spray. Figure 2 presents a picture and sketch of the
experimental facility.
2.2 Droplet size and velocity measurements
The velocity and size of the droplets produced during atomization were measured by a Phase
Doppler Particle Analyzer (TSI Inc., Minneapolis, MN). A detailed description of this measurement
technique can be found elsewhere (Bachalo 1994). Briefly, the 514.5 nm beam from an Argon ion laser
was split and one of the beams passed through a Bragg cell which produced a 40 MHz frequency shift.
These two beams were then transported through fiber optics to the experimental setup where they cross,
forming an interferometry fringe pattern at the probe volume. Light scattered from the droplets crossing
through the beams’ intersection was acquired at three distinct points by the receiver and processed by
three photodetectors. The frequency and phase shift in the signal were extracted to compute the droplet
velocity and diameter, respectively. In these experiments, the receiver was placed at a 30º angle with the
transmitter to collect backscattered light and a 150 µm slit was used in order to reduce the probe volume
size. With the current optical setup the probe volume was 110 µm in diameter and 525 µm long, and the
resolution of the system allows the detection of droplets down to 1.5 µm in diameter.
Page 4 of 17
The PDPA system was positioned in such a way that the measurement volume was located on the
plane where the injector nozzle evolved. By using the two degrees of freedom of the traverse system, the
injector was moved relative to the probe volume. Thus, measurements were taken along different radial
and axial positions within a plane that cut diametrically across the spray. The origin of this plane was
located at the center of the liquid nozzle discharge, with the orientation of the coordinate system as
indicated in Fig. 1. The axial velocity and size of individual droplets flowing through the probe volume
were measured and statistically analyzed. The arithmetic mean velocity of the droplets and the Sauter
mean diameter (SMD) of the droplets were computed directly from the raw measurements using
MATLAB (Mathworks, Natick, MA).
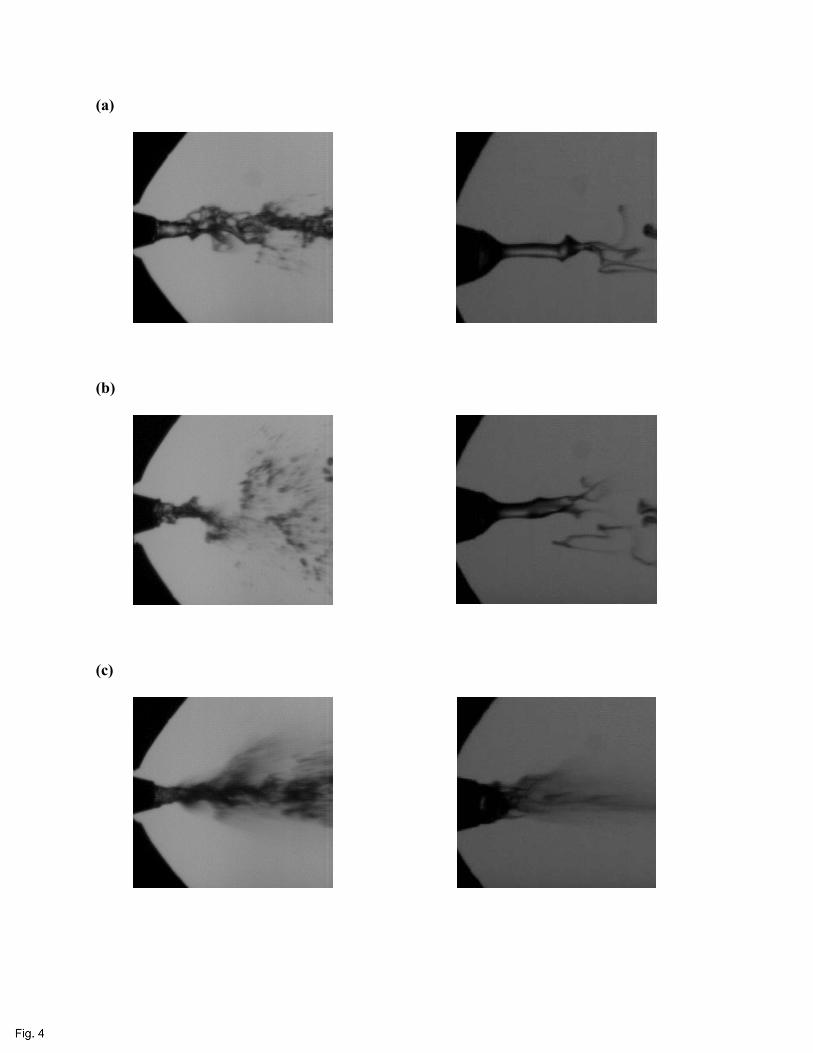
High-speed visualizations of the primary break-up process were captured by back-illuminating the
region of interest at the outlet of the liquid and gas jets. A Photron Fastcam 10k digital camera, at a
resolution of 256x240 pixels, was focused through a Nikor 65mm Micro lens on a 5 mm x 5 mm region
located at the outlet of the liquid nozzle. The camera operated at 1000 frames per second and the
illumination came from a Kodak stroboscopic light synchronized with the camera. Although the exposure
time of the camera was set at 1/2000 sec., the light pulses from the stroboscopic light were very short
(approx. 10 microseconds) so that the droplet motion was frozen and the sharpness in the resulting images
was enhanced. Images captured by this method for different experimental conditions are shown in Fig. 4.
2.3 Characterization of liquid rheology
Five fluids with rheologies of increasing complexity were utilized in this study, specifically water,
two glycerol-water mixtures, an Acetone/water/Polyethylene Glycol(PEG)/Cellulose Acetate (CA)
mixture and two Opadry™ II water-based solutions, Y-30-18037 and 85F18422 (Colorcon, West Point,
PA). The CA:PEG coating was prepared by adding 9% (w/w) CA and 1% PEG to a solution consisting of
3% water and 87% Acetone. Both Opadry™ solutions were aqueous; however Opadry™ A (Y-30-18037)
utilized 15% solids (w/w) while Opadry ™ B (85F18422) utilized 20% solids in solution.
The shear rate dependence of viscosity for the different fluids used in the atomization experiments
was measured on a Brookfield DVII+Pro digital cone and plate viscometer. The viscosity of water and
two different solutions of glycerol in water were tested to validate the procedure and check the viscometer
calibration. The measured values were constant across all values of shear rate tested, as expected for
Newtonian fluids. The rheology of three solutions of interest was also investigated within the range of
shear rates available. Surface tension was measured with a Cole Parmer EW-59951 tensiometer. This
system uses the du Nuoy ring method with a Platinum Iridium ring and a calibrated torque balance to
measure the surface tension of liquids in air. The density, surface tension and viscosity at different shear
rates of these fluids were measured prior to atomization and the results are given in Table 1 below.
Page 5 of 17
The data presented in Table 1 clearly shows that the Opadry™ solutions exhibit a strong non-
Newtonian behaviour. The other fluids had almost constant viscosity, with the variation in the different
measurements being attributable to slight internal heating at higher shear rates. The shear-thinning
(pseudoplastic) behaviour of the Opadry™ solutions was characterized for low and intermediate values of
the shear rate. The use of the highest measured shear rate viscosity in the atomization model yields a great
improvement over use of the low viscosity values, which would grossly overestimate the effect of
viscosity on atomization. The shear rate at the outlet from the nozzle is estimated to be higher than the
range tested here, thus it would be beneficial to measure the viscosity of the solutions at higher shear rates.
It is also important to note the large differences in surface tension, ranging from 22 mN/m for the acetone
based solution to 72 mN/m for water. This physical property has a very strong impact on atomization
dynamics. If the polymer solutions, which have the highest viscosity, did not have such low surface
tensions the resulting droplet size for these fluids would be orders of magnitude larger than water.
3. Atomization Model
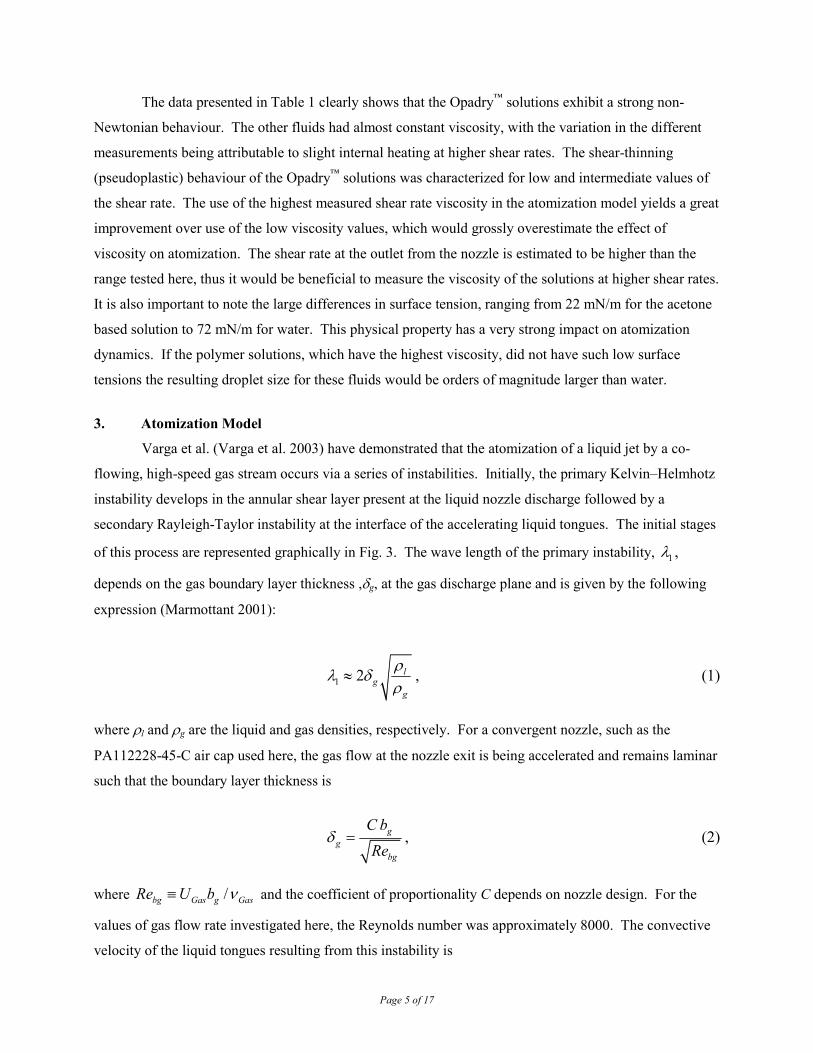
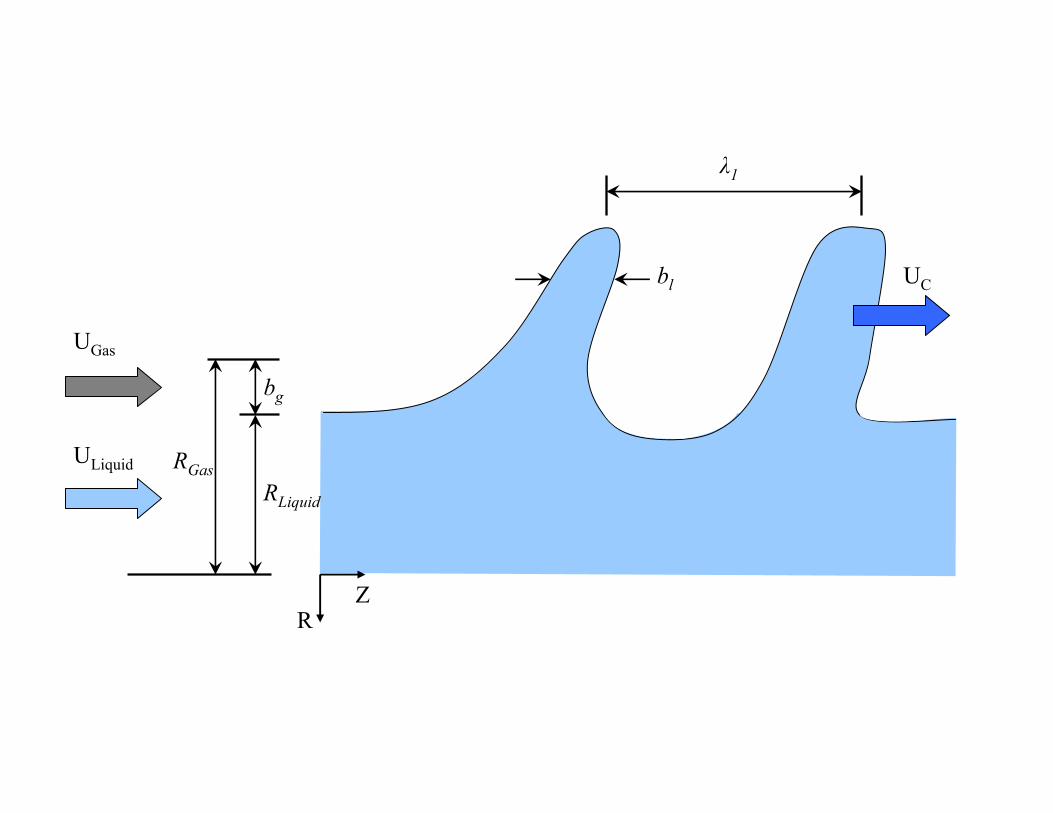
Varga et al. (Varga et al. 2003) have demonstrated that the atomization of a liquid jet by a co-
flowing, high-speed gas stream occurs via a series of instabilities. Initially, the primary Kelvin–Helmhotz
instability develops in the annular shear layer present at the liquid nozzle discharge followed by a
secondary Rayleigh-Taylor instability at the interface of the accelerating liquid tongues. The initial stages
of this process are represented graphically in Fig. 3. The wave length of the primary instability, 1λ ,
depends on the gas boundary layer thickness ,δg, at the gas discharge plane and is given by the following
expression (Marmottant 2001):
1 2 lg
g
ρλ δρ
≈ , (1)
where ρl and ρg are the liquid and gas densities, respectively. For a convergent nozzle, such as the
PA112228-45-C air cap used here, the gas flow at the nozzle exit is being accelerated and remains laminar
such that the boundary layer thickness is
g
gbg
C bRe
δ = , (2)
where /bg Gas g GasRe U b ν≡ and the coefficient of proportionality C depends on nozzle design. For the
values of gas flow rate investigated here, the Reynolds number was approximately 8000. The convective
velocity of the liquid tongues resulting from this instability is
Page 6 of 17
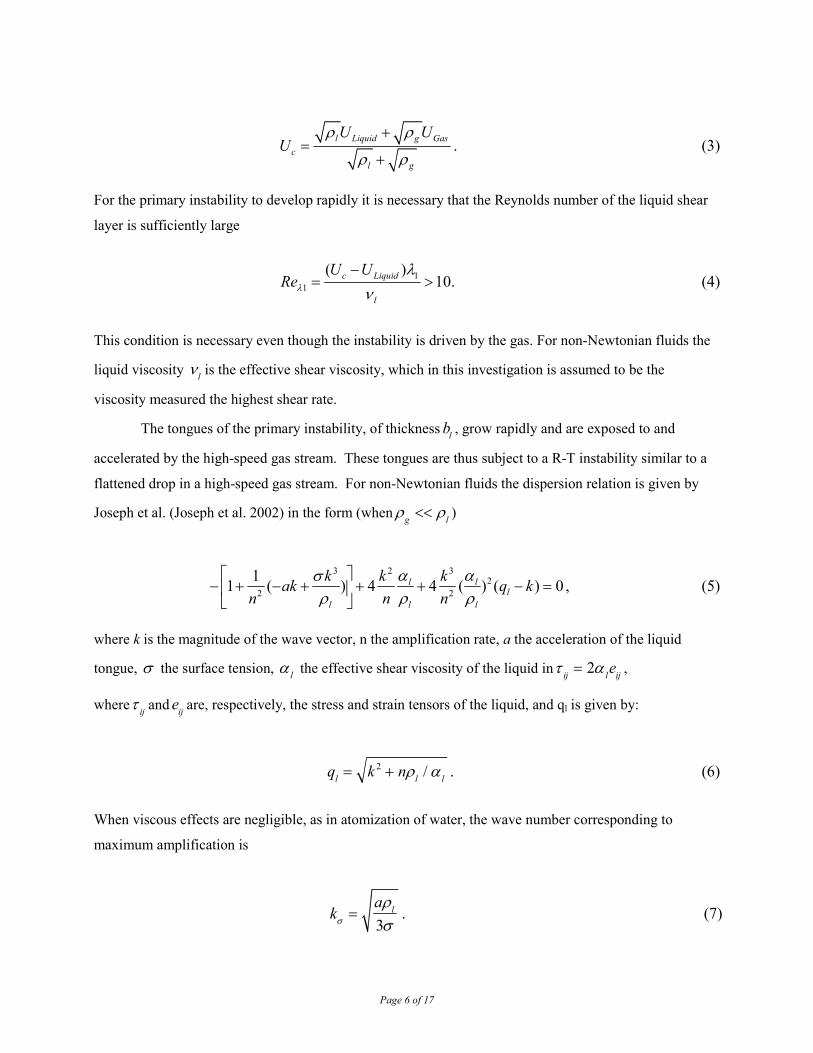
l Liquid g Gasc
l g
U UU
ρ ρ
ρ ρ
+=
+. (3)
For the primary instability to develop rapidly it is necessary that the Reynolds number of the liquid shear
layer is sufficiently large
1
1
( )10.c Liquid
l
U UReλ
λν
−= > (4)
This condition is necessary even though the instability is driven by the gas. For non-Newtonian fluids the
liquid viscosity ν l is the effective shear viscosity, which in this investigation is assumed to be the
viscosity measured the highest shear rate.
The tongues of the primary instability, of thickness bl , grow rapidly and are exposed to and
accelerated by the high-speed gas stream. These tongues are thus subject to a R-T instability similar to a
flattened drop in a high-speed gas stream. For non-Newtonian fluids the dispersion relation is given by
Joseph et al. (Joseph et al. 2002) in the form (when ρg << ρl )
3 2 32
2 2
11 ( ) 4 4 ( ) ( ) 0l ll
l l l
k k kak q kn n n
α ασρ ρ ρ
⎡ ⎤− + − + + + − =⎢ ⎥⎣ ⎦
, (5)
where k is the magnitude of the wave vector, n the amplification rate, a the acceleration of the liquid
tongue, σ the surface tension, α l the effective shear viscosity of the liquid inτ ij = 2α leij ,
where τ ij and
eij are, respectively, the stress and strain tensors of the liquid, and ql is given by:
ql = k 2 + nρl /α l . (6)
When viscous effects are negligible, as in atomization of water, the wave number corresponding to
maximum amplification is
kσ =aρl
3σ. (7)
Page 7 of 17
When viscous terms are important, as is the case for the water-glycerol mixtures and the tablet coating
solutions under investigation here, α l is large and it can be assumed that 2l
l
nkρα
<<1 such that
1( )2
l
l
nq kkρα
− ≈ in Eq. (6). The simplified dispersion relation from Eq. (5) then reads:
2 4 2 3
2/ ( )l l
l l l
k k kn kaα α σρ ρ ρ
= − + − − − . (8)
Disturbances will grow when the second term in Eq. (8) is positive and larger than the first term. It is
useful to rewrite equation Eq. (8) in the form:
n =k 2α l
ρl
1+aρl
2
k3α l2 −
σρl
kα l2
⎛
⎝⎜
⎞
⎠⎟
1/ 2
−1⎡
⎣
⎢⎢
⎤
⎦
⎥⎥
. (9)
From Eq. (9) it is seen that the amplification rate is zero when k =aρl
σ, which is the capillary cut-off
wave number, and when k = 0. The wave number of maximum amplification is given by the third order
equation
4α l
2
ρl2 k3 −
3σρl
k 2 + a = 0 . (10)
The exact solution of this equation is too complex to be of practical interest. However, for the high
viscosity fluids studied, the Ohnesorge number based on the wave length is large and the second term in
Eq. (10) is small compared to the first one, so that the wave number of maximum amplification is:
2
3max 2l
l
ak ρα
≈ . (11)
Page 8 of 17
The R-T wavelength is max
2RT k
πλ = and ultimately the droplet diameter is a fraction of
λRT (Varga et al. 2003). Therefore, assuming viscous and surface tension effects are additive to the
leading order according to the dispersion relation, we look for a correlation in the form:
λRT = 2π 3σaρl
+ C2
α l2
aρl2
3⎡
⎣⎢⎢
⎤
⎦⎥⎥
. (12)
The acceleration a in (12) is simply l
F Fam Vρ
= = , where the force F is the drag force exerted by the gas
stream on a liquid element, here the liquid tongue of the primary instability,
21 ( )
2 D g Gas c eF C U U Aρ= − (13)
where CD ≈ 2 is the drag coefficient and Ae the projected area. The mass of the liquid to be accelerated is
m = ρlbl Ae with bl ∝ λ1 . The expression for a is therefore given by:
2( )g Gas c
l l
U Ua
bρ
ρ−
≈ . (14)
Substitution of Eq. (14) in Eq. (12) gives:
1/ 2 1/ 6 1/32 2'122
1
( )1
( )g g c l
RTg g c l
U UC
U Uρ ασλλ
ρ λσ ρ σ
⎛ ⎞⎛ ⎞ ⎧ ⎫− ⎧ ⎫⎪ ⎪⎜ ⎟∝ +⎜ ⎟ ⎨ ⎬ ⎨ ⎬⎜ ⎟ ⎜ ⎟− ⎪ ⎪ ⎩ ⎭⎩ ⎭⎝ ⎠ ⎝ ⎠. (15)
Further substituting for λ1 from Eq. (1) and using Eq. (2) and taking the drop diameter, say the Sauter
Mean Diameter (SMD), proportional to λRT gives:
1/ 4 1/ 6 1/121/ 2
1/6 2 /31 2
/ 1(1 ) 1/
g l g bglr Dl
l l bg g l gDl
b ReDSMD C m C We OhD D Re bWe
ρ ρρ ρ
⎧ ⎫⎛ ⎞ ⎛ ⎞ ⎛ ⎞⎛ ⎞ ⎪ ⎪= + +⎜ ⎟ ⎜ ⎟ ⎜ ⎟⎨ ⎬⎜ ⎟ ⎜ ⎟ ⎜ ⎟ ⎜ ⎟⎝ ⎠ ⎪ ⎪⎝ ⎠ ⎝ ⎠ ⎝ ⎠⎩ ⎭. (16)
In Eq. (16), the mass loading effect in the form (1+ rm ) is obtained from energy arguments
previously outlined by Mansour and Chigier (Mansour and Chigier 1995), where
Page 9 of 17
l Liquid llr
g g Gas g
U Ammm U A
ρρ
= = and Al and Ag are the areas of the liquid and gas nozzle exit sections, respectively.
Furthermore, this equation indicates a dependency of the SMD on 5/ 4GasU − andσ −1/ 2 . The drop diameter
increases with bg
1/ 4 if the coefficient of proportionality C in Eq. (3) remains constant when bg is changed.
As will be shown below, this would only be the case if the length of the gas jet potential cone is much
larger than the liquid jet’s intact length which is not typical of atomizers designs.
The SMD in Eq. (16) has been made dimensionless by the liquid diameter Dl and the Weber and
Ohnesorge numbers are based on Dl following the usual convention. However, it should be emphasized
that the drop diameter does not depend on liquid diameter but rather on the gas boundary layer thickness at
the nozzle exit. This has been clearly demonstrated by Varga et al. (Varga et al. 2003) where the liquid
diameter was changed by a factor of 3 and the drop diameter remained practically identical for the same
gas flow conditions.
For completeness, the various non-dimensional parameters in Eq (16) are defined as follows:
Weber number:2( )g Gas c l
Dl
U U DWe
ρσ−
= ,
Ohnesorge number: Oh =α l
ρlσDl
, (17)
Reynolds number: Gas gbg
g
U bRe
ν= ,
Mass flux ratio: l Liquid lr
g Gas g
U Am
U Aρρ
= .
The coefficients C1 and C2 in Eq. (16) are order 1 and values for both coefficients are determined
from experiments. The value of C1 depends on the gas nozzle geometry in general, and on the contraction
ratio in particular, because for a given nozzle size the gas boundary layer thickness at the liquid nozzle
discharge depends strongly on the contraction ratio. C2 characterizes the viscosity dependence of the
critical wavenumber in the R-T instability, compared to the surface tension dependence. This value is
associated to the additivity and linearity of both cohesive effects, surface tension and viscosity, which
Page 10 of 17
determine the growth rate of the instability. The validity of the linear theory for R-T instability has been
confirmed for a wide parameter range via qualitative observation of the jet break-up process.
Another important parameter, which does not appear explicitly in Eq. (16), is the dynamic
pressure ratio M that determines the rate of atomization and hence the intact length of the liquid stream
(Lasheras & Hopfinger, 2000). This ratio is defined as
2
2g Gas
l Liquid
UM
Uρρ
= . (18)
The dimensionless intact length of the liquid stream can be defined as LDl
≈6M
and in the
present investigation M is typically large (of the order 100). The gas potential cone length is
approximately 6bg . For efficient atomization it is desirable that the gas potential cone length is equal or
larger than the liquid intact length so that the primary atomization is completed before the gas velocity
starts to decrease. This requirement is expressed by
bg MDl
> 1. (19)
It is worth noting that for the flow rates and atomizer utilized in this investigation, Eq. (19) is
satisfied easily, with values typically exceeding 10, strongly suggesting that atomization in pharmaceutical
tablet coating is typically quite rapid and efficient. Finally, the fluid jets under the conditions of interest
here are laminar, but would potentially become turbulent if the flow rates are significantly increased.
Turbulent conditions of the liquid stream at the nozzle discharge plane would have little effect on the
atomization process, while turbulent conditions in the high-speed gas stream would require altering the
exponent of Rebg in Eq (16).
4. Rheological properties
The non-Newtonian behaviour in Eq. (5) is expressed by the effective viscosity, lα relating the
stress tensor with the strain tensor
2ij l ijeτ α= . (20)
Page 11 of 17
Mansour & Chigier (Mansour and Chigier 1995) considered air-blast atomization of power law liquids
with the shear viscosity of the form: 1m
ls lα µ γ −= . (21)
In Eq. (21), the subscript s is added to distinguish shear dependent viscosity from elongation strain
dependent viscosity. Although elongational strain is dominant within the liquid nozzle (Mansour and
Chigier 1995), during atomization shear is anticipated to be much larger than elongational strain. When m
= 1 in Eq. (21) the shear viscosity is just the liquid viscosity, for m <1 the liquid is shear thinning for m>1
it is shear thickening. An estimate of the shear rate in the atomization process is given by 1/cU λ such
that lα in (16) may be replaced by 11( / )m
l cB Uµ λ − where B is a constant to be determined from
experiments.
In the simplest rheological model of the fluids used, we can assume the Non-Newtonian behaviour
will manifest in three different stages according to the value of the local shear rate experienced by the
fluid. For very low shear rates, viscosity can be modelled by an inverted parabola α = µ0 1−γγ 0
⎛
⎝⎜⎞
⎠⎟⎡
⎣⎢
⎤
⎦⎥
2
.
For an intermediate range of shear rates, the fluid behaviour is captured by the classical power law
α = µ1γγ 1
⎛⎝⎜
⎞⎠⎟
m−1
. Finally, for the largest values of the shear rate viscosity assumes an asymptotic value
that can be established from the end of the validity of the power law. Typically this asymptotic behaviour
determines the effective viscosity for the break-up process µ∞, as the fluid been atomized is subjected to
very large shear deformations (Mansour and Chigier 1995). Thus, the value of viscosity obtained at the
largest shear rate is utilized for the model. This value represents a conservative estimate of the shear
during atomization, but avoids extrapolation based on the power law constitutive law outside the range of
shear rates tested. Despite this simplifying assumption the model data will be shown to compare
favourably with experimental data.
5. Results and Discussion
5.1 Qualitative observations
Images of liquid jet break-up are shown in Fig. 4, for several Weber and Reynolds numbers for
both the water and the 85% glycerol-water solutions. The glycerol-water mixture is of interest because it
allows determination the coefficient C2 in Eq. (16) and elucidates the effect of viscosity on the atomization
process. The value of the coefficient C2 is found by estimating the wavelength of the R-T instability using
Page 12 of 17
image processing. For the range of parameters and atomizer geometry studied, C2 was found to be equal
to 1.
5.2 Effect of Pattern Air
The model for the break-up of the liquid jet into droplets does not take into account the existence
of the two side jets that inject the pattern air into the spray. The geometry of the atomizer used in this
investigation is such that the pattern air impinges on the main stream at a distance downstream that is large
compared to the break-up length. As was discussed previously, the growth of the R-T instability whose
wavelength ultimately determines the droplet size is assumed to take place in the potential cone of the
main gas jet, a condition which is necessary for efficient atomization. For the conditions under
investigation here, this distance is typically of the order of 3 mm. The impinging distance of the pattern
air, based on the atomizer geometry, is ~7 mm. For visual reference, the axial extent of the images shown
in Fig 4. is 5mm, so the pattern air jets impinge downstream of the field of view shown. Therefore, the
effect of the pattern air can be neglected in the break-up model which determines the droplet SMD, but the
pattern air plays an important role in the transport of the droplets of different sizes.
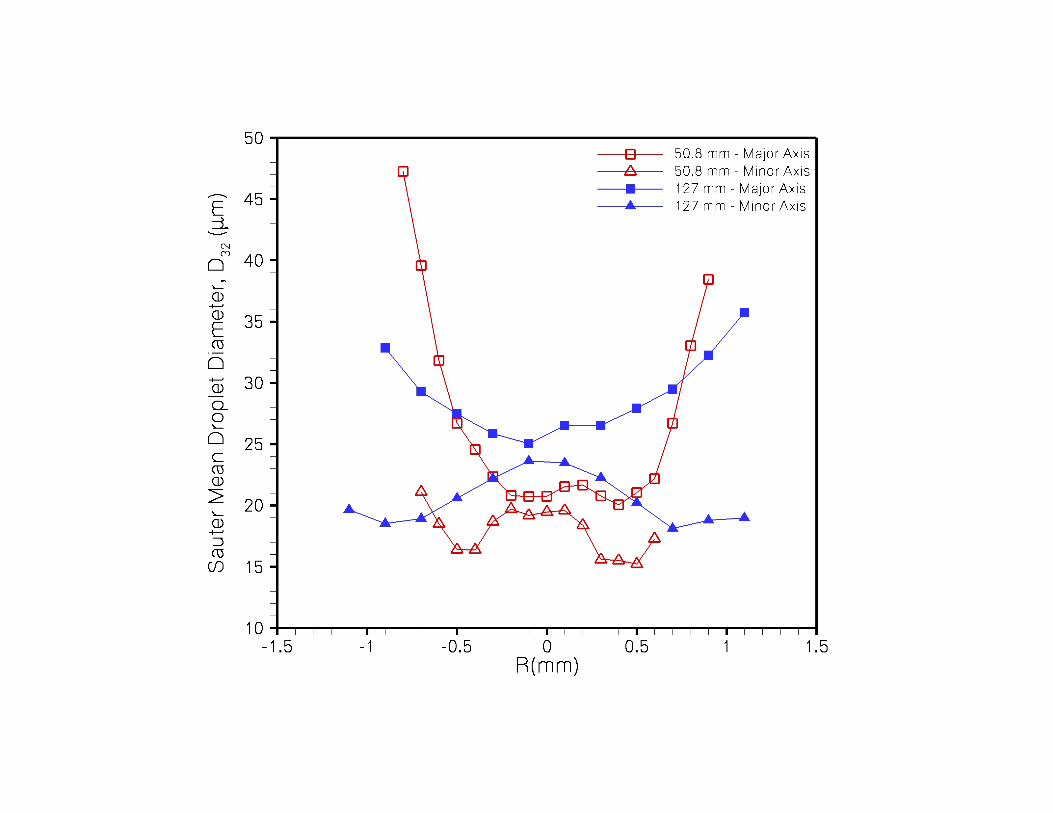
The pattern air induces an asymmetry in the velocity field of the spray such that the cross section
becomes elliptical rather than the circular cross section typical of a co-axial atomizer. The patterned spray
is narrower along the axis of the side jets, where the pattern air momentum forces the spray inwards
(minor axis of the ellipse), and broader in the perpendicular axis (major axis of the ellipse). This is shown
clearly in Fig. 5, where the droplet SMD distribution is plotted for both the minor and major axis, at two
distances downstream of the atomizer. To generate the data presented in Fig. 5 water was atomized using
a gas flow rate of 59.5 SLPM using the atomizer detailed in Fig. 1. The effect of the pattern air on the
droplet size distribution is rather complicated. The size distribution is concave along the major axis with
larger droplets found at increasing radial distances from the center of the atomizer, due primarily to the
tendency of larger droplets to conserve radial momentum longer than smaller droplets. A contrary
situation occurs along the minor axis, where the effect of the side jets is more noticeable for the larger
droplets that are subject to higher aerodynamic focusing towards the center of the spray axis due to their
larger inertia and lower diffusivity. The smallest droplets quickly adjust to the local gas velocity,
minimizing any local perturbation inflicted by the pattern air. This explains the convex shape of the
diameter distribution found along the cross section minor axis. Furthermore, some large droplets acquire a
significant radial velocity component as they interact with the pattern air and, because of their large
inertia, do not lose that momentum as they cross the spray’s axis. These droplets are found in relatively
high proportion at the outskirts of the jet, where the droplet number density is low and a small number of
very large droplets have a significant impact on the average diameter of the distribution. This explains the
Page 13 of 17
change from convex to concave in the diameter radial distribution. Note that the inflexion point associated
with this change in character moves outwards from the spray’s axis with distance downstream, as one
would expect the large droplets to continue to move radially, occupying the outer region of the spray.
This inhomogeneity in the diameter distribution along the radial coordinate in the spray was found
consistently for all fluids tested.
5.3 Droplet size measurements and comparison with model prediction
Predictions from the quantitative model were compared with experimental results for the five fluids
discussed previously. Conditions for the atomization experiments were invariant over the range of fluids
tested, and were conducted using a liquid flow rate of 10 g/min and a gas flow rate of 59.5 SLPM. For the
atomizer and flow rates utilized in this investigation, this results in a gas velocity in the annular gap at the
base of the liquid nozzle of ~220 m/s and the velocity of the liquid stream was approximately 0.4 m/s.
The dynamic pressure ratio, M, for water was ~317 which was a typical value over the range of fluids
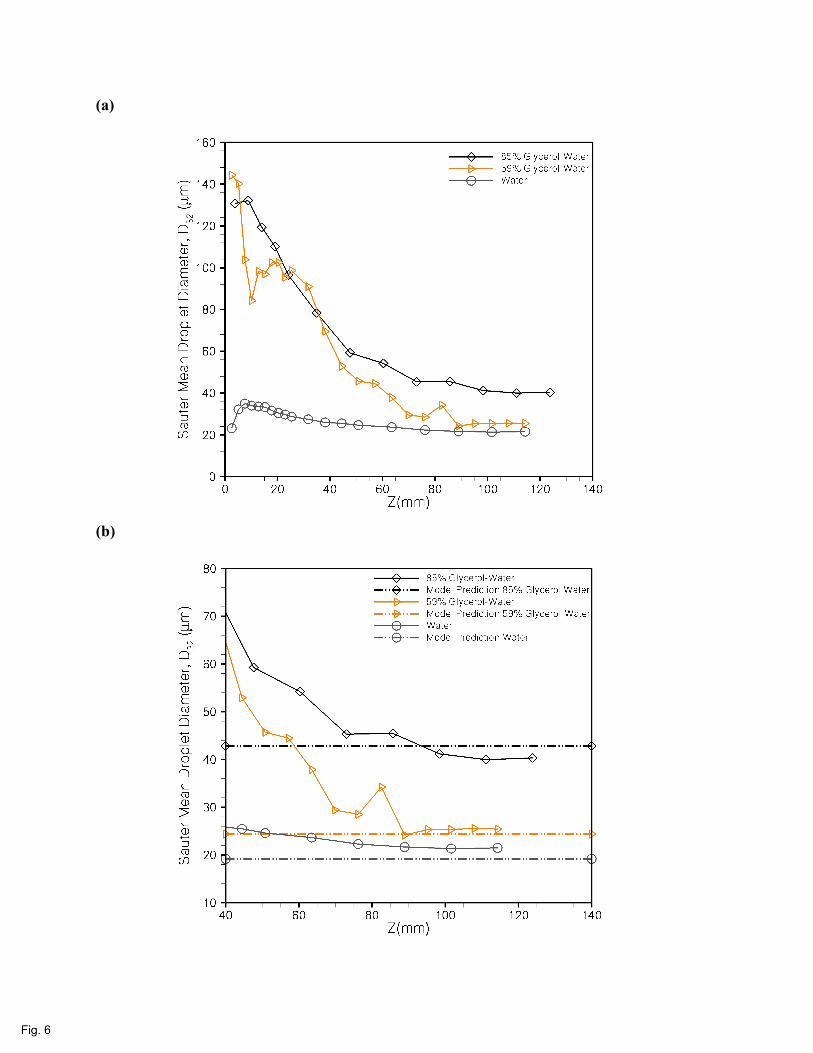
under the conditions of interest here. The data from water and the two glycerol-water mixtures, shown in
Fig. 6, was used to validate the model and to determine if appropriate values were assigned to the two
adjustable constants in the model. As Fig. 6b demonstrates, setting both constants equal to 1 produces
acceptable model predictions for conditions of efficient atomization and a laminar gas-stream boundary
layer. The values of droplet SMD predicted by the model are 19 µm for water, 24 µm for 59% glycerol-
water and 43 µm for 85% glycerol-water. It is important to emphasise that the model is predicting the
droplet SMD after the atomization process is complete, which generally occurs at an axial distance of
~50mm downstream from the atomizer. Upstream of the completion of atomization large droplets and
ligaments are present that affect the PDPA measurement of SMD. In pharmaceutical tablet coating the
distance from the atomizer to the tablet bed is generally greater than 100 mm and does vary somewhat
depending on the scale and manufacturer of the equipment.
The kinematic viscosity of the 59 % and 85 % glycerol-water mixtures are approximately 10 and
65 times that of water. It can be seen in Fig. 6 that the droplet SMD is not affected when the kinematic
viscosity is ten times that of water; however the droplet SMD becomes noticeably larger when the
viscosity is of the order of sixty-five times that of water. This behaviour is well represented by the
additive terms in Eq. (15). When viscosity is low, the first term, which depends solely on surface tension,
is dominant and the dependence on viscosity is negligible. When viscosity is high, however, the term
multiplying C2 is much larger and the dependency on surface tension becomes weaker, resulting in a
dominant contribution from the viscous term. Additionally, increasing viscosity also increases the
distance at which atomization is complete, due to fact that both the primary and secondary instabilities
growth slower when the viscosity is large. Variation of the droplet SMD with increasing effective
Page 14 of 17
viscosity was found to be well captured by the additive dependency of the Ohnesorge and the Weber
numbers incorporated within the model.
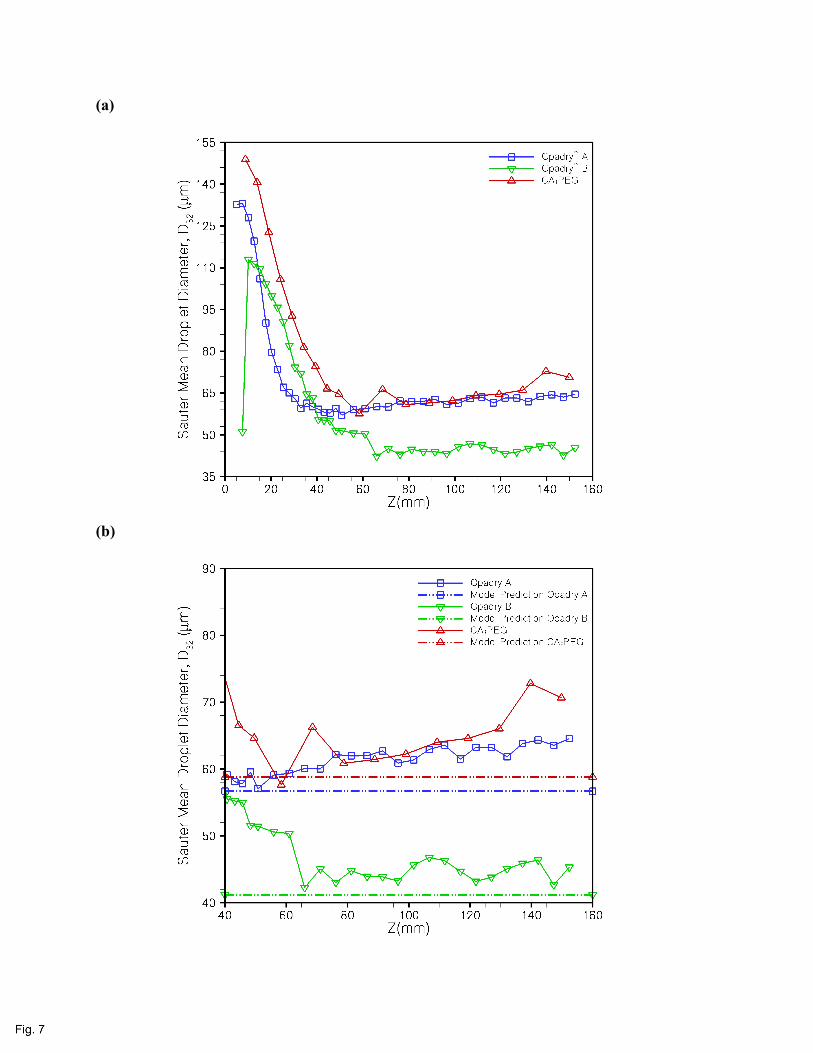
Data for the three tablet coating solutions is presented in Fig 7. The values of SMD predicted by the
model were 59 µm for CA-PEG, 57 µm for Opadry™ A and 41 µm for Opadry™ B. These values
compared favorably with the experimental values measured at downstream from the injector after
atomization is complete, see Fig 7b for details.
6. Conclusions
This work presents a model developed to predict the performance of co-axial atomizers utilized in
pharmaceutical tablet coating when atomizing common tablet coating solutions under typical processing
conditions. This model has been validated using fluids of increasing rheological complexity. Output from
the model is the SMD of the atomized droplets after completion of atomization. The model results were
found to compare favorably with experimental data over the range of fluids tested. In addition,
development of the model has yielded useful insights into the characteristics and performance of the
atomizers frequently encountered in pharmaceutical tablet coating. For example, this investigation has
clearly demonstrated that, for typical processing conditions, pattern air plays a negligible role in the
atomization process, which occurs via a series of instabilities which form very close to the atomizer
discharge plane. However, the patter air was shown to play an important role in the transport of droplets
within the spray.
This work has also identified areas which require further investigation. Several of the fluids under
investigation here are non-Newtonian, and the range of shear rates at which viscosity was measured is
below what would be encountered during atomization. Clearly, characterization of the rheological
properties of the fluids at conditions which more closely approximate the atomization process would be
expected to improve the accuracy of this model. However, the results presented here suggest that the
current model is capable of making timely predictions of atomizer performance in pharmaceutical tablet
coaters, and offers a practical tool to guide scale-up and optimization in these systems.
Acknowledgements
Helpful discussions concerning tablet coating were held with several Pfizer colleagues,
specifically A. G. Thombre, B. A. Johnson and P. E. Luner. The support of this research by the
management of Pfizer Global Research and Development (S. M. Herbig, C. A. Oksanen and C. M. Sinko)
is gratefully acknowledged. Finally, J. Rodriguez at UCSD offered valuable assistance with several
aspects of this project.
Page 15 of 17
REFERENCES
am Ende, M. T., and Berchielli, A. (2005). "A Thermodynamic Model for Organic and Aqueous Tablet Film Coating." Pharmaceutical Development and Technology, 10, 47-58. Bachalo, W. D. (1994). "Experimental Methods in Multiphase Flows." International Journal of Multiphase Flow, 20, 261-295. IMS Midas Database, 2005. IMS Health, CT, USA. Joseph, D. D., Beaver, G. S., and Funada, T. (2002). "Rayleigh-Taylor Instability of Viscoelastic Drops at High Weber Numbers." Journal of Fluid Mechanics, 453, 109-132. Kawase, Y., and De, A. (1982). "Ligament-Type Disintegration of Non-Newtonian Fluid in Spinning Disk Atomization." Journal of Non-Newtonian Fluid Mechanics, 10, 367-371. Kremer, D. M., and Hancock, B. C. (2006). "Process Simulation in the Pharmaceutical Industry: A Review of Some Basic Physical Models." Journal of Pharmaceutical Sciences, 95(3), 517-529. Lasheras, J. C., and Hopfinger, E. J. (2000). "Liquid Jet Instability and Atomization in a Coaxial Gas Stream." Annual Review of Fluid Mechanics, 32, 275-308. Lin, J.-C., and Gentry, J. W. (2003). "Spray Drying Drop Morphology: Experimental Study." Aerosol Science and Technology, 37, 15-32. Mackaplow, M. B., Zarraga, I. E., and Morris, J. F. (2006). "Rotary spray congealing of a suspension: Effect of disk speed and dispersed particle properties." Journal of Microencapsulation, 23, 793-809. Mansour, A., and Chigier, N. (1995). "Air-blast Atomization of non-Newtonian Liquids." Journal of Non-Newtonian Fluid Mechanics, 58, 161-194. Marmottant, P. (2001). "Atomisation d’un courant liquide dans un courant gazeux," Ph.D. Thesis, Institut National Polytechnique de Grenoble, Grenoble. Masters, K. (1976). Spray Drying: an introduction to principles, operational practice and applications, Wiley, New York. Muller, R., and Kleinebudde, P. (2006). "Comparison Study of laboratory and production spray guns in film coating: Effect of pattern air and nozzle diameter." Pharmaceutical Development and Technology, 11, 425-435. Oakley, D. E. (2004). "Spray Dryer Modeling in Theory and Practice." Drying Technology, 22(6), 1371-1402. Varga, C. M., Lasheras, J. C., and Hopfinger, E. J. (2003). "Initial Breakup of a Small-Diameter Liquid Jet by a High Speed Gas Stream." Journal of Fluid Mechanics, 497, 405-434.
Page 16 of 17
Tables
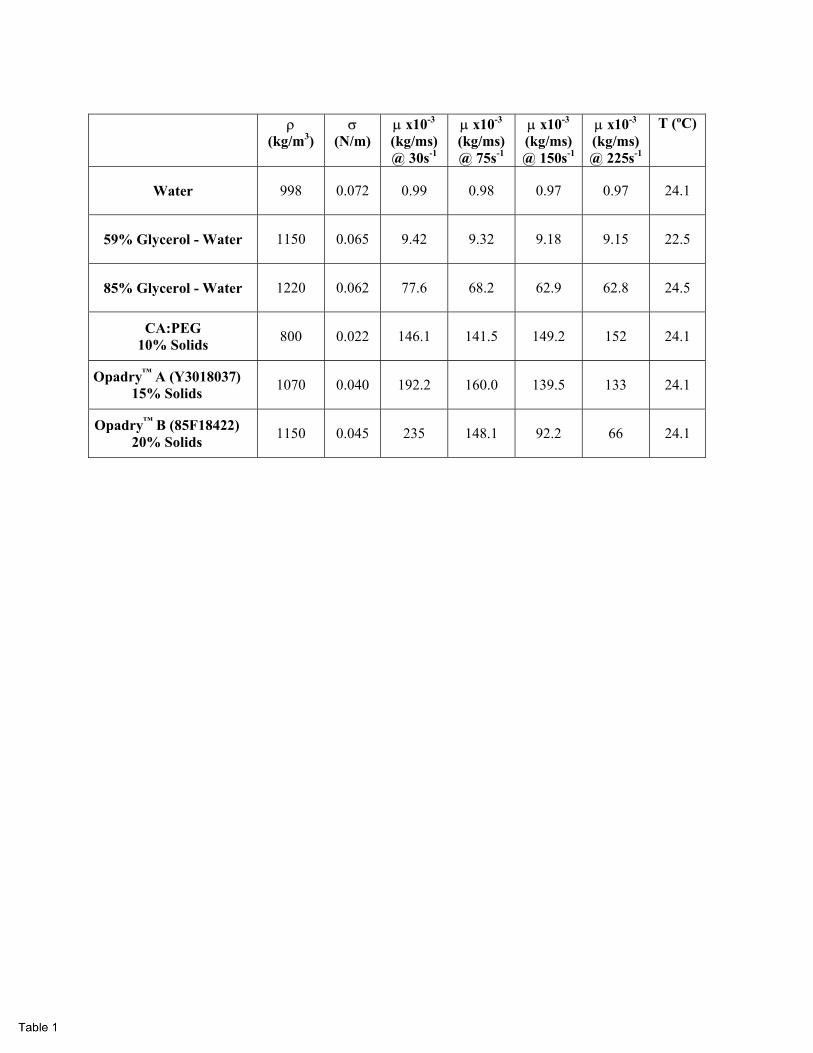
Table 1 – Physical and rheological properties of the fluids utilized in the atomization experiments.
ρ
(kg/m3) σ
(N/m) µ x10-3 (kg/ms) @ 30s-1
µ x10-3 (kg/ms) @ 75s-1
µ x10-3 (kg/ms) @ 150s-1
µ x10-3 (kg/ms) @ 225s-1
T (ºC)
Water 998 0.072 0.99 0.98 0.97 0.97 24.1
59% Glycerol - Water 1150 0.065 9.42 9.32 9.18 9.15 22.5
85% Glycerol - Water 1220 0.062 77.6 68.2 62.9 62.8 24.5
CA:PEG 10% Solids 800 0.022 146.1 141.5 149.2 152 24.1
Opadry™ A (Y3018037) 15% Solids 1070 0.040 192.2 160.0 139.5 133 24.1
Opadry™ B (85F18422) 20% Solids 1150 0.045 235 148.1 92.2 66 24.1
Page 17 of 17
Figures
Figure 1 – Atomizer schematic. Figure 2 – (a) Sketch and (b) photograph of the atomization experiment. Figure 3 – Sketch of the primary instability in the liquid stream caused by the high-speed, co-axial air
stream. Figure 4 – High-speed visualizations of the atomization process for water (left) and 85% glycerol-water
(right) at various atomization conditions. (a) DlWe = 60; (b) DlWe = 153; (c) DlWe = 640. Figure 5 – Sauter Mean Diameter of water droplets as a function of radial position at two distances
downstream of the injector. Figure 6 – Sauter Mean Diameter of water and the two glycerol-water mixtures downstream of the
atomizer. (a) entire field of view; (b) detail view showing completion of atomization and model prediction.
Figure 7 - Sauter Mean Diameter of three tablet coating solutions downstream of the atomizer. (a) entire
field of view; (b) detail view showing completion of atomization and model prediction.
DPA = 0.71 mm
Dgo = 2.85 mm
Dgin = 1.78 mm
Dl = 0.71 mm
High Momentum CoaxialAir Jet
Side Air Jets(Pattern Air)
Low Momentum Liquid Jet
Lnozzle = 1.0 mm
Z
R
(a)
(b)
bg
ZR
RLiquid
ULiquid
UGas
RGas
λ1
UCbl
(a)
(b)
(c)
(a)
(b)
(a)
(b)