atomistic theory for the damping of vibrational modes in ... · substrate. as a specific example,...
TRANSCRIPT
General rights Copyright and moral rights for the publications made accessible in the public portal are retained by the authors and/or other copyright owners and it is a condition of accessing publications that users recognise and abide by the legal requirements associated with these rights.
Users may download and print one copy of any publication from the public portal for the purpose of private study or research.
You may not further distribute the material or use it for any profit-making activity or commercial gain
You may freely distribute the URL identifying the publication in the public portal If you believe that this document breaches copyright please contact us providing details, and we will remove access to the work immediately and investigate your claim.
Downloaded from orbit.dtu.dk on: May 02, 2020
Atomistic theory for the damping of vibrational modes in monoatomic gold chains
Engelund, Mads; Brandbyge, Mads; Jauho, Antti-Pekka
Published in:Physical Review B Condensed Matter
Link to article, DOI:10.1103/PhysRevB.80.045427
Publication date:2009
Document VersionPublisher's PDF, also known as Version of record
Link back to DTU Orbit
Citation (APA):Engelund, M., Brandbyge, M., & Jauho, A-P. (2009). Atomistic theory for the damping of vibrational modes inmonoatomic gold chains. Physical Review B Condensed Matter, 80(4), 045427.https://doi.org/10.1103/PhysRevB.80.045427

Atomistic theory for the damping of vibrational modes in monoatomic gold chains
M. Engelund,1,* M. Brandbyge,1 and A. P. Jauho1,2
1Department of Micro and Nanotechnology, DTU Nanotech, Technical University of Denmark, Ørsteds Plads,Bldg. 345E, DK-2800 Kongens Lyngby, Denmark
2Department of Applied Physics, Helsinki University of Technology, P.O. Box 1100, Helsinki FI-02015 TKK, Finland�Received 17 April 2009; revised manuscript received 30 June 2009; published 30 July 2009�
We develop a computational method for evaluating the damping of vibrational modes in monatomic metallicchains suspended between bulk crystals under external strain. The damping is due to the coupling between thechain and contact modes and the phonons in the bulk substrates. The geometry of the atoms forming thecontact is taken into account. The dynamical matrix is computed with density-functional theory in the atomicchain and the contacts using finite atomic displacements while an empirical method is employed for the bulksubstrate. As a specific example, we present results for the experimentally realized case of gold chains in twodifferent crystallographic directions. The range of the computed damping rates confirms the estimates obtainedby fits to experimental data �T. Frederiksen et al., Phys. Rev. B 75, 205413 �2007��. Our method indicates thatan order-of-magnitude variation in the harmonic damping is possible even for relatively small changes in thestrain. Such detailed insight is necessary for a quantitative analysis of damping in metallic atomic chains andin explaining the rich phenomenology seen in the experiments.
DOI: 10.1103/PhysRevB.80.045427 PACS number�s�: 63.22.Gh, 68.65.�k, 73.40.Jn
I. INTRODUCTION
The continuing shrinking of electronic devices and theconcomitant great interest in molecular electronics1 have un-derlined the urgency of a detailed understanding of transportof electrons through molecular-scale contacts. A particularlyimportant issue concerns the energy exchange between thecharge carriers and the molecular contact. Thus, the localJoule heating resulting from the current passing through thecontact and its implications to the structural stability of suchcontacts are presently under intense investigation.2–6 Experi-mentally, local heating in molecular conductors in the pres-ence of the current has been inferred using two-levelfluctuations7 and Raman spectroscopy.8
Monatomic chains of metal atoms9 are among the sim-plest possible atomic-scale conductors. The atomic goldchain is probably the best-studied atomic-sized conductor,and a great deal of detailed information is available fromexperiments10–22 and related theoretical studies.13,15,18,23–33
The current-induced vibrational excitation and the stabilityof atomic metallic chains have been addressed in a fewexperiments.34–37
In the case of a gold chain Agraït et al.12 reported well-defined inelastic signals in the current-voltage characteris-tics. These signals were seen as a sharp 1% drop of theconductance at the onset of back scattering due to vibrationalexcitation when the voltage equals the vibrational energy.Especially for the longer chains �six to seven atoms�, thevibrational signal due to the alternating bond-length �ABL�mode28,31 dominates. This resembles the situation of an infi-nite chain with a half-filled electronic band where only thezone-boundary phonon can back-scatter electrons11 due tomomentum conservation.
The inelastic signal gives a direct insight into how thefrequency of the ABL mode depends on the strain of theatomic chain. This frequency can also be used to infer thebond strength. The signature of heating of the vibrational
mode is the nonzero slope of the conductance versus voltagebeyond the onset of excitation: with no heating the curvewould be flat. Fits to the experiment on gold chains using asimple model30 suggest that the damping of the excitation, asexpected, can be significant. However, the experiments ingeneral show a variety of behaviors and it is not easy to inferthe extent of localization of the ABL vibration or its dampingin these systems.38
In order to address the steady-state effective temperatureof the biased atomic gold chain theoretically, it is necessaryto consider the various damping mechanisms affecting thelocalized vibrations, such as their coupling to the vibrationsin the contact or to the phonons in the surrounding bulkreservoirs. This is the purpose of the present paper: we cal-culate the vibrational modes in atomic gold chains and theircoupling and the resulting damping due to the phonon sys-tem in the leads. We work within the harmonic approxima-tion and employ first-principles density-functional theory�DFT� for the atomic chain and the contacts39 while a poten-tial model is used for the force constants of the leads.40
Experimental transmission electron microscopy �TEM�studies20,41 have shown that atomic chains form in the �100�and �111� directions while the �110� direction gives rise tothicker rods.41 Therefore we focus on chains between two�100� surfaces or �111� surfaces. We consider chain lengthsof three to seven atoms and study the behavior of their vi-brations and damping when the chains are stretched. TheTEM micrographs also indicate that the chains are suspendedbetween pyramids, so in our calculations we add the smallestpossible fcc-stacked pyramid to link the chain to the givensurfaces.
As we shall show below, at low strain the gold chainshave harmonically undamped ABL modes with frequenciesoutside the bulk band. The long chains of six to seven atomsalso have ABL modes with very low damping at high strain.Our results indicate that chains between �111� surfaces willhave a lower damping than chains between �100� surfaces.Importantly, we find that the damping is an extremely sensi-
PHYSICAL REVIEW B 80, 045427 �2009�
1098-0121/2009/80�4�/045427�11� ©2009 The American Physical Society045427-1
tive function of the external strain: an order-of-magnitudechange may result from minute changes in the strain. Thismay provide a key for understanding the rich behavior foundin experiments.
The paper is organized as follows. In Sec. II we describehow the central quantities, i.e., the dynamical matrix, theprojected density of states, and the damping rates are calcu-lated. Section III is devoted to the analysis of the numericalresults we have obtained, beginning with results for thestructure of the chains, proceeding to the dynamical matrix,and concluding with an analysis of the damping of modes inthe systems. Section IV gives our final conclusions whilecertain technical details are presented in three appendices.
II. METHOD
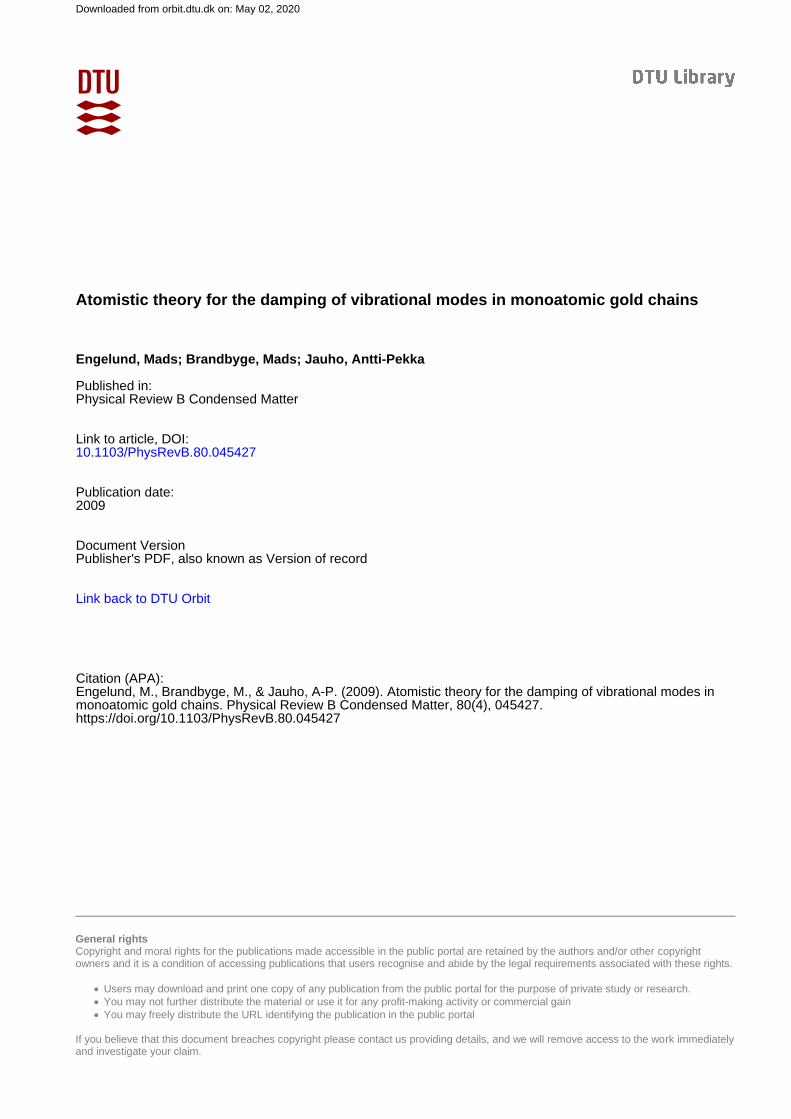
As will become evident in the forthcoming discussion it isadvantageous to use two different ways to label the atomsforming the junction; these two schemes are illustrated inFig. 1. The first scheme �Fig. 1, top panel� is based on thecross-sectional area and collects all atoms with equilibriumpositions on the one-dimensional line joining the two sur-faces into a “chain,” and calls the remaining atoms betweenthe chain and the substrate the “base.” The second scheme�Fig. 1, bottom� distinguishes between a “pyramid” and a“central chain;” this is chosen because the last atom of thechain has bonds to four or five atoms making this atom verydifferent from the central chain atoms that only have twobonds per atom.
A quantity of central importance to all our analysis is themass-scaled dynamical matrix, K, which we here define asincluding �,
Kij =�2
�mimj
�2E
�ui � uj, �1�
where E is the total energy of the system, ui is the coordinatecorresponding to the ith degree of translational freedom forthe atoms of the system. mi is the mass of the atom that the
ith degree of freedom belongs to. K governs the evolution ofthe vibrational system within the harmonic approximation. Inthe Fourier domain the Newton equation of motion reads
Ku� = ��2u�, �2�
where � denotes a mode of oscillation in the system and �� isthe corresponding quantization energy.
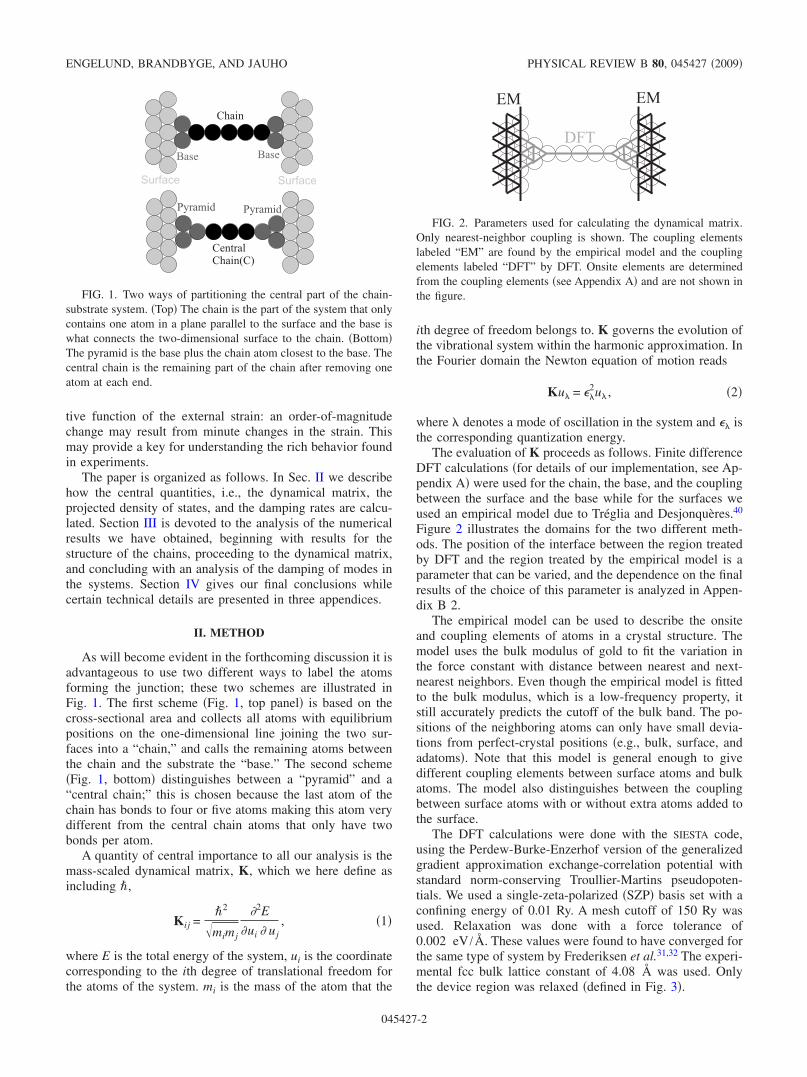
The evaluation of K proceeds as follows. Finite differenceDFT calculations �for details of our implementation, see Ap-pendix A� were used for the chain, the base, and the couplingbetween the surface and the base while for the surfaces weused an empirical model due to Tréglia and Desjonquères.40
Figure 2 illustrates the domains for the two different meth-ods. The position of the interface between the region treatedby DFT and the region treated by the empirical model is aparameter that can be varied, and the dependence on the finalresults of the choice of this parameter is analyzed in Appen-dix B 2.
The empirical model can be used to describe the onsiteand coupling elements of atoms in a crystal structure. Themodel uses the bulk modulus of gold to fit the variation inthe force constant with distance between nearest and next-nearest neighbors. Even though the empirical model is fittedto the bulk modulus, which is a low-frequency property, itstill accurately predicts the cutoff of the bulk band. The po-sitions of the neighboring atoms can only have small devia-tions from perfect-crystal positions �e.g., bulk, surface, andadatoms�. Note that this model is general enough to givedifferent coupling elements between surface atoms and bulkatoms. The model also distinguishes between the couplingbetween surface atoms with or without extra atoms added tothe surface.
The DFT calculations were done with the SIESTA code,using the Perdew-Burke-Enzerhof version of the generalizedgradient approximation exchange-correlation potential withstandard norm-conserving Troullier-Martins pseudopoten-tials. We used a single-zeta-polarized �SZP� basis set with aconfining energy of 0.01 Ry. A mesh cutoff of 150 Ry wasused. Relaxation was done with a force tolerance of0.002 eV /Å. These values were found to have converged forthe same type of system by Frederiksen et al.31,32 The experi-mental fcc bulk lattice constant of 4.08 Å was used. Onlythe device region was relaxed �defined in Fig. 3�.
CentralChain(C)
Surface
Chain
Base
Surface
Base
Pyramid Pyramid
FIG. 1. Two ways of partitioning the central part of the chain-substrate system. �Top� The chain is the part of the system that onlycontains one atom in a plane parallel to the surface and the base iswhat connects the two-dimensional surface to the chain. �Bottom�The pyramid is the base plus the chain atom closest to the base. Thecentral chain is the remaining part of the chain after removing oneatom at each end.
DFT
EMEM
FIG. 2. Parameters used for calculating the dynamical matrix.Only nearest-neighbor coupling is shown. The coupling elementslabeled “EM” are found by the empirical model and the couplingelements labeled “DFT” by DFT. Onsite elements are determinedfrom the coupling elements �see Appendix A� and are not shown inthe figure.
ENGELUND, BRANDBYGE, AND JAUHO PHYSICAL REVIEW B 80, 045427 �2009�
045427-2

For the �111� orientations a 4�4 atom surface unit and a2�3 k-point sampling was used while for the �100� orienta-tions a 3�3 atom surface unit cell and a 3�3 k-point sam-pling was employed. This ensured a similar and sufficientk-point density for both kinds of surfaces �see Appendix B2�.
A. Green’s function for a perturbation on the surface
All properties of interest in the present context can bederived from the �retarded� Green’s function D, defined by
��� + i��2I − K�D��� = I � MD , �3�
where �=0+ and we defined the inverse of the Green’s func-tion by M=D−1. Specifically, we shall need the Green’s func-tion projected onto the region close to the Chain. Our proce-dure is based on a method due to Mingo et al.42 which haspreviously been tested in an investigation of finite Si nano-wires between Si surfaces. We define XYZ as the block of thematrix X, where the indices run over the degrees of freedomin regions Y ,Z, respectively, where Y ,Z= 1,2 ,A ,D ,L ,R,as defined either in Fig. 1 or Fig. 3.
First, let us start with two perfect surfaces. We then addthe atoms that connect these surfaces �the base and thechain�. Within a certain range from the added atoms the on-site and coupling elements of K will be different from thevalues for the perfect surface. Together, the added atoms andthe perturbed atoms define the device region D �Fig. 3, bot-tom�. The coupling between the device region and the rest ofthe surface �L ,R for the left and right leads, respectively� isassumed to be unperturbed.
In order to compute the Green’s function projected on thedevice region, DDD���, we first consider this matrix represen-tation of Eq. �3�:43
�MDD MD�
M�D M����DDD DD�
D�D D��� = �IDD 0D�
0�D I��� . �4�
Here the index �= �L ,R�, i.e., the left and right unperturbedsurface while D= 1,A ,2. Using straightforward matrix ma-nipulations one finds
DDD = �MDD − MD��M���−1M�D�−1 = �MDD − �DD�−1,
�5�
which defines the self-energy �DD=MD��M���−1M�D. Sincethe added atoms do not couple to the unperturbed surfaces,and the perturbed region 1 couples only to the right unper-turbed surface while the perturbed region 2 only couples tothe left unperturbed surface, the self-energy �DD has thematrix structure
�DD = M1L�MLL�−1ML1 0 0
0 0 0
0 0 M2R�MRR�−1MR2� . �6�
This object can be evaluated as follows. First, in the limit oflarge regions 1 and 2, the coupling elements ML1 and MR2must approach those of the unperturbed surface, ML1
S andMR2
S , respectively. In what follows, we shall make the ap-proximation that the regions 1 and 2 are chosen so that thiscondition is satisfied sufficiently accurately. Second, we notethat the matrix M�� is indistinguishable from the matrixM��
S as long as the involved atoms are outside the perturbedregions 1 or 2. Therefore, we can write
M1L�MLL�−1ML1 � M1LS �MLL
S �−1ML1S � �11
S ,
M2R�MRR�−1MR2 � M2RS �MRR
S �−1MR2S � �22
S , �7�
where the accuracy increases with increasing size of regions1 and 2. On the other hand, using the definition of the self-energy, we can write
�11S = M11
S − �D11S �−1,
�22S = M22
S − �D22S �−1, �8�
where DiiS , i=1,2 is the projection of the unperturbed
Green’s functions onto the atoms in regions 1 and 2, respec-tively. This object is evaluated by exploiting the periodicityin the ideal surface plane. The Fourier transform of MS in theparallel directions has a tridiagonal block structure and wecan solve for its inverse very effectively using recursivetechniques �see, e.g., Sancho et al.44�. Of course we still haveto evaluate the Fourier transform for a large number of kpoints. The density of k points as well as the size of theinfinitesimal � are convergence parameters which determinethe accuracy and cost of the computation. An analysis of thechoice of these parameters is given in Appendix B 2.
To sum up, the calculation is preformed in the followingsteps: �i� start with perfect leads and specify the device inbetween them. �ii� The atoms in the leads where K is per-turbed by the presence of the device are identified. �iii� Theunperturbed surface Green’s function DS is found via k-pointsampling and then used to construct the self-energy, Eqs. �7�
DeviceRegion(D)
Unperturbed
Added(A)
Perturbed(2)
Perturbed(1)
Lead(L) Lead(R)
FIG. 3. Adding atoms to two surfaces. �Top� The forces betweensurface atoms within next-nearest-neighbor distance 4.08 Å of theadded atoms are perturbed by the presence of the added atoms.�Bottom� The device region is where the coupling between the at-oms is different from the values for the two unperturbed surfaces.The coupling between the device region and the leads is consideredto be unperturbed.
ATOMISTIC THEORY FOR THE DAMPING OF… PHYSICAL REVIEW B 80, 045427 �2009�
045427-3

and �8�. �iv� The perturbed Green’s function is then foundusing this self-energy via Eqs. �5� and �6�.
B. Modes and lifetimes
For any finite system the eigenvalues ��2 and thereby also
the density of states are found straightforwardly. For infinitesystems we use that each eigenvector, u�, with the corre-sponding eigenvalue, �� gives a contribution to the imagi-nary part of the Green’s function in the ���� limit
u�† Im D���u� � −
1
2��
1
�� − ���2 + �2 .
This expression results in the following density of states
n��� = −2�
lim
�→0+Im D��� . �9�
The broadened vibrational modes of the device region caneach be associated with a finite lifetime. To do this we needto have a definition of an approximate vibrational mode ofthe central part of the system that evolves into an eigenmodeof K when the coupling to the leads tends to zero. We define“modes” as the vectors that for some energy, ��, correspondto a zero eigenvalue mode of Re DDD���� �see Appendix Cfor details�.
We also need to define a few characteristics of a mode.The Green’s function projected onto a mode can be approxi-mated by a broadened free phonon propagator with constants�� and � in a neighborhood of the mode peak energy,
u�†DDD���u� =
1
�� + i��2 − ��2 =
1
�2 − ���2 + �
2� + i2��
.
The time-dependent version of the Green’s function is anexponentially damped sinusoidal oscillation with dampingrate of
�
� , mean lifetime, ��= �
�, and Q factor, Q�=
��
2�.
Comparing the broadened phonon propagator to Eq. �5� wesee that u�
† Im ����u�=−2��, leading to
� = −u�
† Im �����u�
2��,
where �� is the mode peak energy.This calculation of �, Q�, and �� only strictly makes
sense for peaks with a Lorentzian line shape. This requiresthat u�
† Im DDD���u� is approximately constant across thepeak which is the case for modes with small broadening andlarge lifetime. Nevertheless, we will also use these defini-tions for the delocalized modes since the calculated valuesare still a measure of interaction with the leads.
We also define a measure of spatial localization, s�,
s� =
�x�C
��u��x�2
�x�D\C
��u��x�2ND − NC
NC,
where ND and NC are the number of atoms in the device andcentral chain region, respectively, and D \C means device
region except the central chain �the perturbed region�. Thisquantity is useful to pick out modes with a large amplitude inthe central chain region only. We have that s�=1 signifiesequal amplitude in C and connecting atoms while the limits�→� �s�→0� signifies a mode which is completely resid-ing inside �outside� the chain.
It should be stressed that the mode properties calculatedin this way only refer to the harmonic damping by the leadsand that other sources of damping are not included such aselectron-hole pair creation and anharmonicity. The dampingdue to electron-hole pair creation, obtained by an ab initiocalculation on a selection of gold chains, is about50–80 eV for the vibrational mode with the strongest cou-pling to electrons.30,31 This type of damping is less depen-dent on strain in gold chains due to stable electronic structureas evidenced by the robust electronic conductance of oneconductance quantum. The harmonic damping due to theleads is typically higher than this but as we shall see it canactually drop well below this value and thus be less than theelectron-hole pair damping.
In case of an applied bias the high-frequency modes maybe excited to a high occupation. The creation of vibrationalquanta is roughly proportional to eV−��� while the damp-ing mechanisms are not expected to have a strong depen-dence of the bias. Therefore, as the bias is increased beyondthe phonon energy threshold, the mode occupation will riseand anharmonic interactions may become increasingly im-portant even for low temperatures. Mingo45 has studied an-harmonic effects on heat conduction in a model atomic con-tact and more recently Wang et al.46 has used ab initiocalculations to access the effect of anharmonicity on heatconduction in carbon-based systems. Anharmonic effects are,however, outside the scope of the present work.
III. RESULTS
A. Geometrical structure and the dynamical matrix
In this subsection we investigate the geometrical structureof the chains and the behavior of the dynamical matrix. Foreach type of calculation �identified by the number of atomsin the chain, the surface orientation, and the type of base� arange of calculations were set up with the two surfaces atdifferent separations, Li �i=1,2 , . . .�, with the separations in-cremented in equally spaced steps. Trial and error was usedto determine suitable step sizes for the different types ofcalculations.
To be able to compare chains of different lengths andbetween different surfaces we define the average bondlength, B= �bj�, as the average length between neighboringatoms within the chain, where j runs over the number ofbonds in the chain �see Fig. 4�. B is useful because it isclosely related to the experimentally measurable force14 onthe chain and can be found without interpolation. The closerelationship between B and the force is demonstrated in Fig.5 where the force is calculated as the slope of a least-squaresfit of
��Ei−1,Li−1�,�Ei,Li�,�Ei+1,Li+1�� ,
where E is the total energy. We note that the force vs Bcurves to a good approximation follows a straight line with a
ENGELUND, BRANDBYGE, AND JAUHO PHYSICAL REVIEW B 80, 045427 �2009�
045427-4

slope of k=2.5 eV /Å2, which can be interpreted as thespring constant of the bonds in the chain. In addition to B wealso define the average bond angle T= �� j�.
The behavior of the systems with respect to B is relativelysimple. As the systems are strained it is mostly the bonds inthe chain that are elongated. Finally the central bond�s� be-come so weak that they break. At low B we see from Fig. 6that the longer chains adopt a zigzag confirmation at lowaverage bond length. The three-atom and four-atom chains,however, remain linear within the investigated range. Fur-thermore, the longer chains have a similar variation in theaverage bond angle.
These preliminary observations are in agreement withprevious theoretical studies by Frederiksen et al.31 andSánchez-Portal et al.47 We recount these observations be-cause we find that using B as a parameter provides a helpfulway to compare chain of different lengths and because thecalculations in this paper are the most accurate to date.48
To shed light on the effect of straining the chains, we nextinvestigate the energies that are related to different types ofmovement by analyzing the eigenmodes and eigenvalues ofselected blocks of K. Especially, we can consider the localmotion of individual atoms or groups of atoms, freezing allother degrees of freedom, by picking the corresponding partsof K. For a single atom this amounts to the onsite 3�3blocks. The square root of the positive eigenvalues of thereduced matrix, which we call local energies, gives the ap-proximate energy of a solution to the full K that has a largeoverlap with the corresponding eigenmode, if the coupling tothe rest of the dynamical matrix is low. The negative eigen-values of a block are ignored since they correspond to mo-tion that is only stabilized by degrees of freedom outside theblock.
The behavior of the dynamical matrix in terms of localenergies is relatively straightforward, as illustrated in Fig. 7.
When the bonds are strained they are also weakened. In thecentral chain the local energies are quickly reduced with in-creased strain ��65% decrease� while the dynamical matrixof the surfaces is hardly affected. The base and the first atomof the chain fall in between these two extremes with a 20%and 40% decrease, respectively. The middle bonds in thecentral chain are the ones that are strained and weakened themost when the surfaces are moved apart. It is also where thechain is expected to break.49 Most interestingly, we note thatat least one jump in the onsite local energies occur whenmoving from the surface to the central chain.
In Fig. 8 we see how motion parallel to the chain is athigher energies than perpendicular motion, and that the lon-gitudinal optical �LO�-type motion of the ABL modes has thehighest energy. We also see that the local energies of theABL/LO-type motion moves past the local energies of thepyramid as the strain is increased. In this way the ABL/LOmodes can in some sense act as a probe of the contacts.
B. Mode lifetimes and Q factors
We next investigate the modes of the finite chain systems.An example is given in Fig. 9 which depicts the projecteddensity of states �DOS� for a chain with four atoms at anintermediate strain. Notice the large variation in the width ofthe peaks. The peaks with a low width correspond to modesthat have the largest amplitude in the chain while the peakswith a large width correspond to modes with large amplitude
2.65 2.70 2.75 2.80 2.85 2.90
B(Å)
0
0.2
0.4
0.6
0.8
1
1.2
1.4
For
ce(e
V/Å
)
k=2.5 eV/Å2 3(100)
4(100)5(100)6(100)7(100)5(111)
FIG. 5. �Color online� Force as a function of average bondlength, T= �� j�.
2.65 2.70 2.75 2.80 2.85 2.90
B(Å)
140
150
160
170
180
T(d
eg.)
3(100)4(100)5(100)6(100)7(100)5(111)
FIG. 6. �Color online� Average bond angle as a function of theaverage bond length. The long chains adopt a zigzag structure atlow B while the short chains remain linear.
surf. base 1 2 3 4 base surf.0
5
10
15
20
Loc
alE
nerg
ies(
meV
)
4 Atoms(100)B=2.65 Å
B=2.88 Å
FIG. 7. �Color online� Local energies of a four-atom chain be-tween two �100� surfaces at different strains. The largest eigenval-ues are connected by a line to guide the eye.
��
b1
b2 b3
b4
�� ��
FIG. 4. Distances and angles used to define the average bondlength, B= �bj�, and the average bond angle, T= �� j�, respectively.
ATOMISTIC THEORY FOR THE DAMPING OF… PHYSICAL REVIEW B 80, 045427 �2009�
045427-5

on the base and surface. Since this type of system has nonatural boundary between “device” and “leads” we will havelarge variation in the harmonic damping no matter where wedefine such a boundary.
In Fig. 10 we present the Q factor, spatial localization,and peak energy of all modes for chains with three to sevenatoms between �100� surfaces. These are the main results ofthis paper. Table I shows the same information in an alterna-tive form. We now proceed to an analysis of these results.
The ABL modes are of special interest. These modes havebeen identified by previous theoretical and experimentalstudies as the primary scatterers of electrons.12,28–30,32,33,50
The ABL modes are easily identified in Fig. 10 since theyhave the highest energy of the modes that are spatially local-ized to the central chain �black or dark gray in the figure�.Modes corresponding to transverse motion of the centralchain are also clearly visible. These modes are energeticallyand spatially localized but are of limited interest because of alow electron-phonon coupling.
Certain ABL modes are very long lived. At low strains,ABL modes lie outside the bulk �and surface� band and have,in our harmonic approximation, an infinite Q factor. In real-ity the Q factor will be limited by electron-phonon and an-harmonic interactions. At higher strain the ABL modes moveinside the bulk band and one observes a great variation in the
corresponding Q factors. When the peak energy lies insidethe bulk band there exists modes in the bulk with the sameenergy and it will mostly be the structure of the connectionbetween the bulk crystal and the chain that determines thewidth of the peak.
The long chains tend to have longer lived ABL modes dueto the larger ratio between the size of the central chain andthe size of its boundary. The seven-atom chain is especiallyinteresting since it has an ABL-type mode with a damping of5 meV at one strain while at another strain the ABL modehas a damping of 300 meV. This is more than one order-of-magnitude variation in the harmonic damping of the primaryscatterer of electrons due to only a 0.03 Å change in theaverage bond length.
The largest damping of an ABL mode for these systems is��1 meV, which is still significantly lower than the�20 meV bandwidth. This can be attributed to fact, notedabove, that there always exists a large mismatch in localenergies moving from the central part of the chain to the restof the system �see Fig. 7�.
Previous studies by Frederiksen et al.31 obtained a roughestimate for the variation in the nonelectronic �harmonic andanharmonic� damping of 5–50 eV for the longer chains byfitting the experimental inelastic electron tunneling spectros-copy �IETS� signals of Agraït et al.11 to a model calculation.The estimated peak energies lie well within the bulk band forall the recorded signals. The reason the nonelectronic damp-ing rate can be extracted is because the excitation of vibra-tions and damping of vibrations through electron-hole cre-ation are both proportional to the strength of the electron-phonon coupling. This means that the step in theexperimental conductance, when the bias reaches the phononenergy, can be used to estimate strength of the electron-phonon interaction and thereby the electron-hole pair damp-ing. The slope in the conductance beyond this step can thenbe used to extract the total damping. By subtracting theelectron-hole pair damping from the total damping we get anestimate of the sum harmonic and anharmonic contributionsto the damping.
The estimate in Ref. 31 agrees well with our lowestdamping of 5 eV. The highest damping we have found was�400 eV found for the six-atom chain which is an orderof magnitude larger than the upper limit of Ref. 31. We be-lieve that this discrepancy can be largely attributed to thedifficulty in extracting the necessary parameters from experi-ments when the harmonic damping is large. Furthermore, forthe six-atom and seven-atom chains we observe that the highdamping occurs at low strain, where the electron-phononcoupling is weak.11
There are two main differences between the �100� and the�111� systems. The first difference is that the �111� systemshave ABL modes that are more long lived compared to the�100� systems �see Table I and Fig. 11�. The second differ-ence is the behavior of the localized modes close to the bandedge �see Fig. 11�. The modes with energies outside the bulkband in the �111� systems are less spatially localized com-pared to the �100� case. At low strain, the �111� chain hasABL modes extending further into the base and surface thanthe �100� chain.
There are certain general features of how the dampingevolves with strain that are easily understood. Modes with
2.65 2.70 2.75 2.80 2.85 2.90
B(Å)
0
5
10
15
20
25L
ocal
Ene
rgie
s(m
eV)
4 Atoms(100)
PyramidCentral ChainLO
LA
TA TO
FIG. 8. Local energies for selected blocks of K �pyramid/centralchain� plotted vs the average bond length in the four-atom chain.Since the central chain in this case consists of two atoms we canclassify the eigenvectors as LO: longitudinal optical, LA: longitu-dinal acoustic, TO: transverse optical �doubly degenerate�, or TA:transverse acoustic �doubly degenerate�.
0 5 10 15 20 25Phonon Energy(meV)
0
1
Pro
ject
edD
OS
4 Atoms(100)B=2.74 Å
Q=5Q=8
Q=16Q=9
Bulk
Band
Edge
FIG. 9. Projected DOS onto a representative selection of thevibrational modes of the device region that has a large overlap withthe added �chain+base� region.
ENGELUND, BRANDBYGE, AND JAUHO PHYSICAL REVIEW B 80, 045427 �2009�
045427-6

peak energies in the range of 16–19 meV in general have avery high damping while those in the range of 14–16 meVhave very low damping. This correlates well with the bulkDOS for gold �see, e.g., Ref. 40�. The optical peak in thebulk DOS corresponds to strong damping while the gap be-tween optical and acoustical modes correspond the range oflow damping.
To sum up, localized modes occur at low strain where thebonds in the chain are very strong and give rise to frequen-cies close to or outside the bulk band edge. Inside the bulkband strong localization is still possible for the long chains,especially the seven-atom chain. This requires, however, thatthe coupling between the central chain and the surface isweak at the typical frequency of the ABL mode due to thestructure of the connection. The behavior depends stronglyon the detailed structure of the base and the state of strain butsome general features can be related to the bulk DOS.
IV. CONCLUSION AND DISCUSSION
We have presented a study of the harmonic damping ofvibrational modes in gold chains using a method that uses abinitio parameters for the chains and empirical parameters forthe leads. We have focused on ABL/LO modes that interactstrongly with electrons and are thereby experimentally acces-sible through IV spectroscopy. We provide an estimate forthe damping of ABL modes from ab initio calculations as afunction of strain for a wide range of gold chain systems.The calculations of the ABL-phonon damping rates agreewell with earlier estimates, found by fitting a model to ex-perimental inelastic signals.11,32
We have found that the values of the harmonic dampingfor the ABL modes can vary by over an order of magnitudewith strain. Even with small variations in the strain, the har-monic damping can exhibit this strong variation. This ex-treme sensitivity may explain the large variations seen ex-perimentally in different chains.
0
5
10
15
20
25
Bulk Band Edge
Q=3
Q=7
3 Atoms(100)
0
5
10
15
20
25
Q=30
Q=5
4 Atoms(100)
0
5
10
15
20
25
Mod
eP
eak
En
ergy
(meV
)
Q=40
Q=10
5 Atoms(100)
0
5
10
15
20
25
Q=80
Q=15
6 Atoms(100)
(b)(a)
(c) (d)
2.65 2.70 2.75 2.80 2.85 2.90
B(Å)
0
5
10
15
20
25
Q=40
Q=1500
7 Atoms(100)
(e)
FIG. 10. The vibrational modes for chains with three to seven atoms between two 100 surfaces. The center of the disks is positioned atthe peak of the projection of vibrational DOS on the mode in question. The area of a disk is proportional to the Q� but is limited to whatcorresponds to a Q factor of 250. The gray level that ranges from light gray to black in four steps signifies that s�� �0,2� �light gray�,�2,4� , �4,6� , �6,8�, or �8,�� �black�.
ATOMISTIC THEORY FOR THE DAMPING OF… PHYSICAL REVIEW B 80, 045427 �2009�
045427-7

The range of the harmonic damping also depends stronglyon the number of atoms in the chain since we see a clearincrease in localization going from a six-atom to a seven-atom chain. The chain with seven atoms really stands out,since it, in addition to having very localized modes in gen-eral, it also has the greatest variation in harmonic damping.This strong variation in the harmonic damping of the ABLmodes, that depends on the details of the structure, suggestthat accurate atomistic calculations of the vibrational struc-ture is necessary to predict the inelastic signal.
All types of chains were found to have ABL modes thatlie outside the bulk phonon band at low strain. These modesare expected to have very long lifetimes since the harmonicdamping is zero. Signatures of the rather abrupt change inthe damping of the ABL modes when strained have notbeen discussed in experimental literature so far. We believethis is due to the common experimental techniques forproducing these chains heavily favor strained chains. TheABL-mode lifetime may be set by the coupling to theelectronic system �electron-hole pair damping�. Indeed, eveninside the bulk band the electron-hole pair damping canbe of the same order as the harmonic damping. Forexample, a �eh�50–80 eV was found for a four-atom30
and a seven-atom31 chains, which we can compare with100–900 eV and 5–300 eV found above for the har-monic vibrational damping. Thus the damping can in certaincases be dominated by the electron-hole pair damping forfrequencies even inside the bulk band.
Finally we find a difference in the damping of ABL modesin chains between �100� and �111� surfaces. For the investi-gated five-atom chains there is both a marked difference inthe strength of damping and in the variation in the dampingwith strain. It might be possible to distinguish between �100�and �111� pyramids experimentally due to this difference.The ABL modes will have strong coupling to the bulk atcertain energies, characteristic of the pyramid type. This inturn, results in broadening/splitting of the modes dependingon whether the characteristic energies are inside or outsidethe bulk band. This broadening/splitting would be detectablein the IV curve since it is related to the characteristics of theconductance step at the peak energy of the vibrational mode.Finding IV curves at different strains could thereby serve as
a fingerprint of the specific way the chain is connected to thesurroundings. Hihath et al.50 have demonstrated that suchmeasurements are indeed possible on a single-molecule con-tact.
The techniques used in this paper can be combined withelectronic transport calculations to predict the inelastic signalin the IV characteristic of a system. This will be done infuture work, where we will also eliminate the use of theempirical model for the leads and use ab initio parametersfor the entire system.
ACKNOWLEDGMENTS
The authors would like to thank Thomas Frederiksen forhelpful discussions and Nicolas Agraït for showing his un-published experimental results. A.P.J. is grateful to theFiDiPro program of the Finnish Academy. Computational re-sources were provided by the Danish Center for ScientificComputing �DCSC�.
APPENDIX A: CONSTRUCTING THE DYNAMICALMATRIX
In this subsection the details of how we constructed thedynamical matrix are presented. The dynamical matrix mustbe symmetric and obey momentum conservation. Momen-tum conservation, in this context, means that when an atomis displaced the force on the displaced atom equals minus thetotal force on all other atoms. We ensure momentum conser-
TABLE I. The variation in the Q�, �, and �� of the ABL modes.For chains with 3–7 between �100� surfaces and for chains with fiveatoms between �111� surfaces but with slightly different bases. Thestrains where the peak energy of the ABL mode falls close to oroutside the bulk band edge have been disregarded.
Chain Q�
�
� eV���
�ps�
3�100� 3–7 800–1200 0.5–0.8
4�100� 5–30 100–900 0.7–7
5�100� 10–40 200–500 1.3–3
6�100� 15–80 90–400 1.6–7
7�100� 40–1500 5–300 2–130
5�111� �symmetric� 15–80 40–400 1.6–16
5�111� �asymmetric� 10–100 40–800 0.8–16
0
5
10
15
20
25
Q=80
Q=15
5 Atoms(111)[sym]
2.65 2.70 2.75 2.80 2.85 2.90
B(Å)
0
5
10
15
20
25
Mod
eP
eak
Ene
rgy(
meV
)
Q=100Q=105 Atoms(111)[asym]
(b)
(a)
FIG. 11. The vibrational modes for five-atom chains betweentwo �111� surfaces. �Top� Symmetric pyramids. �Bottom� Asymmet-ric pyramids �one atom added to one of the pyramids�. The area ofa disk is proportional to the Q� but is limited to what corresponds toa Q factor of 250. The gray level that ranges from light gray toblack in four steps signifies that s�� �0,2� �light gray�,�2,4� , �4,6� , �6,8�, or �8,�� �black�.
ENGELUND, BRANDBYGE, AND JAUHO PHYSICAL REVIEW B 80, 045427 �2009�
045427-8

vation by setting the onsite 3�3 matrix to minus the sum ofthe force-constant coupling matrices to all the other atoms.This method for regularizing the dynamical matrix was pre-viously used by Frederiksen et al.31 and generally improveson the errors introduced in the total energy when displacingatoms relative to the underlying computational grid �the DFTegg-box effect�. We calculate off-diagonal coupling part ofthe force-constant matrix was calculated with a finite differ-ence scheme using a displacement, Z, of 0.02 Å in the x, y,and z directions for all atoms in the chain and base.
To improve the accuracy further, the forces were calcu-lated for both positive and negative displacements. If i and jare degrees of freedom situated inside the DFT region wetherefore perform four independent calculations of Kij =K jisince K is a symmetric matrix. In the end we use the averageof the force constant from these four calculations
Kij =�2
�mimj
�Fij+
Z+
Fji+
Z−
Fij−
Z−
Fji−
Z�� 4,
where, e.g., Fij+ denotes the force on i due to a positivedisplacement of j. If i is inside the DFT region and j is not,the coupling is calculated as an average of two force con-stants
Kij =�2
�mimj
�Fji+
Z−
Fji−
Z�� 2.
If an atom was close to a periodic image of another atom�less than half the unit-cell length in any direction� the forcebetween these atoms was set to zero to avoid artifacts of theperiodic calculational setup. The empirical model was usedto calculate the coupling between the surface atoms. After allcoupling elements were found the onsite elements were cal-culated for the system as a whole.
APPENDIX B: CONVERGENCE
1. Convergence parameters
In the calculations there are several convergence param-eters and here we provide an overview. There are three im-portant length scales in the calculations: L1, L2, and L3. Weassume that when two atoms are further apart than L1, thecoupling elements between them vanishes. L2 is the correla-tion length for properties that do not have an energy depen-dence, such as forces, equilibrium positions, and total ener-gies while L3 is the assumed correlation length for propertiesthat do have an energy dependence, such as the surfaceGreen’s function, vibrational DOS, etc. L3 always needs tobe larger than L2, L3�L2 but the specific size needed de-pends on the required energy resolution. L2 determines thek-point sampling used in the DFT calculations and L3 thek-point sampling used in the calculation of the surfaceGreen’s function. In each case the number of k points usedone direction is chosen to be the smallest integer, i, such thati�
La , where a is the size of the calculational cell in that
direction. The DFT k-point sampling used is dense enough toensure that L2�23 Å for all calculations.
In the calculation of the Green’s functions we introduceda finite artificial broadening. This broadening, �, was divided
into a small broadening of the device region, �C, and a largebroadening for the leads, �L. The reasoning behind this isthat the density of states is much more smooth in the bulklikeregions far away from the chain. A large �L has the advan-tage that it reduces the need for k-point sampling drastically.Without a small �C we would not be able to discover verysharp peaks in the DOS. To reliably find the modes of thesystem it is also important that the energy spacing, �E is onthe same level or smaller than �C.
The artificial broadening limits how large lifetimes wecan resolve. This is why we in the following write the upperlimit to the lifetime introduced by the artificial broadening.
A final convergence parameter is the position of the inter-face between DFT and empirical model parameters for thedynamical matrix. This is a very important parameter sincethe error introduced by having this interface relatively closeto the chain is what limits the precision of the calculations.
2. Test of convergence
Next we present the tests that have been carried out toensure that the calculations in this paper are sufficiently con-verged. The convergence for the SIESTA basis set and the sizeof the finite displacement used in the finite difference calcu-lations was already tested for the same type of systems byFrederiksen et al.31
So here we first examine the convergence of the DFTcalculations of the dynamical matrix. A calculation for afour-atom chain between �100� surface was done with im-proved values for the important DFT convergence param-eters. The mesh cutoff was increased from 150 to 200 Ry andthe k-point sampling was increased from 2�3 to 3�4. Forthis change in parameter we obtained a maximal differenceof 0.2 meV, when comparing the square root of the sortedarray of eigenvalues of the dynamical matrix. This is a neg-ligible size since the average value of the eigenvalues isabout 10 meV. The k-point sampling in the DFT calculationsproved crucial for the structure of the strained systems sincegamma-point calculations resulted in different structures�different bonds weakened at high strain� with very largelifetimes.
The perturbation length used in our calculations was L1=4.08 Å, which is the same as next-nearest-neighbor dis-tance. The magnitude of any next-nearest-neighbor couplingmatrix, defined as �X�=��ijXij
2 was never larger than 15%compared to the magnitude of any nearest-neighbors cou-pling matrix. The error introduced by this truncation issmaller than the one introduced by using the empirical modelfor the dynamical matrix.
For the calculation of the DOS we gradually improved L3,�L, and �C and found that the DOS was converged using�E=10 eV, �L=100 eV �7 ps�, �C=10 eV �70 ps�,and L2=200 Å �68�68 k points� except in one calculationfor the seven-atom chain we needed the lifetime of one verysharp peak. This required a better resolution using �E=1 eV, �L=10 eV �70 ps�, �C=1 eV �700 ps�, andL2=400 Å �136�136 k points�.
Finally, we have considered how much the interface be-tween the DFT parameters and the empirical parameters af-
ATOMISTIC THEORY FOR THE DAMPING OF… PHYSICAL REVIEW B 80, 045427 �2009�
045427-9

fects our results. In Fig. 12 we show a study where we varythe position of this interface. We find that our calculation ofthe Q factor and the spacial localization is converged toabout the first significant digit for modes that are spatiallylocalized to the central chain. We judge that this is whatmainly sets the limit of accuracy of in our calculations.
APPENDIX C: DEFINITION OF THE MODESFOR AN OPEN SYSTEM
The starting point is the modes of a closed system,namely, the eigenmodes of K. The most important require-ment, for the definition of modes in the case of the opensystem, is that these modes become the modes of the isolatedsystem in the limit of zero coupling between the device re-gion and the leads.
The following definition fulfills this condition. A mode isdefined as a �complex� eigenvector u� of MDD���� �andDDD����� that fulfills,
Reu�†DDD����u� = 0 �C1�
and
�
��Reu�
†DDD���u���=�� � 0 �C2�
for some energy, ��, corresponding to a peak in DOS.An illustration of these two conditions is given in Fig. 13.
In practice, the modes are found from the number of positiveeigenvalues of DDD evaluated at each point of our energygrid. If this number increases between two successive ener-gies, � and �+��, the eigenmodes at these two energies arematched up. The eigenmode corresponding to the eigenvaluethat changes sign is then identified as a mode of the opensystem.
*[email protected] G. Cuniberti, G. Fagas, and K. Richter, Introducing Molecular
Electronics �Springer, New York, 2005�.2 G. Schulze et al., Phys. Rev. Lett. 100, 136801 �2008�.3 Y. Teramae, K. Horiguchi, S. Hashimoto, M. Tsutsui, S.
Kurokawa, and A. Sakai, Appl. Phys. Lett. 93, 083121 �2008�.4 Z. F. Huang, F. Chen, R. D’Agosta, P. A. Bennett, M. Di Ventra,
and N. J. Tao, Nat. Nanotechnol. 2, 698 �2007�.5 M. Galperin, A. Nitzan, and M. A. Ratner, Phys. Rev. B 75,
155312 �2007�.6 D. A. Ryndyk, P. D’Amico, G. Cuniberti, and K. Richter, Phys.
Rev. B 78, 085409 �2008�.7 M. Tsutsui, M. Taniguchi, and T. Kawai, Nano Lett. 8, 3293
�2008�.8 Z. Ioffe, T. Shamai, A. Ophir, G. Noy, I. Yutsis, K. Kfir, O.
Cheshnovsky, and Y. Selzer, Nat. Nanotechnol. 3, 727 �2008�.9 G. Rubio-Bollinger, S. R. Bahn, N. Agraït, K. W. Jacobsen, and
S. Vieira, Phys. Rev. Lett. 87, 026101 �2001�.10 V. Rodrigues and D. Ugarte, Phys. Rev. B 63, 073405 �2001�.11 N. Agraït, C. Untiedt, G. Rubio-Bollinger, and S. Vieira, Chem.
Phys. 281, 231 �2002�.
12 N. Agraït, C. Untiedt, G. Rubio-Bollinger, and S. Vieira, Phys.Rev. Lett. 88, 216803 �2002�.
13 S. B. Legoas, D. S. Galvao, V. Rodrigues, and D. Ugarte, Phys.Rev. Lett. 88, 076105 �2002�.
14 N. Agraït, A. L. Yeyati, and J. M. van Ruitenbeek, Phys. Rep.377, 81 �2003�.
15 L. G. C. Rego, A. R. Rocha, V. Rodrigues, and D. Ugarte, Phys.Rev. B 67, 045412 �2003�.
16 P. Z. Coura, S. B. Legoas, A. S. Moreira, F. Sato, V. Rodrigues,S. O. Dantas, D. Ugarte, and D. S. Galvao, Nano Lett. 4, 1187�2004�.
17 J. Bettini, V. Rodrigues, J. C. Gonzalez, and D. Ugarte, Appl.Phys. A: Mater. Sci. Process. 81, 1513 �2005�.
18 M. Lagos, V. Rodrigues, and D. Ugarte, J. Electron Spectrosc.Relat. Phenom. 156-158, 20 �2007�.
19 A. Hasmy, L. Rincón, R. Hernández, V. Mujica, M. Márquez,and C. González, Phys. Rev. B 78, 115409 �2008�.
20 T. Kizuka, Phys. Rev. B 77, 155401 �2008�.21 A. Thiess, Y. Mokrousov, S. Blugel, and S. Heinze, Nano Lett.
8, 2144 �2008�.22 M. Tsutsui, K. Shoji, M. Taniguchi, and T. Kawai, Nano Lett. 8,
Chain Added Central Region All0
5
10
15
20
25
Mod
eP
eak
Ene
rgy(
meV
) 5 Atoms(111)[sym]
Q=13 Q=17 Q=18 Q=20
FIG. 12. Modes of the device region with a different DFT/EMinterface. The label designates the region treated with DFT, wherethe “added” region is the one used in the main part of the calcula-tions and “all” is fully ab initio. See Fig. 11 to see what the colorand size signify. In this plot modes with s�� �0,2� are suppressed.
0 1 2 3Energy(arb. units)
(arb
.uni
ts)
FIG. 13. Example Re D and n���, dashed and solid line, respec-tively, for a Green’s function with two poles at 1 and 2 with a 0.1broadening. We see that the values where the real part is zero onlycorrespond to peaks in the density if the slope is positive.
ENGELUND, BRANDBYGE, AND JAUHO PHYSICAL REVIEW B 80, 045427 �2009�
045427-10

345 �2008�.23 T. N. Todorov, Philos. Mag. B 77, 965 �1998�.24 S. R. Bahn and K. W. Jacobsen, Phys. Rev. Lett. 87, 266101
�2001�.25 E. Z. da Silva, A. J. R. da Silva, and A. Fazzio, Phys. Rev. Lett.
87, 256102 �2001�.26 Y.-C. Chen, M. Zwolak, and M. Di Ventra, Nano Lett. 3, 1691
�2003�.27 M. J. Montgomery, J. Heakstra, T. N. Todorov, and A. P. Sutton,
J. Phys.: Condens. Matter 15, 731 �2003�.28 T. Frederiksen, M. Brandbyge, N. Lorente, and A. P. Jauho,
Phys. Rev. Lett. 93, 256601 �2004�.29 J. K. Viljas, J. C. Cuevas, F. Pauly, and M. Hafner, Phys. Rev. B
72, 245415 �2005�.30 M. Paulsson, T. Frederiksen, and M. Brandbyge, Phys. Rev. B
72, 201101�R� �2005�.31 T. Frederiksen, M. Paulsson, M. Brandbyge, and A.-P. Jauho,
Phys. Rev. B 75, 205413 �2007�.32 T. Frederiksen, N. Lorente, M. Paulsson, and M. Brandbyge,
Phys. Rev. B 75, 235441 �2007�.33 E. Hobi, A. Fazzio, and A. J. R. da Silva, Phys. Rev. Lett. 100,
056104 �2008�.34 H. Yasuda and A. Sakai, Phys. Rev. B 56, 1069 �1997�.35 R. H. M. Smit, C. Untiedt, and J. M. van Ruitenbeek, Nanotech-
nology 15, S472 �2004�.36 M. Tsutsui, Y.-k. Taninnouchi, S. Kurokawa, and A. Sakai, Jpn.
J. Appl. Phys., Part 1 44, 5188 �2005�.
37 M. Tsutsui, S. Kurokawa, and A. Sakai, Nanotechnology 17,5334 �2006�.
38 N. Agraït �private communications�.39 J. M. Soler, E. Artacho, J. D. Gale, A. García, J. Junquera, P.
Ordejón, and D. Sánchez-Portal, J. Phys.: Condens. Matter 14,2745 �2002�.
40 G. Tréglia and M. C. Desjonquères, J. Phys. �Paris� 46, 987�1985�.
41 V. Rodrigues and D. Ugarte, Eur. Phys. J. D 16, 395 �2001�.42 N. Mingo, D. A. Stewart, D. A. Broido, and D. Srivastava, Phys.
Rev. B 77, 033418 �2008�.43 Formally, this equation is derived by inserting identity operators
I��D��D�+ ������ in Eq. �3� and using the basis �D� , ��� forthe matrix representation.
44 M. P. L. Sancho, J. M. L. Sancho, and J. Rubio, J. Phys. F: Met.Phys. 14, 1205 �1984�.
45 N. Mingo, Phys. Rev. B 74, 125402 �2006�.46 J. S. Wang, J. Wang, and J. T. Lu, Eur. Phys. J. B 62, 381 �2008�.47 D. Sánchez-Portal, E. Artacho, J. Junquera, P. Ordejón, A.
García, and J. M. Soler, Phys. Rev. Lett. 83, 3884 �1999�.48 The k-point sampling of Ref. 31 is so sparse that it may in
certain instances give unrealistic predictions for the structure.49 P. Velez, S. A. Dassie, and E. P. M. Leiva, Chem. Phys. Lett.
460, 261 �2008�.50 J. Hihath, C. R. Arroyo, G. Rubio-Bollinger, N. J. Tao, and N.
Agrait, Nano Lett. 8, 1673 �2008�.
ATOMISTIC THEORY FOR THE DAMPING OF… PHYSICAL REVIEW B 80, 045427 �2009�
045427-11