atomic layer deposition, a rising technique for … · atomic layer deposition, a rising technique...
TRANSCRIPT

Atomic Layer Deposition, a rising technique for SOFC and MCFC devices
A. Meléndez-Ceballos, D. Chery, A. Marizy, V. Albin,
A. Ringuedé, M. Cassir*
* Head Laboratoire d’Electrochimie, Chimie des Interfaces et Modélisation pour l’Energie, LECIME, UMR 7575 CNRS, ENSCP, Paris, France
EFC 2013 Rome

High temperature fuel cells & electrolysis
OHOH 222 21
…………+FC
SOEC
ZrO2-Y2O3
Cermet Ni-YSZ
La1-xSrxMnO3
O2- O2-
- → + 2 2
_ 2 2 1
O e O
_ 2 2 2
2 e O H O H + → + -
SOFC: 600-700°C
- e CO O H CO H 2 2 2 2 3 2
+ + → + -
CO32-
- → + + 2 3 2 2 2
2
1 CO - e CO O
Li2CO3- K2CO3
Ni + 2 à 10% Cr ou Al
NiO
MCFC: 600-650°C
↑ lifetime & performance:
Nanostruct./electrochem.
→ half-cells → single cells
EFC 2013 Rome
MCFC/SOFC Composite
carbonate/oxide
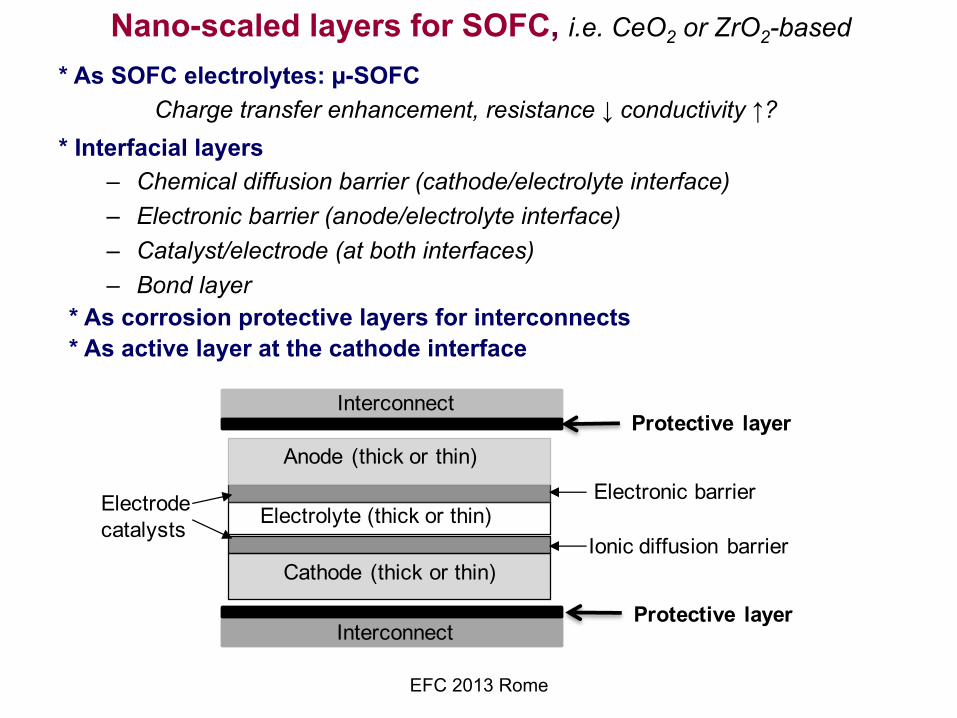
Nano-scaled layers for SOFC, i.e. CeO2 or ZrO2-based
* Interfacial layers – Chemical diffusion barrier (cathode/electrolyte interface) – Electronic barrier (anode/electrolyte interface) – Catalyst/electrode (at both interfaces) – Bond layer
* As SOFC electrolytes: µ-SOFC Charge transfer enhancement, resistance ↓ conductivity ↑?
* As corrosion protective layers for interconnects * As active layer at the cathode interface
Cathode (thick or thin)
Electronic barrierElectrolyte (thick or thin)
Anode (thick or thin)
Ionic diffusion barrier
Electrodecatalysts
Interconnect
Interconnect
Protective layer
Protective layer
EFC 2013 Rome

Atomic layer Deposition
4
Surface saturation reaction. Thickness: from few nm to µm
R. Puurunen, J. Appl. Phys., 97 (2005) 121301
Gro
wth
spe
ed
Deposition T
ALD window
- Crystaline as deposited
M. Cassir et al., J. Mater. Chem., 20 (2010) 8987
EFC 2013 Rome
Litterature orientations
Two main tendencies / use of ALD in SOFCs applications: Ø Low operating temperatures (<500°C) for micro systems such as portable applications. In µ-SOFCs, ultrathin electrolyte layers have a significant role and ALD presents a serious advantage.
ü The use of ultrathin catalytic or current-collector layers of Pt and Pt grid-patterned catalysts is common.
ü However, this approach supposes the direct use of hydrogen and contradicts the requirements of SOFCs in cogeneration: avoiding precious metals and using fuels as natural gas or biomass which implies a reforming process operating at around 600°C.
Ø The second tendency concerns electrolyte or catalysts interlayers
and / or cheaper electrode materials activated by ultrathin ALD-processed materials.
EFC 2013 Rome
State-of-the-Art Electrolyte, interfaces & current collectors: (i) Stabilized zirconia (e.g. YSZ): ZrO2, YSZ, ZrO2-In2O3 from few nm to 1 µm. on planar substrates, on porous electrodes and on pre-patterned surfaces (ii) Ceria and doped ceria (e.g. Gd0.2Ce0.8O2-d = GDC), YDC (iii) LaGaO3, which is a potential electrolyte when doped: LSGM (La0.9Sr0.1Ga0.8Mg0.2O3) (iv) BaZrO3, proton-conductor (v) Pt deposits (catalysts or/and current collectors)
Cathode: a) LaxSr1-xMnO3 (LSM) b) La1-xCaxMnO3: potential electrode c) La1-xSrxFeO3 (LSF)
Anode: LaGaO3-based materials when doped with Sr and Mg
Main teams: Prinz et al., Mc Intyre et al., Bent et al. (Standford), Niinistö et al (Helsinki), Cassir et al. (Paris), Nilsen et al. (Norway), …
Review “Input of Atomic Layer Deposition for Solid Oxide Fuel Cell Applications”, M. Cassir, A. Ringuedé, L. Ninistö, J. Mater. Chem., 20 (2010) 8987
EFC 2013 Rome
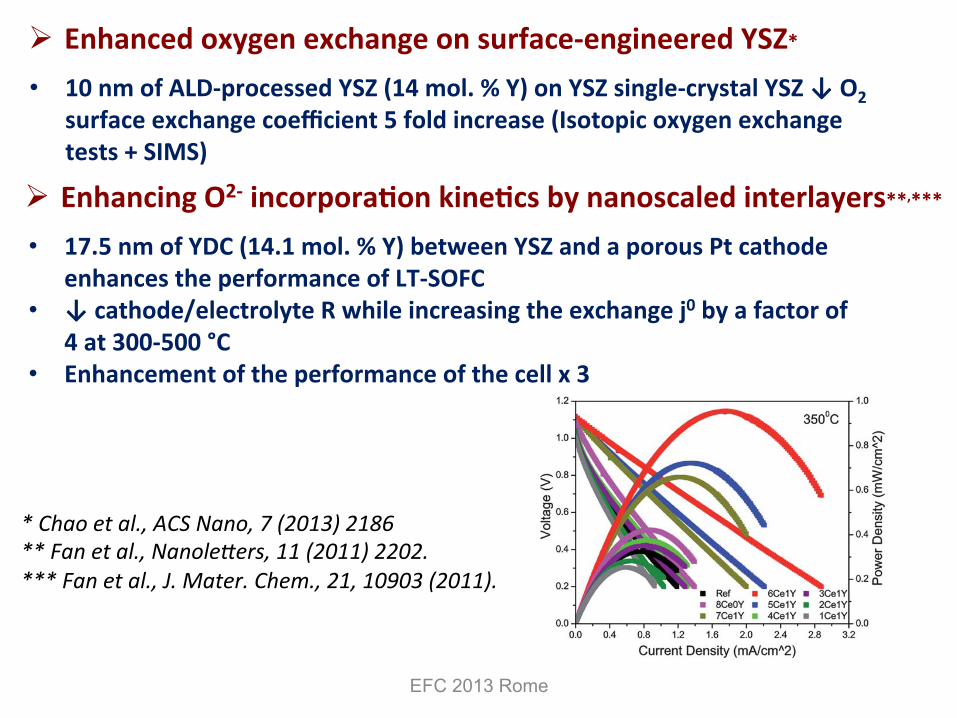
* Chao et al., ACS Nano, 7 (2013) 2186 ** Fan et al., Nanole:ers, 11 (2011) 2202. *** Fan et al., J. Mater. Chem., 21, 10903 (2011).
Ø Enhancing O2-‐ incorpora/on kine/cs by nanoscaled interlayers**,*** • 17.5 nm of YDC (14.1 mol. % Y) between YSZ and a porous Pt cathode
enhances the performance of LT-‐SOFC • ↓ cathode/electrolyte R while increasing the exchange j0 by a factor of
4 at 300-‐500 °C • Enhancement of the performance of the cell x 3
Ø Enhanced oxygen exchange on surface-‐engineered YSZ* • 10 nm of ALD-‐processed YSZ (14 mol. % Y) on YSZ single-‐crystal YSZ ↓ O2
surface exchange coefficient 5 fold increase (Isotopic oxygen exchange tests + SIMS)
EFC 2013 Rome

Grain sizes of 20-‐30 nm result in a high density of grain boundaries, which together with the OH-‐ incorpora?on tend to provoke the proton conduc?vity of the YSZ thin film (200 nm) 10 mW/cm² at 450°C
* Prinz et al., Chem. of Mater. 21, 3290 (2009) ** J. S. Park et al. , Chem. Of Mater., 22, 5366 (2010)
Ø Y-‐doped BaZrO3 proton conduc/ng membranes (BYZ) of 100 nm used in a single cell with Pt porous electrodes*
100 nm thin films: ü ALD-‐processed: 136 mW/cm² at 400°C ü PLD (pulsed laser deposi?on)-‐ processed : 120 mW/cm² at 450°C
Ø Proton conduc/on-‐based fuel cell with YSZ electrolyte by ALD**
EFC 2013 Rome

ZrO2-Y2O3 (YSZ) 8 mol% / LSM at 300°C .
990 nm nm 990 nm
990 nm 540 nm 280 nm
-6.5
-6
-5.5
-5
-4.5
-4
-3.5
-315 17 19 21 23 25 27
10000/T(K-1)
Log(σ(S.m-1))
E=0.33eV
E=0.34eV
E=0.40eVж Sample AΔ Sample BÅSample C
100°CT(°C)
200°C300°C
activation energies < 1 eV (bulk YSZ)
σi(280)<σi(540)≈σi(990)
Sl
Rmeas1=σ
C. Brahim, Appl.. Surf. Sci. 253 (2007) 3962 M. Cassir et al. Appl. Surf. Sci., 193 (2002) 120 M. Cassir et al., Patent WO02053798 (2002)
-4.00E+02
-2.00E+02
0.00E+00
2.00E+02
4.00E+02
6.00E+02
0.00E+00 2.00E+02 4.00E+02 6.00E+02 8.00E+02 1.00E+03 1.20E+03 1.40E+03
Z'/Ohm
-Z''/Ohm 6
54
3
210 -1
-2
6
54
3210
-1
-2
65 4 3
ж Sample AΔ Sample BÅ Sample C
EFC 2013 Rome
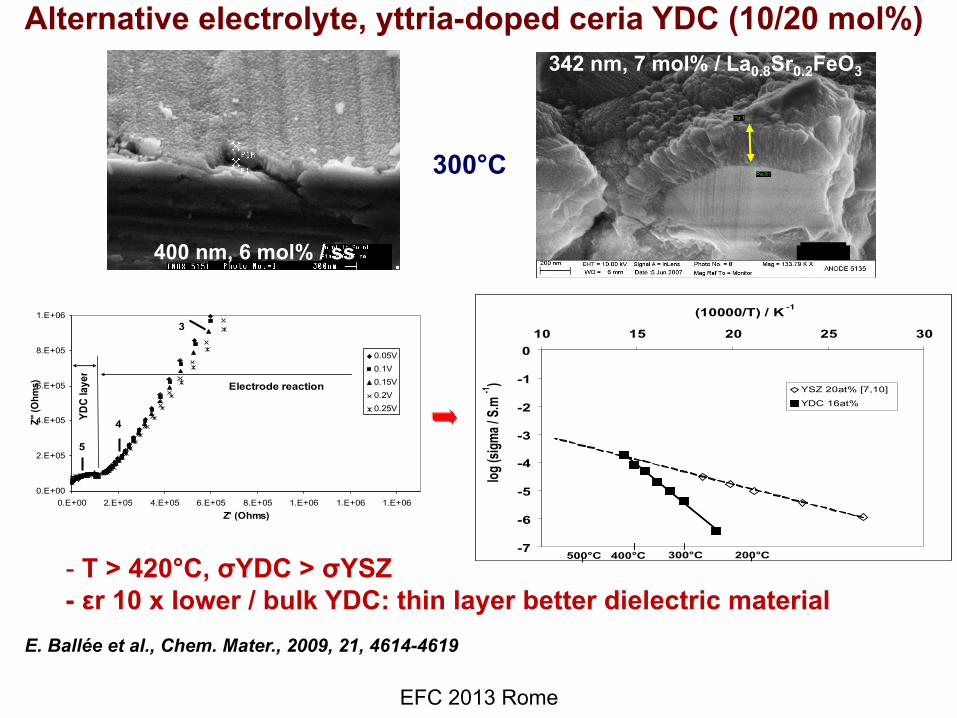
Alternative electrolyte, yttria-doped ceria YDC (10/20 mol%)
400 nm, 6 mol% / ss
342 nm, 7 mol% / La0.8Sr0.2FeO3
300°C
342 nm, 7 mol% / La0.8Sr0.2FeO3
0.E+00
2.E+05
4.E+05
6.E+05
8.E+05
1.E+06
0.E+00 2.E+05 4.E+05 6.E+05 8.E+05 1.E+06 1.E+06 1.E+06Z' (Ohms)
Z" (O
hms)
0.05V0.1V0.15V0.2V0.25V
3
4
5
YDC
laye
r
Electrode reaction
-7
-6
-5
-4
-3
-2
-1
010 15 20 25 30
(10000/T) / K -1
log (s
igma /
S.m
-1)
YSZ 20at% [7,10]
YDC 16at%
400°C 300°C500°C 200°C-7
-6
-5
-4
-3
-2
-1
010 15 20 25 30
(10000/T) / K -1
log (s
igma /
S.m
-1)
YSZ 20at% [7,10]
YDC 16at%
400°C 300°C500°C 200°C
- T > 420°C, σYDC > σYSZ - εr 10 x lower / bulk YDC: thin layer better dielectric material
E. Ballée et al., Chem. Mater., 2009, 21, 4614-4619 EFC 2013 Rome
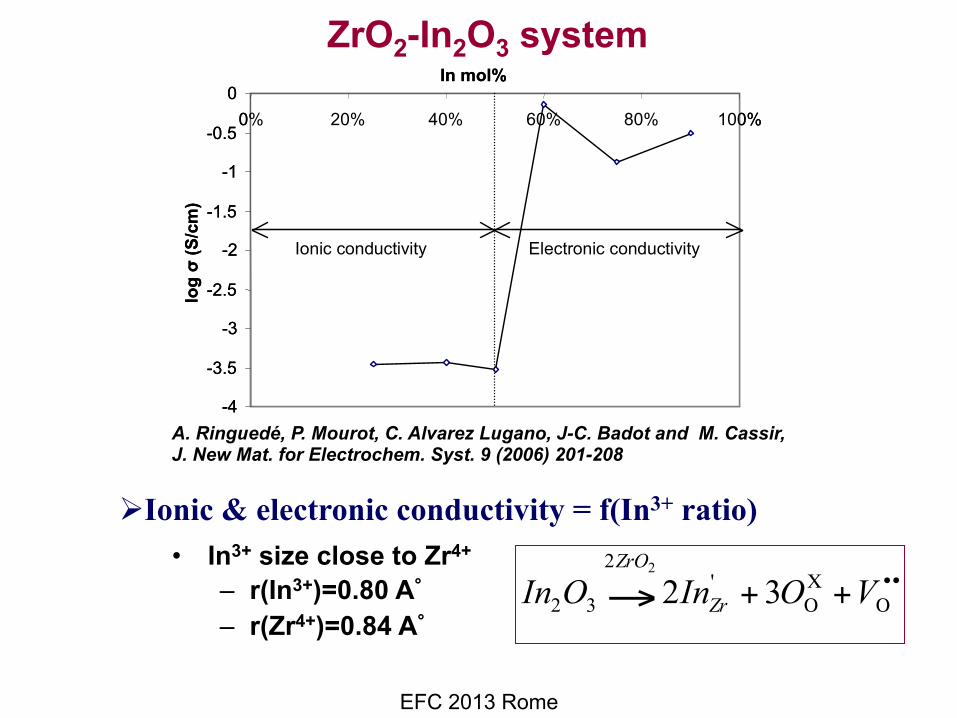
• In3+ size close to Zr4+ – r(In3+)=0.80 A° – r(Zr4+)=0.84 A°
Ø Ionic & electronic conductivity = f(In3+ ratio)
ZrO2-In2O3 system
••Ο
ΧΟ ++→ VOInOIn Zr
ZrO
32 '2
32
2
-4
-3.5
-3
-2.5
-2
-1.5
-1
-0.5
00% 20% 40% 60% 80% 100%
In mol%
log σ
(S/c
m)
Ionic conductivity Electronic conductivity
-4
-3.5
-3
-2.5
-2
-1.5
-1
-0.5
00% 20% 40% 60% 80% 100%
In mol%
log σ
(S/c
m)
Ionic conductivity Electronic conductivity
A. Ringuedé, P. Mourot, C. Alvarez Lugano, J-C. Badot and M. Cassir, J. New Mat. for Electrochem. Syst. 9 (2006) 201-208
EFC 2013 Rome
30 40 50 60 70 802θ (°)
Inte
nsité
(u.a
)
¿
¿
¿ ¿
Þ
Þ
Þ
Þ
Þ
¿ZrO2 ÞLSM
(a)
(b)
(111
)
(200
)
(220
)
(311
)
Þ
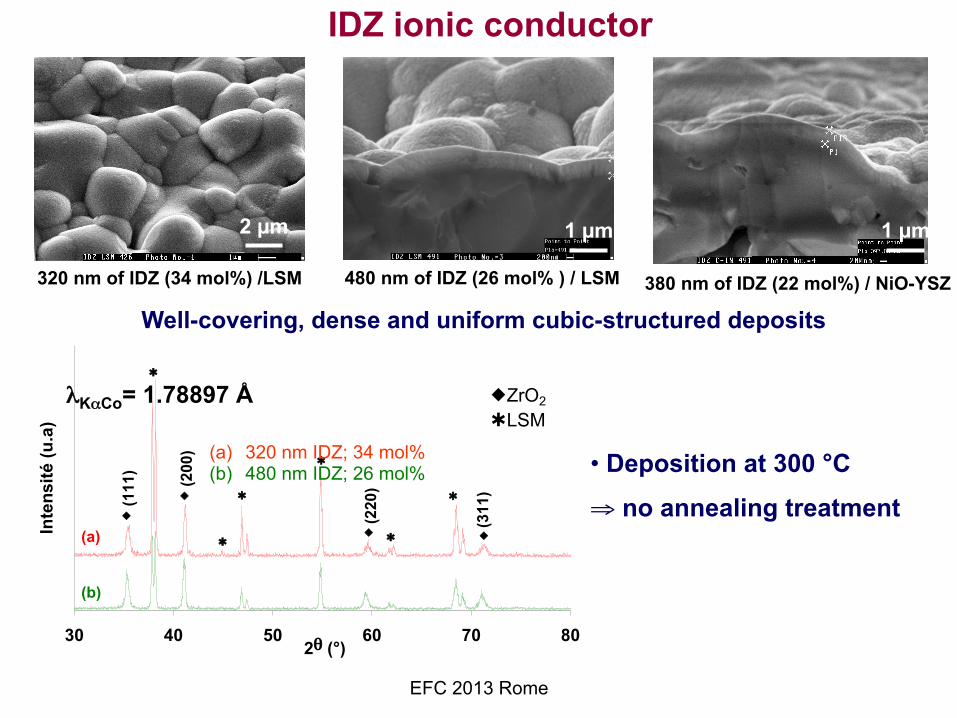
IDZ ionic conductor
320 nm of IDZ (34 mol%) /LSM 480 nm of IDZ (26 mol% ) / LSM 380 nm of IDZ (22 mol%) / NiO-YSZ Well-covering, dense and uniform cubic-structured deposits
λKαCo= 1.78897 Å
(a) 320 nm IDZ; 34 mol% (b) 480 nm IDZ; 26 mol%
• Deposition at 300 °C
⇒ no annealing treatment
2 µm 1 µm 1 µm 2 µm
EFC 2013 Rome
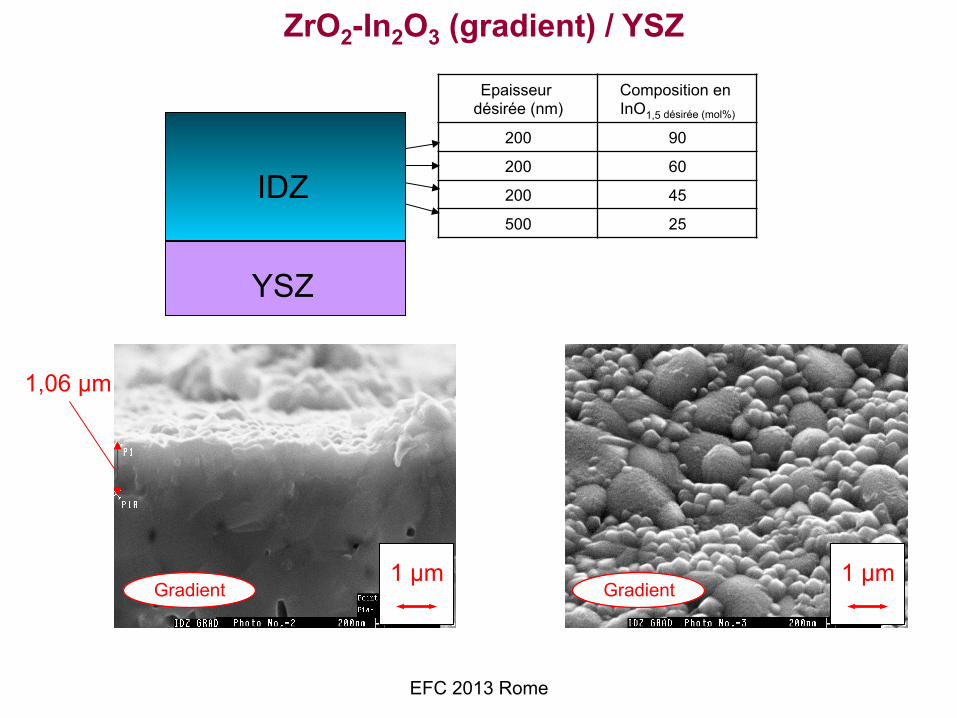
Gradient Gradient 1 µm 1 µm
1,06 µm
ZrO2-In2O3 (gradient) / YSZ
Epaisseur désirée (nm)
Composition en InO1,5 désirée (mol%)
200 90 200 60 200 45 500 25
YSZ
IDZ
EFC 2013 Rome

Electrical behaviour of the gradient
7
8
9
10
11
12
13
14
15
11 12 13 14 15 16 17 18 19 20 21
10000/T /K-1
Log
((R
/e)/(Ω
/m))
YSZ30%50%65%90%gradient HT
300°C400°C500°C
% In ≤ 65 % ⇒ R with % In
65%
50% 30%
90%
% In = 90 % ⇒ R
EFC 2013 Rome
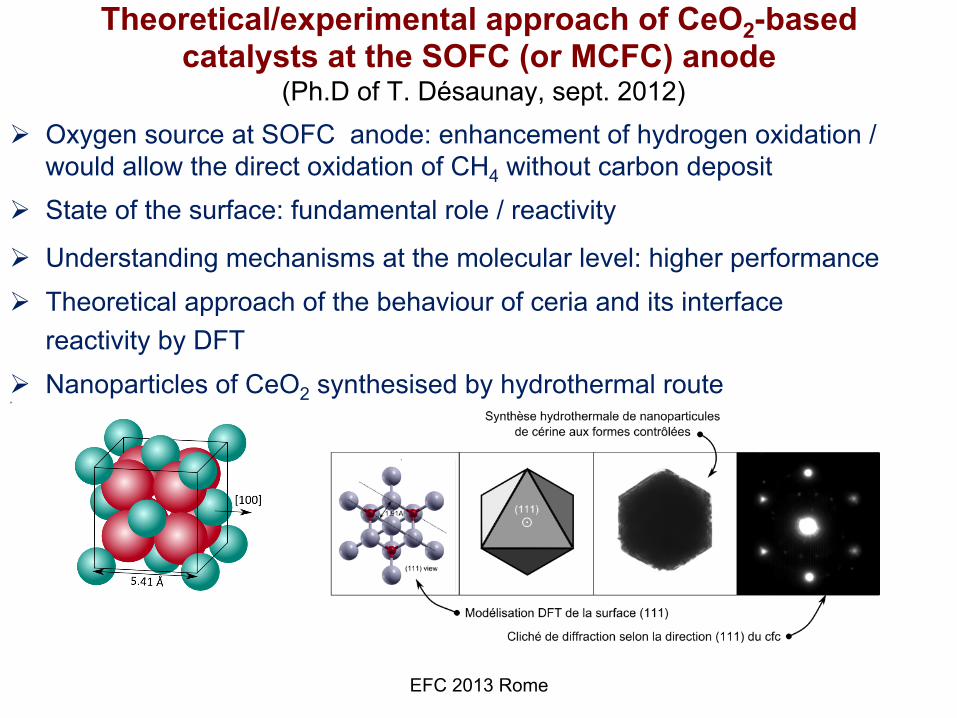
Theoretical/experimental approach of CeO2-based catalysts at the SOFC (or MCFC) anode
(Ph.D of T. Désaunay, sept. 2012) Ø Oxygen source at SOFC anode: enhancement of hydrogen oxidation /
would allow the direct oxidation of CH4 without carbon deposit Ø State of the surface: fundamental role / reactivity
Ø Understanding mechanisms at the molecular level: higher performance
Ø Theoretical approach of the behaviour of ceria and its interface reactivity by DFT
Ø Nanoparticles of CeO2 synthesised by hydrothermal route Ø
EFC 2013 Rome

Ø Reactivity: T-programmed reduction (TPR): T order: nanocubes (100) < nanowires (110) < nanooctahedra (111)
> > Ea (kJ/mol) : 70 < 130 < 430
Ø Thin-layered CeO2 / NiO-YSZ by ALD
EFC 2013 Rome
Al2O3 (102)
Y:ZrO2 (100)
SrTiO3 (100)
Non oriented

Thin layers for MCFC by ALD
H2 + CO2 + H2O ↓
Anode"Ni + 3% Cr"Li2CO3-Na2CO3/LiAlO2
Ni2+ → Ni (short-circuit)
LixNi1-xO → ↑"Cathode "O2 + CO2 ↑
!
Ni + 3% Cr"
Li2CO3-Na2CO3/LiAlO2
Thin layer < 1 µm"Ni/NiO
Protection of MCFC separator plates
Protection of the cathode cathode
Current collector Anticorrosion layer MCrAlY bond layer
Stainless steel
EFC 2013 Rome
Coatings
CeO2 TiO2 Nb2O5 Co3O4

EFC 2013 Rome
TiO2 + 2Li+ +CO32− → Li2TiO3 +CO2
LixTiyNiO3.59 ± 0.06 (x ≤ 0.5 and y ≤ 0.36): crystal structure similar to NiO
TiO2 coating (300 nm) / Ni in molten Li2CO3-K2CO3 at 650°C Before After 230 h Mapping: well-distributed mixed phase Ti-Ni-O
Sol. /
wt.ppm
Ni TiO2 / Ni (50 nm)
TiO2 / Ni (150 nm)
TiO2 /Ni (300 nm)
Ni 15 8.2 6.5 10
Ti 1.3 1.2 < 1
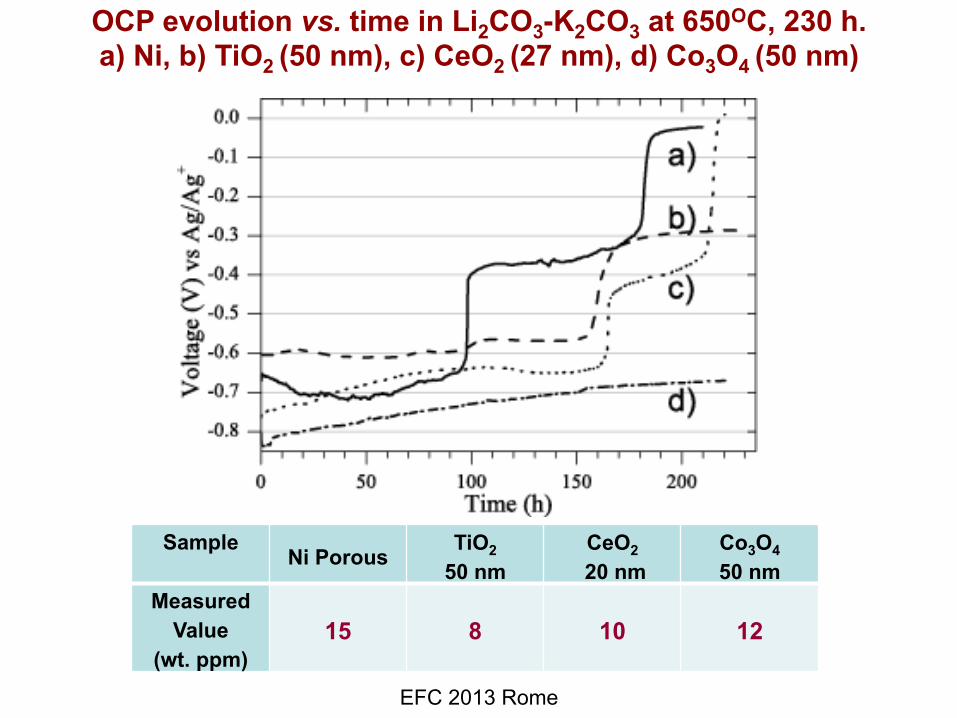
OCP evolution vs. time in Li2CO3-K2CO3 at 650OC, 230 h. a) Ni, b) TiO2 (50 nm), c) CeO2 (27 nm), d) Co3O4 (50 nm)
EFC 2013 Rome
Sample Ni Porous TiO2
50 nm CeO2
20 nm Co3O4 50 nm
Measured Value
(wt. ppm) 15 8 10 12
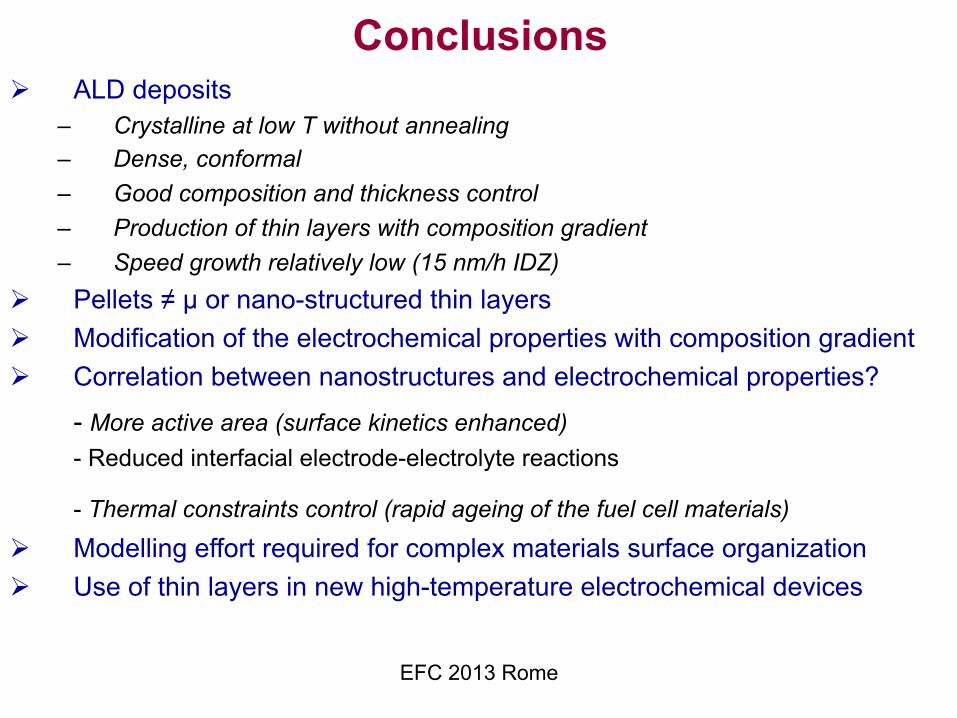
Conclusions Ø ALD deposits
– Crystalline at low T without annealing – Dense, conformal – Good composition and thickness control – Production of thin layers with composition gradient – Speed growth relatively low (15 nm/h IDZ)
Ø Pellets ≠ µ or nano-structured thin layers Ø Modification of the electrochemical properties with composition gradient Ø Correlation between nanostructures and electrochemical properties?
- More active area (surface kinetics enhanced) - Reduced interfacial electrode-electrolyte reactions
- Thermal constraints control (rapid ageing of the fuel cell materials) Ø Modelling effort required for complex materials surface organization Ø Use of thin layers in new high-temperature electrochemical devices
EFC 2013 Rome