atomic force spectroscopy using colloidal tips
TRANSCRIPT

Atomic Force Spectroscopy Using Colloidal Tips Functionalized withDried Crude Oil: A Versatile Tool to Investigate Oil−MineralInteractionsL. Rickard Dickinson,† Bart M. J. M. Suijkerbuijk,‡ Steffen Berg,‡ Fons H. M. Marcelis,‡
and Hannes C. Schniepp*,†
†Department of Applied Science, The College of William & Mary, PO Box 8795, Williamsburg, Virginia 23187, United States‡Shell Global Solutions International B.V., Kessler Park 1, 2288 GS Rijswijk, The Netherlands
*S Supporting Information
ABSTRACT: The recovery efficiency of water flooding (water injection in oil reservoirs to recover oil) can be improved bymodification of the ionic composition of the brine. This effect is attributed to changes in the physicochemical interactions withinin the crude oil−brine−rock (COBR) system. To systematically modify these interactions, gain predictive capability, andoptimize recovery efficiency, further understanding of these systems is required. Our work introduces a new tool to facilitate thestudy of interactions in such ternary systems. Utilizing atomic force spectroscopy, we developed a custom dried oil-coated probewhich directly measures the interactions between crude oil and a mineral substrate in a varying aqueous environment at theirnatural length scale. In most of the previous studies, COBR interactions were studied by using model systems wherein crude oilwas represented by organic acids, for instance, which is a significant simplification of natural systems that may be unwarranted. Inthis study, we measured the interaction forces between mineral surfaces and actual crude oils. The experiments allow us tosystematically test the effect of brine composition on the forces between mineral surfaces and crude oil components in all theircomplexity under realistic reservoir conditions. Our results illustrate the reproducibility of measurements made using this customtool by using multiple probes to show salinity-dependent repulsive interactions between the oil coating and a mica substrate.These electrostatic interactions are consistent with trends expected by the Debye−Huckel theory, showing a decrease in repulsiveforces as a function of increasing monovalent ion concentration. Adherence to this expected trend provides insight into theCOBR interactions in a particular oil reservoir with particular oil, brine, and mineral compositions. Additionally, the presence ofelectrostatic forces suggests that the dried crude oil coating retains surface charge throughout the drying procedure. Therefore,this tool has the potential to represent or approximate the electrostatic interactions of the original liquid crude oil system duringthe study of COBR interactions.
■ INTRODUCTION
Currently, much of the oil in reservoirs cannot be recovered byconventional methods such as natural depletion, gas injection,and water injection.1 On average, primary production extracts10−20% of oil from a reservoir, while water injection increasesthis extraction to 20−40% of the total oil.1−3 The recovery islimited by mainly two factors: the macroscopic sweepefficiency, which is impacted by factors like geologicalheterogeneity, and the microscopic displacement efficiency.Even in cases of optimum sweep, there is a significant amountof oil trapped in the pore space by capillary forces and oil−rockadhesion.4,5 It has been demonstrated that a promising way toaddress this problem and increase recovery efficiency is tomodify the brine composition of the injection water in order toalter the interactions between rock and crude oil.6,7
However, the effectiveness of this approach varies greatly: insome reservoirs the recovered amount of oil improvessignificantly when the salinity and/or composition of thebrine is altered, whereas in other cases the same measures showlittle to no effect.8−10 There also appears to be a differencebetween the ways in which the composition can impact oilrecovery from sandstone reservoirs versus carbonate reservoirs.However, the common denominator for both cases is that a
change in salinity and pH impacts the surface charge ofminerals present in the pore space which is hypothesized byabout 80% of the published literature to cause or contribute tothe observed low salinity effect.9,11−18 However, there are alsovarious alternative mechanisms proposed.10,19−21 Despitesignificant scrutiny of this subject over the past years, themain reasons for this variation remain rather elusive; our goal isto understand the underlying mechanisms at the pore scale,providing the basis for prediction and systematic optimizationof oil recovery.Systematic analysis of this problem is very complicated
because of the compositional complexity of both the crudes andthe minerals in the reservoirs, and because of the grainmicrostructure of the minerals22,23 and correspondinglyheterogeneous oil−water mineral contacts on the porescale.18 Reservoir rocks are predominantly composed of silicateand/or carbonate minerals, with great compositional andstructural variations depending on the location of the reservoirand the conditions during its formation. The rocks are
Received: July 29, 2016Revised: October 13, 2016Published: October 27, 2016
Article
pubs.acs.org/EF
© 2016 American Chemical Society 9193 DOI: 10.1021/acs.energyfuels.6b01862Energy Fuels 2016, 30, 9193−9202

composed of grains from different mineral species, withdiameters ranging from micrometers to millimeters andcorresponding variations in reservoir porosity (0−25%) andpermeability (1−2000 millidarcy).1 An example is given inFigure 1, which shows a false-color electron micrograph of apiece of Berea sandstone exposing secondary quartz and fine-grained quartz, with the pores between them clearly indicated;patches of kaolinite, a single dolomite crystal, and a detritalclaystone grain add further complexity to the sample surface.The surfaces of the different mineral species potentiallyundergo different chemical reactions in a given brinecomposition and pH and thus exhibit different surface chargedensities. Combined with the rock topography, this can lead tocomplex, highly heterogeneous surface charge distributions onthe rocks. Not only the minerals but also the crude oils exhibitwidely different compositions from reservoir to reservoir,22,24
with varying percentages of naphthenes (hydrocarbonscontaining cyclic features, 30−60 wt %), paraffins (saturatedlinear and branched hydrocarbons, 15−60 wt %), aromatics(3−30 wt %),1 and asphaltenes (heavier hydrocarbons withheteroatoms such as O, N, and S, 0−10 wt %), in addition tosmall amounts of other chemicals.1 Crude oil contains a rangeof components that have polar functional groups and are hencesurface active. At the crude oil−brine interface, the functionalgroups of these components can dissociate and are hencecharged.25 The interactions between the surfaces of the oildroplets and the surfaces of the rocks are determined by factorssuch as their charges, their chemical compositions, and theirtopographies. Specifically, the key aspect of both the oil and therock are their interfaces, not their bulk composition. Theseinterfaces govern the mutual interactions between thesecomponents of the subsurface system. Given the complexityof these systems and their compositional variation fromlocation to location, it is not surprising that the relativeimportance of electrostatic contributions to the oil−rockinteractions varies greatly between different reservoirs, and
with it the effect of the brines’ ionic composition on recoveryefficiency.The most direct way of testing the influence of brine
composition on oil recovery efficiency is through spontaneousimbibition tests or core flooding experiments.26 Theseexperiments are a standard in the oil industry and are typicallycarried out with crudes and mineral specimens directly from thereservoir and thus take into account the full complexity of thesesystems;1 in addition, they also provide the possibility to studythe influence of temperature, pH, and salinity on oilrecovery.5,21,27−34 However, these tests cover a wide range ofindividual aspects, which makes it very difficult to separateindividual contributions of different effects and to understandwhat is cause and what effect. Recent experiments with bettercontrol over individual parameters have shown that theadhesion of oil on clay-coated surfaces becomes weaker whenlowering the salinity.11 A disadvantage of all of these methodscarried out at a larger scale is that they inherently average overall the mineral components in the reservoir because of the sizeof the sample that is probed and thus cannot account forspecific local geometries. Thus, there is the need to focus moreon the details of the oil−solid contacts, which can beconsistently and qualitatively described by electrokineticmodeling.15,35
Our goal has been to develop predictive capabilities enablinga systematic reduction of oil−mineral adhesion for improvedrecovery. There is potential for a significantly more rigorousand causal understanding via experiments that avoid averagingover the inhomogeneities of the mineral surfaces and insteadfocus on the interactions between individual components. Thisapproach further promises the ability to translate interactionsfrom the nano- to microscale to a contribution in an effectivesurface energy or intrinsic contact angle, in other words, the“scale-up” process from molecular to pore scale.9 To achieveour goal, there are currently two major directions: contact anglemeasurements and force spectroscopy (FS) using atomic forcemicroscopy (AFM). For contact angle experiments, a droplet
Figure 1. False-color scanning electron microscopy (SEM) image showing the microscopic grain structure of a sandstone sample, featuringsecondary quartz (dark blue), fine grained quartz (light blue), a single dolomite crystal (yellow, see arrow), and a detrital claystone grain (orange, topleft corner), as well as kaolinite (green) and rock pores (red).
Energy & Fuels Article
DOI: 10.1021/acs.energyfuels.6b01862Energy Fuels 2016, 30, 9193−9202
9194

(typically crude oil or a subset of its components) is placed ontop of a smooth substrate of a well-defined mineral species(mica, silicon, silica, kaolinite) to determine wettability as afunction of pH,13,36−40 salinity,13,36−43 surfactants,44 solvents,45
and crude oil composition.46 One disadvantage of suchmeasurements is that specialized substrates are needed thatare pure in composition, smooth enough (to measure anintrinsic contact angle and avoid roughness-induced contactangle hysteresis and other artifacts), and large enough forcontact angle experiments. These requirements directly lead toquestions regarding the representativeness of such materials forthe subsurface. Moreover, such substrates are very challengingto produce for some of the mineral species relevant in reservoirrocks. Another disadvantage is that contact angle measurementsessentially probe the interfacial energies47 without revealingfurther details about the actual nature of the interactionsinvolved. The latter problem is addressed by FS48 based onliquid-cell AFM, which has proven very powerful to directlycharacterize these interfacial interactions. Furthermore, FS isable to directly determine the surface forces computed in theframework of the Debye−Huckel theory47 on the basis ofsurface charges obtained by zeta-potential measurements.In FS, the interaction forces between a nano- or microscopi-
cally small probe and a solid surface, immersed in a liquidmedium, are directly probed as a function of separation, withsubnanometer and piconewton resolutions of separation andforce, respectively. The general idea is that the materials usedon the surfaces of the AFM probe and the sample are similarenough to the oil and minerals such that the measured forcesare representative of the oil−mineral interactions in a reservoir.The liquid cell can be loaded with different brines to simulatewaterflooding conditions and test the effects of brinecomposition.A particular difficulty in FS is the preparation of the probe
and solid substrate such that the conditions in a reservoir areapproached and the measurements actually probe the oil−mineral interactions. For the AFM probe, two geometries havebeen employed: In a minority of the cases, regular “sharp” AFMprobes featuring diameters of a few nanometers have beenused49,50 (Figure 2A). More common are spherical (colloidal)probes featuring radii of a few micrometers (Figure 2B−E).39,40,51−57 Because of their larger size, colloidal probes aremechanically less fragile than sharp AFM probes; in addition,the larger colloidal probes provide stronger signals, and theirspherical geometry can be more easily compared to availablemodels. Regular AFM tips, in contrast, are optimized forsharpness but do not feature a well-defined geometry. When itcomes to the materials used for the probe and the substrate, avariety of setups have been used. In a few experiments, thesame material was used for tip and substrate (Figure 2B,C).This approach can be used to test the effect of brinecomposition on the interfacial behavior of only one reservoircomponent. This has been done for mineral components(Figure 2B) such as Illite (where Illite particles were used as
both the substrate and as a “pseudo spherical” colloidalprobe).58
Introducing a surface representing the oil phase into thesystem is particularly challenging, because it requiresfunctionalization of at least one surface to mimic the crude.In some cases, both the substrate and the colloidal probe werefunctionalized with substances to represent the oil (see Figure2C).40,56,57 The most representative approach, however, tostudying oil−mineral interactions with FS is to represent boththe oil and the mineral in the system. Therefore, either theprobe takes the role of the mineral and the substrate takes therole of the crude (Figure 2D)39,54,55 or vice versa (Figure2E).49,50,52,53 A disadvantage with the former approach is thatcolloidal spheres are available only in a very limited range ofmaterials; the sphere material closest to any of the mineralcomponents in reservoirs is amorphous silica, which was usedin multiple references.39,54,55 It is chemically similar but notidentical to quartz;22 for other mineral species found inreservoirs no colloidal spheres with similar surface chemistryare available. This problem can be addressed by having theprobe represent the oil and the substrate represent the mineral(see Figure 2E). Because the only requirement for the substrateis to be flat, many more materials become viable, and manymore of the mineral surfaces found in a reservoir can be probed.For example, researchers have measured the interactions on thefollowing simulated minerals: silicon,50 Illite,50 mica,50−52
glass,52,53 and sandstone grains.49
A final question is with which material we shouldfunctionalize the probe to best represent the crude, which ischallenging because of the complexity of crude oil. Most of thestudies have used a single substance, such as octadecane51 or n-decane,54 to represent the crude; in other cases, individualfunctional groups, such as −COOH49,50 and −CH3,
50 wereused to simulate polar or nonpolar oil interactions withminerals. While this dramatically simplified approach provideswell-defined experimental conditions, it remains unclearwhether this provides a realistic approximation to the behaviorof real crude. Some other experiments used a subset of thecrude oil components for functionalization, such as bitu-men,40,56 resin,53 and asphaltenes.53,57 Our goal was to stay asclose as possible to the conditions in the reservoir; therefore,we decided to use actual crude oil for functionalization.Hogshead et al. had previously used crude to functionalizesubstrates;55 however, as detailed in the previous paragraph,this means that the probe has to be used to represent themineral, which has several disadvantages. To overcome thislimitation, one can functionalize the AFM probes with crude,which has previously been demonstrated by Basu and Sharma,who determined the critical disjoining pressure between acrude-coated colloidal probe and a water film.51−53 A problemthey found in their work is that the oil pulls off the tip overtime, and tips thus need to be changed frequently.51−53
In the work presented here, we build on the idea offunctionalizing a colloidal AFM probe with crude oil. Thisapproach provides the ability to study the interactions with a
Figure 2. Graphical representation of possible experimental setups to measure oil−mineral interactions via force spectroscopy: using a probe torepresent the mineral (A, B, D) or the crude oil (black, C, E), and the substrate as the mineral (A, B, E) or the crude oil (black, C, D). Sharp probes(A) have been used, as well as colloidal probes (B−E).
Energy & Fuels Article
DOI: 10.1021/acs.energyfuels.6b01862Energy Fuels 2016, 30, 9193−9202
9195

wide range of minerals, which are introduced as solid substrates.However, we sought to develop a crude oil-coated probe that iscapable of conducting many measurements without significantoil loss. Such a probe enables longer-term experiments, forexample to monitor oil−mineral interactions as a function ofchanging solution composition without changing the probe. Weshow that coating a colloidal AFM probe in crude oil and thenallowing the lighter components to evaporate provides a robustoil layer that can be used to probe interactions with mineralsurfaces in aqueous solutions. This initial study tests electro-static forces as a function of salinity and shows that our dried oilprobe still holds electrostatic charges after the drying processand thus exhibits electromagnetic interactions similar to thoseof crude oil.
■ EXPERIMENTAL SECTIONMaterials.We used freshly cleaved mica (Ted Pella; PELCO, grade
V5) as an atomically smooth and homogeneous substrate. Sodiumchloride (Sigma-Aldrich; Certified ACS grade) and picopure water(Synergy UV Millipore) were used to make the solutions. The crudeoil that we utilized for coating both the wet and dried oil probes comesfrom an Asian oil field and was sampled at the well head to preventcontamination with production chemicals. The total acid number(TAN) of this crude was ≈0.25, determined according to ASTMStandard D 664. We built the colloidal probes from nonfunctionalizedsilica spheres (Bangs Laboratories; mean diameter, 7.27 ± 0.702 μm),tipless silicon nitride cantilevers (Bruker; MLCT-O10; nominal springconstant k = 0.05 N/m), and 5 min quick-set epoxy (Ace Hardware).Cantilevers with a relatively low spring constant were chosen tomeasure the weak electrostatic interactions.Manufacturing Crude-Functionalized Colloidal Probes. To
make the colloidal silica probes we attached the AFM probe to a three-dimensional translation stage which was mounted to an Olympus iX71inverted optical microscope. The following microscope objectives wereused for all analysis and to make the colloidal probes: MPLFLN-BD,5× (0.15 NA); MPLFLN-BD, 20× (0.45 NA); and MPLFLN-BD,100× (0.9 NA). The manufacturing process is illustrated in Figure 3.
To make the probes, a tipless cantilever (Figure 3A) was dipped intoan epoxy droplet that had previously been deposited onto a glass slide(Figure 3B) to attach a small amount of epoxy to its end (Figure 3C).The epoxy-coated cantilever was then brought into contact with a silicasphere on the same glass slide in order to glue it to the cantilever(Figure 3D). After the epoxy cured and the silica sphere was firmlyattached to the cantilever (Figure 3E), we dipped the probe into adroplet of crude oil (Figure 3F). At this stage of the preparationprocess, we classify it as a “wet” oil probe because the oil coating onthe sphere is still liquid.For reference purposes, we did some experiments with the “wet”
probes described in the previous paragraph; most probes, however,were further treated and converted into “dried” probes. Therefore,they were placed in an oven (Thermo Scientific; Lindberg Blue MV0914A vacuum oven) at 50 °C and ambient pressure to evaporatethe more volatile components in the oil and solidify the oil coating.After removal from the oven, the probes remained in ambient
conditions until the experiments were performed. This time spanvaried from a few hours to 5 days. A bare silica probe and the surfaceof a dried oil-coated probe were imaged via SEM using Amray 1810and Hitachi S-570 instruments. For SEM sample preparation, a gold/palladium coating was applied using an Anatech Hummer 6.2 sputtercoater.
Force Spectroscopy. To study the effect of the salinity, weperformed FS experiments (NT-MDT; Ntegra Prima) for each probein a higher-salinity environment (10 mM NaCl) at multiple locationson a mica substrate, followed by the lower-salinity measurements(1 mM NaCl). The experiments were performed at ambienttemperature and pressure. A closed liquid cell (NT-MDT; modelMP3LCNTF) was used to prevent changes in the concentration dueto evaporation. We then converted the raw FS force−displacementcurves to true force−distance curves.48 As the first step of this process,we vertically shifted all curves such that the zero of the deflection axiscorresponds to the relaxed cantilever. This process also removes thevertical offset among curves resulting from the gradual drift of thecantilever during an experiment. Second, we applied a linear fit to theconstant compliance region (in which the probe establishes “hard”contact with the surface) and shifted the curves horizontally such thatthe linear fit went through the origin. This procedure also defines thezero of separation. Finally, we scaled the data (so that the “hard”contact region represents the linear elastic response of the cantilever),converting the piezo extension to a tip−sample separation value andscaling of the data to units of force (based on the spring constant ofthe cantilever).
pH Measurements. To ensure that our results were notinfluenced by pH changes, we took five pH readings from thesolution in the liquid cell after each experiment (Oakton Instruments;CON 510 Series, using a Thermo Scientific Orion 9110DJWP DoubleJunction pH Electrode). The measured pH was compared to pHmeasured in the original stock solutions used to feed the liquid cell(Figure 4). These tests were done because changes in the pH would
potentially affect the charges of the investigated surfaces and thus theirwetting behavior.47 We found the pH values to be very stable; for the10 mM NaCl concentration, the measured pH was slightly higher afterthe experiment (5.5 ± 0.1) compared to before (5.3 ± 0.0). For 1 mMNaCl, there was no measurable pH difference before (5.2 ± 0.0) andafter (5.2 ± 0.1) the experiment. For the mica substrate, such little pHchanges will not modulate the surface charge substantially, because theisoelectric point of mica is much lower (pH 3−3.5).59 The oil surfacemay, however, be more susceptible to changes as the pH values arearound the pKa of carboxylic acids, which occur in crude oils. Theisoelectric point of the crude oils we used is not known. The overallrelatively low pH values are due to ingress of ambient CO2 into thestock solutions. The measured pH values around 5.5 are still, however,relevant to actual reservoir conditions.
Figure 3. Steps detailing the manufacturing procedure of our customAFM probe.
Figure 4. Stock solution (before experiment) and liquid cell solution(after experiment) pH averages for 10 mM NaCl and 1 mM NaCl(standard deviation given in the error bars).
Energy & Fuels Article
DOI: 10.1021/acs.energyfuels.6b01862Energy Fuels 2016, 30, 9193−9202
9196
■ RESULTS AND DISCUSSION
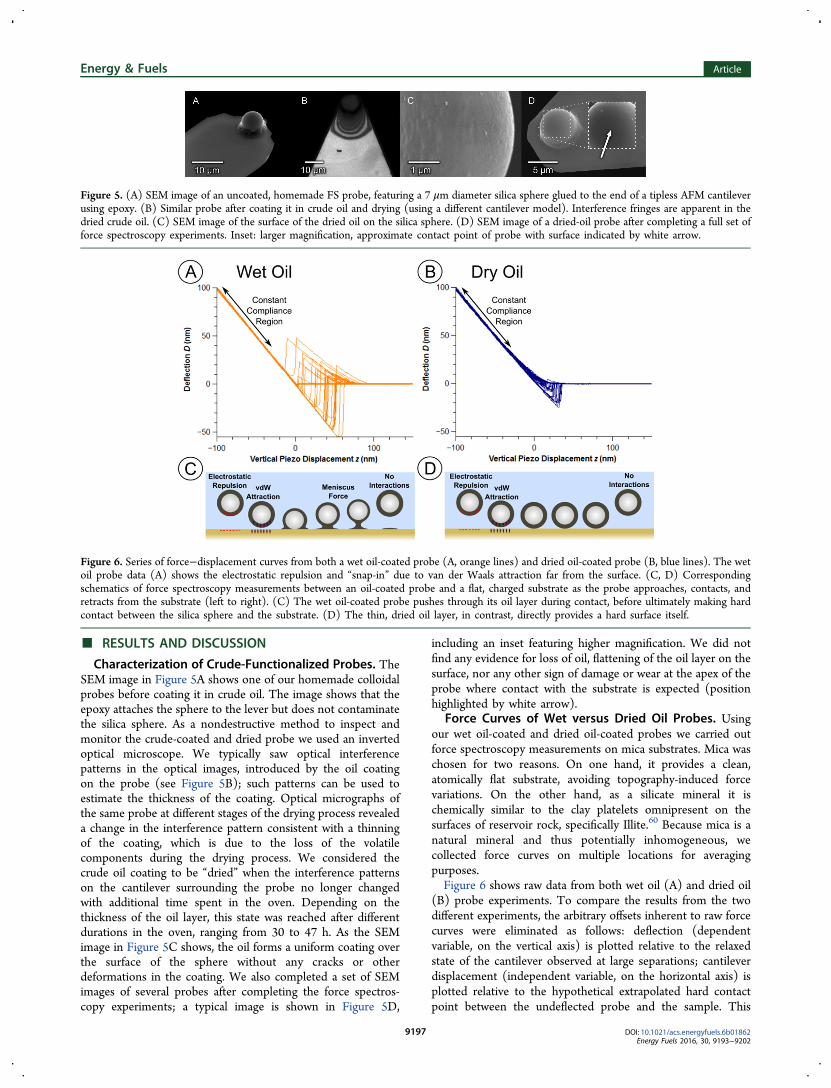
Characterization of Crude-Functionalized Probes. TheSEM image in Figure 5A shows one of our homemade colloidalprobes before coating it in crude oil. The image shows that theepoxy attaches the sphere to the lever but does not contaminatethe silica sphere. As a nondestructive method to inspect andmonitor the crude-coated and dried probe we used an invertedoptical microscope. We typically saw optical interferencepatterns in the optical images, introduced by the oil coatingon the probe (see Figure 5B); such patterns can be used toestimate the thickness of the coating. Optical micrographs ofthe same probe at different stages of the drying process revealeda change in the interference pattern consistent with a thinningof the coating, which is due to the loss of the volatilecomponents during the drying process. We considered thecrude oil coating to be “dried” when the interference patternson the cantilever surrounding the probe no longer changedwith additional time spent in the oven. Depending on thethickness of the oil layer, this state was reached after differentdurations in the oven, ranging from 30 to 47 h. As the SEMimage in Figure 5C shows, the oil forms a uniform coating overthe surface of the sphere without any cracks or otherdeformations in the coating. We also completed a set of SEMimages of several probes after completing the force spectros-copy experiments; a typical image is shown in Figure 5D,
including an inset featuring higher magnification. We did notfind any evidence for loss of oil, flattening of the oil layer on thesurface, nor any other sign of damage or wear at the apex of theprobe where contact with the substrate is expected (positionhighlighted by white arrow).
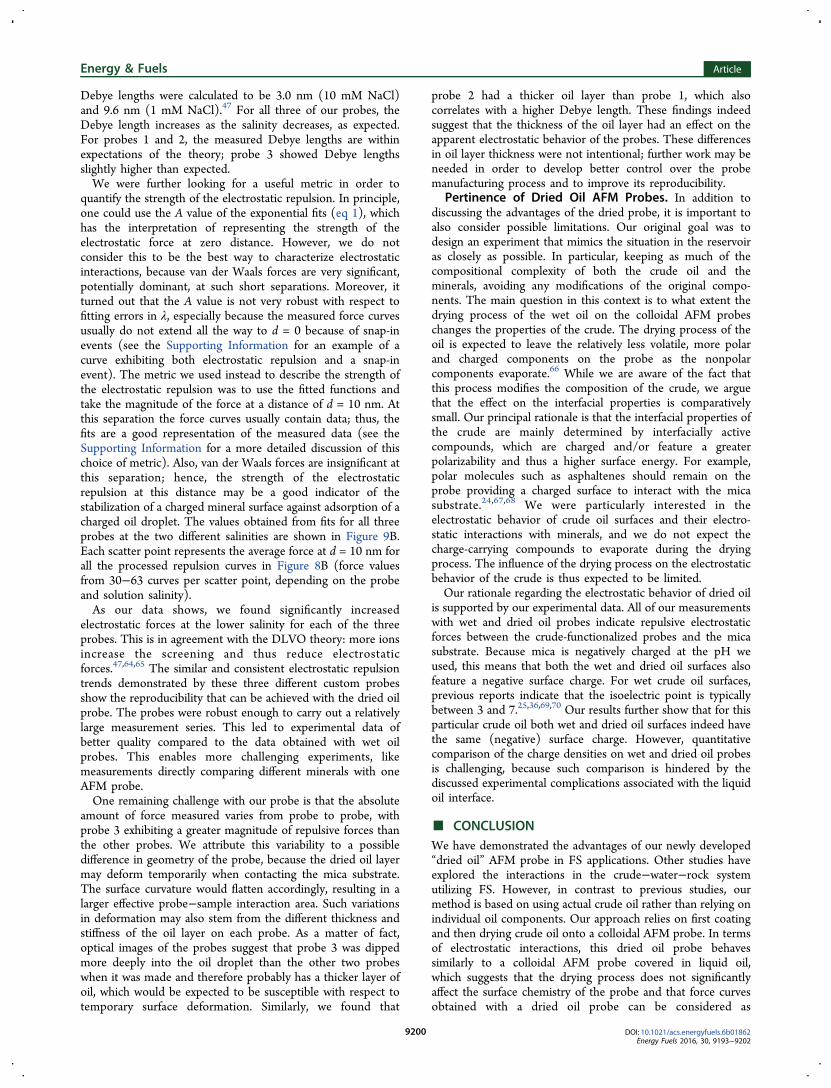
Force Curves of Wet versus Dried Oil Probes. Usingour wet oil-coated and dried oil-coated probes we carried outforce spectroscopy measurements on mica substrates. Mica waschosen for two reasons. On one hand, it provides a clean,atomically flat substrate, avoiding topography-induced forcevariations. On the other hand, as a silicate mineral it ischemically similar to the clay platelets omnipresent on thesurfaces of reservoir rock, specifically Illite.60 Because mica is anatural mineral and thus potentially inhomogeneous, wecollected force curves on multiple locations for averagingpurposes.Figure 6 shows raw data from both wet oil (A) and dried oil
(B) probe experiments. To compare the results from the twodifferent experiments, the arbitrary offsets inherent to raw forcecurves were eliminated as follows: deflection (dependentvariable, on the vertical axis) is plotted relative to the relaxedstate of the cantilever observed at large separations; cantileverdisplacement (independent variable, on the horizontal axis) isplotted relative to the hypothetical extrapolated hard contactpoint between the undeflected probe and the sample. This
Figure 5. (A) SEM image of an uncoated, homemade FS probe, featuring a 7 μm diameter silica sphere glued to the end of a tipless AFM cantileverusing epoxy. (B) Similar probe after coating it in crude oil and drying (using a different cantilever model). Interference fringes are apparent in thedried crude oil. (C) SEM image of the surface of the dried oil on the silica sphere. (D) SEM image of a dried-oil probe after completing a full set offorce spectroscopy experiments. Inset: larger magnification, approximate contact point of probe with surface indicated by white arrow.
Figure 6. Series of force−displacement curves from both a wet oil-coated probe (A, orange lines) and dried oil-coated probe (B, blue lines). The wetoil probe data (A) shows the electrostatic repulsion and “snap-in” due to van der Waals attraction far from the surface. (C, D) Correspondingschematics of force spectroscopy measurements between an oil-coated probe and a flat, charged substrate as the probe approaches, contacts, andretracts from the substrate (left to right). (C) The wet oil-coated probe pushes through its oil layer during contact, before ultimately making hardcontact between the silica sphere and the substrate. (D) The thin, dried oil layer, in contrast, directly provides a hard surface itself.
Energy & Fuels Article
DOI: 10.1021/acs.energyfuels.6b01862Energy Fuels 2016, 30, 9193−9202
9197

process is described in Experimental Section as the first twosteps in the curve processing procedure. Accordingly, all curvesexhibit zero deflection, D, at large displacements; they thenfeature a gradual onset of repulsive forces (upward cantileverdeflections D) as the probe approaches the surface (decreasingdisplacements z) for both the wet and the dried oil probe.However, the onset of repulsion of the wet oil in Figure 6Aoccurs at much greater piezo displacements z and features alarge scatter in these displacements compared to the dried oil(Figure 6B), which can be explained as follows. For the wet oilprobes consisting of a silica sphere covered in a wet oil layer(see Figure 6C), it is actually the silica sphere below the liquidoil layer that establishes hard contact with the substrate andthus defines the constant compliance region (indicated inFigure 6A), whereas the repulsive electrostatic interactionoccurs between the outer surface of the liquid oil covering thesilica sphere. Hence, there is an offset between the electrostaticinteractions and the hard repulsion, corresponding to thethickness of the oil layer. This thickness varies from probe toprobe and can also decrease during the experiment, in caseswhere the amount of oil on the probe is reduced because oftransfer to the substrate. Moreover, because of its mechanicalinstability, the oil−water interface is also subject to randommotions, thus introducing noise. The corresponding variationsin this offset can be observed in Figure 6A. Because the layerthickness is unknown, and because tip separation in AFM isdetermined only relative to the hard contact point, we havefound it impossible to quantitatively determine the actualseparation of the liquid oil surface from the substrate. For thedried oil probe, in contrast, it is the surface of the dried oil, andnot the silica sphere below it, that establishes contact with thesubstrate (Figure 6D) in the constant compliance region.Correspondingly, there is no offset in Figure 6B. Thisdemonstrates that the dried oil probes have several advantages:the interaction distance between the oil surface and thesubstrate can be quantitatively determined; the results are muchmore reproducible, and they do not directly depend on thethickness of the applied oil layer.Quantitative analysis of force spectroscopy data is challeng-
ing when the surface of the probe can deform significantly as afunction of separation,61,62 which is the case for the wet oil. Theapparent oil−mica repulsion increasingly pushes the oil surfaceaway from the mica as the probe comes closer to the surface.This systematic deformation of the interface leads to adeviation from the expected47,63 exponential behavior and
thus complicates comparison of the experimental data tomodels. To test our experimental data for the presence of thisphenomenon, the curves from Figure 6 were converted toforce−distance curves and plotted in Figure 7 with alogarithmic force scale. It is apparent that the curves from thewet oil probes are not straight lines (Figure 7A), as would beexpected for exponential functions, but systematically deviatetoward smaller forces at shorter distances. This can beexplained by the compression of the oil layer due to repulsiveforces, which gradually increases the actual separation betweenthe surfaces during approach and thus lowers the repulsiveforces. For the dried oil probe, in contrast, the force curvesshow the expected exponential trend over the entire distance(Figure 7B). The suspected flattening of the wet oil dropletwould also be expected to increase the effective probe−substrate interaction area. This is consistent with ourobservation that the maximal repulsive force, indicated byscatter points at the end of each plotted curve in Figure 7, wassystematically higher for the wet probes (0.8 ± 0.6 nN) incomparison to the dried probes (0.1 ± 0.2 nN).The fact that the separation measurements for the wet oil
probe are dependent on the varying thickness of the oil layerparticularly complicates the fitting procedure. Usually, thisregion of the true force−distance curve, F(d), is fitted with afunction of the form
= · λ−F d A( ) e d/ (1)
where λ is the Debye length47 and A is the electrostaticrepulsion at zero separation. However, an additional offset, Δd,due to the liquid layer on the probe will introduce a potentiallyvery large artificial correction eΔd/λ to the fit parameter A, withno direct meaning in terms of an actual electrostatic force.Correspondingly, in case of a wet oil coating on the probe, A isno longer a quantitative measure for the absolute strength ofthe electrostatic repulsion. This made it impossible for us toquantitatively compare the strength of the electrostaticrepulsion measured with liquid coatings of different thickness.Our newly developed dried oil probes avoid all of thesedifficulties and thus allow for a more quantitative analysis of theforce data.
Application of Dried Oil Probes. To demonstrate theversatility and durability of our dried oil probes, we carried outa series of FS experiments on mica, using three different probes(“1”, “2”, and “3”), all coated with the same type of crude oil.
Figure 7. Repulsive region of processed curves from Figure 6 plotted with a logarithmic force scale to indicate deviation from an exponential trend.The maximum force in each curve is indicated by a scatter point.
Energy & Fuels Article
DOI: 10.1021/acs.energyfuels.6b01862Energy Fuels 2016, 30, 9193−9202
9198

Each force spectroscopy experiment was carried out in 10 mMand 1 mM aqueous NaCl solutions in order to studyelectrostatic interactions as a function of salinity. Figure 8summarizes all of our data taken from the three different probesat the two salinities, showing both the approaching force−displacement curves (A) and corresponding true force−distance curves (B). In Figure 8A (force−displacement curves)98% of all individual force curves collected are shown; onlyabout 2% of the curves had erratic shapes, for instance whenthe probe never disengaged from the surface. Some curves forprobes 2 and 3 exhibited van der Waals attraction (Figure 8A),while the curves for probe 1 did not.
In Figure 8B only the curves from Figure 8A that exhibitedmeasurable repulsion (75% of all curves) are plotted as trueforce−distance curves. The remaining curves either exhibitedno repulsion (20%) or exhibited repulsion far from the surface(3%; predominantly isolated to probe 2). Relying on the 75%of curves that exhibited measurable electrostatic repulsion(Figure 8B), we sought to quantitatively compare the effect ofsalinity on electrostatic forces between the oil coating and micasubstrate. Therefore, we computed the Debye length for eachindividual true force−displacement curve by carrying out anexponential fit; averages and standard deviations (error bars)are shown in Figure 9A. Based on Debye−Huckel theory,
Figure 8. Force−displacement curves for dried oil probe (A) and corresponding true force−distance curves that exhibited repulsion (B).
Figure 9. Average Debye length of exponential fits taken from processed repulsion curve data (A) and average electrostatic repulsion values at 10 nmseparation distance between the three custom probes and mica substrate at two different liquid cell solution molarities (for a total of six scatterpoints) (B). For these solution molarities, the calculated Debye lengths based on theory are 3.0 nm (10 mM NaCl) and 9.6 nm (1 mM NaCl).47
Energy & Fuels Article
DOI: 10.1021/acs.energyfuels.6b01862Energy Fuels 2016, 30, 9193−9202
9199
Debye lengths were calculated to be 3.0 nm (10 mM NaCl)and 9.6 nm (1 mM NaCl).47 For all three of our probes, theDebye length increases as the salinity decreases, as expected.For probes 1 and 2, the measured Debye lengths are withinexpectations of the theory; probe 3 showed Debye lengthsslightly higher than expected.We were further looking for a useful metric in order to
quantify the strength of the electrostatic repulsion. In principle,one could use the A value of the exponential fits (eq 1), whichhas the interpretation of representing the strength of theelectrostatic force at zero distance. However, we do notconsider this to be the best way to characterize electrostaticinteractions, because van der Waals forces are very significant,potentially dominant, at such short separations. Moreover, itturned out that the A value is not very robust with respect tofitting errors in λ, especially because the measured force curvesusually do not extend all the way to d = 0 because of snap-inevents (see the Supporting Information for an example of acurve exhibiting both electrostatic repulsion and a snap-inevent). The metric we used instead to describe the strength ofthe electrostatic repulsion was to use the fitted functions andtake the magnitude of the force at a distance of d = 10 nm. Atthis separation the force curves usually contain data; thus, thefits are a good representation of the measured data (see theSupporting Information for a more detailed discussion of thischoice of metric). Also, van der Waals forces are insignificant atthis separation; hence, the strength of the electrostaticrepulsion at this distance may be a good indicator of thestabilization of a charged mineral surface against adsorption of acharged oil droplet. The values obtained from fits for all threeprobes at the two different salinities are shown in Figure 9B.Each scatter point represents the average force at d = 10 nm forall the processed repulsion curves in Figure 8B (force valuesfrom 30−63 curves per scatter point, depending on the probeand solution salinity).As our data shows, we found significantly increased
electrostatic forces at the lower salinity for each of the threeprobes. This is in agreement with the DLVO theory: more ionsincrease the screening and thus reduce electrostaticforces.47,64,65 The similar and consistent electrostatic repulsiontrends demonstrated by these three different custom probesshow the reproducibility that can be achieved with the dried oilprobe. The probes were robust enough to carry out a relativelylarge measurement series. This led to experimental data ofbetter quality compared to the data obtained with wet oilprobes. This enables more challenging experiments, likemeasurements directly comparing different minerals with oneAFM probe.One remaining challenge with our probe is that the absolute
amount of force measured varies from probe to probe, withprobe 3 exhibiting a greater magnitude of repulsive forces thanthe other probes. We attribute this variability to a possibledifference in geometry of the probe, because the dried oil layermay deform temporarily when contacting the mica substrate.The surface curvature would flatten accordingly, resulting in alarger effective probe−sample interaction area. Such variationsin deformation may also stem from the different thickness andstiffness of the oil layer on each probe. As a matter of fact,optical images of the probes suggest that probe 3 was dippedmore deeply into the oil droplet than the other two probeswhen it was made and therefore probably has a thicker layer ofoil, which would be expected to be susceptible with respect totemporary surface deformation. Similarly, we found that
probe 2 had a thicker oil layer than probe 1, which alsocorrelates with a higher Debye length. These findings indeedsuggest that the thickness of the oil layer had an effect on theapparent electrostatic behavior of the probes. These differencesin oil layer thickness were not intentional; further work may beneeded in order to develop better control over the probemanufacturing process and to improve its reproducibility.
Pertinence of Dried Oil AFM Probes. In addition todiscussing the advantages of the dried probe, it is important toalso consider possible limitations. Our original goal was todesign an experiment that mimics the situation in the reservoiras closely as possible. In particular, keeping as much of thecompositional complexity of both the crude oil and theminerals, avoiding any modifications of the original compo-nents. The main question in this context is to what extent thedrying process of the wet oil on the colloidal AFM probeschanges the properties of the crude. The drying process of theoil is expected to leave the relatively less volatile, more polarand charged components on the probe as the nonpolarcomponents evaporate.66 While we are aware of the fact thatthis process modifies the composition of the crude, we arguethat the effect on the interfacial properties is comparativelysmall. Our principal rationale is that the interfacial properties ofthe crude are mainly determined by interfacially activecompounds, which are charged and/or feature a greaterpolarizability and thus a higher surface energy. For example,polar molecules such as asphaltenes should remain on theprobe providing a charged surface to interact with the micasubstrate.24,67,68 We were particularly interested in theelectrostatic behavior of crude oil surfaces and their electro-static interactions with minerals, and we do not expect thecharge-carrying compounds to evaporate during the dryingprocess. The influence of the drying process on the electrostaticbehavior of the crude is thus expected to be limited.Our rationale regarding the electrostatic behavior of dried oil
is supported by our experimental data. All of our measurementswith wet and dried oil probes indicate repulsive electrostaticforces between the crude-functionalized probes and the micasubstrate. Because mica is negatively charged at the pH weused, this means that both the wet and dried oil surfaces alsofeature a negative surface charge. For wet crude oil surfaces,previous reports indicate that the isoelectric point is typicallybetween 3 and 7.25,36,69,70 Our results further show that for thisparticular crude oil both wet and dried oil surfaces indeed havethe same (negative) surface charge. However, quantitativecomparison of the charge densities on wet and dried oil probesis challenging, because such comparison is hindered by thediscussed experimental complications associated with the liquidoil interface.
■ CONCLUSIONWe have demonstrated the advantages of our newly developed“dried oil” AFM probe in FS applications. Other studies haveexplored the interactions in the crude−water−rock systemutilizing FS. However, in contrast to previous studies, ourmethod is based on using actual crude oil rather than relying onindividual oil components. Our approach relies on first coatingand then drying crude oil onto a colloidal AFM probe. In termsof electrostatic interactions, this dried oil probe behavessimilarly to a colloidal AFM probe covered in liquid oil,which suggests that the drying process does not significantlyaffect the surface chemistry of the probe and that force curvesobtained with a dried oil probe can be considered as
Energy & Fuels Article
DOI: 10.1021/acs.energyfuels.6b01862Energy Fuels 2016, 30, 9193−9202
9200
representative of crude oil. In comparison to wet oil probes,however, it provides much greater stability and durability, and itprovides experimental data of significantly higher quality, asdemonstrated by our results. The probe surface is more robustand maintains its geometry; moreover, the obtained forcecurves establish a point of zero separation, which enables themeasurement of absolute probe−sample separations. Becauseof this robustness, the probes are not deformed as theyapproach the surface; thus, undistorted force curves can beobtained. The probes are stable enough to allow thecompletion of many experiments; therefore, quantitativecomparisons for interactions with different minerals or insolutions of different composition can be established with thesame probe. As is the case in general with scanning probetechniques, such comparative experiments with the same probeare particularly important, because fluctuations in the behaviorof different probes are notorious, mainly because of geometricaldifferences.In conclusion, the dried oil probe we developed represents a
highly versatile tool for quantitative measurement of theinteraction forces in a crude oil−brine−rock system. Thisapproach is expected to work with every crude oil in principle,and the size of the probe is small enough to test interactionswith individual grains of reservoir rock. We thus believe thatthis will become a powerful tool to improve our fundamentalunderstanding of crude−mineral interactions.
■ ASSOCIATED CONTENT*S Supporting InformationThe Supporting Information is available free of charge on theACS Publications website at DOI: 10.1021/acs.energy-fuels.6b01862.
Discussion of a sample force curve and of our metric toassess the strength of the electrostatic interactions (PDF)
■ AUTHOR INFORMATIONCorresponding Author*Tel.: (757) 221-2559. Fax: (757) 221-2050. E-mail:[email protected] authors declare no competing financial interest.
■ ACKNOWLEDGMENTSThis work was financially supported by Shell Global SolutionsInternational B.V. H.C.S. acknowledges support from the U.S.National Science Foundation under Grant 1534428. Weacknowledge William W. Dickinson for help with scanningelectron microscopy.
■ REFERENCES(1) Hyne, N. J. Nontechnical Guide to Petroleum Geology, Exploration,Drilling, and Production, 2nd ed.; Penn Well Corporation: Tulsa, OK,2001.(2) Lake, L. Enhanced Oil Recovery; Prentice Hall: Englewood Cliffs,NJ, 1989.(3) Lake, L. W.; Johns, R.; Rossen, B.; Pope, G. Fundamentals ofEnhanced Oil Recovery; Society of Petroleum Engineers: Richardson,TX, 2014.(4) Agbalaka, C.; Dandekar, A. Y.; Patil, S. L.; Khataniar, S.; Hemsath,J. R. In SPE Asia Pacif ic Oil & Gas Conference and Exhibition; Societyof Petroleum Engineers (SPE): Perth, Australia, 2008.(5) Sharma, M. M.; Filoco, P. R. SPE Journal 2000, 5 (3), 293−300.
(6) Dake, L. Fundamentals of Reservoir Engineering, 1st ed.; Elsevier:Oxford, UK, 1978.(7) Huang, J. S.; Varadaraj, R. Curr. Opin. Colloid Interface Sci. 1996,1, 535−539.(8) Skrettingland, K.; Holt, T.; Tweheyo, M. T.; Skjevrak, I. SPEReservoir Evaluation & Engineering 2011, 14 (2), 182−192.(9) Suijkerbuijk, B. M. J. M.; Kuipers, H. P. C. E.; Kruijsdijk, C. P. J.W. van; Berg, S.; Winden, J. F. van; Ligthelm, D. J.; Mahani, H.;Almada, M. P.; Pol, E.; Van den Niasar, V. J.; Romanuka, J.; Vermolen,E. C. M.; Al-Qarshubi, I. S. M. In International Petroleum TechnologyConference; Beijing, China, 2013.(10) Zhang, Y.; Morrow, N. R. In SPE/DOE Symposium on ImprovedOil Recovery; Society of Petroleum Engineers (SPE): Tulsa, OK, 2006;pp 1−14.(11) Berg, S.; Cense, A. W.; Jansen, E.; Bakker, K. Petrophysics 2010,51 (05).(12) Cense, A.; Berg, S.; Jansen, E.; Bakker, K. In SPE Enhanced OilRecovery Conference; Society of Petroleum Engineers: Kuala Lumpur,Malaysia, 2011.(13) Mahani, H.; Berg, S.; Ilic, D.; Bartels, W.-B.; Joekar-Niasar, V. InSPE Enhanced Oil Recovery Conference; Society of PetroleumEngineers: Kuala Lumpur, Malaysia, 2013; pp 1−14.(14) Mahani, H.; Keya, A. L.; Berg, S.; Bartels, W.-B.; Nasralla, R.;Rossen, W. In EUROPEC 2015; Society of Petroleum Engineers(SPE): Madrid, Spain, 2015; pp 1−27.(15) Mahani, H.; Berg, S.; Ilic, D.; Bartels, W.-B.; Joekar-Niasar, V.SPE Journal 2015, 20 (01), 8−20.(16) Mahani, H.; Keya, A. L.; Berg, S.; Bartels, W.-B.; Nasralla, R.;Rossen, W. R. Energy Fuels 2015, 29 (3), 1352−1367.(17) Mahani, H.; Keya, A. L.; Berg, S.; Nasralla, R. In SPE ReservoirCharacterisation and Simulation Conference and Exhibition; Society ofPetroleum Engineers (SPE): Abu Dhabi, 2015.(18) Schmatz, J.; Urai, J. L.; Berg, S.; Ott, H. Geophys. Res. Lett. 2015,42 (7), 2189−2195.(19) Chavez-Miyauchi, T. E.; Firoozabadi, A.; Fuller, G. G. Langmuir2016, 32 (9), 2192−2198.(20) Fredriksen, S. B.; Rognmo, A. U.; Fernø, M. A. In SPE BergenOne Day Seminar; Society of Petroleum Engineers (SPE), 2016.(21) Tang, G.-Q.; Morrow, N. R. J. Pet. Sci. Eng. 1999, 24 (2−4), 99−111.(22) Cuiec, L. E. In Fall Meeting of the Society of Petroleum Engineers ofAIME; Society of Petroleum Engineers (SPE): Dallas, TX, 1975.(23) Zhu, Y.; Weng, H.; Chen, Z.; Chen, Q. J. Pet. Sci. Eng. 2003, 38,1−11.(24) Tissot, B. P.; Welte, D. H. Petroleum Formation and Occurrence,2nd ed.; Springer-Verlag: Berlin, 1984.(25) Buckley, J. S. In Proceedings of the 3rd International Symposium onEvaluation of Reservoir Wettability and Its Effect on Oil Recovery;Laramie, WY, 1994; pp 33−38.(26) Anderson, W. G. JPT, J. Pet. Technol. 1986, 38 (11), 1246−1262.(27) Aksulu, H.; Hamsø, D.; Strand, S.; Puntervold, T.; Austad, T.Energy Fuels 2012, 26, 3497−3503.(28) Austad, T.; Shariatpanahi, S. F.; Strand, S.; Black, C. J. J.; Webb,K. J. Energy Fuels 2012, 26, 569−575.(29) Buckley, J. S. Curr. Opin. Colloid Interface Sci. 2001, 6, 191−196.(30) Hadia, N. J.; Hansen, T.; Tweheyo, M. T.; Torsæter, O. EnergyFuels 2012, 26, 4328−4335.(31) Kumar, M.; Fogden, A.; Morrow, N. R.; Buckley, J. S.Petrophysics 2011, 52 (6), 428−436.(32) Lager, A.; Webb, K. J.; Black, C. J. J.; Singleton, M.; Sorbie, K. S.In International Symposium of the Society of Core Analysts; Society ofCore Analysts: Trondheim, Norway, 2006.(33) Yildiz, H. O.; Morrow, N. R. J. Pet. Sci. Eng. 1996, 14, 159−168.(34) Zhou, X.; Morrow, N. R.; Ma, S. SPE Journal 2000, 5 (2), 199−207.(35) Joekar-Niasar, V.; Mahani, H. Ind. Eng. Chem. Res. 2016, 55(21), 6227−6235.(36) Drummond, C.; Israelachvili, J. J. Pet. Sci. Eng. 2004, 45, 61−81.
Energy & Fuels Article
DOI: 10.1021/acs.energyfuels.6b01862Energy Fuels 2016, 30, 9193−9202
9201

(37) Lebedeva, E. V.; Fogden, A. Environ. Sci. Technol. 2010, 44,9470−9475.(38) Lebedeva, E. V.; Fogden, A. Colloids Surf., A 2011, 377, 115−122.(39) Liu, J.; Xu, Z.; Masliyah, J. Langmuir 2003, 19, 3911−3920.(40) Liu, J.; Xu, Z.; Masliyah, J. Colloids Surf., A 2005, 260, 217−228.(41) Hassenkam, T.; Andersson, M. P.; Hilner, E.; Matthiesen, J.;Dobberschutz, S.; Dalby, K. N.; Bovet, N.; Stipp, S. L. S.; Salino, P.;Reddick, C.; Collins, I. R. SPE Journal 2016, 21 (03), 720−729.(42) Pedersen, N. R.; Hassenkam, T.; Ceccato, M.; Dalby, K. N.;Mogensen, K.; Stipp, S. L. S. Energy Fuels 2016, 30 (5), 3768−3775.(43) Shi, L.; Olsson, M. H. M.; Hassenkam, T.; Stipp, S. L. S. EnergyFuels 2016, 30, 5346.(44) Seiedi, O.; Rahbar, M.; Nabipour, M.; Emadi, M. A.; Ghatee, M.H.; Ayatollahi, S. Energy Fuels 2011, 25, 183−188.(45) Kumar, K.; Dao, E.; Mohanty, K. K. J. Colloid Interface Sci. 2005,289, 206−217.(46) Lord, D. L.; Buckley, J. S. Colloids Surf., A 2002, 206, 531−546.(47) Israelachvili, J. N. Intermolecular and Surface Forces, 2nd ed.;Academic Press: New York, 1992.(48) Cappella, B.; Dietler, G. Surf. Sci. Rep. 1999, 34, 1−104.(49) Hassenkam, T.; Pedersen, C. S.; Dalby, K.; Austad, T.; Stipp, S.L. S. Colloids Surf., A 2011, 390, 179−188.(50) Hassenkam, T.; Mitchell, A. C.; Pedersen, C. S.; Skovbjerg, L.L.; Bovet, N.; Stipp, S. L. S. Colloids Surf., A 2012, 403, 79−86.(51) Basu, S.; Sharma, M. M. J. Colloid Interface Sci. 1996, 181, 443−455.(52) Basu, S.; Sharma, M. M. SPE Journal 1997, 2, 427−435.(53) Basu, S.; Sharma, M. M. SPE Journal 1999, 4 (3), 235−241.(54) Hartley, P. G.; Grieser, F.; Mulvaney, P.; Stevens, G. W.Langmuir 1999, 15, 7282−7289.(55) Hogshead, C. G.; Manias, E.; Williams, P.; Lupinsky, A.; Painter,P. Energy Fuels 2011, 25, 293−299.(56) Liu, J.; Xu, Z.; Masliyah, J. J. Colloid Interface Sci. 2005, 287,507−520.(57) Liu, J.; Zhang, L.; Xu, Z.; Masliyah, J. Langmuir 2006, 22, 1485−1492.(58) Long, J.; Xu, Z.; Masliyah, J. H. Colloids Surf., A 2006, 281, 202−214.(59) Ta, T. C.; Sykes, M. T.; McDermott, M. T. Langmuir 1998, 14,2435−2443.(60) Liu, L.; Buckley, J. S. J. Pet. Sci. Eng. 1999, 24, 75−83.(61) Dagastine, R. R.; Stevens, G. W.; Chan, D. Y. C.; Grieser, F. J.Colloid Interface Sci. 2004, 273 (1), 339−342.(62) Watson, G. S.; Watson, J. A. Quantitative Measurements of NanoForces using Atomic Force Microscopy (AFM); VDM Verlag:Saarbrucken, 2008.(63) Ducker, W. A.; Senden, T. J.; Pashley, R. M. Nature 1991, 353(6341), 239−241.(64) Adamson, A.; Gast, A. Physical Chemistry of Surfaces, 6th ed.;Wiley-Interscience: New York, 1997.(65) Butt, H.-J.; Cappella, B.; Kappl, M. Surf. Sci. Rep. 2005, 59, 1−152.(66) Sayyouh, M. H.; Hemeida, A. M.; Al-Blehed, M. S.; Desouky, S.M. J. Pet. Sci. Eng. 1991, 6 (3), 225−233.(67) Buckley, J. S.; Wang, J. J. Pet. Sci. Eng. 2002, 33 (1−3), 195−202.(68) Salathiel, R. A. JPT, J. Pet. Technol. 1973, 25 (10), 1216−1224.(69) Buckley, J. S.; Takamura, K.; Morrow, N. R. SPE Reservoir Eng.1989, 4 (03), 332−340.(70) Buckley, J. S.; Lord, D. L. J. Pet. Sci. Eng. 2003, 39, 261−273.
Energy & Fuels Article
DOI: 10.1021/acs.energyfuels.6b01862Energy Fuels 2016, 30, 9193−9202
9202