atmospheric transport modeling and data fusion in …
TRANSCRIPT

ATMOSPHERIC TRANSPORT MODELING AND DATA FUSION IN SUPPORT OF COMPREHENSIVE NUCLEAR-TEST-BAN TREATY
VERIFICATION
Gerhard Wotawa and Andreas W. N. Becker
Provisional Technical Secretariat of the Preparatory Commission for the Comprehensive Nuclear-Test-Ban Treaty Organization
ABSTRACT Waveform signals can be processed to distinguish between explosions and natural events and can help locating explosion centers fast and with high accuracy. However, they cannot be used to demonstrate a possible nuclear nature for the event. This final proof can only be provided by detection of airborne radioactivity downwind of the event. To support the verification of the Comprehensive Nuclear-Test-Ban Treaty (CTBT) based on particulate radionuclide and noble gas monitoring in combination with seismic explosion location results, the Provisional Technical Secretariat (PTS) has developed the Atmospheric Transport Modeling (ATM) software.
The software receives as input weather analyses from two world-leading centers (European Centre for Medium-Range Weather Forecasts and US Center for Environmental Prediction) in near-real-time and with high resolution. The PTS then computes, 14 days backward in time, source-receptor sensitivity (SRS) fields for all radionuclide samples taken at its operating and non-operating (future) sites. The diagnostic Lagrangian particle diffusion model FLeXpaRT is utilized as transport code. The code simulates transport and diffusion in inverse (backtracking) mode. The simulated adjoint tracer is released at the exact location of the monitoring site from the end to the start time of the air sampling, and then re-sampled every three hours at the surface level (0–30 m) on a global grid up to 14 days backward. The resulting SRS fields (equivalent to concentration fields in forward simulations) are stored in a database and are available ahead of the measurement results. In case of qualified events, the PTS will have the opportunity to request SRS fields from all Regional Specialized Meteorological Centres (RSMCs) of the World Meteorological Organisation (WMO). The WMO has agreed to provide this support in near-real-time, and has included SRS fields as products in its global data processing and forecasting system (GDPFS), making it a world standard for backtracking computations beyond CTBT verification.
Based on the pre-computed SRS fields needed as input, the post-processing software WebGrape has been developed. If the user specifies a measurement scenario, WebGrape can correlate these measurements with resulting signals from all possible single grid-cell source scenarios (1° × 1°, 3 hours) world-wide to identify consistent source locations of the detected radionuclides. Such results can easily be overlaid with information from seismic processing, for example seismic event locations and error ellipses, allowing fusion of, in space and time, the estimates from both technologies. If the user suspects a particular source scenario, WebGrape computes the world-wide measurement scenario that would result from his assumption. WebGrape does not require extensive computing resources, and results that would have required their own research project in the past are now available within minutes. The SRS concept allows for further post-processing efforts. SRS fields can easily be folded with gridded emission inventories available on the same grid. This provides an excellent method to verify, validate, and easily adapt emission inventories. Such methods may also be useful for the verifications of environmental agreements that ban or control the emission of certain trace gases.
29th Monitoring Research Review: Ground-Based Nuclear Explosion Monitoring Technologies
806
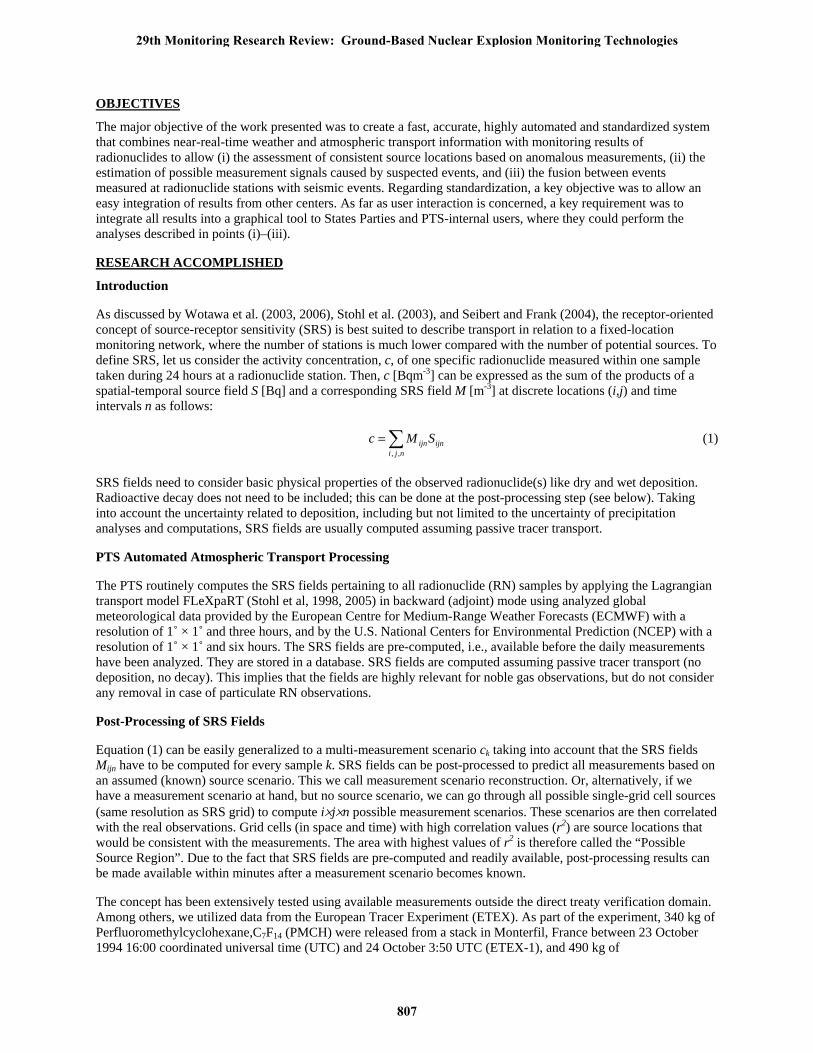
OBJECTIVES
The major objective of the work presented was to create a fast, accurate, highly automated and standardized system that combines near-real-time weather and atmospheric transport information with monitoring results of radionuclides to allow (i) the assessment of consistent source locations based on anomalous measurements, (ii) the estimation of possible measurement signals caused by suspected events, and (iii) the fusion between events measured at radionuclide stations with seismic events. Regarding standardization, a key objective was to allow an easy integration of results from other centers. As far as user interaction is concerned, a key requirement was to integrate all results into a graphical tool to States Parties and PTS-internal users, where they could perform the analyses described in points (i)–(iii).
RESEARCH ACCOMPLISHED
Introduction
As discussed by Wotawa et al. (2003, 2006), Stohl et al. (2003), and Seibert and Frank (2004), the receptor-oriented concept of source-receptor sensitivity (SRS) is best suited to describe transport in relation to a fixed-location monitoring network, where the number of stations is much lower compared with the number of potential sources. To define SRS, let us consider the activity concentration, c, of one specific radionuclide measured within one sample taken during 24 hours at a radionuclide station. Then, c [Bqm-3] can be expressed as the sum of the products of a spatial-temporal source field S [Bq] and a corresponding SRS field M [m-3] at discrete locations (i,j) and time intervals n as follows:
∑=nji
ijnijnSMc,,
(1)
SRS fields need to consider basic physical properties of the observed radionuclide(s) like dry and wet deposition. Radioactive decay does not need to be included; this can be done at the post-processing step (see below). Taking into account the uncertainty related to deposition, including but not limited to the uncertainty of precipitation analyses and computations, SRS fields are usually computed assuming passive tracer transport.
PTS Automated Atmospheric Transport Processing
The PTS routinely computes the SRS fields pertaining to all radionuclide (RN) samples by applying the Lagrangian transport model FLeXpaRT (Stohl et al, 1998, 2005) in backward (adjoint) mode using analyzed global meteorological data provided by the European Centre for Medium-Range Weather Forecasts (ECMWF) with a resolution of 1˚ × 1˚ and three hours, and by the U.S. National Centers for Environmental Prediction (NCEP) with a resolution of 1˚ × 1˚ and six hours. The SRS fields are pre-computed, i.e., available before the daily measurements have been analyzed. They are stored in a database. SRS fields are computed assuming passive tracer transport (no deposition, no decay). This implies that the fields are highly relevant for noble gas observations, but do not consider any removal in case of particulate RN observations.
Post-Processing of SRS Fields
Equation (1) can be easily generalized to a multi-measurement scenario ck taking into account that the SRS fields Mijn have to be computed for every sample k. SRS fields can be post-processed to predict all measurements based on an assumed (known) source scenario. This we call measurement scenario reconstruction. Or, alternatively, if we have a measurement scenario at hand, but no source scenario, we can go through all possible single-grid cell sources (same resolution as SRS grid) to compute i×j×n possible measurement scenarios. These scenarios are then correlated with the real observations. Grid cells (in space and time) with high correlation values (r2) are source locations that would be consistent with the measurements. The area with highest values of r2 is therefore called the “Possible Source Region”. Due to the fact that SRS fields are pre-computed and readily available, post-processing results can be made available within minutes after a measurement scenario becomes known.
The concept has been extensively tested using available measurements outside the direct treaty verification domain. Among others, we utilized data from the European Tracer Experiment (ETEX). As part of the experiment, 340 kg of Perfluoromethylcyclohexane,C7F14 (PMCH) were released from a stack in Monterfil, France between 23 October 1994 16:00 coordinated universal time (UTC) and 24 October 3:50 UTC (ETEX-1), and 490 kg of
29th Monitoring Research Review: Ground-Based Nuclear Explosion Monitoring Technologies
807

Perfluoromethylcyclopentane, C6F12 (PMCP) from November 14, 1994, 15:00 UTC to November 15, 2:45 UTC. PMCH and PMCP are passive tracers that were subsequently recorded at more than 150 sites all across Europe every three hours. To arrive at a spatial and temporal resolution comparable with the PTS monitoring system, PMCH/PMCP data were only used from a subset of five selected stations over Europe and were re-sampled to 12 hours. SRS fields were computed for the five selected locations and each re-sampled pseudo-sample. Source correlation analyses were done for ETEX-1 and ETEX-2 and yielded excellent (ETEX-1) and good results (ETEX-2) (see Figure 1). A measurement scenario reconstruction for ETEX-1 showed a good correspondence at all stations with the real measurements (Figure 2).
Figure 1. Source correlation results computed for the European Tracer Experiment (ETEX); Results for ETEX-1 (left; October 1994) have been compiled using PMCH data from five stations re-sampled to 12 hours, for ETEX-2 (right; November 1994) using PMCP data from four stations.
In April 1984, special measurements of radioactive cesium (137Cs) were performed in Stockholm/Sweden immediately after the accident in the nuclear power plant (NPP) at Chernobyl, former Soviet Union, became known. We computed SRS fields for this monitoring site. A SRS-based measurement scenario reconstruction assuming a realistic source term showed strong correspondence in variance and level with the time-series of the measurements (Figure 3). A source correlation analysis yielded a possible source region that was confined around the NPP location (not shown here).
SRS fields can also be folded with gridded emission inventories that are available on the same grid to predict time series of measurements at one or more stations. This method has been applied to predict 137Cs measured in Yellowknife based on an experimental emission inventory that was assumed to be proportional to the fire pixels in the boreal forest area recorded with the moderate-resolution imaging spectroradiometer (MODIS) instrument onboard the TERRA satellite. As a result, we found out that monthly averages of 137Cs were predicted with impressive accuracy for two consecutive years, establishing the boreal forest as a significant source of the material through burning (see Wotawa et al., 2006). Furthermore, related bottom-up emission estimates based on these calculations confirmed and consolidated the emission values per area burnt as established in the literature for single cases during short time periods. As a second application, monthly averaged values of the radio-xenon isotope 133Xe were predicted for Yellowknife and Spitsbergen. The emission inventory was estimated according to the geographical location of the NPP, and the emission terms were taken from a consolidated report. Differences in concentration levels at both sites could be explained, and it was shown that 133Xe measured in the high latitudes is probably older than 14 days (see Saey et al., 2006).
29th Monitoring Research Review: Ground-Based Nuclear Explosion Monitoring Technologies
808
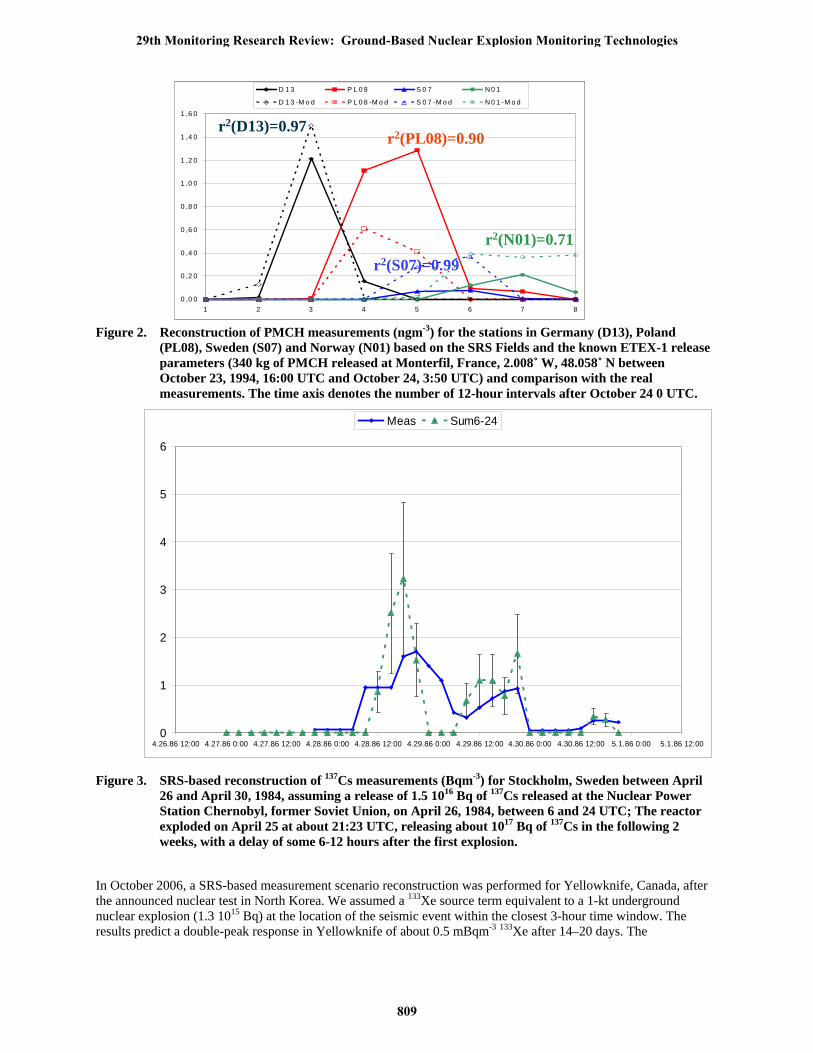
Figure 2. Reconstruction of PMCH measurements (ngm-3) for the stations in Germany (D13), Poland (PL08), Sweden (S07) and Norway (N01) based on the SRS Fields and the known ETEX-1 release parameters (340 kg of PMCH released at Monterfil, France, 2.008˚ W, 48.058˚ N between October 23, 1994, 16:00 UTC and October 24, 3:50 UTC) and comparison with the real measurements. The time axis denotes the number of 12-hour intervals after October 24 0 UTC.
Figure 3. SRS-based reconstruction of 137Cs measurements (Bqm-3) for Stockholm, Sweden between April 26 and April 30, 1984, assuming a release of 1.5 1016 Bq of 137Cs released at the Nuclear Power Station Chernobyl, former Soviet Union, on April 26, 1984, between 6 and 24 UTC; The reactor exploded on April 25 at about 21:23 UTC, releasing about 1017 Bq of 137Cs in the following 2 weeks, with a delay of some 6-12 hours after the first explosion.
In October 2006, a SRS-based measurement scenario reconstruction was performed for Yellowknife, Canada, after the announced nuclear test in North Korea. We assumed a 133Xe source term equivalent to a 1-kt underground nuclear explosion (1.3 1015 Bq) at the location of the seismic event within the closest 3-hour time window. The results predict a double-peak response in Yellowknife of about 0.5 mBqm-3 133Xe after 14–20 days. The
0 ,0 0
0 ,2 0
0 ,4 0
0 ,6 0
0 ,8 0
1 ,0 0
1 ,2 0
1 ,4 0
1 ,6 0
1 2 3 4 5 6 7 8
D 1 3 P L 0 8 S 0 7 N 0 1
D 1 3 -M o d P L 0 8 -M o d S 0 7 -M o d N 0 1 -M o d
r2(D13)=0.97r2(PL08)=0.90
r2(S07)=0.99r2(N01)=0.71
0 ,0 0
0 ,2 0
0 ,4 0
0 ,6 0
0 ,8 0
1 ,0 0
1 ,2 0
1 ,4 0
1 ,6 0
1 2 3 4 5 6 7 8
D 1 3 P L 0 8 S 0 7 N 0 1
D 1 3 -M o d P L 0 8 -M o d S 0 7 -M o d N 0 1 -M o d
r2(D13)=0.97r2(PL08)=0.90
r2(S07)=0.99r2(N01)=0.71
0
1
2
3
4
5
6
4.26.86 12:00 4.27.86 0:00 4.27.86 12:00 4.28.86 0:00 4.28.86 12:00 4.29.86 0:00 4.29.86 12:00 4.30.86 0:00 4.30.86 12:00 5.1.86 0:00 5.1.86 12:00
Meas Sum6-24
29th Monitoring Research Review: Ground-Based Nuclear Explosion Monitoring Technologies
809
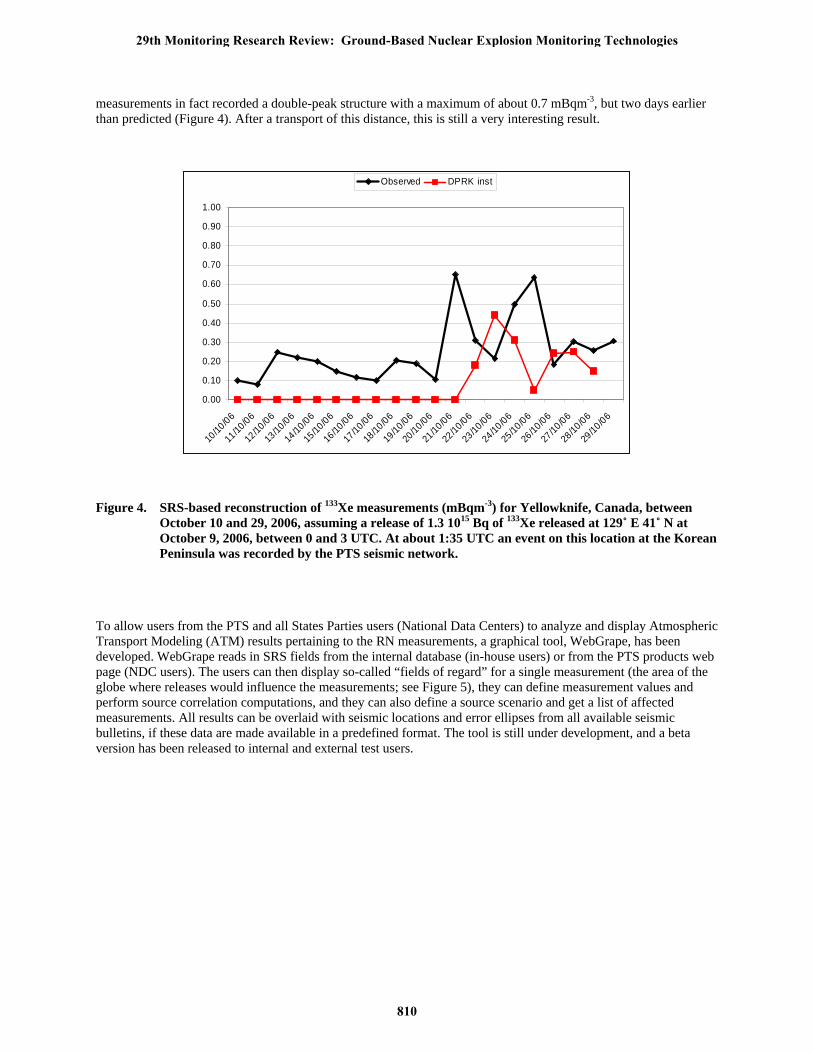
measurements in fact recorded a double-peak structure with a maximum of about 0.7 mBqm-3, but two days earlier than predicted (Figure 4). After a transport of this distance, this is still a very interesting result.
0.00
0.10
0.20
0.30
0.40
0.50
0.60
0.70
0.80
0.90
1.00
10/10
/06
11/10
/06
12/10
/06
13/10
/06
14/10
/06
15/10
/06
16/10
/06
17/10
/06
18/10
/06
19/10
/06
20/10
/06
21/10
/06
22/10
/06
23/10
/06
24/10
/06
25/10
/06
26/10
/06
27/10
/06
28/10
/06
29/10
/06
Observed DPRK inst
Figure 4. SRS-based reconstruction of 133Xe measurements (mBqm-3) for Yellowknife, Canada, between October 10 and 29, 2006, assuming a release of 1.3 1015 Bq of 133Xe released at 129˚ E 41˚ N at October 9, 2006, between 0 and 3 UTC. At about 1:35 UTC an event on this location at the Korean Peninsula was recorded by the PTS seismic network.
To allow users from the PTS and all States Parties users (National Data Centers) to analyze and display Atmospheric Transport Modeling (ATM) results pertaining to the RN measurements, a graphical tool, WebGrape, has been developed. WebGrape reads in SRS fields from the internal database (in-house users) or from the PTS products web page (NDC users). The users can then display so-called “fields of regard” for a single measurement (the area of the globe where releases would influence the measurements; see Figure 5), they can define measurement values and perform source correlation computations, and they can also define a source scenario and get a list of affected measurements. All results can be overlaid with seismic locations and error ellipses from all available seismic bulletins, if these data are made available in a predefined format. The tool is still under development, and a beta version has been released to internal and external test users.
29th Monitoring Research Review: Ground-Based Nuclear Explosion Monitoring Technologies
810

Figure 5. View from the graphical tool WebGrape (display of a so-called “field of regard” for the RN station RN036). This software helps users from the PTS and the National Data Centers to display and analyze atmospheric transport modeling results in connection with RN measurements. SRS-based source correlation analyses and measurement reconstructions can be performed, displayed and stored. The software works on every state of the art PC or Laptop.
International Backtracking Response System
Comprehensive Nuclear-Test-Ban Treaty Organization (CTBTO)/PTS and WMO have developed and tested a system where the PTS notifies WMO RSMCs in case of qualified RN events. The RSMCs then sends SRS fields calculated with their own models to the PTS. These SRS fields pertain to the RN samples under scrutiny (and typically also measurements from neighboring stations, depending on the PTS request) and. Details of the measurements are not exposed to RSMCs, only station coordinates and measurement times. WMO SRS fields supplement the PTS in-house computations, and can be imported into the WebGrape tool for further analysis.
The response system has been tested in two experiments (2003 and 2005). The experiments were based on a fictitious measurement scenario computed by means of a forward run with an ATM from an automatically chosen release location. The fictitious measurements served then as basis for the notification of the RSMCs. In both experiments, the multi-model average source correlation results were closer to the real release location compared with the source correlation results from all participating models. As in the emergency response field linked to forward modeling, this underpins once more the strength of the ensemble dispersion modelling (EDM) concept also in the backtracking domain (Becker et al., 2007).
At the meeting of the WMO Commission for Basic Systems in Seoul in November 2006, it was unanimously recommended that the CTBTO-WMO backtracking response system should be included in the WMO manual for the GDPFS. The recommendation stated that backtracking computations can be requested by the PTS related to the CTBT verification purposes, but also by any National Meteorological Service (NMS) for any other purpose. Format, communication, and procedures were taken as proposed by the PTS. A formal integration of the system into the PTS processing in case of a so-called Level-5 event in the particulate RN network (detection of more than one treaty-relevant RN) is expected later in 2007.
29th Monitoring Research Review: Ground-Based Nuclear Explosion Monitoring Technologies
811

CONCLUSIONS AND RECOMMENDATIONS
The PTS successfully integrated the best available meteorological analysis data and state-of-the art ATMs in its automated processing to support the interpretation of RN monitoring results. Standardized SRS fields are computed and stored in near-real-time and before the related measurements are available. This allows to predict measurement scenarios based on release assumptions, and to perform source correlation calculations. A powerful post-processing tool is under beta-testing, which allows users to post-process and display the ATM results and to fuse ATM results with event locations and error ellipses from seismic bulletins. A CTBTO-WMO response system has been set up, that allows the PTS to request SRS fields from a number of WMO RSMCs spread all over the world to supplement its own computations. The related backtracking EDM system will greatly enhance the results from a technical viewpoint, but also increase the political acceptance due to the wide geographical spread of the contributors. It is recommended that this system be included in the standard processing as soon as possible, and also that the system be expanded to noble gas monitoring as soon as an appropriate noble gas event classification system is in place.
Further analyses are needed, especially in the noble gas area. Unlike in the particulate area, there is just limited experience with global monitoring of radio-xenon isotopes. The need for further studies includes the comparison of top-down with bottom-up emission estimates. Top-down estimates are based on reports from facilities and/or countries, while bottom-up estimates come from the measurements and the ATM computations. This is especially true for the isotope 133Xe, where a hemispheric-scale background has been identified. To better interpret measurements and to develop a categorization scheme, the structure, frequency, and strength of the impact of known emitters to specific monitoring stations needs to be established and to be taken into consideration.
ACKNOWLEDGEMENTS
The 137Cs data for Stockholm related to the Chernobyl accident have been made available by Lars-Erik De Geer, former PTS staff member, currently at the Swedish Defense Research Agency. The ETEX experiment has been conducted by the European Commission, and the data have been downloaded from the server of the Joint Research Centre Environment Institute.
REFERENCES
Becker, A., G. Wotawa, L.-E. De Geer, P. Seibert, R. R. Draxler, C. Sloan, R. D’Amours, M. Hort, H. Glaab, P. Heinrich, Y. Grillon, V. Shershakov, K. Katayama, Y. Zhang, P. Stewart, M. Hirtl, M. Jean, and P. Chen (2007). Global backtracking of anthropogenic radionuclides by means of a receptor oriented ensemble dispersion modeling system in support of Nuclear-Test-Ban treaty Verification, Atmos. Environ. 41: 4520, 4534.
Saey, P. R., G. Wotawa, L.-E. De Geer, A. Axelsson, M. Bean, R. D’Amours, K. Elmgren, J. Peterson, A. Ringbom, T.J. Stocki and R.K. Ungar (2006). Radioxenon background at high northern latitudes, J. Geophys. Res. 111: D17306, doi:10.1029/2005JD007038
Seibert, P. and A. Frank (2004). Source-receptor matrix calculation with a Lagrangian particle dispersion model in backward mode, Atmos. Chem. Phys. 4: 51, 63.
Stohl, A., M. Hittenberger, and G. Wotawa (1998). Validation of the Lagrangian particle dispersion model FLeXpaRT against large scale tracer experiment data, Atmos. Environ. 32: 4245, 4264.
Stohl, A., C. Forster, S. Eckhardt, N. Spichtinger, H. Huntrieser, J. Heland, H. Schlager, S. Wilhelm, F. Arnold, and O. Cooper (2003). A backward modeling study of intercontinental pollution transport using aircraft measurements, J. Geophys. Res. 108: 4370.
Stohl, A., C. Forster, A. Frank, P. Seibert, and G. Wotawa (2005). Technical note: The Lagrangian particle dispersion model FLeXpaRT version 6.2, Atmos. Chem. Phys. 5: 2461, 2474.
Wotawa, G., L.-E. De Geer, P. Denier, M. Kalinowski, H. Toivonen, R. D’Amours, F. Desiato, J.-P. Issartel, M. Langer, P. Seibert, A. Frank, C. Sloan, and H. Yamazawa (2003). Atmospheric transport modelling in support of CTBT verification—Overview and basic concepts, Atmos. Environ. 37: 2529, 2537.
Wotawa, G., L.-E. De Geer, A. Becker, R. D’Amours, M. Jean, R. Servranckx, and K. Ungar (2006). Inter- and intra-continental transport of radioactive cesium released by boreal forest fires, Geophys. Res. Lett. 33: L12806, doi:10.1029/2006GL026206.
29th Monitoring Research Review: Ground-Based Nuclear Explosion Monitoring Technologies
812