atmospheric circulation over the bolivian altiplano during dry
TRANSCRIPT

INTERNATIONAL JOURNAL OF CLIMATOLOGY
Int. J. Climatol. 19: 1579–1600 (1999)
ATMOSPHERIC CIRCULATION OVER THE BOLIVIAN ALTIPLANODURING DRY AND WET PERIODS AND EXTREME PHASES OF THE
SOUTHERN OSCILLATIONM. VUILLE*
Department of Geosciences, Uni6ersity of Massachusetts, Amherst, MA 01003-5820, USA
Recei6ed 22 September 1998Re6ised 7 March 1999
Accepted 16 March 1999
ABSTRACT
The atmospheric circulation over the Bolivian Altiplano during composite WET and DRY periods and during HIGHand LOW index phases of the Southern Oscillation was investigated using daily radiosonde data from Antofagasta(Chile), Salta (Argentina), Lima (Peru) and La Paz (Bolivia), daily precipitation data from the Bolivian/Chileanborder between 18° and 19°S and monthly NCEP (National Centers for Environmental Prediction) reanalysis databetween 1960 and 1998. In austral summer (DJF) the atmosphere during WET periods is characterized by easterlywind anomalies in the middle and upper troposphere over the Altiplano, resulting in increased moisture influx fromthe interior of the continent near the Altiplano surface. The Bolivian High is intensified and displaced southward. Onthe other hand, westerly winds usually prevail during DRY summer periods, preventing the moisture transport fromthe east from reaching the western Altiplano. Precipitation tends to be deficient over the western Bolivian Altiplanoduring LOW index summers and above average during HIGH and LOW+1 summers, but the relation is weak andstatistically insignificant. LOW summers feature broadly similar atmospheric circulation anomalies as DRY periodsand can be regarded as an extended DRY period or as a summer with increased occurrence of DRY episodes. HIGHsummers, and to a lesser degree LOW+1 summers, are characterized by broadly opposite atmospheric characteris-tics, featuring a more pronounced Bolivian High located significantly further south, and easterly wind anomalies overthe Altiplano. In winter (JJA) precipitation events are rare; these are associated with increased northerly and westerlywind components, reduced pressure and temperature, and increased specific humidity over the entire Altiplano.Atmospheric circulation anomalies during LOW periods are less pronounced in austral winter (JJA) than in summer,but generally feature similar changes (increased temperatures and a vertically expanded troposphere). However, thesignificance of these anomalies, especially with regard to the wind pattern, varies depending on station and pressurelevel. Accordingly, precipitation during austral winter shows no relationship with the extremes of the SouthernOscillation. Copyright © 1999 Royal Meteorological Society.
KEY WORDS: Altiplano; precipitation; Southern Oscillation; composite analysis
1. INTRODUCTION
The atmospheric circulation over the South American Altiplano in its seasonal and diurnal cycle has beeninvestigated in a variety of studies. For some purposes, however, e.g. reconstruction of palaeoclimate orinterpretation of proxy records, knowledge of the atmospheric circulation during climatic extremes mightbe more helpful, than analyses of seasonal or diurnal cycles. Accordingly, the aim of this study is toanalyse the atmospheric circulation over the broader Altiplano region during extreme climatic periods,which are likely to be prominent in high-resolution proxy records from this area. The main purpose is toprovide new information for the calibration of an ice core, recently recovered from Sajama volcano (6542m, 18°06%S, 68°53%W), in the western Bolivian Andes (Thompson et al., 1998). The stratigraphy of thiscore is intrinsically linked to the climate and the atmospheric circulation during the deposition of the
* Correspondence to: Department of Geosciences, University of Massachusetts, Amherst, MA 01003-5820, USA. Tel.: +1 413 5450659; fax: +1 413 545 1200; e-mail: [email protected]
CCC 0899–8418/99/141579–22$17.50Copyright © 1999 Royal Meteorological Society
M. VUILLE1580
snow (Hardy et al., 1998). Therefore, the main emphasis of this study is on extended dry and wet periodsand the El Nino–Southern Oscillation phenomenon (ENSO), which has been identified in other palaeorecords from tropical Andean ice cores (Thompson et al., 1984).
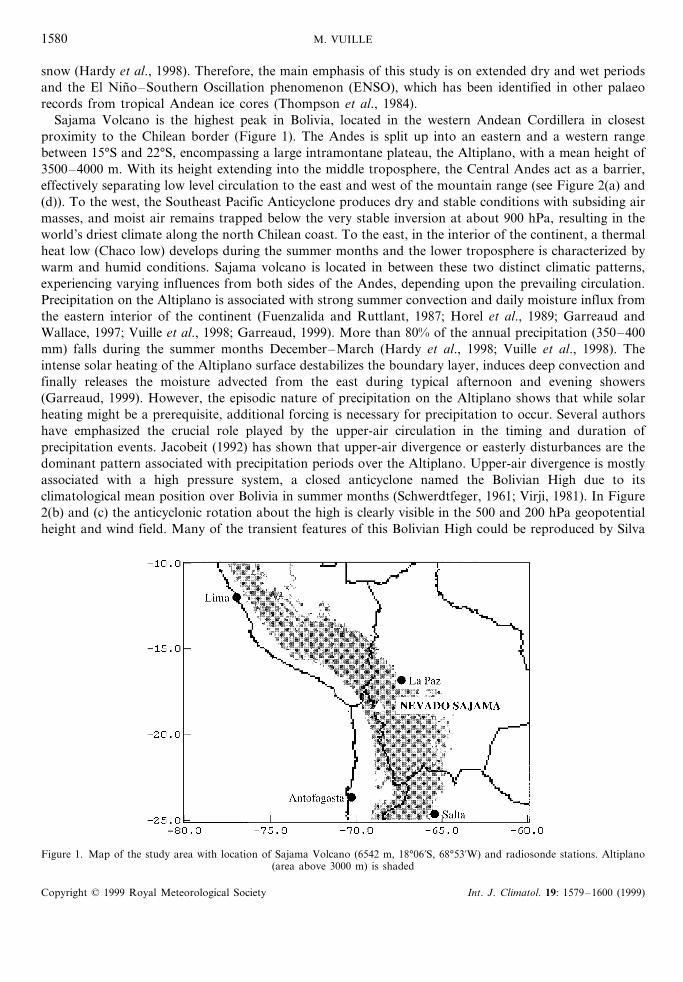
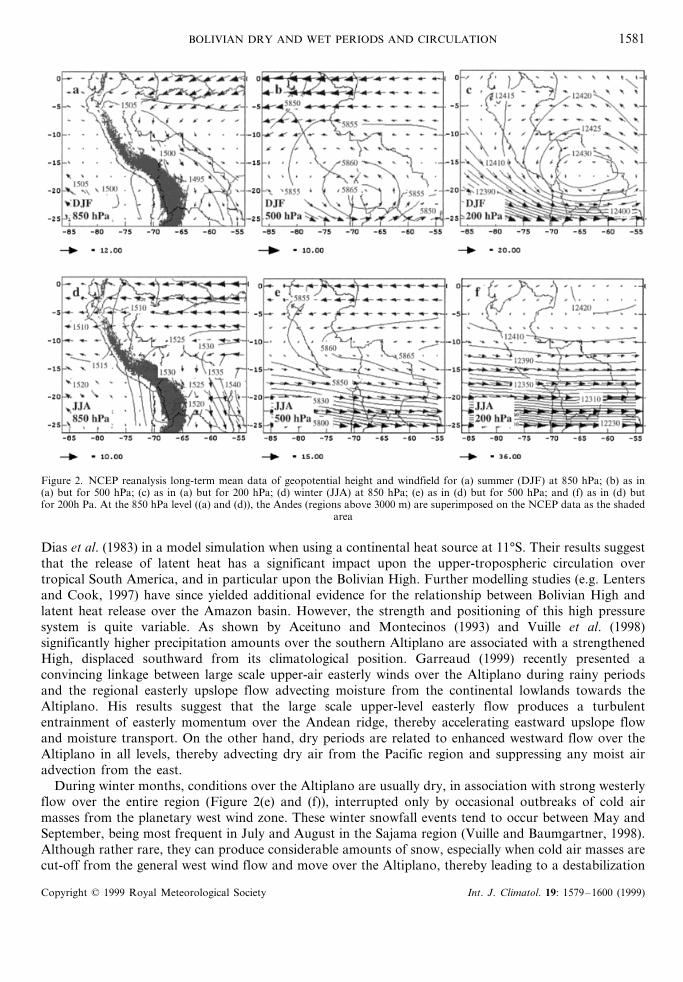
Sajama Volcano is the highest peak in Bolivia, located in the western Andean Cordillera in closestproximity to the Chilean border (Figure 1). The Andes is split up into an eastern and a western rangebetween 15°S and 22°S, encompassing a large intramontane plateau, the Altiplano, with a mean height of3500–4000 m. With its height extending into the middle troposphere, the Central Andes act as a barrier,effectively separating low level circulation to the east and west of the mountain range (see Figure 2(a) and(d)). To the west, the Southeast Pacific Anticyclone produces dry and stable conditions with subsiding airmasses, and moist air remains trapped below the very stable inversion at about 900 hPa, resulting in theworld’s driest climate along the north Chilean coast. To the east, in the interior of the continent, a thermalheat low (Chaco low) develops during the summer months and the lower troposphere is characterized bywarm and humid conditions. Sajama volcano is located in between these two distinct climatic patterns,experiencing varying influences from both sides of the Andes, depending upon the prevailing circulation.Precipitation on the Altiplano is associated with strong summer convection and daily moisture influx fromthe eastern interior of the continent (Fuenzalida and Ruttlant, 1987; Horel et al., 1989; Garreaud andWallace, 1997; Vuille et al., 1998; Garreaud, 1999). More than 80% of the annual precipitation (350–400mm) falls during the summer months December–March (Hardy et al., 1998; Vuille et al., 1998). Theintense solar heating of the Altiplano surface destabilizes the boundary layer, induces deep convection andfinally releases the moisture advected from the east during typical afternoon and evening showers(Garreaud, 1999). However, the episodic nature of precipitation on the Altiplano shows that while solarheating might be a prerequisite, additional forcing is necessary for precipitation to occur. Several authorshave emphasized the crucial role played by the upper-air circulation in the timing and duration ofprecipitation events. Jacobeit (1992) has shown that upper-air divergence or easterly disturbances are thedominant pattern associated with precipitation periods over the Altiplano. Upper-air divergence is mostlyassociated with a high pressure system, a closed anticyclone named the Bolivian High due to itsclimatological mean position over Bolivia in summer months (Schwerdtfeger, 1961; Virji, 1981). In Figure2(b) and (c) the anticyclonic rotation about the high is clearly visible in the 500 and 200 hPa geopotentialheight and wind field. Many of the transient features of this Bolivian High could be reproduced by Silva
Figure 1. Map of the study area with location of Sajama Volcano (6542 m, 18°06%S, 68°53%W) and radiosonde stations. Altiplano(area above 3000 m) is shaded
Copyright © 1999 Royal Meteorological Society Int. J. Climatol. 19: 1579–1600 (1999)
BOLIVIAN DRY AND WET PERIODS AND CIRCULATION 1581
Figure 2. NCEP reanalysis long-term mean data of geopotential height and windfield for (a) summer (DJF) at 850 hPa; (b) as in(a) but for 500 hPa; (c) as in (a) but for 200 hPa; (d) winter (JJA) at 850 hPa; (e) as in (d) but for 500 hPa; and (f) as in (d) butfor 200h Pa. At the 850 hPa level ((a) and (d)), the Andes (regions above 3000 m) are superimposed on the NCEP data as the shaded
area
Dias et al. (1983) in a model simulation when using a continental heat source at 11°S. Their results suggestthat the release of latent heat has a significant impact upon the upper-tropospheric circulation overtropical South America, and in particular upon the Bolivian High. Further modelling studies (e.g. Lentersand Cook, 1997) have since yielded additional evidence for the relationship between Bolivian High andlatent heat release over the Amazon basin. However, the strength and positioning of this high pressuresystem is quite variable. As shown by Aceituno and Montecinos (1993) and Vuille et al. (1998)significantly higher precipitation amounts over the southern Altiplano are associated with a strengthenedHigh, displaced southward from its climatological position. Garreaud (1999) recently presented aconvincing linkage between large scale upper-air easterly winds over the Altiplano during rainy periodsand the regional easterly upslope flow advecting moisture from the continental lowlands towards theAltiplano. His results suggest that the large scale upper-level easterly flow produces a turbulententrainment of easterly momentum over the Andean ridge, thereby accelerating eastward upslope flowand moisture transport. On the other hand, dry periods are related to enhanced westward flow over theAltiplano in all levels, thereby advecting dry air from the Pacific region and suppressing any moist airadvection from the east.
During winter months, conditions over the Altiplano are usually dry, in association with strong westerlyflow over the entire region (Figure 2(e) and (f)), interrupted only by occasional outbreaks of cold airmasses from the planetary west wind zone. These winter snowfall events tend to occur between May andSeptember, being most frequent in July and August in the Sajama region (Vuille and Baumgartner, 1998).Although rather rare, they can produce considerable amounts of snow, especially when cold air masses arecut-off from the general west wind flow and move over the Altiplano, thereby leading to a destabilization
Copyright © 1999 Royal Meteorological Society Int. J. Climatol. 19: 1579–1600 (1999)

M. VUILLE1582
of the generally warmer atmospheric column. The low winter precipitation amounts reported from thesparse meteorological network in the area should therefore be interpreted with caution as they mightrepresent an underestimation of the real amounts (Vuille and Ammann, 1997).
As a result of the convective nature of precipitation episodes in this arid part of the Bolivian Altiplano,the spatial variability is high (Ronchail, 1995). Therefore, only precipitation data from stations in theclosest vicinity of Sajama volcano were used to determine the dry and wet periods for which theatmospheric circulation was analysed. Radiosonde data from the four closest stations with reliable andlong enough records and monthly NCEP (National Centers for Environmental Prediction) reanalysis datawere used to determine the atmospheric circulation during the corresponding periods. A similar approachwas applied by Aceituno and Montecinos (1993) looking at the atmospheric circulation during wet anddry periods over the Chilean Altiplano. However, their study was limited to coastal radiosondes (Lima,Antofagasta and Quintero), the austral summer, and to a relatively short time period (1980–1987).
Several authors have analysed the relationship between ENSO and interannual climatic variability overthe South American continent (e.g. Ropelewski and Halpert, 1987, 1989, 1996; Aceituno, 1988; Rogers,1988; Aceituno, 1989; Kiladis and Diaz, 1989; Halpert and Ropelewski, 1992). Although these studieshelped to improve knowledge about the large-scale ENSO influence over the South American continent,they were not able to spatially resolve ENSO features in areas such as the Central Andes, where this signalis spatially incoherent. Regional studies on the influence of ENSO have shed more light in certain regionsof the Altiplano. Several authors have reported below-average precipitation and increased temperaturesassociated with warm/low index phases (El Nino) of the Southern Oscillation. The statistical confidence,however, varies considerably, depending on the area, data and time period that was analysed. Aceituno(1988) found a coherent pattern of weak positive correlations between the SO and precipitation over theAltiplano at the height of the rainy season (JF). Aceituno and Garreaud (1995) reported below-averagelevels of Lake Titicaca associated with ENSO periods, consistent with data published by Tapley andWaylen (1990) indicating reduced precipitation amounts in the Peruvian Altiplano during warm events.Below average snow accumulation on Quelccaya Ice Cap in Peru (Thompson et al., 1984; Thompson,1993) and a negative glacier mass balance due to increased temperatures and reduced snowfall on Zongoglacier in the Cordillera Real of Bolivia (Francou et al., 1995), could also be attributed to climaticanomalies caused by El Nino. Ronchail (1999) showed that below average summer precipitation (JFMA)in the Bolivian Altiplano is frequent during negative phases of the SO (El Nino), but also emphasized thatmany dry periods over the Altiplano are not related to the ENSO phenomenon. During the last decadesthe driest summers in the Altiplano have often, but not always, been El Nino years. In addition, the mostextreme precipitation values seem to be independent of the SO. They can occur during extreme phases ofthe SO, as well as during normal years. The relationship between Altiplano precipitation and ENSO hasbecome of growing interest as El Nino events seem to become more frequent since the late 1970s,probably linked to decadal-scale climate changes in the Pacific domain (Trenberth and Hoar, 1996). Thedecadal-scale precipitation variability over the Bolivian Altiplano, however, shows a distinct disruptionwith significantly increased precipitation amounts between the early 1970s and the late 1980s (Ronchail,1999). Although the relationship between ENSO, precipitation and atmospheric circulation over theAltiplano will only be discussed based on data from the last decades, one can assume, that similarmechanisms have functioned in the past. On Quelccaya Ice Cap in the Peruvian Andes the ENSO signalin the d18O record has remained stable over at least the last millennium (Diaz and Pulwarty, 1994).
In the following section the data and methods that were applied in this study are described. The sectionafter this presents the results from the analysis of the radiosonde and NCEP reanalysis data during WETand DRY episodes during the summer and winter months. The section ‘Atmospheric Circulation duringHigh and Low Index Phases’ is similar to the previous section but discusses the results for LOW- (ElNino) and HIGH-index phases of the Southern Oscillation (La Nina), respectively. The last sectiondiscusses the results presented in the previous sections, summarizes this study and presents someconclusions.
Copyright © 1999 Royal Meteorological Society Int. J. Climatol. 19: 1579–1600 (1999)
BOLIVIAN DRY AND WET PERIODS AND CIRCULATION 1583
2. DATA AND METHODS
As precipitation on the dry western Altiplano has a very episodic nature, this study is based on both daily(radiosonde) and monthly (NCEP reanalysis) data. Wet periods normally last only a few days and arepreceded and followed by dry periods without precipitation (Aceituno and Montecinos, 1993). Daily datatherefore can help to resolve some atmospheric features associated with precipitation events, that mightbe masked when using monthly data alone.
Daily precipitation data from six Altiplano stations in the closest vicinity of Volcano Sajama wereobtained from the Chilean National Direction of Waters (Direccion General de Aguas, Santiago, Chile)and the Bolivian National Meteorological and Hydrological Institute (Servicio Nacional de Meteorologıae Hidrologıa, La Paz, Bolivia). Station names and the length of each record are given in Table I.
Upper-air data from the four stations closest to Nevado Sajama were extracted from CARDS(Comprehensive Aerological Reference Data Set). The selected stations include two records to the west ofthe Andes on the Pacific coast (Antofagasta, Chile and Lima, Peru), one record on the Altiplano (La Paz,Bolivia) and one to the east of the Andes (Salta, Argentina). The length of each record is shown in TableI and station locations are shown in Figure 1. From each station record, daily data at 12:00 UTC (exceptLima where only data at 00:00 UTC were available) were extracted, including geopotential height (gpm),air temperature (°C), relative humidity (%), wind direction (°) and wind speed (m s−1) for the standardpressure levels 850, 700, 500, 400, 300 and 200 hPa (except for La Paz, where 850 and 700 hPa would berather meaningless and for relative humidity where no data was available at the 200 hPa level). Fromthese original data, zonal and meridional wind components (m s−1) and specific humidity (g kg−1) werederived.
Monthly NCEP reanalysis data (Kalnay et al., 1996) of air temperature, geopotential height and zonaland meridional wind component were extracted from the original data set at the 850, 700, 500, 300 and200 hPa level and for specific humidity at the 700, 500 and 300 hPa level. An additional variable,horizontal water vapour flux (g s−1 m−2), was computed for the 700, 500 and 300 hPa level based onspecific humidity, zonal and meridional wind and air density (e.g. Berri and Inzunza, 1993; Rao et al.,1996, 1998). Rao et al. (1998) have shown that NCEP reanalysis data is able to capture the generalcharacteristics of moisture transport during El Nino and La Nina years, using vertically integrated watervapour flux.
In a first step, daily precipitation amounts were analysed for the summer months December–February(DJF) and the winter months June–August (JJA) between 1960 and 1993, although some stations hadconsiderably shorter records (Table I). DJF represents the main precipitation period, while JJA isnormally dry, but also characterized by occasional polar outbreaks of the west wind zone leading to rarebut significant winter precipitation. Each day was classified as either WET, DRY or neutral. WET
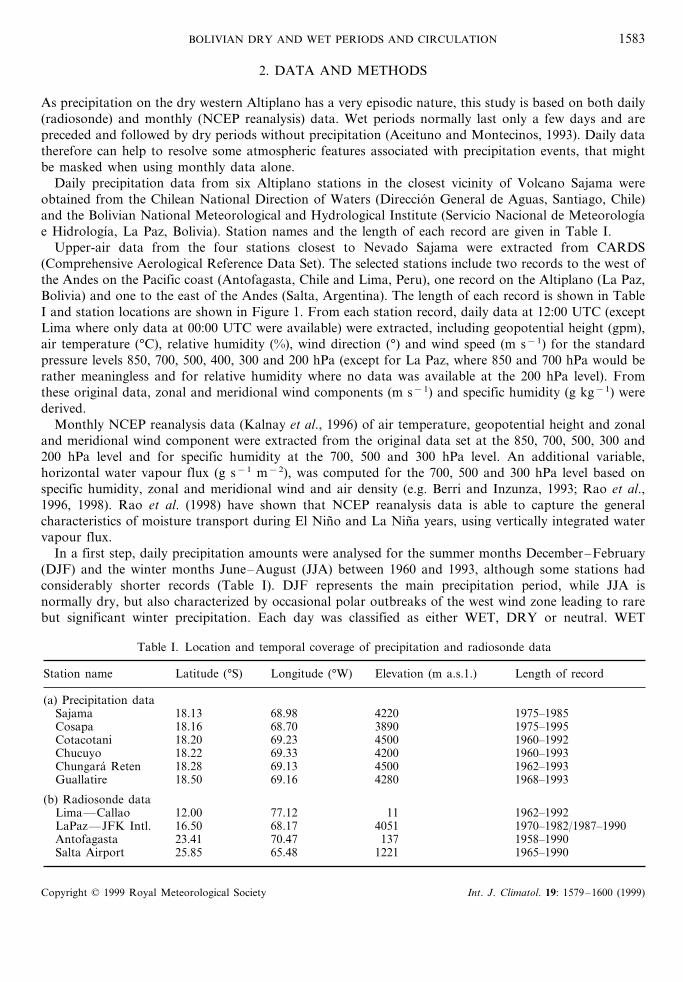
Table I. Location and temporal coverage of precipitation and radiosonde data
Length of recordElevation (m a.s.1.)Longitude (°W)Latitude (°S)Station name
(a) Precipitation data1975–1985422068.9818.13Sajama
18.16 68.70 3890Cosapa 1975–1995Cotacotani 18.20 69.23 4500 1960–1992
18.22 69.33 4200Chucuyo 1960–1993Chungara Reten 1962–199318.28 450069.13
1968–1993428069.1618.50Guallatire
(b) Radiosonde dataLima—Callao 12.00 77.12 11 1962–1992
1970–1982/1987–1990LaPaz—JFK Intl. 405168.1716.501958–199013770.4723.41Antofagasta
Salta Airport 25.85 65.48 1221 1965–1990
Copyright © 1999 Royal Meteorological Society Int. J. Climatol. 19: 1579–1600 (1999)

M. VUILLE1584
Table II. HIGH (SOI\1), LOW (SOIB−2) and LOW+1 (DJF following a LOW episode andSOI\−1) index years for DJF and JJA (HIGH and LOW only)
Period Events
(a) DJFLOW 1958–1959, 1972–1973, 1977–1978, 1982–1983, 1986–1987, 1991–1992, 1997–1998LOW+1 1959–1960, 1973–1974, 1978–1979, 1983–1984, 1987–1988, 1993–1994HIGH 1961–1962, 1966–1967, 1970–1971, 1973–1974, 1975–1976, 1988–1989, 1996–1997
(b) JJALOW 1965, 1972, 1977, 1982, 1987, 1993, 1994, 1997HIGH 1964, 1973, 1975, 1981, 1988, 1996
Periods in bold are covered by radiosonde data only, periods in italics by NCEP reanalysis data only.
includes periods when all stations recorded at least 0.5 mm day−1 over five or more consecutive days(DJF), or over at least 2 days (JJA). This differentiation between DJF and JJA was necessary becauseprecipitation is very rare, and of short duration, during the winter months—no events would have metthe 5 day summer criteria. DRY includes all periods of at least 5 days without precipitation at all stations(for both DJF and JJA). This procedure yielded 475 (425) days for WET (DRY) in DJF and 140 (2416)days for WET (DRY) in JJA between 1960 and 1993.
The corresponding data for WET and DRY were then extracted from the upper-air sounding recordsfor both DJF and JJA. However, only the records from Antofagasta, Lima and Salta cover most of theWET and DRY periods, as the La Paz record is considerably shorter (Table I). Arithmetic means andstandard deviations were computed for each parameter and a two-tailed Student’s t-test was performedin order to evaluate significant differences in the atmospheric variables during DRY and WET periods forboth the summer (DJF) and winter (JJA) months.
The same analysis was also applied to the NCEP reanalysis data, however on a monthly basis.Composites were built for all summers (DJF) when precipitation records near Sajama indicate anomaliesabove (WET) or below (DRY) one standard deviation, compared to the long-term mean. This procedureyielded four wet summers (1971–1972, 1972–1973, 1974–1975 and 1985–1986) forming the NCEP WETcomposite, and four dry summers (1965–1966, 1982–1983, 1989–1990 and 1991–1992) forming theNCEP DRY composite. This analysis was applied to austral summer only, since the temporal resolutionof the monthly NCEP data used in this study would not allow to resolve the few and rare winterprecipitation events, preceded and followed by extended dry periods.
Besides the classification into WET and DRY, both the CARDS and the NCEP data were alsoanalysed as a function of HIGH and LOW index phases of the Southern Oscillation (standardizedpressure difference between Tahiti and Darwin, using 1951–1980 as base period) obtained from theClimate Prediction Center (NOAA-CPC). Three-monthly SOI averages were computed for DJF and JJAand all periods for which SOI\1 (HIGH) and SOIB−2 (LOW) were retained. The selected HIGH andLOW index phases for DJF and JJA are listed in Table II. The thresholds of 1 and −2 for thestandardized SOI anomalies are somewhat arbitrary but yielded an equal number of seven strong HIGHand LOW index DJF periods since 1958, the first year with radiosonde data. However, as for theWET-DRY analysis, the La Paz record is considerably shorter and only covers four HIGH and LOWindex phases. Only the SOI and no SST index (e.g. NINO3) was used, and only the three summer (winter)months DJF (JJA) were considered. Therefore, some of the extracted events differ from time periodscommonly considered to be El Nino/La Nina events, mainly because SOI and SST anomalies in thePacific have not been highly correlated at all times during the last decades (Deser and Wallace, 1987).Three-monthly composites were built for both HIGH and LOW phases during DJF and JJA and atwo-tailed Student’s t-test performed on all parameters of the radiosonde data to see whether significantchanges occur in the atmospheric circulation between the two extreme phases of the Southern Oscillation.
Again a similar analysis was carried out based on the NCEP reanalysis data. Monthly anomalies werecomputed by subtracting the long-term monthly mean (1960–1998) and anomaly composites for the same
Copyright © 1999 Royal Meteorological Society Int. J. Climatol. 19: 1579–1600 (1999)
BOLIVIAN DRY AND WET PERIODS AND CIRCULATION 1585
HIGH and LOW index phases were created. Again the NCEP analysis was applied to austral summer(DJF) only, since the results from the radiosonde analysis suggested only a weak relationship between theatmospheric circulation during JJA and the SO (see section ‘Austral winter (JJA)’). In some areas thetropical Andes tend to be anomalously wet in summers following an ENSO event (e.g. Henderson, 1996),henceforth referred to as LOW+1. This increased precipitation can presumably be attributed to aclimatic response of the tropical Atlantic to the Pacific ENSO signal and hence increased easterly moistureinflux towards the Andes (e.g. Enfield, 1996). In order to account for this possible phase-lag relationship,an additional composite was created (LOW+1), including all DJF periods following a LOW index phase,after the SOI had started to rise again (first DJF when SOI\−1). All anomaly composites, includingwater vapour flux, were compared with the long-term mean and tested for significance using a two-tailedStudent’s t-test.
3. ATMOSPHERIC CIRCULATION DURING DRY AND WET PERIODS
The results from the composite analysis of DRY and WET periods in the Nevado Sajama area arepresented in Figures 3–6. Results are discussed separately for summer (DJF) and winter (JJA). Emphasisis on middle and upper tropospheric levels, as 850 and 700 hPa are strongly influenced by diurnal cyclesand boundary layer processes, which are of less relevance to this study.
3.1. Austral summer (DJF)
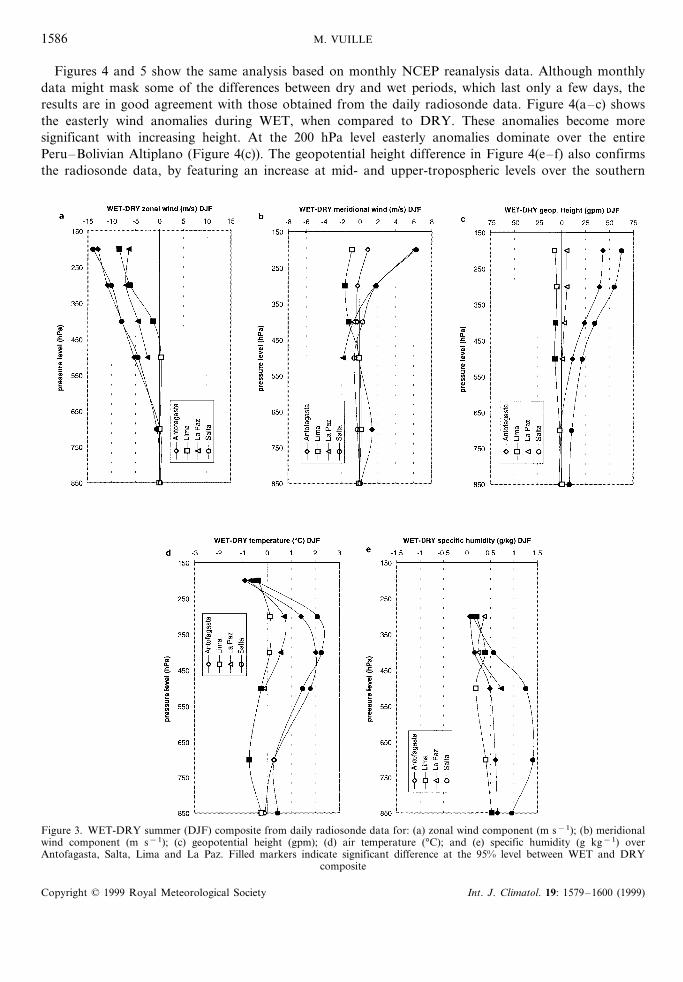
The most coherent pattern during WET periods in austral summer (DJF) is the more negative zonalwind component over the entire Altiplano (Figure 3(a)). All four radiosonde stations show significantlylower zonal wind values during WET as compared to DRY periods in the middle and upper troposphere.This confirms earlier results by Aceituno and Montecinos (1993) and Garreaud (1999), which show thatprecipitation events over the western Altiplano during austral summer are strictly tied to easterly windanomalies. However, it is interesting to see that these easterlies (or weakened westerlies in the case ofAntofagasta and Salta) are present and significant at all levels, not only at the 500 hPa level where majormoisture advection towards the western Altiplano takes place (Aceituno and Montecinos, 1996). It isfurther noteworthy that the circulation anomalies associated with precipitation events in the Sajamaregion are obviously of a larger scale, as the associated wind anomalies can be traced in radiosonde datafar away from Nevado Sajama. The meridional wind (Figure 3(b)) also shows a very interesting pattern,with an increased southerly component to the east of the Altiplano (Salta and La Paz) and an increasednortherly component to the west (Lima). Differences over Antofagasta are insignificant. As mentionedearlier, summer precipitation over the Altiplano is generally associated with upper-air anticyclonic outflowfrom a high pressure system (Bolivian High). Accordingly, as this anticyclone intensifies and movessouthward during precipitation events, winds to the east of the Altiplano become more southerly, whileto the west a more northerly component prevails. This interpretation is further supported by the analysisof the geopotential height pattern (Figure 3(c)). While the geopotential height is significantly increasedover the southernmost Altiplano (Antofagasta and Salta) in the middle and upper troposphere duringWET, the change is insignificant over the central Altiplano (La Paz), but negative to the north over Lima.This is consistent with the picture of a southward displacement and intensification of the Bolivian Highduring precipitation events on Nevado Sajama. Mid-tropospheric temperatures increase significantlyduring precipitation events over the Altiplano due to latent heat release (Figure 3(d)), which is consistentwith similar results obtained by Aceituno and Montecinos (1993), and decrease at the 200 hPa level. Thechange in the large-scale atmospheric circulation from DRY to WET periods also affects the humiditylevels recorded over the four stations. Instead of presenting the measured relative humidity, a moreconservative value, the specific humidity is shown in Figure 3(e). Not surprisingly, increased humidityvalues show up throughout the entire troposphere in all four radiosonde records during WET periodsover the Sajama area, confirming the large-scale nature of these events.
Copyright © 1999 Royal Meteorological Society Int. J. Climatol. 19: 1579–1600 (1999)
M. VUILLE1586
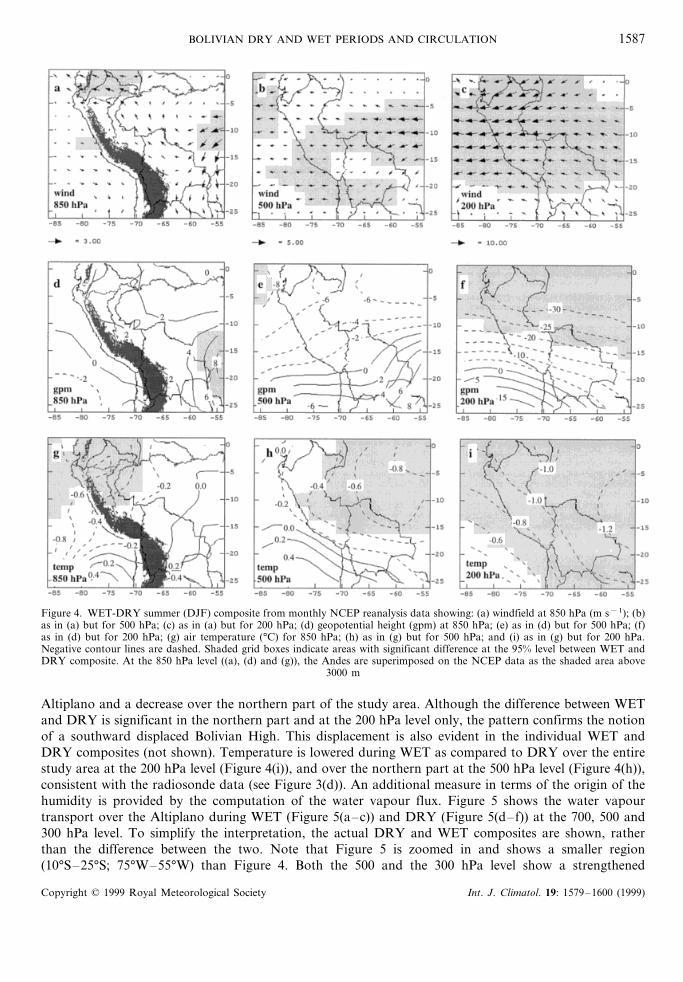
Figures 4 and 5 show the same analysis based on monthly NCEP reanalysis data. Although monthlydata might mask some of the differences between dry and wet periods, which last only a few days, theresults are in good agreement with those obtained from the daily radiosonde data. Figure 4(a–c) showsthe easterly wind anomalies during WET, when compared to DRY. These anomalies become moresignificant with increasing height. At the 200 hPa level easterly anomalies dominate over the entirePeru–Bolivian Altiplano (Figure 4(c)). The geopotential height difference in Figure 4(e–f) also confirmsthe radiosonde data, by featuring an increase at mid- and upper-tropospheric levels over the southern
Figure 3. WET-DRY summer (DJF) composite from daily radiosonde data for: (a) zonal wind component (m s−1); (b) meridionalwind component (m s−1); (c) geopotential height (gpm); (d) air temperature (°C); and (e) specific humidity (g kg−1) overAntofagasta, Salta, Lima and La Paz. Filled markers indicate significant difference at the 95% level between WET and DRY
composite
Copyright © 1999 Royal Meteorological Society Int. J. Climatol. 19: 1579–1600 (1999)
BOLIVIAN DRY AND WET PERIODS AND CIRCULATION 1587
Figure 4. WET-DRY summer (DJF) composite from monthly NCEP reanalysis data showing: (a) windfield at 850 hPa (m s−1); (b)as in (a) but for 500 hPa; (c) as in (a) but for 200 hPa; (d) geopotential height (gpm) at 850 hPa; (e) as in (d) but for 500 hPa; (f)as in (d) but for 200 hPa; (g) air temperature (°C) for 850 hPa; (h) as in (g) but for 500 hPa; and (i) as in (g) but for 200 hPa.Negative contour lines are dashed. Shaded grid boxes indicate areas with significant difference at the 95% level between WET andDRY composite. At the 850 hPa level ((a), (d) and (g)), the Andes are superimposed on the NCEP data as the shaded area above
3000 m
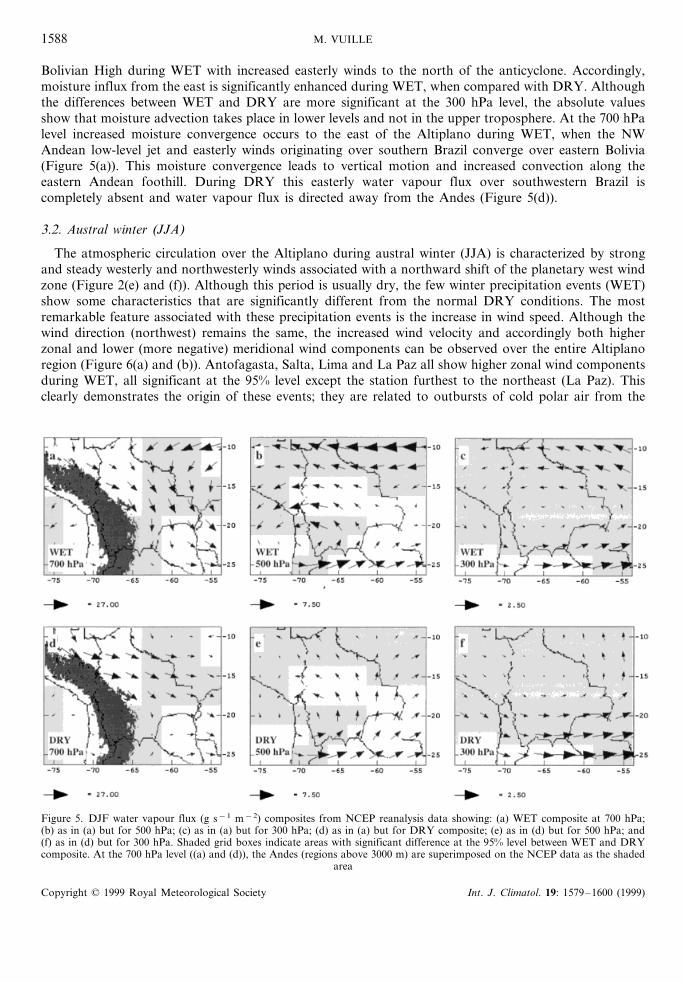
Altiplano and a decrease over the northern part of the study area. Although the difference between WETand DRY is significant in the northern part and at the 200 hPa level only, the pattern confirms the notionof a southward displaced Bolivian High. This displacement is also evident in the individual WET andDRY composites (not shown). Temperature is lowered during WET as compared to DRY over the entirestudy area at the 200 hPa level (Figure 4(i)), and over the northern part at the 500 hPa level (Figure 4(h)),consistent with the radiosonde data (see Figure 3(d)). An additional measure in terms of the origin of thehumidity is provided by the computation of the water vapour flux. Figure 5 shows the water vapourtransport over the Altiplano during WET (Figure 5(a–c)) and DRY (Figure 5(d–f)) at the 700, 500 and300 hPa level. To simplify the interpretation, the actual DRY and WET composites are shown, ratherthan the difference between the two. Note that Figure 5 is zoomed in and shows a smaller region(10°S–25°S; 75°W–55°W) than Figure 4. Both the 500 and the 300 hPa level show a strengthened
Copyright © 1999 Royal Meteorological Society Int. J. Climatol. 19: 1579–1600 (1999)
M. VUILLE1588
Bolivian High during WET with increased easterly winds to the north of the anticyclone. Accordingly,moisture influx from the east is significantly enhanced during WET, when compared with DRY. Althoughthe differences between WET and DRY are more significant at the 300 hPa level, the absolute valuesshow that moisture advection takes place in lower levels and not in the upper troposphere. At the 700 hPalevel increased moisture convergence occurs to the east of the Altiplano during WET, when the NWAndean low-level jet and easterly winds originating over southern Brazil converge over eastern Bolivia(Figure 5(a)). This moisture convergence leads to vertical motion and increased convection along theeastern Andean foothill. During DRY this easterly water vapour flux over southwestern Brazil iscompletely absent and water vapour flux is directed away from the Andes (Figure 5(d)).
3.2. Austral winter (JJA)
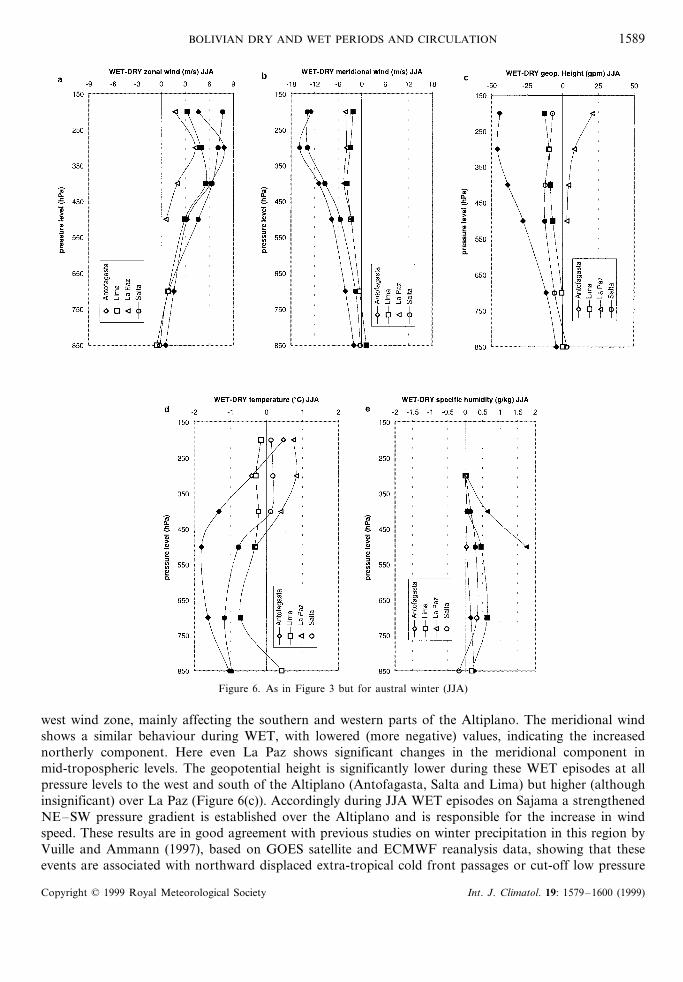
The atmospheric circulation over the Altiplano during austral winter (JJA) is characterized by strongand steady westerly and northwesterly winds associated with a northward shift of the planetary west windzone (Figure 2(e) and (f)). Although this period is usually dry, the few winter precipitation events (WET)show some characteristics that are significantly different from the normal DRY conditions. The mostremarkable feature associated with these precipitation events is the increase in wind speed. Although thewind direction (northwest) remains the same, the increased wind velocity and accordingly both higherzonal and lower (more negative) meridional wind components can be observed over the entire Altiplanoregion (Figure 6(a) and (b)). Antofagasta, Salta, Lima and La Paz all show higher zonal wind componentsduring WET, all significant at the 95% level except the station furthest to the northeast (La Paz). Thisclearly demonstrates the origin of these events; they are related to outbursts of cold polar air from the
Figure 5. DJF water vapour flux (g s−1 m−2) composites from NCEP reanalysis data showing: (a) WET composite at 700 hPa;(b) as in (a) but for 500 hPa; (c) as in (a) but for 300 hPa; (d) as in (a) but for DRY composite; (e) as in (d) but for 500 hPa; and(f) as in (d) but for 300 hPa. Shaded grid boxes indicate areas with significant difference at the 95% level between WET and DRYcomposite. At the 700 hPa level ((a) and (d)), the Andes (regions above 3000 m) are superimposed on the NCEP data as the shaded
area
Copyright © 1999 Royal Meteorological Society Int. J. Climatol. 19: 1579–1600 (1999)
BOLIVIAN DRY AND WET PERIODS AND CIRCULATION 1589
Figure 6. As in Figure 3 but for austral winter (JJA)
west wind zone, mainly affecting the southern and western parts of the Altiplano. The meridional windshows a similar behaviour during WET, with lowered (more negative) values, indicating the increasednortherly component. Here even La Paz shows significant changes in the meridional component inmid-tropospheric levels. The geopotential height is significantly lower during these WET episodes at allpressure levels to the west and south of the Altiplano (Antofagasta, Salta and Lima) but higher (althoughinsignificant) over La Paz (Figure 6(c)). Accordingly during JJA WET episodes on Sajama a strengthenedNE–SW pressure gradient is established over the Altiplano and is responsible for the increase in windspeed. These results are in good agreement with previous studies on winter precipitation in this region byVuille and Ammann (1997), based on GOES satellite and ECMWF reanalysis data, showing that theseevents are associated with northward displaced extra-tropical cold front passages or cut-off low pressure
Copyright © 1999 Royal Meteorological Society Int. J. Climatol. 19: 1579–1600 (1999)

M. VUILLE1590
systems. Temperatures are significantly lower in low- and mid-tropospheric levels over Antofagasta, Limaand Salta (Figure 6(d)) during WET episodes, confirming the cold, extratropical nature of these events.Figure 6(e) shows the specific humidity change between WET and DRY periods, respectively. Althoughhumidity levels are considerably lower than during summer months, the increase during WET is stillsignificant when compared to DRY over the entire Altiplano in mid-tropospheric levels. In strongcontrast to the summer months, however, the main water vapour transport during WET in the winter(JJA) occurs with northwesterly winds.
4. ATMOSPHERIC CIRCULATION DURING HIGH AND LOW INDEX PHASES
4.1. Austral summer (DJF)
Figure 7 shows the DJF precipitation amounts and one standard deviation for Cosapa, Cotacotani andChucuyo (see Table I) during HIGH, LOW and LOW+1, compared to the long-term mean. Althoughamounts tend to be lower during LOW and higher during HIGH and LOW+1, none of the anomaliesare significant at the 95% level (two tailed Student’s t-test). This result confirms the rather weak tendencytowards below average precipitation during El Nino summers on the Bolivian Altiplano reported byRonchail (1999). In addition, La Nina summers and summers following an El Nino period appear to beassociated with slightly increased rainfall.
The associated changes in the atmospheric circulation are presented in Figures 8–14 in the same wayas in the previous section. Figure 8(a) and (b) show increased easterly and southerly (except for Lima)wind components during HIGH, when compared to LOW. Accordingly, reduced summer precipitationamounts during LOW phases are obviously the result of increased northwesterly wind anomalies, whichprevent humid air masses from the eastern interior of the continent to penetrate into the Sajama area.Strengthened westerly wind anomalies (weakened easterlies) are very pronounced over Lima, where thezonal wind component is significantly increased (95% level) at all levels between 500 and 200 hPa duringLOW as compared to HIGH. Over Antofagasta and Salta the difference is only significant at the 200 hPalevel, while over La Paz westerly wind anomalies are significantly increased in mid-tropospheric levels(500, 400 hPa) during LOW. The meridional wind component shows significantly lower values (increasednortherly component) between 200 and 500 hPa (Antofagasta), and 200 and 300 hPa (Salta and La Paz)during LOW as compared to HIGH (Figure 8(b)). Lima is the only station where the northerly wind
Figure 7. DJF precipitation amounts (mm) for Cosapa, Cotacotani and Chucuyo during LOW, HIGH and LOW+1 periods,compared to the long-term mean. Error bars indicate 1 standard deviation
Copyright © 1999 Royal Meteorological Society Int. J. Climatol. 19: 1579–1600 (1999)
BOLIVIAN DRY AND WET PERIODS AND CIRCULATION 1591
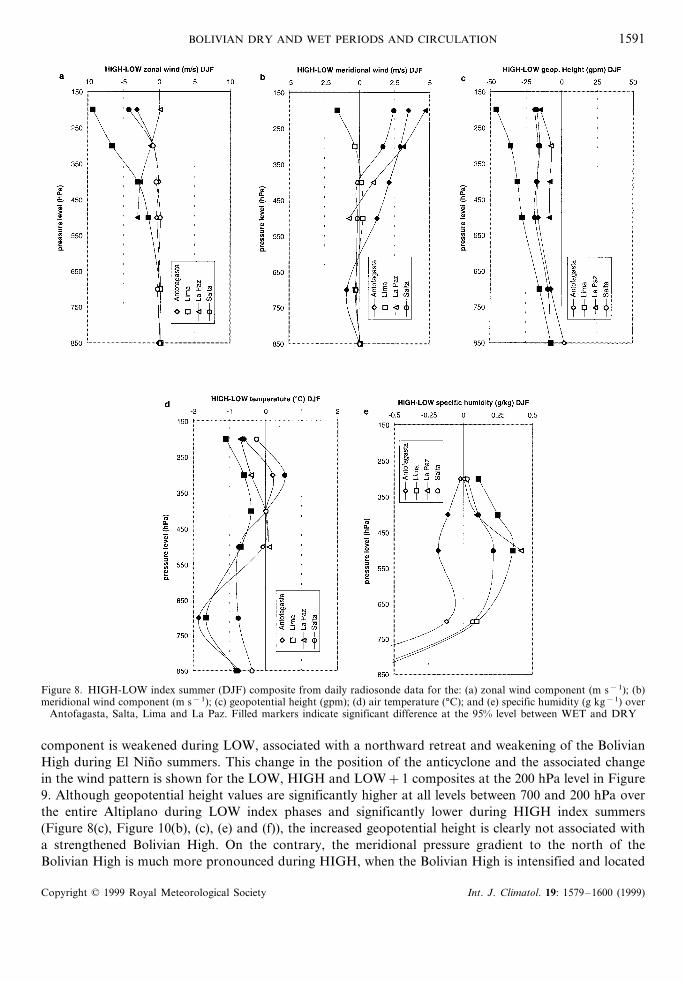
Figure 8. HIGH-LOW index summer (DJF) composite from daily radiosonde data for the: (a) zonal wind component (m s−1); (b)meridional wind component (m s−1); (c) geopotential height (gpm); (d) air temperature (°C); and (e) specific humidity (g kg−1) over
Antofagasta, Salta, Lima and La Paz. Filled markers indicate significant difference at the 95% level between WET and DRY
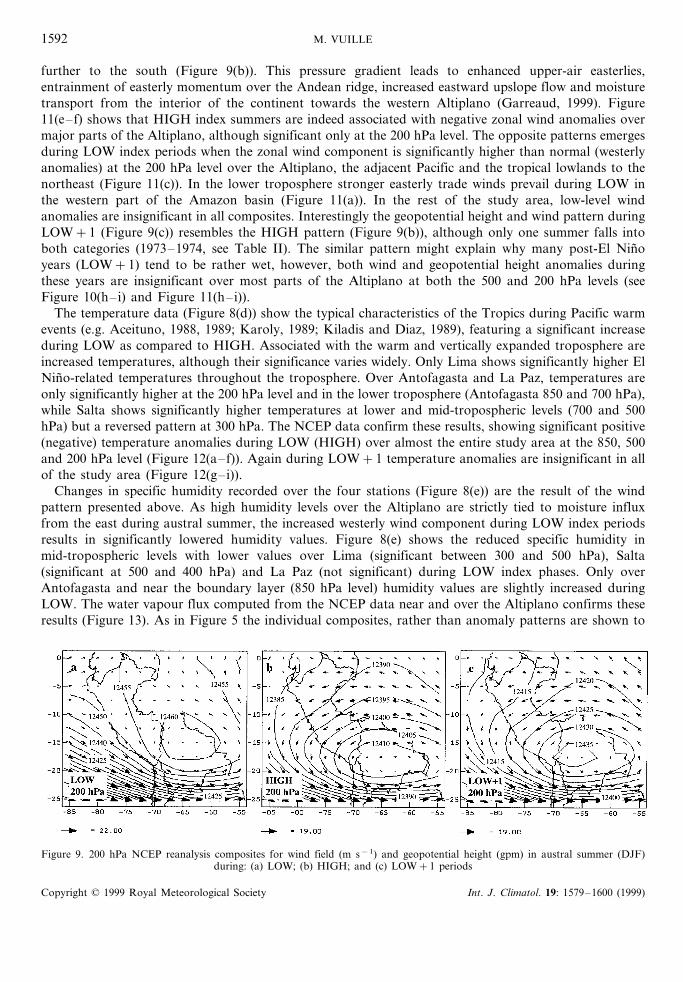
component is weakened during LOW, associated with a northward retreat and weakening of the BolivianHigh during El Nino summers. This change in the position of the anticyclone and the associated changein the wind pattern is shown for the LOW, HIGH and LOW+1 composites at the 200 hPa level in Figure9. Although geopotential height values are significantly higher at all levels between 700 and 200 hPa overthe entire Altiplano during LOW index phases and significantly lower during HIGH index summers(Figure 8(c), Figure 10(b), (c), (e) and (f)), the increased geopotential height is clearly not associated witha strengthened Bolivian High. On the contrary, the meridional pressure gradient to the north of theBolivian High is much more pronounced during HIGH, when the Bolivian High is intensified and located
Copyright © 1999 Royal Meteorological Society Int. J. Climatol. 19: 1579–1600 (1999)
M. VUILLE1592
further to the south (Figure 9(b)). This pressure gradient leads to enhanced upper-air easterlies,entrainment of easterly momentum over the Andean ridge, increased eastward upslope flow and moisturetransport from the interior of the continent towards the western Altiplano (Garreaud, 1999). Figure11(e–f) shows that HIGH index summers are indeed associated with negative zonal wind anomalies overmajor parts of the Altiplano, although significant only at the 200 hPa level. The opposite patterns emergesduring LOW index periods when the zonal wind component is significantly higher than normal (westerlyanomalies) at the 200 hPa level over the Altiplano, the adjacent Pacific and the tropical lowlands to thenortheast (Figure 11(c)). In the lower troposphere stronger easterly trade winds prevail during LOW inthe western part of the Amazon basin (Figure 11(a)). In the rest of the study area, low-level windanomalies are insignificant in all composites. Interestingly the geopotential height and wind pattern duringLOW+1 (Figure 9(c)) resembles the HIGH pattern (Figure 9(b)), although only one summer falls intoboth categories (1973–1974, see Table II). The similar pattern might explain why many post-El Ninoyears (LOW+1) tend to be rather wet, however, both wind and geopotential height anomalies duringthese years are insignificant over most parts of the Altiplano at both the 500 and 200 hPa levels (seeFigure 10(h–i) and Figure 11(h–i)).
The temperature data (Figure 8(d)) show the typical characteristics of the Tropics during Pacific warmevents (e.g. Aceituno, 1988, 1989; Karoly, 1989; Kiladis and Diaz, 1989), featuring a significant increaseduring LOW as compared to HIGH. Associated with the warm and vertically expanded troposphere areincreased temperatures, although their significance varies widely. Only Lima shows significantly higher ElNino-related temperatures throughout the troposphere. Over Antofagasta and La Paz, temperatures areonly significantly higher at the 200 hPa level and in the lower troposphere (Antofagasta 850 and 700 hPa),while Salta shows significantly higher temperatures at lower and mid-tropospheric levels (700 and 500hPa) but a reversed pattern at 300 hPa. The NCEP data confirm these results, showing significant positive(negative) temperature anomalies during LOW (HIGH) over almost the entire study area at the 850, 500and 200 hPa level (Figure 12(a–f)). Again during LOW+1 temperature anomalies are insignificant in allof the study area (Figure 12(g–i)).
Changes in specific humidity recorded over the four stations (Figure 8(e)) are the result of the windpattern presented above. As high humidity levels over the Altiplano are strictly tied to moisture influxfrom the east during austral summer, the increased westerly wind component during LOW index periodsresults in significantly lowered humidity values. Figure 8(e) shows the reduced specific humidity inmid-tropospheric levels with lower values over Lima (significant between 300 and 500 hPa), Salta(significant at 500 and 400 hPa) and La Paz (not significant) during LOW index phases. Only overAntofagasta and near the boundary layer (850 hPa level) humidity values are slightly increased duringLOW. The water vapour flux computed from the NCEP data near and over the Altiplano confirms theseresults (Figure 13). As in Figure 5 the individual composites, rather than anomaly patterns are shown to
Figure 9. 200 hPa NCEP reanalysis composites for wind field (m s−1) and geopotential height (gpm) in austral summer (DJF)during: (a) LOW; (b) HIGH; and (c) LOW+1 periods
Copyright © 1999 Royal Meteorological Society Int. J. Climatol. 19: 1579–1600 (1999)

BOLIVIAN DRY AND WET PERIODS AND CIRCULATION 1593
Figure 10. Geopotential height (gpm) anomaly fields (deviation from long-term mean) during austral summer (DJF) for: (a) LOWand 850 hPa; (b) as in (a) but for 500 hPa; (c) as in (a) but for 200 hPa; (d) HIGH and 850 hPa; (e) as in (d) but for 500 hPa; (f)as in (d) but for 200 hPa; (g) LOW+1 and 850 hPa; (h) as in (g) but for 500 hPa; and (i) as in (g) but for 200 hPa. Negative contourlines are dashed. Shaded grid boxes indicate areas with significant anomalies at the 95% level. At the 850 hPa level ((a), (d) and (g)),
the Andes (regions above 3000 m) are superimposed on the NCEP data as the shaded area
simplify the interpretation. The long-term mean DJF water vapour flux is shown in Figure 13(a–c) forcomparison. The weakening and northward displacement of the Bolivian High during LOW leads to asignificant reduction of the water vapour flux over the northern part of the Altiplano (Figure 13(e–f)),very similar to the situation observed during DRY (compare with Figure 5(e–f)). On the other handmoisture flux is increased over the Altiplano during HIGH (Figure 13(h–i)) and LOW+1 (Figure13(k–l)), although the anomalies do not reach statistical significance at all levels and over the entire studyarea. At the 700 hPa level the flow from the NW along the eastern Andean slope is reduced during HIGH(Figure 13(g)) when compared to LOW or the long-term mean. On the other hand an increased northerlycomponent leads to enhanced moisture convergence over the eastern Bolivian lowlands during LOW+1(Figure 13(j)), similar to the WET composite (Figure 5(a)).
Copyright © 1999 Royal Meteorological Society Int. J. Climatol. 19: 1579–1600 (1999)

M. VUILLE1594
4.2. Austral winter (JJA)
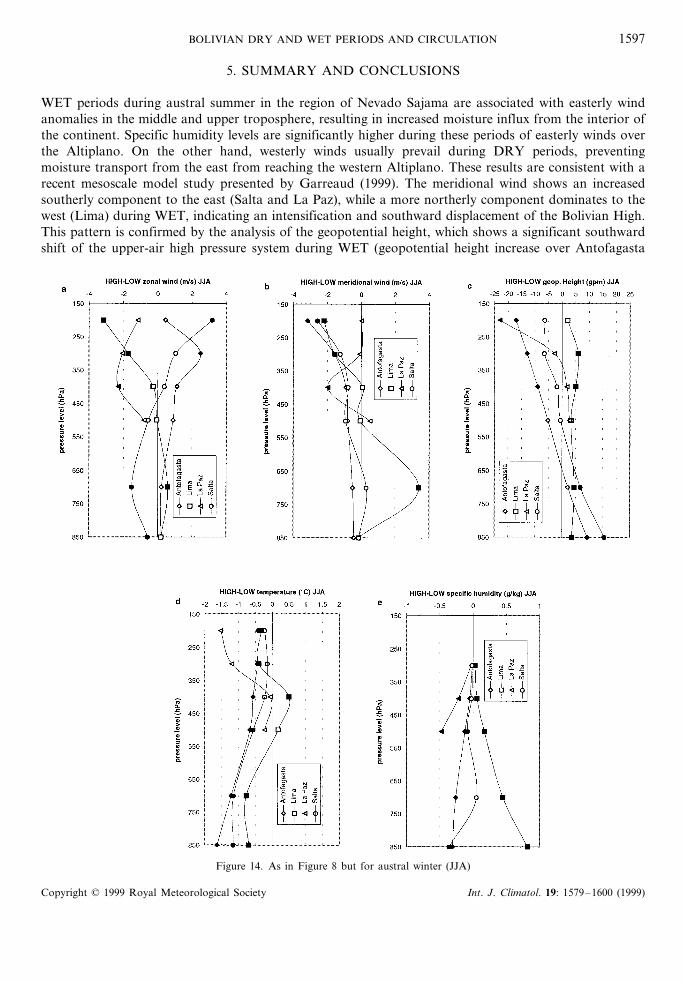
Precipitation events in austral winter are rare in the Altiplano and the recorded amounts are sometimesvery dubious (Vuille and Ammann, 1997). In addition, the Southern Oscillation tends to peak duringaustral summer, and exhibits less extreme values during the winter months. Accordingly it is no surprisethat precipitation data from the stations near Nevado Sajama show no relationship with the SouthernOscillation during austral winter months (JJA, not shown). Changes in the atmospheric circulationbetween HIGH and LOW index phases are also less pronounced and the patterns generally less consistentbetween the analysed records. Therefore, only results from the radiosonde analysis are presented here.Most obvious are the increased temperatures (Figure 14(d)) and the vertically expanded troposphere(increase in geopotential height, Figure 14(c)) during LOW as compared to HIGH, consistent with resultsby Aceituno (1989), who reports that the atmospheric response during LOW periods in austral winter is
Figure 11. As in Figure 10 but for wind field (m s−1)
Copyright © 1999 Royal Meteorological Society Int. J. Climatol. 19: 1579–1600 (1999)

BOLIVIAN DRY AND WET PERIODS AND CIRCULATION 1595
Figure 12. As in Figure 10 but for air temperature (°C)
in broad agreement with the response in austral summer. Lima is the only station which does not agreewith this pattern, featuring slightly decreased (increased) geopotential height values and lower (higher)mid-tropospheric temperatures during LOW (HIGH). The wind pattern shows a less evident picture,featuring reduced zonal wind components over the southern stations Salta and Antofagasta (weakerwesterlies) in the upper and middle troposphere during LOW as compared to HIGH, while the samecomponent is enhanced over Lima and La Paz (Figure 14(a)). The significance of these anomalieshowever, varies widely, depending on station and pressure level. The response of the meridional windcomponent is more consistent, featuring positive anomalies (weakened northerly winds) during LOW ascompared to HIGH over the entire area, although not significant at all levels (Figure 14(b)). The specifichumidity is higher during LOW than during HIGH over Antofagasta, Salta, and La Paz, while Limaagain shows a different behaviour with higher values during HIGH (Figure 14(e)). In general variationsin the atmospheric circulation over the Altiplano during austral winter show a rather weak relationshipto the Southern Oscillation. Interannual variability during austral winter might more likely be determinedby other factors, such as the strength and frequency of extra-tropical waves (frontal systems and cut-offlow pressure systems) originating in the Pacific and penetrating into the Altiplano region.
Copyright © 1999 Royal Meteorological Society Int. J. Climatol. 19: 1579–1600 (1999)

M. VUILLE1596
Figure 13. DJF water vapour flux (g s−1 m−2) composites from NCEP reanalysis data showing: (a) long-term mean at 700 hPa;(b) as in (a) but for 500 hPa; (c) as in (a) but for 300 hPa; (d) LOW composite at 700 hPa; (e) as in (d) but for 500 hPa; (f) as in(d) but for 300 hPa; (g) HIGH composite at 700 hPa; (h) as in (g) but for 500 hPa; (i) as in (g) but for 300 hPa; (j) LOW+1composite at 700 hPa; (k) as in (j) but for 500 hPa; and (l) as in (j) but for 300 hPa. Shaded grid boxes indicate areas with significantanomalies at the 95% level. At the 700 hPa level ((a), (d), (g) and (j)), the Andes (regions above 3000 m) are superimposed on the
NCEP data as the shaded area
Copyright © 1999 Royal Meteorological Society Int. J. Climatol. 19: 1579–1600 (1999)
BOLIVIAN DRY AND WET PERIODS AND CIRCULATION 1597
5. SUMMARY AND CONCLUSIONS
WET periods during austral summer in the region of Nevado Sajama are associated with easterly windanomalies in the middle and upper troposphere, resulting in increased moisture influx from the interior ofthe continent. Specific humidity levels are significantly higher during these periods of easterly winds overthe Altiplano. On the other hand, westerly winds usually prevail during DRY periods, preventingmoisture transport from the east from reaching the western Altiplano. These results are consistent with arecent mesoscale model study presented by Garreaud (1999). The meridional wind shows an increasedsoutherly component to the east (Salta and La Paz), while a more northerly component dominates to thewest (Lima) during WET, indicating an intensification and southward displacement of the Bolivian High.This pattern is confirmed by the analysis of the geopotential height, which shows a significant southwardshift of the upper-air high pressure system during WET (geopotential height increase over Antofagasta
Figure 14. As in Figure 8 but for austral winter (JJA)
Copyright © 1999 Royal Meteorological Society Int. J. Climatol. 19: 1579–1600 (1999)
M. VUILLE1598
and Salta, no change over La Paz and a decrease over Lima). The fact that this anticyclone is intensifiedand centred over the southern Altiplano, south of its climatological position, during rainy periods, isfurther corroborated by the analysis of monthly NCEP reanalysis data and consistent with similar resultsreported by Aceituno and Montecinos (1993). Besides the upper-air divergent outflow related to the highpressure system, upper-air easterly winds to the north of the anticyclone lead to a turbulent entrainmentof near-surface winds, accelerating moisture transport in lower levels towards the Altiplano (Garreaud,1999). Often the upper-air high pressure system is located off the Pacific coast, to the southwest of theAltiplano, enhancing the southeasterly flow and upper-air divergence over the Altiplano (Jacobeit, 1992;Vuille et al., 1998).
Circulation mechanisms during WET periods in winter (JJA) are entirely different from in the summer,yet very little has been published to date about atmospheric circulation during WET periods on theAltiplano in austral winter. This period is generally believed to be entirely dry. However, recent snowaccumulation measurements on the summit of Nevado Sajama yielded 53 cm of snowfall from Julythrough September 1997 (Hardy et al., 1998), and Vuille and Baumgartner (1998) reported an average ofthree to five snowfall events per winter in the southern Altiplano. Vuille and Ammann (1997), analysingwinter snowfall events on the Altiplano between 1984 and 1993 using NOAA/AVHRR and GOESsatellite data, ECMWF gridded upper-air data and radiosonde data from Antofagasta, have shown thatprecipitation between May and September is associated with outbursts or northward intrusions of polarair masses from the planetary west wind zone. Cold fronts, or upper-air low pressure systems (cut-offlows), that penetrate into the southern Altiplano trigger the rare winter precipitation events on NevadoSajama. The radiosonde analysis presented here confirm these results, revealing increased northerly andwesterly wind components, reduced pressure and temperatures, and increased specific humidity over theentire Altiplano during such events. The fact that these anomalies are more pronounced over the southernand western stations Antofagasta, Lima and Salta than over La Paz provide clear evidence for the Pacificorigin of these events.
The results from this analysis of atmospheric circulation during WET and DRY periods over the SouthAmerican Altiplano in austral summer (DJF) and winter (JJA) have clear implications for the interpreta-tion of the proxy data obtained from ice cores from Sajama summit. Most importantly they show thatprecipitation events on Sajama are related to large-scale circulation changes over the entire Altiplanoregion, and can be traced in radiosonde data to the east and the west of the Central Andes. Accordingly,proxy data from the ice core are of more than just local significance, and can be linked to circulationfeatures on a larger scale. Furthermore, Nevado Sajama lies in an area which is influenced by two entirelydifferent circulation regimes during the course of the year. Due to the seasonal shifts of the circulationzones, it experiences tropical as well as extra-tropical precipitation events. This is of importance becausepast climatic changes, recorded in the ice cores, might have been caused by shifts in circulation zones. Inthese terms, Nevado Sajama is an excellent place for palaeoclimatic studies.
The El Nino–Southern Oscillation phenomenon has a significant impact on the Altiplano climate,especially during austral summer. Atmospheric circulation anomalies however are more significant thanchanges in precipitation, which are statistically insignificant in the Nevado Sajama region. Nonetheless,precipitation tends to be deficient during LOW index summers (El Nino), and above average duringHIGH (La Nina) and LOW+1 (DJF following El Nino) summers. The tendency towards increasedaridity during LOW summers can at least partially be attributed to a higher zonal wind component(westerly wind anomalies) in the middle and upper troposphere, preventing penetration of moist airmasses from the eastern interior of the continent into the Sajama area. These westerlies are associatedwith a northward displaced and weakened Bolivian High. In this sense LOW index periods arecharacterized by similar anomalies as DRY periods, and can be regarded as an extended DRY period ora summer with an increased occurrence of DRY episodes. Furthermore, both LOW and DRY summersfeature significantly above average upper-air temperatures (200 hPa). Although not always significant atall pressure levels, the general state of the atmosphere over the Altiplano during austral summer LOWindex phases can be characterized by an increased westerly and northerly wind component, reducedspecific humidity, an increase in atmospheric temperatures and a vertically expanded troposphere.
Copyright © 1999 Royal Meteorological Society Int. J. Climatol. 19: 1579–1600 (1999)

BOLIVIAN DRY AND WET PERIODS AND CIRCULATION 1599
HIGH index summers are characterized by broadly opposite atmospheric characteristics also mostlytypical for WET summer periods (lower temperatures at 500 and 200 hPa, a more pronounced BolivianHigh located significantly further south, and easterly wind anomalies over the Altiplano). The atmo-spheric circulation during the summer following an El Nino event (LOW+1) shows some similarities withthe HIGH index situation, however the anomalies are statistically insignificant when compared to thelong-term mean.
Precipitation during austral winter (JJA) shows no relationship with the extremes of the SouthernOscillation. Atmospheric circulation anomalies are also less pronounced, and generally feature the samechanges as in summer (increased temperatures and a vertically expanded troposphere during LOW).However, the significance of these changes, especially with regard to the wind pattern, varies dependingon station and pressure level. In general winter circulation anomalies over the Altiplano show littlerelation to the Southern Oscillation and are more likely determined by other factors such as thepenetration of extra-tropical frontal systems and cut-off low pressure systems, not directly linked toENSO.
Despite the clearly demonstrated influence of ENSO on the atmospheric circulation over the Altiplano,precipitation anomalies near Nevado Sajama are statistically insignificant (95% level). Factors other thansurface conditions in the Pacific apparently play a crucial role in determining precipitation amounts. Ithas also been suggested recently, that precipitation variability on interannual and interdecadal timescalesin the tropical Andes might rather be attributed to Atlantic than Pacific SST forcings (Enfield, 1996;Henderson, 1996; Melice and Roucou, 1998; Vuille et al., 1999). Studies are under way, to learn moreabout what forcing factors other than ENSO contribute to climatic variability on interannual timescalesover the South American Altiplano.
ACKNOWLEDGEMENTS
Radiosonde data from the CARDS project was kindly provided by Henry F. Diaz and Jon Eischeid. LitaButtolph contributed part of the Bolivian precipitation data. NCEP reanalysis data was received fromNOAA-CIRES Climate Diagnostics Center. Frank Keimig is gratefully acknowledged for his program-ming assistance. The valuable comments and suggestions from Raymond S. Bradley and Douglas R.Hardy are appreciated. Two anonymous reviewers provided helpful comments that substantially improvedan earlier version of this article. This study was financed by US-NSF (grant ATM 9707698) andSwiss-NSF (grant 8220-050401). Both agencies are gratefully acknowledged.
REFERENCES
Aceituno, P. 1988. ‘On the functioning of the Southern Oscillation in the South American sector. Part I: Surface climate’, Mon. Wea.Re6., 116, 505–524.
Aceituno, P. 1989. ‘On the functioning of the Southern Oscillation in the South American Sector. Part II: Upper-air circulation’, J.Climate, 2, 341–355.
Aceituno, P. and Montecinos, A. 1993. ‘Circulation anomalies associated with dry and wet periods in the South AmericanAltiplano’, Proc. 4th Int. Conf. on S. Hem. Meteor., Hobart, Australia, Am. Meteor. Soc., pp. 330–331.
Aceituno, P. and Garreaud, R. 1995. ‘Impacto de los fenomenos el nino y la nina en regimenes fluviometricos andinos’, Re6. Chilenade Ing. Hidraulica, 10(2), 33–43.
Aceituno, P. and Montecinos, A. 1996. ‘Ciclos meteorologicos anual y diario en el sector chileno del Altiplano sudamericano’,unpublished manuscript.
Berri, G.J. and Inzunza, B.J. 1993. ‘The effect of the low-level jet on the poleward water vapor transport in the central region ofSouth America’, Atmos. En6iron., 27A(3), 335–341.
Deser, C. and Wallace, J.M. 1987. ‘El Nino events and their relation to the Southern Oscillation: 1925–1986’, J. Geophys. Res.,92(C13), 14189–14196.
Diaz, H.F. and Pulwarty, R.S. 1994. ‘An analysis of the time scales of variability in centuries-long ENSO-sensitive records in thelast 1000 years’, Clim. Change, 26, 317-342.
Enfield, D.B. 1996. ‘Relationship of inter-American rainfall to tropical Atlantic and Pacific SST variability’, Geophys. Res. Lett.,23(23), 3305–3308.
Francou, B., Ribstein, P., Saravia, R. and Tiriau, E. 1995. ‘Monthly balance and water discharge of an inter-tropical glacier: Zongoglacier, Cordillera Real, Bolivia, 16°S’, J. Glaciol., 41(137), 61–67.
Copyright © 1999 Royal Meteorological Society Int. J. Climatol. 19: 1579–1600 (1999)
M. VUILLE1600
Fuenzalida, H.P. and Ruttlant, J. 1987. ‘Origen del vapor de agua que precipita sobre el Altiplano de Chile’, Proc. II CongresoInter-Americano de Meteorologia, Buenos Aires, Argentina, Am. Meteorol. Soc., 6.3.1.–6.3.4.
Garreaud R.D. and Wallace, J.M. 1997. ‘The diurnal march of convective cloudiness over the Americas’, Mon. Wea. Re6., 125,3157–3171.
Garreaud, R.D. 1999. ‘Multi-scale analysis of the summertime precipitation over the Central Andes’, Mon. Wea. Re6. (in press).Halpert, M.S. and Ropelewski, C.F. 1992. ‘Surface temperature patterns associated with the Southern Oscillation’, J. Climate, 5,
577–593.Hardy, D.R., Vuille, M., Braun, C., Keimig, F. and Bradley, R.S. 1998. ‘Annual and daily meteorological cycles at high altitude on
a tropical mountain’, Bull. Am. Meteorol. Soc., 79(9), 1899–1913.Henderson, K.A. 1996. The El Nino–Southern Oscillation and other modes of interannual tropical climate 6ariability as recorded in
ice cores from the Ne6ado Huascaran Col, Peru, MS Thesis, Ohio State University, 194 pp.Horel, J.D., Hahmann, A.N. and Geisler, J.E. 1989. ‘An investigation of the annual cycle of convective activity over the tropical
Americas’, J. Climate, 2, 1388–1403.Jacobeit, J. 1992. ‘Die grossraumige Hohenstromung in der Hauptregenzeit feuchter und trockener Jahre uber dem sudamerikanis-
chen Altiplano’, Meteor. Z. N. F. 1, 6, 276–284.Kalnay, E., Kanamitsu, M., Kistler, R., Collins, W., Deaven, D., Gandin, L., Iredell, M., Saha, S., White, G., Woollen, J., Zhu,
Y., Chelliah, M., Ebisuzaki, W., Higgins, W., Janowiak, J., Mo, K.C., Ropelewski, C., Wang, J., Leetmaa, A., Reynolds, R.,Jenne, R. and Joseph, D. 1996. ‘The NCEP/NCAR 40-year reanalysis project’, Bull. Am. Meteorol. Soc., 77(3), 437–471.
Karoly, D.J. 1989. ‘Southern hemisphere circulation features associated with El Nino–Southern Oscillation events’, J. Climate, 2,1239–1252.
Kiladis, G.N. and Diaz, H. 1989. ‘Global climatic anomalies associated with extremes in the Southern Oscillation’, J. Climate, 2,1069–1090.
Lenters, J.D. and Cook, K.H. 1997. ‘On the origin of the Bolivian High and related circulation features of the South AmericanClimate’, J. Atmos. Sci., 54, 656–677.
Melice, J.L. and Roucou, P. 1998. ‘Decadal time scale variability recorded in the Quelccaya summit ice core d18O isotopic ratioseries and its relation with sea surface temperature’, Clim. Dyn., 14, 117–132.
Rao, V.B., Cavalcanti, I.F.A. and Hada, K. 1996. ‘Annual variation of rainfall over Brazil and water vapor characteristics overSouth America’, J. Geophys. Res., 101(D21), 26539–26551.
Rao, V.B., Chapa, S.R. and Cavalcanti, I.F.A. 1998. ‘Moisture budget in the tropics and the Walker circulation’, J. Geophys. Res.,103(D12), 13713–13728.
Rogers, J.C. 1988. ‘Precipitation variability over the Caribbean and the tropical Americas associated with the Southern Oscillation’,J. Climate, 1, 172–182.
Ronchail, J. 1995. ‘Variabilidad interanual de las precipitaciones en Bolivia’, Bull. Inst. fr. etudes andines, 24(3), 369–378.Ronchail, J. 1999. ‘Variabilite pluviometrique lors des phases extremes de l’oscillation australe du Pacifique en Bolivie (1950–1993)’,
Bull. Inst. fr. etudes andines (in press).Ropelewski, C.F. and Halpert, M.S. 1987. ‘Global and regional scale precipitation patterns associated with the El Nino/Southern
Oscillation’, Mon. Wea. Re6., 115, 1606–1626.Ropelewski, C.F. and Halpert, M.S. 1989. ‘Precipitation patterns associated with the high index phase of the Southern Oscillation’,
J. Climate, 3, 268–284.Ropelewski, C.F. and Halpert, M.S. 1996. ‘Quantifying Southern Oscillation–precipitation relationships’, J. Climate, 9, 1042–1059.Schwerdtfeger, W. 1961. ‘Stromungs- und Temperaturfeld der freien Atmosphare uber den Anden’, Meteor. Rundschau, 14(1), 1–6.Silva Dias, P.L., Schubert, W.H. and DeMaria, M. 1983. ‘Large-scale response of the tropical atmosphere to transient convection’,
J. Atmos. Sci., 40, 2689–2707.Tapley, T.D. and Waylen, P.R. 1990. ‘Spatial variability of annual precipitation and ENSO events in western Peru’, Hydrol. Sci. J.,
35(4), 429–446.Thompson, L.G., Mosley-Thompson, E. and Arnao, B.J. 1984. ‘El Nino–Southern Oscillation events recorded in the stratigraphy
of the tropical Quelccaya ice cap, Peru’, Science, 226, 50–52.Thompson, L.G. 1993. ‘Reconstructing the paleo ENSO records from tropical and subtropical ice cores’, Bull. Inst. fr. etudes
andines, 22(1), 65–83.Thompson, L.G., Davis, M.E., Mosley-Thompson, E., Sowers, T., Henderson, K., Zagorodnov, V.S., Lin, P-N., Mikhalenko, V.N.,
Campen, R.K., Bolzan, J.F., Cole-Dai, J. and Francou, B., 1998. ‘A 25,000 year tropical climate history from Bolivian ice cores’,Science, 282, 1858–1864.
Trenberth, K.E. and Hoar, T.J. 1996. ‘The 1990–1995 El Nino–Southern Oscillation event: longest on record’, Geophys. Res. Lett.,23(1), 57–60.
Virji, H. 1981. ‘A preliminary study of summertime tropospheric circulation over South America estimated from cloud winds’, Mon.Wea. Re6., 109, 599–610.
Vuille, M. and Ammann, C. 1997. ‘Regional snowfall patterns in the high arid Andes’, Clim. Change, 36, 413–423.Vuille, M. and Baumgartner, M.F. 1998. ‘Monitoring the regional and temporal variability of winter snowfall in the arid Andes
using digital NOAA/AVHRR data’, Geocarto Int., 13(1), 59–68.Vuille, M., Hardy, D.R., Braun, C., Keimig, F. and Bradley, R.S. 1998. ‘Atmospheric circulation anomalies associated with
1996/1997 summer precipitation events on Sajama Ice Cap, Bolivia’, J. Geophys. Res., 103(D10), 11191–11204.Vuille, M., Bradley, R.S. and Keimig, F. 1999. ‘Climate variability in the Andes of Ecuador and its relation to tropical Pacific and
Atlantic sea surface temperature anomalies’, J. Climate (in review).
Copyright © 1999 Royal Meteorological Society Int. J. Climatol. 19: 1579–1600 (1999)