atlas: software development environment for hardware
TRANSCRIPT

ATLAS: SOFTWARE DEVELOPMENT ENVIRONMENT FOR
HARDWARE TRANSACTIONAL MEMORY
A DISSERTATION
SUBMITTED TO THE DEPARTMENT OF ELECTRICAL
ENGINEERING
AND THE COMMITTEE ON GRADUATE STUDIES
OF STANFORD UNIVERSITY
IN PARTIAL FULFILLMENT OF THE REQUIREMENTS
FOR THE DEGREE OF
DOCTOR OF PHILOSOPHY
Sewook Wee
June 2008

c© Copyright by Sewook Wee 2008
All Rights Reserved
ii
I certify that I have read this dissertation and that, in my opinion, it
is fully adequate in scope and quality as a dissertation for the degree
of Doctor of Philosophy.
(Christos Kozyrakis) Principal Adviser
I certify that I have read this dissertation and that, in my opinion, it
is fully adequate in scope and quality as a dissertation for the degree
of Doctor of Philosophy.
(Oyekunle Olukotun)
I certify that I have read this dissertation and that, in my opinion, it
is fully adequate in scope and quality as a dissertation for the degree
of Doctor of Philosophy.
(Fouad A. Tobagi)
Approved for the University Committee on Graduate Studies.
iii

iv

Abstract
Multi-cores are already available on today’s personal computers, and parallel pro-
gramming is the key to utilizing their scalable performance. However, writing a
fast and correct parallel program is still difficult because multiple threads run on
the shared data; thus, programmers should synchronize them properly. To address
this difficulty, Transactional Memory (TM) has been proposed as an alternative to
conventional lock-based synchronization. TM can be implemented in a variety of
ways; software TM (STM) is attractive because it runs on off-the-shelf hardware
without modification, whereas hardware TM (HTM) performs much better and pro-
vides correct and predictable results. This research is built upon the Transactional
Coherence and Consistency architecture (TCC), an HTM architecture developed at
Stanford University. Moreover, unlike other proposals, TCC uses TM mechanisms to
replace conventional MESI protocol−which stands for Modified, Exclusive, Shared,
and Invalid−having all user code executes within transactions−i.e. all transactions,
all the time.
To develop parallel applications that fully utilize TM’s capability, a complete
software development environment is necessary. The software environment includes
programming languages, an operating system, and performance and functionality de-
bugging tools. This thesis presents a software development environment, referred to
as ATLAS; it addresses the challenges of the latter two issues, the operating system
and the productivity tools, on the full-system prototype of the TCC architecture.
Running an operating system on an HTM system faces many challenges: it requires
a communication mechanism between the user thread and the operating system that
does not compromise the atomicity and isolation of transactions; It also requires a
v
mechanism to handle irrevocable operations, such as I/O, and external actions, such
as interrupts. ATLAS addresses these issues by dedicating a CPU to run the oper-
ating system (OS CPU). The remaining CPUs run a proxy kernel that handles the
interactions of the applications with the operating system using a separate commu-
nication channel. This thesis describes the implementation of OS functionality using
this approach and demonstrates that it scales efficiently to multi-core systems with
32 processors.
ATLAS builds upon TM resources to provide three functional and performance
debugging tools for parallel programming. The first tool, ReplayT, provides the
deterministic replay of multithreaded applications; it tracks execution at the granu-
larity of transactions to reduce both the time and space overhead of logging thread
interactions. The second tool, AVIO-TM, detects atomicity violation bugs in transac-
tional memory programs. It extends, simplifies, and accelerates the proposed AVIO
mechanism. The third tool, TAPE, is a light-weight runtime performance bottleneck
monitor that identifies the performance bottlenecks of TM applications with the de-
tailed information that is needed to optimize the applications. TAPE builds upon
TM hardware that continuously monitors all memory accesses in the user code.
vi

Acknowledgments
I wish to acknowledge the valuable contributions of my advisors, Christos Kozyrakis
and Kunle Olukotun. They have encouraged me in my research whenever I faced an
obstacle and directed me toward the right path with excellent insights whenever I
lost my way. Furthermore, they were both wonderful counselors and role models for
my life.
I would like to thank Fouad A. Tobagi for serving on my reading and oral exami-
nation committee. Moreover, he invigorated me whenever we met with his smile and
sense of humor. I, also, want to thank Boris Murman for readily agreeing to serve as
the committee chairman. In fact, when I first started my graduate study at Stanford,
I almost changed my research field because his class was so interesting.
All of my research could not have been completed without the help of my col-
leagues. I appreciate Njuguna Njoroge for delivering a stable TCC cache at our early
research stage; Jared Casper for implementing interconnection hardware; Jiwon Seo
for assisting with the software infrastructure; and undergraduate alumni−Justin Bur-
dick, Daxia Ge, Yuriy Teslyar, Sanghyup Kwak–for their unlimited devotion. All the
TCC group members, including Chi Cao Minh, JaeWoong Chung, Austen McDon-
ald, Brian Carlstrom, Hassan Chafi, Nathan Bronson, Tayo Oguntebi, and Sungpack
Hong, have provided a stable infrastructure that I could always rely on.
I should mention that RAMP, the Research Accelerator for Multiple Processors,
and BEE2 developers actually accelerated my research, as they promised, by sharing
their resources and letting me focus on my research issue based on their infrastruc-
ture. In particular, I want to thank David Patterson for leading the community,
John Wawrzynek and Chen Cheng for the BEE2 board support, Daniel Burke and
vii
Alex Krasnov for BEE2 clusters and RAMP tutorials, and Andrew Schultz and Greg
Gibling for their efforts in integrating BEE2 infrastructure into RAMP.
The Samsung Scholarship, formerly the Samsung Lee Kun Hee Scholarship Foun-
dation, has financially supported my research for the last 5 years. Moreover, all of
my friends whom I have met through the scholarship are priceless. As my small ac-
knowledgment, I was able to shorten my study to 5 years, despite having a 6-year
scholarship appointment.
I cannot forget to mention all of my Stanford friends and church fellows, who
encouraged me when I was lost, and spent time with me when I was lonely. However,
I should abbreviate the list here without naming any of them, otherwise I would not
be able to complete these acknowledgments without forgetting some of them.
I could not have done this research without my family’s devotion. So Jung, my
wife, has helped me in every respect from her professional knowledge of statistics
to her endless prayer for my pursuing Ph.D. Our expected baby motivated me to
push ahead with my dissertation. I give my special thanks to my parents who have
supported me for the last 30 years by all means, sacrificing more than I deserve.
Finally and most importantly, I would like to thank my Lord. He has planned for
me, directed me, driven me, and encouraged me. It is all done by Him.
viii

Contents
Abstract v
Acknowledgments vii
1 Introduction 1
2 Background and Motivation 5
2.1 Transactional Memory Overview . . . . . . . . . . . . . . . . . . . . . 5
2.1.1 Programming with TM . . . . . . . . . . . . . . . . . . . . . . 6
2.1.2 Implementation of Transactional Memory . . . . . . . . . . . . 7
2.2 Transactional Coherence and Consistency . . . . . . . . . . . . . . . . 9
2.2.1 Transactional Memory Support in TCC . . . . . . . . . . . . . 9
2.2.2 Continuous Execution of Transactions . . . . . . . . . . . . . 9
2.2.3 Implementation of TCC . . . . . . . . . . . . . . . . . . . . . 11
2.3 Software Environment for HTM . . . . . . . . . . . . . . . . . . . . . 12
3 ATLAS Prototype Overview 15
3.1 ATLAS Hardware Implementation . . . . . . . . . . . . . . . . . . . . 16
3.1.1 ATLAS Hardware Architecture . . . . . . . . . . . . . . . . . 16
3.1.2 Mapping on the BEE2 Board . . . . . . . . . . . . . . . . . . 17
3.2 ATLAS Software Stack . . . . . . . . . . . . . . . . . . . . . . . . . . 19
3.2.1 TM API Library . . . . . . . . . . . . . . . . . . . . . . . . . 20
3.2.2 Discussion . . . . . . . . . . . . . . . . . . . . . . . . . . . . . 23
3.3 Evaluation . . . . . . . . . . . . . . . . . . . . . . . . . . . . . . . . . 23
ix
3.3.1 TM API Latency . . . . . . . . . . . . . . . . . . . . . . . . . 23
3.3.2 The Characterization of the ATLAS Memory System . . . . . 26
3.4 Summary . . . . . . . . . . . . . . . . . . . . . . . . . . . . . . . . . 29
4 Operating System Support for HTM 31
4.1 Challenges with HTM . . . . . . . . . . . . . . . . . . . . . . . . . . 32
4.1.1 Loss of Isolation at Exceptions and System Calls . . . . . . . 32
4.1.2 Loss of Atomicity at Exceptions and System Calls . . . . . . . 33
4.2 Practical Solution to HTM−OS Interactions . . . . . . . . . . . . . . 33
4.2.1 Hardware Architecture Update . . . . . . . . . . . . . . . . . 35
4.2.2 Software Stack Update . . . . . . . . . . . . . . . . . . . . . . 36
4.2.3 ATLAS Core . . . . . . . . . . . . . . . . . . . . . . . . . . . 36
4.2.4 Bootloader . . . . . . . . . . . . . . . . . . . . . . . . . . . . . 37
4.2.5 Proxy Kernel . . . . . . . . . . . . . . . . . . . . . . . . . . . 38
4.2.6 Runtime Exception Handling Procedure . . . . . . . . . . . . 38
4.3 OS Performance Issues . . . . . . . . . . . . . . . . . . . . . . . . . . 41
4.3.1 Localizing the OS Services . . . . . . . . . . . . . . . . . . . . 42
4.3.2 Accelerating the OS CPU . . . . . . . . . . . . . . . . . . . . 42
4.4 Evaluation . . . . . . . . . . . . . . . . . . . . . . . . . . . . . . . . . 43
4.4.1 Experimental Platform Configurations . . . . . . . . . . . . . 43
4.4.2 Exception Handling Latency . . . . . . . . . . . . . . . . . . . 44
4.4.3 Application Scalability . . . . . . . . . . . . . . . . . . . . . . 46
4.4.4 Limits to Scalability . . . . . . . . . . . . . . . . . . . . . . . 49
4.5 Related Work . . . . . . . . . . . . . . . . . . . . . . . . . . . . . . . 50
4.6 Summary . . . . . . . . . . . . . . . . . . . . . . . . . . . . . . . . . 50
5 Productivity Tools for Parallel Programming 53
5.1 Challenges and Opportunities . . . . . . . . . . . . . . . . . . . . . . 54
5.2 ReplayT . . . . . . . . . . . . . . . . . . . . . . . . . . . . . . . . . . 56
5.2.1 Deterministic Replay . . . . . . . . . . . . . . . . . . . . . . . 56
5.2.2 ReplayT . . . . . . . . . . . . . . . . . . . . . . . . . . . . . . 56
5.2.3 ReplayT Extensions . . . . . . . . . . . . . . . . . . . . . . . 58
x

5.2.4 Evaluation of ReplayT Runtime Overhead . . . . . . . . . . . 60
5.2.5 Related Work . . . . . . . . . . . . . . . . . . . . . . . . . . . 63
5.3 AVIO-TM . . . . . . . . . . . . . . . . . . . . . . . . . . . . . . . . . 64
5.3.1 Atomicity Violation . . . . . . . . . . . . . . . . . . . . . . . . 64
5.3.2 AVIO Background . . . . . . . . . . . . . . . . . . . . . . . . 65
5.3.3 AVIO-TM . . . . . . . . . . . . . . . . . . . . . . . . . . . . . 67
5.3.4 Intermediate-write Detector . . . . . . . . . . . . . . . . . . . 68
5.3.5 Evaluation of AVIO-TM . . . . . . . . . . . . . . . . . . . . . 73
5.4 TAPE . . . . . . . . . . . . . . . . . . . . . . . . . . . . . . . . . . . 74
5.4.1 TAPE Conflict Profiling . . . . . . . . . . . . . . . . . . . . . 75
5.4.2 TAPE Overflow Profiling . . . . . . . . . . . . . . . . . . . . . 77
5.4.3 Evaluation of TAPE Runtime Overhead . . . . . . . . . . . . 78
5.5 Summary . . . . . . . . . . . . . . . . . . . . . . . . . . . . . . . . . 81
6 Conclusions 83
6.1 Future Work . . . . . . . . . . . . . . . . . . . . . . . . . . . . . . . . 85
Bibliography 87
xi

xii
List of Tables
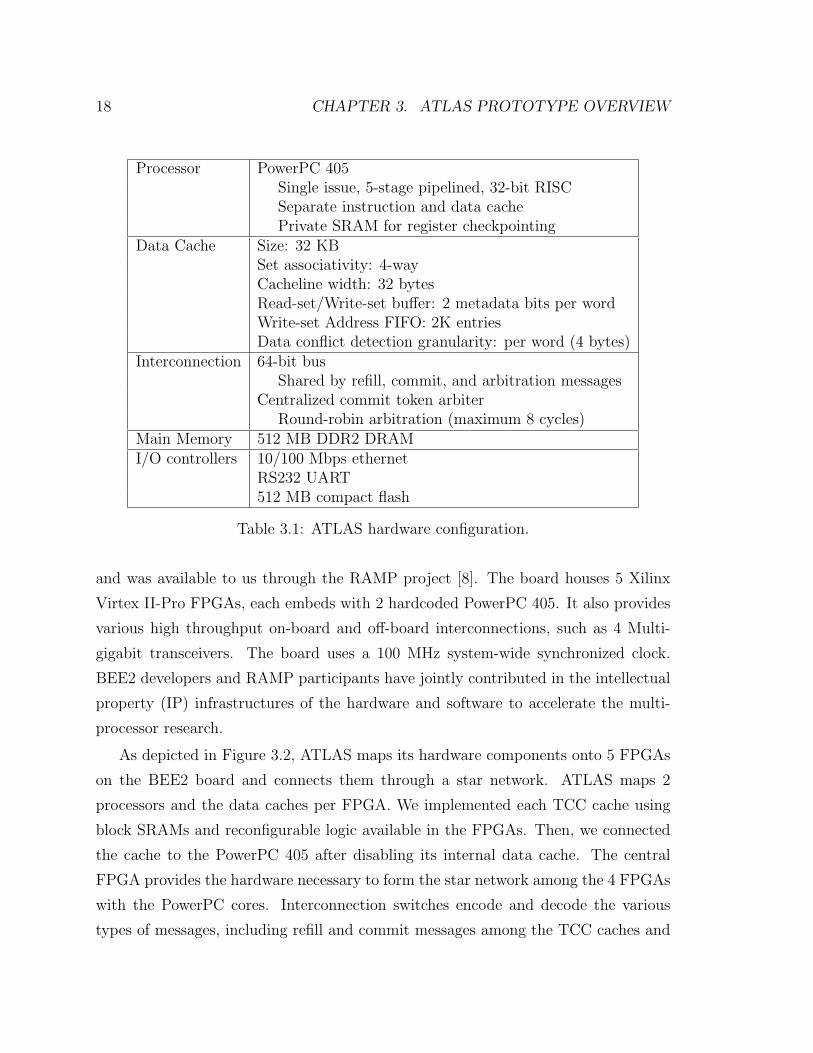
3.1 ATLAS hardware configuration. . . . . . . . . . . . . . . . . . . . . . 18
3.2 ATLAS hardware design statistics. . . . . . . . . . . . . . . . . . . . 20
3.3 TM API latency comparison between the ATLAS system and
an HTM system with a custom processor core. TransactionEnd
and TransactionBegin are merged to a function TransactionEndBe-
gin. Note that W∗ represents the write-set size in words. . . . . . . 24
4.1 The configuration of experimental platforms. Depending on the
OS CPU clock frequency and the use of a victim TLB, ATLAS is
configured in four ways and compared. . . . . . . . . . . . . . . . . . 43
4.2 TLB miss exception handling latency comparisons. Note that
the results are measured from the application CPU side. Therefore,
all cycles refer to a 100 MHz clock frequency regardless of OS CPU’s
operating clock frequency. . . . . . . . . . . . . . . . . . . . . . . . . 44
4.3 System call operation latency comparisons. Note that the results
are measured from the application CPU side. Therefore, all cycles refer
to a 100 MHz clock frequency regardless of OS CPU’s operating clock
frequency. . . . . . . . . . . . . . . . . . . . . . . . . . . . . . . . . . 45
xiii

xiv
List of Figures
2.1 An example parallel program with locks (a) and transactions (b). . . 6
2.2 The execution model of the TCC architecture. . . . . . . . . . . . . . 10
2.3 The TCC cache organization. . . . . . . . . . . . . . . . . . . . . . . 11
3.1 The ATLAS hardware architecture. . . . . . . . . . . . . . . . . . . 17
3.2 ATLAS hardware architecture is mapped on a BEE2 board by con-
necting 5 FPGAs on the board through a star network. . . . . . . . . 19
3.3 The full-system software stack of the ATLAS prototype. . . . . . . . 21
3.4 A Micro-benchmark program to measure the characteristics of ATLAS
memory system. . . . . . . . . . . . . . . . . . . . . . . . . . . . . . . 26
3.5 The comparison of memory system characteristics between
the baseline design and ATLAS. It plots the result of running the
benchmark program in Figure 3.4. . . . . . . . . . . . . . . . . . . . . 30
4.1 Hardware architecture update. The updated ATLAS hardware
includes a dedicated CPU to the OS execution (OS CPU) in the cen-
tral FPGA, and a private SRAM (mailbox) per CPU that serves the
mailbox. . . . . . . . . . . . . . . . . . . . . . . . . . . . . . . . . . 35
4.2 Software stack update. The updated software stack includes an
ATLAS core, a proxy kernel, and a bootloader that facilitate the hard-
ware updates. The stack is organized in two columns, depending on
the CPUs the modules run on. . . . . . . . . . . . . . . . . . . . . . 37
4.3 The procedure of TLB miss exception handling. . . . . . . . . . . . . 39
4.4 The procedure of system call handling. . . . . . . . . . . . . . . . . . 40
xv
4.5 Application scalability for the 5 STAMP applications. Five
STAMP applications are evaluated using 1, 2, 4, and 8 CPU config-
urations. The X-axis represents CPU and application configuration,
while the Y-axis presents the breakdown of normalized execution time.
The execution time is normalized to the 1 CPU total execution time
of each application. Busy measures the cycles that the CPU spends
in useful work, while L1 Miss is for the time that it stalls due to L1
data cache misses. Arbitration stands for the commit token arbi-
tration cycles, and Commit does for the cycles flushing the write-set,
clearing the speculative buffer, and checkpointing the registers. Con-
flict cycles are wasted ones due to the data conflicts and represents
cycles from the beginning of the transaction to the conflict detection.
System shows the cycles that the application CPU spends in resolving
exceptions. . . . . . . . . . . . . . . . . . . . . . . . . . . . . . . . . 47
4.6 Application scalability for the SPLASH and SPLASH-2 ap-
plications. The axes are similar to those in Figure 4.5. . . . . . . . 48
4.7 The scaling limitations of using a single OS CPU. It plots the
normalized execution time of a micro-benchmark that requests TLB
misses to the OS CPU in a rate of 1.24% of memory access instruc-
tions. The fraction of memory accesses in the total instruction mix is
configured to 20%, which is considered as the average [31]. The X-axis
represents the number of CPUs that generate requests simultaneously,
and the Y-axis shows the normalized execution time of each service.
Four configurations shown in Table 4.1 are experimented. The execu-
tion time should remain 1 if the OS CPU is not saturated; otherwise it
becomes higher as the service is delayed due to the congestion in the
OS CPU. . . . . . . . . . . . . . . . . . . . . . . . . . . . . . . . . . 52
5.1 The runtime scenario of ReplayT. . . . . . . . . . . . . . . . . . . . . 56
xvi
5.2 ReplayT runtime overhead for the 5 STAMP applications.
Five STAMP applications are evaluated using 1, 2, 4, and 8 CPU
configurations. The X-axis represents CPU and ReplayT configura-
tion. B stands for the base configuration that does not run ReplayT,
while L and R are for ReplayT log mode and replay mode configura-
tions, respectively. The runtime overhead is normalized to the median
of the execution time of the base configuration. Boxplots provides
information of medians (thick lines), lower and upper quartiles (box
boundaries), and whiskers (error bars). . . . . . . . . . . . . . . . . 61
5.3 ReplayT runtime overhead for the 3 SPLASH and SPLASH-2
applications. The axes are similar to those in Figure 5.2. . . . . . . 62
5.4 The example of an atomicity violation bug. (a) shows the ex-
ample code with two operations−reading and increasing the value of
A−that should be executed within a single atomic block, but are sep-
arated into two distinctive transactions. (b) illustrates the scenario
of execution with correct result that both T0 and T1 successfully in-
crease A. (c) demonstrates the scenario of execution with the wrong
result that T0’s increment to A is overwritten by T1’s. . . . . . . . . 65
5.5 AVIO’s indicators. An unserializable access indicates the atomicity
violation. A white circle in each box represents the current access in a
local thread; a gray one is a previous local access; and a black one is
an interleaved access from a remote thread between a gray and a white
one. R represents a read access and W represents a write access. A
black arrow indicates which direction to move an interleaved access in
order to achieve equivalent serial accesses. . . . . . . . . . . . . . . . 66
xvii

5.6 An example of the false negative corner case in the original
AVIO algorithm. R(ead) and W(rite) next to the line number char-
acterize an access type. The program has an atomicity violation bug
that an intermediate write (line 1.3) is exposed to the remote thread
(line 2.1) before it is correctly updated (line 3.2). However, because of
reads in the local thread (lines 1.4 and 3.1), AVIO cannot detect the
bug. . . . . . . . . . . . . . . . . . . . . . . . . . . . . . . . . . . . . 69
5.7 An example of false negative corner case originated from
the missing “read-after-write” information in a TCC cache.
R(ead) and W(rite) next to the line number characterize an access type.
The program has an atomicity violation bug where a local thread’s read
(line 3.3) and update (line 5.1) overwrites the remote thread’s update
(line 4.1). The original AVIO algorithm would detect the bug (case 4
in Figure 5.5). However, ATLAS does not include a load to the trans-
action read-set if the first access to that address in the transaction was
a write (missing “read-after-write”); hence, AVIO-TM does not con-
sider the read access in line 3.3. Therefore, AVIO-TM considers the
pattern as a “write (line 3.1) - write (line 4.1) - write (line 5.1)” (case
8 in Figure 5.5), and thus cannot detect the bug. . . . . . . . . . . . 70
5.8 The algorithm of the intermediate-write detector. . . . . . . . . . . . 71
5.9 The execution time to process a variable with the AVIO anal-
ysis (T ). Ar,i is the number of remote accesses to a variable between
the rth and ith accesses in the local thread. k is the constant amount of
time to check atomicity violation for a given interleaving pattern. At
is the number of local accesses in the thread t, and P is the number of
threads in the application. A is total number of accesses to the variable
in the application. . . . . . . . . . . . . . . . . . . . . . . . . . . . . 73
5.10 An example report from running vacation with TAPE conflict profiling
enabled. . . . . . . . . . . . . . . . . . . . . . . . . . . . . . . . . . . 76
xviii

5.11 TAPE runtime overhead for the 5 STAMP applications. Five
STAMP applications are evaluated using 1, 2, 4, and 8 CPU configura-
tions. The X-axis represents CPU and TAPE configuration. B stands
for the base configuration that does not run TAPE, while C and O are
for TAPE conflict and overflow profiling configurations, respectively.
The runtime overhead is normalized to the median of the execution
time of the base configuration. Boxplots provides information of me-
dians (thick lines), lower and upper quartiles (box boundaries), and
whiskers (error bars). . . . . . . . . . . . . . . . . . . . . . . . . . . 79
5.12 TAPE runtime overhead for the 3 SPLASH and SPLASH-2
applications. The axes are similar to those in Figure 5.11. . . . . . . 80
xix

xx

Chapter 1
Introduction
With single thread performance improvement reaching fundamental limitations in
terms of power consumption and design complexity [69, 6], a multi-core system
provides a cost effective solution to convert increased transistor budgets into scalable
performance. All the major chip vendors have already switched to multi-core systems.
This trend has been observed in a wide range of domains: servers [38, 49, 36], personal
computers [4, 1], and even embedded systems [2, 37, 35, 3]. As a result, parallel
programming has become a requirement in order to achieve scalable performance by
exploiting multiple processor cores.
However, parallel programming is difficult. The majority of programmers are not
yet able to use existing parallel programming methods, such as lock-based program-
ming, and produce correct and fast parallel applications. The major part of this
complexity is due to the synchronization required when multiple threads access data
in shared memory. The lock-based techniques, which have been used in conventional
parallel models to synchronize such accesses, are cumbersome to use. For example, a
program with coarse-grain locks is easy to write, but poorly scales because the locks
serialize the threads in user code. The alternative is to use fine-grain locks in order
to improve concurrency. However, programming with fine-grain locks is error-prone
and typically introduces issues such as data races and deadlocks.
1

2 CHAPTER 1. INTRODUCTION
Transactional Memory (TM) has been proposed as an alternative synchronization
primitives that can simplify parallel programming [33, 66, 32, 29]. Using TM, pro-
grammers only declare coarse-grain blocks of parallel tasks (transactions) that should
execute atomically and in isolation. Guaranteeing atomicity and isolation as multiple
of these tasks execute in parallel is the responsibility of the underlying TM system.
Using optimistic concurrency [40], the TM system provides high performance similar
to that of code with fine-grain locks [46]. Therefore, TM can eliminate the trade-off
between performance and correctness of lock-based coding.
To support transactional execution, the TM system must implement data ver-
sioning and conflict detection. Software TM (STM) systems implement these re-
quirements in software [20, 29, 64]. This approach is attractive because it runs on
existing hardware and more flexible, but it suffers from poor performance due to the
runtime overhead of the software instrumentation of memory accesses. On the other
hand, hardware TM (HTM) typically implements these features by modifying the
data caches and the coherence protocol [26, 7, 43]. With the hardware support,
TM overheads are minimized. Moreover, an HTM system provides strong isolation,
a property required for the correct and predictable execution of transactional code,
without additional runtime overheads.
Nevertheless, an efficient TM implementation using hardware support is not suf-
ficient to support parallel programming with transactions. In addition, we need a
complete software development environment for the TM system. The software envi-
ronment should include high-level programming languages, operating systems (OS),
and productivity tools for correctness debugging and performance tuning. High-level
languages provide programmers with an easy way to express concurrency using atomic
transactions The OS supports I/O operations and handles issues, such as memory vir-
tualization and resource management. Debugging and performance tuning tools are
essential for effective parallel programming.
There are many challenges in realizing the software development environment for
HTM. For example, supporting the interaction of user transactions with the OS code
is not trivial. It is impossible for the transactions to communicate with the OS in the
middle of transactions without compromising the isolation. Furthermore, it is difficult

3
to make transactions atomic if there are irrevocable operations within transactions,
such as an I/O operation. On the other hand, there are opportunities to use TM to
simplify the aspects of the software development environment. For instance, while
debugging parallel code, one must consider an interleaving of the threads. In TM,
collecting the thread interleaving can be simplified by tracking it at the granularity
of transactions.
Thesis Contributions
In this dissertation, we address these challenges and exploit the opportunities for TM
in the software development environment. The main contributions of this dissertation
are the following:
1. We extend an operating system to work correctly on a hardware TM system.
Specifically, we address challenges, such as maintaining the isolation and the
atomicity as exceptions occur in the middle of transactions, as well as perfor-
mance issues related to OS−TM interactions. As a solution, we dedicate a CPU
to the OS execution and provide a separate communication channel between the
CPU that runs the OS and the remaining CPUs that run applications.
2. We provide correctness debugging and performance tuning tools that are essen-
tial for parallel programming, such as a deterministic replay tool (ReplayT),
an automated atomicity violation detector (AVIO-TM), and a light-weight run-
time performance bottleneck monitor (TAPE). Moreover, we demonstrate that
the implementation of these tools can be simplified by utilizing the features of
hardware transactional memory systems.
3. We implement and evaluate all of the above on the full-system prototype.
Specifically, we designed the FPGA-based prototype of a specific hardware TM
architecture, Transactional Coherence and Consistency (TCC). The full-system
prototype, which is referred to an ATLAS prototype, provides high performance
and rich capability to implement and evaluate all of the above contributions on.
4 CHAPTER 1. INTRODUCTION
Organization
The organization of the reminder of this dissertation is as follows:
Chapter 2 provides background information for this dissertation. It reviews trans-
actional memory and the specific hardware TM architecture on which this dissertation
is based. In addition, this chapter explains the necessity of the software environment
for hardware transactional memory.
Chapter 3 introduces the ATLAS prototype. This chapter emphasizes the ne-
cessity of a full-system prototype. Then, it describes the hardware architecture, the
implementation using a multi-FPGA board, and the software libraries that control the
hardware features and expose TM functionality to higher level programming models.
Chapter 4 explains the challenges of running a full-featured OS on an HTM sys-
tem. The challenges include maintaining isolation and atomicity in the middle of
transactions when exceptions occur, and performance issues, as well. As a solution,
we dedicate a CPU to run the operating system, and remaining CPUs run a proxy ker-
nel that handles the interactions of the applications with the operating system using
a separate communication channel. We evaluate the proposed solution on the ATLAS
prototype by measuring the exception handling latency, the application scalability,
and the limits to scalability with a single OS CPU.
Chapter 5 introduces a set of tools for correctness debugging and performance
tuning, including a deterministic replay (ReplayT), an automatic atomicity violation
detector (AVIO-TM), and a runtime performance bottleneck monitor (TAPE). It
explains the functionality and implementation of these tools on top of the hardware
TM system, and evaluates their runtime overhead and cost.
Finally, Chapter 6 concludes the dissertation by revisiting the thesis contributions.
It finishes with directions for future work.

Chapter 2
Background and Motivation
In this chapter, we provide the background information and the motivation of this
dissertation. First, we review Transactional Memory (TM), including basic concepts
and benefits, TM programming models, and implementation options for TM systems.
Then, we introduce a specific hardware TM (HTM) system, Transactional Coherence
and Consistency (TCC) architecture developed by Stanford University, on which this
thesis is based. We describe how TCC relies on the continuous execution of trans-
actions, and briefly explain its implementation. Finally, we motivate my research by
emphasizing the necessity of a software development environment for HTM.
2.1 Transactional Memory Overview
TM has been proposed as an alternative to the conventional lock-based synchroniza-
tion of shared-memory accesses [33, 66, 32, 29]. It uses memory transactions as syn-
chronization primitives. A memory transaction is the atomic and isolated sequence
of memory accesses.
A memory transaction has following three important properties.
• Atomicity: a transaction makes its updates visible to the shared global mem-
ory all at once only when the transaction is successfully finished. Otherwise,
the transaction should abort without making any updates to the memory.
5

6 CHAPTER 2. BACKGROUND AND MOTIVATION
void depos i t ( account , amount )LOCK( l−>account ) ; {
int t ;t=bank . get ( account ) ;t=t+amount ;bank . put ( account , t ) ;
} ;UNLOCK( l−>account ) ;
void depos i t ( account , amount )atomic{
int t ;t=bank . get ( account ) ;t=t+amount ;bank . put ( account , t ) ;
}
(a) Lock-based synchronization (b) TM-based synchronization
Figure 2.1: An example parallel program with locks (a) and transactions (b).
• Isolation: the intermediate memory updates of a transaction should not be
visible to other threads until the transaction successfully commits.
• Serializability: transactions seem to execute in a single serial order. In other
words, partial steps in a transaction is not interleaved with other transactions.
2.1.1 Programming with TM
Figure 2.1 provides the example of TM program comparing it with the similar program
using lock-based synchronization. The program reads the balance of a bank account
and updates it to make a deposit. Assuming multiple threads are executing deposit
or withdrawal tasks, these two steps should be atomically executed; otherwise, the
account balance could be corrupted due to data races with concurrent withdrawals
or deposits to the same account. With locks (Figure 2.1 (a)), programmers need to
manually implement the synchronization by identifying the shared variables ( ac-
count), specifying lock regions, and managing the associated lock variables (l). On
the other hand, with TM (Figure 2.1 (b)), programmers only need to declare atomic
regions and leave the implementation burden to an underlying TM system.
The TM system implements synchronization typically using optimistic concur-
rency [40]. Even though the TM system provides the illusion of sequential execution,
it speculatively executes transactions in parallel optimistically assuming that there
2.1. TRANSACTIONAL MEMORY OVERVIEW 7
is no data dependency. If there exists a data dependency between two transactions
in the runtime, however, the TM system detects and resolves it by aborting one of
them and re-executing at a later point in time. Using this scheme, the TM system
only slows down when there is a true dependency between transactions. Moreover,
by detecting conflicts at a fine granularity, the TM system provides similar or even
better performance than well-tuned parallel applications using fine-grain locks [46].
Therefore, TM simplifies the synchronization by breaking the performance versus
complexity trade-off that lock-base programming has suffered from. TM programs are
easy-to-write because they only require programmers to declare the atomic blocks in
coarse-grain, and they achieve as good performance as well-tuned parallel programs
with fine-grain locks without the burden of manually dealing with races, deadlocks,
or livelocks. Moreover, TM provides better composability. It is difficult to combine
multiple software modules into one atomic block with locks; it requires the modules
to break their abstraction and a programmer to deal with the implementation details
to ensure both performance and correctness. On the other hand, it is much easier
with transactions. A programmer can use a transaction to encapsulate the transac-
tions in these software modules without compromising their atomicity or isolation.
Furthermore, TM makes the system more robust to failure. With locks, the system
may deadlock when a thread fails while it holds a lock that other threads need to
acquire. This deadlock does not happen in transactions since TM systems do not use
application level lock during the transaction execution.
2.1.2 Implementation of Transactional Memory
The TM system must implement data versioning and conflict detection. The data
versioning is required to atomically update transaction’s entire modifications (write-
set) to the shared-memory when the transaction commits, or to completely discard
them when the transaction aborts. Moreover, to support optimistic concurrency, the
TM system should detect the data dependency conflicts between concurrent transac-
tions. It typically detects the conflicts by tracking all of the memory references in a
8 CHAPTER 2. BACKGROUND AND MOTIVATION
transaction (read-set), and comparing them to the modifications (write-set) of other
transactions.
A variety of TM systems have been proposed to implement these requirements.
They can be classified into three categories: hardware TM, software TM, and hybrid
TM systems.
Software TM (STM) systems implement these requirements in software using in-
strumentation code for read and write accesses, and software data structures [29,
64, 20, 30]. STM is attractive because it runs on the existing hardware and is flexi-
ble to modify if new features are necessary or to customize for a specific application
domain. Nevertheless, the runtime overhead of software instrumentation overhead
can slow down each thread by 40% up to 7× even after the aggressive compiler
optimization [5, 30]. Furthermore, STM cannot provide strong isolation without ad-
ditional performance penalties. The lack of strong isolation makes software develop-
ment become more complicated as such a system produces incorrect or unpredictable
results [41, 21, 67].
On the other hand, hardware TM (HTM) implements the requirements in hard-
ware, by modifying data caches and the cache coherence protocol [26, 7, 43]. The
advantage of HTM is its high performance; it minimizes the runtime overhead because
the data versioning and conflict detection are transparently done when a processor ac-
cesses memory using ordinary load and store instructions. Moreover, HTM inherently
provides strong isolation [41]. With strong isolation, the TM system guarantees the
isolation of intermediate updates inside a transaction not only from other transactions
but also from the non-transactional code. The disadvantage of HTM is complexity
and cost, as the caches and the coherence protocol must be redesigned. In addition,
a possible resource overflow due to the limited hardware capacity should be handled
to maintain the correctness of the system [17].
Many hybrid TM systems also have been proposed to combine the flexibility of
STM systems with the performance of HTM systems [39, 63, 10]. Some hybrid
systems switch to STM mode as a virtualization mechanism for the HTM mode, when
hardware resources are exhausted [39, 18]. Other hybrid TM systems use hardware
mechanisms to optimize performance bottlenecks of an STM implementation [63,

2.2. TRANSACTIONAL COHERENCE AND CONSISTENCY 9
10]. Most of hybrid systems require hardware modification to data caches and two
versions of the code (one for HTM, the other for STM) for every transaction. Their
performance is a factor of two lower than that of HTM systems and they often fail
to provide strong isolation.
Due to its performance and correctness merits, this dissertation focuses on an
HTM system, specifically, the Transactional Coherence and Consistency (TCC) ar-
chitecture, which is reviewed in the following section.
2.2 Transactional Coherence and Consistency
2.2.1 Transactional Memory Support in TCC
TCC [26] is a hardware TM system; it buffers the write-set in its data cache and
commits it at the end of the transaction to the shared-memory (lazy versioning).
In the mean time, it tracks the read-set in its data cache and detects a possible
data dependency conflict by snooping incoming messages when another transaction
commits (optimistic conflict detection). When it detects a conflict, it aborts the
transaction and re-executes it.
Most of other TM systems implement TM requirements on top of already complex
MESI−which stands for Modified, Exclusive, Shared, and Invalid−coherence and
consistency protocols [45, 58, 57, 61]. Unlike them, TCC eliminates the complex
MESI protocol and directly implements the TM features.
2.2.2 Continuous Execution of Transactions
TCC provides cache coherence and memory consistency at transaction granularity.
As a consequence, it runs transactions continuously (all transactions, all the time).
In contrast, other systems use the TM mechanisms only for user code within trans-
actional annotations and rely on regular MESI coherence for the rest of the code.
Figure 2.2 shows an example of the execution model of the TCC architecture.
Each CPU locally buffers the write accesses by the transaction and tracks its read-
set and write-set. At the end of the transaction, CPU 0 requests a permission to

10 CHAPTER 2. BACKGROUND AND MOTIVATION
....ld 0xddddld 0xeeee....st 0xbeef ....
ld 0xaaaald 0xbbbb....
0xbeef
....ld 0xbeef....
0xbeef
Figure 2.2: The execution model of the TCC architecture.
commit from a centralized commit token arbiter. Once the commit token is granted,
the CPU commits its write-set atomically to the shared-memory. Other CPUs, then,
snoop the broadcasted commit message to detect a possible data dependency conflict.
Since there is no overlap between the incoming commit message and its read-set, CPU
1 continues its execution. Since there is an overlap, CPU 2 aborts its transaction,
rolls back its speculative state, and restarts it at a later point.
Continuous transactional execution simplifies parallel programming. It provides
a single abstraction for coherence, consistence, and synchronization (transactions).
Moreover, it also simplifies thread interactions and interleaving, since they are only
possible at transaction boundaries. This simplifies reasoning about the correctness
of parallel programs at coarser granularity. It also enables the development of low
overhead tools for correctness debugging and performance tuning as we discuss in
Chapter 5.
Even with TCC’s continuous transactional execution model, programmers only
need to declare atomic blocks that they want to synchronize. TCC executes an im-
plicit transaction from the end of an atomic block to the beginning of the next atomic
block. This scheme works because the remaining code between atomic blocks should

2.2. TRANSACTIONAL COHERENCE AND CONSISTENCY 11
ProcessorRegisterCheckpoint
V SR (7:0)
SM (7:0)
TAG(18:0)
DATA(8 words)
TCCCache
Write-setAddress
FIFO
Load/StoreAddress
SnoopControl
RefillControl
OverflowControl
CommitControl
Load/StoreData Commit
CommitData
CommitAddress
Trigger
Overflow
Commit Bus
Refill Bus
CommitAddress In
CommitData In
RefillData In
CommitAddress Out
CommitData Out
Violation
Figure 2.3: The TCC cache organization.
not access shared variables. If threads access the shared variables in a conflicting
manner outside of explicit transactions, the program is incorrectly synchronized and
may experience data races.
2.2.3 Implementation of TCC
The TCC architecture implements continuous transactional execution by modifying
data caches and the coherence protocol. Figure 2.3 shows the data cache organization
of the TCC architecture (TCC cache). It implements the read-set and write-set by
adding SR (speculatively read) and SM (speculatively modified) metadata bits at
word granularity. Moreover, to efficiently collect and commit the write-set at the end
of a transaction, it queues write-set addresses in the first-in-first-out (FIFO) buffer.

12 CHAPTER 2. BACKGROUND AND MOTIVATION
At the beginning of a transaction, The processor checkpoints user-visible registers.
While the transaction is being executed, if the processor reads a word, then the TCC
cache marks the corresponding SR bit. For a write access, the TCC cache marks the
corresponding SM bit and queues the address to the write-set address FIFO.
When the processor commits at the end of the transaction, the TCC cache should
first acquire a commit token from an arbiter. The commit token arbiter enforces
commit atomicity by allowing one commit at a time. Once the TCC cache acquires
the commit token, it collects the write-set using the write-set address FIFO and
commits it by sending the addresses and data to the main memory and the other
processors in the system. After that, it clears the set of metadata, such as the SR,
SM bits and the write-set address FIFO, and releases the commit token.
When a commit message is broadcasted from another processor, the TCC cache
snoops the message and looks up the committed address. A conflict is detected if the
address is present in the cache and the corresponding SR bit is set. This indicates
an overlap between the write-set of the committing transaction and the read-set of
the locally executing transaction. Then, the processor aborts the local transaction
by invalidating dirty cachelines (SM bit set), and clearing the metadata, such as SR,
SM bits, and write-set address FIFO.
Due to the limited hardware resources, the TCC cache sometimes cannot hold
the entire transactional state. Hence, an overflow occurs when the TCC cache has to
evict a cacheline that speculatively accessed in the transaction (SR or SM bit set). To
handle the overflow in a simple manner, the TCC architecture serializes the system; it
acquires the commit token, commits the intermediate write-set, and holds the token
until the end of the transaction. In this way, it keeps atomicity and serializability
of the transaction while prohibiting the commit from other transactions. Note that
other transactions can be executing in the meantime, but they cannot commit.
2.3 Software Environment for HTM
So far, I explained how programmers can express synchronization with TM, and how
TM systems implement atomicity and isolation. Nevertheless, programmers need

2.3. SOFTWARE ENVIRONMENT FOR HTM 13
a complete software development environment to exploit TM systems’ potential and
achieve scalable performance with a small amount of effort. The software development
environment should include high-level programming languages, operating systems,
and productivity tools.
To use transactions in parallel programs, it is important to have TM support in
high-level programming language [11]. Programmers want to implicitly express trans-
actions by identifying only transaction boundaries. No further annotations should be
necessary for the memory accesses within the transaction. In this way, they express
parallelism in higher-level and leave the explicit transaction implementation to com-
pilers and the underlying TM system [5, 12]. Also, compiler designers prefer to
include transactions into the syntax of programming language, rather than to imple-
ment it in the library, because it enables further optimizations and avoids correctness
pitfalls [30].
The operating system is also the critical piece of the software development envi-
ronment. It manages physical resources on behalf of user programs and virtualizes
their functionality. Nevertheless, running OS on an HTM system can be challeng-
ing. During their execution, applications frequently use OS services, such as file I/O
and memory management. The OS may also intervene in exceptional situations such
as interrupts. However, it is difficult for HTM systems to support a switch to OS
code inside a transaction without compromising the two important properties for
transactional execution: isolation and atomicity.
Software development includes not only writing code, but also debugging its cor-
rectness and tuning its performance. These two aspects become more important in
parallel programming because of its additional complexity compared to sequential
programming. Moreover, the primary motivation for the parallel programming is
scalable performance. Therefore, a rich set of productivity tools for debugging and
tuning is necessary to truly simplify the parallel programming using transactions.
In this dissertation, I focus on the operating system and the productivity tools.
More specifically, I address the challenges of running an OS on an HTM system and
demonstrate the opportunities of HTM system’s simplifying the implementation of
productivity tools.
14 CHAPTER 2. BACKGROUND AND MOTIVATION
Chapter 3
ATLAS Prototype Overview
The previous chapter documented the necessity of hardware transactional memory
(HTM) and the software development environment for HTM. Since HTM typically
implements data versioning and conflict detection by modifying data caches and co-
herence protocols, a prototype is essential in developing the HTM software environ-
ment and in evaluating the effectiveness and efficiency of the overall system.
Moreover, it is desirable to have a flexible prototype that can be updated after
receiving the feedback from the evaluation. However, the development and verifica-
tion cost of a modern multi-core processor system is so high that the architectural
exploration on the real hardware through multiple design revisions is unaffordable in
most cases.
A software simulator is attractive due to its flexibility and low cost; it facilitates
wide design space exploration and eases the sharing of the infrastructure. However,
simulators are too slow to productively develop software on it [25, 19]. This per-
formance concern becomes more serious when using a single-threaded simulator to
model a multi-core system; the low performance limits the workload size and de-
grades the credibility of the evaluation. Parallelized software simulators have been
discussed to address this performance issue, but most simulators exhibited poor scala-
bility because frequent synchronizations were required [8]. Furthermore, a full-system
simulation with operating system is even slower and requires additional development
complexity.
15

16 CHAPTER 3. ATLAS PROTOTYPE OVERVIEW
In this chapter, we presents the first, high performance and flexible HTM pro-
totype, an ATLAS prototype [53]. The ATLAS prototype uses FPGAs to model
the chip multi-processor (CMP) implementation of the Transactional Coherence and
Consistency (TCC) architecture with 8 processor cores. Initially, we developed the
ATLAS prototype as the proof-of-concept of the TCC architecture. ATLAS validates
the results from the comparable software simulator of the TCC architecture and
proves that parallel applications written with transactions scale on the TCC archi-
tecture [53]. Even though the ATLAS prototype is not the optimal implementation of
HTM features (Section 3.3 explains long latencies in some operations), its application
scalability trend matches well with the one from the software simulator. Moreover,
ATLAS provides two to three orders of magnitude better performance than the com-
parable software simulator [52]. This performance advantage shortens the iteration
latency of software development; thus, it allows us to use ATLAS as a software de-
velopment environment with a full-featured operating system and large application
datasets.
The remainder of this chapter explains the ATLAS hardware implementation,
FPGA mapping, and its software stack. Then, it evaluates the memory system char-
acteristics of the ATLAS prototype.
3.1 ATLAS Hardware Implementation
3.1.1 ATLAS Hardware Architecture
The hardware architecture of the ATLAS prototype is illustrated in Figure 3.1. AT-
LAS models the 8-way chip multi-processor (CMP) implementation of the TCC archi-
tecture. Each CPU is coupled with a data cache that implements the TCC protocol
for transactional execution (TCC cache). All CPUs are connected to the main mem-
ory through the coherent bus. The commit token arbiter is the central unit that
processes commit requests from the CPUs.
Table 3.1 summarizes the specific hardware configuration. ATLAS uses the Pow-
erPC 405 hardcoded in FPGA devices. The PowerPC 405 is a single-issue, 5-stage

3.1. ATLAS HARDWARE IMPLEMENTATION 17
TCC$I $
CPU 0
TCC$I $
CPU 1
TCC$I $
CPU 2
TCC$I $
CPU 7...
Coherent Bus
Memory & I/O Controllers Commit Token Arbiter
Figure 3.1: The ATLAS hardware architecture.
pipelined, 32-bit RISC processor with separate instruction and data caches. More-
over, it includes a memory management unit that allows it to run a full-featured
operating system, such as Linux. ATLAS attaches a private SRAM memory to each
processor to implement register checkpointing functionality.
ATLAS uses a custom-designed data cache with TCC protocol support (TCC
cache). The TCC cache is configured as a non-blocking 32 KB, 4-way set-associative
cache with 32-byte cacheline width. The TCC cache detects data dependency conflict
at word granularity. ATLAS implements read-set and write-set tracking by adding 8
Kbits of metadata−1 bit for read-set and 1 bit for write-set tracking per word in the
cache−and 2,048-entry write-set address FIFO.
The eight processors refill from and commit to the main memory via the coherent
bus. The main memory consists of 512 MB DDR2 DRAM. A centralized commit
token arbiter attends to commit token requests from TCC caches, and allows only
one TCC cache to commit at a time. In addition, ATLAS provides various I/O
controllers, such as an ethernet controller and a disc controller via this bus.
3.1.2 Mapping on the BEE2 Board
We have implemented the ATLAS prototype using the Berkeley Emulation Engine 2
(BEE2) board [14] that had been developed by Berkeley Wireless Research Center,
18 CHAPTER 3. ATLAS PROTOTYPE OVERVIEW
Processor PowerPC 405Single issue, 5-stage pipelined, 32-bit RISCSeparate instruction and data cachePrivate SRAM for register checkpointing
Data Cache Size: 32 KBSet associativity: 4-wayCacheline width: 32 bytesRead-set/Write-set buffer: 2 metadata bits per wordWrite-set Address FIFO: 2K entriesData conflict detection granularity: per word (4 bytes)
Interconnection 64-bit busShared by refill, commit, and arbitration messages
Centralized commit token arbiterRound-robin arbitration (maximum 8 cycles)
Main Memory 512 MB DDR2 DRAMI/O controllers 10/100 Mbps ethernet
RS232 UART512 MB compact flash
Table 3.1: ATLAS hardware configuration.
and was available to us through the RAMP project [8]. The board houses 5 Xilinx
Virtex II-Pro FPGAs, each embeds with 2 hardcoded PowerPC 405. It also provides
various high throughput on-board and off-board interconnections, such as 4 Multi-
gigabit transceivers. The board uses a 100 MHz system-wide synchronized clock.
BEE2 developers and RAMP participants have jointly contributed in the intellectual
property (IP) infrastructures of the hardware and software to accelerate the multi-
processor research.
As depicted in Figure 3.2, ATLAS maps its hardware components onto 5 FPGAs
on the BEE2 board and connects them through a star network. ATLAS maps 2
processors and the data caches per FPGA. We implemented each TCC cache using
block SRAMs and reconfigurable logic available in the FPGAs. Then, we connected
the cache to the PowerPC 405 after disabling its internal data cache. The central
FPGA provides the hardware necessary to form the star network among the 4 FPGAs
with the PowerPC cores. Interconnection switches encode and decode the various
types of messages, including refill and commit messages among the TCC caches and
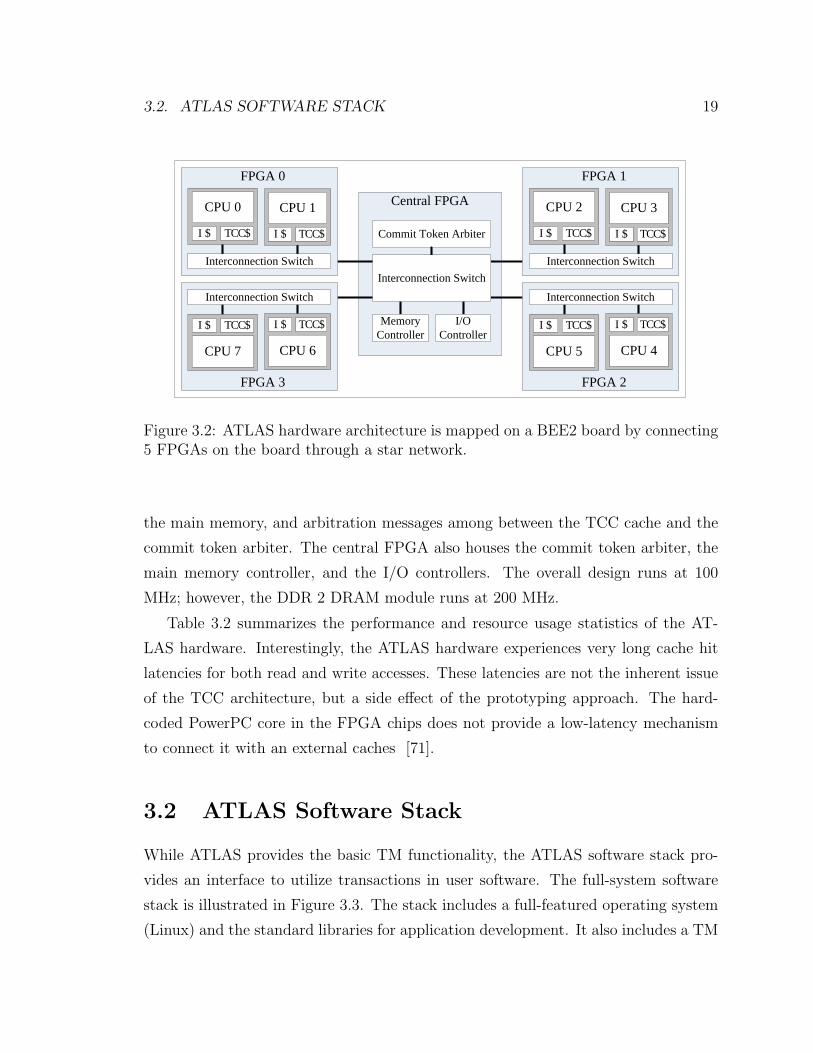
3.2. ATLAS SOFTWARE STACK 19
Central FPGA
MemoryController
Commit Token Arbiter
I/OController
Interconnection Switch
FPGA 0
TCC$I $
CPU 0
TCC$I $
CPU 1
Interconnection Switch
FPGA 3
TCC$I $
CPU 7
TCC$I $
CPU 6
Interconnection Switch
FPGA 1
TCC$I $
CPU 2
TCC$I $
CPU 3
Interconnection Switch
FPGA 2
TCC$I $
CPU 5
TCC$I $
CPU 4
Interconnection Switch
Figure 3.2: ATLAS hardware architecture is mapped on a BEE2 board by connecting5 FPGAs on the board through a star network.
the main memory, and arbitration messages among between the TCC cache and the
commit token arbiter. The central FPGA also houses the commit token arbiter, the
main memory controller, and the I/O controllers. The overall design runs at 100
MHz; however, the DDR 2 DRAM module runs at 200 MHz.
Table 3.2 summarizes the performance and resource usage statistics of the AT-
LAS hardware. Interestingly, the ATLAS hardware experiences very long cache hit
latencies for both read and write accesses. These latencies are not the inherent issue
of the TCC architecture, but a side effect of the prototyping approach. The hard-
coded PowerPC core in the FPGA chips does not provide a low-latency mechanism
to connect it with an external caches [71].
3.2 ATLAS Software Stack
While ATLAS provides the basic TM functionality, the ATLAS software stack pro-
vides an interface to utilize transactions in user software. The full-system software
stack is illustrated in Figure 3.3. The stack includes a full-featured operating system
(Linux) and the standard libraries for application development. It also includes a TM

20 CHAPTER 3. ATLAS PROTOTYPE OVERVIEW
Performance statistics
Clock frequency 100 MHz(DDR2 module: 200 MHz)
Cache hit latency 13 cycles (load)7 cycles (store)
Cache miss penalty 103.3 cycles (on average)
FPGA resource statistics
EDA Tools Xilinx EDK 9.1iFPGA0−3 17,641 LUTs (26%)(Xilinx XC2VP70) 212 KB BRAMs (32%)Central FPGA 16,284 LUTs (24%)(Xilinx XC2VP70) 66 KB BRAMs (10%)
Table 3.2: ATLAS hardware design statistics.
API library that provides an interface to specify transactions, and productivity tools
that ease correctness debugging and performance tuning.
In this section, we focus on the TM API library implementation. Chapters 4 and
5 discuss operating system support and the productivity tools, respectively.
3.2.1 TM API Library
The TM API support includes three key functions: 1) starting a transaction, 2) ending
a transaction, and 3) aborting a transaction. A programmer specifies the boundary of
an atomic block using a pair of TransactionBegin and TransactionEnd statements,
whereas the TM system automatically runs a TransactionAbort statement when a
data dependency conflict is detected by the hardware TM resources. The remainder
of this section describes the functional requirements and implementation issues of
each function in the API set.
TransactionBegin
To begin a transaction, the API issues the following steps.
This function checkpoints the context of a thread at the beginning of a transaction.
The checkpoint is required if the transaction is rolled back as explained in Chapter 2.

3.2. ATLAS SOFTWARE STACK 21
Operating System (Linux, kernel 2.4.30)
TM Application
Productivity Tool Library
Standard Library (libc, lm…)
TM API Library
Figure 3.3: The full-system software stack of the ATLAS prototype.
procedure TransactionBegin:
1: Save general purpose registers (GPRs)2: Save user-accessible special purpose registers (SPRs)3: Save a program counter register (PC) and a process ID (PID)
The checkpoint includes a program counter, user-level registers, and the process ID.
We checkpoint the registers to a private SRAM attached to each CPU using assembly
code that sequentially copies the content of registers to the SRAM. An HTM proto-
type with a custom processor core would implement register checkpointing by adding
a register snapshot feature that has the latency of a few clock cycles. However, this
is impossible for ATLAS because it uses the hardcoded PowerPC in the FPGA chips.
Apart from the performance issue, software register checkpointing is also error-prone
as certain special purpose registers keep changing in the process.
TransactionEnd
To end a transaction, the API issues the following steps.
As explained in Chapter 2, the TM system ends a transaction by atomically
committing all memory updates in the write-set to the main memory and by clearing

22 CHAPTER 3. ATLAS PROTOTYPE OVERVIEW
procedure TransactionEnd:
1: Request a commit token2: Spin until the commit token is granted3: Commit a write-set4: Clear metadata bits5: Release the commit token
any metadata bits maintained in the processor’s cache. To maintain the atomicity,
each core first requests a commit token from the arbiter before the commit, and
releases it at the end of the commit process.
In ATLAS, the TransactionEnd API implementation individually initiates these
steps using a series of memory-mapped commands to the TCC cache. This implemen-
tation is particularly useful when instrumenting the API code for various purposes,
such as measuring the latency of each step in the commit process.
TransactionAbort
To abort a transaction, the API issues the following steps.
procedure TransactionAbort:
1: Invalidate dirty cachelines2: Clear metadata bits3: Restore the checkpointed register states
In ATLAS, TransactionAbort is not an API that programmers can call directly.
Instead, this function is invoked by the TM system when it detects a data conflict. It
rolls back the executing transaction by instructing the TCC cache to invalidate the
dirty cachelines and to clear the speculative buffers−read-set, write-set, and write-set
address FIFO−and restoring the checkpointed register states.
As the TCC cache detects a data dependency conflict, it sends an interrupt signal
to the CPU. The CPU services the interrupt by invoking the TransactionAbort
function. Similar to all of previous API functions, the TransactionAbort is also a
useful place to extend the capability of the TM system. For instance, we can insert
code in the abort handler to collect information about the conflict and make available
to a performance tuning tool.
3.3. EVALUATION 23
3.2.2 Discussion
As I mentioned in Chapter 2, ATLAS continuously executes transactions; the end of
one transaction is the beginning of the next transaction. Therefore, one might argue
that it is redundant for the ATLAS system to expose two API functions, the Trans-
actionBegin and the TransactionEnd. In fact, in the ATLAS TM API library, there
is only one internal function that implements the transaction boundary, and two API-
level functions are the wrappers of the internal implementation. There are several rea-
sons for using a pair of API functions. First, it supports compatibility with other TM
implementations that runs non-transactional code from time to time. Furthermore,
it enables forward compatibility with the TM applications with nested transactions
where the TransactionBegin and the TransactionEnd have different semantics even
on a system that continuously executes transactions. Note, however, that ATLAS cur-
rently supports only close-nested transactions by flattening−basically, ignoring the
nested transactions−and does not support open-nested ones.
3.3 Evaluation
There are many interesting points to evaluate in the ATLAS prototype. However,
since this dissertation focuses on the software development environment, this section
evaluates only the aspects of the ATLAS prototype that are important from the
software perspective. A detailed hardware evaluation is available in [52].
3.3.1 TM API Latency
The TM API latency is important because it determines the overhead of using trans-
actions. The higher overhead may motivate the programmer to use coarser-grain
transactions to amortize it. This comes at the cost of higher possibility for conflicts.
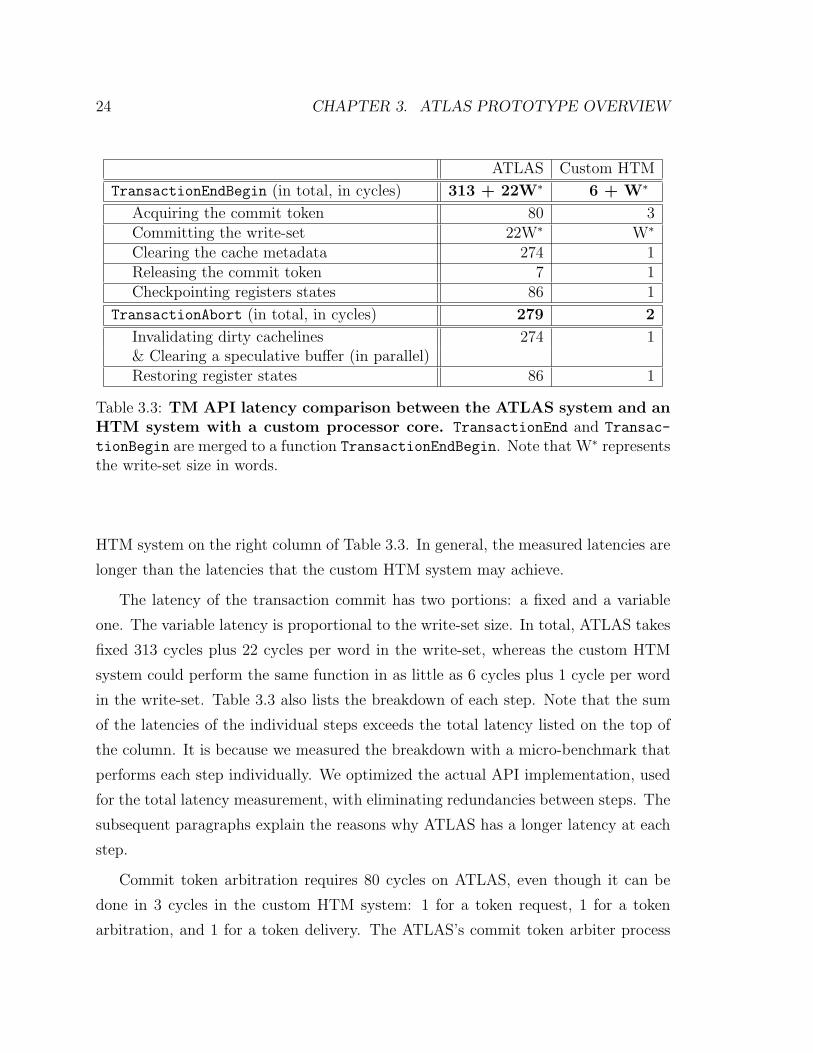
Table 3.3 summarizes the latencies of TransactionBegin and TransactionEnd
functions (grouped together in a TransactionEndBegin function) and Transaction-
Abort function. For comparative purposes, we estimate the latencies of a custom
24 CHAPTER 3. ATLAS PROTOTYPE OVERVIEW
ATLAS Custom HTM
TransactionEndBegin (in total, in cycles) 313 + 22W∗ 6 + W∗
Acquiring the commit token 80 3Committing the write-set 22W∗ W∗
Clearing the cache metadata 274 1Releasing the commit token 7 1Checkpointing registers states 86 1
TransactionAbort (in total, in cycles) 279 2
Invalidating dirty cachelines 274 1& Clearing a speculative buffer (in parallel)Restoring register states 86 1
Table 3.3: TM API latency comparison between the ATLAS system and anHTM system with a custom processor core. TransactionEnd and Transac-
tionBegin are merged to a function TransactionEndBegin. Note that W∗ representsthe write-set size in words.
HTM system on the right column of Table 3.3. In general, the measured latencies are
longer than the latencies that the custom HTM system may achieve.
The latency of the transaction commit has two portions: a fixed and a variable
one. The variable latency is proportional to the write-set size. In total, ATLAS takes
fixed 313 cycles plus 22 cycles per word in the write-set, whereas the custom HTM
system could perform the same function in as little as 6 cycles plus 1 cycle per word
in the write-set. Table 3.3 also lists the breakdown of each step. Note that the sum
of the latencies of the individual steps exceeds the total latency listed on the top of
the column. It is because we measured the breakdown with a micro-benchmark that
performs each step individually. We optimized the actual API implementation, used
for the total latency measurement, with eliminating redundancies between steps. The
subsequent paragraphs explain the reasons why ATLAS has a longer latency at each
step.
Commit token arbitration requires 80 cycles on ATLAS, even though it can be
done in 3 cycles in the custom HTM system: 1 for a token request, 1 for a token
arbitration, and 1 for a token delivery. The ATLAS’s commit token arbiter process
3.3. EVALUATION 25
the request in round- robin manner that takes 4 cycles on average for an 8 CPU
configuration. However, the major part of the overhead originates from the high
latency connection between the processor and the TCC cache through the interface
of the PowerPC core; and the off-chip communication between the TCC cache and
the commit token arbiter.
Committing the write-set takes 22 cycles per word on ATLAS. Even though the
commit message travels across FPGA chips and is delivered to the physical main
memory, the operation is pipelined in order to achieve high throughput. Nevertheless,
ATLAS suffers from 21 cycles of overhead per word compared to the custom HTM
system. The limiting factor is not the latency of individual modules, but rather the
blocks used to integrate the modules, such as the TCC cache, the interconnection
switches, and the DRAM memory controller.
The overhead in clearing the TCC cache metadata is primarily due to the capa-
bilities of the FPGA prototyping technology. Generally speaking, FPGA fabrics are
not efficient in implementing associative storage arrays, such as caches. ATLAS im-
plements the TCC cache using SRAM modules embedded in FPGA chips. Due to the
lack of gang clear capability in the SRAM module, we clear the metadata bits stored
in the SRAM module by accessing each cacheline separately using a series of memory-
mapped instructions. The total latency is 274 cycles including the implementation
overhead.
The commit token release takes 7 cycles on ATLAS, which is the same as the
overhead of storing a word to the TCC cache. The software implementation of register
checkpointing suffers from the latency of the sequential transfers of register values to
the private SRAM.
The latency of the transaction rollback has no variable portion. We clear the
TCC cache from speculative state and invalidate the dirty cachelines in the write-set
in parallel. Meanwhile, register restoration is merely the inverse process of register
checkpoint; thus, it has the same latency. Therefore, the latency difference for roll-
back between ATLAS and the custom HTM system originates the same sources as
equivalent steps in the transaction commit.

26 CHAPTER 3. ATLAS PROTOTYPE OVERVIEW
1 // Descr ip t i on :2 // Sweeping a chuck o f memory in a s t r i d e manner3 // Var iab l e s :4 // x − a chunk o f memory to sweep5 // c s i z e − s i z e o f x6 // s t r i d e − a width o f s t r i d e7 for ( count = LOOP; count > 0 ; count−−)8 for ( index = 0 ; index < c s i z e ; index += s t r i d e )9 x [ index ]++;
(a) C language version for the readability
1 l i $count , LOOP2 mtctr $count3 outer :4 l i $index , 05 i nne r :6 cmpw $index , $ c s i z e7 bge i n n e r e x i t8 lwzx $temp , $index , $x9 addi $temp , $temp , $ s t r i d e
10 stw $temp , $index , $x11 i n n e r e x i t :12 bdnz outer
(b) PowerPC assembly version actually used in the experiment
Figure 3.4: A Micro-benchmark program to measure the characteristics of ATLASmemory system.
3.3.2 The Characterization of the ATLAS Memory System
This section evaluates the characteristics of the ATLAS memory system. Specifically,
it evaluates the latency of various memory actions, such as the configuration of the
TCC cache, an overflow event while executing a large transaction, and TLB misses.
For reference, we compare the latencies with those measured from the memory system
of a uni-processor baseline design.
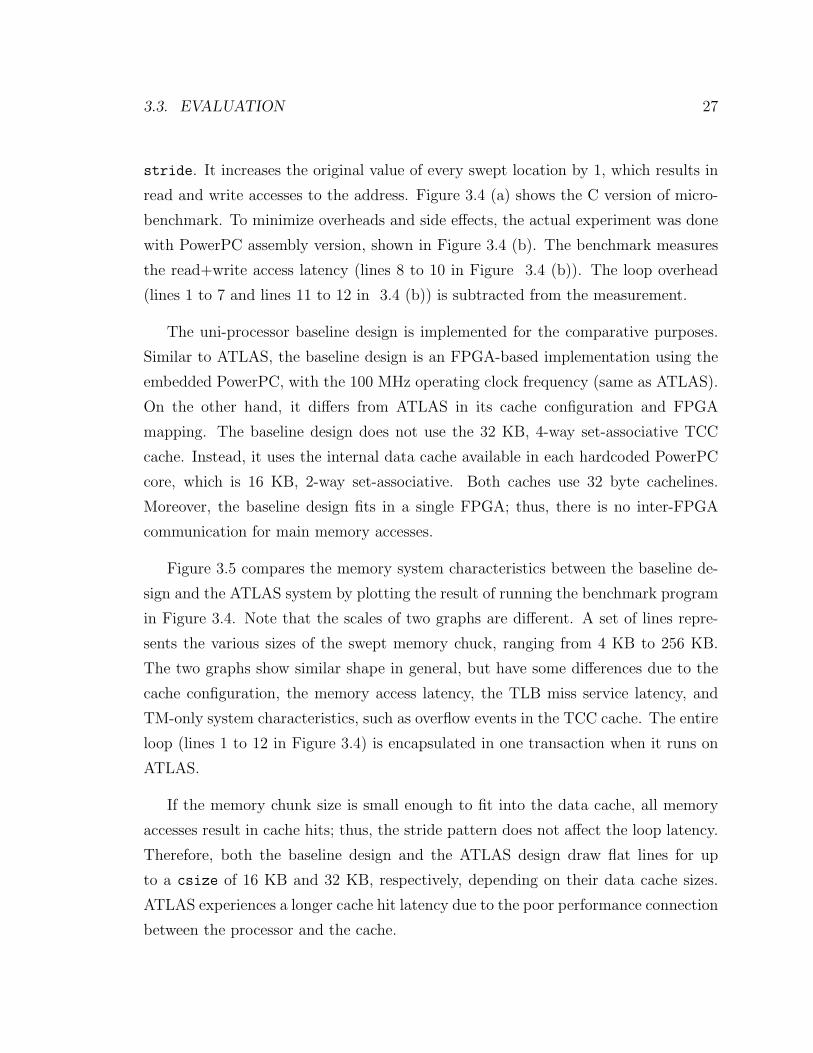
Figure 3.4 shows the micro-benchmark designed for the experiment. It is slightly
modified from the code in [31], which is based on the detailed description in [62].
The micro-benchmark sweeps a chunk of memory, x, sized csize with stride width of
3.3. EVALUATION 27
stride. It increases the original value of every swept location by 1, which results in
read and write accesses to the address. Figure 3.4 (a) shows the C version of micro-
benchmark. To minimize overheads and side effects, the actual experiment was done
with PowerPC assembly version, shown in Figure 3.4 (b). The benchmark measures
the read+write access latency (lines 8 to 10 in Figure 3.4 (b)). The loop overhead
(lines 1 to 7 and lines 11 to 12 in 3.4 (b)) is subtracted from the measurement.
The uni-processor baseline design is implemented for the comparative purposes.
Similar to ATLAS, the baseline design is an FPGA-based implementation using the
embedded PowerPC, with the 100 MHz operating clock frequency (same as ATLAS).
On the other hand, it differs from ATLAS in its cache configuration and FPGA
mapping. The baseline design does not use the 32 KB, 4-way set-associative TCC
cache. Instead, it uses the internal data cache available in each hardcoded PowerPC
core, which is 16 KB, 2-way set-associative. Both caches use 32 byte cachelines.
Moreover, the baseline design fits in a single FPGA; thus, there is no inter-FPGA
communication for main memory accesses.
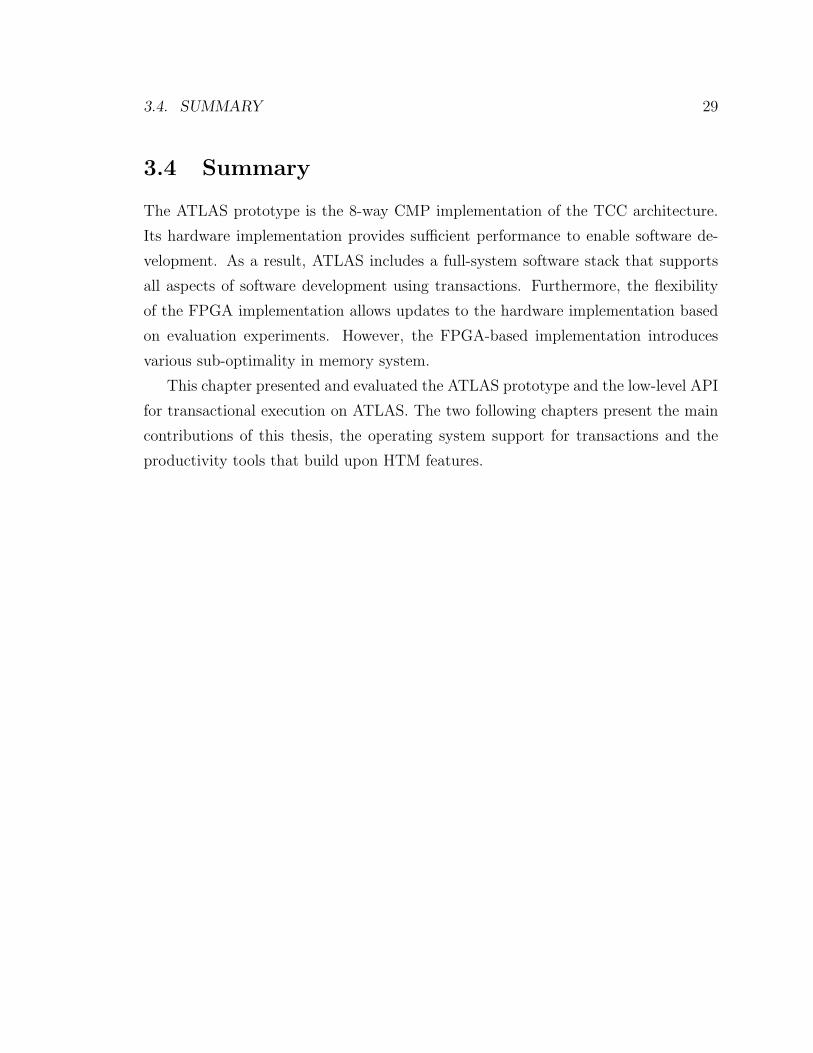
Figure 3.5 compares the memory system characteristics between the baseline de-
sign and the ATLAS system by plotting the result of running the benchmark program
in Figure 3.4. Note that the scales of two graphs are different. A set of lines repre-
sents the various sizes of the swept memory chuck, ranging from 4 KB to 256 KB.
The two graphs show similar shape in general, but have some differences due to the
cache configuration, the memory access latency, the TLB miss service latency, and
TM-only system characteristics, such as overflow events in the TCC cache. The entire
loop (lines 1 to 12 in Figure 3.4) is encapsulated in one transaction when it runs on
ATLAS.
If the memory chunk size is small enough to fit into the data cache, all memory
accesses result in cache hits; thus, the stride pattern does not affect the loop latency.
Therefore, both the baseline design and the ATLAS design draw flat lines for up
to a csize of 16 KB and 32 KB, respectively, depending on their data cache sizes.
ATLAS experiences a longer cache hit latency due to the poor performance connection
between the processor and the cache.

28 CHAPTER 3. ATLAS PROTOTYPE OVERVIEW
It is noticeable that only the ATLAS system has longer latencies in some combi-
nations of the configuration−an 8 KB csize with a 4 byte stride; a 16 KB csize
with 4 and 8 byte strides, a 32 KB csize with 4, 8, and 8 byte strides−even
though we expect perfect cache hits. This additional latency is due to an overflow
in the TCC cache. All of these combinations have no less than 2,048 words of write
accesses. These accesses overflow the 2,048 entries of the write-set address FIFO;
thus, require the immediate commit of the write-set in the current transaction. As
Table 3.3 shows, this process contributes 22 cycles per word (per loop in this case),
while the 313 cycles of fixed cost are amortized.
As the memory chunk size becomes larger than the data cache size, both designs
start to slow down due to cache misses. Because a cache miss loads an entire cacheline,
in configurations with stride widths narrower than the cacheline width (4, 8, and 16
bytes), the cache miss penalty is amortized over multiple accesses within the same
cacheline. The latency drops in wide stride configurations indicate the associativity
of the data cache. For example, because ATLAS has a 4-way set-associative data
cache, all 4 accesses in a 256 KB csize with a 64 KB stride combination fits in the
TCC cache with no additional cache misses.
Furthermore, ATLAS incurs an additional latency for the configurations with
frequent cache misses. A cache eviction that takes place in the process of serving
a cache miss triggers an overflow in the TCC cache. The overhead of associative
overflows peaks at 8 KB stride due to the TCC cache configuration: four of 8 KB
sets. Because of the set size, the overflow occurs every 4 access (one per set); thus,
its fixed cost (313 cycles) is shared by these 4 accesses.
Finally, the sharp peaks in 256 KB csize configurations in both systems are due
to TLB misses. In both systems, the PowerPC processor uses a unified TLB with
64 entries and Linux uses a 4 KB page size. Therefore, sweeping 256 KB csize
requires 65 TLB entries (64 for data pages and 1 for an instruction page) and results
in TLB misses. The TLB miss handling overhead peaks at the 4 KB stride because
each loop generates a TLB miss in this configuration. (Linux evicts TLB entries in
round-robin manner.)
3.4. SUMMARY 29
3.4 Summary
The ATLAS prototype is the 8-way CMP implementation of the TCC architecture.
Its hardware implementation provides sufficient performance to enable software de-
velopment. As a result, ATLAS includes a full-system software stack that supports
all aspects of software development using transactions. Furthermore, the flexibility
of the FPGA implementation allows updates to the hardware implementation based
on evaluation experiments. However, the FPGA-based implementation introduces
various sub-optimality in memory system.
This chapter presented and evaluated the ATLAS prototype and the low-level API
for transactional execution on ATLAS. The two following chapters present the main
contributions of this thesis, the operating system support for transactions and the
productivity tools that build upon HTM features.

30 CHAPTER 3. ATLAS PROTOTYPE OVERVIEW
4B 8B 16B
32B
64B
128B
256B
512B 1K
B2K
B4K
B8K
B16
KB32
KB64
KB
128K
B
Stride (Bytes)
0
20
40
60
80
100
120
140
Read+
Wri
te L
ate
ncy
(cy
cles)
csize=4KBcsize=8KBcsize=16KBcsize=32KBcsize=64KBcsize=128KBcsize=256KB
(a) Baseline design
4B 8B 16B
32B
64B
128B
256B
512B 1K
B2K
B4K
B8K
B16
KB32
KB64
KB
128K
B
Stride (Bytes)
0
100
200
300
400
500
600
Read+
Wri
te L
ate
ncy
(cy
cles)
csize=4KBcsize=8KBcsize=16KBcsize=32KBcsize=64KBcsize=128KBcsize=256KB
(b) ATLAS
Figure 3.5: The comparison of memory system characteristics between thebaseline design and ATLAS. It plots the result of running the benchmark programin Figure 3.4.
Chapter 4
Operating System Support for
HTM
While running a user-defined transaction, an HTM system may invoke the operating
system to service a system call or an exception. The challenge for the HTM system
is to guarantee the atomicity and isolation of the user transaction, while providing
sufficient information to OS code in order to service the event. Moreover, the challenge
is even greater for systems, such as TCC, that continuously execute transactions.
In this chapter, we provide mechanisms that facilitate the interactions between the
operating system code and the HTM system. These practical mechanisms guarantee
the isolation and the atomicity of user transactions. Moreover, they do not require
invasive changes to the operating system code, but can execute with minimal exten-
sions. The solution dedicates one extra CPU to the OS execution. The remaining
CPUs that run applications request the service from the dedicated CPU when they
encounter exceptions and system calls in the middle of a transaction. This approach
allows transactional applications to interact with an OS that is largely unaware of
the hardware support for TM.
The remainder of this chapter is organized as following: we first explain the chal-
lenges in running OS with HTM. Next, we describe practical solutions based on a
dedicated CPU to the the OS execution and a separate communication channel be-
tween the application and the OS. Then, we provide the detailed illustration of the
31

32 CHAPTER 4. OPERATING SYSTEM SUPPORT FOR HTM
runtime procedures for events, such as system calls and exceptions, and describe cer-
tain optimization techniques. Finally, we evaluate the overhead and scalability of the
proposed solution.
4.1 Challenges with HTM
During their executions, applications frequently use OS services, such as file I/O and
memory management. The OS may also intervene in exceptional situations, such as
interrupts. However, it is difficult for an HTM system to support a switch to OS
code when it encounters exceptions and system calls in the middle of a transaction
because it may compromise the two important properties for transactional execution:
isolation and atomicity.
4.1.1 Loss of Isolation at Exceptions and System Calls
As explained in Chapter 2, a TM system executes transactions in isolation. The inter-
mediate memory updates of a transaction should not be visible to other threads until
the transaction successfully commits. Strictly speaking, OS code is also considered
as “other threads” in this context. On the other hand, the OS needs information
about the execution state of the current transaction in order to process a system call
or serve an exception. Nevertheless, providing this information without exposing the
intermediate updates to the shared memory is a challenge.
Writing to a file is a good example that illustrates this issue. Writing a string to
a file requires communication between the application and the OS; the application
should send a file descriptor, and the content of the string. This communication
should not be allowed because the transaction is isolated from the OS until the end
of its commit. If the write call occurs within a transaction, the file descriptor and
the content are not committed updates and are isolated in the processor caches. If
we commit the transaction to make this information available to the OS, we have
also exposed the transaction updates all of the other threads before the transaction
reaches its intended commit point.
4.2. PRACTICAL SOLUTION TO HTM−OS INTERACTIONS 33
4.1.2 Loss of Atomicity at Exceptions and System Calls
A TM system executes transactions not only in isolation but also atomically. In other
words, it updates its write-set only when the transaction is successfully finished.
Otherwise, the transaction should abort without leaving any update in the global
memory. Therefore, all memory updates in the transaction should be buffered until
the transaction commits.
Again, the above file writing example explains this issue. If a transaction writes a
string to a file and it is aborted, the file writing should also be undone. Otherwise, it
leaves side effects that may affect the application results, i.e. writing a string multiple
times. Of course, undoing this file operation is not covered by the transaction aborting
scheme explained in Chapter 2. Moreover, in general operating systems, a file writing
is considered as an irrevocable task. Therefore, the file writing in the middle of a
transaction compromises the atomicity. Even if the transaction commits successfully,
atomicity is broken if we implement the write call by committing the transaction
state early. Another threads may observe a memory update by the transaction that
occurred before the write call but not another one that will occur after the write call.
Even though the two writes are grouped into one transaction, one can observe them
as a non-atomic unit.
4.2 Practical Solution to HTM−OS Interactions
ATLAS provides a practical solution that enables transactional applications to in-
teract with an existing OS, while maintaining isolation and atomicity. The solution
deploys an extra CPU (OS CPU) dedicated to the OS execution. In addition, it
provides a separate communication channel between the OS CPU and the remaining
CPUs that run applications (application CPUs). Hence, a transaction can commu-
nicate with the OS-specific information about an exception or a system call without
compromising the isolation and atomicity of its memory updates. Currently, the types
of OS requests that ATLAS supports are TLB miss exceptions and system calls. With
supporting these OS services, ATLAS provides a full-featured workstation from the
34 CHAPTER 4. OPERATING SYSTEM SUPPORT FOR HTM
application programmer’s perspective. Other exceptions, such as arithmetic over-
flows, can be supported in a similar manner, if necessary.
By running the OS on a dedicated CPU, ATLAS can utilize an existing uni-
processor OS. The OS code does not need to be significantly modified to use or
understand transactions. The separate OS CPU also provides performance isolation.
Interrupt are fully processed in the OS CPU without interfering in any way with the
CPUs that run the user code.
We maintain isolation by using the separate communication channel. Each appli-
cation CPU and the OS CPU is equipped with a mailbox, a private memory space that
is not synchronized with shared memory. The application CPUs and the OS CPU
communicate by exchanging messages through their mailboxes. The application CPU
posts an OS service request to the mailbox of the OS CPU, and the OS CPU returns
the result of the service to the mailbox of the application CPU. Since shared memory
is not updated with any of the application updates buffered in the TCC cache, this
approach maintains isolation.
Finally, we maintain atomicity by serializing the transaction execution when an
irrevocable action, such as a file writing, occurs in the middle of a transaction. When
the system is serialized, all other transactions, except the one that requests the OS
service, cannot commit even if they have completed their executions. Therefore, the
OS requesting transaction is guaranteed not to have any conflict with other transac-
tions; thus, it will successfully commit without any other code observing its updates in
a non-atomic manner. Even though serialization negatively affects the performance,
its overall effect is usually amortized since irrevocable requests are not common in
the performance critical path of most applications.
Using these mechanisms, ATLAS supports all of the features that applications
expect from the OS implicitly or explicitly. Applications implicitly expect TLB miss
handling by the OS. A Translation Lookahead Buffer (TLB) is a hardware table
that caches a set of mappings from virtual memory addresses to their corresponding
physical memory addresses at page granularity. Because it is a hardware mechanism,
there is a capacity limit. A TLB miss happens when the TLB does not contain the
mapping for the virtual address that the processor is accessing (faulting address).
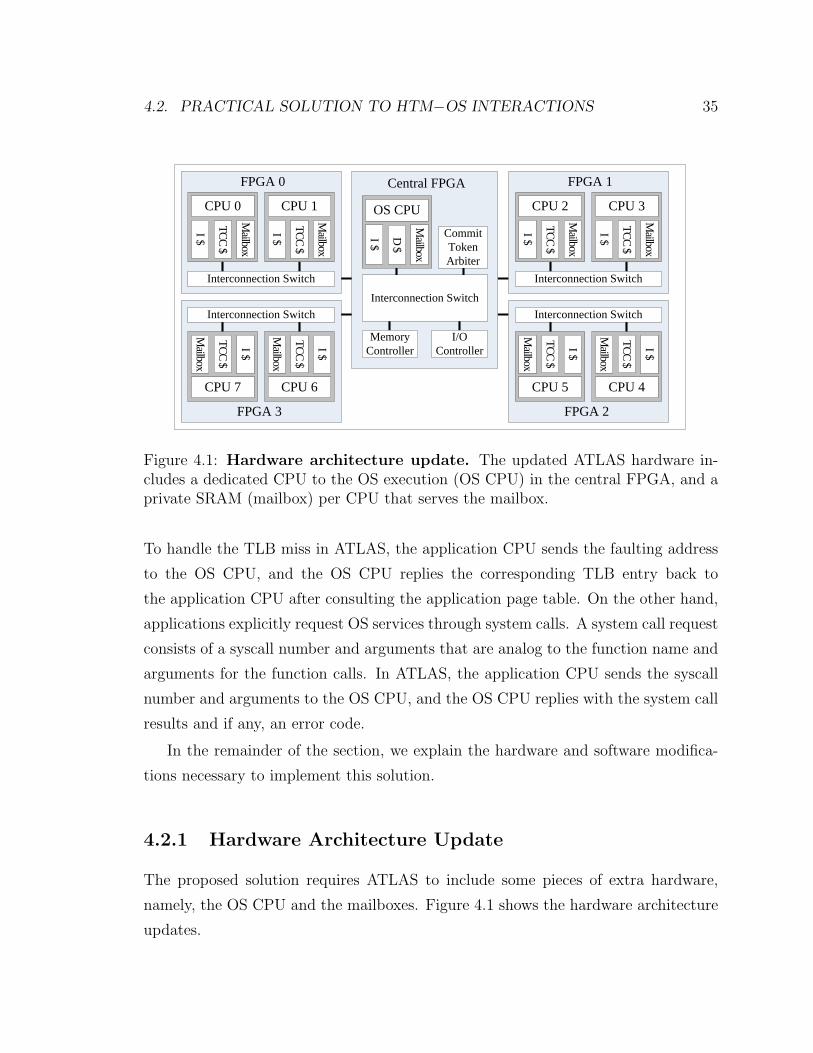
4.2. PRACTICAL SOLUTION TO HTM−OS INTERACTIONS 35
FPGA 0
Interconnection Switch
TCC$
I $
CPU 0
Mailbox
TCC$
I $
CPU 1
Mailbox
Central FPGA
MemoryController
Commit Token Arbiter
I/OController
Interconnection Switch
D $
I $
OS CPU
MailboxFPGA 3
Interconnection Switch
TCC$
I $
CPU 6
Mailbox
TCC$
I $
CPU 7
Mailbox
FPGA 1
Interconnection SwitchTCC
$
I $
CPU 2
Mailbox
TCC$
I $CPU 3
Mailbox
FPGA 2
Interconnection Switch
TCC$
I $
CPU 4
Mailbox
TCC$
I $
CPU 5
Mailbox
Figure 4.1: Hardware architecture update. The updated ATLAS hardware in-cludes a dedicated CPU to the OS execution (OS CPU) in the central FPGA, and aprivate SRAM (mailbox) per CPU that serves the mailbox.
To handle the TLB miss in ATLAS, the application CPU sends the faulting address
to the OS CPU, and the OS CPU replies the corresponding TLB entry back to
the application CPU after consulting the application page table. On the other hand,
applications explicitly request OS services through system calls. A system call request
consists of a syscall number and arguments that are analog to the function name and
arguments for the function calls. In ATLAS, the application CPU sends the syscall
number and arguments to the OS CPU, and the OS CPU replies with the system call
results and if any, an error code.
In the remainder of the section, we explain the hardware and software modifica-
tions necessary to implement this solution.
4.2.1 Hardware Architecture Update
The proposed solution requires ATLAS to include some pieces of extra hardware,
namely, the OS CPU and the mailboxes. Figure 4.1 shows the hardware architecture
updates.

36 CHAPTER 4. OPERATING SYSTEM SUPPORT FOR HTM
For the OS CPU, ATLAS uses one of the unused hardcoded PowerPC cores in
the central FPGA of the BEE2 board. This scheme is obviously optimal because the
FPGAs are connected via the star network around the central FPGA. Since the OS
CPU does not run OS that was written with transactions, it does not use the TCC
cache, but, rather the internal data cache embedded in the PowerPC 405 core.
Mailboxes are private SRAMs that are closely connected to CPUs. The mailbox
of the OS CPU is segmented into multiple sectors, one per application CPU. The
application CPU has permission to write to its sector to send request information.
The OS CPU has permission to write to the mailboxes of all application CPUs. All
CPUs have read accesses to their own mailboxes. Because the mailbox is designed to
enable communication between the OS CPU and the application CPU, application
CPUs cannot communicate with each other using the mailbox. All read and write
requests to the mailboxes occur through the regular interconnection network.
4.2.2 Software Stack Update
As shown in Figure 4.2, the ATLAS software stack is also updated. The stack is
organized in two columns depending on the CPUs that the modules run on. The
ATLAS core is a user-level code that runs on the OS CPU and listens to the requests
from the application CPUs. The proxy kernel is a thin runtime that runs on the
application CPU proxying the OS that runs on the OS CPU. The bootloader is
the code that boots up the application CPU and waits for the application initiation
from the OS CPU. Details of the new modules are provided in this section. The
productivity tool library runs both on the application CPU and the OS CPU as
explained in Chapter 5.
4.2.3 ATLAS Core
The ATLAS core is a user-level code that runs on the OS CPU. In the beginning of
an application, it initiates the application code on the application CPUs. Then, it
waits for to the OS requests from the application CPUs by checking the corresponding
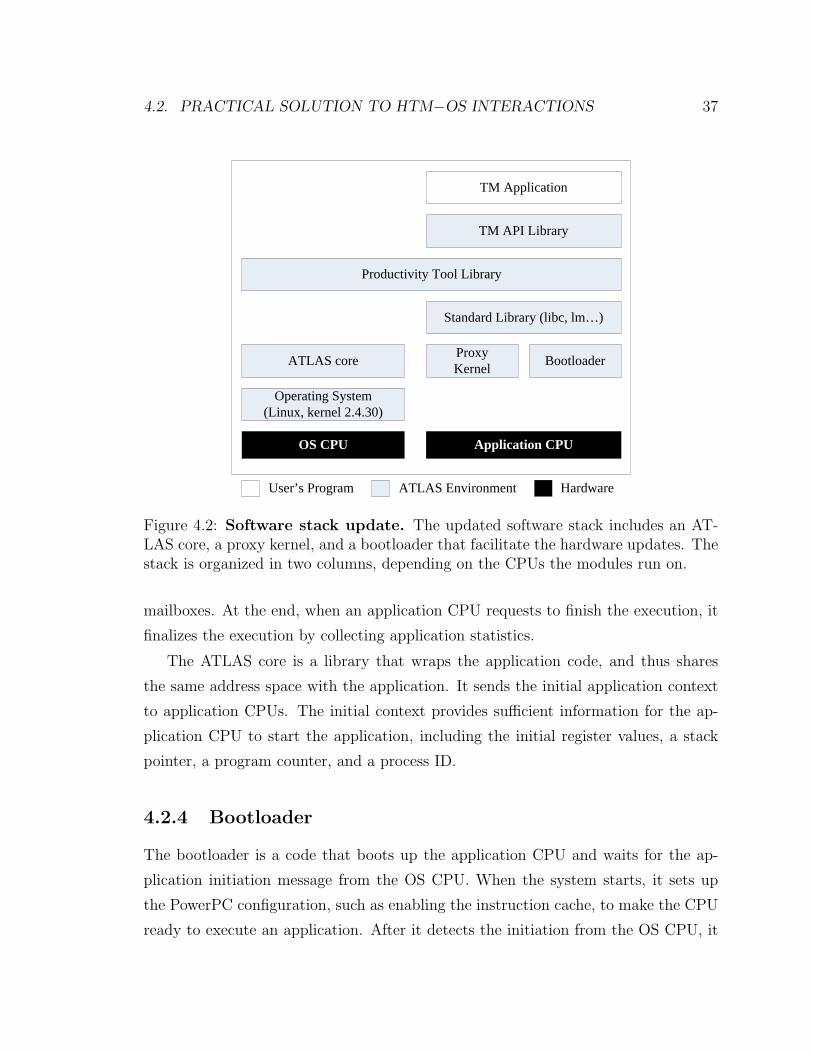
4.2. PRACTICAL SOLUTION TO HTM−OS INTERACTIONS 37
Operating System (Linux, kernel 2.4.30)
ATLAS core ProxyKernel
Productivity Tool Library
Bootloader
Standard Library (libc, lm…)
OS CPU Application CPU
HardwareATLAS EnvironmentUser’s Program
U
TM Application
TM API Library
Figure 4.2: Software stack update. The updated software stack includes an AT-LAS core, a proxy kernel, and a bootloader that facilitate the hardware updates. Thestack is organized in two columns, depending on the CPUs the modules run on.
mailboxes. At the end, when an application CPU requests to finish the execution, it
finalizes the execution by collecting application statistics.
The ATLAS core is a library that wraps the application code, and thus shares
the same address space with the application. It sends the initial application context
to application CPUs. The initial context provides sufficient information for the ap-
plication CPU to start the application, including the initial register values, a stack
pointer, a program counter, and a process ID.
4.2.4 Bootloader
The bootloader is a code that boots up the application CPU and waits for the ap-
plication initiation message from the OS CPU. When the system starts, it sets up
the PowerPC configuration, such as enabling the instruction cache, to make the CPU
ready to execute an application. After it detects the initiation from the OS CPU, it
38 CHAPTER 4. OPERATING SYSTEM SUPPORT FOR HTM
installs the delivered context into the CPU’s register file and switches the CPU to
the delivered context.
4.2.5 Proxy Kernel
The proxy kernel is a thin-layer runtime that runs on the application CPU proxying
the OS that runs on the OS CPU. When an exception or a system call happens on
the application CPU, the processor hardware automatically switches to the desig-
nated address where the corresponding exception handler is located. ATLAS places
the proxy kernel in this address, even though the proxy kernel does not handle the
exception. Rather, it proxies the OS by sending the requests to the OS CPU, waiting
for the response, and installing the returned result as if the request had been handled
locally.
4.2.6 Runtime Exception Handling Procedure
As mentioned earlier, ATLAS supports a TLB miss exception and a syscall exception
that are sufficient to provide full-system support to application developers. In this
subsection, we describe the detailed procedures for these exceptions.
ATLAS differs two exceptions based on revocability. A TLB miss sometimes
results in changes in OS data structures, such as the page table. However, the result
of application execution is supposed to be independent of the page table state; thus,
ATLAS considers the TLB miss exception to be revocable. On the other hand, as
system calls are explicitly initiated by the application, a system call, such as file
I/O, affects the result of the application. Therefore, ATLAS regards the system call
exception as irrevocable. Even though there are many system calls that are revocable,
such as get-time-of-day, for simplicity, ATLAS services all system calls in the same
manner.
The difference between system calls and TLB exceptions has a significant impact
on their implementation. Irrevocable exceptions serialize the system; if another trans-
action makes a system call request, it will fail to acquire the permission to serialize
the system until the first transaction that made a system call commits. On the other

4.2. PRACTICAL SOLUTION TO HTM−OS INTERACTIONS 39
Figure 4.3: The procedure of TLB miss exception handling.
hand, TLB miss exceptions can be requested by multiple transactions in parallel.
While the requests are serialized as the single OS CPU processes all of them, the
commits of the corresponding transactions are not serialized.
The TLB Miss Exception
When a TLB miss happens, the OS requires the information of the faulting address
and the access type−read or write−to resolve the exception through the proxy kernel.
Figure 4.3 illustrates the detailed procedure of the interplay between the application
and the OS. When the application hits the TLB miss exception, the proxy kernel
is invoked. The kernel sends the TLB information to the ATLAS core (A1), and
waits for a response from the ATLAS core (A2). On the OS CPU side, the ATLAS
core collects the information and calls a special device driver (O1). The device driver
regenerates the memory access using the TLB miss information (O2), which causes OS

40 CHAPTER 4. OPERATING SYSTEM SUPPORT FOR HTM
Figure 4.4: The procedure of system call handling.
to load the TLB entry on the OS CPU’s TLB by searching the page table or servicing
the page fault, if necessary. The driver searches the OS CPU’s TLB to find the
corresponding entry (O3). Then, the ATLAS core receives the entry from the device
driver and sends it back to the proxy kernel (O4). After the proxy kernel receives the
TLB entry, it masks some of access flags in the entry (A3). The modification makes
the associated page bypass the internal data cache embedded in the PowerPC. This
modification is necessary because ATLAS implements the TCC cache as an external
cache to the hardcoded PowerPC core. Finally, the proxy kernel installs the entry to
the local TLB (A4) and returns to the application.
4.3. OS PERFORMANCE ISSUES 41
The System Call Exception
In contrast to the TLB miss handling that only requires a faulting address and the
access type, a system call handling requires the OS to read and write the application’s
address space. Therefore, the OS CPU and the application CPU should synchronize
the memory state before processing the system call. Synchronization includes two
actions. First, the OS CPU flushes its cache to ensure that any subsequent reads
to the application space will return the most recent values. Second, the application
CPU must commit its transaction to make its updates visible to the OS. To avoid
atomicity issues, we serialize all of the user transactions at this point.
Figure 4.4 demonstrates the detailed procedure. First, the proxy kernel acquires a
commit token to serialize the system (A1). Then, the kernel requests the OS CPU to
flush and invalidate its data cache (A2). After the OS CPU flushes its cache (O1, A3),
the proxy kernel also commits the write-set of the transaction (A4). Following this
synchronization, the proxy kernel sends the system call information to the ATLAS
core (A5). The ATLAS core, in turn, processes the system call by invoking the OS
(O2), flushes and invalidates the data cache (O3), and sends the result back to the
proxy kernel (O4). Finally, the proxy kernel installs the result (A7) and returns to
the application. When the transaction actually completes and commits, the commit
token is released and other transactions can also proceed with committing.
4.3 OS Performance Issues
ATLAS deploys a single OS CPU to support the OS requests from all eight applica-
tion CPUs. Therefore, the OS CPU is expected to be the performance bottleneck,
particularly as the system scales. In fact, the evaluation in Section 4.4 shows that
the OS CPU in the original scheme is already starting to become congested in 4
and 8 processor configurations. Deploying multiple OS CPUs and running an SMP
(Symmetric Multi-Processors) version of OS is an unavoidable solution for larger scale
systems. However, there are multiple ways to improve the OS CPU’s performance,
while maintaining the simplicity of the proposed solution.
42 CHAPTER 4. OPERATING SYSTEM SUPPORT FOR HTM
4.3.1 Localizing the OS Services
There are several exceptions that do not modify the internal states of the OS, The
results of such exceptions can be locally cached by the proxy kernel running in the
application CPU, and can be reused as long as the internal OS state is valid. The TLB
miss is a good example for the case. When the application accesses a virtual address
for the first time, the TLB miss for the access incurs the page fault and modifies
the internal states of OS, i.e. the page table. However, as the application deals with
large datasets, the hardware TLB cannot contain the whole set of mappings and must
repeatedly evict and refill some entries. TLB misses according to this scenario merely
look up the internal page table while not modifying it. Therefore, these TLB misses
can be locally serviced by buffering the evicted TLB entries close to the application
core. The OS processor needs to be consulted only when a mapping is requested for
the first time, or when mappings change (paging to disk).
As a demonstration of the scheme, ATLAS implements a victim TLB. A victim
TLB is a software-managed mechanism that locally buffers evicted TLB entries in the
private SRAM of the proxy kernel. With the victim TLB, the proxy kernel searches
for the victim TLB before it sends a request message to the OS CPU. This localized
mechanism diminishes the congestion in the OS CPU. As shown in Section 4.4, the
TLB miss rate is reduced by 15-fold on average when the victim TLB is used. More-
over, this scheme reduces the latency of individual requests because it eliminates the
communication latency between the applications CPU and the OS CPU.
4.3.2 Accelerating the OS CPU
As the workloads of the application CPUs and the OS CPU are different, it is also
reasonable to make them heterogeneous. Accelerating the OS CPU can decrease the
performance congestion in some degrees and improve the system scalability. Of course,
as the performance of OS services are not only affected by the CPU performance but
also by the memory system, these scheme only improve the fraction that is bounded
by the CPU.

4.4. EVALUATION 43
OS CPU Clock Frequency100 MHz 300 MHz
Victim TLBNo ATLAS100 ATLAS300Yes ATLAS100v ATLAS300v
Table 4.1: The configuration of experimental platforms. Depending on the OSCPU clock frequency and the use of a victim TLB, ATLAS is configured in four waysand compared.
ATLAS accelerates the OS CPU by increasing its CPU clock frequency. While the
overall system clock frequency remains at 100MHz, this implementation speeds up the
CPU clock frequency to 300MHz. This optimization is not possible for the application
CPUs, because they must interact with the TCC cache that uses reconfigurable logic
and cannot be clocked faster than 100MHz.
4.4 Evaluation
In this section, we evaluate the OS support features of the ATLAS system. We first
measure the latencies of handling the exceptions that ATLAS supports: TLB misses
and system calls. The latencies are measured on various platform configurations as
well as on the baseline design used in Chapter 3. Then, we ran 8 benchmarks on
ATLAS to demonstrate the effectiveness and scalability of the ATLAS system with
the proposed solution. Finally, we project the performance limit of the single OS
CPU solution by running a microbenchmark.
4.4.1 Experimental Platform Configurations
Following the performance improvement schemes discussed in Section 4.3, ATLAS
can be configured in multiple ways. In this evaluation, we configure ATLAS in four
different ways depending on the OS CPU clock frequency and the use of a victim TLB
in the application CPUs. The Table 4.1 summarizes the configurations. ATLAS100
is the original configuration that uses a 100 MHz OS CPU and handles all TLB
misses on the OS CPU. ATLAS100v is a variant of ATLAS100 that includes the

44 CHAPTER 4. OPERATING SYSTEM SUPPORT FOR HTM
Configuration Latency (cycles)
ATLAS100 1613.6ATLAS300 928.6ATLAS100v 644.6ATLAS300v 644.6Baseline 83.9
Table 4.2: TLB miss exception handling latency comparisons. Note that theresults are measured from the application CPU side. Therefore, all cycles refer to a100 MHz clock frequency regardless of OS CPU’s operating clock frequency.
victim TLB. ATLAS300 and ATLAS300v are corresponding versions of ATLAS100
and ATLAS100v with a 300 MHz OS CPU.
4.4.2 Exception Handling Latency
TLB Miss Exception
To measure the TLB miss exception handling latency, we use a microbenchmark
that constantly accesses 64 pages of data in a stride width of a page plus a word (a
1028 byte stride). In this way, the CPU can keep all 64 words in the data cache,
while generating TLB misses for every access because of the limited TLB capacity.
Obviously, the numbers are adjusted to remove other factors that contribute to the
latency, such as the loop overhead or the cache hit latency.
As Table 4.2 indicates, the TLB miss exception handling takes longer in ATLAS
than the baseline design. It is because the TLB miss exception is handled by the OS
CPU through the proxy kernel in ATLAS, while it is directly handled on the CPU
in the baseline design. ATLAS100, the original design takes 20 times longer than
the baseline design. By localizing the handling using a victim TLB (ATLAS100v),
this latency is reduced by 60%. Accelerating the OS CPU clock frequency to 300
MHz (ATLAS300) also helps in reducing the latency by 42%. However, there is
no difference between ATLAS100v and ATLAS300v because most TLB misses are
handled by the victim TLB.
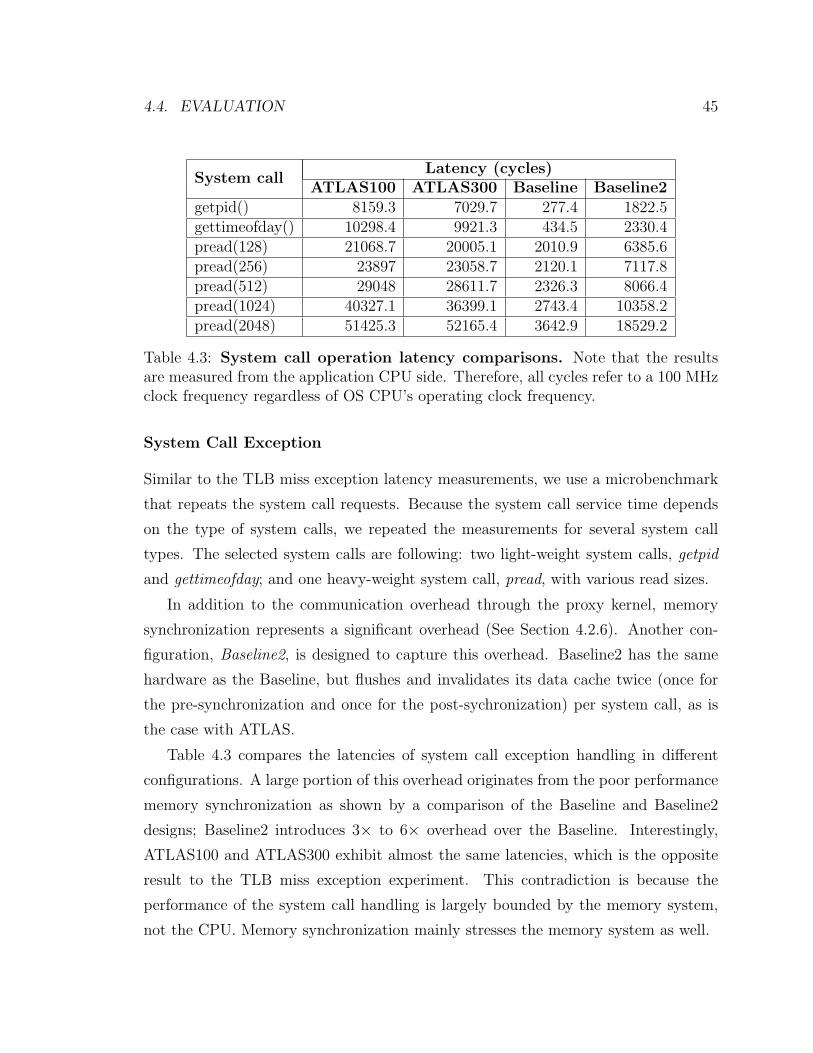
4.4. EVALUATION 45
System callLatency (cycles)
ATLAS100 ATLAS300 Baseline Baseline2getpid() 8159.3 7029.7 277.4 1822.5gettimeofday() 10298.4 9921.3 434.5 2330.4pread(128) 21068.7 20005.1 2010.9 6385.6pread(256) 23897 23058.7 2120.1 7117.8pread(512) 29048 28611.7 2326.3 8066.4pread(1024) 40327.1 36399.1 2743.4 10358.2pread(2048) 51425.3 52165.4 3642.9 18529.2
Table 4.3: System call operation latency comparisons. Note that the resultsare measured from the application CPU side. Therefore, all cycles refer to a 100 MHzclock frequency regardless of OS CPU’s operating clock frequency.
System Call Exception
Similar to the TLB miss exception latency measurements, we use a microbenchmark
that repeats the system call requests. Because the system call service time depends
on the type of system calls, we repeated the measurements for several system call
types. The selected system calls are following: two light-weight system calls, getpid
and gettimeofday; and one heavy-weight system call, pread, with various read sizes.
In addition to the communication overhead through the proxy kernel, memory
synchronization represents a significant overhead (See Section 4.2.6). Another con-
figuration, Baseline2, is designed to capture this overhead. Baseline2 has the same
hardware as the Baseline, but flushes and invalidates its data cache twice (once for
the pre-synchronization and once for the post-sychronization) per system call, as is
the case with ATLAS.
Table 4.3 compares the latencies of system call exception handling in different
configurations. A large portion of this overhead originates from the poor performance
memory synchronization as shown by a comparison of the Baseline and Baseline2
designs; Baseline2 introduces 3× to 6× overhead over the Baseline. Interestingly,
ATLAS100 and ATLAS300 exhibit almost the same latencies, which is the opposite
result to the TLB miss exception experiment. This contradiction is because the
performance of the system call handling is largely bounded by the memory system,
not the CPU. Memory synchronization mainly stresses the memory system as well.

46 CHAPTER 4. OPERATING SYSTEM SUPPORT FOR HTM
4.4.3 Application Scalability
The practical solutions discussed in this chapter address the challenges of interactions
between transactions and the OS code but have performance limitations. At the end
of the day, the overall overhead of the OS infrastructure depends on the characteristics
of the applications that run on it and the frequency at which they invoke OS services.
In this experiment, we evaluate the ATLAS system with a set of benchmarks: 5
STAMP applications and 3 SPLASH and SPLASH-2 applications. STAMP [10] is a
unique benchmark suite that is written from scratch in order to evaluate the effective-
ness of coarse-grain transactions. V acation models a 3-tier server system powered by
the in-memory database; kmeans is an algorithm that clusters objects into k parti-
tions based on some attributes; genome performs gene sequencing; and yada produces
guaranteed quality meshes for applications, such as graphics rendering; labyrinth im-
plements Lee’s maze routing algorithm, which is commonly used in layout [70]. On
the other hand, SPLASH [68] and SPLASH-2 [75] are parallel benchmark suites that
are widely used in evaluating parallel computer systems. Radix is a parallel sort-
ing algorithm; mp3d simulates rarefied hypersonic flow; and ocean simulates eddy
currents in an ocean basin. The applications were originally coded with locks. We
produced transactional version by replacing locked regions with transactions. Any
code between two lock regions also executes an implicit transaction.
Figures 4.5 and 4.6 demonstrate the scalability of the benchmark applications.
The experiment uses the ATLAS300v configuration since it provides best performance
mitigating the limitation of FPGA-based implementation. Despite differences, gen-
erally speaking, the execution time of applications scale well in ATLAS despite the
inefficiencies of the FPGA-based implementation. Nevertheless, the scalability of the
TM applications is beyond the scope of this dissertation. Rather, we focus on the
effect of the system time on the scalability. There are several applications that have
significant portions of system cycles: vacation, yada, radix, and mp3d. It is because
they all deal with such large data sets that they frequently overflow the TLB. It is
noticeable that the system time scales even though only one OS CPU handles all
requests from application CPUs. There are two factors that contribute to this effect:
the localized fraction in the system time and the balanced time-sharing of the OS

4.4. EVALUATION 47
0.000
0.125
0.250
0.375
0.500
0.625
0.750
0.875
1.000
1p 2p 4p 8p 1p 2p 4p 8p 1p 2p 4p 8p 1p 2p 4p 8p 1p 2p 4p 8p
vacation kmeans genome yada labyrinth
Norm
aliz
ed B
reak
dow
n
Busy L1 Miss Arbitration Commit Sync Conflict System
Figure 4.5: Application scalability for the 5 STAMP applications. FiveSTAMP applications are evaluated using 1, 2, 4, and 8 CPU configurations. TheX-axis represents CPU and application configuration, while the Y-axis presents thebreakdown of normalized execution time. The execution time is normalized to the1 CPU total execution time of each application. Busy measures the cycles that theCPU spends in useful work, while L1 Miss is for the time that it stalls due to L1data cache misses. Arbitration stands for the commit token arbitration cycles, andCommit does for the cycles flushing the write-set, clearing the speculative buffer, andcheckpointing the registers. Conflict cycles are wasted ones due to the data conflictsand represents cycles from the beginning of the transaction to the conflict detection.System shows the cycles that the application CPU spends in resolving exceptions.

48 CHAPTER 4. OPERATING SYSTEM SUPPORT FOR HTM
0.000
0.125
0.250
0.375
0.500
0.625
0.750
0.875
1.000
1p 2p 4p 8p 1p 2p 4p 8p 1p 2p 4p 8p
radix mp3d ocean
Norm
aliz
ed B
reak
dow
nBusy L1 Miss Arbit Commit Sync Conflict System
Figure 4.6: Application scalability for the SPLASH and SPLASH-2 appli-cations. The axes are similar to those in Figure 4.5.
CPU. As seen in Figures 4.3 and 4.4, there are several steps handled in applica-
tion CPUs. These steps do not require serialization in the OS CPU and multiple
application CPUs can execute them in parallel. Moreover, if the requests from the
application CPUs do not collide, but are separated sparsely enough in time, the sys-
tem time of an individual application CPU scales even though the total amount of
work in the OS CPU remains the same. This is the case until the OS CPU becomes
saturated.

4.4. EVALUATION 49
4.4.4 Limits to Scalability
As discussed in Section 4.3, the single OS CPU scheme will eventually become the
performance bottleneck as a system scales. This portion of the evaluation explores
this limitation: how many application CPUs a single CPU can handle without being
a performance bottleneck.
To measure and project the performance limit, we use a micro-benchmark exper-
iment. In the micro-benchmark, multiple CPUs simultaneously requests TLB miss
service to the single OS CPU in a controlled rate. Because ATLAS only supports
up to 8 CPUs, it uses pessimistic approach to model configurations with more than
8 CPU configurations; instead of doubling the number of CPUs, it doubles the TLB
miss service request rate. It is pessimistic because it gives up the potential overlap
in the local portion of the service.
Figure 4.7 illustrates the result of the experiment. The normalized execution time
of each service indicates the congestion in the OS CPU; it remains 1 if the OS CPU is
not congested. The micro-benchmark generates a TLB miss at 1.24% of all memory
accesses. This rate is collected from the average TLB miss rate of 8 applications that
are used in the previous experiment. The micro-benchmark contains 20% memory
accesses in the instruction mix, which is considered as the average [31].
In the original ATLAS implementation, ATLAS100, the OS CPU starts to congest
with more than 2 application CPUs. The average TLB miss rate is reduced to 0.08%
when the victim TLB is enabled. With the victim TLB, ATLAS100v puts lower
pressure on the OS CPU, and moves the limit to 4 CPUs. Moreover, ATLAS300
pushes the limit to 16 CPUs by improving the latency of request polling in the OS
CPU. Finally, by employing both techniques, ATLAS300v enhances the scalability to
32 application CPUs. Overall, while the single OS CPU is eventually not scalable,
this experiments shows that it can be a practical and simple solution for small and
medium scale parallel systems.
50 CHAPTER 4. OPERATING SYSTEM SUPPORT FOR HTM
4.5 Related Work
Intel’s multiple instruction stream processor (MISP) [28] architecture is a similar con-
cept of running the OS in a dedicated CPU. However, it is different from ATLAS in
its motivation and focus. The MISP tries to reduce OS-based synchronization over-
head in a CMP system, by allowing application to directly manage synchronization
and scheduling. On the other hand, ATLAS focuses on OS support for application
development.
Ramadan, et al. have studied MetaTM/LinuxTx [60] that uses TM for OS devel-
opment. They developed a TM-based OS, LinuxTx, by converting frequently used
synchronization primitives in the SMP Linux OS to their TM-based ones. Moreover,
they provide transaction suspension and resume mechanism to prevent aborting trans-
actions when interrupts occur. Their work presents the first OS that uses transactions.
Nevertheless, their system was studied in simulation (not an actual prototype) and
did resort to conventional synchronization mechanisms (locks) for challenging events
such as irrevocable I/O.
4.6 Summary
It is not trivial to run the OS on an HTM system because the OS may violate the
atomicity and isolation guarantees that HTM provides to user transactions.
The practical solution, proposed in this chapter, addresses these challenges by
deploying an extra CPU dedicated to the OS execution and providing a separate
communication channel between the OS and the application. The updated hardware,
coupled with a full-system software stack based on a proxy kernel that orchestrates
the communication between the OS CPU and application CPUs. Using this scheme,
the system provides transactional applications with the full-featured OS services,
without requiring invasive changes to the existing OS code. The proposed solution is
evaluated with the 5 STAMP benchmark applications and 3 SPLASH and SPLASH-2
benchmark applications; it scales well without compromising atomicity and isolation.

4.6. SUMMARY 51
Moreover, the single OS CPU scheme scales up to 32 processors with performance
optimizations, such as the service localization and the OS CPU acceleration.
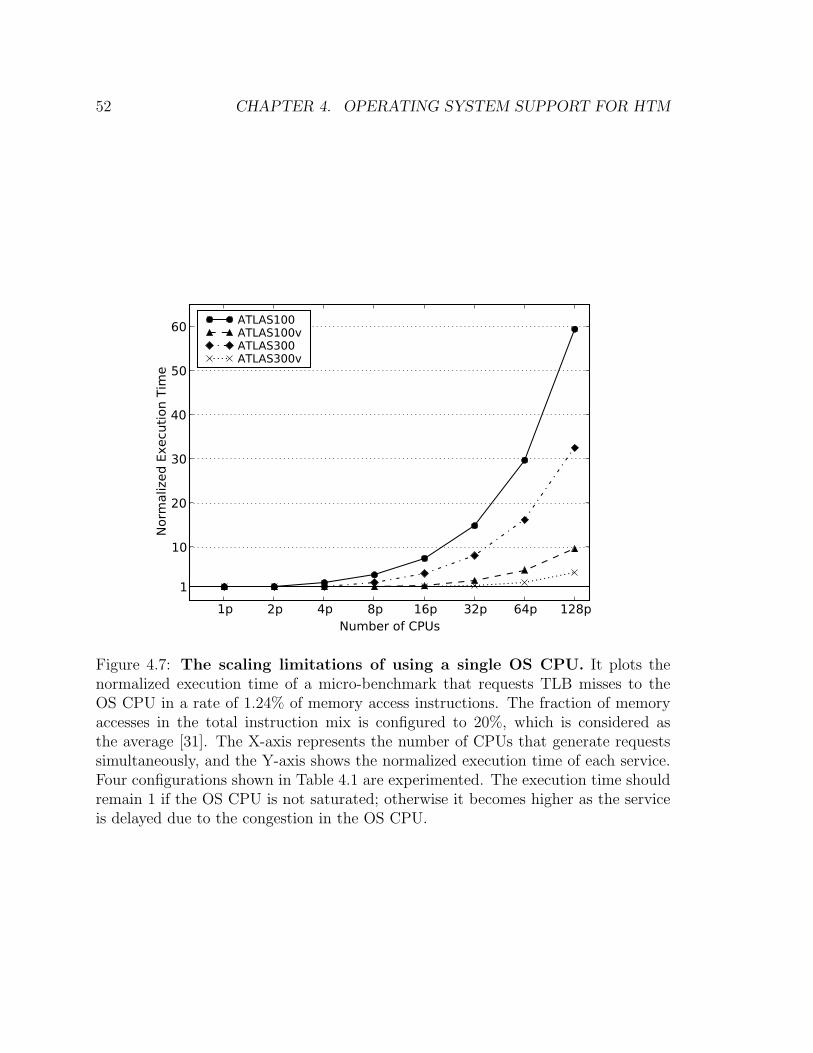
52 CHAPTER 4. OPERATING SYSTEM SUPPORT FOR HTM
1p 2p 4p 8p 16p 32p 64p 128pNumber of CPUs
1
10
20
30
40
50
60
Norm
aliz
ed E
xecu
tion T
ime
ATLAS100ATLAS100vATLAS300ATLAS300v
Figure 4.7: The scaling limitations of using a single OS CPU. It plots thenormalized execution time of a micro-benchmark that requests TLB misses to theOS CPU in a rate of 1.24% of memory access instructions. The fraction of memoryaccesses in the total instruction mix is configured to 20%, which is considered asthe average [31]. The X-axis represents the number of CPUs that generate requestssimultaneously, and the Y-axis shows the normalized execution time of each service.Four configurations shown in Table 4.1 are experimented. The execution time shouldremain 1 if the OS CPU is not saturated; otherwise it becomes higher as the serviceis delayed due to the congestion in the OS CPU.
Chapter 5
Productivity Tools for Parallel
Programming
Software development includes not only writing code, but also debugging its correct-
ness bugs and tuning its performance. Compared to sequential programming, these
two aspects become more important in parallel programming because of its additional
complexity when compared to the sequential programming. Moreover, the primary
motivation for parallel programming is scalable performance. Therefore, a rich set
of productivity tools for debugging and tuning is necessary to truly simplify parallel
programming.
In this chapter, we describe the challenges in building productivity tools for paral-
lel programming and demonstrate the opportunities to utilize Transactional Memory
(TM) support for building these tools. Specifically, we present three productivity
tools: ReplayT, AVIO-TM, and TAPE.
ReplayT is a deterministic replay tool that utilizes the serializability provided by
TM systems, such as TCC. Because TM isolates all of memory accesses to shared vari-
ables within a transaction, the thread interleaving can be fully captured by recording
only the sequential order of transactions. Moreover, the transaction order is suffi-
cient to deterministically replay a parallel application on a system that continuously
executes transactions. The commit order captures all interactions among threads
53

54 CHAPTER 5. PRODUCTIVITY TOOLS FOR PARALLEL PROGRAMMING
because interleaved communication takes place at the boundaries of atomic trans-
actions. Assuming transactions contain more than a few instructions, recording the
transaction commit order has negligible runtime overhead and requires log2 P bits of
storage overhead per transaction, where P is the number of CPUs in the system (8
for ATLAS).
AVIO-TM is an automated atomicity violation detection tool, the variation of
AVIO [44] for the ATLAS system. AVIO is based on the observation that an unseri-
alizable access interleaving is a good indicator of an atomicity violation. The AVIO
paper categorizes four types of pathologies and associates each of them with a cor-
responding unserializable access case. Utilizing the fact that, in the TM systems,
threads only interact at transaction granularity, AVIO-TM improves the performance
and correctness of original AVIO proposal. It first improves the memory access col-
lection process by logging the information at transaction granularity. Moreover, by
compressing the multiple memory accesses to a variable in a transaction into one
reference, it shortens the interleaving analysis time.
TAPE is a light-weight runtime performance bottleneck monitor. TAPE utilizes
the fact that the TM system already tracks the detailed information about perfor-
mance bottleneck events, such as data dependency conflicts or overflows in the meta-
data buffers of TCC caches. With this fact, TAPE collects and manages the detailed
information with negligible overhead in both runtime and hardware cost. TAPE is
useful particularly because it allows programmers to tune an application without
deeply understanding it. In our experience, we could eliminate performance bot-
tlenecks in one of our benchmark using TAPE. The process did not require us to
understand implementation details of the application.
5.1 Challenges and Opportunities
In addition to the bugs of sequential programming, parallel programmers have an
additional challenge to overcome, namely, concurrency bugs. Concurrency bugs are
hard to detect and fix because they lead to incorrect results only when the threads

5.1. CHALLENGES AND OPPORTUNITIES 55
interleave in certain ways. Therefore, without a mechanism to capture thread inter-
leaving for a specific execution, programmers would not be able to fully understand a
bug; repeated executions may merely produce non-deterministic results that are not
relevant to the debugging. However, collecting the thread interleaving information
requires tracking the order of memory accesses, which is expensive in terms of time
and storage. Even with the sufficient thread interleaving information, concurrency
bugs are not trivial to manually analyze. The interleaving pattern that originates a
failure can be thousands of lines away from the failure detection. Hence, rather than
manually tracking the bug, programmers need an automated bug detection tool that
analyzes the large volume of trace across multiple threads.
Moreover, the primary purpose of parallelization is to achieve scalable perfor-
mance; thus, performance tuning is an essential part of software development for
parallel programs. Therefore, it is desirable to have profiling tools that guide the
tuning processes. Profiling a parallel program is challenging because it needs to col-
lect detailed information about thread interactions without introducing significant
runtime overhead that distorts the application behavior.
Existing HTM features provides opportunities to address these challenges. Be-
cause an HTM system tracks all memory accesses for data versioning and conflict
detection, it can easily collect the memory access information without heavy runtime
overhead. Moreover, a TM system that continuously executes transactions only al-
lows the thread interaction at the transaction boundaries. Therefore, the system can
capture thread interleaving information at the granularity of transactions, instead
of individual load and store. Furthermore, an HTM system already tracks detailed
information about thread interactions that cause performance bottlenecks; thus, it
can collect the information without introducing a significant runtime overhead.

56 CHAPTER 5. PRODUCTIVITY TOOLS FOR PARALLEL PROGRAMMING
Execute
ArbitrateCommit
Execute
ArbitrateCommit
Execute
ArbitrateCommit
T0T1
T2
Threads
Tim
e
Execute
ArbitrateCommit
Execute
Arbitrate
Commit
Execute
Arbitrate
Commit
T0 T1 T2
Abort &re-exe.
ArbitrateReplayT Log: T0 - T1 - T2Log Mode Replay Mode
Figure 5.1: The runtime scenario of ReplayT.
5.2 ReplayT
5.2.1 Deterministic Replay
Deterministic replay is a tool that captures sufficient runtime information to faithfully
regenerate an execution of a program. The runtime information includes input data
to the application, arrival of interrupts, random numbers generated in the execution,
and so on. For parallel programs, thread interleaving information is very important
because it is not statically specified in the binary and typically determines if a certain
concurrency bug will affect program correctness or not. To capture the thread inter-
leaving, the system needs to record all of memory accesses to the shared memory in
their order. This recording process is expensive in terms of time and storage. More-
over, the logging overhead can distort the actual thread interleaving if it can delay
the execution of some threads.
5.2.2 ReplayT
ReplayT is a deterministic replay tool that utilizes the serializability provided by TM
systems, such as TCC. Because TM isolates all of memory accesses to shared vari-
ables within a transaction, the thread interleaving can be fully captured by recording

5.2. REPLAYT 57
only the sequential order of transactions. Moreover, the transaction order is suffi-
cient to deterministically replay a parallel application on a system that continuously
executes transactions. The commit order captures all interactions among threads
because interleaved communication takes place at the boundaries of atomic trans-
actions. Assuming transactions contain more than a few instructions, recording the
transaction commit order has negligible runtime overhead and requires log2 P bits of
storage overhead per transaction, where P is the number of CPUs in the system (8
for ATLAS).
Figure 5.1 demonstrates a simple scenario of recording and replaying commit order
in the TCC architecture. In the original run (log mode), as transactions commit in
a first-come-first-served manner, ReplayT records their order in a global log. In this
example, it logs that threads T0, T1, and T2 committed their transactions in this
order. When the program is re-executed in replay mode, the ReplayT informs the
system to make ordering decisions based on the pre-recorded commit order. In this
example, it happens that threads complete transactions in order of T1, T2, and T0.
Even though T1 and T2 request to commit prior to T0, ReplayT delays them until
T0 completes and commits its transaction. In this case, committing T0 causes T2 to
abort and re-execute since there was a conflict between the two.
On ATLAS, the commit token arbiter is the existing hardware module that can
observe and control the sequential commit order. Therefore, ATLAS implements Re-
playT by extending the commit token arbiter. Specifically, we provide an interface
between the arbiter and the OS CPU. The OS CPU runs a software library that
orchestrates the above scenario. In the log mode, the commit token arbiter fills a
hardware log buffer with the transaction commit order. The ReplayT library periodi-
cally drains the buffer to a log file in main memory. In the replay mode, the ReplayT
library fills up a replay buffer with the pre-recorded commit order, and configures the
arbiter to grants the commit token following the specified thread order. The hard-
ware buffer size should be large enough to prevent the periodic buffer draining from
the buffer overflow that blocks the arbiter’s operation. ATLAS provides 512-entry
hardware buffers. Each entry contains a 4-byte thread ID for the simple interface
design even though a 3-bit ID is sufficient.

58 CHAPTER 5. PRODUCTIVITY TOOLS FOR PARALLEL PROGRAMMING
As shown in the evaluation (Section 5.2.4), the overhead of ReplayT is negligible
in terms of storage and runtime. ReplayT consumes only 1.38 bytes per 10, 000 in-
structions on average, and has less than 6% of runtime overhead for all applications.
Thus, a programmer can have the logger on throughout the testing phase of an ap-
plication without experiencing productivity loss. The low runtime overhead suggests
that recording the execution order is unlikely to change the runtime behavior so much
that many concurrency bugs would be masked.
We should note that ReplayT has some limitations in capturing external non-
deterministic events, such as random inputs, DMA, I/O, and interrupts. Nevertheless,
ReplayT can easily integrate a feature that separately records the information that
affects application execution as other deterministic replay tools do [76, 48]. It is
particularly easy because the OS CPU that runs the ReplayT library has full access
to the information. Moreover, since ReplayT provides the ability to deterministically
replay the application across system activities, such as a DMA transfer or an interrupt,
these activities are not necessary to track [48].
5.2.3 ReplayT Extensions
The availability of a low-overhead mechanism that captures execution order pro-
vides the basis for additional debugging tools, such as unique re-execution and cross-
platform replay.
Unique Replay
With parallel programs, running an application with a specific test dataset once is not
necessarily sufficient for testing. The same dataset with some ordering perturbation
may expose a concurrency bug in the code. Hence, a programmer may want to run
the same test multiple times to ensure reasonable coverage. However, it would be
preferable if every run follows a unique execution order as opposed to recreating a
previously seen one.
We provide a unique replay tool for ATLAS that builds upon ReplayT to ensure
that each re-execution leads to a unique interleaving of transactions across the parallel

5.2. REPLAYT 59
threads. In particular, the tool shuffles the ReplayT log to generate multiple, unique
orderings of transactions. The shuffling of the transactions is limited by certain exe-
cution events. For example, we cannot shuffle transactions across barrier boundaries
or across system calls. The ATLAS libraries for such events are annotated so that
they are recorded in the ReplayT log. While a programmer must still decide how
many times to re-run a program with unique replay, at least the tool guarantees that
each re-execution is unique and no time is wasted waiting for runs that cannot reveal
a new concurrency bug.
Replay with Monitoring Code
When re-executing an incorrect run, programmers often add monitoring code, such
as printf statements, in order to increase the visibility into the code behavior. In
parallel program debugging, however, the monitoring code itself often changes the
ordering among threads. The added code may significantly delay execution of a
thread and affect the interleaving across threads. As a result, the bug may not
be exposed during re-execution. ReplayT avoids this runtime distortion. As long
as the monitoring code does not affect the distribution of work across threads and
transactions at the user level, ReplayT can deterministically replay the incorrect run
after the monitoring code has been inserted. Hence, the programmer can use printf
statements and functions that do backtrace logging to accelerate the bug detection
without losing the ability to re-execute a faulty run. This feature is difficult to
implement with tools that support deterministic replay by tracking individual loads
and stores [76, 77, 48]. Even though the monitoring functions can be easily marked,
it is difficult to distinguish during runtime which communication events (e.g., cache
misses) are solely due to the program itself and which are affected by monitoring code
as well.
Cross-Platform Replay
Even after extensive in-house testing, an application may still contain concurrency
bugs that could potentially show up on the client systems. Deterministic re-execution
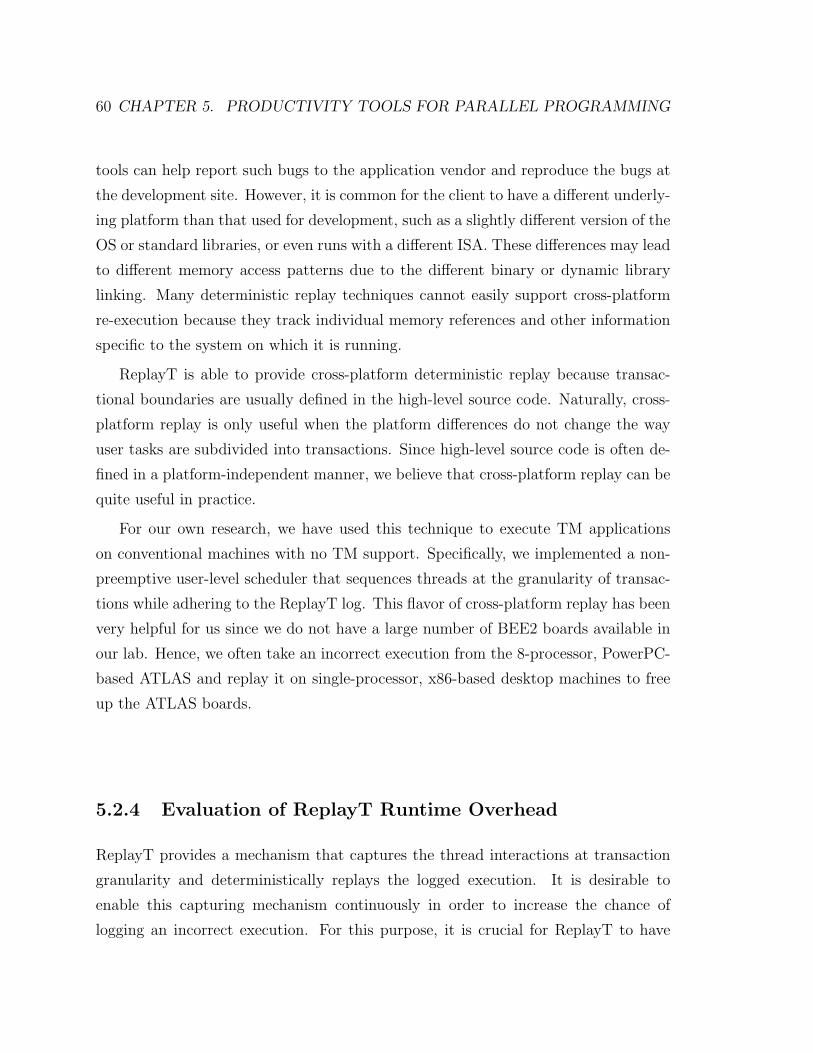
60 CHAPTER 5. PRODUCTIVITY TOOLS FOR PARALLEL PROGRAMMING
tools can help report such bugs to the application vendor and reproduce the bugs at
the development site. However, it is common for the client to have a different underly-
ing platform than that used for development, such as a slightly different version of the
OS or standard libraries, or even runs with a different ISA. These differences may lead
to different memory access patterns due to the different binary or dynamic library
linking. Many deterministic replay techniques cannot easily support cross-platform
re-execution because they track individual memory references and other information
specific to the system on which it is running.
ReplayT is able to provide cross-platform deterministic replay because transac-
tional boundaries are usually defined in the high-level source code. Naturally, cross-
platform replay is only useful when the platform differences do not change the way
user tasks are subdivided into transactions. Since high-level source code is often de-
fined in a platform-independent manner, we believe that cross-platform replay can be
quite useful in practice.
For our own research, we have used this technique to execute TM applications
on conventional machines with no TM support. Specifically, we implemented a non-
preemptive user-level scheduler that sequences threads at the granularity of transac-
tions while adhering to the ReplayT log. This flavor of cross-platform replay has been
very helpful for us since we do not have a large number of BEE2 boards available in
our lab. Hence, we often take an incorrect execution from the 8-processor, PowerPC-
based ATLAS and replay it on single-processor, x86-based desktop machines to free
up the ATLAS boards.
5.2.4 Evaluation of ReplayT Runtime Overhead
ReplayT provides a mechanism that captures the thread interactions at transaction
granularity and deterministically replays the logged execution. It is desirable to
enable this capturing mechanism continuously in order to increase the chance of
logging an incorrect execution. For this purpose, it is crucial for ReplayT to have

5.2. REPLAYT 61
B L R B L R B L R B L R
1p 2p 4p 8p
-10
-5
0
5
10
15
Runti
me O
verh
ead (
%) vacation
B L R B L R B L R B L R
1p 2p 4p 8p
-0.3
-0.2
-0.1
0.0
0.1
0.2
0.3
Runti
me O
verh
ead (
%) kmeans
B L R B L R B L R B L R
1p 2p 4p 8p
-5
0
5
10
Runti
me O
verh
ead (
%) genome
B L R B L R B L R B L R
1p 2p 4p 8p
-15
-10
-5
0
5
10
15
20
Runti
me O
verh
ead (
%) yada
B L R B L R B L R B L R
1p 2p 4p 8p
0
5
10
15
Runti
me O
verh
ead (
%) labyrinth
Figure 5.2: ReplayT runtime overhead for the 5 STAMP applications. FiveSTAMP applications are evaluated using 1, 2, 4, and 8 CPU configurations. The X-axis represents CPU and ReplayT configuration. B stands for the base configurationthat does not run ReplayT, while L and R are for ReplayT log mode and replay modeconfigurations, respectively. The runtime overhead is normalized to the median of theexecution time of the base configuration. Boxplots provides information of medians(thick lines), lower and upper quartiles (box boundaries), and whiskers (error bars).

62 CHAPTER 5. PRODUCTIVITY TOOLS FOR PARALLEL PROGRAMMING
B L R B L R B L R B L R
1p 2p 4p 8p
-15
-10
-5
0
Runti
me O
verh
ead (
%) radix
B L R B L R B L R B L R
1p 2p 4p 8p
-15
-10
-5
0
5
Runti
me O
verh
ead (
%) mp3d
B L R B L R B L R B L R
1p 2p 4p 8p
-10
0
10
20
30
Runti
me O
verh
ead (
%) ocean
Figure 5.3: ReplayT runtime overhead for the 3 SPLASH and SPLASH-2applications. The axes are similar to those in Figure 5.2.
minimal runtime overhead. In this section, we evaluate it by running the 8 benchmark
applications used in Chapter 4.
Figures 5.2 and 5.3 show the ReplayT runtime overhead for 5 STAMP applications
and 3 SPLASH and SPLASH-2 applications, respectively. Since it is the case with any
real computer system, there is variance on the execution time of the same program and
dataset configuration on ATLAS. To illustrate the variance, the graph plots the result
using boxplots. The thick line in the box represents the median value of execution
runtime for 40 samples. Runtime overheads are normalized to the median value of the
base configuration that does not use ReplayT. We choose a median, not an average,
because the median is less sensitive to outliers.

5.2. REPLAYT 63
For log mode, graphs show that ReplayT has less than 6% of runtime overhead for
all applications. Moreover, compared to the variance in the execution time of each
configuration (the height of each box), these differences are considered statistically
insignificant. The overhead is negligible because the ReplayT library that runs on the
OS CPU only slows down the overall system when copying the log to main memory,
which delays servicing OS requests from the application CPUs.
During replay mode, ReplayT slows down the system because it does not allow
transactions to commit in a first-come-first-serve manner, but enforces the transaction
commits in a certain order. Therefore, ReplayT has overhead that reach a maximum
of 8% for all applications. The relatively higher overheads in yada, labyrinth, and
ocean are explained by their conflict time (See Figures 4.5 and 4.6); applications with
frequent dependencies across transactions may slow down in replay mode, because
commit messages would arrive later than they would with the base configuration.
5.2.5 Related Work
There have been significant research efforts on the deterministic replay since it is
crucial to the parallel application debugging. Flight Data Recorder (FDR) [76] is a
hardware-based full-system recorder that includes checkpointing, input logging, and
memory race recording. It piggybacks the instruction counter to the cache coherence
protocol to capture the order of thread interactions, and applies transitive reduction
(TR) [50]. Regulated Transitive Reduction (RTR) [77] enhances FDR by improving
the TR. It judiciously logs stricter and vecterizable dependencies, which are not nec-
essarily conflicts. BugNet [48] is application-level deterministic replay tool. It logs
first-time-load-values it improves FDR’s checkpointing and input logging algorithm.
Recently, Rerun [34] and DeLorean [47] have been proposed. They are very similar
to ReplayT in recording the commit order of atomic blocks to capture a thread
interleaving. ATLAS differs from all the above: it uses the hardware resources in a
TM system track ordering events at transaction granularity in order to reduce runtime
and storage overheads.

64 CHAPTER 5. PRODUCTIVITY TOOLS FOR PARALLEL PROGRAMMING
5.3 AVIO-TM
In conventional shared-memory multi-processors, data races due to missing or improp-
erly placed lock primitives are the dominant type of synchronization bugs. Therefore,
a large number of tools have been developed to provide automated or assisted race de-
tection based on locksets [65, 15], happens-before relationships [22, 51, 55], or hybrid
schemes [54, 56, 78].
TM programs do not suffer from conventional data races when accesses to shared
data are enclosed within transactions. If two transactions operate on the same data,
the TM system detects the conflict and enforces serialization by stalling or rolling
back one of the two. Nevertheless, TM programs may include synchronization bugs
in the form of atomicity violations: two or more operations on some data that should
be executed within a single atomic block were coded so that they execute across two
or more separate transactions. In this case, even with TM support, the correctness of
the program can be compromised if a third transaction that accesses the same data
is serialized between the two.
5.3.1 Atomicity Violation
Figure 5.4 provides a simple example of an atomicity violation. The program uses
multiple threads to read and increase a variable, A. The two operations, reading and
increasing, should execute within a single atomic block, but were coded by the pro-
grammer in separate transactions (atomicity bug). Figure 5.4 (b) shows a correct
execution of two increments to A by threads T0 and T1. Figure 5.4 (c) shows an
incorrect execution where one of the two updates is essentially lost. From the point
of view of the TM system, both executions are correct serializable orders of the trans-
actions specified in the user code. The problem is in the specification of transactions
in the user code.
In TM systems like TCC that continuously execute transactions, all concurrency
bugs show up as atomicity violations since the TM system eliminates data races. Be-
cause atomicity violations occur non-deterministically, it is hard to find out the source
of incorrect executions. Therefore, it is desirable to have a tool that automatically
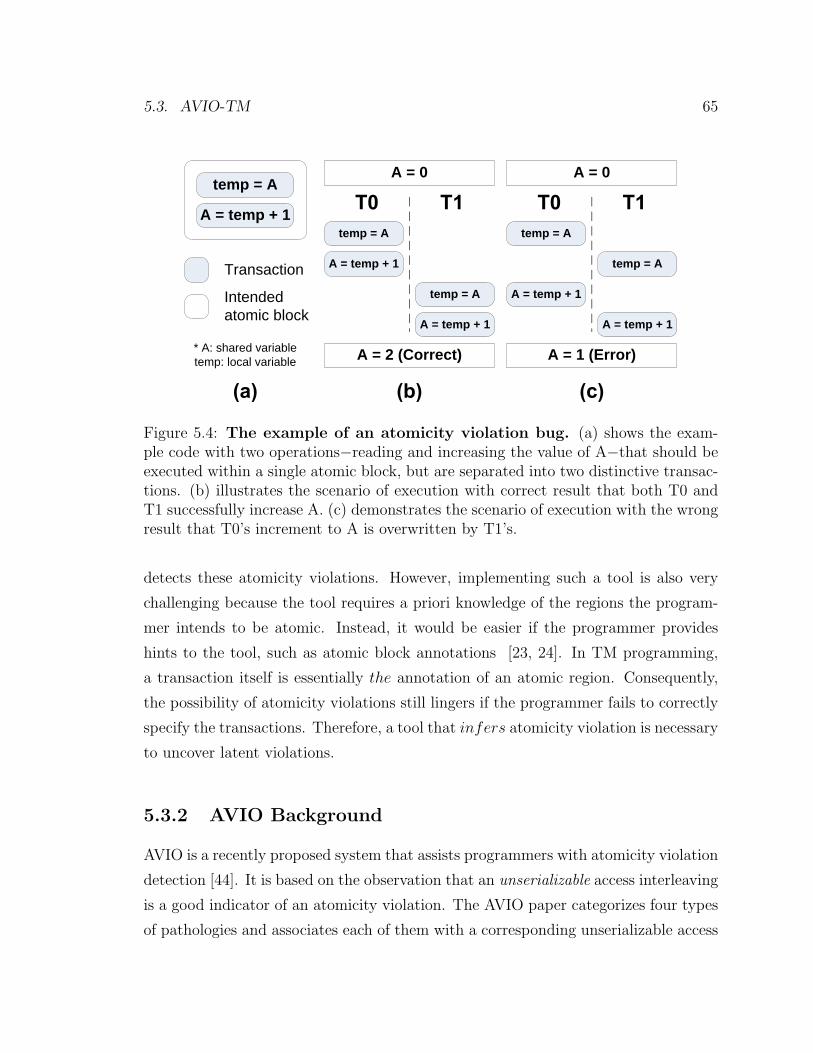
5.3. AVIO-TM 65
temp = A
A = temp + 1
Transaction
Intended atomic block
temp = A
A = temp + 1
temp = A
A = temp + 1
A = 0
A = 2 (Correct)
temp = A
A = temp + 1
temp = A
A = temp + 1
A = 0
A = 1 (Error)* A: shared variabletemp: local variable
Figure 5.4: The example of an atomicity violation bug. (a) shows the exam-ple code with two operations−reading and increasing the value of A−that should beexecuted within a single atomic block, but are separated into two distinctive transac-tions. (b) illustrates the scenario of execution with correct result that both T0 andT1 successfully increase A. (c) demonstrates the scenario of execution with the wrongresult that T0’s increment to A is overwritten by T1’s.
detects these atomicity violations. However, implementing such a tool is also very
challenging because the tool requires a priori knowledge of the regions the program-
mer intends to be atomic. Instead, it would be easier if the programmer provides
hints to the tool, such as atomic block annotations [23, 24]. In TM programming,
a transaction itself is essentially the annotation of an atomic region. Consequently,
the possibility of atomicity violations still lingers if the programmer fails to correctly
specify the transactions. Therefore, a tool that infers atomicity violation is necessary
to uncover latent violations.
5.3.2 AVIO Background
AVIO is a recently proposed system that assists programmers with atomicity violation
detection [44]. It is based on the observation that an unserializable access interleaving
is a good indicator of an atomicity violation. The AVIO paper categorizes four types
of pathologies and associates each of them with a corresponding unserializable access

66 CHAPTER 5. PRODUCTIVITY TOOLS FOR PARALLEL PROGRAMMING
R
R
R
R
R
W
R
W
R
R
W
W
W
R
R
W
R
W
W
W
R
W
W
W
Case 8: PassCase 7: BugCase 6: BugCase 5: Pass
Case 4: BugCase 3: PassCase 2: BugCase 1: Pass
Figure 5.5: AVIO’s indicators. An unserializable access indicates the atomicityviolation. A white circle in each box represents the current access in a local thread;a gray one is a previous local access; and a black one is an interleaved access froma remote thread between a gray and a white one. R represents a read access andW represents a write access. A black arrow indicates which direction to move aninterleaved access in order to achieve equivalent serial accesses.
case. For example, case 1 in Figure 5.5 illustrates a serializable access pattern. It is
serializable because there exists an alternative pattern that avoids interleaving but
produces the same result by re-ordering the remote read access to ahead of the first
local access (as the black arrow indicates). Therefore, the atomicity of two local
accesses is not violated by the remote access, and thus this pattern is not the source
of failure in the buggy run. On the other hand, case 2 in Figure 5.5 illustrates an
access pattern with a write access from a remote thread that cannot be serialized. If
two read accesses in a local thread are interleaved with the remote write access not in
the correct runs but only in the buggy runs, AVIO infers that the two local accesses
were intended to be atomic, but written with an atomicity violation bug.
Given a trace of memory accesses across threads, AVIO performs an analysis that
detects the unserializable accesses. However, programmers often code unserializable
interleaving patterns that are intentional and correct (benign races). Reporting atom-
icity violations in such cases is undesirable since programmers tend to dismiss tools

5.3. AVIO-TM 67
that frequently report false positives. To address this concern, AVIO relies on training
runs that are known to generate the correct output. Any unserializable pattern that
shows up in the training runs is ‘white-listed’ (included in the list of ‘safe’ unserializ-
able patterns). Consequently, if that access pattern is used in a non-training run, it is
not reported to the programmer as an atomicity violation. After a sufficient number
of training runs, AVIO extracts the set of memory addresses that must be serializable
at all times, which it groups as an access interleaving invariant set (AI − Invariant
set). AVIO analyzes the execution in search for unserializable interleaving patterns
only within the AI-invariant set.
5.3.3 AVIO-TM
AVIO-TM is a variation of AVIO for the ATLAS system. Utilizing the fact that, in
the TM systems, threads only interact at transaction granularity, AVIO-TM improves
the original AVIO proposal in following two ways:
Easy collection of global memory access history
The first requirement for AVIO is to capture the trace of memory accesses. To collect
the trace using software, we would have to instrument all of the memory accesses,
which is likely to slow down the application by one or two orders of magnitude. The
software instrumentation overhead not only slows down the data collection process
(25× in AVIO), but also distorts the behavior of the thread interleaving.
An HTM can address this challenge by using the hardware resources for trans-
actional execution. It has a mechanism that tracks memory references within trans-
actions to perform the data versioning and the conflict detection. Moreover, in con-
junction with a deterministic replay tool, such as ReplayT, it can first capture the
behavior of the thread interleaving in the log mode, and collect the trace in the replay
mode while not distorting the original interleaving. Hence, the significant memory
traffic necessary to capture the address trace is guaranteed not to affect thread in-
terleaving. Furthermore, we can collect the memory reference information not by
instrumenting the application code, but by extending the TM API implementation.

68 CHAPTER 5. PRODUCTIVITY TOOLS FOR PARALLEL PROGRAMMING
For the AVIO-TM implementation, we provide a commit handler that scans the TCC
caches before the transaction commits, extracts the addresses read and written by the
transaction, and stores them in memory. While the commit handler will significantly
distort the transaction length, ReplayT maintains the thread interaction.
TM’s isolation property guarantees that there is no interleaved access between
any two accesses to one variable within a transaction. Therefore, AVIO-TM only
needs to collect and analyze the read-set and write-set of transactions, not the entire
trace of the memory accesses. Hence, AVIO-TM collects and analyzes smaller trace
size than the original AVIO scheme thanks to the locality of memory accesses within
transactions.
Fast AI-set Analysis and Convergence
Once the access history is available, AVIO analyzes it to identify potential atomicity
violations. AVIO-TM improves the analysis phase as well. Since access interleaving
is at the granularity of transactions, the number of interleaving permutations that
must be considered is significantly reduced. Hence, the analysis runtime is drastically
reduced. More important, the number of training runs necessary to converge on the
true AI-invariant set is smaller. With our implementation of the TM-based AVIO
tool, we observed that one or two training runs were sufficient for converging to a
small AI-invariant set in our benchmark applications. To some extent, this was not
surprising for loop-based applications. For non-iterative applications, a programmer
can use the unique replay feature to produce a large number of distinct training runs
for fast convergence to the true AI-invariant set.
5.3.4 Intermediate-write Detector
Even though AVIO-TM is faster, there are also accuracy issues to consider and ad-
dress.
The AVIO indicators shown in Figure 5.5 can be condensed into two main cat-
egories: break-in write (cases 2, 4, and 6) and intermediate-write leakage (case 7).
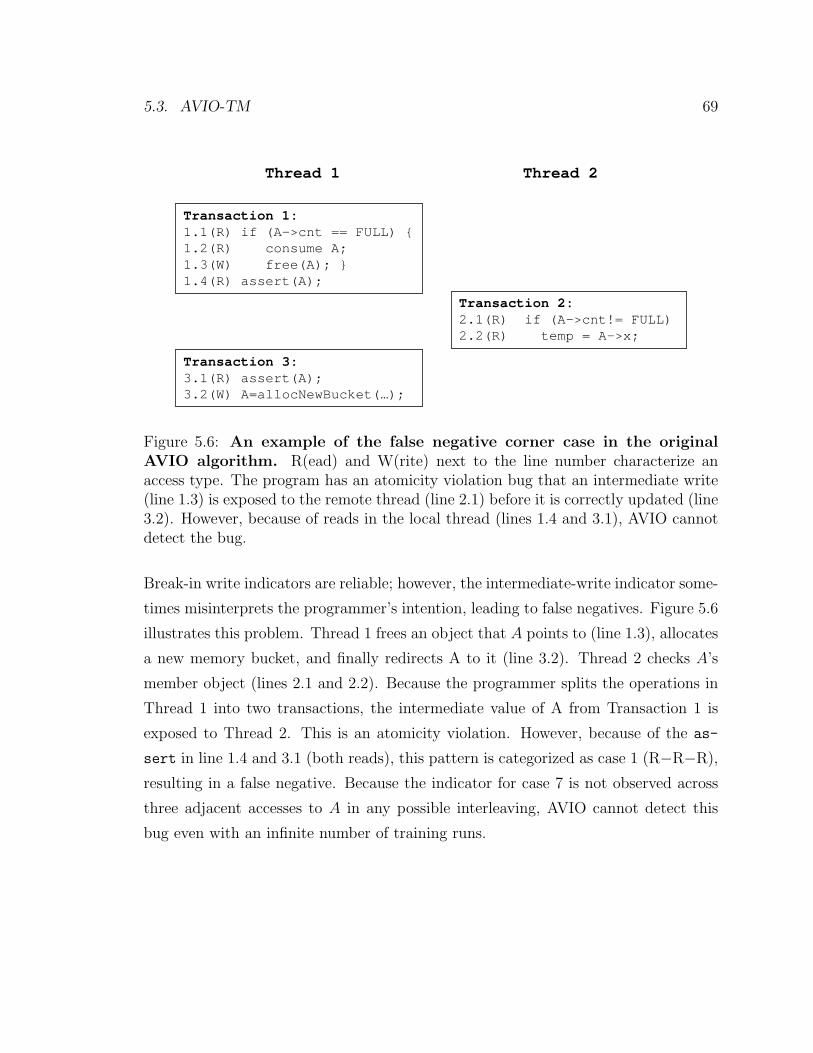
5.3. AVIO-TM 69
Transaction 1:
1.1(R) if (A->cnt == FULL) {
1.2(R) consume A;
1.3(W) free(A); }
1.4(R) assert(A);
Transaction 3:
3.1(R) assert(A);
3.2(W) A=allocNewBucket(…);
Transaction 2:
2.1(R) if (A->cnt!= FULL)
2.2(R) temp = A->x;
Thread 1 Thread 2
Figure 5.6: An example of the false negative corner case in the originalAVIO algorithm. R(ead) and W(rite) next to the line number characterize anaccess type. The program has an atomicity violation bug that an intermediate write(line 1.3) is exposed to the remote thread (line 2.1) before it is correctly updated (line3.2). However, because of reads in the local thread (lines 1.4 and 3.1), AVIO cannotdetect the bug.
Break-in write indicators are reliable; however, the intermediate-write indicator some-
times misinterprets the programmer’s intention, leading to false negatives. Figure 5.6
illustrates this problem. Thread 1 frees an object that A points to (line 1.3), allocates
a new memory bucket, and finally redirects A to it (line 3.2). Thread 2 checks A’s
member object (lines 2.1 and 2.2). Because the programmer splits the operations in
Thread 1 into two transactions, the intermediate value of A from Transaction 1 is
exposed to Thread 2. This is an atomicity violation. However, because of the as-
sert in line 1.4 and 3.1 (both reads), this pattern is categorized as case 1 (R−R−R),
resulting in a false negative. Because the indicator for case 7 is not observed across
three adjacent accesses to A in any possible interleaving, AVIO cannot detect this
bug even with an infinite number of training runs.
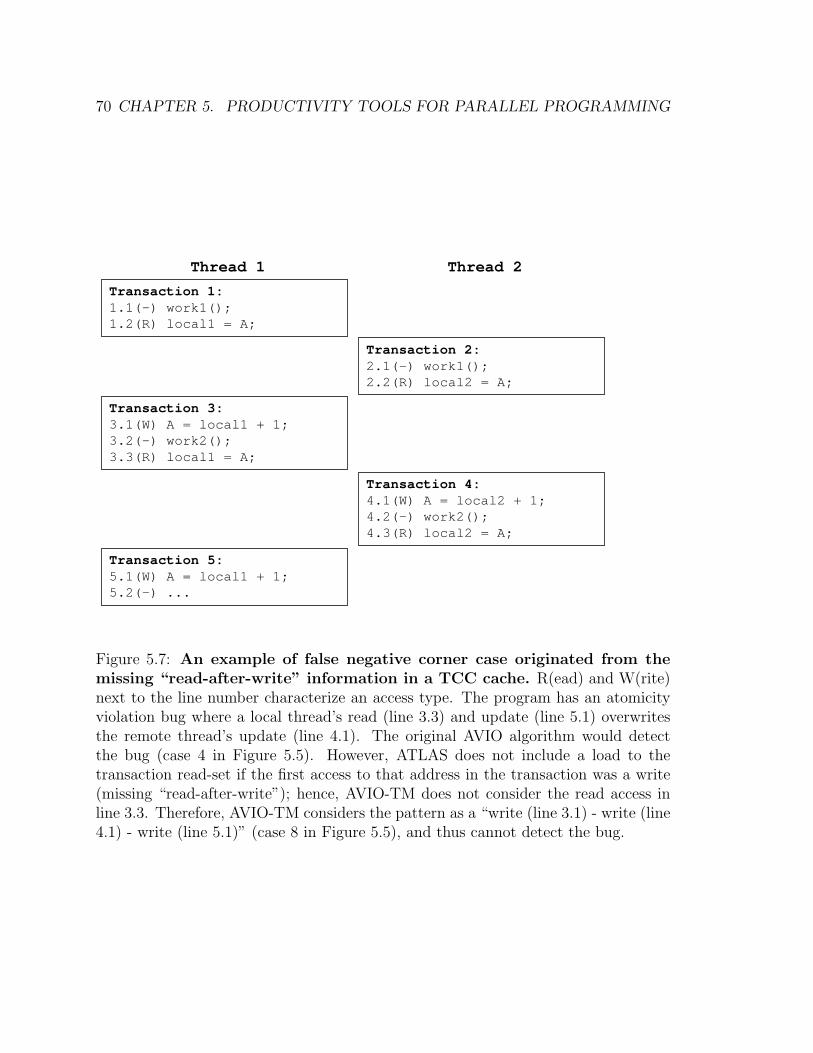
70 CHAPTER 5. PRODUCTIVITY TOOLS FOR PARALLEL PROGRAMMING
Transaction 1:
1.1(-) work1();
1.2(R) local1 = A;
Thread 1 Thread 2
Transaction 3:
3.1(W) A = local1 + 1;
3.2(-) work2();
3.3(R) local1 = A;
Transaction 5:
5.1(W) A = local1 + 1;
5.2(-) ...
Transaction 2:
2.1(-) work1();
2.2(R) local2 = A;
Transaction 4:
4.1(W) A = local2 + 1;
4.2(-) work2();
4.3(R) local2 = A;
Figure 5.7: An example of false negative corner case originated from themissing “read-after-write” information in a TCC cache. R(ead) and W(rite)next to the line number characterize an access type. The program has an atomicityviolation bug where a local thread’s read (line 3.3) and update (line 5.1) overwritesthe remote thread’s update (line 4.1). The original AVIO algorithm would detectthe bug (case 4 in Figure 5.5). However, ATLAS does not include a load to thetransaction read-set if the first access to that address in the transaction was a write(missing “read-after-write”); hence, AVIO-TM does not consider the read access inline 3.3. Therefore, AVIO-TM considers the pattern as a “write (line 3.1) - write (line4.1) - write (line 5.1)” (case 8 in Figure 5.5), and thus cannot detect the bug.

5.3. AVIO-TM 71
procedure Intermediate−write Analyzer
1: All writes to shared variables are INTERMEDIATE by default2: for all transactions in program do3: I ← current transaction4: for all addresses in transaction write-set do5: A← current memory address6: P ← last transaction wrote to the address7: if A in P is OFFICIAL then8: continue;9: end if
10: for all interleaved transactions between P and I do11: R← interleaved transaction12: if A is in read-set of R then13: set A in P to OFFICIAL; break;14: else if A is in write-set of R then15: break;16: end if17: end for18: end for19: end for
Figure 5.8: The algorithm of the intermediate-write detector.
Furthermore, our TM-based AVIO introduces another false negative case. ATLAS
does not include a load to the transaction read-set if the first access to that address
in the transaction was a write. Therefore, what we collect from the TCC cache is
actually a subset of the entire read-set. Figure 5.7 shows the false negative case
caused by this issue. Thread 1 and Thread 2 increase the global variable, A, by 1
after some local workload (work1 and work2). The programmer meant to enclose each
workload with one increment operation in a single transaction, but instead produced
the transaction decomposition in Figure 5.7 that violates atomicity. The sequence of
read (line 3.3), write (line 4.1), and write (line 5.1) to A is correctly detected as a
bug in the original AVIO. In our implementation, the read access in line 3.3 is not
available because the transaction starts with a write to A in line 3.1. Hence, a false
negative is produced.
72 CHAPTER 5. PRODUCTIVITY TOOLS FOR PARALLEL PROGRAMMING
Both cases of false negatives are related to intermediate-write leakage between
transactions. Hence, we developed an additional analysis tool, the intermediate-write
analyzer, that automatically parses the memory access history and detects interme-
diate writes that are committed across transactional boundaries. Figure 5.8 presents
the analysis algorithm. The tool determines whether a write is either intermediate
or official. A write is intermediate if a local thread overwrites the address before a
remote thread reads it, or if a remote thread overwrites the address before a remote
thread reads it. Otherwise, the tool marks it as official, if a remote thread reads the
address before either a local or remote thread overwrites it. The tool marks all writes
to the shared variables as intermediate by default. Then, it analyzes transactions in
the global commit order available in the execution trace. For each write access address
(A) of the currently analyzed transaction (I), it first finds out the last transaction
that wrote to the address in the local thread (P ). If the address is already marked as
official, it skips the rest of steps. Otherwise, the tool scans through the interleaved
remote transactions (R) between P and I to find out the first remote access. If it is
a read, the tool marks it as official. The analysis time is proportional to both the
total number of transactions and the total number of memory accesses in the worst
case analysis, which has the same asymptotic complexity as AVIO analysis.
The new analysis tool can identify the false negative in the AVIO analysis de-
scribed in Figure 5.6. Note, however, that it does not replace AVIO since it cannot
detect other bug cases. Consequently, these two tools must be used in a comple-
mentary fashion on each memory access history recorded. The intermediate-write
analyzer addresses the false negative introduced by our TM-based implementation of
AVIO (see Figure 5.7). The tool only needs to know writes in the local thread and if
the first access from the remote thread is a read before it is overwritten. Therefore,
the tool does not need to consider a read access that occurs after an initial write to
the same address at the beginning of the transaction.
Just like AVIO, the intermediate-write analyzer can report false positives. We
eliminate them using the same approach: white-listing of official intermediate writes
detected in training writes. On a buggy run, we report to the programmer all inter-
mediate runs marked as official.
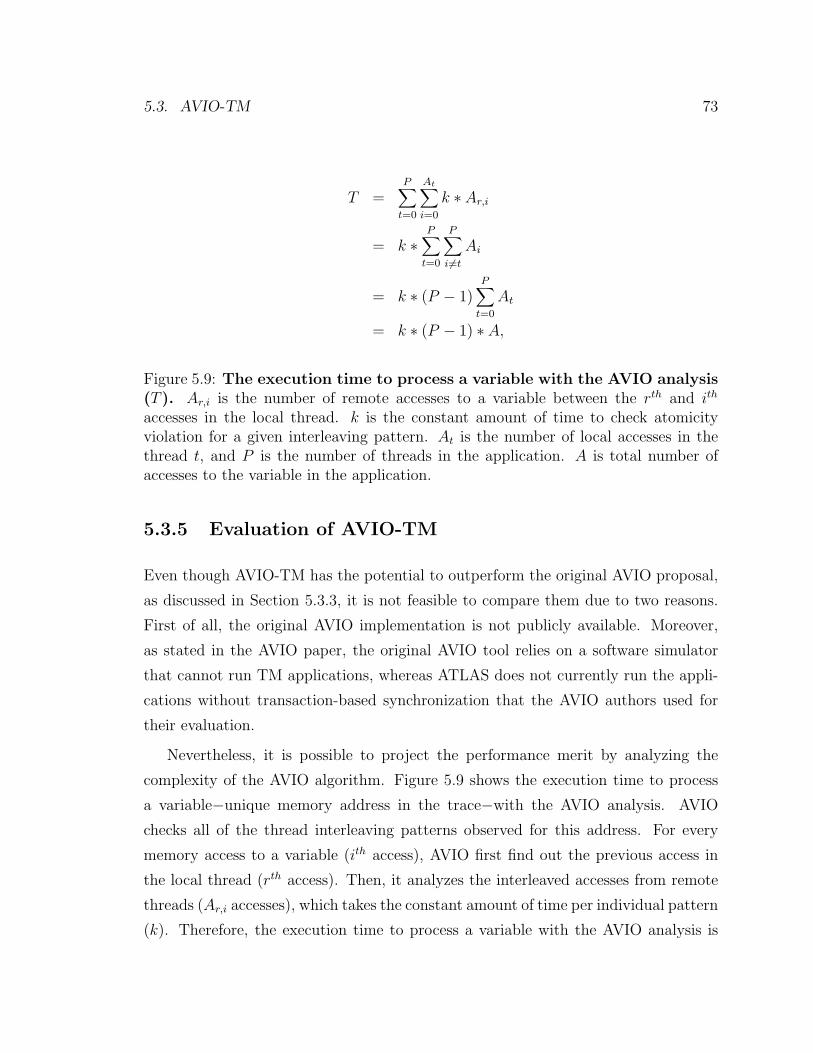
5.3. AVIO-TM 73
T =P∑
t=0
At∑i=0
k ∗ Ar,i
= k ∗P∑
t=0
P∑i6=t
Ai
= k ∗ (P − 1)P∑
t=0
At
= k ∗ (P − 1) ∗ A,
Figure 5.9: The execution time to process a variable with the AVIO analysis(T ). Ar,i is the number of remote accesses to a variable between the rth and ith
accesses in the local thread. k is the constant amount of time to check atomicityviolation for a given interleaving pattern. At is the number of local accesses in thethread t, and P is the number of threads in the application. A is total number ofaccesses to the variable in the application.
5.3.5 Evaluation of AVIO-TM
Even though AVIO-TM has the potential to outperform the original AVIO proposal,
as discussed in Section 5.3.3, it is not feasible to compare them due to two reasons.
First of all, the original AVIO implementation is not publicly available. Moreover,
as stated in the AVIO paper, the original AVIO tool relies on a software simulator
that cannot run TM applications, whereas ATLAS does not currently run the appli-
cations without transaction-based synchronization that the AVIO authors used for
their evaluation.
Nevertheless, it is possible to project the performance merit by analyzing the
complexity of the AVIO algorithm. Figure 5.9 shows the execution time to process
a variable−unique memory address in the trace−with the AVIO analysis. AVIO
checks all of the thread interleaving patterns observed for this address. For every
memory access to a variable (ith access), AVIO first find out the previous access in
the local thread (rth access). Then, it analyzes the interleaved accesses from remote
threads (Ar,i accesses), which takes the constant amount of time per individual pattern
(k). Therefore, the execution time to process a variable with the AVIO analysis is

74 CHAPTER 5. PRODUCTIVITY TOOLS FOR PARALLEL PROGRAMMING
as the first line in Figure 5.9. The equation is simplified on the second line; the
summation of the number of interleaved remote accesses for each local access in the
thread t is same as the total number of remote accesses from thread t’s perspective
(∑At
i=0 Ar,i =∑P
i6=t Ai). Moreover, the equation becomes simpler on the third line; the
number of local access in one thread (At) contributes P − 1 times to the total sum,
since accesses in one thread is considered as remote threads by other P − 1 threads.
Therefore, the total sum becomes proportional to the total number of accesses (A)
as well as the number of threads (minus one).
In summary, AVIO analysis time is proportional to the total number of accesses
(A) to the variable in the application. In the experiment with the 8 benchmark
applications, we compared the total number of memory accesses (A in the original
AVIO analysis) with the sum of read-set and write-set sizes in each transaction (A in
the AVIO-TM analysis). On average, AVIO-TM compacts the trace size by 12 folds.
Therefore, AVIO-TM performs faster analysis than the original AVIO.
5.4 TAPE
While transactional memory makes it easier to correctly write a parallel program, the
program may still suffer from performance bottlenecks. Specifically, frequent conflicts
between transactions and capacity overflows in the caches that maintain transactional
metadata can serialize execution [27]. To help the user identify the most significant
bottlenecks, ATLAS includes a profiler framework, called TAPE (Transactional Ap-
plication Profiling Environment), that utilizes performance counters built into the
PowerPC cores and additional counters and filters introduced in the TCC cache. Al-
though it provides similar features to the original TAPE proposal [13], the ATLAS
implementation uses less hardware and relies more on software handlers and data
structures. Section 5.4.3 shows that the profiling overhead is small despite the lack
of the hardware buffers and logic described in [13].
TAPE hardware tracks the occurrence of all transactional conflicts and overflows,
the corresponding instruction and data references that triggered them, and an ap-
proximation of their cost in clock cycles. The profiler software uses this information
5.4. TAPE 75
to identify the most important problems across the whole program execution and
pinpoint the offending variables and/or lines in the user source code. The accurate
feedback of performance bottlenecks allows programmers to quickly tune their appli-
cations as they can focus on important issues and avoid the need to understand the
whole application.
5.4.1 TAPE Conflict Profiling
A TM system maintains atomicity and isolation by detecting conflicts across concur-
rently executing transactions. Conflicts are handled by rolling back and restarting
transactions, wasting any work performed by the transaction thus far. Conflicts are
indicative of true or false sharing between transactions. A programmer can often
restructure the code to avoid some of the most expensive conflicts. The program-
mer can reduce these conflicts by resizing transactions, changing the layout or access
order of important data structures, and using other schemes that reduce communica-
tion across threads, such as privatization or the introduction of reduction variables.
The use of finer-grain transactions typically reduces the overhead of conflicts as the
amount of work wasted is minimized. However, programmers must be careful to avoid
introducing atomicity violations or transactions that are too small to amortize the
cost of starting and committing them.
To effectively apply such optimizations, the programmer needs to know which two
transactions and which shared objects are involved in the conflict, and some measure
of the significance of the conflict. A hardware TM tracks most of these information
to maintain atomicity and isolation, and remaining information can be obtained by
minimally modifying both hardware and software. A local thread ID and the address
of a conflicting shared object are available. We can collect a committing thread ID
by piggybacking a thread ID to a commit message. It requires an extension in the
commit controller of the TCC cache. The significance factors, such as wasted cycles
and occurrence frequency, can be easily managed in software.
TAPE first collects information about the most significant conflict in a transac-
tion. When a conflict occurs, the TAPE software library collects information, such
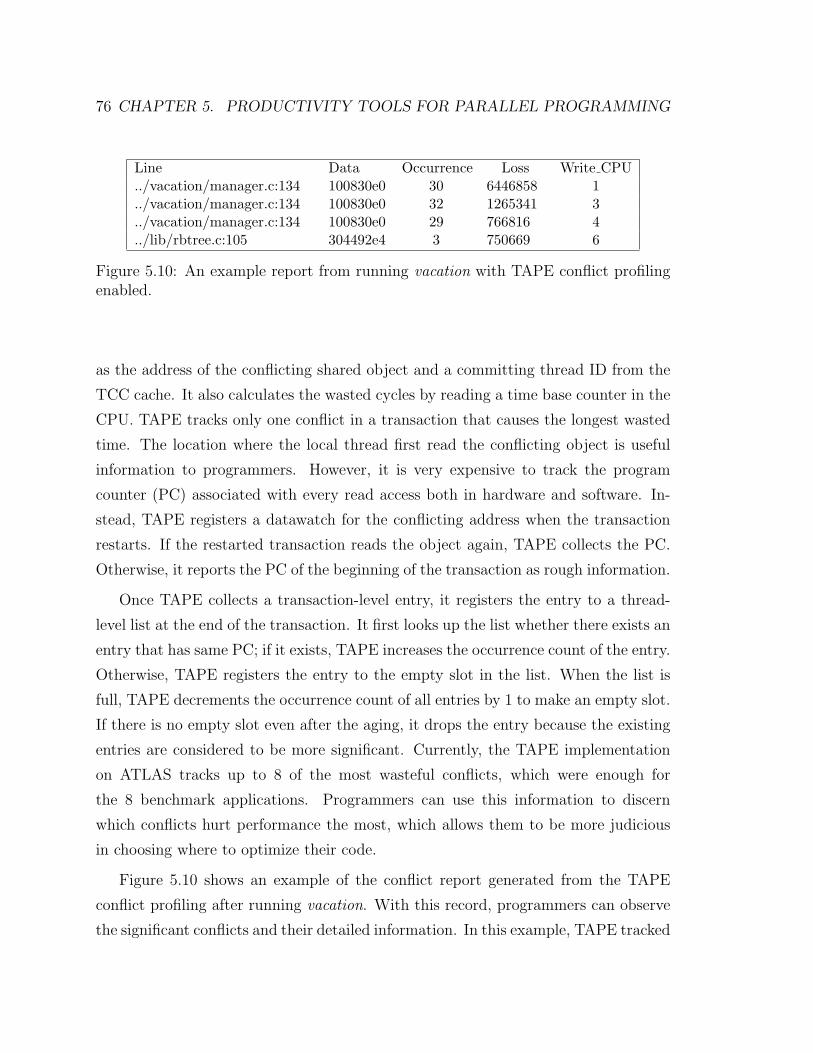
76 CHAPTER 5. PRODUCTIVITY TOOLS FOR PARALLEL PROGRAMMING
Line Data Occurrence Loss Write CPU../vacation/manager.c:134 100830e0 30 6446858 1../vacation/manager.c:134 100830e0 32 1265341 3../vacation/manager.c:134 100830e0 29 766816 4../lib/rbtree.c:105 304492e4 3 750669 6
Figure 5.10: An example report from running vacation with TAPE conflict profilingenabled.
as the address of the conflicting shared object and a committing thread ID from the
TCC cache. It also calculates the wasted cycles by reading a time base counter in the
CPU. TAPE tracks only one conflict in a transaction that causes the longest wasted
time. The location where the local thread first read the conflicting object is useful
information to programmers. However, it is very expensive to track the program
counter (PC) associated with every read access both in hardware and software. In-
stead, TAPE registers a datawatch for the conflicting address when the transaction
restarts. If the restarted transaction reads the object again, TAPE collects the PC.
Otherwise, it reports the PC of the beginning of the transaction as rough information.
Once TAPE collects a transaction-level entry, it registers the entry to a thread-
level list at the end of the transaction. It first looks up the list whether there exists an
entry that has same PC; if it exists, TAPE increases the occurrence count of the entry.
Otherwise, TAPE registers the entry to the empty slot in the list. When the list is
full, TAPE decrements the occurrence count of all entries by 1 to make an empty slot.
If there is no empty slot even after the aging, it drops the entry because the existing
entries are considered to be more significant. Currently, the TAPE implementation
on ATLAS tracks up to 8 of the most wasteful conflicts, which were enough for
the 8 benchmark applications. Programmers can use this information to discern
which conflicts hurt performance the most, which allows them to be more judicious
in choosing where to optimize their code.
Figure 5.10 shows an example of the conflict report generated from the TAPE
conflict profiling after running vacation. With this record, programmers can observe
the significant conflicts and their detailed information. In this example, TAPE tracked

5.4. TAPE 77
4 conflicts and sorted them by the significance of conflicts ( Loss). Line shows
the location where the application reads the object ( Data) that conflicts with a
remote thread ( Write CPU). Both Occurrence and Loss indicate the significance
of conflicts: Occurrence represents the number of conflicts that the application
encountered in the location, and Loss shows the maximum wasted cycles among
the conflicts. It is noticeable that top three entries point to the same Line. It is
because multiple program counter (PC) values that TAPE collected in the runtime
were translated into one line in the source code.
5.4.2 TAPE Overflow Profiling
The TCC hardware buffers read and write state in the L1 cache during the execution
of a transaction. At commits, it flushes the write-set state to memory. In some situa-
tions, transactions with a large read and/or write states may overflow the capacity of
the hardware cache, at which point the transaction needs to flush its speculative set.
In ATLAS, we give the highest priority to an overflowing transaction, which guaran-
tees that it will not be rolled back. Hence, it acquires the commit token and safely
flushes its state to memory. For the remainder of its execution, it preserves the com-
mit token in order to avoid atomicity violations. Consequently, other transactions are
unable to commit, potentially serializing the system. Other overflow handling schemes
have been proposed that do not serialize commits, namely by storing transactional
state in main memory [7] or virtual memory [59, 17, 16, 9]. Nevertheless, overflows
are expensive in terms of performance since they require additional software/firmware
handlers, more main memory accesses, or page table operations.
For ATLAS, the most costly overflows are those that occur far away from the
commit point since other transactions are prevented from committing for a long time.
Reducing overflows involves using finer-grain transactions that fit in hardware caches
in most cases. If the overflow occurs inside a parallel loop, the programmer can
re-chunk the loop or perform loop fission [74]. Overflows occurring inside a forked
region can be fixed by splitting the transaction into multiple smaller transactions,
while being careful not to introduce atomicity violations.
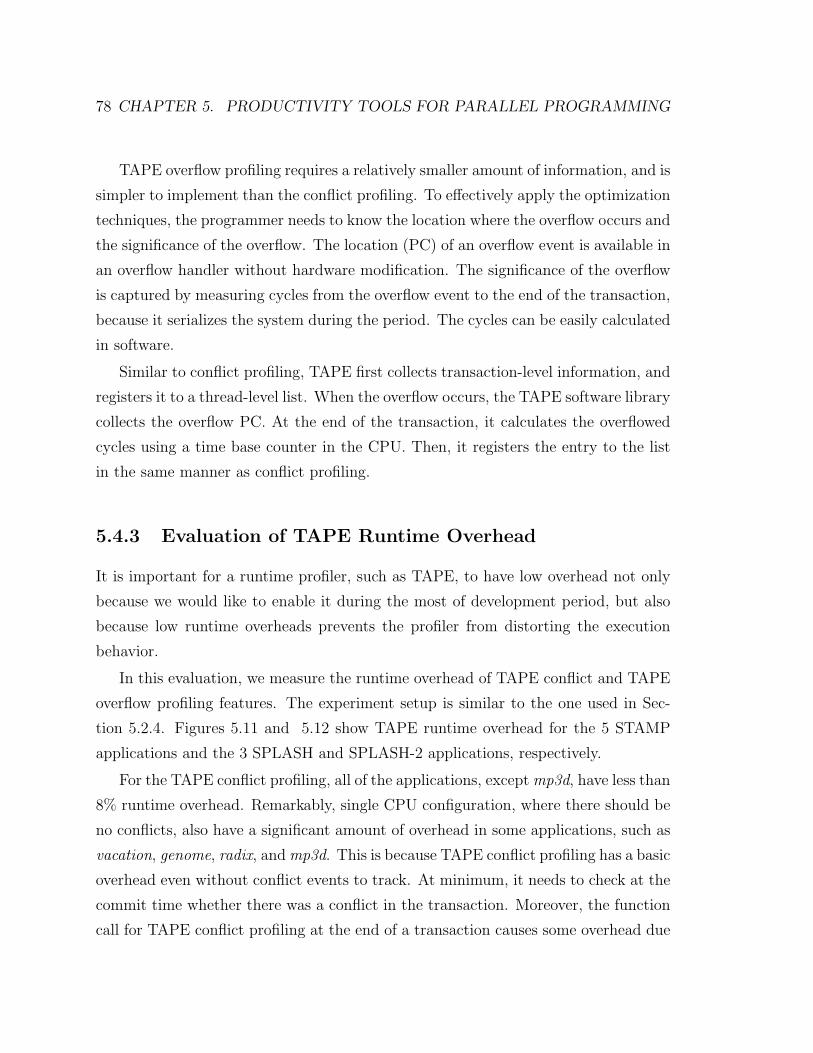
78 CHAPTER 5. PRODUCTIVITY TOOLS FOR PARALLEL PROGRAMMING
TAPE overflow profiling requires a relatively smaller amount of information, and is
simpler to implement than the conflict profiling. To effectively apply the optimization
techniques, the programmer needs to know the location where the overflow occurs and
the significance of the overflow. The location (PC) of an overflow event is available in
an overflow handler without hardware modification. The significance of the overflow
is captured by measuring cycles from the overflow event to the end of the transaction,
because it serializes the system during the period. The cycles can be easily calculated
in software.
Similar to conflict profiling, TAPE first collects transaction-level information, and
registers it to a thread-level list. When the overflow occurs, the TAPE software library
collects the overflow PC. At the end of the transaction, it calculates the overflowed
cycles using a time base counter in the CPU. Then, it registers the entry to the list
in the same manner as conflict profiling.
5.4.3 Evaluation of TAPE Runtime Overhead
It is important for a runtime profiler, such as TAPE, to have low overhead not only
because we would like to enable it during the most of development period, but also
because low runtime overheads prevents the profiler from distorting the execution
behavior.
In this evaluation, we measure the runtime overhead of TAPE conflict and TAPE
overflow profiling features. The experiment setup is similar to the one used in Sec-
tion 5.2.4. Figures 5.11 and 5.12 show TAPE runtime overhead for the 5 STAMP
applications and the 3 SPLASH and SPLASH-2 applications, respectively.
For the TAPE conflict profiling, all of the applications, except mp3d, have less than
8% runtime overhead. Remarkably, single CPU configuration, where there should be
no conflicts, also have a significant amount of overhead in some applications, such as
vacation, genome, radix, and mp3d. This is because TAPE conflict profiling has a basic
overhead even without conflict events to track. At minimum, it needs to check at the
commit time whether there was a conflict in the transaction. Moreover, the function
call for TAPE conflict profiling at the end of a transaction causes some overhead due
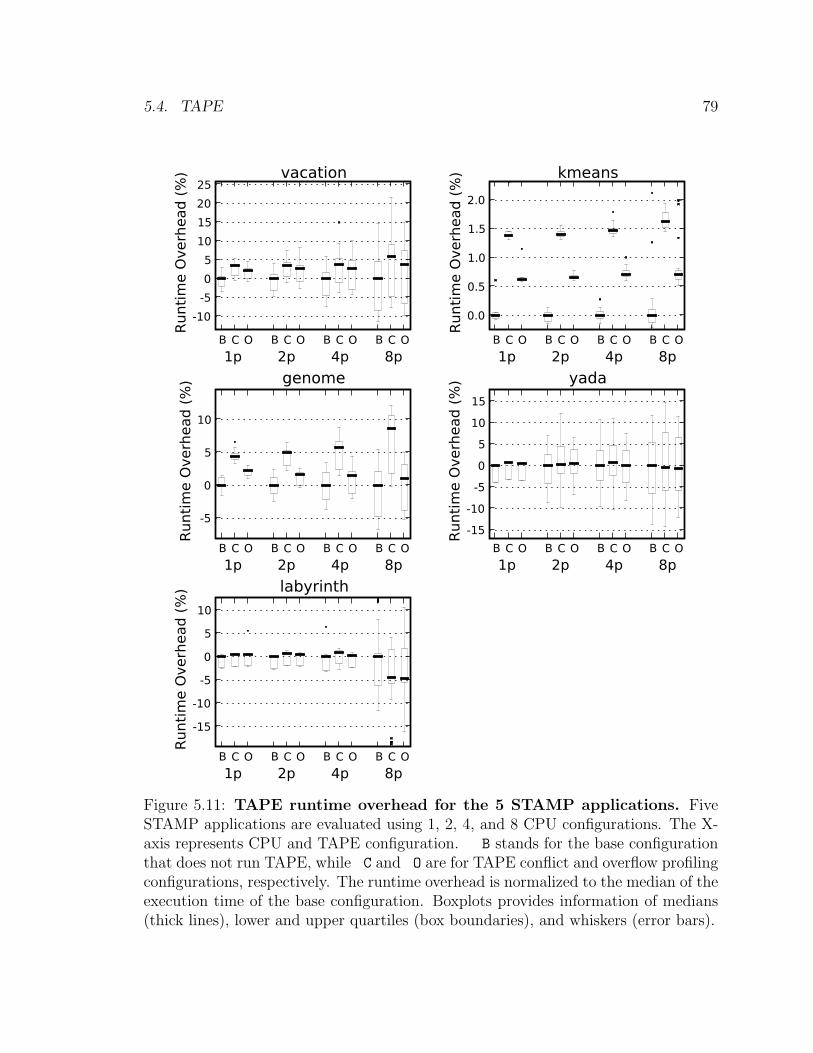
5.4. TAPE 79
B C O B C O B C O B C O
1p 2p 4p 8p
-10
-5
0
5
10
15
20
25R
unti
me O
verh
ead (
%) vacation
B C O B C O B C O B C O
1p 2p 4p 8p
0.0
0.5
1.0
1.5
2.0
Runti
me O
verh
ead (
%) kmeans
B C O B C O B C O B C O
1p 2p 4p 8p
-5
0
5
10
Runti
me O
verh
ead (
%) genome
B C O B C O B C O B C O
1p 2p 4p 8p
-15
-10
-5
0
5
10
15
Runti
me O
verh
ead (
%) yada
B C O B C O B C O B C O
1p 2p 4p 8p
-15
-10
-5
0
5
10
Runti
me O
verh
ead (
%) labyrinth
Figure 5.11: TAPE runtime overhead for the 5 STAMP applications. FiveSTAMP applications are evaluated using 1, 2, 4, and 8 CPU configurations. The X-axis represents CPU and TAPE configuration. B stands for the base configurationthat does not run TAPE, while C and O are for TAPE conflict and overflow profilingconfigurations, respectively. The runtime overhead is normalized to the median of theexecution time of the base configuration. Boxplots provides information of medians(thick lines), lower and upper quartiles (box boundaries), and whiskers (error bars).
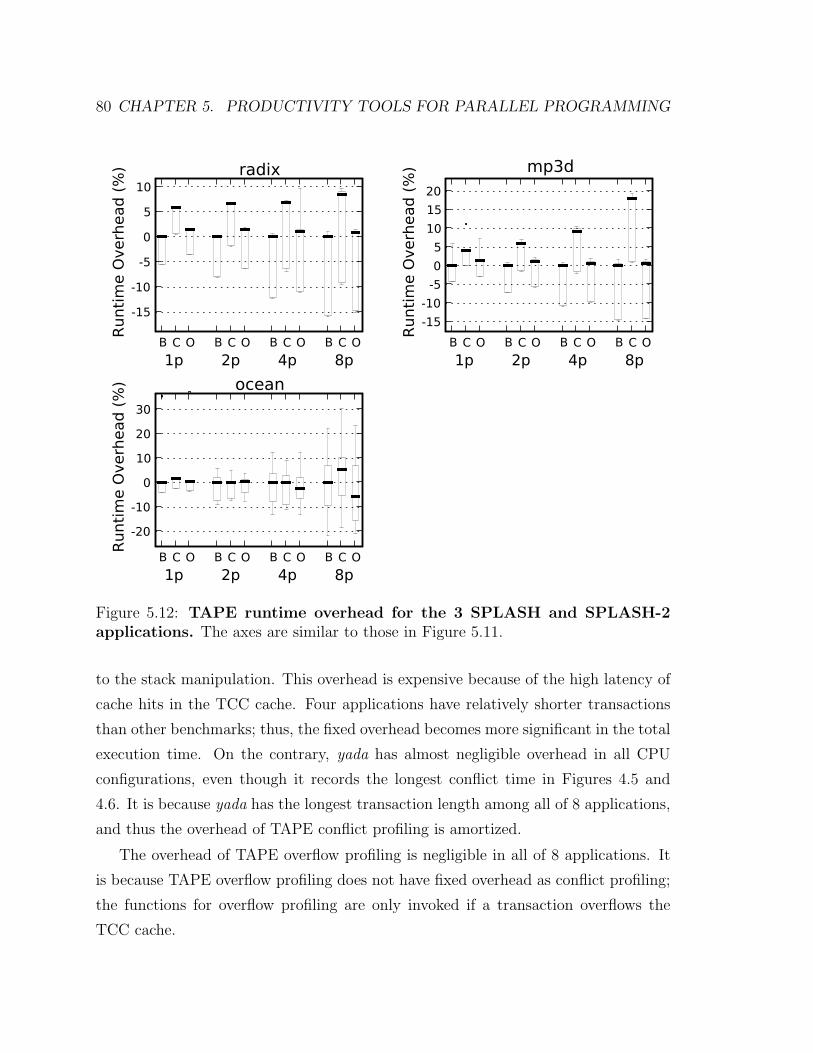
80 CHAPTER 5. PRODUCTIVITY TOOLS FOR PARALLEL PROGRAMMING
B C O B C O B C O B C O
1p 2p 4p 8p
-15
-10
-5
0
5
10
Runti
me O
verh
ead (
%) radix
B C O B C O B C O B C O
1p 2p 4p 8p
-15
-10
-5
0
5
10
15
20
Runti
me O
verh
ead (
%) mp3d
B C O B C O B C O B C O
1p 2p 4p 8p
-20
-10
0
10
20
30
Runti
me O
verh
ead (
%) ocean
Figure 5.12: TAPE runtime overhead for the 3 SPLASH and SPLASH-2applications. The axes are similar to those in Figure 5.11.
to the stack manipulation. This overhead is expensive because of the high latency of
cache hits in the TCC cache. Four applications have relatively shorter transactions
than other benchmarks; thus, the fixed overhead becomes more significant in the total
execution time. On the contrary, yada has almost negligible overhead in all CPU
configurations, even though it records the longest conflict time in Figures 4.5 and
4.6. It is because yada has the longest transaction length among all of 8 applications,
and thus the overhead of TAPE conflict profiling is amortized.
The overhead of TAPE overflow profiling is negligible in all of 8 applications. It
is because TAPE overflow profiling does not have fixed overhead as conflict profiling;
the functions for overflow profiling are only invoked if a transaction overflows the
TCC cache.
5.5. SUMMARY 81
TAPE is a useful tool particularly because it allows programmers to tune an ap-
plication without deeply understanding it. In our experience, ocean initially results
in very frequent overflows that are not seen in a comparable software simulation.
TAPE overflow profiling pointed out that the overflows are originated from a stan-
dard library that emulates floating point operations because the PowerPC 405 is not
equipped with a floating point unit (FPU). These overflows do not occur in the soft-
ware simulator because the simulator models a hardware FPU. We could eliminate
them by replacing the emulation library with hand-optimized version that rarely uses
memory operations [42]. The process did not require us to understand implementation
details of ocean.
5.5 Summary
In this chapter, we presented a set of correctness debugging and performance tuning
tools for parallel programming. ReplayT is a deterministic replay tool that simplifies
the capturing mechanism of thread interleaving by recording the transaction commit
order. It minimizes the space overhead down to 1 byte per transaction, and the
runtime overhead to less than 6% in the log mode. Moreover, it deterministically
replays the logged execution at a comparable speed to the normal execution without
ReplayT. AVIO-TM is an automated violation detector that improves performance
and correctness of the original AVIO proposal. Utilizing the isolation property of TM
systems, it improves the analysis performance by up to an order of magnitude. TAPE
is a light-weight runtime performance bottleneck monitor that tracks data dependency
conflicts and TCC cache overflows. It tracks the 8 most significant performance
bottlenecks per category with less than 8% of runtime overhead.
To demonstrate these tools as well as the ATLAS prototype, we held hands-on
tutorials twice: once in the 34th International Symposium on Computer Architecture
(ISCA 2007) [72] and once in the Thirteenth International Conference on Architectural
Support for Programming Languages and Operating Systems (ASPLOS 2008) [73]
as a part of the RAMP workshop. More than 60 researchers from academia and
industry participated. They first parallelized vacation with transactions. Then, using

82 CHAPTER 5. PRODUCTIVITY TOOLS FOR PARALLEL PROGRAMMING
the profiling features of TAPE, they identified and eliminated the key performance
bottleneck in the code within just a few minutes without the need to understand
7,000 lines of C code in the application. They also used ReplayT to debug one TM
micro-benchmark that had an atomicity violation bug that causes it to behave non-
deterministically. As an interesting anecdote in using ReplayT, 16 groups ran the
same buggy program with the same test dataset that had three potential orderings,
one of which exposed a bug. On the first run, approximately half of them got an
incorrect result, while the rest got a correct result. One group had to repeat the
run six times before seeing an incorrect output. They reported that ReplayT was
particularly useful in debugging a parallel program that they did not know much
about.

Chapter 6
Conclusions
In this dissertation, we address the challenges and exploit the opportunities for TM
in the software development environment. The main contributions are the following:
1. We extend an operating system to work correctly on a hardware TM system.
The practical solution addresses the challenges of running OS on an HTM sys-
tem without compromising atomicity and isolation properties by deploying an
extra CPU dedicated to the OS execution and providing a separate communica-
tion channel between the OS and the application. The updated hardware, cou-
pled with a full-system software stack based on a proxy kernel that orchestrates
the communication between the OS CPU and application CPUs. Overall, the
system provides transactional applications with the services of a full-featured
OS. With the proposed solution, the 8 benchmark applications scale well with-
out comprising atomicity and isolation. Moreover, the single OS CPU scheme
scales up to 32 processors with performance optimizations, such as the service
localization and the OS CPU acceleration.
2. We provide correctness debugging and performance tuning tools that are essen-
tial for parallel programming, such as ReplayT, AVIO-TM, and TAPE. ReplayT
is a deterministic replay tool that simplifies the capturing mechanism of thread
interleaving by recording the transaction commit order. It minimizes the space
overhead down to 1 byte per transaction, and the runtime overhead to less than
83

84 CHAPTER 6. CONCLUSIONS
6% in the log mode. Moreover, it deterministically replays the logged execution
at a comparable speed to the normal execution without ReplayT. AVIO-TM
is an automated violation detector that improves performance and correctness
of the original AVIO proposal. Utilizing the isolation property of TM systems,
it improves the analysis performance by up to an order of magnitude. TAPE
is a light-weight runtime performance bottleneck monitor that tracks data de-
pendency conflicts and TCC cache overflows. It tracks the 8 most significant
performance bottlenecks per category with less than 8% of runtime overhead.
3. We implement and evaluate all of the above on the ATLAS prototype. The
ATLAS prototype uses FPGAs to model the chip multi-processor (CMP) imple-
mentation of the Transactional Coherence and Consistency (TCC) architecture
with 8 processor cores. The ATLAS prototype validates the results from the
comparable software simulator of the TCC architecture and proves that paral-
lel applications written with transactions scale on the TCC architecture [53].
Even though the ATLAS prototype is not the optimal implementation of HTM
features (Section 3.3 explains long latencies in some operations), its application
scalability trend matches well with the one from the software simulator. More-
over, ATLAS provides two to three orders of magnitude better performance than
the comparable software simulator [52]. This performance advantage shortens
the iteration latency of software development; thus, it allows us to use ATLAS
as a software development environment with a full-featured operating system
and large application datasets.
Overall, this dissertation provides the software development environment for the
HTM system that is equipped with full-featured OS support and a rich set of pro-
ductivity tools for correctness debugging and performance tuning. TM application
programmers should benefit from this software environment to accelerate their appli-
cation development.
6.1. FUTURE WORK 85
6.1 Future Work
A user study of parallel programming with transactional memory will be interesting
future work. Transactional memory promises to make parallel programming easier.
However, even after 15 years of transactional memory research [33], there has been no
case study that compares TM programming with conventional parallel programming.
It is because there has been no hardware TM system widely available. Moreover,
we have not had a rich set of productivity tools for TM programming, to make the
comparison fair. From now on, leveraging on the contribution of this thesis, one can
coordinate a user study case, such as a parallel programming competition or a parallel
programming course. This research will be interesting to both the TM community
and its critics.

86 CHAPTER 6. CONCLUSIONS

Bibliography
[1] AMD AthlonTM X2 Dual-Core Processors for Desktop. http://www.amd.com/
us-en/Processors/ProductInformation/0,,30 118 9485 13041,00.html.
[2] ARM11 MPCore. http://www.arm.com/products/CPUs/
ARM11MPCoreMultiprocessor.html.
[3] Fall processor forum: The road to multicore. http://www.instat.com/fpf/05/
index05.htm.
[4] Intel coreTM 2 duo processors. http://www.intel.com/products/processor/
core2duo/index.htm.
[5] A.-R. Adl-Tabatabai, B. Lewis, V. Menon, B. R. Murphy, B. Saha, and T. Shpeis-
man. Compiler and runtime support for efficient software transactional memory.
In PLDI ’06: Proceedings of the 2006 ACM SIGPLAN Conference on Program-
ming Language Design and Implementation, New York, NY, USA, 2006. ACM
Press.
[6] V. Agarwal, M. S. Hrishikesh, S. W. Keckler, and D. Burger. Clock rate versus
IPC: the end of the road for conventional microarchitectures. In Proceedings
of the 27th Annual International Symposium on Computer Architecture, pages
248–259, 2000.
[7] C. S. Ananian, K. Asanovic, B. C. Kuszmaul, C. E. Leiserson, and S. Lie. Un-
bounded Transactional Memory. In Proceedings of the 11th International Sympo-
sium on High-Performance Computer Architecture (HPCA’05), pages 316–327,
San Francisco, California, February 2005.
87
88 BIBLIOGRAPHY
[8] Arvind, K. Asanovic, D. Chiou, J. C. Hoe, C. Kozyrakis, S.-L. Lu, M. Os-
kin, D. Patterson, J. Rabaey, and J. Wawrzynek. RAMP: Research accelerator
for multiple processors - a community vision for a shared experimental parallel
HW/SW platform. Technical report, September 2005.
[9] C. Blundell, J. Devietti, et al. Making the fast case common and the uncommon
case simple in unbounded transactional memory. SIGARCH Computer Archi-
tecture News, 35(2), 2007.
[10] C. Cao Minh, M. Trautmann, J. Chung, A. McDonald, N. Bronson, J. Casper,
C. Kozyrakis, and K. Olukotun. An effective hybrid transactional memory system
with strong isolation guarantees. In Proceedings of the 34th Annual International
Symposium on Computer Architecture. June 2007.
[11] B. D. Carlstrom, A. McDonald, H. Chafi, J. Chung, C. Cao Minh, C. Kozyrakis,
and K. Olukotun. The Atomos Transactional Programming Language. In PLDI
’06: Proceedings of the 2006 ACM SIGPLAN Conference on Programming Lan-
guage Design and Implementation, pages 1–13, New York, NY, USA, June 2006.
ACM Press.
[12] L. Ceze, J. Tuck, P. Montesinos, and J. Torrellas. BulkSC: bulk enforcement of
sequential consistency. In ISCA ’07: Proceedings of the 34th annual international
symposium on Computer architecture, pages 278–289, New York, NY, USA, 2007.
ACM Press.
[13] H. Chafi, C. Cao Minh, A. McDonald, B. D. Carlstrom, J. Chung, L. Hammond,
C. Kozyrakis, and K. Olukotun. TAPE: a transactional application profiling
environment. In ICS ’05: Proceedings of the 19th annual international conference
on Supercomputing, pages 199–208, New York, NY, USA, 2005. ACM.
[14] C. Chang, J. Wawrzynek, and R. W. Brodersen. BEE2: A high-end reconfig-
urable computing system. IEEE Design and Test of Computers, 22(2):114–125,
March/April 2005.

BIBLIOGRAPHY 89
[15] J.-D. Choi, K. Lee, A. Loginov, R. O’Callahan, V. Sarkar, and M. Sridharan.
Efficient and precise datarace detection for multithreaded object-oriented pro-
grams. In PLDI ’02: Proceedings of the ACM SIGPLAN 2002 Conference on
Programming language design and implementation, pages 258–269, New York,
NY, USA, 2002. ACM Press.
[16] W. Chuang, S. Narayanasamy, G. Venkatesh, J. Sampson, M. V. Biesbrouck,
G. Pokam, O. Colavin, and B. Calder. Unbounded page-based transactional
memory. In ASPLOS-XII: Proceedings of the 12th international conference on
Architectural support for programming languages and operating systems. ACM
Press, October 2006.
[17] J. Chung, C. Cao Minh, A. McDonald, H. Chafi, B. D. Carlstrom, T. Skare,
C. Kozyrakis, and K. Olukotun. Tradeoffs in transactional memory virtual-
ization. In ASPLOS-XII: Proceedings of the 12th international conference on
Architectural support for programming languages and operating systems. ACM
Press, October 2006.
[18] P. Damron, A. Fedorova, Y. Lev, V. Luchangco, M. Moir, and D. Nussbaum.
Hybrid transactional memory. In ASPLOS-XII: Proceedings of the 12th interna-
tional conference on Architectural support for programming languages and oper-
ating systems, October 2006.
[19] J. D. Davis, S. E. Richardson, C. Charitsis, and K. Olukotun. A chip prototyping
substrate: the flexible architecture for simulation and testing (fast). volume 33,
pages 34–43. ACM Press, New York, NY, USA, 2005.
[20] D. Dice, O. Shalev, and N. Shavit. Transactional locking II. In DISC’06: Pro-
ceedings of the 20th International Symposium on Distributed Computing, March
2006.
[21] D. Dice and N. Shavit. Understanding tradeoffs in software transactional mem-
ory. In CGO ’07: Proceedings of the International Symposium on Code Genera-
tion and Optimization, March 2007.
90 BIBLIOGRAPHY
[22] A. Dinning and E. Schonberg. An empirical comparison of monitoring algorithms
for access anomaly detection. In PPOPP ’90: Proceedings of the second ACM
SIGPLAN symposium on Principles & practice of parallel programming, pages
1–10, New York, NY, USA, 1990. ACM Press.
[23] C. Flanagan and S. N. Freund. Atomizer: a dynamic atomicity checker for
multithreaded programs. In POPL ’04: Proceedings of the 31st ACM SIGPLAN-
SIGACT Symposium on Principles of Programming Languages, pages 256–267,
New York, NY, USA, 2004. ACM Press.
[24] C. Flanagan and S. Qadeer. A type and effect system for atomicity. In PLDI ’03:
Proceedings of the ACM SIGPLAN 2003 conference on Programming language
design and implementation, pages 338–349, New York, NY, USA, 2003. ACM
Press.
[25] J. Gibson, R. Kunz, D. Felt, M. Horowitz, J. Hennessy, and M. Neinrich. FLASH
vs. (Simulated) FLASH: Closing the simulation loop. In Proceedings of the
27th Annual International Symposium on Computer Architecture, pages 316–
325, June 2000.
[26] L. Hammond, B. D. Carlstrom, V. Wong, M. Chen, C. Kozyrakis, and K. Oluko-
tun. Transactional coherence and consistency: Simplifying parallel hardware and
software. Micro’s Top Picks, IEEE Micro, 24(6), Nov/Dec 2004.
[27] L. Hammond, B. D. Carlstrom, V. Wong, B. Hertzberg, M. Chen, C. Kozyrakis,
and K. Olukotun. Programming with transactional coherence and consistency
(TCC). In ASPLOS-XI: Proceedings of the 11th international conference on
Architectural support for programming languages and operating systems, pages
1–13, New York, NY, USA, October 2004. ACM Press.
[28] R. A. Hankins, G. N. Chinya, J. D. Collins, P. H. Wang, R. Rakvic, H. Wang,
and J. P. Shen. Multiple instruction stream processor. In ISCA ’06: Proceedings
of the 33rd International Symposium on Computer Architecture, pages 114–127,
Washington, DC, USA, 2006. IEEE Computer Society.

BIBLIOGRAPHY 91
[29] T. Harris and K. Fraser. Language support for lightweight transactions. In
OOPSLA ’03: Proceedings of the 18th annual ACM SIGPLAN conference on
Object-oriented programing, systems, languages, and applications, pages 388–
402. ACM Press, 2003.
[30] T. Harris, M. Plesko, A. Shinnar, and D. Tarditi. Optimizing memory trans-
actions. In PLDI ’06: Proceedings of the 2006 ACM SIGPLAN Conference on
Programming Language Design and Implementation, New York, NY, USA, 2006.
ACM Press.
[31] J. L. Hennessy and D. A. Patterson. Computer Architecture: A Quantitative
Approach. Morgan Kaufmann Publishers Inc., San Francisco, CA, USA, 2003.
[32] M. Herlihy, V. Luchangco, M. Moir, and I. William N. Scherer. Software trans-
actional memory for dynamic-sized data structures. In PODC ’03: Proceedings
of the twenty-second annual symposium on Principles of distributed computing,
pages 92–101, New York, NY, USA, July 2003. ACM Press.
[33] M. Herlihy and J. E. B. Moss. Transactional memory: Architectural support for
lock-free data structures. In Proceedings of the 20th International Symposium on
Computer Architecture, pages 289–300, 1993.
[34] D. R. Hower and M. D. Hill. Rerun: Exploiting episodes for lightweight mem-
ory race recording. In ISCA ’08: Proceedings of the 35th annual international
symposium on Computer architecture, New York, NY, USA, 2008. ACM Press.
[35] M. Ito and et. al. Sh-mobileg1: A single-chip application and dual-mode base-
band processor. In Conference Record of Hot Chips 18, August 2006.
[36] R. Kalla, B. Sinharoy, and J. Tendler. Simultaneous multi-threading implemen-
tation in POWER5. In Conference Record of Hot Chips 15 Symposium, Stanford,
CA, August 2003.
[37] S. Kaneko and et. al. A 600-mhz single-chip multiprocessor with 4.8-gb/s internal
shared pipelined bus and 512-kb internal memory. IEEE Journal of Solid-State
Circuits, 39(1):184–193, January 2004.

92 BIBLIOGRAPHY
[38] P. Kongetira, K. Aingaran, and K. Olukotun. Niagara: A 32-way multithreaded
Sparc processor. IEEE Micro, 25(2):21–29, March–April 2005.
[39] S. Kumar, M. Chu, C. J. Hughes, P. Kundu, and A. Nguyen. Hybrid transactional
memory. In PPoPP ’06: Proceedings of the eleventh ACM SIGPLAN symposium
on Principles and practice of parallel programming, New York, NY, USA, March
2006. ACM Press.
[40] H. T. Kung and J. T. Robinson. On optimistic methods for concurrency control.
ACM Transactions on Database Systems, 6(2), June 1981.
[41] J. Larus and R. Rajwar. Transactional Memory. Morgan Claypool Synthesis
Series, 2006.
[42] N. Leeder. Powerpc performance libraries. Sourceforge website:
http://sourceforge.net/projects/ppcperflib.
[43] B. Liblit. An operational semantics for LogTM. Technical Report CS-TR-2006-
1571, University of Wisconsin-Madison, Department of Computer Sciences, Au-
gust 2006.
[44] S. Lu, J. Tucek, F. Qin, and Y. Zhou. AVIO: detecting atomicity violations
via access interleaving invariants. In ASPLOS-XII: Proceedings of the 12th in-
ternational conference on Architectural support for programming languages and
operating systems, pages 37–48, New York, NY, USA, 2006. ACM Press.
[45] J. F. Martınez and J. Torrellas. Speculative synchronization: applying thread-
level speculation to explicitly parallel applications. In ASPLOS-X: Proceedings
of the 10th international conference on Architectural support for programming
languages and operating systems, pages 18–29, New York, NY, USA, October
2002. ACM Press.
[46] A. McDonald, J. Chung, H. Chafi, C. Cao Minh, B. D. Carlstrom, L. Ham-
mond, C. Kozyrakis, and K. Olukotun. Characterization of TCC on Chip-
Multiprocessors. In PACT ’05: Proceedings of the 14th International Conference

BIBLIOGRAPHY 93
on Parallel Architectures and Compilation Techniques, pages 63–74, Washington,
DC, USA, September 2005. IEEE Computer Society.
[47] P. Montesinos, L. Ceze, P. Montesinos, and J. Torrellas. DeLorean: Recording
and Deterministically Replaying Shared-Memory Multiprocessor Execution Ef-
ficiently. In ISCA ’08: Proceedings of the 35th annual international symposium
on Computer architecture, New York, NY, USA, 2008. ACM Press.
[48] S. Narayanasamy, G. Pokam, and B. Calder. Bugnet: Continuously recording
program execution for deterministic replay debugging. In ISCA ’05: Proceedings
of the 32nd annual international symposium on Computer Architecture, pages
284–295, Washington, DC, USA, 2005. IEEE Computer Society.
[49] U. G. Nawathe, M. Hassan, L. Warriner, K. Yen, B. Upputuri, D. G. andAshok
Kumar, and H. Park. An 8-core, 64-thread, 64-bit, power efficient sparc soc. In
Presentation at ISSCC 2007, San Francisco, CA, February 2007.
[50] R. H. B. Netzer. Optimal tracing and replay for debugging shared-memory
parallel programs. In PADD ’93: Proceedings of the 1993 ACM/ONR workshop
on Parallel and distributed debugging, pages 1–11, New York, NY, USA, 1993.
ACM.
[51] R. H. B. Netzer and B. P. Miller. Improving the accuracy of data race detection.
In PPOPP ’91: Proceedings of the third ACM SIGPLAN symposium on Princi-
ples and practice of parallel programming, pages 133–144, New York, NY, USA,
1991. ACM Press.
[52] N. Njoroge. ATLAS: A Platform for Accelerating Transactional Memory Re-
search. PhD thesis, Stanford University, 2008.
[53] N. Njoroge, J. Casper, S. Wee, Y. Teslyar, D. Ge, C. Kozyrakis, and K. Olukotun.
ATLAS: a chip-multiprocessor with transactional memory support. In DATE ’07:
Proceedings of the conference on Design, automation and test in Europe, pages
3–8, New York, NY, USA, 2007. ACM Press.

94 BIBLIOGRAPHY
[54] R. O’Callahan and J.-D. Choi. Hybrid dynamic data race detection. In PPoPP
’03: Proceedings of the ninth ACM SIGPLAN symposium on Principles and
practice of parallel programming, pages 167–178, New York, NY, USA, 2003.
ACM Press.
[55] D. Perkovic and P. J. Keleher. Online data-race detection via coherency guaran-
tees. In OSDI ’96: Proceedings of the second USENIX symposium on Operating
systems design and implementation, pages 47–57, New York, NY, USA, 1996.
ACM Press.
[56] E. Pozniansky and A. Schuster. Efficient on-the-fly data race detection in mul-
tithreaded C++ programs. In PPoPP ’03: Proceedings of the ninth ACM SIG-
PLAN symposium on Principles and practice of parallel programming, pages 179–
190, New York, NY, USA, 2003. ACM Press.
[57] R. Rajwar and J. R. Goodman. Speculative Lock Elision: Enabling Highly
Concurrent Multithreaded Execution. In MICRO 34: Proceedings of the 34th
annual ACM/IEEE International Symposium on Microarchitecture, pages 294–
305. IEEE Computer Society, 2001.
[58] R. Rajwar and J. R. Goodman. Transactional lock-free execution of lock-based
programs. In ASPLOS-X: Proceedings of the 10th international conference on
Architectural support for programming languages and operating systems, pages
5–17, New York, NY, USA, October 2002. ACM Press.
[59] R. Rajwar, M. Herlihy, and K. Lai. Virtualizing Transactional Memory. In ISCA
’05: Proceedings of the 32nd Annual International Symposium on Computer Ar-
chitecture, pages 494–505, Washington, DC, USA, June 2005. IEEE Computer
Society.
[60] H. E. Ramadan, C. J. Rossbach, D. E. Porter, O. S. Hofmann, A. Bhandari, and
E. Witchel. MetaTM/TxLinux: transactional memory for an operating system.
SIGARCH Computer Architecture News, 35(2):92–103, 2007.
BIBLIOGRAPHY 95
[61] P. Rundberg and P. Stenstrom. Reordered speculative execution of critical sec-
tions. In Proceedings of the 2002 International Conference on Parallel Processing,
February 2002.
[62] R. H. Saavedra-Barrera. CPU Performance Evaluation and Execution Time Pre-
diction Using Narrow Spectrum Benchmarking. PhD thesis, EECS Department,
University of California, Berkeley, Feb 1992.
[63] B. Saha, A. Adl-Tabatabai, and Q. Jacobson. Architectural support for soft-
ware transactional memory. In MICRO ’06: Proceedings of the International
Symposium on Microarchitecture, 2006.
[64] B. Saha, A.-R. Adl-Tabatabai, R. L. Hudson, C. Cao Minh, and B. Hertzberg.
McRT-STM: A high performance software transactional memory system for a
multi-core runtime. In PPoPP ’06: Proceedings of the eleventh ACM SIGPLAN
symposium on Principles and practice of parallel programming, New York, NY,
USA, March 2006. ACM Press.
[65] S. Savage, M. Burrows, G. Nelson, P. Sobalvarro, and T. Anderson. Eraser: a
dynamic data race detector for multithreaded programs. ACM Transactions on
Computer Systems, 15(4):391–411, 1997.
[66] N. Shavit and D. Touitou. Software transactional memory. In Proceedings of the
14th Annual ACM Symposium on Principles of Distributed Computing, pages
204–213, Ottawa, Canada, August 1995.
[67] T. Shpeisman, V. Menon, A.-R. Adl-Tabatabai, S. Balensiefer, D. Grossman,
R. L. Hudson, K. Moore, and B. Saha. Enforcing isolation and ordering in
STM. In PLDI ’07: Proceedings of the 2007 ACM SIGPLAN Conference on
Programming Language Design and Implementation, June 2007.
[68] J. P. Singh, W.-D. Weber, and A. Gupta. SPLASH: Stanford Parallel Applica-
tions for Shared-Memory. Computer Architecture News.

96 BIBLIOGRAPHY
[69] D. W. Wall. Limits of instruction-level parallelism. In ASPLOS-IV: Proceedings
of the fourth international conference on Architectural support for programming
languages and operating systems, pages 176–188. ACM Press, 1991.
[70] I. Watson, C. Kirkham, and M. Lujan. A study of a transactional parallel routing
algorithm. In PACT ’07: Proceedings of the 16th International Conference on
Parallel Architecture and Compilation Techniques (PACT 2007), pages 388–398,
Washington, DC, USA, 2007. IEEE Computer Society.
[71] S. Wee, J. Casper, N. Njoroge, Y. Tesylar, D. Ge, C. Kozyrakis, and K. Oluko-
tun. A practical fpga-based framework for novel cmp research. In FPGA ’07:
Proceedings of the 2007 ACM/SIGDA 15th international symposium on Field
programmable gate arrays, pages 116–125, New York, NY, USA, 2007. ACM
Press.
[72] S. Wee and N. Njoroge. Using ATLAS for Performance Tuning and Debugging.
Hands-on tutorial at RAMP Workshop 2007 in conjunction with ISCA 2008,
June 2007.
[73] S. Wee and N. Njoroge. Using ATLAS for Performance Tuning and Debugging.
Hands-on tutorial at RAMP Workshop 2008 in conjunction with ASPLOS XIII,
March 2008.
[74] M. Wolfe. High-Performance Compilers for Parallel Computing. Addison-Wesley,
1995.
[75] S. C. Woo, M. Ohara, E. Torrie, J. P. Singh, and A. Gupta. The SPLASH2
Programs: Characterization and Methodological Considerations. In Proceedings
of the 22nd International Symposium on Computer Architecture, pages 24–36,
June 1995.
[76] M. Xu, R. Bodik, and M. D. Hill. A ”flight data recorder” for enabling full-system
multiprocessor deterministic replay. In ISCA ’03: Proceedings of the 30th annual
international symposium on Computer architecture, pages 122–135, New York,
NY, USA, 2003. ACM Press.
BIBLIOGRAPHY 97
[77] M. Xu, M. D. Hill, and R. Bodik. A regulated transitive reduction (rtr) for longer
memory race recording. In ASPLOS-XII: Proceedings of the 12th international
conference on Architectural support for programming languages and operating
systems, pages 49–60, New York, NY, USA, 2006. ACM Press.
[78] Y. Yu, T. Rodeheffer, and W. Chen. Racetrack: efficient detection of data race
conditions via adaptive tracking. In SOSP ’05: Proceedings of the twentieth
ACM symposium on Operating systems principles, pages 221–234, New York,
NY, USA, 2005. ACM Press.