atlas of sorghum
TRANSCRIPT

© The Board of Regents of the University of Nebraska. All rights reserved. 1
Atlas of Sorghum(Sorghum bicolor (L.) Moench)
Production in Easternand Southern Africa

2 © The Board of Regents of the University of Nebraska. All rights reserved.
Authors
Charles S. Wortmann and Martha Mamo, Department of Agronomy and Horticulture, University of Nebraska-Lincoln, Lincoln, NE, USA
Christopher Mburu, Kenya Agricultural Research Institute, Kakamega, Kenya
Elias Letayo, Agricultural Research Institute – Hombolo, Department of Research and Development, Dodoma, Tanzania
Girma Abebe, Melkassa Agricultural Research Center - Ethiopian Institute of Agricultural Research, Nazareth, Ethiopia
Kaizzi C. Kayuki, Kawanda Agricultural Research Institute - National Agricultural Research Organization, Kampala, Uganda
Medson Chisi, Zambia Agricultural Research Institute, Zambia
Munyaradzi Mativavarira, Zimbabwe Agricultural Research and Extension Services, Zimbabwe
Soares Xerinda, Chokwe Agricultural Research Center, Gaza, Mozambique
Theophile Ndacyayisenga, Institut des Sciences Agronomiques du Rwanda, Rwanda
© 2009,The Board of Regents of the University of Nebraska on behalf of the University of Nebraska–Lincoln. All rights reserved.
MAFSTanzania

© The Board of Regents of the University of Nebraska. All rights reserved. 3
Preface
Grain sorghum (Sorghum bicolor (L.) Moench) is a major crop in many parts of Africa and is noted for its versatility and diversity. It is adapted over a wide range of precipitation and temperature levels and is produced at sea level to above 2000 m altitude. In eastern and southern Africa, it is primarily a crop of resource-poor, small-scale farmers and is typically produced under adverse conditions such as low input use and marginal lands. There are numerous biotic and abiotic constraints to production. The grain and stover are used in many different ways with localized preferences. Much information is needed to effectively address the problems and opportunities of this diverse crop.
The Atlas of Sorghum Production in Eastern and Southern Africa presents information on sorghum in nine countries to serve information needs of researchers, extension and rural development specialists, policy makers, and emergency relief personnel. It accounts for 85% of the sorghum production on an area basis, or 3,400,000 ha, from Ethiopia south to Mozambique with most of the uncovered production in Somalia (FAOSTAT, 2008). Numerous researchers and others knowledgeable of sorghum in their country contributed information and expert opinions for the Atlas. The Atlas presents information in maps and tables for 39 sorghum production areas in nine countries addressing production constraints, cropping systems, management, uses, preferences, gender roles, and marketing.
Acknowledgements
This publication was made possible through support provided to INTSORMIL by the U.S. Agency for International Development, under the terms of Grant No. LAG-G-00-96-900009-00. We thank the numerous researchers and other sorghum specialists who contributed information on sorghum production in their countries. We also thank Mark Strnad for his assistance in creating the map graphics for this publication.

4 © The Board of Regents of the University of Nebraska. All rights reserved.
Table of Contents
Grain Sorghum Production in Nine Countries of Eastern and southern Africa ......................................... 5
Grain Sorghum Production Systems ........................................................................................................ 11
Sorghum Production Constraints ............................................................................................................. 18
Preferred Phenotypic Characteristics of Sorghum Cultivars ................................................................... 27
Gender and Family Roles in Sorghum Production, Post-harvest Handling, and Marketing ................... 33
Sorghum Utilization ................................................................................................................................. 37
Marketing of Sorghum Grain ................................................................................................................... 39
References ................................................................................................................................................ 41
Appendix A. Grain sorghum management. .............................................................................................. 42
Appendix B. Constraints to sorghum production expressed as millions of Mg yr-1 annual yield loss. .... 48 Appendix C. Sorghum utilization and cultivar phenotypic preferences. ................................................. 58
Abbreviations: • SPA, Sorghum Production Area; • ILRI, International Livestock Research Institute.

© The Board of Regents of the University of Nebraska. All rights reserved. 5
The domestication of grain sorghum of the durra race may have occurred before 2000 BC in Ethiopia (Doggett, 1998), but an estimate of 1000 BC is now more widely accepted (Balole and Legwaila, 2006). However, early archaeological evidence for the crop is lacking in Africa while such evidence is much stronger in Arabia and India (Rowley-Conway et al., 1999; Young and Thompson, 1999). Remains of grain of wild sorghum, presumably collected from natural stands for food or irregularly cultivated, have been found in an early Neolithic site in southern Egypt that has been dated as 8,000 years old (Wasylikowa and Dahlberg, 1999). Archaeobotanical work at Aksum in northern Ethiopia found sorghum grain in deposits of 6th to 7th centuries AD, but not in pre-Aksumite deposits that dated to the 5th century BC, while kernels of teff, oat, barley and other crops were found in the early deposits (Boardman, 1999).
Sorghum is the fifth most important cereal globally and the dietary staple of around 500 million people. It is an important food crop in many parts of eastern and southern Africa. Sorghum is tolerant, relative to other major cereal crops, to adverse growing conditions. It is efficient in photosynthesis and in water and nutrient use. Some early-maturing sorghum cultivars require less than two months of rainfall to produce grain, and the species is genetically very diverse with preferred cultivars for different uses.
A constraint to greater demand for grain sorghum as a human food is its nutritional quality. The grain of some cultivars is high in tannin, which blocks the body’s ability to absorb and use protein and other nutritional ingredients. Another nutritional concern is that a large proportion of protein in sorghum grain is prolamine which has low digestibility in humans (Balole and Legwaila, 2006).
The Atlas presents information on sorghum production in eastern and southern Africa to serve the needs of researchers, extension and rural development specialists, policy makers, and emergency relief personnel. It is intended as an aid in prioritization of research and development activities, such as identification of the primary production constraints or most important traits considered by farmers in cultivar selection. The information is useful to regional collaboration between researchers facing similar problems in similar situations. The information is potentially useful in targeting the exchange of sorghum germplasm by matching genotypes to the needs of sorghum production areas (SPAs).
Sources of sorghum production dataCollection, compilation and analysis of sorghum
production data were conducted for nine countries of eastern and southern Africa: Ethiopia, Kenya, Malawi, Mozambique, Rwanda, Tanzania, Uganda, Zambia, and Zimbabwe. The process involved a series of stages: 1) obtaining and processing sorghum production data; 2) delineating SPAs; 3) collecting attribute data for each SPA; 4) analysis of the data; and 5) presentation of results in map and tabular forms. The availability and quality of data varied by country and all estimates reported have some margin of error.
Sorghum production data for Ethiopia were government statistics obtained through ILRI (2002). The data set contained estimates of area, yield and quantity of production at the wereda, a sub-district administrative unit level, for up to five years. Median values of hectares of annual sorghum production for the available years were estimated for each wereda while excluding extreme outliers. When data were unavailable or very inconsistent for a wereda, estimates were made in consideration of information from surrounding weredas and agro-climatic conditions.
Production data for Kenya at the province level was obtained through ILRI (2002) and the area of production was assigned to districts based on the authors’ knowledge of sorghum production in the country. Production estimates by agro-ecological zones and by province were used for Rwanda and Zambia, respectively. A county-level set of data developed by Wortmann and Eledu (1999) was used for Uganda. Estimates of production area by region for Tanzania (Ministry of Agriculture, unpublished) were allocated to districts based on the authors’ knowledge of sorghum production in the country. Estimates of production area by province for Mozambique (Ministry of Agriculture, unpublished) were assigned to districts based on an incomplete set of district data obtained through ILRI (2002), province level estimates, and the authors’ knowledge of sorghum production in the country. For Zimbabwe and Malawi, national production estimates (FAOSTAT, 2008) were used and assigned to production areas based on the authors’ knowledge of sorghum production in the country. National estimates at the regional level were used for Zambia. Detailed data was not obtained for Burundi but Burundi is included in the sorghum distribution map with random distribution of 50,000 ha as estimated by FAO.
Delineation and characterization of sorghum production areas
The authors’ knowledge of sorghum production in the country was applied for a rough determination of the boundaries of SPAs. The delineation of the SPAs
CHAPTER 1.
Grain Sorghum Production in Nine Countries Of Eastern And Southern Africa

6 © The Board of Regents of the University of Nebraska. All rights reserved.
was refined using information on the agroecology, the presence of park and forested areas, the presence of water bodies and wetlands, and the sorghum production data. The SPAs were characterized for latitude, longitude, altitude, and mean temperature and precipitation during the sorghum-growing periods as determined using LocClim 1.0, a local climate estimator (Grieser, 2002).
Co-authors assumed responsibility for collection of data on production constraints, cropping systems, management, uses, preferences, gender roles, and marketing for the SPAs in their countries. Data collection was done through interviews of people recognized as knowledgeable about sorghum production in the country. These resource people included primarily sorghum researchers, but also government staff with extension and/or administrative responsibilities. Interviews were conducted for Ethiopia (6), Kenya (3), Mozambique (7), Rwanda (3), Uganda (12), Tanzania (7), Zambia (3), and Zimbabwe (2), respectively. The responsible co-author reconciled differences in the responses to establish a value for each variable in each SPA.
Distribution of sorghum production in eastern and southern Africa
Some areas have particularly high concentrations of sorghum production (Map 1.1). Areas of greater concentration of sorghum production include much of north central, northwestern and western Ethiopia; the eastern mid-altitude area of Ethiopia; the area to the east of Lake Victoria in Kenya and Tanzania; Rwanda; central Tanzania; and northern and eastern Uganda. The distribution of sorghum production within SPAs
is undoubtedly less uniform than indicated by the production points. The map, however, adequately represents the distribution of sorghum production for national and regional planning and policy formulation needs.
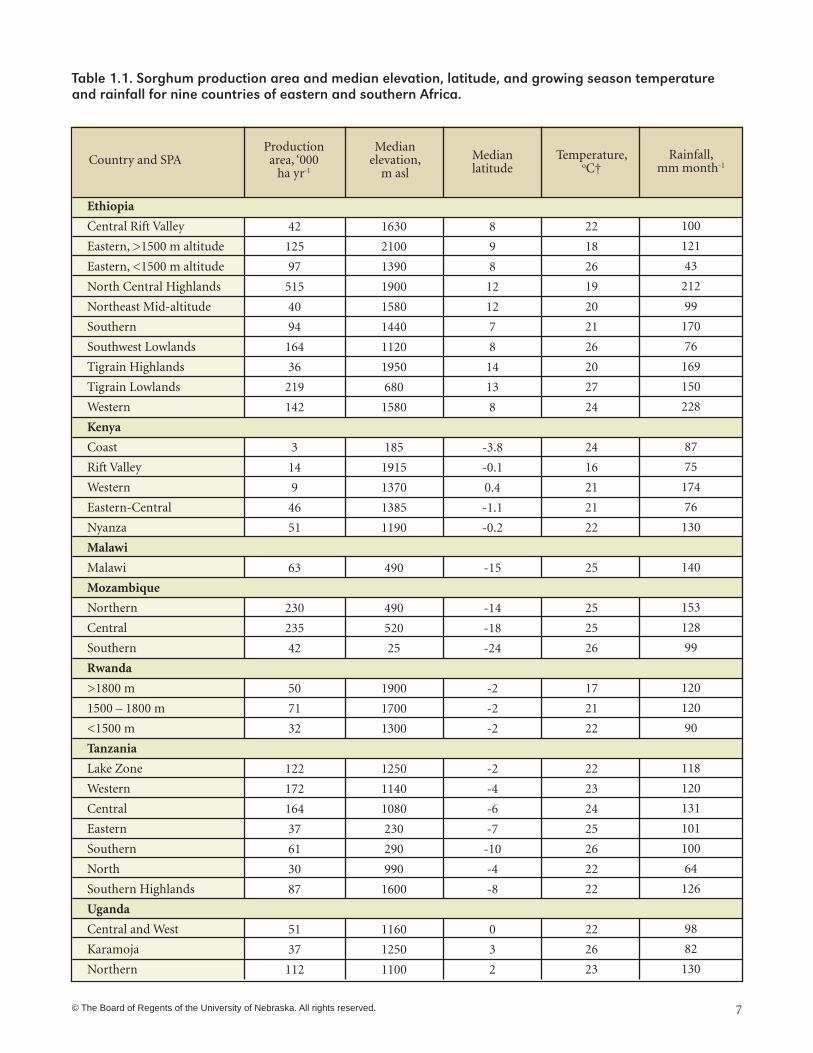
Thirty-nine SPAs were delineated for Ethiopia (10), Kenya (5), Malawi (1), Mozambique (3), Rwanda (3), Uganda (5), Tanzania (7), Zambia (2), and Zimbabwe (3), respectively (Map 1.2). Sorghum production area for the 39 SPAs ranged from 5,000 ha for the Coast Province of Kenya to 515,000 ha for the North Central Highlands of Ethiopia (Table 1).
The results indicate that more than 70% of the sorghum production area is at latitudes greater than six degrees from the equator (Table 1) with implications for photoperiod effects. Approximately 24, 30 and 45% of the sorghum is produced with mean temperatures during the growing season of ≤20˚C, 21-23˚C, and ≥24˚C, respectively. Mean temperature is negatively associated with altitude. Within altitude ranges, temperature is associated with latitude as crop production at the higher latitudes occurs during the warmer, longer day-length months of the year. Approximately 19%, 34% and 47% of the sorghum is produced with mean monthly precipitation during the growing season of <100 mm, 101-130 mm, and >130 mm, respectively. About 35% of the sorghum production area is in especially drought-prone areas where a combination of warm mean temperature (>20˚C) and low mean monthly rainfall (< 120 mm) during the growing season combine to create water-scarce conditions.
© The Board of Regents of the University of Nebraska. All rights reserved. 7
Ethiopia
Central Rift Valley
Eastern, >1500 m altitude
Eastern, <1500 m altitude
North Central Highlands
Northeast Mid-altitude
Southern
Southwest Lowlands
Tigrain Highlands
Tigrain Lowlands
Western
Kenya
Coast
Rift Valley
Western
Eastern-Central
Nyanza
Malawi
Malawi
Mozambique
Northern
Central
Southern
Rwanda
>1800 m
1500 – 1800 m
<1500 m
Tanzania
Lake Zone
Western
Central
Eastern
Southern
North
Southern Highlands
Uganda
Central and West
Karamoja
Northern
Production area, ‘000
ha yr-1
Median elevation,
m asl
Median latitude
8
9
8
12
12
7
8
14
13
8
-3.8
-0.1
0.4
-1.1
-0.2
-15
-14
-18
-24
-2
-2
-2
-2
-4
-6
-7
-10
-4
-8
0
3
2
1630
2100
1390
1900
1580
1440
1120
1950
680
1580
185
1915
1370
1385
1190
490
490
520
25
1900
1700
1300
1250
1140
1080
230
290
990
1600
1160
1250
1100
42
125
97
515
40
94
164
36
219
142
3
14
9
46
51
63
230
235
42
50
71
32
122
172
164
37
61
30
87
51
37
112
Temperature, oC†
22
18
26
19
20
21
26
20
27
24
24
16
21
21
22
25
25
25
26
17
21
22
22
23
24
25
26
22
22
22
26
23
Country and SPA Rainfall,mm month-1
100
121
43
212
99
170
76
169
150
228
87
75
174
76
130
140
153
128
99
120
120
90
118
120
131
101
100
64
126
98
82
130

8 © The Board of Regents of the University of Nebraska. All rights reserved.
South West Highlands
Eastern
Zambia
AEZ I
AEZ II
Zimbabwe
Matabeleland
Masvingo
Mashona East
Production area, ‘000
ha yr-1
Median elevation,
m asl
Median latitude
-1
1
-15
-13
-20
-21
-18
1900
1170
1000
1200
1100
400
1200
32
31
24
19
70
32
17
Temperature, oC†
18
22
25
22
23
25
22
Country and SPA Rainfall,mm month-1
110
98
120
180
80
100
110
† Climate data source: Grieser, 2002.

© The Board of Regents of the University of Nebraska. All rights reserved. 9

10 © The Board of Regents of the University of Nebraska. All rights reserved.
Tigrain Highlands
Tigrain Lowland
Western
Central
Southern
Northern Province
Central Province
Eastern
Northern
Matabele
Masvingo
AEZ I
AEZ II
Malawi
Southern Highlands
Northern
Western
Eastern > 1500m
Eastern < 1500m
NC HighlandsNE Mid-altitude
Southwest
Southern
Rwanda Mid-Elevation
SW Highlands
Burundi
Lake Zone
Rwanda Lowland
Central and West
Rwanda Highland
Shonaland E.
Nyanza Western
Eastern
Eastern-Central
Coastal
Rift Valley
Karamoja
Central Rift Valley
Southern Province

© The Board of Regents of the University of Nebraska. All rights reserved. 11
CHAPTER 2.
Grain Sorghum Production Systems
Grain sorghum production in northern Ethiopia to southern Mozambique spans 38 degrees of latitude. Production occurs from near sea level to above 2000 m in altitude, and in semi-arid to humid conditions. Small-scale, resource-poor farmers, who use it primarily as a staple food for home consumption, produce most grain sorghum. The result is a wide range of cropping systems.
Data collectionInformation about grain sorghum production systems
was obtained by interviewing sorghum specialists in each country as described in Chapter 1. Interviewees assigned a total of 20 points to a list of nine cropping system options. These included sole crop production of sorghum and intercropping with maize, finger millet, pearl millet, common bean, cowpea, pigeon pea, groundnut, or cassava. Allocation of more points indicated more importance for that attribute. No points were allocated if the attribute was considered to be of little or negligible importance in an SPA. In the analysis of the data, each point was considered to be the equivalent of 5% of the annual sorghum area for the SPA.
Interviewees assigned a total of six points for both sowing time and harvest time to the 12 months to indicate the relative importance of the months for sowing and harvest of sorghum. Each point was considered to be the equivalent of 16.7% of the total area sown or harvested annually for the SPA.
Interviewees qualified the level of mechanization of production by allocating six points to indicate the relative importance of manual, draft animal, and tractor power to sorghum production in each SPA. In the analysis of
the data, each point was considered to be the equivalent of 16.7% of the energy used annually for sorghum production.
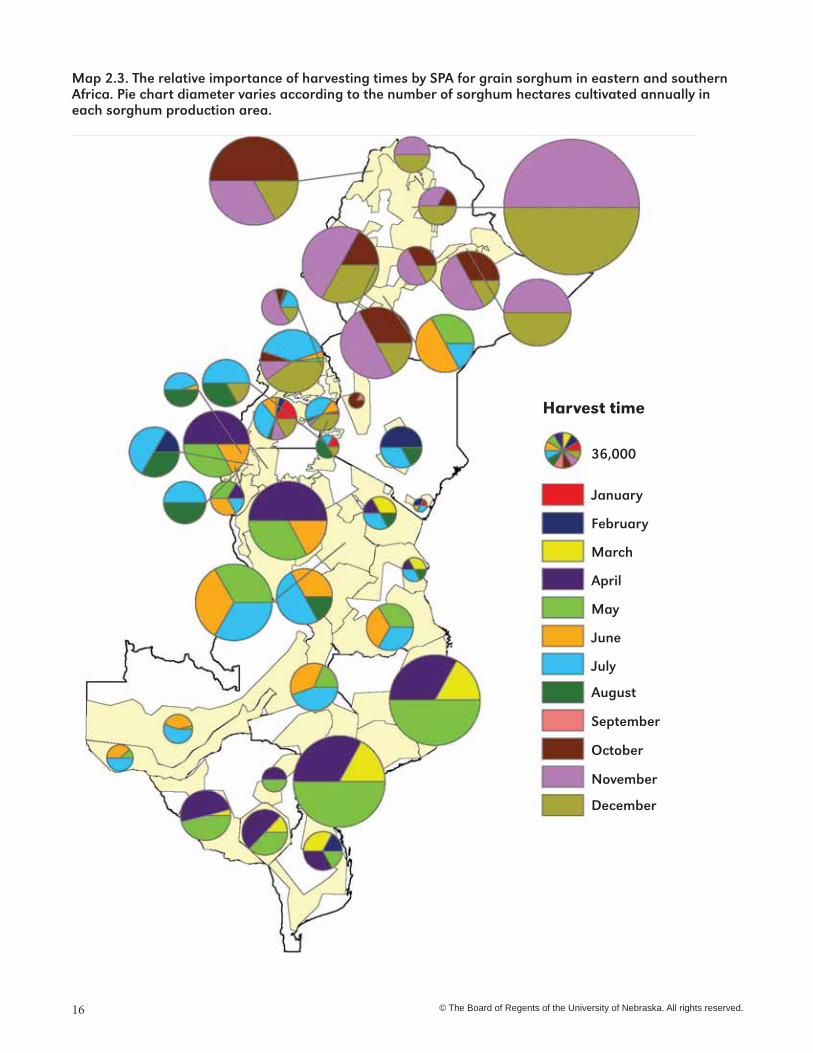
Information by SPA is presented in maps using pie charts for each SPA and in Appendix A. The diameters of the pie charts vary according to the hectares of production in the SPA. The maps were created using ArcGIS 9.0 (ESRI, Redlands, CA).
Cropping systemsMost sorghum (61%) in eastern and southern Africa is
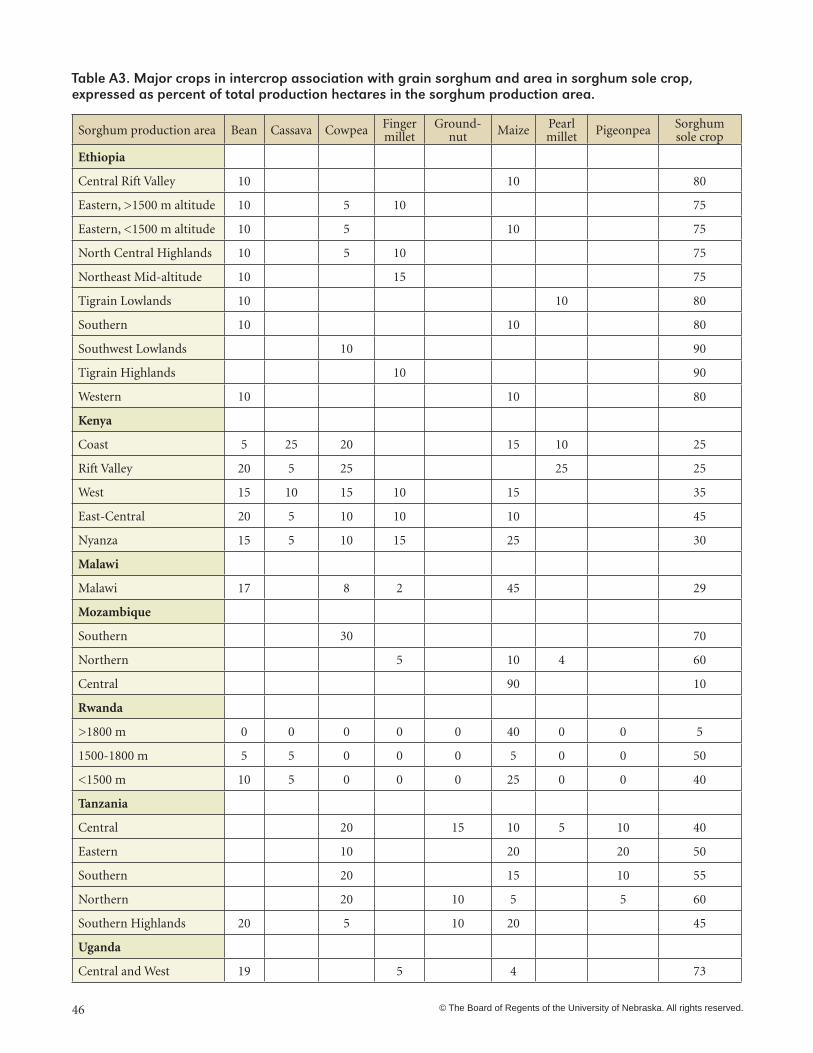
produced in sole crop, which contrasts with western Africa where intercrop production of sorghum is more prevalent. The most important intercrop companion crops of sorghum are maize, cowpea and common bean (Fig. 2.1). Intercropping sorghum with maize is especially common in central Mozambique, and to a lesser extent in western Kenya, eastern Tanzania, and the southern highlands of Tanzania (Map 2.1). Intercropping with cowpea is most important to the Coast and Eastern Provinces of Kenya, southern Mozambique, and in much of Tanzania, Zambia and Zimbabwe. Intercrop production of sorghum and common bean is common in: southwestern, central and western Uganda; the Eastern and Rift Valley Provinces of Kenya; Rwanda; Malawi; and in the southern highlands of Tanzania. The sorghum and groundnut intercrop association is common in several SPAs of Tanzania and Rwanda. Intercropping with pigeon pea is important in eastern Tanzania. Significant intercrop production with cassava and pearl millet occurred in the Coast and Eastern Provinces of Kenya, respectively.

12 © The Board of Regents of the University of Nebraska. All rights reserved.
Sowing timesSowing of sorghum is determined by the onset of
the rain periods in most SPAs. The rainfall pattern and timing are largely determined by the Intercontinental Convergence Zone which moves north to south and returns each year. It thereby crosses the equator twice each year resulting in a bimodal rainfall pattern. As latitude increases, the rainfall pattern becomes increasingly unimodal.
Most sorghum is sown from April to July in Ethiopia (Fig. 2.2). April is the most common sowing time for the Eastern Mid-altitude, North Central, and Tigrain Highlands SPAs (Map 2.2). Sorghum is sown mainly in January and February in the Southern SPA of Ethiopia.
In the Coast and Eastern Provinces of Kenya, sorghum is sown for both rain seasons, in March and April and again in September (Fig. 2.2, Map 2.2). Sowing is primarily in February and March for Nyanza and Western Provinces, and in April for the Rift Valley Province.
In Uganda, the main sowing times are in March and August. The Southwestern Highlands SPA is an exception
for Uganda where sowing is primarily in December and January.
There are two sorghum production seasons in northern and eastern Tanzania with major sowing times in March and October. Most sorghum is sown in November through January elsewhere with relatively more sown in November in the southern parts. Sowing is primarily in November and December in Zambia and Mozambique with later sowing in the south and from November to February in Malawi and Zimbabwe.
Harvesting timesMost sorghum in Ethiopia is harvested from October
through December (Fig. 2.3), but harvest in the Southern SPA is in May through July (Map 2.3). The major sorghum harvest period in Kenya and Uganda is July to August, but with some harvest throughout the year, depending on the SPA. Sorghum harvests are primarily from April through July in Tanzania, Malawi and Zambia, and from March through May in Mozambique and Zimbabwe.

© The Board of Regents of the University of Nebraska. All rights reserved. 13
Level of mechanization
CountryHuman
laborDraft
animals Tractor
Ethiopia 57 31 11
Kenya 77 18 5
Malawi 31 69 0
Mozambique 90 10 0
Rwanda 100 0 0
Tanzania 42 52 6
Uganda 61 32 7
Zambia 65 35 0
Zimbabwe 56 42 2
Most field operations for sorghum production are done manually in all nine countries and there is generally little use of tractors (Table 2.1). There is relatively more use of tractors for sorghum production in the Tigrain Lowlands of Ethiopia and in Eastern Tanzania than elsewhere, accounting for about one third of the power invested in these SPAs (Map 2.4). Draft animal use for land preparation is important throughout Ethiopia, in Eastern and Nyanza Provinces of Kenya, in northern and eastern Uganda, and in most parts of Tanzania with relatively less use in eastern and southern Tanzania. Draft animal power is also important in Malawi, Zambia, and Zimbabwe.

14 © The Board of Regents of the University of Nebraska. All rights reserved.

© The Board of Regents of the University of Nebraska. All rights reserved. 15
16 © The Board of Regents of the University of Nebraska. All rights reserved.

© The Board of Regents of the University of Nebraska. All rights reserved. 17

18 © The Board of Regents of the University of Nebraska. All rights reserved.
Grain sorghum yields are very low in eastern Africa as compared to yields in the US and well below the genetic potential. The national average yields range from 0.6 to 1.5 Mg ha-1 for these five countries as compared to 4.3 Mg ha-1 in the USA (FAOSTAT, 2006). The biotic and abiotic constraints to yield are numerous with a combined effect of much yield loss. In this chapter, these constraints are evaluated for their importance at SPA, national and regional levels.
Data collection and analysisInformation about grain sorghum production systems
was obtained by interviewing sorghum specialists in each country as described in Chapter 1. The interviews were conducted by presenting a list of 43 potential constraints to higher sorghum grain yields. Interviewees were encouraged to add constraints to the list that they considered to be important in one or more SPA. The interviewee was asked to allocate exactly 120 points to these 43 constraints for each SPA. Allocation of more points indicated greater yield loss associated with the constraint. No points were allocated to constraints considered to be of negligible or very minor importance in an SPA.
Yield losses due to constraints were estimated assuming: mean sorghum grain yield was 1.5 Mg ha-1 for all SPAs; potential yield with existing cultivars and with each of these 43 constraints removed was 6.3 Mg ha-1; and that each of the 120 assigned points represented 40 kg ha-1 yield loss. The number of assigned points was therefore multiplied by 40 to estimate yield loss per hectare due to each constraint in each SPA. Estimated yield loss due to each constraint in each SPA was calculated by multiplying estimated loss per hectare by the number of hectares of grain sorghum produced annually.
The 43 constraints were assigned to five sets of constraints. These were comprised of 8 diseases, 9 insect pests, 9 soil fertility- and soil water- related constraints, 7 other biotic constraints, and 7 other abiotic constraints. The importance of the four or five constraints for each of the five sets determined to be responsible for the greatest yield losses is presented in maps using pie charts for each SPA. The diameter of the pie charts varies according to the total yield loss due to that set of constraints.
Overview of sorghum production constraintsThe combination of soil water deficits was the most
important constraint to production accounting for a total of approximately 1.8 million Mg of loss per year for these five countries (Table 3.1; Fig. 3.1). Soil water deficits during grain fill were most important for Ethiopia and Mozambique. Mid-season deficits were relatively less important than for other growth stages in Ethiopia but very important in the other countries.
Nitrogen deficiency was recognized as a major constraint accounting for about 1.2 million Mg yr -1 loss. Nitrogen deficiency was the most important constraint in Mozambique and Tanzania, and was in the top six constraints in the other three countries.
The stalk borer complex, (including Chilo partellus (Swinh.), Busseola fusca (Fuller), and Sesamia calamistis) was found to be a very important constraint to yield regionally. Total loss of production potential to stalk borer was estimated to be more than 1.1 million Mg yr-1. The stalk borer complex was recognized as the most important constraint in Ethiopia and Uganda, but of relatively less importance in Mozambique. Chilo partellus (Swinh.) was identified as the most important stem borer species.
Weeds and striga (Striga hermontheca and Striga asiatica) were the next most important constraints overall, each causing more than 0.9 million Mg yr-1 loss in production. Striga was the most important constraint in Kenya, and the second most important in Ethiopia and Uganda. Striga was of little importance in Mozambique. Weeds were in the top five constraints for all five countries.
CHAPTER 3.
Sorghum Production Constraints
Grain sorghum yields are very low in eastern and southern Africa as compared to yields in the US and well below the genetic potential. The national average yields range from 0.6 to 1.5 Mg ha-1 for these nine countries as compared to a mean yield of 4.3 Mg ha-1 in the USA (FAOSTAT, 2008). The biotic and abiotic constraints to yield are numerous with a combined effect of much yield loss. In this chapter, these constraints are evaluated for their importance at SPA, national and regional levels.
Data collection and analysisInformation about grain sorghum production systems
was obtained by interviewing sorghum specialists in each country as described in Chapter 1. The interviews were conducted by presenting a list of 43 potential constraints to higher sorghum grain yields. Interviewees were encouraged to add constraints to the list that they considered to be important in one or more SPA. The interviewee was asked to allocate exactly 120 points to these 43 constraints for each SPA. Allocation of more points indicated greater yield loss associated with the constraint. No points were allocated to constraints considered to be of negligible or very minor importance in an SPA.
Yield losses due to constraints were estimated assuming: mean sorghum grain yield was 1.5 Mg ha-1 for all SPAs; potential yield with existing cultivars and with each of these 43 constraints removed was 6.3 Mg ha-1; and that each of the 120 assigned points represented 40 kg ha-1 yield loss. The number of assigned points was therefore multiplied by 40 to estimate yield loss per hectare due to each constraint in each SPA. Estimated yield loss due to each constraint in each SPA was calculated by multiplying estimated loss per hectare by the number of hectares of grain sorghum produced annually.
The 43 constraints were assigned to nine sets of constraints. These were comprised of eight diseases, nine insect pests, nine soil fertility- and soil water-related constraints, seven other biotic constraints, and seven other abiotic constraints.
The importance of the four or five constraints for each of the five sets determined to be responsible for the greatest yield losses is presented in maps using pie
charts for each SPA. The diameter of the pie charts varies according to the total yield loss due to that set of constraints. Estimated yield losses caused by the various biotic and abiotic constraints are reported for each SPA in Appendix B.
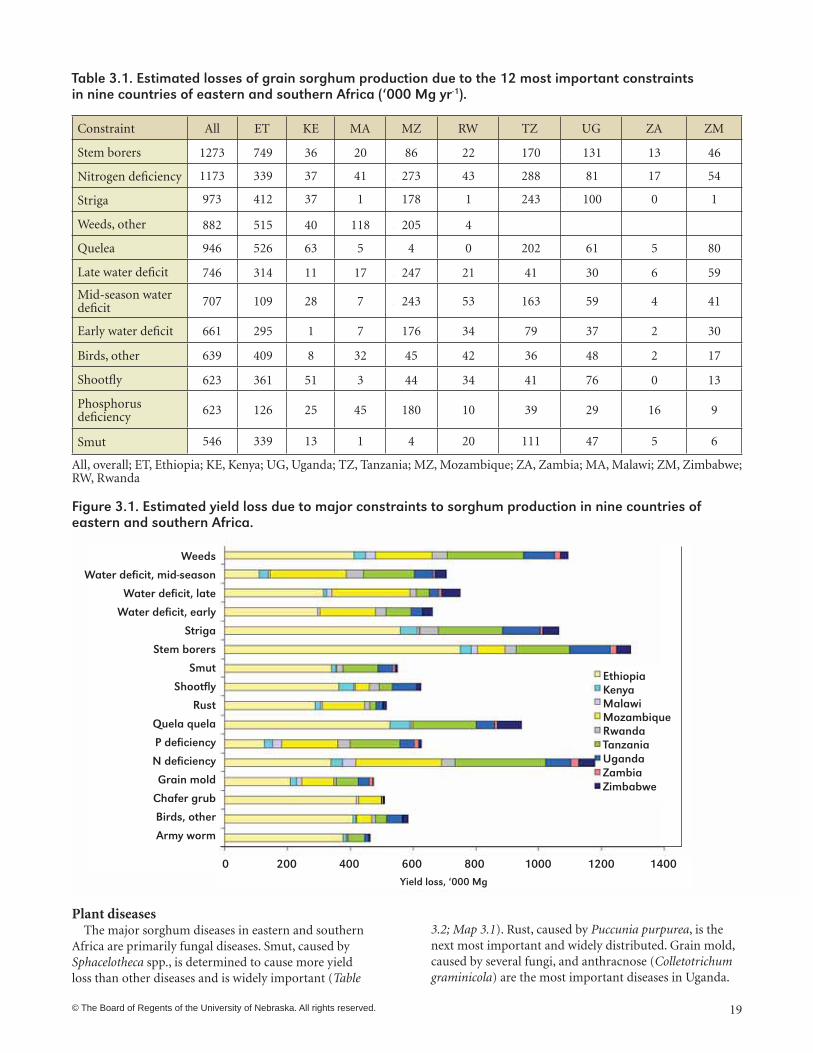
Overview of sorghum production constraintsThe combination of soil water deficits is the most
important constraint to production, accounting for over 2 million Mg yr-1 of yield loss for these nine countries (Table 3.1; Fig. 3.1). Soil water deficits during grain fill are most important for Ethiopia and Mozambique. Mid-season deficits are relatively less important than for other growth stages in Ethiopia but very important in the other countries.
The stalk borer complex, (including Chilo partellus (Swinh.), Busseola fusca (Fuller), and Sesamia calamistis) is found to be a very important constraint to yield regionally. Total loss of production potential to stalk borer is estimated to be more than 1.3 million Mg yr-1. The stalk borer complex is recognized as the most important constraint in Ethiopia and Uganda, but of relatively less importance in Mozambique. Chilo partellus (Swinh.) is identified as the most important stem borer species.
Nitrogen deficiency is recognized as a major constraint accounting for about 1.2 million Mg yr-1 loss. Nitrogen deficiency is the most important constraint in Mozambique, Tanzania, and Zambia, and is in the top six constraints in the other countries.
Striga (Striga hermontheca and Striga asiatica) is the next most important constraint overall, causing more than 1 million Mg yr-1 loss in production. Striga is the most important constraint in Kenya and Rwanda, and the second most important in Ethiopia, Uganda, and Zimbabwe.
Weeds, quelea (primarily Quelea quelea), other birds, shootfly (Atherigona soccata.), phosphorus deficiency and smut each cause more than 0.5 million Mg yr-1 loss in production. Bird damage is an especially important yield constraint in Ethiopia, Kenya, Malawi, and Rwanda, and has probably accounted for a significant decline in sorghum production area in Kenya.
© The Board of Regents of the University of Nebraska. All rights reserved. 19
Constraint All ET KE MA MZ RW TZ UG ZA ZM
Stem borers 1273 749 36 20 86 22 170 131 13 46
Nitrogen deficiency 1173 339 37 41 273 43 288 81 17 54
Striga 973 412 37 1 178 1 243 100 0 1
Weeds, other 882 515 40 118 205 4
Quelea 946 526 63 5 4 0 202 61 5 80
Late water deficit 746 314 11 17 247 21 41 30 6 59
Mid-season water deficit 707 109 28 7 243 53 163 59 4 41
Early water deficit 661 295 1 7 176 34 79 37 2 30
Birds, other 639 409 8 32 45 42 36 48 2 17
Shootfly 623 361 51 3 44 34 41 76 0 13
Phosphorus deficiency 623 126 25 45 180 10 39 29 16 9
Smut 546 339 13 1 4 20 111 47 5 6
All, overall; ET, Ethiopia; KE, Kenya; UG, Uganda; TZ, Tanzania; MZ, Mozambique; ZA, Zambia; MA, Malawi; ZM, Zimbabwe; RW, Rwanda
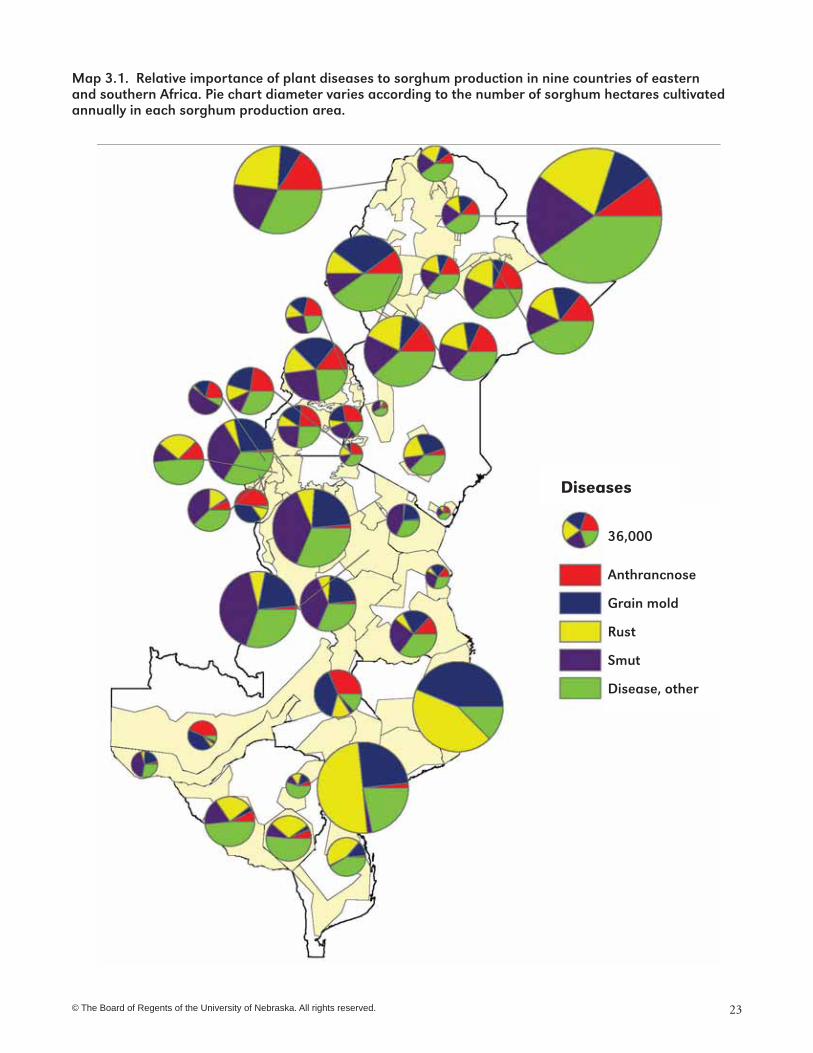
Plant diseasesThe major sorghum diseases in eastern and southern
Africa are primarily fungal diseases. Smut, caused by Sphacelotheca spp., is determined to cause more yield loss than other diseases and is widely important (Table
3.2; Map 3.1). Rust, caused by Puccunia purpurea, is the next most important and widely distributed. Grain mold, caused by several fungi, and anthracnose (Colletotrichum graminicola) are the most important diseases in Uganda.
1273
1173
973
882
946
746
707
661
639
623
623
546
749
339
412
515
526
314
109
295
409
361
126
339
36
37
37
40
63
11
28
1
8
51
25
13
20
41
1
118
5
17
7
7
32
3
45
1
86
273
178
205
4
247
243
176
45
44
180
4
22
43
1
4
0
21
53
34
42
34
10
20
170
288
243
202
41
163
79
36
41
39
111
131
81
100
61
30
59
37
48
76
29
47
13
17
0
5
6
4
2
2
0
16
5
46
54
1
80
59
41
30
17
13
9
6

20 © The Board of Regents of the University of Nebraska. All rights reserved.
Country Aphids Armyworm Cutworm Grasshoppers/locusts Grubs Midge Shootfly Stem borers Termites
Ethiopia 213 378 233 274 419 295 361 749 14
Kenya 8 11 13 1 1 17 51 36 1
Malawi 2 1 1 6 6 0 3 20 1
Mozambique 4 4 4 4 73 4 44 86 4
Rwanda 5 2 2 12 2 2 34 36 2
Tanzania 53 50 13 10 4 54 41 170 4
Uganda 11 14 19 12 2 42 76 131 3
Zambia 2 0 2 5 0 1 0 19 0
Zimbabwe 11 6 9 3 3 6 13 45 1
Total 308 464 296 325 510 421 624 1286 30
Country Anthracnose Charcoal rot Grain mold Late blight Mildew Nematodes Rust Smut
Ethiopia 232 191 209 143 191 143 289 339
Kenya 15 8 20 20 6 1 15 13
Malawi 14 1 17 1 3 2 6 1
Mozambique 4 4 100 4 42 4 135 4
Rwanda 16 1 7 18 8 6 18 20
Tanzania 11 13 71 61 23 4 20 111
Uganda 33 9 36 13 10 5 21 47
Zambia 8 1 11 0 1 3 2 9
Zimbabwe 3 6 3 7 4 7 11 6
Total 333 233 471 266 288 173 515 546
Grain mold is also considered to be important in the mid-altitude SPAs of Ethiopia, Kenya, and Zambia. Anthracnose and rust are considered to be of high importance in the Eastern Lowlands and the Tigrain Lowlands areas of Ethiopia. Smut is important in the low and mid-altitude SPAs of Ethiopia, Eastern Province of Kenya, and for much of Uganda. Downy mildew (Peronosclerospora sorghi) is seen to be of moderate importance in all SPAs. Ergot (Claviceps africana) and bacterial streak (Pseudomonas andropogoni) are occasionally important in some wetter SPAs, but are rated relatively low compared to other constraints.
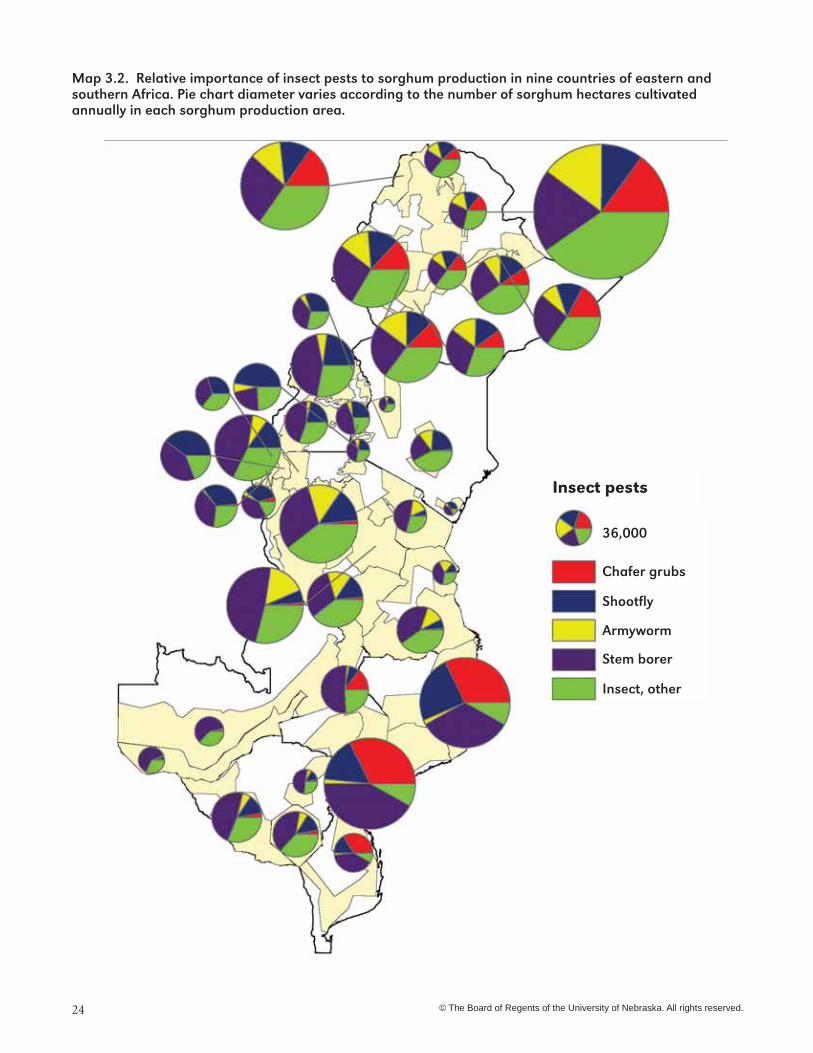
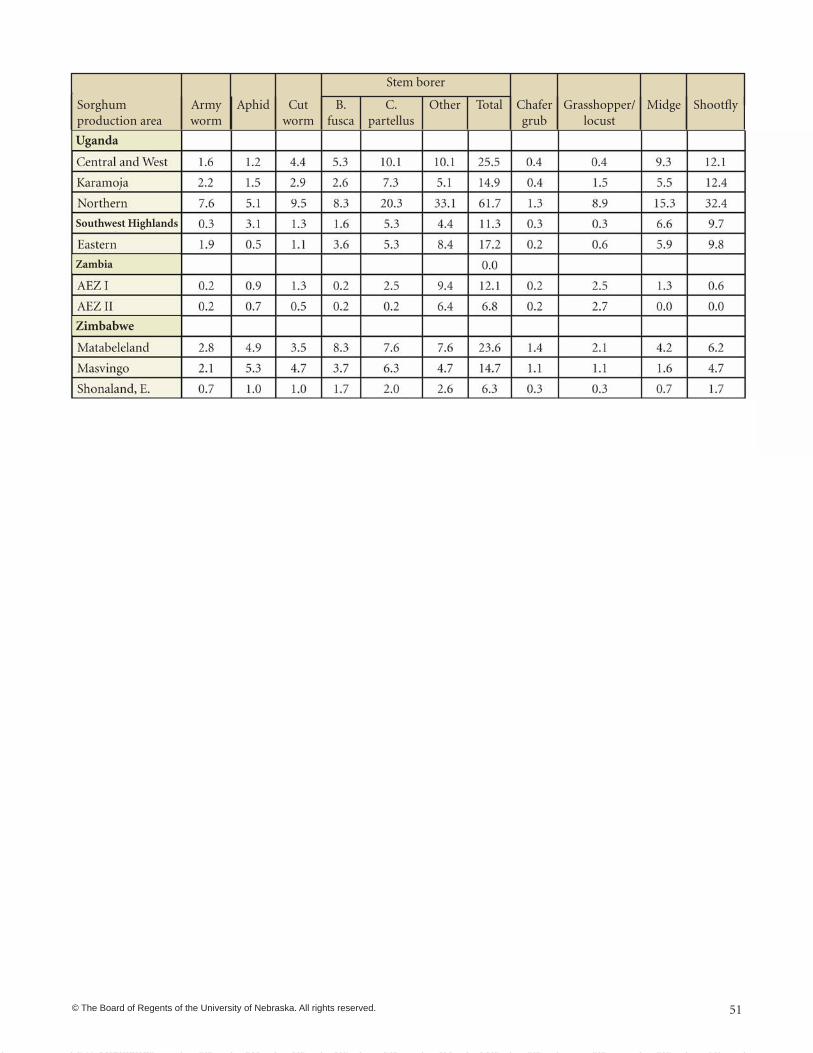
Insect pestsThe yield losses caused by the stem borer complex are
determined to exceed losses due to any other insect pests
(Table 3.3; Map 3.2). Shootfly is the next important insect pest and is widespread, but especially in the Coast and Western Provinces of Kenya and throughout Uganda. The chafer grub complex is important in Ethiopia and Mozambique, but less important elsewhere. Armyworm (Spodoptera and Mythimna spp.) is rated of high importance for most SPAs of Ethiopia but of moderate or minor importance in other countries; severe armyworm attack occurs infrequently but can result in complete crop loss. The grasshopper/locust complex is important in parts of Ethiopia, especially in the Tigrain Lowlands of northwest Ethiopia. Sorghum midge (Stenodiplosis sorghicola) is of importance in the SPAs of eastern Africa but of less importance in southern Africa.
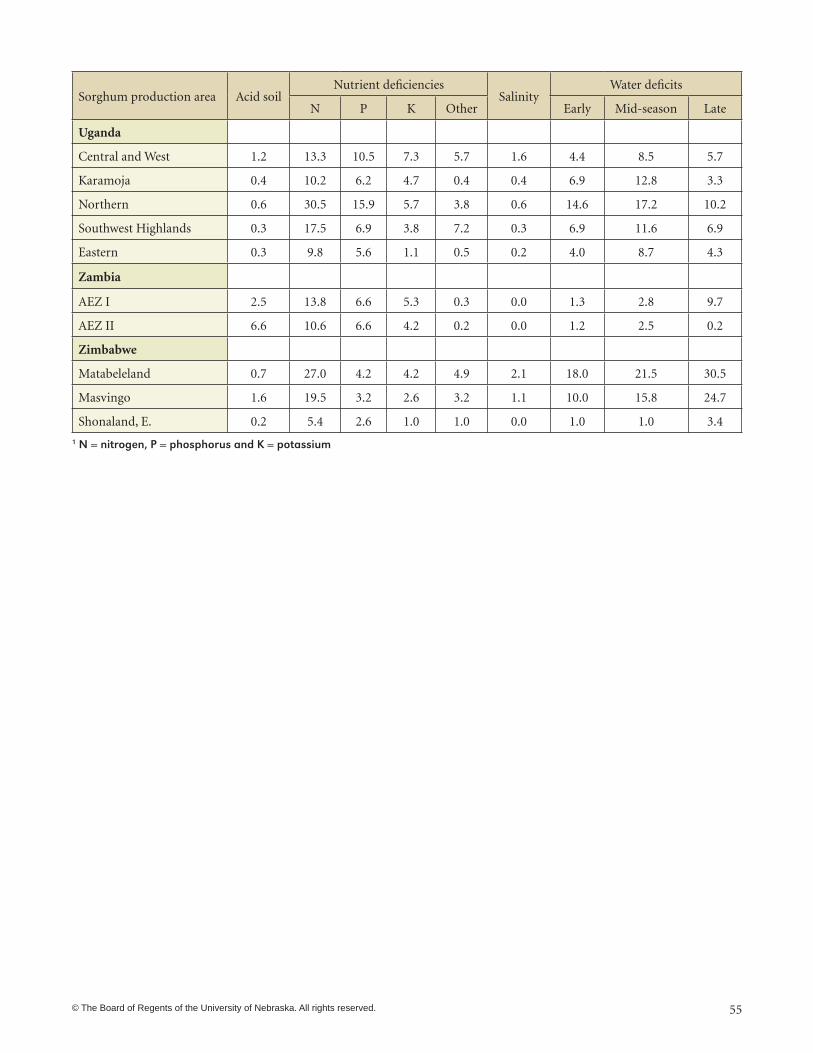
Soil fertility constraints and soil water deficitsSoil water deficits are the most important constraint to

© The Board of Regents of the University of Nebraska. All rights reserved. 21
Country Acid soil complex
Nutrient deficienciesSalinity
Soil water deficits
N P K Other Early Mid-season Late
Ethiopia 26 339 126 14 94 19 295 109 314
Kenya 1 37 25 1 2 11 1 28 11
Malawi 6 41 29 14 1 0 7 7 17
Mozambique 4 273 180 67 4 4 176 243 247
Rwanda 42 43 39 29 2 0 34 53 21
Tanzania 7 288 159 21 4 26 79 163 41
Uganda 3 81 45 23 17 3 37 59 30
Zambia 9 24 13 10 0 0 2 5 10
Zimbabwe 2 52 10 8 9 3 29 38 59
Total 97 1171 623 182 133 67 660 705 746
Country Domestic animals Wildlife Birds, other Quelea Striga Theft Weeds
Ethiopia 31 79 125 526 560 17 544
Kenya 12 14 47 63 52 3 39
Malawi 5 3 32 5 6 1 185
Mozambique 4 4 474 4 4 4 185
Rwanda 21 31 42 0 58 6 50
Tanzania 13 47 184 202 205 4 251
Uganda 36 13 55 61 118 16 116
Zambia 4 5 12 7 9 1 13
Zimbabwe 20 40 35 77 50 13 24
Total 145 234 1003 943 1060 64 1254
yield (Table 3.1; Fig 3.1). Soil water deficits during crop establishment and early growth and during grain fill are seen as most important in Ethiopia while mid-season deficits are generally seen as most important in Uganda and Kenya.
Nitrogen deficiency is recognized as a major yield constraint in all SPAs (Table 3.4; Map 3.3). Phosphorus deficiency is of moderate to high importance in all SPAs, and especially in Nyanza Province of Kenya. Potassium deficiency is generally of low importance for most sorghum production, but of moderate importance in Malawi, Mozambique, Rwanda, Zambia, and parts of Uganda. Deficiency of other nutrients is not indicated except for Southwest Uganda. Soil acidity is a problem in Rwanda and in AEZ II in Zambia. Salinity is seen to be of relatively low importance.
Other biotic constraintsStriga, weeds, and quelea are recognized as major
constraints (Table 3.5). Quelea is seen as an especially important constraint in the Rift Valley areas of Ethiopia and Kenya, as well as the Southwest Lowlands of Ethiopia, the other SPAs of Kenya, and in Tanzania (Map 3.4).
Striga is rated especially high for Eastern and Northern Uganda, Zimbabwe, the production areas of < 1800 m in Rwanda, and for the Western, Nyanza and Coast Provinces of Kenya. Striga is determined to be of minor importance for the Central Rift Valley and Western SPAs of Ethiopia, but of high to very high importance for all other SPAs in Ethiopia.
Weeds, other than striga, are widely recognized as a major constraint to sorghum production. Uncontrolled

22 © The Board of Regents of the University of Nebraska. All rights reserved.
Country Cold Flooding Heat Low radiation Root barriers Soil crusting Wind
Ethiopia 20 239 39 235 61 17 258
Kenya 26 9 7 17 1 4 7
Malawi 1 1 8 1 1 0 1
Mozambique 4 4 4 4 4 4 4
Rwanda 2 17 6 1 0 5 46
Tanzania 4 33 4 4 4 18 4
Uganda 7 6 6 14 2 16 13
Zambia 0 0 5 2 0 0 0
Zimbabwe 17 3 6 23 0 4 7
Total 80 312 83 300 74 67 340
grazing of fields by domestic animals is of moderate concern in the Northern and Karamoja SPAs of Uganda. Crop damage due to wildlife is of greatest concern in the Southwest Lowlands of Ethiopia, the Rift Valley Highlands of Kenya, the highlands of Rwanda, and in Zimbabwe. Birds of species other than Quelea are seen as a problem generally, but especially for the SPAs of Kenya, Malawi, Mozambique, the Rwanda Highlands, Tanzania, Zambia, and in Central and Western Uganda.
Other abiotic constraintsWind is rated as a significant constraint for several SPAs
of Ethiopia, especially for the Eastern Mid-altitude SPA,
and in parts of Rwanda (Table 3.6). High temperature is judged to be a significant constraint in the Eastern Province of Kenya, and in several SPAs of Ethiopia, including the Tigrain Lowlands, the Southwest Lowlands, and the Central Rift Valley. Soil crusting is rated of moderate importance in all production areas of Ethiopia except for the Tigrain Lowlands and the Eastern Lowlands SPAs. Barriers to root growth are generally not important but of moderate importance in the Nyanza Province of Kenya and the Southwest Highlands of Uganda, probably due to the presence of laterite layers in these intensively farmed areas.
© The Board of Regents of the University of Nebraska. All rights reserved. 23
24 © The Board of Regents of the University of Nebraska. All rights reserved.

© The Board of Regents of the University of Nebraska. All rights reserved. 25

26 © The Board of Regents of the University of Nebraska. All rights reserved.

© The Board of Regents of the University of Nebraska. All rights reserved. 27
CHAPTER 4.
Preferred Phenotypic Characteristics of Sorghum CultivarsA range of grain characteristics, plant heights, panicle
types, and other phenotypic characteristics are considered by farmers in the choice of sorghum cultivars.
Information about grain sorghum production systems was obtained by interviewing sorghum specialists in each country as described in Chapter 1. The assessment of the importance of 28 sorghum phenotypic preferences was done by allocating a total of 30 points among these preferences for each SPA. In the analysis of the data, each point was considered to be the equivalent of 3.3% of the total consideration given to phenotypic preferences for the SPA. Several characteristics were found to be of minor or negligible significance and the results are presented for 17 more commonly expressed preferences. Detailed SPA level information is presented in Appendix C.
Perceived preferences of farmersPlant height is a major phenotypic characteristic with
more producers favoring plant height of less than 2 m as compared to those favoring taller phenotypes in selection of cultivars (Fig. 4.1; Map 4.1). However, tall sorghums as well as shorter sorghums have important places in the sorghum-producing farming systems throughout eastern and southern Africa.
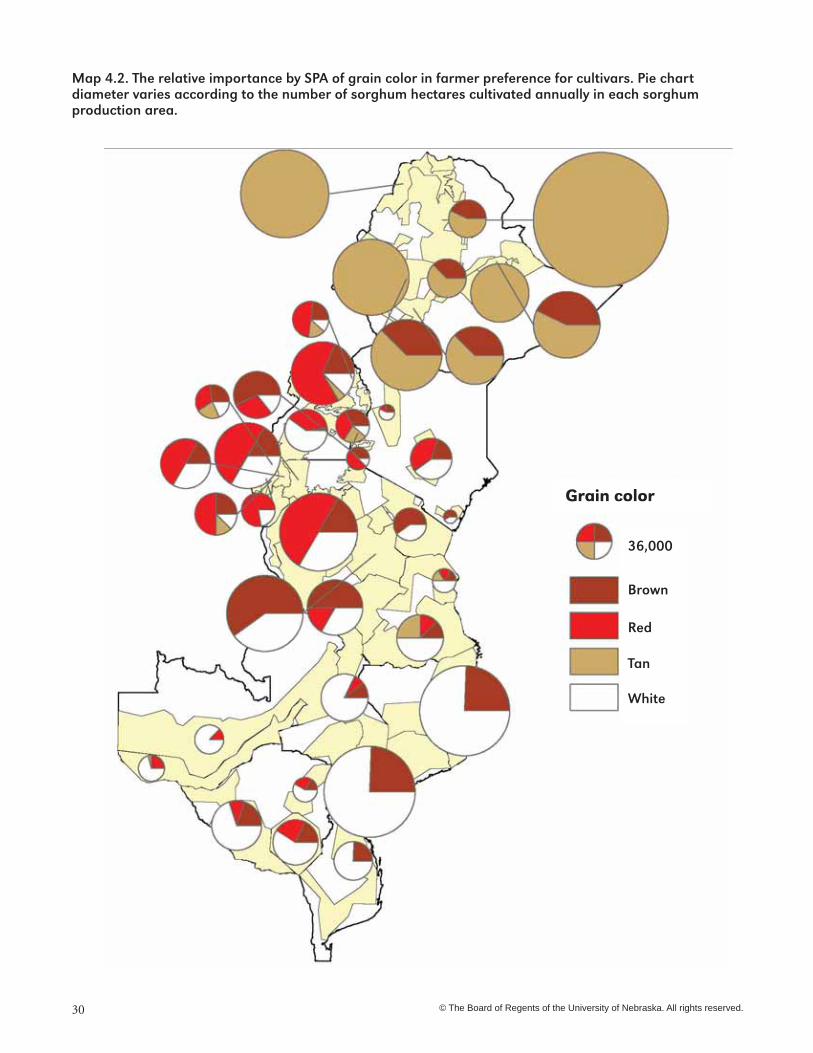
Grain color is recognized as an important consideration in cultivar selection with a greater preference for tan in Ethiopia and white in Mozambique, Zambia, and Zimbabwe as well as parts of Tanzania (Map. 4.2). Red and brown grain types are often preferred in Kenya, Rwanda, Uganda, and the Lake and Western SPAs of Tanzania. Red and brown grain types are often associated with higher tannin content, are preferred less by birds, and are less affected by mold. Preferences for brown and red types with high tannin content may also be associated with their localized preference for brewing.
Grain size is less important than grain color with an overall preference for grain of >3g per 100 kernels than for smaller grain. The preference for larger grain size is strongly expressed for Mozambique and some SPAs in Ethiopia (Map 4.3).
Preference for panicle positioning varied with SPAs with preferences more strongly indicated in Ethiopia and Tanzania than in the other countries. Crooked, or goose-neck, is less often preferred than erect positioning of the panicle, but the crooked positioning is more preferred in the Eastern Mid-altitude and Northeastern SPAs of Ethiopia, in Nyanza Province of Kenya, and in the Karamoja and Eastern SPAs of Uganda.

28 © The Board of Regents of the University of Nebraska. All rights reserved.
Preference for compact, semi-compact and loose panicles is similar overall, but preferences differed by, and within, SPAs (Map 4.4). Compact panicles are most preferred in northwest Ethiopia and in Mozambique. The greatest preferences for semi-compact panicles were expressed for the Central Rift Valley, Southern, Eastern Lowlands, and Western SPAs of Ethiopia. Loose panicles are most preferred in the North Central and Tigrain Highlands SPAs of Ethiopia, in western Kenya, in northern Uganda, and generally throughout Tanzania.
Photoperiod sensitivity is not an important
consideration in Kenya, Tanzania and Uganda, as might be expected, as there is little variation in day length. In Ethiopia, as well, the results show little concern about photoperiod sensitivity in most SPAs, but the results indicate some preference for each type in the North Central and Tigrain Highlands SPAs. Preference for photoperiod insensitivity is expressed for the Mozambique SPAs.
Threshability is not expressed as a major consideration of farmers in Mozambique but it is considered to be of some importance elsewhere.

© The Board of Regents of the University of Nebraska. All rights reserved. 29
30 © The Board of Regents of the University of Nebraska. All rights reserved.

© The Board of Regents of the University of Nebraska. All rights reserved. 31

32 © The Board of Regents of the University of Nebraska. All rights reserved.
© The Board of Regents of the University of Nebraska. All rights reserved. 33
CHAPTER 5.
Gender and Family Roles in Sorghum Production, Post-Harvest Handling, and Marketing
CountryProduction Post-harvest Marketing
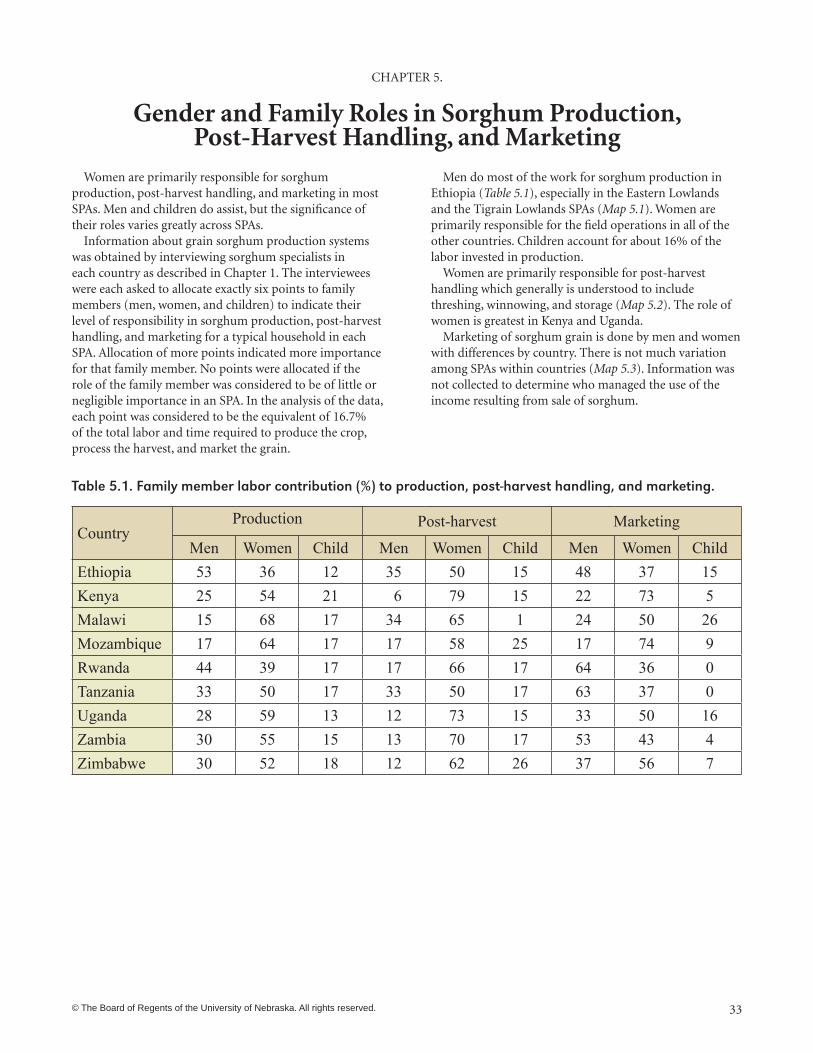
Men Women Child Men Women Child Men Women ChildEthiopia 53 36 12 35 50 15 48 37 15Kenya 25 54 21 6 79 15 22 73 5Malawi 15 68 17 34 65 1 24 50 26Mozambique 17 64 17 17 58 25 17 74 9Rwanda 44 39 17 17 66 17 64 36 0Tanzania 33 50 17 33 50 17 63 37 0Uganda 28 59 13 12 73 15 33 50 16Zambia 30 55 15 13 70 17 53 43 4Zimbabwe 30 52 18 12 62 26 37 56 7
Women are primarily responsible for sorghum production, post-harvest handling and marketing in most SPAs. Men and children do assist, but the significance of their roles varies greatly across SPAs.
Information about grain sorghum production systems was obtained by interviewing sorghum specialists in each country as described in Chapter 1. The interviewees were each asked to allocate exactly 6 points to family members (men, women, and children) to indicate their level of responsibility in sorghum production, post-harvest handling, and marketing for a typical household in each SPA. Allocation of more points indicated more importance for that family member. No points were allocated if the role of the family member was considered to be of little or negligible importance in an SPA. In the analysis of the data, each point was considered to be the equivalent of 16.7% of the total labor and time required to produce the crop, process the harvest, and market the grain.
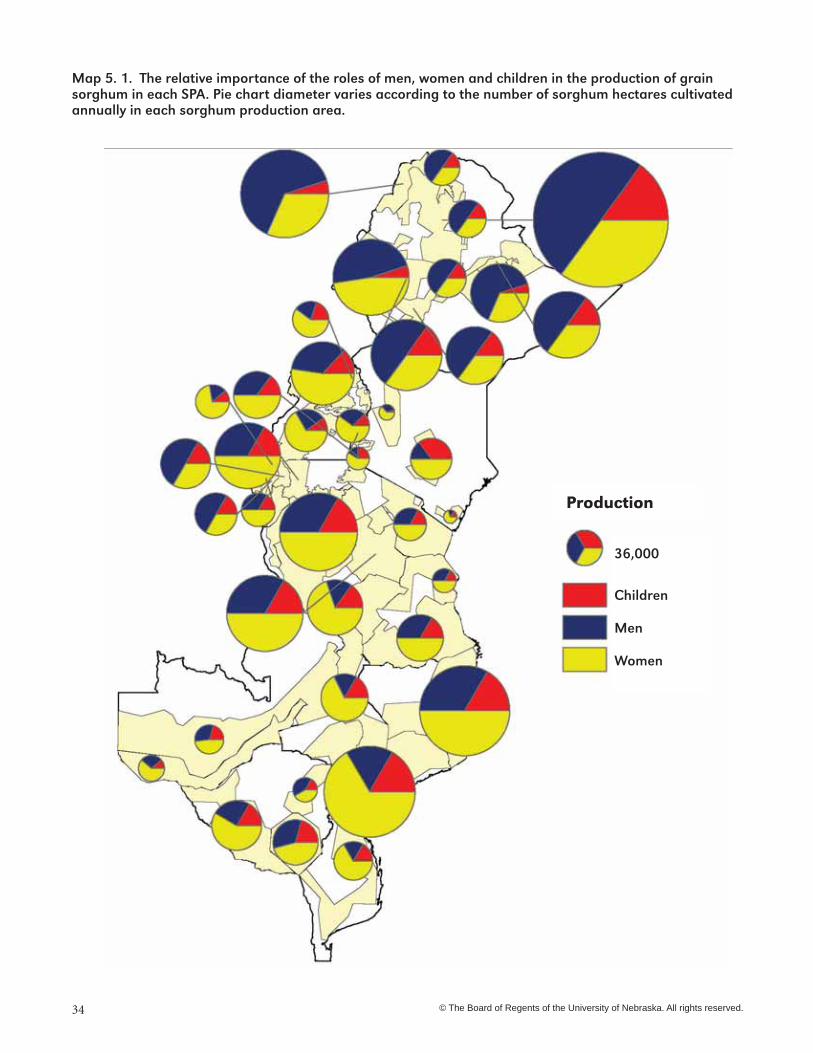
Men did most of the work for sorghum production in Ethiopia (Table 5.1), especially in the Eastern Lowlands and the Tigrain Lowlands SPAs (Map 5.1). Women were primarily responsible for the field operations in all of the other countries. Children accounted for about 13% of the labor invested in production.
Women were primarily responsible for post-harvest handling which generally was understood to include threshing, winnowing, and storage (Map 5.2). The role of women was greatest in Kenya and Uganda.
Men did most of the marketing in Ethiopia while women did 50% or more of the marketing in the other four countries. There was not much variation among SPAs within countries (Map 5.3). Information was not collected to determine who managed the use of the income resulting from sale of sorghum.
Women are primarily responsible for sorghum production, post-harvest handling, and marketing in most SPAs. Men and children do assist, but the significance of their roles varies greatly across SPAs.
Information about grain sorghum production systems was obtained by interviewing sorghum specialists in each country as described in Chapter 1. The interviewees were each asked to allocate exactly six points to family members (men, women, and children) to indicate their level of responsibility in sorghum production, post-harvest handling, and marketing for a typical household in each SPA. Allocation of more points indicated more importance for that family member. No points were allocated if the role of the family member was considered to be of little or negligible importance in an SPA. In the analysis of the data, each point was considered to be the equivalent of 16.7% of the total labor and time required to produce the crop, process the harvest, and market the grain.
Men do most of the work for sorghum production in Ethiopia (Table 5.1), especially in the Eastern Lowlands and the Tigrain Lowlands SPAs (Map 5.1). Women are primarily responsible for the field operations in all of the other countries. Children account for about 16% of the labor invested in production.
Women are primarily responsible for post-harvest handling which generally is understood to include threshing, winnowing, and storage (Map 5.2). The role of women is greatest in Kenya and Uganda.
Marketing of sorghum grain is done by men and women with differences by country. There is not much variation among SPAs within countries (Map 5.3). Information was not collected to determine who managed the use of the income resulting from sale of sorghum.
34 © The Board of Regents of the University of Nebraska. All rights reserved.

© The Board of Regents of the University of Nebraska. All rights reserved. 35

36 © The Board of Regents of the University of Nebraska. All rights reserved.
© The Board of Regents of the University of Nebraska. All rights reserved. 37
CHAPTER 6.
Sorghum Utilization
Sorghum grain and stover have diverse uses with the stover often considered to be as valuable as the grain. The importance of the different uses varies by SPA.
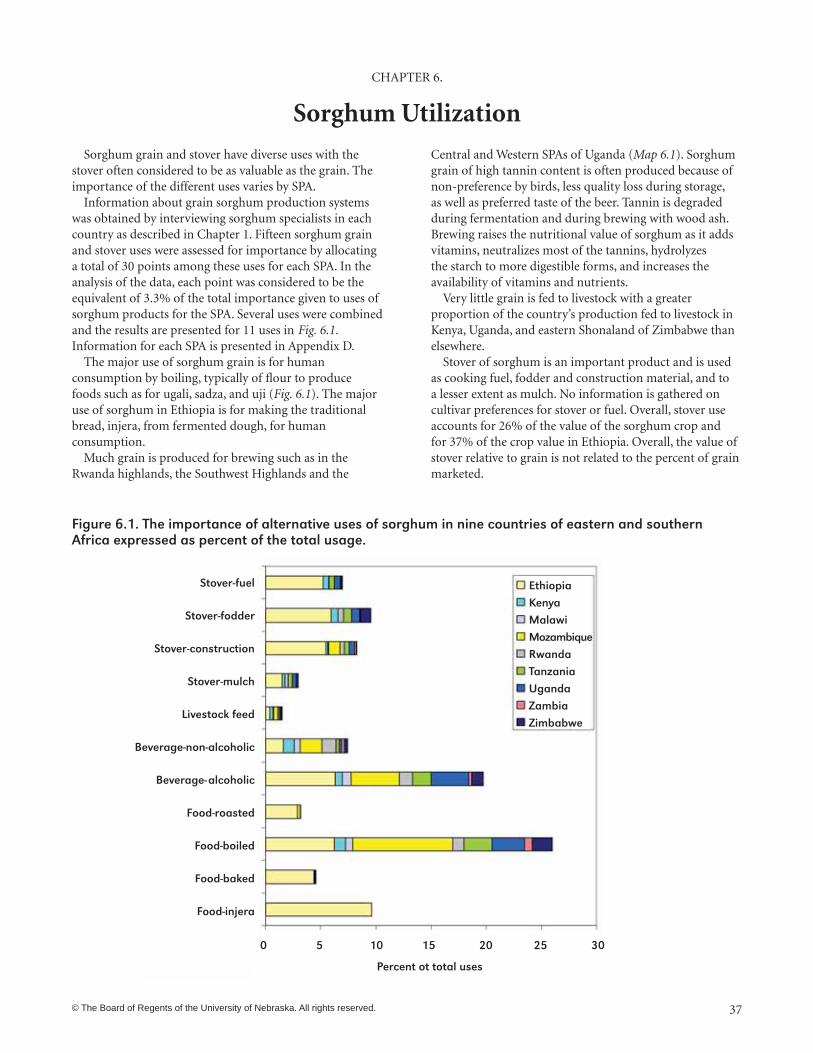
Information about grain sorghum production systems was obtained by interviewing sorghum specialists in each country as described in Chapter 1. Fifteen sorghum grain and stover uses were assessed for importance by allocating a total of 30 points among these uses for each SPA. In the analysis of the data, each point was considered to be the equivalent of 3.3% of the total importance given to uses of sorghum products for the SPA. Several uses were combined and the results are presented for 11 uses in Fig. 6.1.
The major use of sorghum grain was for human consumption by boiling, typically of flour to produce foods such as for ugali and uji in Kenya, Tanzania, and Uganda (Fig. 6.1). The major use of sorghum in Ethiopia was for making the traditional bread, injera, from fermented dough for human consumption.
Much grain was produced for brewing such as in the Southwest Highlands and the Central and Western SPAs of Uganda (Map 6.1). Sorghum grain of high tannin content
was often produced due to non-preference by birds, less quality loss during storage, along with and better storage options, as well as preferred taste of the beer. Tannin is degraded during fermentation with wood ash and during brewing. Brewing raises the nutritional value of sorghum as it adds vitamins, neutralizes most of the tannins, hydrolyzes the starch to more digestible forms, and increases the availability of vitamins and nutrients.
Very little grain is fed to livestock with a greater proportion of the country’s production fed to residents’ livestock in Kenya and Uganda than elsewhere.
Stover of sorghum was an important product and is used as cooking fuel, fodder and construction material, and to a lesser extent as mulch. No information was gathered on cultivar preferences of stover for fuel.
The value of stover, overall, was about 40% of the value of grain produced, and most highly valued in Ethiopia followed by Kenya, with relatively little value given in Mozambique. Overall, the value of stover relative to grain was not related to the percent of grain marketed.
Sorghum grain and stover have diverse uses with the stover often considered to be as valuable as the grain. The importance of the different uses varies by SPA.
Information about grain sorghum production systems was obtained by interviewing sorghum specialists in each country as described in Chapter 1. Fifteen sorghum grain and stover uses were assessed for importance by allocating a total of 30 points among these uses for each SPA. In the analysis of the data, each point was considered to be the equivalent of 3.3% of the total importance given to uses of sorghum products for the SPA. Several uses were combined and the results are presented for 11 uses in Fig. 6.1. Information for each SPA is presented in Appendix D.
The major use of sorghum grain is for human consumption by boiling, typically of flour to produce foods such as for ugali, sadza, and uji (Fig. 6.1). The major use of sorghum in Ethiopia is for making the traditional bread, injera, from fermented dough, for human consumption.
Much grain is produced for brewing such as in the Rwanda highlands, the Southwest Highlands and the
Central and Western SPAs of Uganda (Map 6.1). Sorghum grain of high tannin content is often produced because of non-preference by birds, less quality loss during storage, as well as preferred taste of the beer. Tannin is degraded during fermentation and during brewing with wood ash. Brewing raises the nutritional value of sorghum as it adds vitamins, neutralizes most of the tannins, hydrolyzes the starch to more digestible forms, and increases the availability of vitamins and nutrients.
Very little grain is fed to livestock with a greater proportion of the country’s production fed to livestock in Kenya, Uganda, and eastern Shonaland of Zimbabwe than elsewhere.
Stover of sorghum is an important product and is used as cooking fuel, fodder and construction material, and to a lesser extent as mulch. No information is gathered on cultivar preferences for stover or fuel. Overall, stover use accounts for 26% of the value of the sorghum crop and for 37% of the crop value in Ethiopia. Overall, the value of stover relative to grain is not related to the percent of grain marketed.

38 © The Board of Regents of the University of Nebraska. All rights reserved.

© The Board of Regents of the University of Nebraska. All rights reserved. 39
Production of cereals and grain legumes by small-scale, resource-poor farmers typically is at least partly for home consumption. Interviewees assigned a total of six points to indicate the proportion of harvested sorghum grain that is marketed or not marketed. In the analysis of the data, each point was considered to be the equivalent of 16.7% of the annual sorghum produced for the SPA.
Most of the sorghum grain is not marketed but consumed on the farm, especially in Ethiopia (Table 7.1). Overall, 34% is marketed. A greater proportion is marketed in Rwanda and Uganda than in other countries. Relatively more of the sorghum produced in the Tigrain Lowlands, where production is relatively large-scale and mechanized, is marketed than elsewhere in Ethiopia (Map 7.1). Seventy percent or more of the grain produced in the Karamoja and the Central and Western SPAs in Uganda is marketed, presumably to be used for brewing in urban areas.
CHAPTER 7.
Marketing of Sorghum Grain
Country %
Ethiopia 29
Kenya 30
Malawi 28
Mozambique 24
Rwanda 67
Tanzania 44
Uganda 50
Zambia 28
Zimbabwe 23

40 © The Board of Regents of the University of Nebraska. All rights reserved.

© The Board of Regents of the University of Nebraska. All rights reserved. 41
Balole, T.V. and G.M. Legwaila. 2006. Sorghum bicolor (L.) Moench. In: Brink, M. & Belay, G. (Eds.). Plant Resources of Tropical Africa 1. Cereals and Pulses. PROTA Foundation, Wageningen, Netherlands / Blackhuys Publishers, Leiden, Netherlands / CTA, Wageningen, Netherlands. Pp 165–175.
Boardman, S. 1999. The agricultural foundation of the Aksumite Empire, Ethiopia: an interim report. Pp 137–147. IN The exploitation of plant resources in ancient Africa. M. van der Veen (Ed.). Kluwe Academic/Plenum Publishers, New York NY.
Doggett, H. 1988. Sorghum (2nd edition). London: Longman. (Tropical Agriculture Series).
FAOSTAT. 2006. (Available at http://faostat.fao.org/ Accessed September 20, 2006.)
Grieser, J. 2002. LocClim 1.0, the FAO local climate estimator. Environment and Natural Resources Service Working Paper No. 9. Food and Agriculture Organization. (Available at: www.fao.org/sd/2002/en1203a_en.htm; verified March 27, 2006.
ILRI, 2002. Agview 2002. International Livestock Research Institute, Nairobi, Kenya.
Rowley-Conway, P., W. Deakin, and C.H. Shaw. 1999. Ancient DNA from sorghum: the evidence from Qasr Ibrim, Egyptian Nubia. Pp 55–61. IN The exploitation of plant resources in ancient Africa. M. van der Veen (Ed.). Kluwe Academic/Plenum Publishers, New York NY.
Young, R. and G. Thompson, 1999. Missing plant foods? Where is the archaeobotanical evidence for sorghum and finger millet in East Africa? Pp 63–72. IN The exploitation of plant resources in ancient Africa. M. van der Veen (Ed.). Kluwe Academic/Plenum Publishers, New York NY. Wasylikowa, K. and J. Dahlberg. 1999. Sorghum in the economy of the early Neolithic nomadic tribes at Nabta Playa, Southern Egypt. Pp 11–31. IN The exploitation of plant resources in ancient Africa. M. van der Veen (Ed.). Kluwe Academic/Plenum Publishers, New York NY.
Wortmann, C.S. and C.A. Eledu, 1999. Uganda’s Agroecological Zones: a guide for planners and policy makers. Centro Internacional de Agricultura Tropical. Kampala, Uganda.

42 © The Board of Regents of the University of Nebraska. All rights reserved.
Sorghum production area Jan Feb Mar Apr May June July Aug Sep Oct Nov Dec
Ethiopia
Central Rift Valley 33 50 17
Eastern, >1500 m altitude 50 17 33
Eastern, <1500 m altitude 33 50 17
North Central Highlands 50 33 17
Northeast Mid-altitude 33 34 33
Tigrain Lowlands 33 50 17
Southern 33 50 17
Southwest Lowlands 33 50 17
Tigrain Highlands 50 33 17
Western 33 50 17
Kenya
Coast 17 33 17 33
Rift Valley 33 17 50
West 34 49 17
East-Central 17 83
Nyanza 17 33 33 17
Malawi
Malawi 17 15 42 25
Mozambique
Southern 17 8 33 25 17
Northern 33 17 50
Central 33 17 50
Rwanda
>1800 m 33 67
1500-1800 m 50 33 17
<1500 m 33 50 17
Tanzania
Lake Zone 17 50 33
Western 17 33 50
Central 17 33 33 17
Eastern 33 17 33 17
Southern 33 33 33
North 33 17 33 17
Southern High 17 33 50

© The Board of Regents of the University of Nebraska. All rights reserved. 43
Sorghum production area Jan Feb Mar Apr May June July Aug Sep Oct Nov Dec
Uganda
Central and West 17 33 33 17
Karamoja 17 5 28 28 5 17
Northern 5 27 23 5 37 3
Southwest Highlands 50 50
East 10 45 3 9 33
Zambia
AEZ I 11 44 45
AEZ II 6 4 26 65
Zimbabwe
Matabeleland 33 17 8 13 29
Masvingo 33 17 4 17 29
Shonaland, E. 33 17 8 17 25

44 © The Board of Regents of the University of Nebraska. All rights reserved.
Sorghum production area Jan Feb Mar Apr May June July Aug Sep Oct Nov Dec
Ethiopia
Central Rift Valley 33 50 17
Eastern, >1500 m altitude 50 50
Eastern, <1500 m altitude 33 50 17
North Central Highlands 50 50
Northeast Mid-altitude 17 33 50
Tigrain Lowlands 50 33 17
Southern 33 50 17
Southwest Lowlands 17 50 33
Tigrain Highlands 50 50
Western 33 50 17
Kenya
Coast 17 33 17 33
Rift Valley 50 33 17
West 50 33 17
East-Central 17 83
Nyanza 17 17 50 16
Malawi
Malawi 19 37 44
Mozambique
Southern 17 33 33 17
Northern 17 33 50
Central 17 33 50
Rwanda
>1800 m 50 50
1500-1800 m 17 33 33 17
<1500 m 17 50 33
Tanzania
Lake Zone 50 33 17
Western 50 33 17
Central 33 33 33
Eastern 33 17 33 17
Southern 33 33 33
North 33 17 33 17
Southern High 33 50 17
Uganda

© The Board of Regents of the University of Nebraska. All rights reserved. 45
Sorghum production area Jan Feb Mar Apr May June July Aug Sep Oct Nov Dec
Central and West 17 5 2 12 33 3 11 17
Karamoja 18 3 8 55 16
Northern 2 3 40 5 10 40
Southwest Highlands 5 45 50
East 3 12 40 3 4 38
Zambia
AEZ I 11 39 50
AEZ II 4 41 56
Zimbabwe 19 37 44
Matabeleland 8 50 42
Masvingo 50 50
Shonaland, E. 17 50 33
46 © The Board of Regents of the University of Nebraska. All rights reserved.
Sorghum production area Bean Cassava Cowpea Finger millet
Ground-nut Maize Pearl
millet Pigeonpea Sorghum sole crop
Ethiopia
Central Rift Valley 10 10 80
Eastern, >1500 m altitude 10 5 10 75
Eastern, <1500 m altitude 10 5 10 75
North Central Highlands 10 5 10 75
Northeast Mid-altitude 10 15 75
Tigrain Lowlands 10 10 80
Southern 10 10 80
Southwest Lowlands 10 90
Tigrain Highlands 10 90
Western 10 10 80
Kenya
Coast 5 25 20 15 10 25
Rift Valley 20 5 25 25 25
West 15 10 15 10 15 35
East-Central 20 5 10 10 10 45
Nyanza 15 5 10 15 25 30
Malawi
Malawi 17 8 2 45 29
Mozambique
Southern 30 70
Northern 5 10 4 60
Central 90 10
Rwanda
>1800 m 0 0 0 0 0 40 0 0 5
1500-1800 m 5 5 0 0 0 5 0 0 50
<1500 m 10 5 0 0 0 25 0 0 40
Tanzania
Central 20 15 10 5 10 40
Eastern 10 20 20 50
Southern 20 15 10 55
Northern 20 10 5 5 60
Southern Highlands 20 5 10 20 45
Uganda
Central and West 19 5 4 73

© The Board of Regents of the University of Nebraska. All rights reserved. 47
Sorghum production area Bean Cassava Cowpea Finger millet
Ground-nut Maize Pearl
millet Pigeonpea Sorghum sole crop
Karamoja 6 94
Northern 5 5 12 18 1 4 11 43
Southwest Highlands 27 8 8 57
Eastern 1 1 13 21 8 3 54
Zambia
AEZ I 25 13 62
AEZ II 33 15 3 48
Zimbabwe 17 8 2 45 29
Matabeleland 38 1 5 8 49
Masvingo 31 9 6 8 46
Shonaland, E. 10 35 3 3 3 48

48 © The Board of Regents of the University of Nebraska. All rights reserved.
Sorghum production area Anthracnose Charcoal rot Grain mold Late blight Mildew Nematodes Rust Smut
Ethiopia
Central Rift Valley 6.6 3.3 3.3 3.3 3.3 3.3 6.6 6.6
Eastern, >1500 m altitude 19.1 19.1 19.1 9.5 19.1 9.5 19.1 19.1
Eastern, <1500 m altitude 22.5 15.0 7.5 7.5 15.0 7.5 22.5 22.5
North Central Highlands 40.4 40.4 40.4 40.4 40.4 40.4 80.9 80.9
Northeast Mid-altitude 61.8 61.8 61.8 30.9 61.8 30.9 61.8 92.6
Tigrain Lowlands 34.0 17.0 17.0 17.0 17.0 17.0 42.5 42.5
Southern 14.8 7.4 7.4 7.4 7.4 7.4 14.8 14.8
Southwest Lowlands 12.9 12.9 38.6 12.9 12.9 12.9 12.9 32.2
Tigrain Highlands 2.8 2.8 2.8 2.8 2.8 2.8 5.6 5.6
Western 16.7 11.2 11.2 11.2 11.2 11.2 22.3 22.3
Kenya
Coast 0.6 0.0 0.2 1.2 0.0 0.0 0.4 0.8
Rift Valley 0.8 0.8 0.3 0.8 1.1 0.1 0.6 2.2
West 2.4 1.2 0.6 1.8 0.1 0.1 1.8 1.2
East-Central 1.9 5.8 9.7 3.9 3.9 0.4 7.8 3.9
Nyanza 9.7 0.5 9.7 12.1 0.5 0.5 4.8 4.8
Malawi
Malawi 13.7 0.6 17.0 0.6 2.7 1.7 5.7 1.2
Mozambique
Southern 0.3 0.3 3.0 0.3 9.0 0.3 10.6 0.3
Northern 1.6 1.6 70.8 1.6 15.7 1.6 70.8 1.6
Central 1.8 1.8 26.6 1.8 17.7 1.8 53.1 1.8
Rwanda
>1800 m 8.0 0.0 6.0 0.0 0.0 0.5 2.0 0.0
1500-1800 m 2.9 0.0 0.7 5.9 5.9 2.9 5.9 14.7
<1500 m 5.0 1.2 0.3 12.5 2.5 2.5 10.0 5.0
Tanzania
Lake Zone 1.0 4.8 23.8 19.0 4.8 1.0 4.8 28.5
Western 0.1 0.7 2.1 1.4 0.7 0.1 0.7 3.5
Central 1.3 1.3 19.1 19.1 6.4 1.3 6.4 38.3
Eastern 3.1 1.5 4.6 3.1 1.5 0.3 1.5 6.1
Southern 5.0 0.5 7.5 7.5 5.0 0.5 2.5 10.1
Northern 0.2 0.2 3.5 3.5 1.2 0.2 0.2 7.0
Southern Highlands 0.7 3.5 10.6 7.1 3.5 0.7 3.5 17.6

© The Board of Regents of the University of Nebraska. All rights reserved. 49
Sorghum production area Anthracnose Charcoal rot Grain mold Late blight Mildew Nematodes Rust Smut
Uganda
Central and West 6.1 3.6 4.4 1.6 0.8 0.8 2.4 6.1
Karamoja 4.7 1.5 4.0 1.5 1.1 0.7 2.9 5.8
Northern 13.4 3.2 21.0 8.9 6.4 2.5 13.4 22.9
Southwest Highlands 2.5 0.3 1.9 0.3 0.3 0.3 0.3 6.3
Eastern 6.0 0.3 4.3 0.9 1.7 0.3 1.7 6.2
Zambia
AEZ I 0.6 1.3 4.1 0.2 1.3 2.5 0.9 8.2
AEZ II 6.9 0.2 6.6 0.2 0.0 0.7 0.7 0.5
Zimbabwe
Matabeleland 1.4 2.8 0.7 2.8 1.4 2.8 4.9 3.5
Masvingo 1.1 2.1 0.5 2.1 1.1 3.2 4.7 1.6
Shonaland, E. 0.7 1.4 1.4 2.0 1.4 0.7 1.4 1.0

50 © The Board of Regents of the University of Nebraska. All rights reserved.
Sorghum production area
Army worm
Aphid Cut worm
B. fusca
C. partellus
Other Total Chafer grub
Grasshopper/locust
Midge Shootfly
Ethiopia
Central Rift Valley 6.6 3.3 6.6 6.6 9.9 0.3 16.8 9.9 6.6 6.6 9.9
Eastern, >1500 m altitude
19.1 9.5 19.1 28.6 28.6 1.0 58.2 38.2 19.1 28.6 28.6
Eastern, <1500 m altitude
15.0 15.0 15.0 15.0 22.5 0.7 38.2 15.0 15.0 15.0 22.5
North Central Highlands
121.3 80.9 80.9 80.9 40.4 40.4 161.7 121.3 80.9 80.9 80.9
Northeast Mid-altitude
92.6 30.9 30.9 61.8 123.5 3.1 188.4 92.6 61.8 61.8 92.6
Tigrain Lowlands 42.5 34.0 25.5 34.0 84.9 1.7 120.6 67.9 51.0 34.0 42.5
Southern 22.2 7.4 14.8 14.8 29.6 0.7 45.1 14.8 7.4 14.8 22.2
Southwest Lowlands
19.3 12.9 12.9 12.9 38.6 1.3 52.8 25.7 12.9 25.7 25.7
Tigrain Highlands 5.6 2.8 5.6 5.6 2.8 2.8 11.2 5.6 2.8 5.6 8.4
Western 33.5 16.7 22.3 22.3 27.9 6.1 56.3 27.9 16.7 22.3 27.9
Kenya
Coast 0.4 0.2 0.4 0.6 0.6 1.2 2.3 0.0 0.0 0.4 2.0
Rift Valley 0.6 0.3 0.8 0.6 0.8 1.4 2.8 0.1 0.1 1.1 1.7
West 1.2 1.2 0.6 1.2 2.4 3.0 6.5 0.1 0.1 2.4 3.6
East-Central 3.9 5.8 1.9 1.9 1.9 3.9 7.8 0.4 0.4 5.8 7.8
Nyanza 4.8 0.5 9.7 2.4 2.4 12.1 16.9 0.5 0.5 7.3 36.3
Malawi
Malawi 0.6 1.7 1.2 0.6 4.4 15.2 20.2 5.8 5.5 0.3 2.7
Mozambique
Southern 0.3 0.3 0.3 0.3 3.0 3.8 7.1 6.0 0.3 0.3 3.0
Northern 1.6 1.6 1.6 1.6 15.7 15.7 33.0 31.5 1.6 1.6 23.6
Central 1.8 1.8 1.8 1.8 26.6 17.7 46.1 35.4 1.8 1.8 17.7
Rwanda
>1800 m 0.5 0.0 0.5 2.0 0.5 2.0 4.5 0.5 0.5 0.5 4.0
1500-1800 m 0.7 2.9 0.7 0.7 0.7 17.6 19.1 0.7 8.8 0.7 17.6
<1500 m 0.3 2.5 0.3 0.3 12.5 0.0 12.8 0.3 2.5 0.3 12.5
Tanzania
Lake Zone 9.5 14.3 1.0 19.0 19.0 19.0 57.0 1.0 1.0 23.8 19.0
Western 1.4 2.1 0.1 0.1 0.1 2.8 3.1 0.1 0.1 1.4 1.4
Central 19.1 12.8 6.4 12.8 12.8 31.9 57.4 1.3 6.4 12.8 6.4
Eastern 4.6 3.1 1.5 0.3 0.3 9.2 9.8 0.3 0.3 1.5 3.1
Southern 5.0 7.5 2.5 0.5 0.5 15.1 16.1 0.5 0.5 5.0 2.5
Northern 3.5 2.3 1.2 2.3 2.3 5.9 10.6 0.2 1.2 2.3 1.2
Southern Highlands
7.1 10.6 0.7 0.7 0.7 14.1 15.5 0.7 0.7 7.1 7.1
Uganda
Central and West 1.6 1.2 4.4 5.3 10.1 10.1 25.5 0.4 0.4 9.3 12.1
Karamoja 2.2 1.5 2.9 2.6 7.3 5.1 14.9 0.4 1.5 5.5 12.4
Northern 7 6 5 1 9 5 8 3 20 3 33 1 61 7 1 3 8 9 15 3 32 4
Stem borer
© The Board of Regents of the University of Nebraska. All rights reserved.50
Mozambique
Rwanda
© The Board of Regents of the University of Nebraska. All rights reserved. 51
Sorghum production area
Army worm
Aphid Cut worm
B. fusca
C. partellus
Other Total Chafer grub
Grasshopper/locust
Midge Shootfly
Ethiopia
Central Rift Valley 6.6 3.3 6.6 6.6 9.9 0.3 16.8 9.9 6.6 6.6 9.9
Eastern, >1500 m altitude
19.1 9.5 19.1 28.6 28.6 1.0 58.2 38.2 19.1 28.6 28.6
Eastern, <1500 m altitude
15.0 15.0 15.0 15.0 22.5 0.7 38.2 15.0 15.0 15.0 22.5
North Central Highlands
121.3 80.9 80.9 80.9 40.4 40.4 161.7 121.3 80.9 80.9 80.9
Northeast Mid-altitude
92.6 30.9 30.9 61.8 123.5 3.1 188.4 92.6 61.8 61.8 92.6
Tigrain Lowlands 42.5 34.0 25.5 34.0 84.9 1.7 120.6 67.9 51.0 34.0 42.5
Southern 22.2 7.4 14.8 14.8 29.6 0.7 45.1 14.8 7.4 14.8 22.2
Southwest Lowlands
19.3 12.9 12.9 12.9 38.6 1.3 52.8 25.7 12.9 25.7 25.7
Tigrain Highlands 5.6 2.8 5.6 5.6 2.8 2.8 11.2 5.6 2.8 5.6 8.4
Western 33.5 16.7 22.3 22.3 27.9 6.1 56.3 27.9 16.7 22.3 27.9
Kenya
Coast 0.4 0.2 0.4 0.6 0.6 1.2 2.3 0.0 0.0 0.4 2.0
Rift Valley 0.6 0.3 0.8 0.6 0.8 1.4 2.8 0.1 0.1 1.1 1.7
West 1.2 1.2 0.6 1.2 2.4 3.0 6.5 0.1 0.1 2.4 3.6
East-Central 3.9 5.8 1.9 1.9 1.9 3.9 7.8 0.4 0.4 5.8 7.8
Nyanza 4.8 0.5 9.7 2.4 2.4 12.1 16.9 0.5 0.5 7.3 36.3
Malawi
Malawi 0.6 1.7 1.2 0.6 4.4 15.2 20.2 5.8 5.5 0.3 2.7
Mozambique
Southern 0.3 0.3 0.3 0.3 3.0 3.8 7.1 6.0 0.3 0.3 3.0
Northern 1.6 1.6 1.6 1.6 15.7 15.7 33.0 31.5 1.6 1.6 23.6
Central 1.8 1.8 1.8 1.8 26.6 17.7 46.1 35.4 1.8 1.8 17.7
Rwanda
>1800 m 0.5 0.0 0.5 2.0 0.5 2.0 4.5 0.5 0.5 0.5 4.0
1500-1800 m 0.7 2.9 0.7 0.7 0.7 17.6 19.1 0.7 8.8 0.7 17.6
<1500 m 0.3 2.5 0.3 0.3 12.5 0.0 12.8 0.3 2.5 0.3 12.5
Tanzania
Lake Zone 9.5 14.3 1.0 19.0 19.0 19.0 57.0 1.0 1.0 23.8 19.0
Western 1.4 2.1 0.1 0.1 0.1 2.8 3.1 0.1 0.1 1.4 1.4
Central 19.1 12.8 6.4 12.8 12.8 31.9 57.4 1.3 6.4 12.8 6.4
Eastern 4.6 3.1 1.5 0.3 0.3 9.2 9.8 0.3 0.3 1.5 3.1
Southern 5.0 7.5 2.5 0.5 0.5 15.1 16.1 0.5 0.5 5.0 2.5
Northern 3.5 2.3 1.2 2.3 2.3 5.9 10.6 0.2 1.2 2.3 1.2
Southern Highlands
7.1 10.6 0.7 0.7 0.7 14.1 15.5 0.7 0.7 7.1 7.1
Uganda
Central and West 1.6 1.2 4.4 5.3 10.1 10.1 25.5 0.4 0.4 9.3 12.1
Karamoja 2.2 1.5 2.9 2.6 7.3 5.1 14.9 0.4 1.5 5.5 12.4
Northern 7.6 5.1 9.5 8.3 20.3 33.1 61.7 1.3 8.9 15.3 32.4
SW Highlands 0.3 3.1 1.3 1.6 5.3 4.4 11.3 0.3 0.3 6.6 9.7
Stem borer
© The Board of Regents of the University of Nebraska. All rights reserved. 51
Uganda
Zimbabwe
Zambia
Southwest Highlands

52 © The Board of Regents of the University of Nebraska. All rights reserved.
Sorghum production area Domestic animals Wildlife Birds, other Quela Striga Theft Weeds
Ethiopia
Central Rift Valley 3.3 0.3 3.3 16.5 0.3 0.3 6.6
Eastern, >1500 m altitude 1.0 1.0 1.0 28.6 38.2 1.0 28.6
Eastern, <1500 m altitude 0.7 0.7 0.7 30.0 30.0 0.7 22.5
North Central Highlands 4.0 4.0 40.4 121.3 161.7 4.0 121.3
Northeast Mid-altitude 3.1 3.1 30.9 123.5 154.4 3.1 92.6
Tigrain Lowlands 1.7 17.0 17.0 67.9 101.9 1.7 51.0
Southern 0.7 7.4 7.4 29.6 22.2 0.7 14.8
Southwest Lowlands 12.9 38.6 12.9 64.3 1.3 1.3 38.6
Tigrain Highlands 2.8 0.3 0.3 5.6 11.2 2.8 8.4
Western 1.1 6.1 11.2 39.0 39.0 1.1 27.9
Kenya
Coast 0.2 0.4 2.0 2.0 2.3 0.2 1.6
Rift Valley 0.3 1.1 1.7 2.8 0.1 0.1 0.8
West 0.6 0.6 3.6 4.7 9.5 0.1 3.0
East-Central 3.9 9.7 15.5 29.1 3.9 0.4 19.4
Nyanza 7.3 2.4 24.2 24.2 36.3 2.4 12.1
Malawi
Malawi 5.1 3.1 32.3 5.1 6.5 1.2 31.6
Mozambique
Southern 0.3 0.3 34.7 0.3 0.3 0.3 10.6
Northern 1.6 1.6 236.0 1.6 1.6 1.6 78.7
Central 1.8 1.8 203.7 1.8 1.8 1.8 88.6
Rwanda
>1800 m 4.0 22.4 21.9 0.0 0.0 0.0 15.9
1500-1800 m 14.7 5.9 14.7 0.0 44.0 5.9 29.3
<1500 m 2.5 2.5 5.0 0.0 13.7 0.0 5.0
Tanzania
Lake Zone 1.0 9.5 28.5 28.5 61.8 1.0 47.5
Western 0.1 0.7 7.0 7.0 8.4 0.1 7.7
Central 6.4 19.1 57.4 76.6 51.0 1.3 76.6
Eastern 3.1 3.1 15.3 15.3 12.2 0.3 23.0
Southern 0.5 7.5 30.2 25.2 20.1 0.5 35.2
Northern 1.2 3.5 10.6 14.1 9.4 0.2 14.1
Southern Highlands 0.7 3.5 35.3 35.3 42.3 0.7 38.8
Mozambique

© The Board of Regents of the University of Nebraska. All rights reserved. 53
Sorghum production area Domestic animals Wildlife Birds, other Quela Striga Theft Weeds
Uganda
Central and West 4.0 6.1 19.4 15.8 17.8 3.2 20.2
Karamoja 7.7 1.8 8.4 8.4 13.9 4.7 10.6
Northern 19.7 3.8 15.3 23.5 65.5 6.4 40.7
Southwest Highlands 1.3 0.3 6.9 4.4 0.3 0.3 16.6
Eastern 3.3 0.9 4.8 9.0 21.1 1.1 11.8
Zambia
AEZ I 1.3 3.8 4.4 5.0 6.0 0.6 9.1
AEZ II 2.5 1.5 7.9 2.5 3.2 0.5 8.6
Zimbabwe
Matabeleland 9.7 20.8 16.6 36.8 22.9 6.2 10.4
Masvingo 7.9 14.7 13.7 30.5 21.6 5.3 8.4
Shonaland, E. 2.4 4.7 4.7 9.8 5.8 1.0 4.7

54 © The Board of Regents of the University of Nebraska. All rights reserved.
Sorghum production area Acid soilNutrient deficiencies
SalinityWater deficits
N P K Other Early Mid-season Late
Ethiopia
Central Rift Valley 0.3 9.9 6.6 0.3 0.3 0.3 9.9 3.3 6.6
Eastern, >1500 m altitude 1.0 28.6 9.5 1.0 1.0 1.0 19.1 1.0 28.6
Eastern, <1500 m altitude 0.7 22.5 15.0 0.7 0.7 0.7 22.5 7.5 15.0
North Central Highlands 4.0 161.7 40.4 4.0 40.4 4.0 80.9 40.4 121.3
Northeast Mid-altitude 3.1 3.1 3.1 3.1 3.1 3.1 92.6 3.1 61.8
Tigrain Lowlands 1.7 1.7 1.7 1.7 1.7 1.7 17.0 17.0 17.0
Southern 0.7 22.2 7.4 0.7 7.4 0.7 14.8 7.4 14.8
Southwest Lowlands 12.9 38.6 25.7 1.3 25.7 6.4 12.9 12.9 12.9
Tigrain Highlands 0.3 11.2 5.6 0.3 2.8 0.3 2.8 5.6 8.4
Western 1.1 39.0 11.2 1.1 11.2 1.1 22.3 11.2 27.9
Kenya
Coast 0.0 1.6 1.0 0.0 0.0 0.6 0.0 1.2 0.4
Rift Valley 0.1 1.7 1.4 0.1 0.1 0.6 0.1 2.2 1.4
West 0.1 7.7 4.7 0.1 0.6 1.2 0.1 1.2 0.6
East-Central 0.4 11.7 5.8 0.4 0.4 3.9 0.4 11.7 5.8
Nyanza 0.5 14.5 12.1 0.5 0.5 4.8 0.5 12.1 2.4
Malawi
Malawi 5.7 40.9 29.2 13.6 0.6 0.3 7.2 7.2 17.2
Mozambique
Southern 0.3 22.6 10.6 7.5 0.3 0.3 18.1 27.1 19.6
Northern 1.6 118.0 62.9 23.6 1.6 1.6 78.7 118.0 94.4
Central 1.8 132.8 106.3 35.4 1.8 1.8 79.7 97.4 132.8
Rwanda
>1800 m 22.4 23.9 19.9 11.9 0.5 0.0 19.9 25.9 10.0
1500-1800 m 14.7 11.7 11.7 11.7 0.7 0.0 8.8 17.6 5.9
<1500 m 5.0 7.5 7.5 5.0 0.3 0.0 5.0 10.0 5.0
Tanzania
Lake Zone 1.0 71.3 47.5 1.0 1.0 4.8 14.3 28.5 9.5
Western 0.1 10.5 5.6 0.7 0.1 1.4 2.1 7.0 1.4
Central 1.3 82.9 38.3 6.4 1.3 6.4 31.9 63.8 12.8
Eastern 3.1 19.9 12.2 3.1 0.3 0.3 4.6 9.2 3.1
Southern 0.5 35.2 20.1 5.0 0.5 5.0 10.1 7.5 5.0
Northern 0.2 15.3 7.0 1.2 0.2 1.2 5.9 11.7 2.3
Southern Highlands 0.7 52.9 28.2 3.5 0.7 7.1 10.6 35.3 7.1
Mozambique
© The Board of Regents of the University of Nebraska. All rights reserved. 55
Sorghum production area Acid soilNutrient deficiencies
SalinityWater deficits
N P K Other Early Mid-season Late
Uganda
Central and West 1.2 13.3 10.5 7.3 5.7 1.6 4.4 8.5 5.7
Karamoja 0.4 10.2 6.2 4.7 0.4 0.4 6.9 12.8 3.3
Northern 0.6 30.5 15.9 5.7 3.8 0.6 14.6 17.2 10.2
Southwest Highlands 0.3 17.5 6.9 3.8 7.2 0.3 6.9 11.6 6.9
Eastern 0.3 9.8 5.6 1.1 0.5 0.2 4.0 8.7 4.3
Zambia
AEZ I 2.5 13.8 6.6 5.3 0.3 0.0 1.3 2.8 9.7
AEZ II 6.6 10.6 6.6 4.2 0.2 0.0 1.2 2.5 0.2
Zimbabwe
Matabeleland 0.7 27.0 4.2 4.2 4.9 2.1 18.0 21.5 30.5
Masvingo 1.6 19.5 3.2 2.6 3.2 1.1 10.0 15.8 24.7
Shonaland, E. 0.2 5.4 2.6 1.0 1.0 0.0 1.0 1.0 3.4

56 © The Board of Regents of the University of Nebraska. All rights reserved.
Sorghum production area Cold Crusting Flooding Heat Low radiation Root barriers Wind
Ethiopia
Central Rift Valley 0.3 6.6 0.3 9.9 0.3 0.3 6.6
Eastern, >1500 m altitude 1.0 19.1 1.0 1.0 1.0 1.0 28.6
Eastern, <1500 m altitude 0.7 0.7 0.7 0.7 0.7 0.7 15.0
North Central Highlands 4.0 80.9 4.0 40.4 40.4 4.0 80.9
Northeast Mid-altitude 3.1 61.8 3.1 61.8 3.1 3.1 30.9
Tigrain Lowlands 1.7 1.7 1.7 51.0 1.7 1.7 34.0
Southern 0.7 14.8 0.7 14.8 0.7 0.7 14.8
Southwest Lowlands 1.3 25.7 25.7 38.6 1.3 1.3 19.3
Tigrain Highlands 5.6 5.6 0.3 0.3 5.6 2.8 5.6
Western 1.1 22.3 1.1 16.7 6.1 1.1 22.3
Kenya
Coast 0.0 0.2 0.4 0.6 0.0 0.2 0.0
Rift Valley 0.8 0.8 0.8 2.2 0.1 0.1 0.3
West 0.1 1.8 3.0 1.8 0.1 1.2 0.6
East-Central 15.5 3.9 0.4 9.7 0.4 1.9 3.9
Nyanza 9.7 2.4 2.4 2.4 0.5 0.5 2.4
Malawi
Malawi 0.6 0.6 7.9 0.6 1.2 0.3 0.6
Mozambique
Southern 0.3 0.3 0.3 0.3 0.3 0.3 0.3
Northern 1.6 1.6 1.6 1.6 1.6 1.6 1.6
Central 1.8 1.8 1.8 1.8 1.8 1.8 1.8
Rwanda
>1800 m 2.0 0.0 0.0 0.0 0.0 2.0 11.9
1500-1800 m 0.0 14.7 5.9 0.0 0.0 2.9 29.3
<1500 m 0.0 2.5 0.3 1.2 0.0 0.0 5.0
Tanzania
Lake Zone 1.0 4.8 1.0 1.0 1.0 1.0 1.0
Western 0.1 2.1 0.1 0.1 0.1 0.1 0.1
Central 1.3 12.8 1.3 1.3 1.3 12.8 1.3
Eastern 0.3 0.3 0.3 0.3 0.3 0.3 0.3
Southern 0.5 0.5 0.5 0.5 0.5 0.5 0.5
Northern 0.2 2.3 0.2 0.2 0.2 2.3 0.2
Southern Highlands 0.7 10.6 0.7 0.7 0.7 0.7 0.7
Mozambique

© The Board of Regents of the University of Nebraska. All rights reserved. 57
Sorghum production area Cold Crusting Flooding Heat Low radiation Root barriers Wind
Uganda
Central and West 0.4 0.4 1.6 8.5 0.4 0.8 1.6
Karamoja 0.3 2.2 1.1 0.3 0.3 1.8 2.2
Northern 0.9 0.9 2.5 4.5 0.9 7.6 6.4
Southwest Highlands 5.0 1.9 0.3 0.3 0.3 4.1 2.2
Eastern 0.2 0.2 0.5 0.2 0.2 1.9 0.2
Zambia
AEZ I 0.2 0.2 1.3 1.9 0.0 0.0 0.2
AEZ II 0.2 0.2 3.9 0.2 0.5 0.0 0.2
Zimbabwe
Matabeleland 11.8 0.7 2.4 9.0 0.0 2.8 3.5
Masvingo 3.7 0.5 1.3 11.0 0.0 0.0 2.1

58 © The Board of Regents of the University of Nebraska. All rights reserved.
Sorghum production areaGrain color Grain size,
100 seed Panicle type Panicle positioning
Brown Red Tan White <3g >3g Loose Semi-compact Compact Crooked Erect
Ethiopia
Central Rift Valley 3 5 2 5 4 3
Eastern, >1500 m altitude 3 4 2 3 3 3 2
Eastern, <1500 m altitude 6 4 5
North Central Highlands 2 2 4 2 3
Northeast Mid-altitude 3 4 2 3 3
Tigrain Lowlands 2 6 3
Southern 3 5 3 5 3 3
Southwest Lowlands 5 5 3
Tigrain Highlands 2 2 6 4
Western 3 5 3 5 3 3
Kenya
Coast 3 1 3 2 1 1 2 1 2
Rift Valley 2 1 4 1 3 1 2 1 3
West 3 4 1 1 1 1 3 2 1
East-Central 1 2 2 1 2 2 1 1 1 2
Nyanza 4 2 1 2 4 1 1 1 2
Malawi
Malawi 1 1 4 2 3 1 1 2
Mozambique
Southern 1 3 6 3 5
Northern 1 3 6 3 5
Central 1 3 6 3 5
Rwanda
>1800 m 7 2 2 1 3 1 1 3
1500-1800 m 2 4 1 1 2 3 2
<1500 m 1 3 2 2 2 1 1 2 1 3
Tanzania
Lake Zone 1 3 2 3 2 2 1 2 2
Western 1 3 2 1 2 3 3 1 3
Central 3 2 1 2 2 2 1 1 3

© The Board of Regents of the University of Nebraska. All rights reserved. 59
Sorghum production areaGrain color Grain size,
100 seed Panicle type Panicle positioning
Brown Red Tan White <3g >3g Loose Semi-compact Compact Crooked Erect
Eastern 1 1 1 3 2 3 1 2 3
Southern 1 1 2 4 3 2 1 1 2 2
Northern 3 2 3 2 2 1 2
Southern Highlands 3 1 2 2 3 2 3
Uganda
Central and West 4 6 4 1 1 2 1 1
Karamoja 2 3 1 1 1 4 1 3 2 1
Northern 1 4 1 3 3 1 1
Southwest Highlands 2 2 2 1 3 2 2 1
Eastern 3 3 2 1 3 1 1 3 1 1
Zambia
AEZ I 2 6 2 2 1
AEZ II 1 5 2 1 3 3
Zimbabwe
Matabeleland 1 1 4 1 1 1 2 1 1
Masvingo 1 1 3 1 1 2 2 1 1
Shonaland, E. 1 2 4 2 1 1 2 1 1

60 © The Board of Regents of the University of Nebraska. All rights reserved.
Sorghum production areaPhotoperiod Plant height Seed tannin Endosperm
textureThresh-abilityInsens. Sens. <1.5 m > 2m 1.5-2 m High Low
Ethiopia
Central Rift Valley 6 2
Eastern, >1500 m altitude 7
Eastern, <1500 m altitude 4 6 2 3
North Central Highlands 4 3 7 3
Northeast Mid-altitude 7 3 2 3
Tigrain Lowlands 2 6 4 2
Southern 6 2
Southwest Lowlands 3 5 6 3
Tigrain Highlands 3 4 7 2
Western 6 2
Kenya
Coast 1 2 1 2 4 3
Rift Valley 1 2 1 2 3 2
West 2 1 3 1 2 3
East-Central 1 2 1 3 3 3
Nyanza 3 1 2 1 2 2
Malawi
Malawi 2 2 2 4 5 1 1 1
Mozambique
Southern 3 3 3 3
Northern 3 3 3 3
Central 3 3 3 3
Rwanda
>1800 m 1 1 5 4 2
1500-1800 m 1 2 4 4 3
<1500 m 1 1 2 2 1 1 1
Tanzania
Lake Zone 2 2 1 3 1 1 2
Western 1 2 3 2 1 2
Central 1 3 3 2 2 2
Eastern 3 3 1 2 2 2
Southern 1 3 1 2 2 2
Northern 2 2 3 2 2 2 2
Southern Highlands 2 3 3 2 2 2

© The Board of Regents of the University of Nebraska. All rights reserved. 61
Sorghum production areaPhotoperiod Plant height Seed tannin Endosperm
textureThresh-abilityInsens. Sens. <1.5 m > 2m 1.5-2 m High Low
Uganda
Central and West 1 1 1 2 2 2 3
Karamoja 2 2 1 1 4 1 3
Northern 4 4 1 3
Southwest Highlands 3 3 3 2 4
Eastern 4 2 1 2 1 3
Zambia
AEZ I 1 3 2 1 4 3 3 1
AEZ II 3 1 1 4 3 2 2
Zimbabwe
Matabeleland 1 4 0 2 3 1 3
Masvingo 1 4 1 1 3 1 3
Shonaland, E. 1 4 1 2 2 1 3

62 © The Board of Regents of the University of Nebraska. All rights reserved.
Sorghum production area Brew-ing
Bak-ing
Boiled-grain Njera Boiled
flourPop-ing
Bever-age1
Build-ing
Grain, animal
Fodder, animal2 Fuel Mulch3
Ethiopia
Central Rift Valley 17 10 13 10 3 3 10 16 13 3
Eastern, >1500 m altitude 13 13 7 20 7 7 10 10 10 3
Eastern, <1500 m altitude 13 7 7 23 7 10 20 13
North Central Highlands 13 13 7 20 3 7 10 13 10 3
Northeast Mid-altitude 13 13 7 20 7 7 10 10 10 3
Tigrain Lowlands 13 7 7 23 7 7 7 10 3 7 7 3
Southern 10 7 20 7 10 3 13 13 13 3
Southwest Lowlands 10 10 10 17 10 17 10 13 3
Tigrain Highlands 13 13 7 20 3 7 7 10 10 10
Western 12 7 7 20 5 8 2 12 14 12 3
Kenya
Coast 13 17 27 7 7 10 7 14
Rift Valley 13 3 17 23 3 7 13 10 10
West 17 27 20 3 7 10 10 6
East-Central 20 20 17 3 7 23 3 6
Nyanza 13 3 23 17 7 7 10 13 6
Malawi
Malawi 35 7 26 23 3 3 1 2
Mozambique
Southern 15 67 7 7 2 2
Northern 25 55 3 12 3 2
Central 29 49 12 8 2
Rwanda
>1800 m 40 10 40 13 3 17 10
1500-1800 m 17 3 3 27 20 3 3
<1500 m 21 16 20 3 3 7
Tanzania
Lake Zone 6 2 11 3 1 3 3 1
Western 7 10 2 3 1 3 2 2
Central 8 11 2 6 2 1
Eastern 10 6 2 2 3 1 3
Southern 6 6 9 3 1 1 2 2
Northern 7 10 2 3 1 3 2 2
Southern Highlands 9 12 1 1 1 2 4

© The Board of Regents of the University of Nebraska. All rights reserved. 63
Sorghum production area Brew-ing
Bak-ing
Boiled-grain Njera Boiled
flourPop-ping
Bever-age1
Build-ing
Grain, animal
Fodder, animal2 Fuel Mulch3
Uganda
Central and West 65 5 1 1 7 7 15
Karamoja 32 14 36 4 8 7
Northern 31 41 8 8 6 3
Southwest Highlands 46 11 19 11 4 4 4
Eastern 21 50 1 5 11 6 6
Zambia
AEZ I 19 7 39 18 11 7 2
AEZ II 19 9 48 13 1 1 1 2
Zimbabwe
Matabeleland 18 2 2 34 2 7 3 2 18 4 2
Masvingo 24 1 4 35 5 4 4 21 2 2
Shonaland, E. 25 3 30 3 8 23