atlantic energy group washington, d.c. 10 jan...
TRANSCRIPT

November 20, 2012 1
Richard O’NeillChief Economic Advisor
Federal Energy Regulation [email protected]
Atlantic Energy GroupWashington, D.C.
10 Jan 2008Views expressed are not necessarily those of
the Commission
November 20, 2012 2
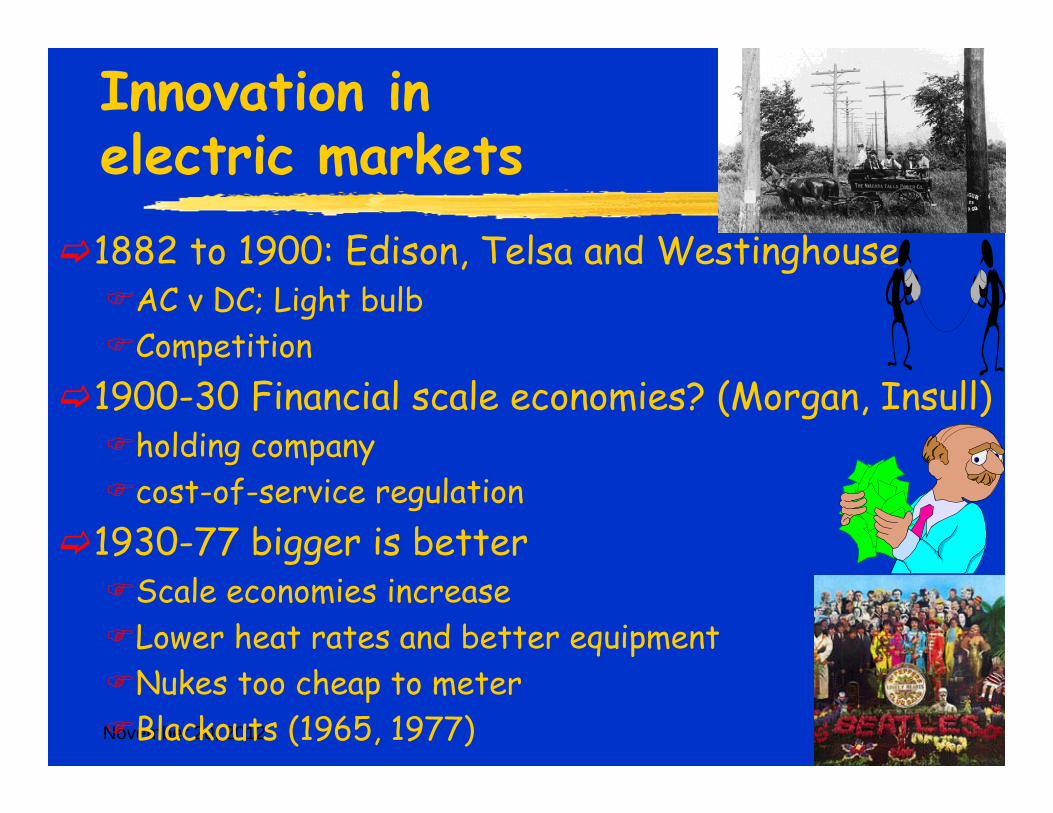
Innovation in electric markets
1882 to 1900: Edison, Telsa and WestinghouseAC v DC; Light bulbCompetition
1900-30 Financial scale economies? (Morgan, Insull) holding companycost-of-service regulation
1930-77 bigger is betterScale economies increaseLower heat rates and better equipmentNukes too cheap to meterBlackouts (1965, 1977)

November 20, 2012 3
for nuclear plants under cost-of-service regulation

November 20, 2012 4
Policy choicescirca 1977
Cost of service regulation isn’t working wellExcess capacity and blackoutsHigh costs
Let’s try market-based regulationProperly shifts riskStronger incentives
1978 PURPA produces independent powerPhysically possibleNon-Goldilocks prices: too high or too low

November 20, 2012 5
Technology eliminates some market failures 1980-2007
Computing hardware and softwareCommunication: fiber optics and the Internetvertical integration not required: ISOsallows the load to participate in the marketSmart grid [Who could ask for more]Faster response
Energy marketGenerator size small compared to marketQFs and IPPs
Market design: cost-based to market-based

November 20, 2012 6
Non-nukes sold at an average of twice bookNukes sold at less than 15% of bookWas this a mistake?Would these units be achieving the current
load factors and profits if not sold off? Do more efficient units lower the LMP? yes Should the ‘buy back’ contracts been longer?What should be done now? Redo?

November 20, 2012 7
Empirical mud slinging
Everyone has his/her counterfactual.Everyone has his/her factual!!!!!Is this displaced aggression?What if natural gas prices fell?What happens with a large carbon tax or a
renewable mandate?would ISOs and LMPs cause the resulting
prices?
Technical analysis can be fun
November 20, 2012 8
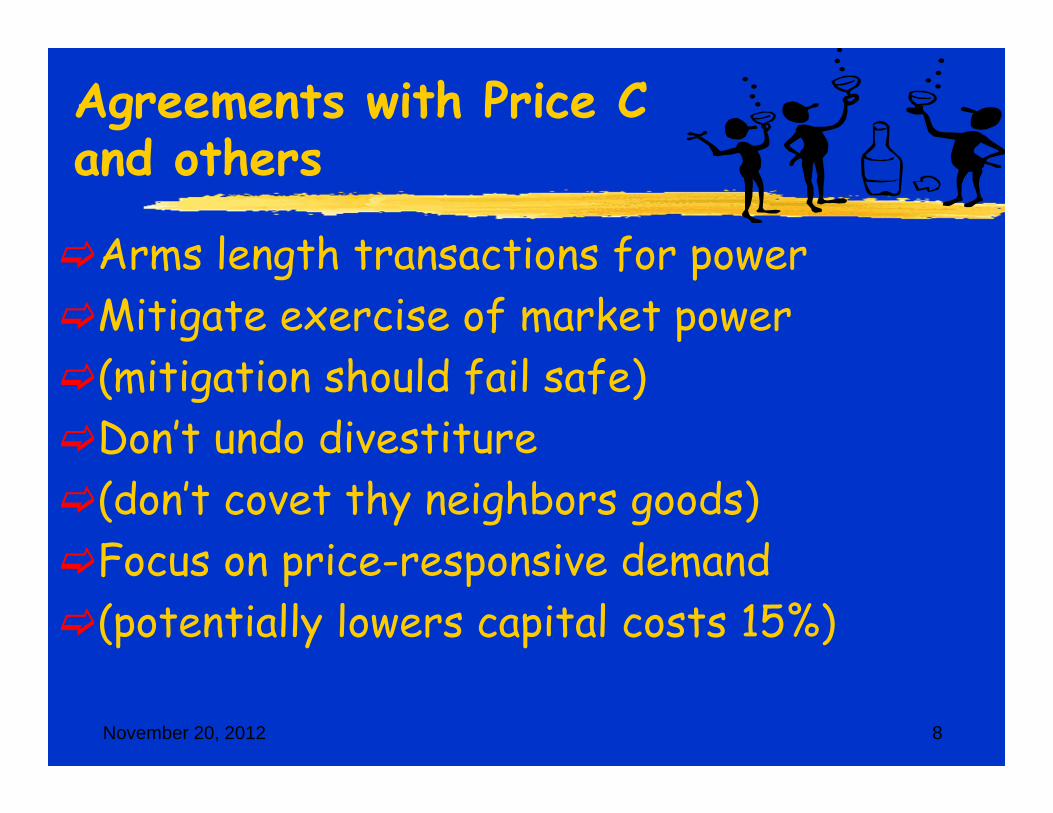
Agreements with Price C and others
Arms length transactions for powerMitigate exercise of market power(mitigation should fail safe)Don’t undo divestiture(don’t covet thy neighbors goods) Focus on price-responsive demand (potentially lowers capital costs 15%)

November 20, 2012 9
Myths and Shibboleths(truth)
FERC has deregulated (FERC has not deregulated anything)Broad socialization does not work(beneficiaries pays does)FERC discourages long term contracts(FERC encourages long term contracts)Deregulation caused the 2003 blackout(a day-two ISO would have prevented the blackout)ISOs are expensive (ISOs are cheap)

November 20, 2012 10
Myths and ShibbolethsCentral planning works better than marketsPrice volatility can be suppressed(Price volatility can be hidden or hedged)Static market shares indicate market power(the market can change and ISOs mitigate hourly)Pay-as-bid will lower prices (it will raise risks then prices )Risks should be borne by consumers(Can we avoid the next round of stranded costs?)
November 20, 2012 11
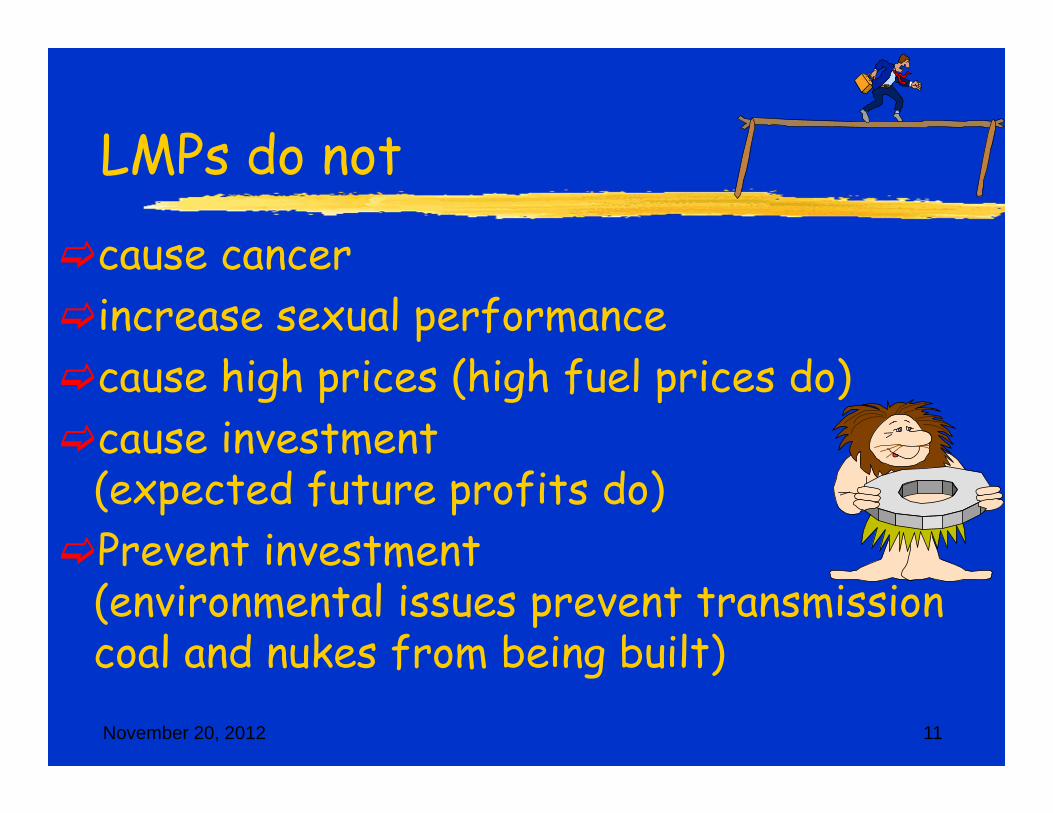
LMPs do not
cause cancerincrease sexual performancecause high prices (high fuel prices do)cause investment
(expected future profits do)Prevent investment
(environmental issues prevent transmission coal and nukes from being built)

November 20, 2012 12
electric end use prices (EIA)
6
7
8
9
10
1960 1965 1970 1975 1980 1985 1990 1995 2000 200year
real
(200
0$) p
rice
Did LMPs cause the 1970 to 1982 price increase?

November 20, 2012 13
UK

November 20, 2012 14
ISOs, LMPs, Efficiency and green power
transparencyAllow better integration of all resourcessolar and wind need real-time ISO markets to
realize full valueWind needs a large real-time balancing marketsolar’s highest output is during peak Send good short term price signals Improve short term efficiency

November 20, 2012 15
Analogies and their problems
analogy ownersCommodity/conduit
Displacement network
other issues pricing
highways public unbundled No congestion Gas tax and toll roads
water public bundled yes other uses usage
Natural gas
private unbundled yes storage and valves
Price caps and no withholding
Air traffic
public unbundled no No pricing Ticket tax
parks public unbundled no congestion Income tax
telecom private mixed No Busy signal Price caps
railroads private bundled no congestion Loose price caps

November 20, 2012 16
Structure conduct performance
StructureNumber of competitorsEntry Access rules
conduct Market power mitigation
PerformanceEfficiencyinnovation
Structure/regulation
cost-of-service
Market-based rates
competitors none one or moreEntry/Access hard easier
Conduct: market power mitigation
Price caps Bid capsAllocate fixed costs
Mitigate bids in an auction
Performance incentives incentivesEfficiency Weak strongInnovation Weak!!!!!!!!!! strong

November 20, 2012 17
ISO Competition Issues
Short-termVertical market power: ISO control Horizontal market power: bid mitigation
Long-term Entry barriersgenerationtransmission Price-responsive demand
Contracts differing expectations

November 20, 2012 18
The Coase paradox: Are efficient markets ‘free’?
“All exchanges regulate in great detail the activities of those who trade in these markets
these exchanges often used by economists as examples of a perfect competition,
for anything approaching perfect competition to exist, an intricate system of rules and regulations would be normally needed.
explanation for these regulations: that they exist in order to reduce transaction costs
Those operating in these markets have to depend, therefore, on the legal system of the State."
Coase, R.H. (1988), ‘The Firm, the Market and the Law’, in The Firm,
the Market and the Law, Chicago, U. of Chicago Press

November 20, 2012 19
What is needed for efficiency and innovation?
good information and market designmitigation of market powerrecognition of how electricity works understand the choicesfree market
market with market rulesadministrative rules
Regulation should encourage innovation and efficiency

November 20, 2012 20
What are the results of ISOs and market-based rates in first ten years
The ghosts of ISOs and
market-based rates past

November 20, 2012 21
Failed market designsZonal markets (Cal, PJM, NE, UK)Prohibit long-term contracts Sequential markets for energy and anc servicesOne settlement systemsInfeasible markets (Cal PX and UK)Ignore non-convexities (start-up and no-load) Ignore market powerall ended in administrative intervention

November 20, 2012 22
Market Design that works
Locational (locational marginal prices)Bid-based dispatchCo-optimizationEfficiencyreliability
Market power (bid) mitigationFreedom of ‘bilateral’ contractsLong term contractingShort-term contracting

November 20, 2012 23
Generation Capacity (up to 4 years) ensure Adequate compensation generation adequacy for reliability Call option in spot market
Transmission rights (up to 10 years) hedge transmission congestion costsOptions and obligations based on difference in LMPs
Day-ahead (24 hours): scheduling market efficiently and reliability (from bids) schedule generation, load and,
transmissionReal-time (5 Minutes): balancing market
efficiently and reliability (from bids) dispatch generation, load and transmission ancillary services
Freedom of bilateral contracting and opt out of above

November 20, 2012 24
Market Monitoring and Mitigation
analyze market design and market powerCorrect market designGive must run contracts for reliability
Ex ante mitigation in ISO is the generator bidding above marginal costs?If so mitigate to marginal costs plus error
Investigate physical withholdingphysical withholding: not available at rated capacity. good reason: scheduled maintenance or forced outagePenalties for violations physical withholding

November 20, 2012 25
Some numbers
Factsand
Counter facts

November 20, 2012 26

November 20, 2012 27-10%
-5%
0%
5%
10%
15%
20%
25%
30%
35%
1990 1992 1994 1996 1998 2000 2002 2004
Cap
acity
Fac
tor I
ncre
men
t ove
r 199
0
All other units
Divested units
Capacity factors at nuclear plants

November 20, 2012 28
Recent studies are confirming the theory
Bushnell and Wolfram, “Ownership Change, Incentives and Plant Efficiency: The Divestiture of U.S. Electric Generation Plants,” 2006after divestiture ~2% lower heat rates.nationwide $4 billion per year.helps achieve environmental goals
Mansur and White, “Market Organization and Market Efficiency in Electricity Markets,” 2007 Examine PJM market expansion.Dramatic increase in flows from inexpensive in the
Midwest to classic PJM.savings of $180 million per year.

November 20, 2012 29
-0.6
-0.5
-0.4
-0.3
-0.2
-0.1
0
0.1
0.2
Non
fuel
Exp
ense
Gro
wth
Rel
ativ
e to
198
1
MUNI Plants
IOU: Non-restructured States
IOU: Restructured States
Figure 2: Nonfuel Expense Trends by Company Type and Restructuring Status

November 20, 2012 30
Results of ISOs and market-based rates in first ten years
More competitionLower heat rates Higher capacity factors Lower labor costsHigher profits for efficient generatorsHigher trading efficiencyBetter dispatch softwareBetter reliability software

November 20, 2012 31
What happens in next ten years?
The ghosts of ISOs and
market-based ratesfuture

November 20, 2012 32
Improvements in MIP (same hardware)
one day unit commitment problemyear Cplex version Time in sec B&B nodes1993 2.2 1646 (unsolved) 1107922007 11.0 1.1 75
And though the holes were rather small they had to count them all
one week unit commitment problemYear Cplex version Time in sec B&B nodes1998 6.0 8000 (unsolved) 44900
2007 11.0 103 2220Eight days a week is not enough to show I care.

November 20, 2012 33
Real-time market Survey ResultsLet me tell you how it will be
ISO Current or previous approach
Date or planned date of MIP
Estimated savings on an annual basis
PJM MIP 2006 $100 millionISONE LR/LP 2008 No estimateSPP LP none N/ANYISO LR/LP none N/AMISO judgment with LR 2008 No estimateCAISO LR. 2008 ~$1 million

November 20, 2012 34
End-use marketsgot to get you into my life
Vertical demand curve in ISO marketsConsumers receive very weak price signalsSee monthly average priceNo real time meter; No real time priceOn a hot summer day wholesale price = $1000/MWHRetail price = $100/MWH
Solution: real time pricing and Demand-side non-convex (MIP) bidding
Two-sided market using MIP!!!!!!!!!
He's as blind as he can be just sees what he wants to see

November 20, 2012 35
day-ahead market Survey ResultsLet me tell you how it will be
ISO Current or previous approach
Date or planned date of MIP-based implementation
Estimated savings on an annual basis
PJM LR 2004 $60 Million
ISONE LR/LP 2008 None
SPP N/A N/A N/A
NYISO LR/LP none N/A
MISO LR 2008 None
CAISO LP 2008 $23 million

November 20, 2012 36
Market Benefits of MIP ImplementationPJM Day Ahead Market uplift Costs 2003-2007 ($/MWh Load)
-
0.25
0.50
Jan-
03Fe
b-03
Mar
-03
Apr
-03
May
-03
Jun-
03Ju
l-03
Aug-
03Se
p-03
Oct
-03
Nov
-03
Dec
-03
Jan-
04Fe
b-04
Mar
-04
Apr
-04
May
-04
Jun-
04Ju
l-04
Aug-
04Se
p-04
Oct
-04
Nov
-04
Dec
-04
Jan-
05Fe
b-05
Mar
-05
Apr
-05
May
-05
Jun-
05Ju
l-05
Aug-
05Se
p-05
Oct
-05
Nov
-05
Dec
-05
Jan-
06Fe
b-06
Mar
-06
Apr
-06
May
-06
Jun-
06Ju
l-06
Aug-
06Se
p-06
Oct
-06
Nov
-06
Dec
-06
Jan-
07Fe
b-07
Mar
-07
Apr
-07
May
-07
Jun-
07Ju
l-07
Aug-
07Se
p-07
Oct
-07
$/M
Wh
Load
Lower cost to maintain operational reliability
Lower uplift payments

November 20, 2012 37
Linear Residual Demand and Local Optimal Solutions
Equilibrium Points - Local Optima
-$10,000
$0
$10,000
$20,000
$30,000
$40,000
$50,000
0 100 200 300 400 500 600 700
Quantity
Net
Ben
efit
-$20
-$10
$0
$10
$20
$30
$40
$50
$60
$70
$80
$90
$100
$110
$120
Mar
gina
l Cos
t
Total Benefits Local Optima Marginal Costs Derived Demand Equilibrium Points
‘eco min’Happy ever after in the market place
November 20, 2012 38
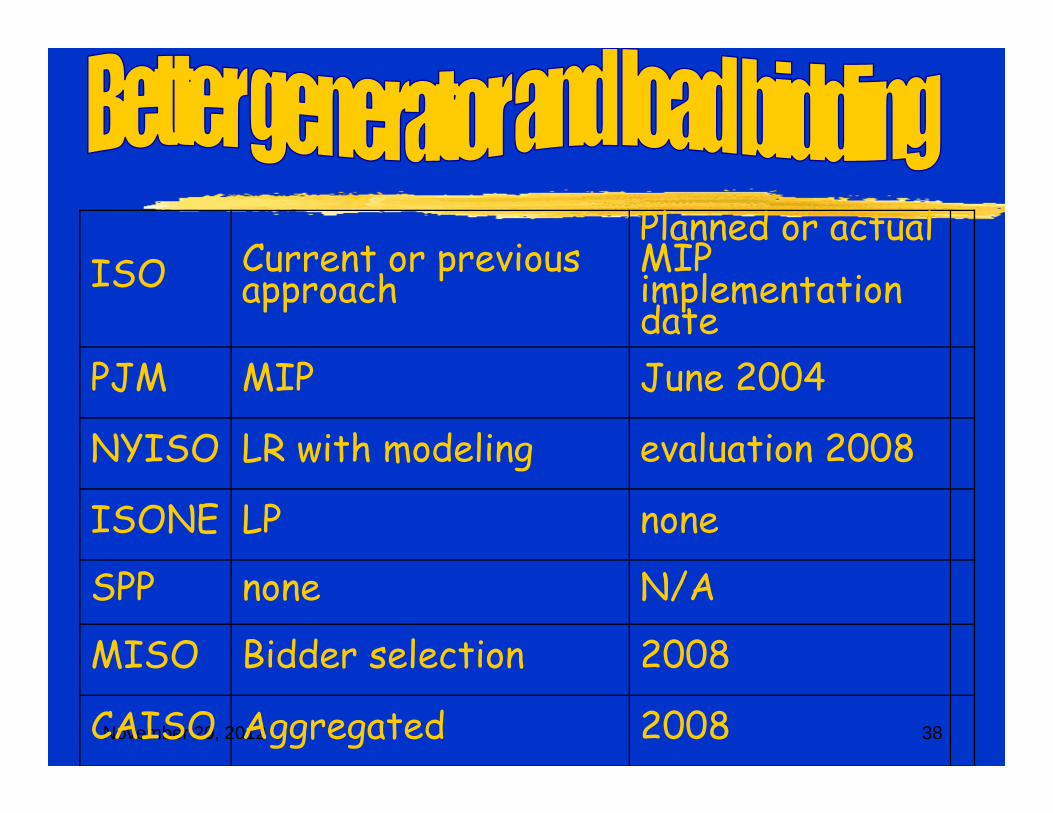
ISO Current or previous approach
Planned or actual MIP implementation date
PJM MIP June 2004
NYISO LR with modeling evaluation 2008
ISONE LP none
SPP none N/A
MISO Bidder selection 2008
CAISO Aggregated 2008

November 20, 2012 39
Open or close circuit breakers using DCOPFIEEE 118 bus provided 25% savingsN-1 for IEEE 118 & RST 96 system showed
savings from 1% to 16%ISONE networks ranged from 5% to 15% savings or $500 Million annual (all solutions have gaps so higher savings may be found)

November 20, 2012 40
Benefits of better market modelingSay the words you long to hear
Benefit/cost can be over 100Bid modeling: CCCT ‘forbidden zones’Topology estimators for reliability:
pricelessBetter reactive power modeling and
marketsTransmission dispatch: 5 to 24% savingsBetter incentives for transmission Worldwide: $10 to $200 billion/year

“A new scientific truth does not triumph by convincing its opponents and making them see the light, but rather because its opponents eventually die, and a new generation grows up that is familiar with it.”
Max Planck, “Scientific Autobiography and Other Papers”
“The magical mystery tour is waiting to take you away,Waiting to take you away. “