atlanta independent school system
TRANSCRIPT

ATLANTAINDEPENDENT
SCHOOL SYSTEMComprehensive Annual Financial Report for theFiscal Year Ended June 30, 2018 Atlanta, Georgia
ATLANTA INDEPENDENT SCHOOL SYSTEM
COMPREHENSIVE ANNUAL FINANCIAL REPORT
FISCAL YEAR ENDED
JUNE 30, 2018
Office of the Chief Financial Officer Lisa Bracken
130 Trinity Avenue, SW
Atlanta, Georgia 30303
ATLANTA INDEPENDENT SCHOOL SYSTEM
Comprehensive Annual Financial Report Table of Contents
Fiscal Year Ended June 30, 2018
Page INTRODUCTORY SECTION
Letter of Transmittal i-vii GFOA Certificate of Achievement viii ASBO International Certificate of Excellence ix
List of Principal Officials x-xvii Appointed Officials xviii
Superintendent’s Information xix-xx Organizational Chart xxi
FINANCIAL SECTION
Report of Independent Certified Public Accountants 1-3 Management’s Discussion and Analysis 4-15 Basic Financial Statements: Government-wide Financial Statements: Statement of Net Position 16 Statement of Activities 17 Fund Financial Statements: Balance Sheet - Governmental Funds 18 Reconciliation of Total Governmental Fund Balances to the Net Position of Governmental Activities 19 Statement of Revenues, Expenditures and Changes in Fund Balances - Governmental Funds 20
Reconciliation of Governmental Funds Statement of Revenues, Expenditures and Changes in Fund Balances to the Government-wide Statement of Activities 21
ATLANTA INDEPENDENT SCHOOL SYSTEM Comprehensive Annual Financial Report
Table of Contents Fiscal Year Ended June 30, 2018
Basic Financial Statements (Continued): Statement of Fiduciary Assets and Liabilities 22
Notes to the Basic Financial Statements 23-57
Required Supplementary Information: Schedule of Proportionate Share of the Net Pension Liability (Teachers Retirement System of Georgia) 58 Schedule of School System’s Contributions (Teachers Retirement System of Georgia) 59 Notes to the Required Supplementary Information (Teachers Retirement System of Georgia) 60 Schedule of Changes in the School System’s Net Pension Liability and Related Ratios (City of Atlanta General Employee’s Pension Fund) 61 Schedule of School System’s Contributions (City of Atlanta General Employee’s Pension Fund) 62 Schedule of the School System’s Proportionate Share of the Net OPEB Liability (School OPEB Fund) 63 Schedule of School System’s Contributions (School OPEB Fund) 64 Notes to the Required Supplementary Information (School OPEB Fund) 65 Schedule of Revenues, Expenditures and Changes in
Fund Balance - Budget and Actual - General Fund 66 OTHER SUPPLEMENTARY INFORMATION Non-Major Governmental Funds: Combining and Individual Fund Statements and Schedules:
Combining Balance Sheet - Non-major Governmental Funds 67 Combining Statement of Revenues, Expenditures and
Changes in Fund Balances - Nonmajor Governmental Funds 68
ATLANTA INDEPENDENT SCHOOL SYSTEM Comprehensive Annual Financial Report
Table of Contents Fiscal Year Ended June 30, 2018
OTHER SUPPLEMENTARY INFORMATION (Continued): Combining Schedule of Revenues, Expenditures and Changes in Fund Balance - Budget and Actual - All Special Revenue Funds Combined 69 Schedule of Revenues, Expenditures and Changes in Fund Balance - Budget and Actual - Title I Special Revenue Fund 70
Schedule of Revenues, Expenditures and Changes in Fund Balance - Budget and Actual - Title II Fund 71
Schedule of Revenues, Expenditures and Changes in Fund Balance - Budget and Actual - Title IV-B Fund 72 Schedule of Revenues, Expenditures and Changes in Fund Balance - Budget and Actual - Food Service Special Revenue Fund 73 Schedule of Revenues, Expenditures and Changes in Fund Balance - Budget and Actual - Lottery Grants Special Revenue Fund 74 Schedule of Revenues, Expenditures and Changes in Fund Balance - Budget and Actual - Other Federal Programs Special Revenue Fund 75 Schedule of Revenues, Expenditures and Changes in Fund Balance - Budget and Actual - Other Special Projects Special Revenue Fund 76 Schedule of Revenues, Expenditures and Changes in Fund Balance - Budget and Actual - Capital Projects Fund 77 Combining Statement of Changes in Fiduciary Assets and Liabilities - Agency Fund 78 Quality Basic Education Programs - Program Expenditures 79
General Fund Quality Basic Education Programs - Schedule of Allotments and Expenditures by Program 80
ATLANTA INDEPENDENT SCHOOL SYSTEM Comprehensive Annual Financial Report
Table of Contents Fiscal Year Ended June 30, 2018
OTHER SUPPLEMENTARY INFORMATION (Continued):
Schedule of Expenditures by Object - Lottery Programs 81 Schedule of Approved Local Option Sales Tax Projects 82 Schedule of State Revenues 83
STATISTICAL SECTION (UNAUDITED) Net Position by Component - Schedule 1 84 Changes in Net Position - Schedule 2 85 and 86
Governmental Fund Balances - Schedule 3 87 Changes in Governmental Fund Balances - Schedule 4 88 and 89
General Fund Expenditures by Function - Schedule 5 90 General Fund Revenues by Source- Schedule 6 91 Assessed and Estimated Actual Value of Taxable Property - Schedule 7 92 Property Tax Rates - All Overlapping Governments - Schedule 8 93 Principal Property Taxpayers - Schedule 9 94 Property Tax Levies and Collections - Schedule 10 95 Comparison of Property Tax Millage Rates - Schedule 11 96 Tax Millage Rates - Schedule 12 97 Ratio of Total Debt Outstanding by Type - Schedule 13 98 Overlapping and Direct Governmental Activities Debt - Schedule 14 99 Legal Debt Margin - Schedule 15 100 Demographic Statistics - Schedule 16 101
ATLANTA INDEPENDENT SCHOOL SYSTEM Comprehensive Annual Financial Report
Table of Contents Fiscal Year Ended June 30, 2018
STATISTICAL SECTION (CONTINUED): Principal Employers - Schedule 17 102 School Breakfast Program - Schedule 18 103 School Lunch Program - Schedule 19 104 Number of Schools - Schedule 20 105 Enrollment by Grade Level - Schedule 21 106 School Buildings, Acreage, and Capacity - Schedule 22 107 and 108 General Fund Per Pupil Cost - Schedule 23 109 Employees by Function - Schedule 24 110 SINGLE AUDIT SECTION Independent Auditor’s Report on Internal Control over Financial Reporting and on Compliance and Other Matters Based on an Audit of Financial Statements Performed in Accordance with Government Auditing Standards 111 and 112 Independent Auditor’s Report on Compliance for Each Major Federal Program and Report on Internal Control Over Compliance Required By the Uniform Guidance 113-115 Schedule of Expenditures of Federal Awards 116 and 117 Notes to the Schedule of Expenditures of Federal Awards 118 Schedule of Findings and Questioned Costs 119 and 120 Status of Prior Fiscal Year Findings and Questioned Costs 121 Management’s Corrective Action Plan 122

130 Trinity Ave., SW Atlanta, GA 30303
(404)802-3500 atlantapublicschools.us
February 20, 2019
Dear Citizens of Atlanta: Atlanta Public Schools (“APS” or “School District”) is pleased to present the Comprehensive Annual Financial Report (CAFR) for the fiscal year that ended on June 30, 2018. Atlanta Public Schools’ financial management officials prepared this report, and it contains information about the scope and character of the School District's fiscal activities and accomplishments in fiscal year 2018. It also illustrates the administration’s efforts to achieve the goals established by the Atlanta Board of Education for the school year. This report is intended to fulfill the requirement for audit prescribed by Georgia Statutes for local boards of education. APS management assumes full responsibility for the completeness and reliability of the information contained in this report, based on a framework of internal controls it has established for this purpose. Because the cost of internal controls should not exceed anticipated benefits, the objective of this report is to provide reasonable, rather than absolute, assurance that the financial statements are free of any material misstatements. The School District operates under the management and control of an elected nine-member Atlanta Board of Education. These members establish and guide policy for APS and approve the budget. The APS superintendent and administrative staff create the budget and manage the District’s finances and daily operations. SNAPSHOT OF ATLANTA PUBLIC SCHOOLS The School District was established in 1872, making it one of the oldest districts in Georgia. APS is home to many notable alumni, including civil-rights activists, renowned engineers, scientists, entertainers, nationally elected officials, and professional athletes. The School District is also home to Booker T. Washington High School, the oldest high school in Atlanta built to educate African-American students. The School District continues to renew its commitment to APS stakeholders through academic excellence, educational equity, ethics and engagement. The School District remains focused on becoming a high-performing school district where students love to learn, educators inspire, families engage and the community trusts the system. APS began implementing the Common Core Georgia Performance Standards (CCGPS) at the start of the 2013 school year and moved to full implementation of the Standards at the start of the 2014 school year. The CCGPS are more rigorous than Georgia’s previous standards and are designed to ensure that students obtain the knowledge and skills required to meet 21st century challenges—
ii
such as strong verbal and written communications, perseverance in problem solving, technical reading and writing, literacy across disciplines, and mathematical proficiency. In April 2014, the School Board appointed Dr. Meria J. Carstarphen as the APS superintendent, and the District began operating under her leadership on July 7, 2014, on a Journey of Transformation. As part of that journey, APS is striving for even more equity and transparency – to remedy the past and eliminate barriers for education. APS is working toward autonomy and flexibility with a new operating model where principals and school communities make decisions for the benefit of the child. APS is focused on improving quality while increasing efficiency. Most of all, APS is determined to provide students with choice-filled lives. As part of a new charter system operating model that went into effect in 2016, APS embraced signature theme programming as a way to instructionally align all schools in a given high school cluster. The model of nine high school clusters with distinct feeder patterns has allowed APS to fully staff and provide more support, opportunity and equity to all schools in the School District. All students have access to music, arts, foreign language and core academic programs, from kindergarten through grade 12. The cluster model enables elementary, middle and high school teachers and administrators within a cluster to collaborate more when creating strategies that increase student performance and it aligns signature academic themes – STEM, International Baccalaureate and College and Career Preparatory – so as to establish a clear academic pathway from Pre-K to 12th grade. The new operating model has also lead to the creation of GO Teams, school-based governance bodies comprised of parents, educators and community members to assist with decision-making at the school and cluster levels. This year, Achieve Atlanta – a partnership spearheaded by The Joseph B. Whitehead Foundation and The Community Foundation for Greater Atlanta – will further its college success work at Atlanta Public Schools (APS) with support from a $532,000 Network for School Improvement grant from the Bill and Melinda Gates Foundation. With the grant, Achieve Atlanta will work with the APS data team to build a technical platform that will allow students to identify good “match and fit” colleges while they are in high school.
As a result, APS began fiscal year 2019 (FY19) poised to further prepare students for college and careers. Students In the 2017-2018 school year, student enrollment stood at about 52,000 students, and the District expects to serve a similar number of students at 89 schools throughout Atlanta this school year. About 2,400 seniors graduated from APS high schools in 2018, earning more than $143 million in college scholarships. Large numbers of APS students continue to earn awards for academic achievement on the state and national levels.
iii
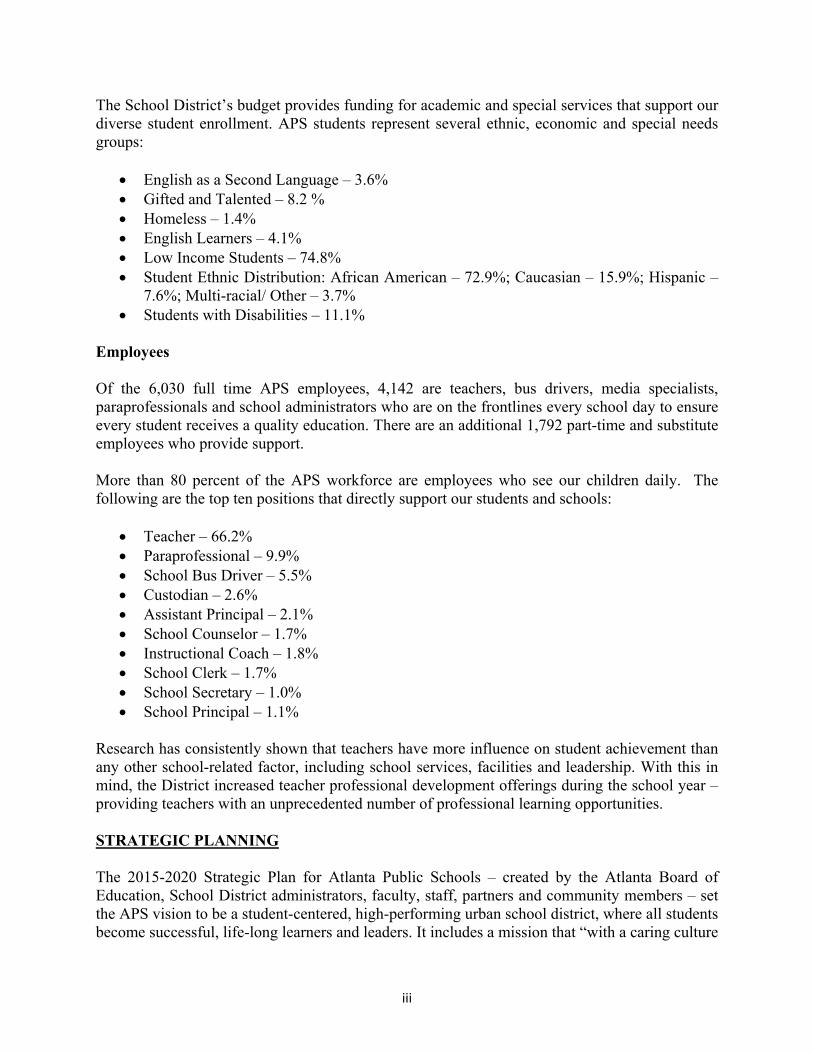
The School District’s budget provides funding for academic and special services that support our diverse student enrollment. APS students represent several ethnic, economic and special needs groups:
English as a Second Language – 3.6% Gifted and Talented – 8.2 % Homeless – 1.4% English Learners – 4.1% Low Income Students – 74.8% Student Ethnic Distribution: African American – 72.9%; Caucasian – 15.9%; Hispanic –
7.6%; Multi-racial/ Other – 3.7% Students with Disabilities – 11.1%
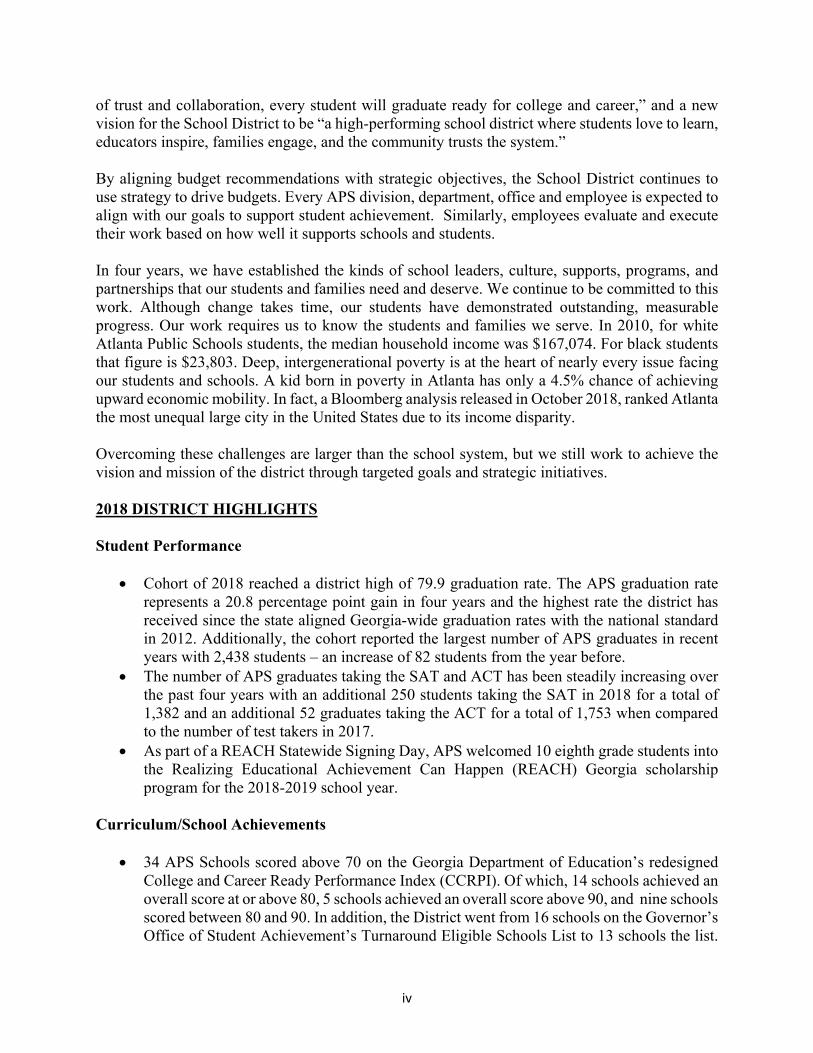
Employees Of the 6,030 full time APS employees, 4,142 are teachers, bus drivers, media specialists, paraprofessionals and school administrators who are on the frontlines every school day to ensure every student receives a quality education. There are an additional 1,792 part-time and substitute employees who provide support. More than 80 percent of the APS workforce are employees who see our children daily. The following are the top ten positions that directly support our students and schools:
Teacher – 66.2% Paraprofessional – 9.9% School Bus Driver – 5.5% Custodian – 2.6% Assistant Principal – 2.1% School Counselor – 1.7% Instructional Coach – 1.8% School Clerk – 1.7% School Secretary – 1.0% School Principal – 1.1%
Research has consistently shown that teachers have more influence on student achievement than any other school-related factor, including school services, facilities and leadership. With this in mind, the District increased teacher professional development offerings during the school year – providing teachers with an unprecedented number of professional learning opportunities. STRATEGIC PLANNING The 2015-2020 Strategic Plan for Atlanta Public Schools – created by the Atlanta Board of Education, School District administrators, faculty, staff, partners and community members – set the APS vision to be a student-centered, high-performing urban school district, where all students become successful, life-long learners and leaders. It includes a mission that “with a caring culture
iv
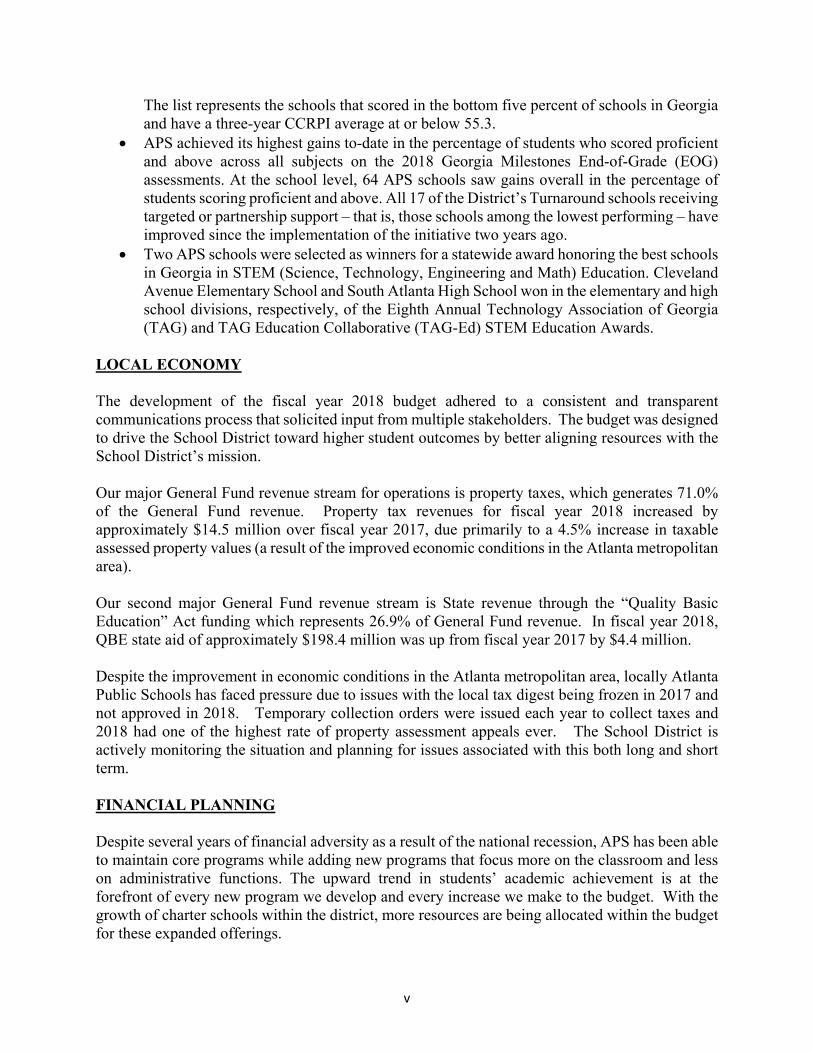
of trust and collaboration, every student will graduate ready for college and career,” and a new vision for the School District to be “a high-performing school district where students love to learn, educators inspire, families engage, and the community trusts the system.” By aligning budget recommendations with strategic objectives, the School District continues to use strategy to drive budgets. Every APS division, department, office and employee is expected to align with our goals to support student achievement. Similarly, employees evaluate and execute their work based on how well it supports schools and students. In four years, we have established the kinds of school leaders, culture, supports, programs, and partnerships that our students and families need and deserve. We continue to be committed to this work. Although change takes time, our students have demonstrated outstanding, measurable progress. Our work requires us to know the students and families we serve. In 2010, for white Atlanta Public Schools students, the median household income was $167,074. For black students that figure is $23,803. Deep, intergenerational poverty is at the heart of nearly every issue facing our students and schools. A kid born in poverty in Atlanta has only a 4.5% chance of achieving upward economic mobility. In fact, a Bloomberg analysis released in October 2018, ranked Atlanta the most unequal large city in the United States due to its income disparity. Overcoming these challenges are larger than the school system, but we still work to achieve the vision and mission of the district through targeted goals and strategic initiatives. 2018 DISTRICT HIGHLIGHTS Student Performance
Cohort of 2018 reached a district high of 79.9 graduation rate. The APS graduation rate represents a 20.8 percentage point gain in four years and the highest rate the district has received since the state aligned Georgia-wide graduation rates with the national standard in 2012. Additionally, the cohort reported the largest number of APS graduates in recent years with 2,438 students – an increase of 82 students from the year before.
The number of APS graduates taking the SAT and ACT has been steadily increasing over the past four years with an additional 250 students taking the SAT in 2018 for a total of 1,382 and an additional 52 graduates taking the ACT for a total of 1,753 when compared to the number of test takers in 2017.
As part of a REACH Statewide Signing Day, APS welcomed 10 eighth grade students into the Realizing Educational Achievement Can Happen (REACH) Georgia scholarship program for the 2018-2019 school year.
Curriculum/School Achievements
34 APS Schools scored above 70 on the Georgia Department of Education’s redesigned College and Career Ready Performance Index (CCRPI). Of which, 14 schools achieved an overall score at or above 80, 5 schools achieved an overall score above 90, and nine schools scored between 80 and 90. In addition, the District went from 16 schools on the Governor’s Office of Student Achievement’s Turnaround Eligible Schools List to 13 schools the list.
v
The list represents the schools that scored in the bottom five percent of schools in Georgia and have a three-year CCRPI average at or below 55.3.
APS achieved its highest gains to-date in the percentage of students who scored proficient and above across all subjects on the 2018 Georgia Milestones End-of-Grade (EOG) assessments. At the school level, 64 APS schools saw gains overall in the percentage of students scoring proficient and above. All 17 of the District’s Turnaround schools receiving targeted or partnership support – that is, those schools among the lowest performing – have improved since the implementation of the initiative two years ago.
Two APS schools were selected as winners for a statewide award honoring the best schools in Georgia in STEM (Science, Technology, Engineering and Math) Education. Cleveland Avenue Elementary School and South Atlanta High School won in the elementary and high school divisions, respectively, of the Eighth Annual Technology Association of Georgia (TAG) and TAG Education Collaborative (TAG-Ed) STEM Education Awards.
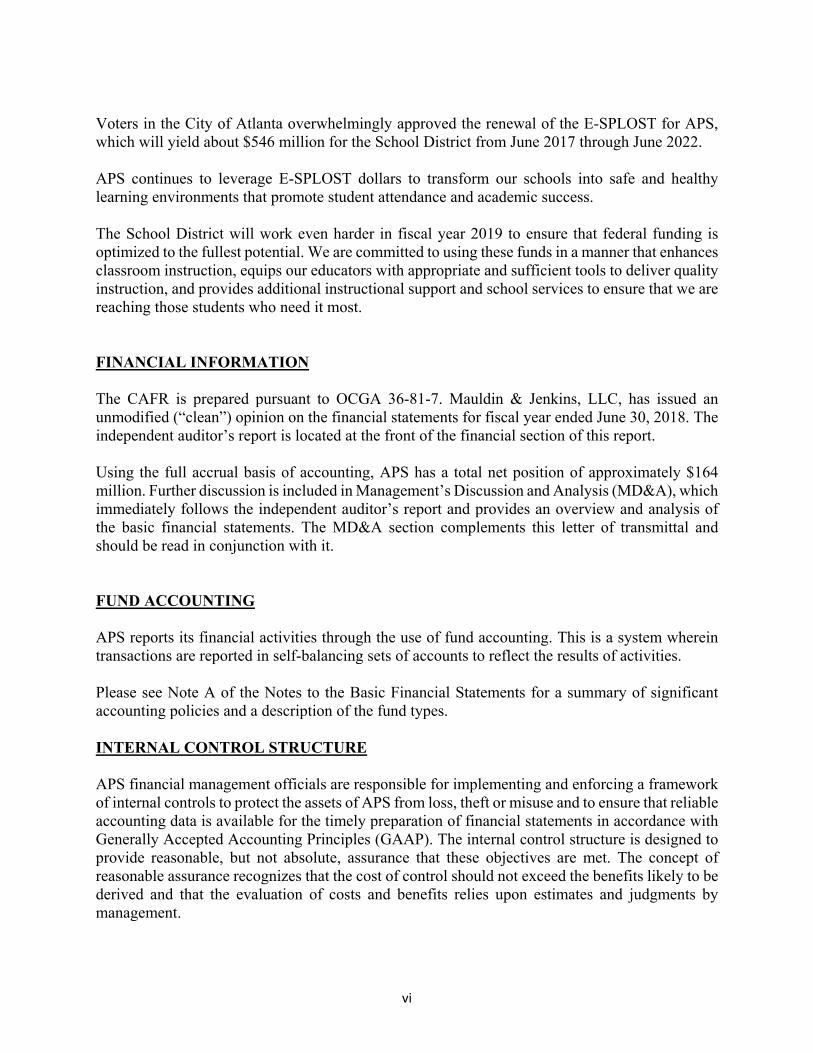
LOCAL ECONOMY The development of the fiscal year 2018 budget adhered to a consistent and transparent communications process that solicited input from multiple stakeholders. The budget was designed to drive the School District toward higher student outcomes by better aligning resources with the School District’s mission. Our major General Fund revenue stream for operations is property taxes, which generates 71.0% of the General Fund revenue. Property tax revenues for fiscal year 2018 increased by approximately $14.5 million over fiscal year 2017, due primarily to a 4.5% increase in taxable assessed property values (a result of the improved economic conditions in the Atlanta metropolitan area). Our second major General Fund revenue stream is State revenue through the “Quality Basic Education” Act funding which represents 26.9% of General Fund revenue. In fiscal year 2018, QBE state aid of approximately $198.4 million was up from fiscal year 2017 by $4.4 million. Despite the improvement in economic conditions in the Atlanta metropolitan area, locally Atlanta Public Schools has faced pressure due to issues with the local tax digest being frozen in 2017 and not approved in 2018. Temporary collection orders were issued each year to collect taxes and 2018 had one of the highest rate of property assessment appeals ever. The School District is actively monitoring the situation and planning for issues associated with this both long and short term. FINANCIAL PLANNING Despite several years of financial adversity as a result of the national recession, APS has been able to maintain core programs while adding new programs that focus more on the classroom and less on administrative functions. The upward trend in students’ academic achievement is at the forefront of every new program we develop and every increase we make to the budget. With the growth of charter schools within the district, more resources are being allocated within the budget for these expanded offerings.
vi
Voters in the City of Atlanta overwhelmingly approved the renewal of the E-SPLOST for APS, which will yield about $546 million for the School District from June 2017 through June 2022. APS continues to leverage E-SPLOST dollars to transform our schools into safe and healthy learning environments that promote student attendance and academic success. The School District will work even harder in fiscal year 2019 to ensure that federal funding is optimized to the fullest potential. We are committed to using these funds in a manner that enhances classroom instruction, equips our educators with appropriate and sufficient tools to deliver quality instruction, and provides additional instructional support and school services to ensure that we are reaching those students who need it most. FINANCIAL INFORMATION The CAFR is prepared pursuant to OCGA 36-81-7. Mauldin & Jenkins, LLC, has issued an unmodified (“clean”) opinion on the financial statements for fiscal year ended June 30, 2018. The independent auditor’s report is located at the front of the financial section of this report. Using the full accrual basis of accounting, APS has a total net position of approximately $164 million. Further discussion is included in Management’s Discussion and Analysis (MD&A), which immediately follows the independent auditor’s report and provides an overview and analysis of the basic financial statements. The MD&A section complements this letter of transmittal and should be read in conjunction with it. FUND ACCOUNTING APS reports its financial activities through the use of fund accounting. This is a system wherein transactions are reported in self-balancing sets of accounts to reflect the results of activities. Please see Note A of the Notes to the Basic Financial Statements for a summary of significant accounting policies and a description of the fund types. INTERNAL CONTROL STRUCTURE APS financial management officials are responsible for implementing and enforcing a framework of internal controls to protect the assets of APS from loss, theft or misuse and to ensure that reliable accounting data is available for the timely preparation of financial statements in accordance with Generally Accepted Accounting Principles (GAAP). The internal control structure is designed to provide reasonable, but not absolute, assurance that these objectives are met. The concept of reasonable assurance recognizes that the cost of control should not exceed the benefits likely to be derived and that the evaluation of costs and benefits relies upon estimates and judgments by management.

viii
The Certificate of Excellence in Financial Reporting is presented to
Atlanta Independent School System
for its Comprehensive Annual Financial Report (CAFR) for the Fiscal Year Ended June 30, 2017.
The CAFR has been reviewed and met or exceeded ASBO International’s Certificate of Excellence standards.
CCharles E. Peterson, Jr., SFO, RSBA, MBA John D. Musso, CAE President Executive Director
x
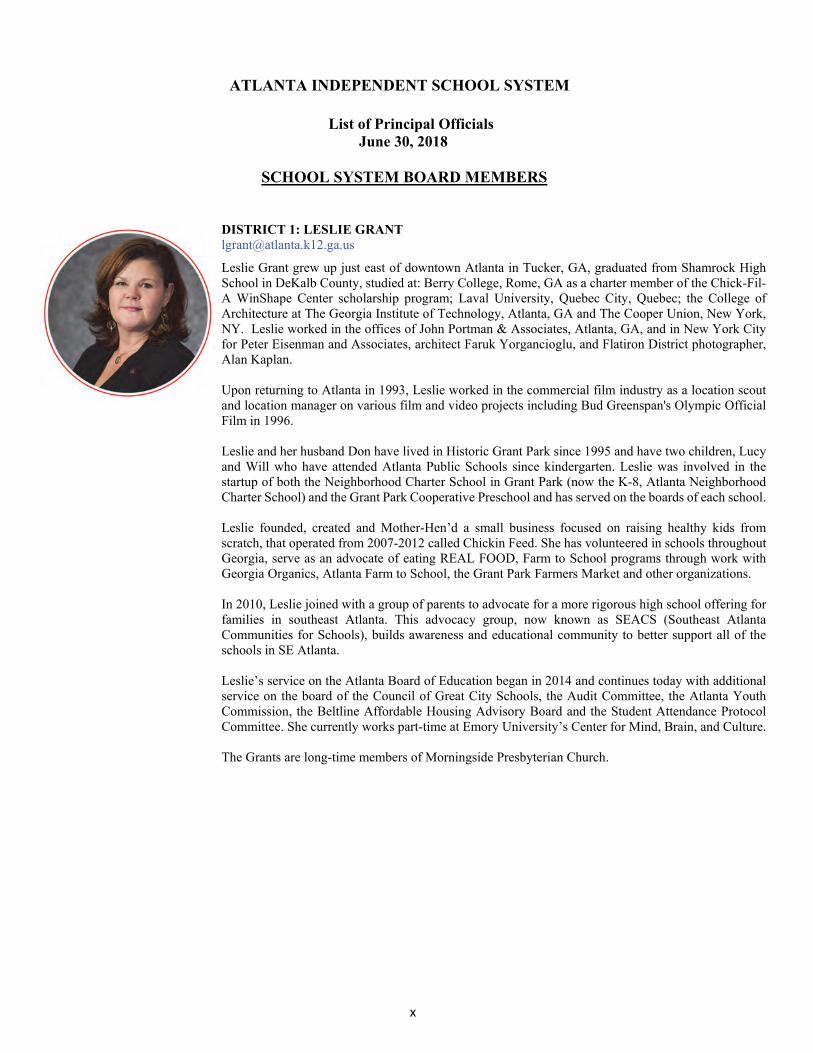
ATLANTA INDEPENDENT SCHOOL SYSTEM List of Principal Officials June 30, 2018 SCHOOL SYSTEM BOARD MEMBERS DISTRICT 1: LESLIE GRANT [email protected] Leslie Grant grew up just east of downtown Atlanta in Tucker, GA, graduated from Shamrock High School in DeKalb County, studied at: Berry College, Rome, GA as a charter member of the Chick-Fil-A WinShape Center scholarship program; Laval University, Quebec City, Quebec; the College of Architecture at The Georgia Institute of Technology, Atlanta, GA and The Cooper Union, New York, NY. Leslie worked in the offices of John Portman & Associates, Atlanta, GA, and in New York City for Peter Eisenman and Associates, architect Faruk Yorgancioglu, and Flatiron District photographer, Alan Kaplan. Upon returning to Atlanta in 1993, Leslie worked in the commercial film industry as a location scout and location manager on various film and video projects including Bud Greenspan's Olympic Official Film in 1996. Leslie and her husband Don have lived in Historic Grant Park since 1995 and have two children, Lucy and Will who have attended Atlanta Public Schools since kindergarten. Leslie was involved in the startup of both the Neighborhood Charter School in Grant Park (now the K-8, Atlanta Neighborhood Charter School) and the Grant Park Cooperative Preschool and has served on the boards of each school. Leslie founded, created and Mother-Hen’d a small business focused on raising healthy kids from scratch, that operated from 2007-2012 called Chickin Feed. She has volunteered in schools throughout Georgia, serve as an advocate of eating REAL FOOD, Farm to School programs through work with Georgia Organics, Atlanta Farm to School, the Grant Park Farmers Market and other organizations. In 2010, Leslie joined with a group of parents to advocate for a more rigorous high school offering for families in southeast Atlanta. This advocacy group, now known as SEACS (Southeast Atlanta Communities for Schools), builds awareness and educational community to better support all of the schools in SE Atlanta. Leslie’s service on the Atlanta Board of Education began in 2014 and continues today with additional service on the board of the Council of Great City Schools, the Audit Committee, the Atlanta Youth Commission, the Beltline Affordable Housing Advisory Board and the Student Attendance Protocol Committee. She currently works part-time at Emory University’s Center for Mind, Brain, and Culture. The Grants are long-time members of Morningside Presbyterian Church.
xi
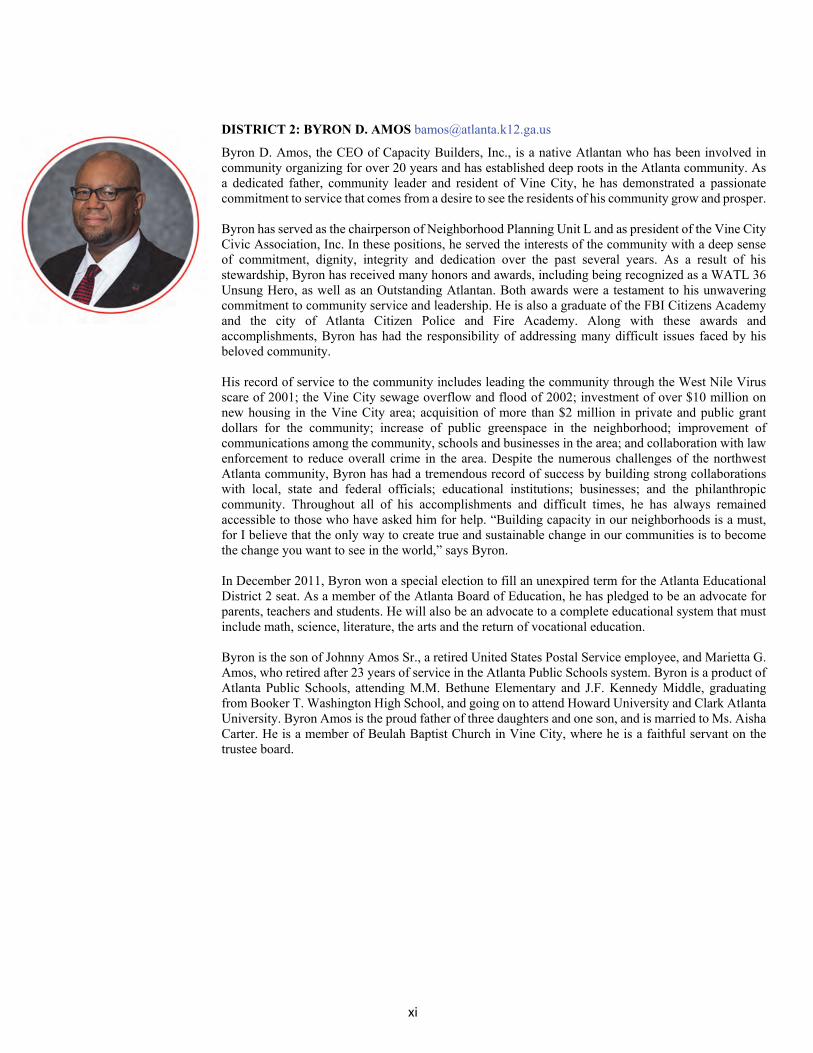
DISTRICT 2: BYRON D. AMOS [email protected] Byron D. Amos, the CEO of Capacity Builders, Inc., is a native Atlantan who has been involved in community organizing for over 20 years and has established deep roots in the Atlanta community. As a dedicated father, community leader and resident of Vine City, he has demonstrated a passionate commitment to service that comes from a desire to see the residents of his community grow and prosper. Byron has served as the chairperson of Neighborhood Planning Unit L and as president of the Vine City Civic Association, Inc. In these positions, he served the interests of the community with a deep sense of commitment, dignity, integrity and dedication over the past several years. As a result of his stewardship, Byron has received many honors and awards, including being recognized as a WATL 36 Unsung Hero, as well as an Outstanding Atlantan. Both awards were a testament to his unwavering commitment to community service and leadership. He is also a graduate of the FBI Citizens Academy and the city of Atlanta Citizen Police and Fire Academy. Along with these awards and accomplishments, Byron has had the responsibility of addressing many difficult issues faced by his beloved community. His record of service to the community includes leading the community through the West Nile Virus scare of 2001; the Vine City sewage overflow and flood of 2002; investment of over $10 million on new housing in the Vine City area; acquisition of more than $2 million in private and public grant dollars for the community; increase of public greenspace in the neighborhood; improvement of communications among the community, schools and businesses in the area; and collaboration with law enforcement to reduce overall crime in the area. Despite the numerous challenges of the northwest Atlanta community, Byron has had a tremendous record of success by building strong collaborations with local, state and federal officials; educational institutions; businesses; and the philanthropic community. Throughout all of his accomplishments and difficult times, he has always remained accessible to those who have asked him for help. “Building capacity in our neighborhoods is a must, for I believe that the only way to create true and sustainable change in our communities is to become the change you want to see in the world,” says Byron. In December 2011, Byron won a special election to fill an unexpired term for the Atlanta Educational District 2 seat. As a member of the Atlanta Board of Education, he has pledged to be an advocate for parents, teachers and students. He will also be an advocate to a complete educational system that must include math, science, literature, the arts and the return of vocational education. Byron is the son of Johnny Amos Sr., a retired United States Postal Service employee, and Marietta G. Amos, who retired after 23 years of service in the Atlanta Public Schools system. Byron is a product of Atlanta Public Schools, attending M.M. Bethune Elementary and J.F. Kennedy Middle, graduating from Booker T. Washington High School, and going on to attend Howard University and Clark Atlanta University. Byron Amos is the proud father of three daughters and one son, and is married to Ms. Aisha Carter. He is a member of Beulah Baptist Church in Vine City, where he is a faithful servant on the trustee board.

xii
DISTRICT 3: MICHELLE D. OLYMPIADIS [email protected] Michelle Olympiadis is the District 3 Representative of the Atlanta Board of Education. From the time Michelle was a preschool room parent, she has been engaged as an active parent, volunteer, and leader to support schools and great experiences for students. In the last three years, her roles have included: 2015 - Present, Member, State Advisory Panel, Georgia Department of Education (GaDOE) 2015 - Present, Member, Student Success Stakeholder Committee, GaDOE 2017 - Present, Inclusion Committee Chair, District 10, Georgia Parent Teacher Association (PTA) 2017-18, Parliamentarian, Morningside Elementary School (MES) PTA 2015 - 17, President, MES PTA 2016 - 17, Vice-President of Communication, District 10 Georgia PTA 2015 - 2017, Grady High School Cluster Advisory, Atlanta Public Schools (APS) 2015 - 2017, Inman Middle School Go Team, APS 2014 - 2017, Special Education Advisory Committee, APS Michelle is currently employed with the Boys and Girls Clubs of America and previously employed with the Consulate General of France, The Coca-Cola Company and Wachovia Bank. Michelle is a lifelong member of the Annunciation Greek Orthodox Cathedral of Atlanta and active in the philanthropic organizations affiliated with the Greek Orthodox Church, Philoptochos and the Daughters of Penelope. A first generation American, her family emigrated from Greece to Atlanta in 1956. Since 1995 she and her family have resided in the city of Atlanta. An APS parent for over 10 years, she has three children, one each in high school, middle school and elementary school.
xiii
BOARD VICE-CHAIR DISTRICT 4: NANCY M. MEISTER [email protected] As a parent and stakeholder, Nancy M. Meister is passionate about the future of Atlanta Public Schools, and has been personally involved in the district for many years and recognizes the importance of public education. She and her husband have watched their children grow and thrive in the Atlanta Public Schools system. As a residential real estate agent, she understands and appreciates the importance of great neighborhood schools, their impact on attracting new businesses to the city and their contribution to the overall sustainable growth of the metro area. Some of Nancy’s community activities include the following: president, North Atlanta Parents of Public Schools (2006-2009); founding member, North Atlanta High School Foundation (2006); PTA president, North Atlanta High School (2007-2008); PTA president, Sutton Middle School (2004-2006); member, Northern Corridor Task Force (2003); and participant, Susan G. Komen 3-Day Walk, Seattle, Washington, (2007) and San Francisco (2008). As a member of the Atlanta Board of Realtors, Nancy is currently a residential real estate agent with Beacham and Company. Prior to joining Beacham, she worked in the Buckhead office of Harry Norman Realtors. ACHIEVEMENTS
$50 million-plus in career sales Top 15 producer in one of metro Atlanta's highest dollar volume offices Recipient of the Miss Emmie Award from Harry Norman, REALTORS for highest ethical and
professional standards Life member, Million Dollar Club 2000 Rookie of the Year for outstanding performance Numerous professional designations, including senior marketing consultant (SMC), accredited
buyer specialist (ABS), and eco-broker Licensed as an associate broker Atlanta Board of Realtors “Good Neighbor Award” in 2009 for making exceptional
contributions to improve the quality of life in the community A native of Massachusetts, Nancy earned a B.S. in marketing management from Bentley College in Waltham, Massachusetts. She moved from Boston to San Francisco and then to Atlanta in 1987. Nancy and her husband, Steve, have lived in Buckhead for 23 years and have raised two sons: Matthew, a Georgia Tech student, and Andrew, a junior at North Atlanta High School.
xiv
DISTRICT 5: ERIKA MITCHELL [email protected] Atlanta native Erika Mitchell is a multi-talented professional and a highly accomplished athlete and local public servant. As a graduate of Alabama State University, she took advantage of a full athletic scholarship by winning numerous awards for her stellar athletic performance including the Indoor and Outdoor track and field South Western Athletics Conference (SWAC) Championships in 2001, 2002 and 2003. Mitchell earned her Bachelor’s Degree in Business Administration with a concentration in Computer Information Systems yielding her the knowledge and opportunities to work for major global brands such as The Coca-Cola Company, Cbeyond and Kodak as an Information Technology (IT) specialist. While the scholarly athlete with a sturdy background in IT, she received a full scholarship from Esani Paul Mitchell partner school to become an licensed esthetics educator. Shortly after completing her educators degree, Mitchell began her teaching career at AVEDA Institute, where she taught histology and physiology of skin, created AVEDA first makeup artist curriculum and small business development. Mitchell also provided State Board certified Continue Educational Units to professional cosmetologist and estheticians. Mitchell's passion for volunteering led her to volunteer her time to international pageants including Miss Africa USA, the Miss Latina US and the Miss Latin America Del Mundo pageant. Through her dedication to volunteer work, she managed to incorporate her business skills and her love for beauty and founded La Reina Pageant Productions in 2010, which also produces Atlanta Latino Fashion Week, Atlanta Caribbean Fashion Week, Miss Georgia Latina™, Miss Teen Georgia Latina™, Miss Alabama Latina and Miss Teen Alabama Latina pageants. As producer and state director, her vision is to mentor and create opportunities for Latinas and Caribbeans to pursue their goals and dreams while impacting the community through culture sharing and, most importantly, culture awareness. As the National Ambassador for the Arthritis Foundation, the President’s Volunteer Service Awards, and the program advisor for Fuel Up to Play 60. Mitchell has served on boards and committees for the following organizations: NFL Alumni, Caribbean American Advancement Foundation and the Boys & Girls Club of Greater Atlanta. Mitchell is committed to bridging the gap with non-profits organizations and for-profit companies to support each other businesses in order to better serve the diverse communities.
xv
DISTRICT 6: ESHÉ P. COLLINS [email protected]
An Atlanta native and former teacher in Atlanta Public Schools, Eshé P. Collins never wavered from
her strong passion for education. Beginning at a young age, she always knew the value of a solid education: a challenging curriculum, a system of great teachers, and strong family and community involvement. Eshé understands the impact of quality education in realizing the potential of the city, and is excited to leverage her passion and experience to provide all students in Atlanta with the education they deserve. Eshé has an extensive record of commitment and achievement in urban education and communities. As a fourth- and fifth-grade teacher at A.D. Williams Elementary School, 92 percent of her students met or exceeded expectations on the Criterion-Referenced Competency Test for both grade levels. Eshé also led the after-school, and summer tutoring programs for the Bowen Homes community and co-founded the “Reaching Back, Bridging Gaps” reading program, a community-based literacy initiative. Eshé’s work within urban settings has been the combination of her classroom, policy and legal experience on issues that address student achievement and equity in education. She analyzed national education issues and advocated for accessible healthcare at the Children’s Defense Fund. Also, Eshe’ worked in Cape Town, South Africa, where she helped refugee women and children access quality services and enrollment in local schools. Currently, Eshé serves as Georgia State University’s project director for Jumpstart, an early education, nonprofit organization that delivers a high-quality curriculum to preschool children in low-income neighborhoods. In this role, she trains adults to teach and lead in their communities; works closely with parents to improve family involvement; and more importantly, inspires children to learn through the love of literacy. Within the program, Eshé has increased community involvement by 150 percent, which has resulted in community members’service of more than 15,000 hours in the classroom and community each year. In pursuit of her passion, Eshé earned a B.A. degree in psychology from Spelman College; M.S. in urban teacher leadership from Georgia State University; and J.D., cum laude, from North Carolina Central University School of Law. She holds Georgia educator certifications in early childhood education and educational leadership, and a license to practice law in the state of Georgia. Eshé is a woman of many accomplishments and continues to be an avid servant throughout the Atlanta community.
xvi
AT-LARGE-SEAT 7, DISTRICTS 1 AND 2: KANDIS WOOD JACKSON [email protected] Kandis Wood Jackson is the At-Large Seat 7 representative on the Atlanta Board of Education. She also is a practicing attorney at the law firm of Alston & Bird LLP. An Atlanta native, Kandis graduated from Duke University in 2008 and returned to Atlanta to teach 6th Grade Social Studies at KIPP WAYS Academy. In 2013, Kandis earned her law degree from Harvard Law School and, again, returned to Atlanta to practice law. Kandis was elected to the Atlanta Board of Education in 2017. She is a member of the Young Lawyers Division Leadership Academy Class of 2016 and the LEAD Atlanta Class of 2017. Kandis also serves as the Vice Chair of the Board of the Atlanta Center for Self Sufficiency and a member of the Board of Trustees of Kenny Leon’s True Colors Theatre Company. Kandis lives in Midtown with her husband Adam and their dog Duke.
AT-LARGE SEAT 8, DISTRICTS 3 AND 4: CYNTHIA BRISCOE BROWN [email protected] Since the early 1990s, Cynthia Briscoe Brown has worked publicly and behind the scenes for all kids, devoting herself to making sure every child gets everything he or she needs to succeed. A graduate of Davidson College and Vanderbilt Law School, Cynthia uses her 27 years of experience as an attorney to help students, teachers and families across the city. She has assisted several APS schools in forming their own nonprofit foundations and frequently donates her expertise to students with legal issues related to college and scholarship applications. Cynthia serves or has served on the boards of the Calvin Center, the Atlanta Partnership for Arts in Learning, the Committee for Teaching About the United Nations/Atlanta, and the Alliance Francaise d’Atlanta, creating partnerships with each organization and opportunities for students and teachers across the city to improve their skills and enrich their lives. As a volunteer with Young Audiences of Atlanta, Cynthia helped develop and implement the smART stART program, using visual and performing arts experiences to improve and encourage the reading skills of economically disadvantaged kindergarten students. During the three terms that she and her husband served as co-presidents of North Atlanta Parents for Public Schools (NAPPS), Cynthia was a unifying force for the North Atlanta cluster of schools and APS as a whole. Cynthia emphasized positive community engagement by supporting APS schools and students, and developing and nurturing strong media relations. She reached out to cluster organizations and community groups across the city to identify common goals and provide a consistent voice for children throughout Atlanta. Cynthia has served on the PTA executive boards in each of her children’s schools. As a trustee of the North Atlanta High School Foundation, she worked to identify and creatively meet the needs of every student. She developed and ran a successful teacher incentive program to engage teachers, build collegiality and reward them for extraordinary support of their students and colleagues. She has participated in several APS facilities construction or renovation project committees on behalf of community stakeholders. Cynthia and her husband, James F. (Jim) Brown Jr., are both Atlanta natives and practicing attorneys. They are active in music and service ministries at First Presbyterian Church of Atlanta. They have two children, both of whom have attended APS schools since kindergarten.
xvii
CHAIR, AT-LARGE SEAT 9, DISTRICTS 5 AND 6: JASON ESTEVES [email protected] Jason Esteves currently serves as an at-large representative on the Atlanta Public Schools Board of Education. He was elected on December 4, 2013 and has focused his efforts at promoting equity and improving the financial outlook of the school system. As an attorney and former educator, Jason is working to ensure every child in Atlanta Public Schools obtains an education that prepares them for college and career. After graduating from the University of Miami, Jason devoted himself to teaching at an under-performing school in a low-income neighborhood. He worked countless hours with students, teachers, and parents to ensure his kids had the resources they needed to succeed. This experience gave Jason insights into the challenges our children face and the importance of public schools that help children overcome those challenges. Today, Jason serves as Assistant General Counsel at Equifax Inc., where he manages litigation matters for the company. He was an associate at the law firm of McKenna Long & Aldridge LLP (now Dentons US LLP) after graduating from Emory University School of Law. Jason also serves on various boards of local non-profits, and believes that partnerships with non-profits are vital to ensuring our children have the wraparound services they need to be able to focus on their education and development. A native of Georgia, Jason was raised in Columbus, Georgia by his parents, Linda and Fernando, a retired Army veteran. At an early age, his parents instilled in him the importance of public service and a good education. Those values are the foundation upon which Jason serves today. Jason is married to Ariel, a graduate of Kennesaw State University and Emory University’s School of Nursing graduate program. Jason met Ariel while he attended Emory Law School. Ariel is a Director at CareSource, serving low-income families across Georgia. Jason and Ariel are proud parents of their son, Jaeden and reside in northwest Atlanta.
xviii
ATLANTA INDEPENDENT SCHOOL SYSTEM
APPOINTED OFFICIALS JUNE 30, 2018
SUPERINTENDENT
Meria J. Carstarphen, Ed.D
SENIOR CABINET
David Jernigan...…………..........................................................Deputy Superintendent
Glenn Brock…………………………………………………….……..General Counsel
Skye Duckett……………...………..……......……..... Chief Human Resources Officer
Lisa Bracken……….……………..…………………………….Chief Financial Officer
William (Bill) Caritj.……………………...Chief Accountability & Information Officer
Larry Hoskins………………………………………………….Chief Operating Officer
Angela King Smith………………………………………….Chief Engagement Officer
xix
ATLANTA INDEPENDENT SCHOOL SYSTEM Superintendent of Schools June 30, 2018
Meria Joel Carstarphen, Ed.D., is the superintendent of Atlanta Public Schools (APS) where she leads the district’s nearly 52,000 students, 6,000 full-time employees, and 89 schools, and oversees the system’s $1 billion annual budget. Prior to serving in Atlanta, she was superintendent in diverse, major metropolitan public school districts, including Austin, Texas and Saint Paul, Minnesota.
In 2014, Dr. Carstarphen was charged with leading the transformation of APS. She has worked to restore organizational integrity and create a student-focused culture not driven by adult agendas. Through her leadership, the District has moved away from an over-reliance on high-stakes testing to emphasize whole-child development.
During her tenure, APS is seeing improvements:
The District’s graduation rate has increased by 20.8 percentage points from 59.1 percent in 2014 to 79.9 percent in 2018, which is the highest graduation rate the District has achieved since the state aligned with the national standard in 2012.
The school system achieved its highest gains to-date in the percentage of students who scored proficient and above on all subjects on the 2018 Georgia Milestones End-of-Grade assessments (English Language Arts, Mathematics, Science, and Social Studies) and the District narrowed the performance gap with the State on all four End-of-Grade subjects.
APS achieved year-over-year gains in the percentage of students scoring proficient and above on 18 of 24 (75%) End-of-Grade and End-of-Course assessments compared to gains in just over half (52%) in the previous year, and the District has seen longitudinal gains in the six End-of-Course subjects it has administered since the 2015 baseline year.
The number of engaged employees increased significantly in 2018 (40%) compared to 2016 (29%), accounting for the largest year-over-year increase that APS has seen since this work began in 2014.
Through the District’s social and emotional learning initiative and its restorative practice efforts, the number of student arrests is down by 34% and student suspension rates have decreased overall.
For the first time in seven years, APS is no longer disproportionate for the over suspension of African-American students with disabilities.
The District increased the number of Career Technical and Agricultural Education (CTAE) pathway completers from 876 in 2017 to 1,083 in 2018 with 70.4% of the students earning an industry credential.
APS’ college-going rate has continued to increase, climbing seven percentage points from 2016 to 2017, and 60% of the 2017 on time graduate cohort were enrolled in two or four-year institutions.
As part of her community involvement, she serves on the boards of the Atlanta Ballet and the Woodruff Arts Center, and serves on the President’s Council for Tulane University. In addition, she serves on the visiting committee for the Harvard Graduate School of Education, and as a Commissioner with the Aspen Institute’s AspenSEAD (Social Emotional and Academic Development). She is an honorary member of the Junior League of Atlanta, a member of Leadership Atlanta, and a member of the Rotary Club of Atlanta.

xx
She is honored and humbled to be the recipient of numerous awards including: the American Federation of State and County Municipal Employees and the Georgia Federation of Public Service Employees Superintendent of the Year (2018); Newcomb Alumnae Association at Tulane University Outstanding Alumna Award (2018); Anti-Defamation League Torch of Liberty Award (2017); Atlanta Magazine’s Women Making A Mark (2017); Georgia Trend Magazine Top 100 Most Influential Georgians (2017, 2016); Atlanta Business Chronicle Most Admired CEO Awards (2017, 2016, 2015); Cool Girls, Cool Woman of the Year (2016); YWCA’s Academy Of Women Achievers Award (2015); Austin Chapter of the NAACP DeWitty/Overton Freedom Award (2013); Greater Austin Chamber of Commerce Superintendent of the Year Award (2011).
Dr. Carstarphen earned her doctorate from the Harvard Graduate School of Education, master of education degrees from Auburn University and Harvard University, and a bachelor of arts in political science and Spanish from Tulane University. She has also studied at the University of Seville, Spain, and University of Innsbruck, Austria. Dr. Carstarphen began her education career as a middle school teacher in her hometown of Selma, Ala. She also has worked with elementary-level children in Seville, Spain, and Caracas, Venezuela.
Dr. Carstarphen is passionate about public education, leading APS and living its mission every day: With a caring culture of trust and collaboration, every student will graduate ready for college and career.
Bunche Middle School Grady High SchoolToomer Elementary SchoolInman Middle School
Peyton Forest Elementary School
Revised 01.26.2018
www.atlantapublicschools.us
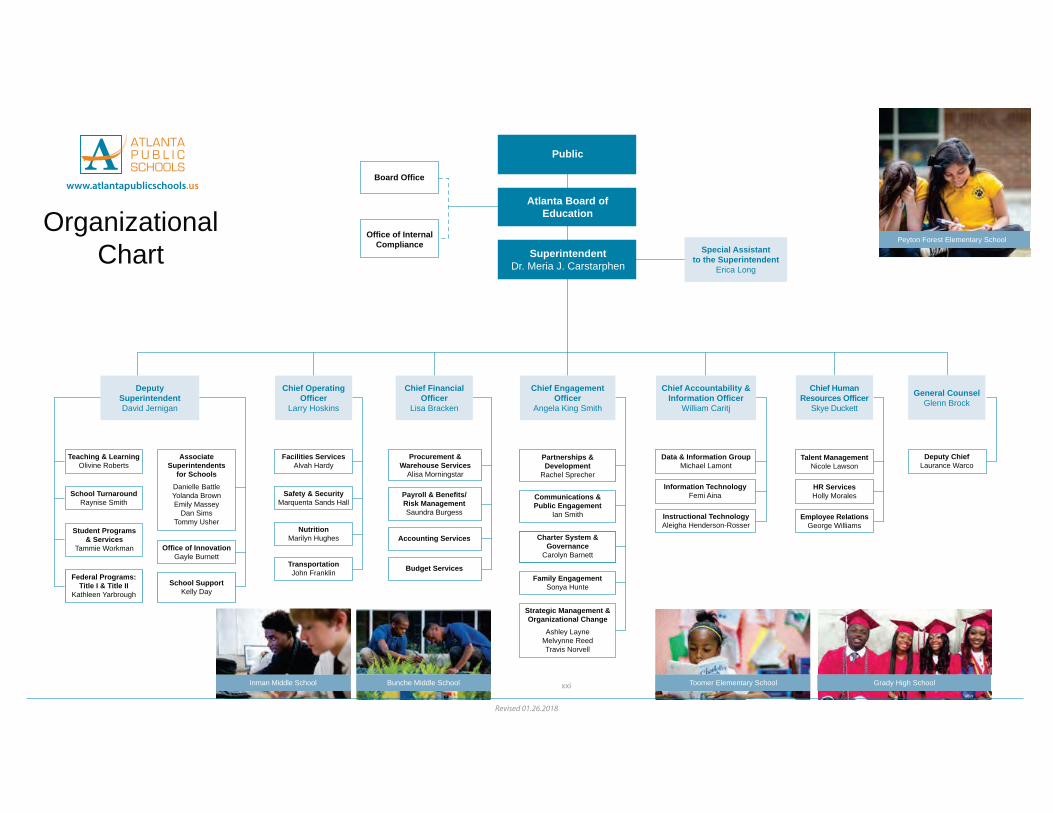
OrganizationalChart
Board Office
Office of Internal Compliance
Deputy SuperintendentDavid Jernigan
Chief Operating Officer
Larry Hoskins
Teaching & LearningOlivine Roberts
Facilities ServicesAlvah Hardy
General CounselGlenn Brock
Deputy ChiefLaurance Warco
Safety & SecurityMarquenta Sands Hall
NutritionMarilyn Hughes
TransportationJohn Franklin
Chief Financial Officer
Lisa Bracken
Procurement & Warehouse Services
Alisa Morningstar
Chief Engagement Officer
Angela King Smith
Strategic Management & Organizational Change
Ashley LayneMelvynne ReedTravis Norvell
Payroll & Benefits/Risk ManagementSaundra Burgess
Accounting Services
Family EngagementSonya Hunte
Budget Services
Chief Human Resources Officer
Skye Duckett
Talent ManagementNicole Lawson
School TurnaroundRaynise Smith
Office of InnovationGayle Burnett
Communications & Public Engagement
Ian Smith
Charter System & Governance
Carolyn Barnett
Partnerships & Development
Rachel Sprecher
HR ServicesHolly Morales
Employee RelationsGeorge Williams
Chief Accountability & Information Officer
William Caritj
Information TechnologyFemi Aina
Data & Information GroupMichael Lamont
Instructional Technology Aleigha Henderson-Rosser
Federal Programs:Title I & Title II
Kathleen Yarbrough
Student Programs & Services
Tammie Workman
Associate Superintendents
for SchoolsDanielle BattleYolanda BrownEmily Massey
Dan SimsTommy Usher
School SupportKelly Day
SuperintendentDr. Meria J. Carstarphen
Atlanta Board of Education
Public
Special Assistantto the Superintendent
Erica Long

INDEPENDENT AUDITOR’S REPORT
To the Superintendent and Members of the Atlanta Independent School System Atlanta, Georgia
Report on the Financial Statements
We have audited the accompanying financial statements of the governmental activities, each major fund, and the aggregate remaining fund information of the Atlanta Independent School System (the "School System") as of and for the fiscal year ended June 30, 2018, and the related notes to the financial statements, which collectively comprise the School System's basic financial statements as listed in the table of contents.
Management’s Responsibility for the Financial Statements
Management is responsible for the preparation and fair presentation of these financial statements in accordance with accounting principles generally accepted in the United States of America; this includes the design, implementation, and maintenance of internal control relevant to the preparation and fair presentation of financial statements that are free from material misstatement, whether due to fraud or error.
Auditor’s Responsibility
Our responsibility is to express opinions on these financial statements based on our audit. We conducted our audit in accordance with auditing standards generally accepted in the United States of America and the standards applicable to financial audits contained in Government Auditing Standards, issued by the Comptroller General of the United States. Those standards require that we plan and perform the audit to obtain reasonable assurance about whether the financial statements are free of material misstatement.
An audit involves performing procedures to obtain evidence about the amounts and disclosures in the financial statements. The procedures selected depend on the auditor’s judgment, including the assessment of the risks of material misstatement of the financial statements, whether due to fraud or error. In making those risk assessments, the auditor considers internal control relevant to the entity’s preparation and fair presentation of the financial statements in order to design audit procedures that are appropriate in the circumstances, but not for the purpose of expressing an opinion on the effectiveness of the entity’s internal control. Accordingly, we express no such opinion. An audit also includes evaluating the appropriateness of accounting policies used and reasonableness of significant accounting estimates made by management, as well as evaluating the overall presentation of the financial statements.
We believe that the audit evidence we have obtained is sufficient and appropriate to provide a basis for our audit opinions.
200 GALLERIA PARKWAY S.E., SUITE 1700 • ATLANTA, GA 30339-5946 • 770-955-8600 • 800-277-0080 • FAX 770-980-4489 • www.mjcpa.com Members of The American Institute of Certified Public Accountants
2
Opinions
In our opinion, the financial statements referred to above present fairly, in all material respects, the respective financial position of the governmental activities, each major fund, and the aggregate remaining fund information of the Atlanta Independent School System as of June 30, 2018, and the respective changes in financial position for the fiscal year then ended in accordance with accounting principles generally accepted in the United States of America.
Emphasis of Matter
As discussed in Notes I, O, and T, the School System implemented Governmental Accounting Standards Board (GASB) Statement No. 75, Accounting and Financial Reporting for Postemployment Benefits Other Than Pensions, as of July 1, 2017. This standard significantly changed the accounting for the School System’s Total OPEB Liability and the related disclosures. Our opinions are not modified with respect to this matter.
Other Matters
Required Supplementary Information
Accounting principles generally accepted in the United States of America require that the Management’s Discussion and Analysis, the Schedule of Proportionate Share of the Net Pension Liability (Teachers Retirement System of Georgia), the Schedule of School System’s Contributions (Teachers Retirement System of Georgia), the Schedule of Changes in the School System’s Net Pension Liability and Related Ratios (City of Atlanta General Employees’ Pension Fund), the Schedule of School System’s Contributions (City of Atlanta General Employees’ Pension Fund), the Schedule of Proportionate Share of the Net OPEB Liability (School OPEB Fund), the Schedule of School System’s Contributions – School OPEB Fund, and the General Fund Schedule of Revenues, Expenditures, and Changes in Fund Balance – Budget to Actual as listed in the table of contents to be presented to supplement the basic financial statements. Such information, although not a part of the basic financial statements, is required by the Governmental Accounting Standards Board who considers it to be an essential part of financial reporting for placing the basic financial statements in an appropriate operational, economic, or historical context. We have applied certain limited procedures to the required supplementary information in accordance with auditing standards generally accepted in the United States of America, which consisted of inquiries of management about the methods of preparing the information and comparing the information for consistency with management’s responses to our inquiries, the basic financial statements, and other knowledge we obtained during our audit of the basic financial statements. We do not express an opinion or provide any assurance on the information because the limited procedures do not provide us with sufficient evidence to express an opinion or provide any assurance.
Other Information
Our audit was conducted for the purpose of forming opinions on the financial statements that collectively comprise the School System’s basic financial statements. The other supplementary information section, as listed in the accompanying table of contents, and the schedule of expenditures of federal awards, as required by Title 2, U.S. Code of Federal Regulations (CFR), Part 200, Uniform Administrative Requirements, Cost Principles, and Audit Requirements for Federal Awards, as well as the introductory and statistical sections are presented for purposes of additional analysis and are not a required part of the basic financial statements.
3
Other Information (Continued)
The other supplementary information section and the schedule of expenditures of federal awards are the responsibility of management and were derived from and relate directly to the underlying accounting and other records used to prepare the basic financial statements. Such information has been subjected to the auditing procedures applied in the audit of the basic financial statements and certain additional procedures, including comparing and reconciling such information directly to the underlying accounting and other records used to prepare the basic financial statements or to the basic financial statements themselves, and other additional procedures in accordance with auditing standards generally accepted in the United States of America. In our opinion, the other supplementary information section and the schedule of expenditures of federal awards are fairly stated in all material respects in relation to the basic financial statements as a whole.
The introductory and statistical sections have not been subjected to the auditing procedures applied in the audit of the basic financial statements, and accordingly, we do not express an opinion or provide any assurance on them.
Other Reporting Required by Government Auditing Standards
In accordance with Government Auditing Standards, we have also issued our report dated February 20, 2019 on our consideration of the School System’s internal control over financial reporting and on our tests of its compliance with certain provisions of laws, regulations, contracts, and grant agreements and other matters. The purpose of that report is solely to describe the scope of our testing of internal control over financial reporting and compliance and the results of that testing, and not to provide an opinion on the effectiveness of the School System’s internal control over financial reporting or on compliance. That report is an integral part of an audit performed in accordance with Government Auditing Standards in considering the School System’s internal control over financial reporting and compliance.
Atlanta, Georgia February 20, 2019
MANAGEMENT’S DISCUSSION AND ANALYSIS

4
ATLANTA INDEPENDENT SCHOOL SYSTEM Management’s Discussion and Analysis
For the Fiscal Year Ended June 30, 2018
The discussion and analysis of the Atlanta Independent School System’s financial performance provides an overview of the fiscal year ended June 30, 2018. The intent of this discussion and analysis is to examine the School System’s financial performance as a whole, identify changes in financial position as well as to provide basic financial statements. The Basic Financial Statements should be reviewed by the readers to enhance their understanding of the School System’s financial performance as a whole or as an entire operating entity. The Basic Financial Statements contain the following components:
Government-wide financial statements including the Statement of Net Position and theStatement of Activities, which provide a broad, long-term overview of the School System’sfinances.
Fund-level financial statements provide a greater level of detail about the School System’smajor funds and focus on how well the School System has performed in the short-term inthe most significant funds.
Notes to the Basic Financial Statements.
This report also presents the highlights for the fiscal year ended June 30, 2018 and contains other supplementary information.
FINANCIAL HIGHLIGHTS
Overall, net position in fiscal year 2018 increased by 33.2% over fiscal year 2017. This was primarily due to an increase in tax revenues. The key financial highlights for fiscal year 2018 as represented are the following:
Total net position for the School System increased from approximately $122.80 million infiscal year 2017 (as restated) to approximately $163.58 million in fiscal year 2018, anincrease of approximately $40.78 million or 33.2% due to an increase in revenues.
Total revenues increased from approximately $919.47 million in fiscal year 2017 toapproximately $944.98 million in fiscal year 2018, an increase of approximately $25.51million or 2.8%.
Total expenses decreased approximately $6.86 million or .75% from approximately$911.06 million in fiscal year 2017 to approximately $904.20 million in fiscal year 2018.
Beginning net position was restated by $433,804,723 (a decrease in beginning netposition) due to the implementation of GASB 75 related to the recognition of beginningnet OPEB liability and related deferred outflows of resources for the first time in fiscalyear 2018.
5
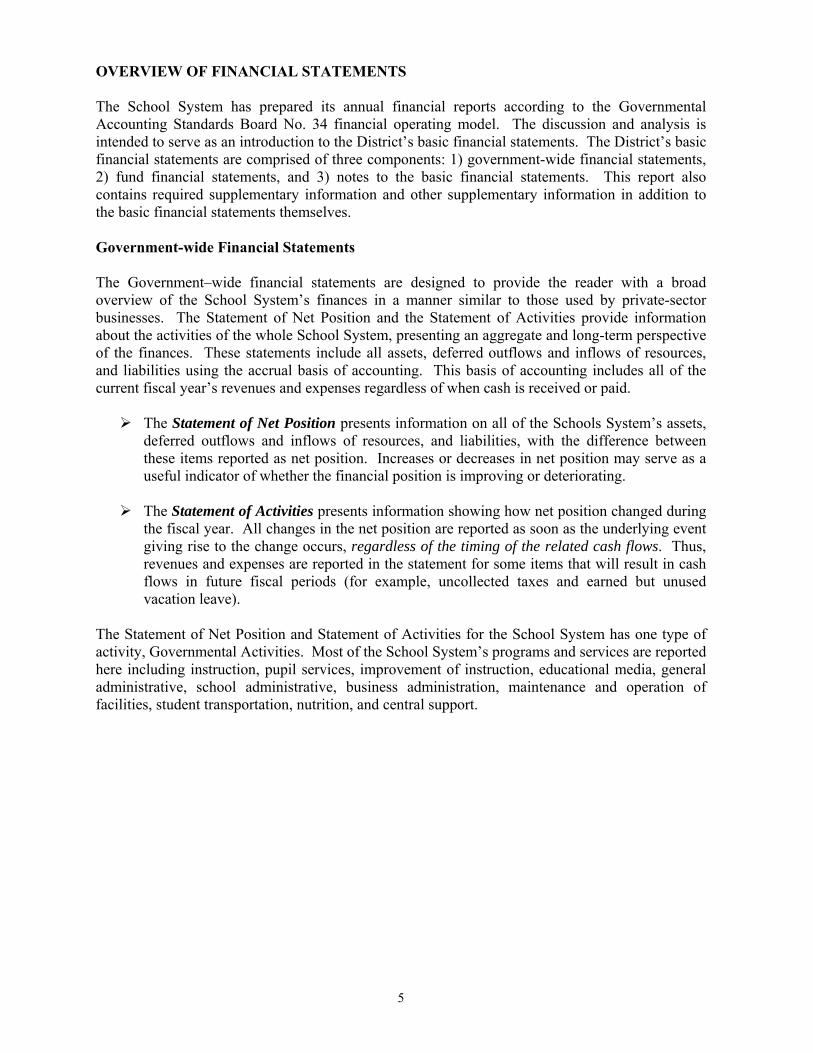
OVERVIEW OF FINANCIAL STATEMENTS
The School System has prepared its annual financial reports according to the Governmental Accounting Standards Board No. 34 financial operating model. The discussion and analysis is intended to serve as an introduction to the District’s basic financial statements. The District’s basic financial statements are comprised of three components: 1) government-wide financial statements, 2) fund financial statements, and 3) notes to the basic financial statements. This report alsocontains required supplementary information and other supplementary information in addition tothe basic financial statements themselves.
Government-wide Financial Statements
The Government–wide financial statements are designed to provide the reader with a broad overview of the School System’s finances in a manner similar to those used by private-sector businesses. The Statement of Net Position and the Statement of Activities provide information about the activities of the whole School System, presenting an aggregate and long-term perspective of the finances. These statements include all assets, deferred outflows and inflows of resources, and liabilities using the accrual basis of accounting. This basis of accounting includes all of the current fiscal year’s revenues and expenses regardless of when cash is received or paid.
The Statement of Net Position presents information on all of the Schools System’s assets,deferred outflows and inflows of resources, and liabilities, with the difference betweenthese items reported as net position. Increases or decreases in net position may serve as auseful indicator of whether the financial position is improving or deteriorating.
The Statement of Activities presents information showing how net position changed duringthe fiscal year. All changes in the net position are reported as soon as the underlying eventgiving rise to the change occurs, regardless of the timing of the related cash flows. Thus,revenues and expenses are reported in the statement for some items that will result in cashflows in future fiscal periods (for example, uncollected taxes and earned but unusedvacation leave).
The Statement of Net Position and Statement of Activities for the School System has one type of activity, Governmental Activities. Most of the School System’s programs and services are reported here including instruction, pupil services, improvement of instruction, educational media, general administrative, school administrative, business administration, maintenance and operation of facilities, student transportation, nutrition, and central support.
6
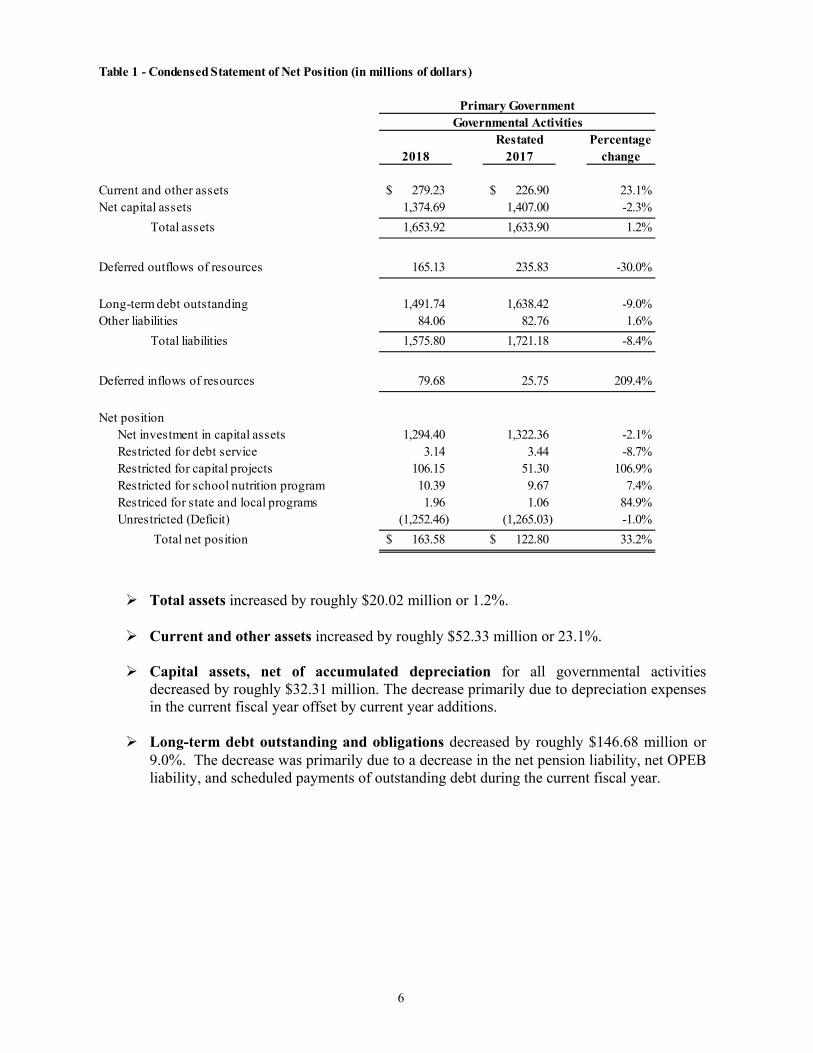
Table 1 - Condensed Statement of Net Position (in millions of dollars)
Restated Percentage2018 2017 change
Current and other assets 279.23$ 226.90$ 23.1%Net capital assets 1,374.69 1,407.00 -2.3%
Total assets 1,653.92 1,633.90 1.2%
Deferred outflows of resources 165.13 235.83 -30.0%
Long-term debt outstanding 1,491.74 1,638.42 -9.0%Other liabilities 84.06 82.76 1.6%
Total liabilities 1,575.80 1,721.18 -8.4%
Deferred inflows of resources 79.68 25.75 209.4%
Net positionNet investment in capital assets 1,294.40 1,322.36 -2.1%Restricted for debt service 3.14 3.44 -8.7%Restricted for capital projects 106.15 51.30 106.9%Restricted for school nutrition program 10.39 9.67 7.4%Restriced for state and local programs 1.96 1.06 84.9%Unrestricted (Deficit) (1,252.46) (1,265.03) -1.0%
Total net position 163.58$ 122.80$ 33.2%
Primary Government Governmental Activities
Total assets increased by roughly $20.02 million or 1.2%.
Current and other assets increased by roughly $52.33 million or 23.1%.
Capital assets, net of accumulated depreciation for all governmental activitiesdecreased by roughly $32.31 million. The decrease primarily due to depreciation expensesin the current fiscal year offset by current year additions.
Long-term debt outstanding and obligations decreased by roughly $146.68 million or9.0%. The decrease was primarily due to a decrease in the net pension liability, net OPEBliability, and scheduled payments of outstanding debt during the current fiscal year.
7
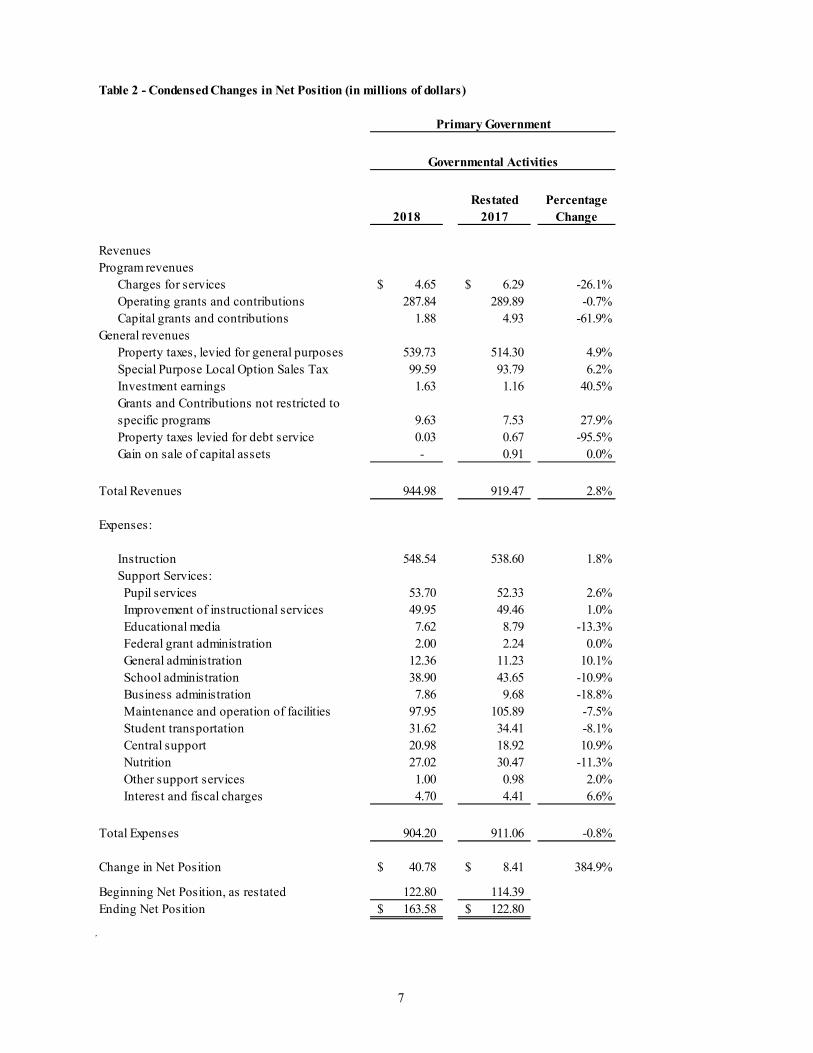
Table 2 - Condensed Changes in Net Position (in millions of dollars)
Restated Percentage2018 2017 Change
RevenuesProgram revenues
Charges for services 4.65$ 6.29$ -26.1%Operating grants and contributions 287.84 289.89 -0.7%Capital grants and contributions 1.88 4.93 -61.9%
General revenuesProperty taxes, levied for general purposes 539.73 514.30 4.9%Special Purpose Local Option Sales Tax 99.59 93.79 6.2%Investment earnings 1.63 1.16 40.5%Grants and Contributions not restricted to specific programs 9.63 7.53 27.9%Property taxes levied for debt service 0.03 0.67 -95.5%Gain on sale of capital assets - 0.91 0.0%
Total Revenues 944.98 919.47 2.8%
Expenses:
Instruction 548.54 538.60 1.8%Support Services: Pupil services 53.70 52.33 2.6% Improvement of instructional services 49.95 49.46 1.0% Educational media 7.62 8.79 -13.3% Federal grant administration 2.00 2.24 0.0% General administration 12.36 11.23 10.1% School administration 38.90 43.65 -10.9% Business administration 7.86 9.68 -18.8% Maintenance and operation of facilities 97.95 105.89 -7.5% Student transportation 31.62 34.41 -8.1% Central support 20.98 18.92 10.9% Nutrition 27.02 30.47 -11.3% Other support services 1.00 0.98 2.0% Interest and fiscal charges 4.70 4.41 6.6%
Total Expenses 904.20 911.06 -0.8%
Change in Net Position 40.78$ 8.41$ 384.9%
Beginning Net Position, as restated 122.80 114.39 Ending Net Position 163.58$ 122.80$
Governmental Activities
Primary Government
8
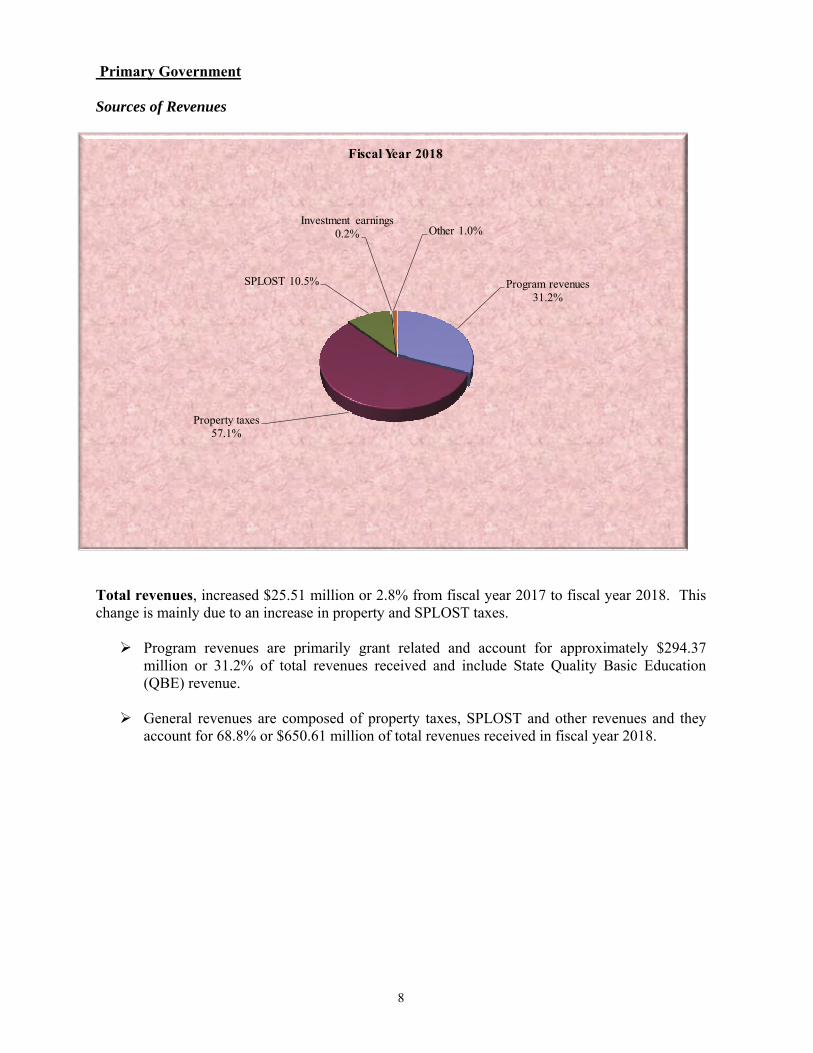
Primary Government
Sources of Revenues
Program revenues31.2%
Property taxes57.1%
SPLOST 10.5%
Investment earnings0.2% Other 1.0%
Fiscal Year 2018
Total revenues, increased $25.51 million or 2.8% from fiscal year 2017 to fiscal year 2018. This change is mainly due to an increase in property and SPLOST taxes.
Program revenues are primarily grant related and account for approximately $294.37million or 31.2% of total revenues received and include State Quality Basic Education(QBE) revenue.
General revenues are composed of property taxes, SPLOST and other revenues and theyaccount for 68.8% or $650.61 million of total revenues received in fiscal year 2018.

9
Primary Government
Expenses
Instruction60.7%
Pupil services5.9%
Improvement of instruction
5.5%
Educational media0.8%
Federal grant administration
0.2%
General administration1.4%
School administration4.3%
Business administration0.9%
Maintenance and operation of facilities
10.8%
Student transportation3.5%
Central support2.3% Nutrition
0.1%
Other support services3.0%
Interest expense0.5%
Fiscal Year 2018
Total expenses decreased from 2017 to 2018 by 0.8% or $6.86 million. This decrease is primarily due to the decrease in the net pension liability and net OPEB liability.
Four groups of activities account for 89.5% or $809.26 million of governmental spending:instruction ($548.54 million or 60.7%); pupil services and improvement of instructionalservices ($103.65 million or 11.5%); administration and business services ($59.12 millionor 6.5%); and maintenance and operations ($97.95 million or 10.8%).
10
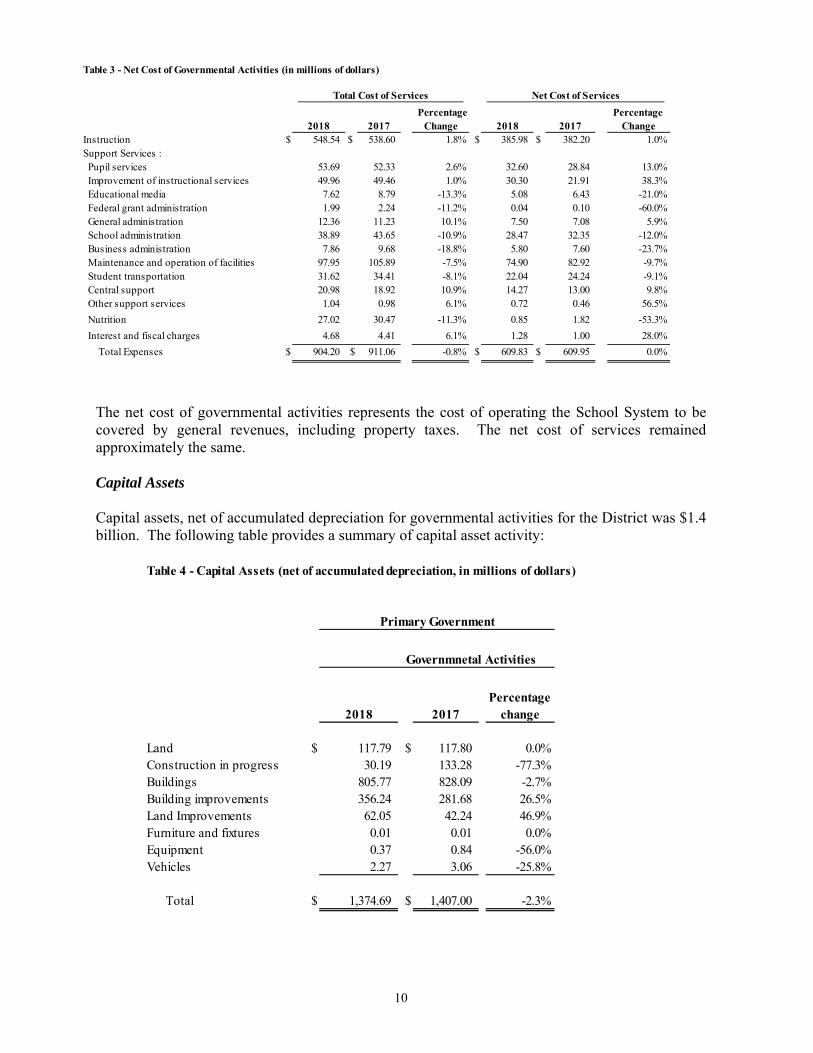
Table 3 - Net Cost of Governmental Activities (in millions of dollars)
Percentage Percentage 2018 2017 Change 2018 2017 Change
Instruction $ 548.54 $ 538.60 1.8% $ 385.98 $ 382.20 1.0%Support Services : Pupil services 53.69 52.33 2.6% 32.60 28.84 13.0% Improvement of instructional services 49.96 49.46 1.0% 30.30 21.91 38.3% Educational media 7.62 8.79 -13.3% 5.08 6.43 -21.0% Federal grant administration 1.99 2.24 -11.2% 0.04 0.10 -60.0% General administration 12.36 11.23 10.1% 7.50 7.08 5.9% School administration 38.89 43.65 -10.9% 28.47 32.35 -12.0% Business administration 7.86 9.68 -18.8% 5.80 7.60 -23.7% Maintenance and operation of facilities 97.95 105.89 -7.5% 74.90 82.92 -9.7% Student transportation 31.62 34.41 -8.1% 22.04 24.24 -9.1% Central support 20.98 18.92 10.9% 14.27 13.00 9.8% Other support services 1.04 0.98 6.1% 0.72 0.46 56.5%
Nutrition 27.02 30.47 -11.3% 0.85 1.82 -53.3%
Interest and fiscal charges 4.68 4.41 6.1% 1.28 1.00 28.0%
Total Expenses $ 904.20 $ 911.06 -0.8% $ 609.83 $ 609.95 0.0%
Total Cost of Services Net Cost of Services
The net cost of governmental activities represents the cost of operating the School System to be covered by general revenues, including property taxes. The net cost of services remained approximately the same.
Capital Assets
Capital assets, net of accumulated depreciation for governmental activities for the District was $1.4 billion. The following table provides a summary of capital asset activity:
Table 4 - Capital Assets (net of accumulated depreciation, in millions of dollars)
Governmnetal Activities
Percentage2018 2017 change
Land $ 117.79 $ 117.80 0.0%Construction in progress 30.19 133.28 -77.3%Buildings 805.77 828.09 -2.7%Building improvements 356.24 281.68 26.5%Land Improvements 62.05 42.24 46.9%Furniture and fixtures 0.01 0.01 0.0%Equipment 0.37 0.84 -56.0%Vehicles 2.27 3.06 -25.8%
Total $ 1,374.69 $ 1,407.00 -2.3%
Primary Government
11
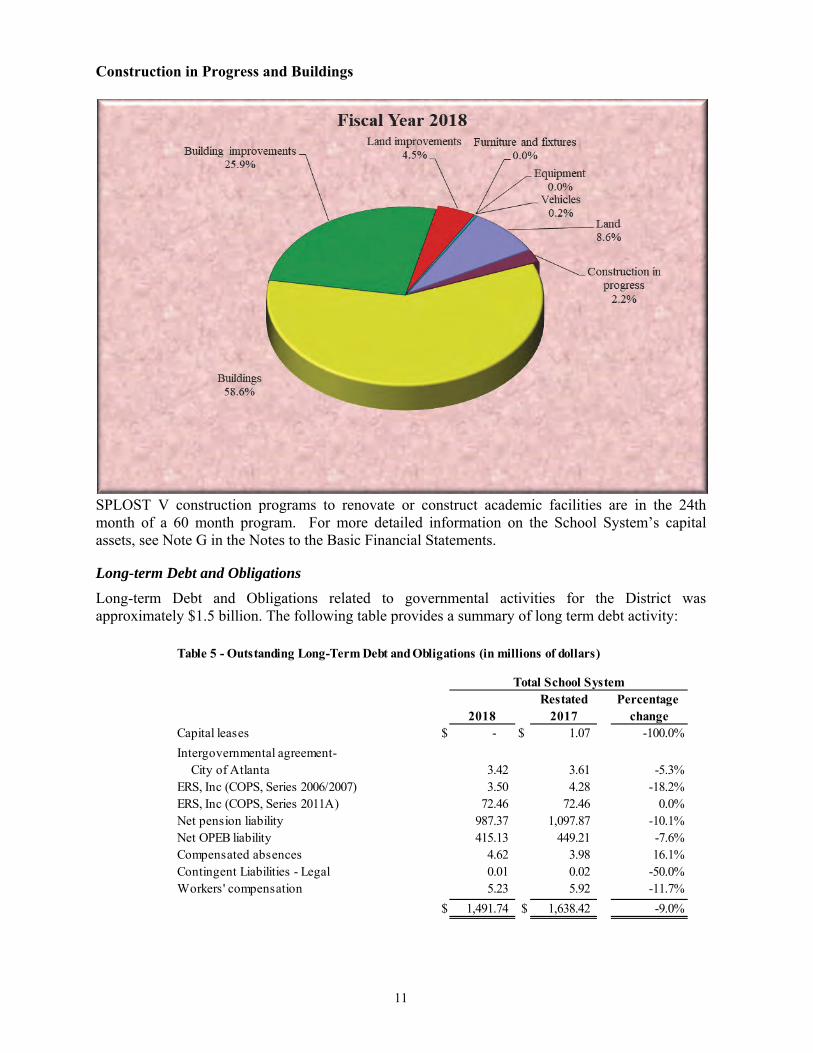
Construction in Progress and Buildings
SPLOST V construction programs to renovate or construct academic facilities are in the 24th month of a 60 month program. For more detailed information on the School System’s capital assets, see Note G in the Notes to the Basic Financial Statements.
Long-term Debt and Obligations Long-term Debt and Obligations related to governmental activities for the District was approximately $1.5 billion. The following table provides a summary of long term debt activity:
Table 5 - Outstanding Long-Term Debt and Obligations (in millions of dollars)
Restated Percentage 2018 2017 change
Capital leases $ - $ 1.07 -100.0%
Intergovernmental agreement-City of Atlanta 3.42 3.61 -5.3%
ERS, Inc (COPS, Series 2006/2007) 3.50 4.28 -18.2%ERS, Inc (COPS, Series 2011A) 72.46 72.46 0.0%Net pension liability 987.37 1,097.87 -10.1%Net OPEB liability 415.13 449.21 -7.6%Compensated absences 4.62 3.98 16.1%Contingent Liabilities - Legal 0.01 0.02 -50.0%Workers' compensation 5.23 5.92 -11.7%
$ 1,491.74 $ 1,638.42 -9.0%
Total School System
12
Outstanding long-term debt and obligations decreased in the current fiscal year due to the decrease in the net pension liability, net OPEB liability and scheduled payments on outstanding debt during the current fiscal year. For more detailed information on the School System’s long-term debt, see Note I in the Notes to the Basic Financial Statements.
Fund Financial Statements Fund financial statements provide detailed information regarding the resources segregated for specific activities or objectives, not Government-wide. Funds are used to track specific sources of revenue and expenditures for particular programs.
The School System has two types of funds:
Governmental funds – These funds are used to account for most of the School System’s basic services and focus on providing cash flow available for spending. These funds include the General Fund, Capital Projects Fund, and other governmental funds of lesser magnitude. Fund accounting statements use the modified accrual method of accounting, which measures cash and other financial assets that can be readily converted to cash. These statements present a short-term view of the School System’s operations and services and do not include the long-term focus presented in the Government-wide financial statements. For an explanation of the differences, see the reconciliations included with the Governmental Fund Statements.
Fiduciary fund – This fund accounts for assets not owned by the School System but for which the School System is responsible for ensuring that the assets in the funds are used for their designated purposes. This fund is not included in the Government-wide financial statements because it cannot be used to finance the School System operations. The School System has one fiduciary fund - Agency Funds (Local School, Club, and Class Funds).
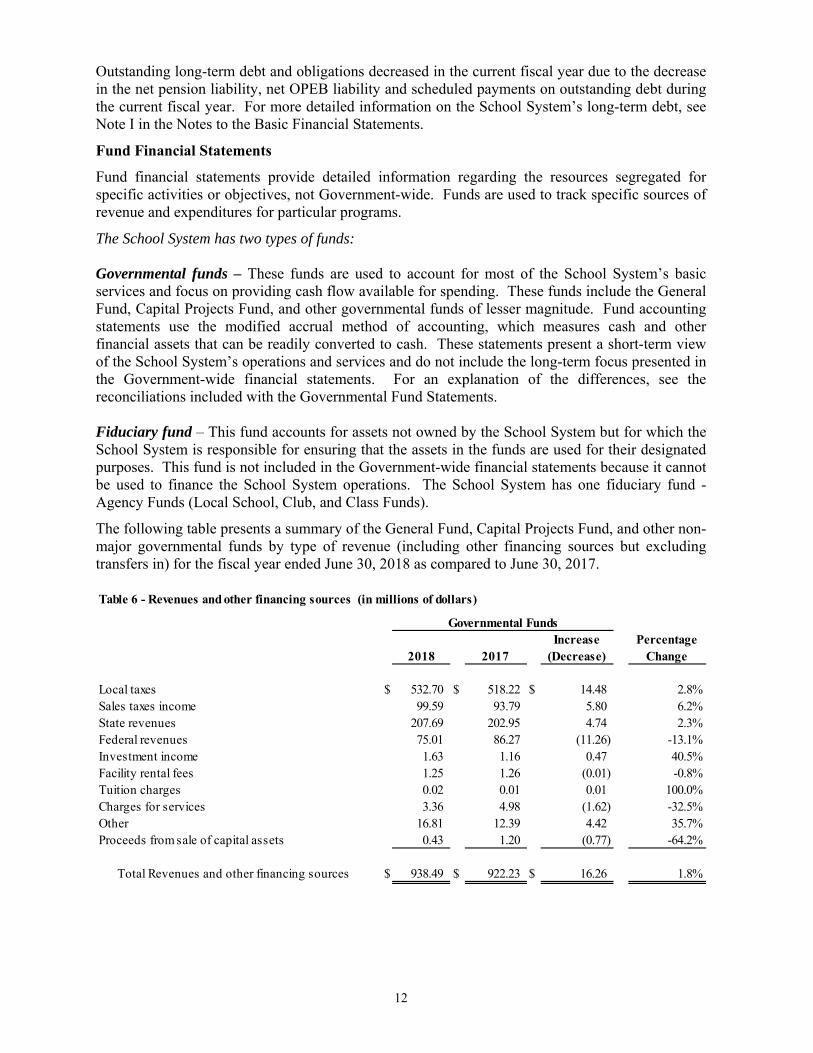
The following table presents a summary of the General Fund, Capital Projects Fund, and other non-major governmental funds by type of revenue (including other financing sources but excluding transfers in) for the fiscal year ended June 30, 2018 as compared to June 30, 2017.
Table 6 - Revenues and other financing sources (in millions of dollars)
2018 2017Increase
(Decrease)Percentage
Change
Local taxes $ 532.70 $ 518.22 $ 14.48 2.8%Sales taxes income 99.59 93.79 5.80 6.2%State revenues 207.69 202.95 4.74 2.3%Federal revenues 75.01 86.27 (11.26) -13.1%Investment income 1.63 1.16 0.47 40.5%Facility rental fees 1.25 1.26 (0.01) -0.8%Tuition charges 0.02 0.01 0.01 100.0%Charges for services 3.36 4.98 (1.62) -32.5%Other 16.81 12.39 4.42 35.7%Proceeds from sale of capital assets 0.43 1.20 (0.77) -64.2%
Total Revenues and other financing sources $ 938.49 $ 922.23 $ 16.26 1.8%
Governmental Funds
13
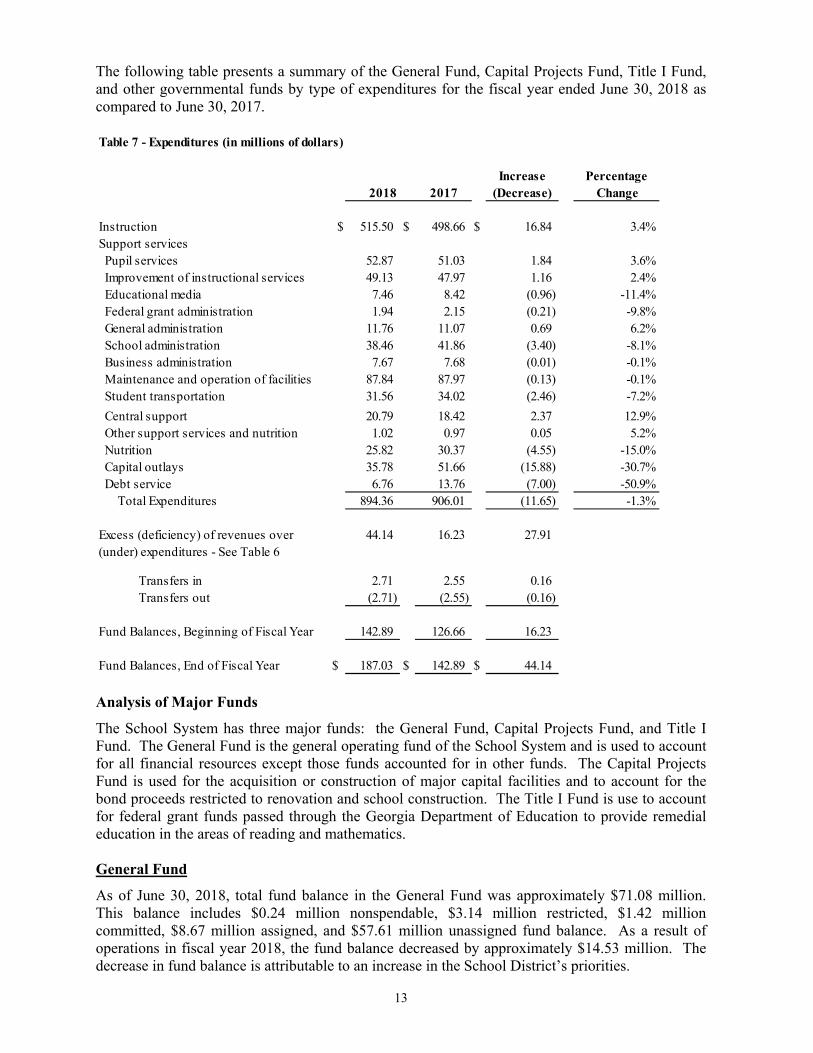
The following table presents a summary of the General Fund, Capital Projects Fund, Title I Fund, and other governmental funds by type of expenditures for the fiscal year ended June 30, 2018 as compared to June 30, 2017.
Table 7 - Expenditures (in millions of dollars)
Increase Percentage 2018 2017 (Decrease) Change
Instruction $ 515.50 $ 498.66 $ 16.84 3.4%Support services Pupil services 52.87 51.03 1.84 3.6% Improvement of instructional services 49.13 47.97 1.16 2.4% Educational media 7.46 8.42 (0.96) -11.4% Federal grant administration 1.94 2.15 (0.21) -9.8% General administration 11.76 11.07 0.69 6.2% School administration 38.46 41.86 (3.40) -8.1% Business administration 7.67 7.68 (0.01) -0.1% Maintenance and operation of facilities 87.84 87.97 (0.13) -0.1% Student transportation 31.56 34.02 (2.46) -7.2%
Central support 20.79 18.42 2.37 12.9% Other support services and nutrition 1.02 0.97 0.05 5.2% Nutrition 25.82 30.37 (4.55) -15.0% Capital outlays 35.78 51.66 (15.88) -30.7% Debt service 6.76 13.76 (7.00) -50.9%
Total Expenditures 894.36 906.01 (11.65) -1.3%
Excess (deficiency) of revenues over 44.14 16.23 27.91 (under) expenditures - See Table 6
Transfers in 2.71 2.55 0.16 Transfers out (2.71) (2.55) (0.16)
Fund Balances, Beginning of Fiscal Year 142.89 126.66 16.23
Fund Balances, End of Fiscal Year $ 187.03 $ 142.89 $ 44.14
Analysis of Major Funds The School System has three major funds: the General Fund, Capital Projects Fund, and Title I Fund. The General Fund is the general operating fund of the School System and is used to account for all financial resources except those funds accounted for in other funds. The Capital Projects Fund is used for the acquisition or construction of major capital facilities and to account for the bond proceeds restricted to renovation and school construction. The Title I Fund is use to account for federal grant funds passed through the Georgia Department of Education to provide remedial education in the areas of reading and mathematics.
General Fund As of June 30, 2018, total fund balance in the General Fund was approximately $71.08 million. This balance includes $0.24 million nonspendable, $3.14 million restricted, $1.42 million committed, $8.67 million assigned, and $57.61 million unassigned fund balance. As a result of operations in fiscal year 2018, the fund balance decreased by approximately $14.53 million. The decrease in fund balance is attributable to an increase in the School District’s priorities.
14
Capital Projects Fund As of June 30, 2018, total fund balance in the Capital Projects Fund was approximately $101.82 million. This balance includes $101.82 million restricted. The fund balance increased by $57.36 million due primarily to higher SPLOST collections than anticipated and SPLOST IV funds remaining.
Title I Fund As of June 30, 2018, the Title I Fund has a zero fund balance as the fund is used to account for a reimbursable grant and therefore, revenues equaled expenditures.
Other Governmental Funds As of June 30, 2018, total fund balance in Nonmajor Governmental Funds was $14.13 million. This balance included approximately $0.32 million in nonspendable, $12.02 million restricted, $1.79 million assigned and -$0.02 million in unassigned. The fund balance increased by $1.31 million due primarily to a decrease in student meal participation which resulted in an overall decrease in nutrition expenditures.
Current Issues Currently known facts, decisions, or conditions that are expected to significantly affect the financial position or results of operations are as follows:
The Fulton County Board of Commissioners voted to freeze a portion of the tax digest for reassessed residential properties at 2017 levels, their decision resulted in a delay in payment of tax revenues in the amount of $485 million, greatly impacting operating cash flows prompting the District to issue a Tax Anticipation Note (TAN). In 2018, the 2017 digest had still not been approved when the new one was submitted. The rate of appeals was so high that the Department of Revenue rejected the digest forcing another temporary collection order; however, this year a smaller amount and short duration was needed due to planning efforts.
The Appropriations Act for fiscal year 2019 establishes maintenance of the employer contributions for the Teachers Plan. The fiscal year 2019 annualized teachers plan employer contribution rate is a monthly amount of $945.00 for each certified employee enrolled in the plan and continuing until changed by Board resolution. This was the same amount as fiscal year 2018.
General Fund Budgetary Highlights The School System’s budget is prepared by the Finance Division and is a collaborative effort between the School System and the Atlanta community. The basis for preparation utilizes a zero-based approach because it has systematically provided a more accurate account of anticipated spending levels for the fiscal year.
For Budget to Actual comparison purposes, the General Fund reported excess expenditures over final budget for the following functions:
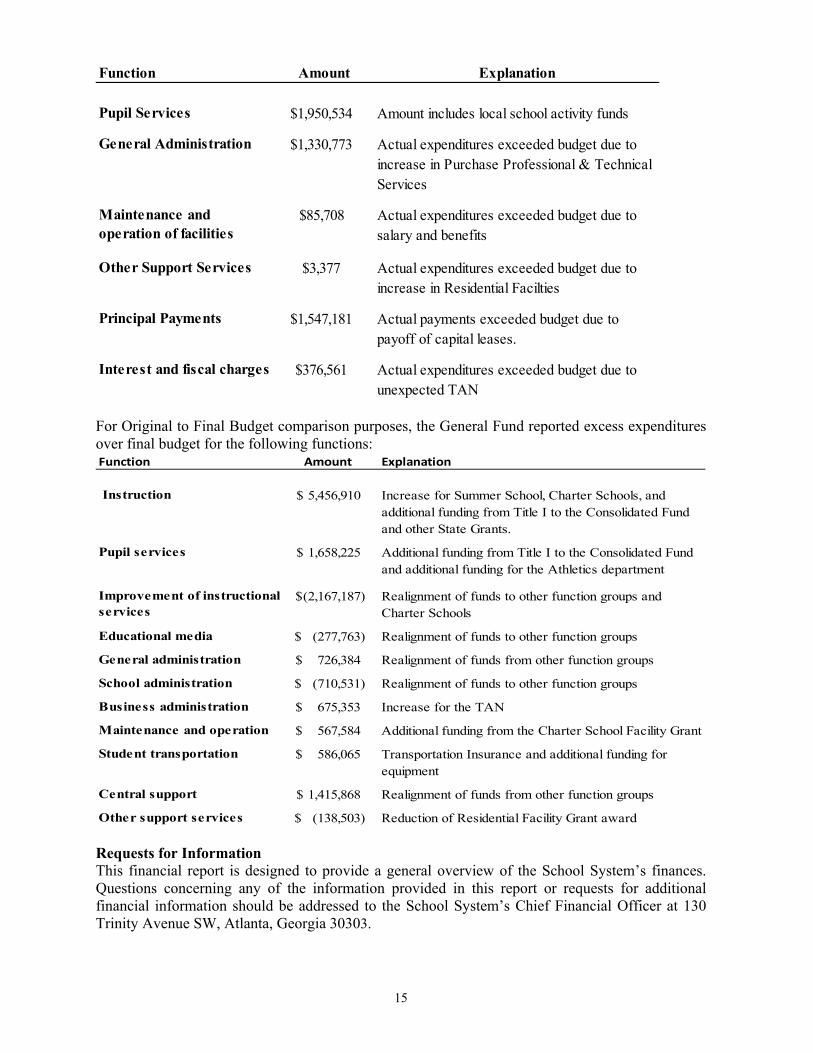
15
Function Amount Explanation
Pupil Services $1,950,534 Amount includes local school activity funds
General Administration $1,330,773 Actual expenditures exceeded budget due to increase in Purchase Professional & Technical Services
Maintenance and operation of facilities
$85,708 Actual expenditures exceeded budget due to salary and benefits
Other Support Services $3,377 Actual expenditures exceeded budget due to increase in Residential Facilties
Principal Payments $1,547,181 Actual payments exceeded budget due to payoff of capital leases.
Interest and fiscal charges $376,561 Actual expenditures exceeded budget due to unexpected TAN
For Original to Final Budget comparison purposes, the General Fund reported excess expenditures over final budget for the following functions: Function Amount Explanation
Instruction 5,456,910$ Increase for Summer School, Charter Schools, and additional funding from Title I to the Consolidated Fund and other State Grants.
Pupil services 1,658,225$ Additional funding from Title I to the Consolidated Fund and additional funding for the Athletics department
Improvement of instructional services
(2,167,187)$ Realignment of funds to other function groups and Charter Schools
Educational media (277,763)$ Realignment of funds to other function groups
General administration 726,384$ Realignment of funds from other function groups
School administration (710,531)$ Realignment of funds to other function groups
Business administration 675,353$ Increase for the TAN
Maintenance and operation 567,584$ Additional funding from the Charter School Facility Grant
Student transportation 586,065$ Transportation Insurance and additional funding for equipment
Central support 1,415,868$ Realignment of funds from other function groups
Other support services (138,503)$ Reduction of Residential Facility Grant award
Requests for Information This financial report is designed to provide a general overview of the School System’s finances. Questions concerning any of the information provided in this report or requests for additional financial information should be addressed to the School System’s Chief Financial Officer at 130 Trinity Avenue SW, Atlanta, Georgia 30303.

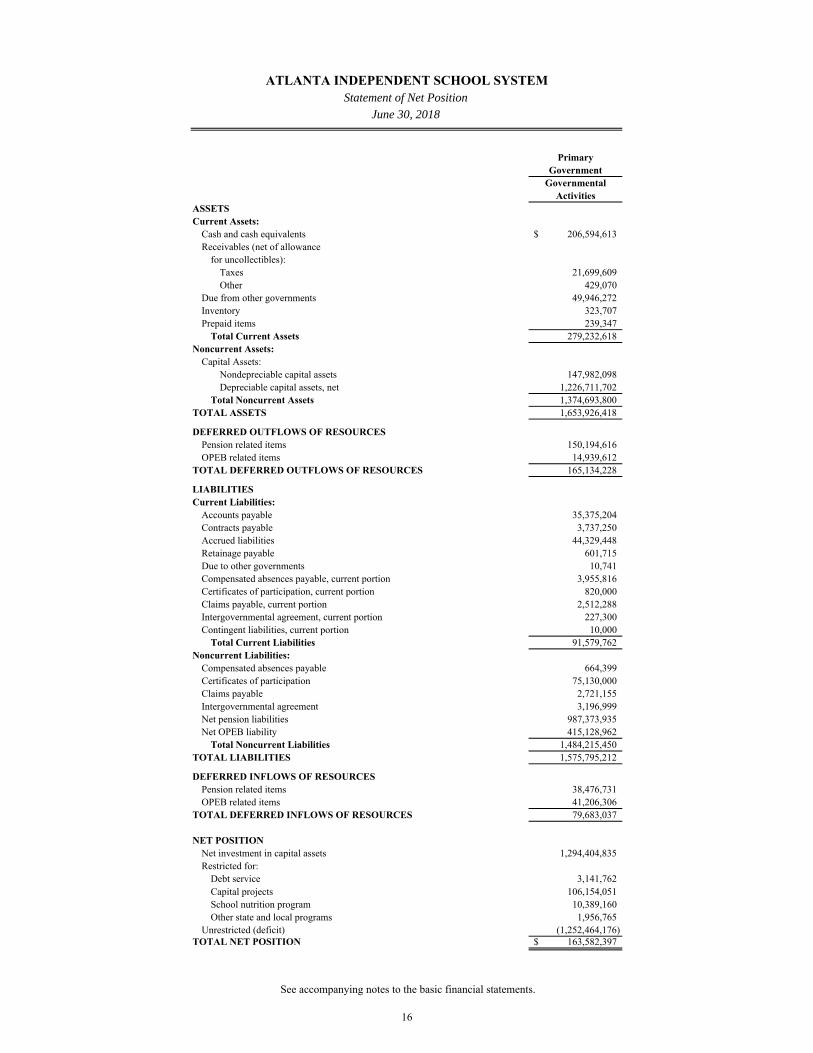
PrimaryGovernment
GovernmentalActivities
ASSETSCurrent Assets:
Cash and cash equivalents 206,594,613$ Receivables (net of allowance
for uncollectibles):Taxes 21,699,609 Other 429,070
Due from other governments 49,946,272 Inventory 323,707 Prepaid items 239,347
Total Current Assets 279,232,618 Noncurrent Assets:
Capital Assets:Nondepreciable capital assets 147,982,098 Depreciable capital assets, net 1,226,711,702
Total Noncurrent Assets 1,374,693,800 TOTAL ASSETS 1,653,926,418
DEFERRED OUTFLOWS OF RESOURCESPension related items 150,194,616 OPEB related items 14,939,612
TOTAL DEFERRED OUTFLOWS OF RESOURCES 165,134,228
LIABILITIESCurrent Liabilities:
Accounts payable 35,375,204 Contracts payable 3,737,250 Accrued liabilities 44,329,448 Retainage payable 601,715 Due to other governments 10,741 Compensated absences payable, current portion 3,955,816 Certificates of participation, current portion 820,000 Claims payable, current portion 2,512,288 Intergovernmental agreement, current portion 227,300 Contingent liabilities, current portion 10,000
Total Current Liabilities 91,579,762 Noncurrent Liabilities:
Compensated absences payable 664,399 Certificates of participation 75,130,000 Claims payable 2,721,155 Intergovernmental agreement 3,196,999 Net pension liabilities 987,373,935 Net OPEB liability 415,128,962
Total Noncurrent Liabilities 1,484,215,450 TOTAL LIABILITIES 1,575,795,212
DEFERRED INFLOWS OF RESOURCESPension related items 38,476,731 OPEB related items 41,206,306
TOTAL DEFERRED INFLOWS OF RESOURCES 79,683,037
NET POSITIONNet investment in capital assets 1,294,404,835 Restricted for:
Debt service 3,141,762 Capital projects 106,154,051 School nutrition program 10,389,160 Other state and local programs 1,956,765
Unrestricted (deficit) (1,252,464,176) TOTAL NET POSITION 163,582,397$
ATLANTA INDEPENDENT SCHOOL SYSTEMStatement of Net Position
June 30, 2018
See accompanying notes to the basic financial statements.
16
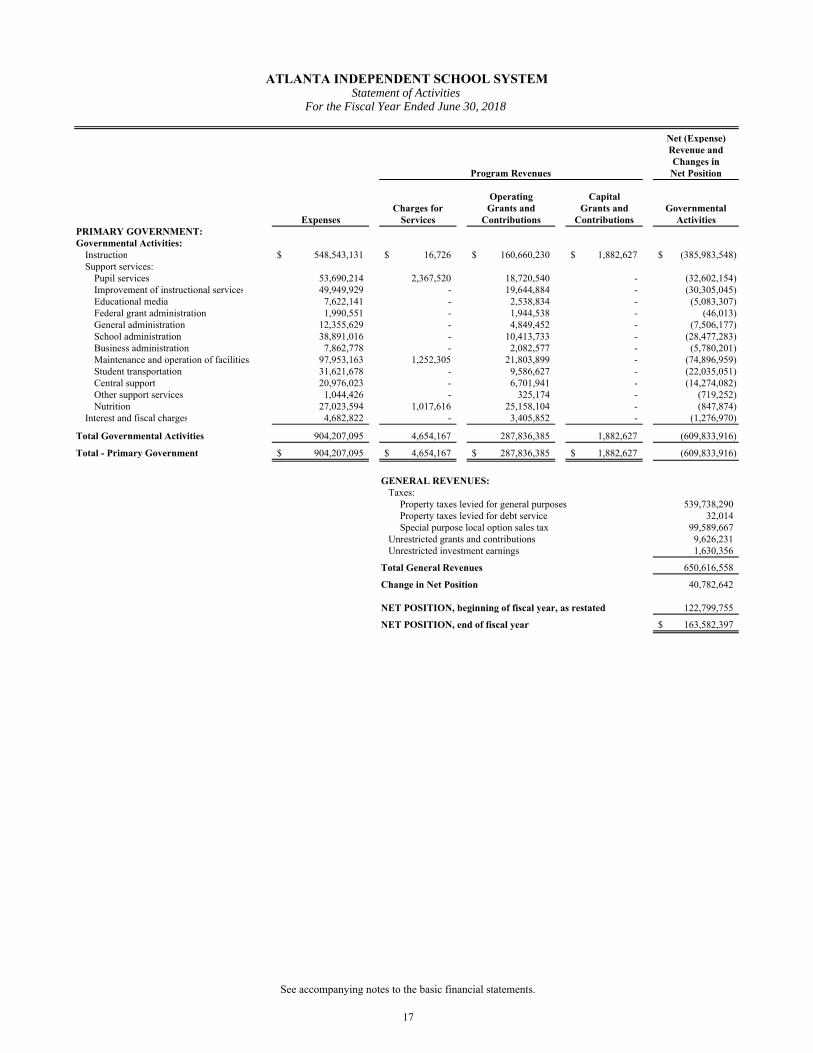
Net (Expense)Revenue andChanges in
Program Revenues Net Position
Operating CapitalCharges for Grants and Grants and Governmental
Expenses Services Contributions Contributions ActivitiesPRIMARY GOVERNMENT:Governmental Activities:
Instruction 548,543,131$ 16,726$ 160,660,230$ 1,882,627$ (385,983,548)$ Support services:
Pupil services 53,690,214 2,367,520 18,720,540 - (32,602,154) Improvement of instructional services 49,949,929 - 19,644,884 - (30,305,045) Educational media 7,622,141 - 2,538,834 - (5,083,307) Federal grant administration 1,990,551 - 1,944,538 - (46,013) General administration 12,355,629 - 4,849,452 - (7,506,177) School administration 38,891,016 - 10,413,733 - (28,477,283) Business administration 7,862,778 - 2,082,577 - (5,780,201) Maintenance and operation of facilities 97,953,163 1,252,305 21,803,899 - (74,896,959) Student transportation 31,621,678 - 9,586,627 - (22,035,051) Central support 20,976,023 - 6,701,941 - (14,274,082) Other support services 1,044,426 - 325,174 - (719,252) Nutrition 27,023,594 1,017,616 25,158,104 - (847,874)
Interest and fiscal charges 4,682,822 - 3,405,852 - (1,276,970)
Total Governmental Activities 904,207,095 4,654,167 287,836,385 1,882,627 (609,833,916)
Total - Primary Government 904,207,095$ 4,654,167$ 287,836,385$ 1,882,627$ (609,833,916)
GENERAL REVENUES: Taxes:
Property taxes levied for general purposes 539,738,290 Property taxes levied for debt service 32,014 Special purpose local option sales tax 99,589,667
Unrestricted grants and contributions 9,626,231 Unrestricted investment earnings 1,630,356
Total General Revenues 650,616,558
Change in Net Position 40,782,642
NET POSITION, beginning of fiscal year, as restated 122,799,755
NET POSITION, end of fiscal year 163,582,397$
ATLANTA INDEPENDENT SCHOOL SYSTEMStatement of Activities
For the Fiscal Year Ended June 30, 2018
See accompanying notes to the basic financial statements.
17
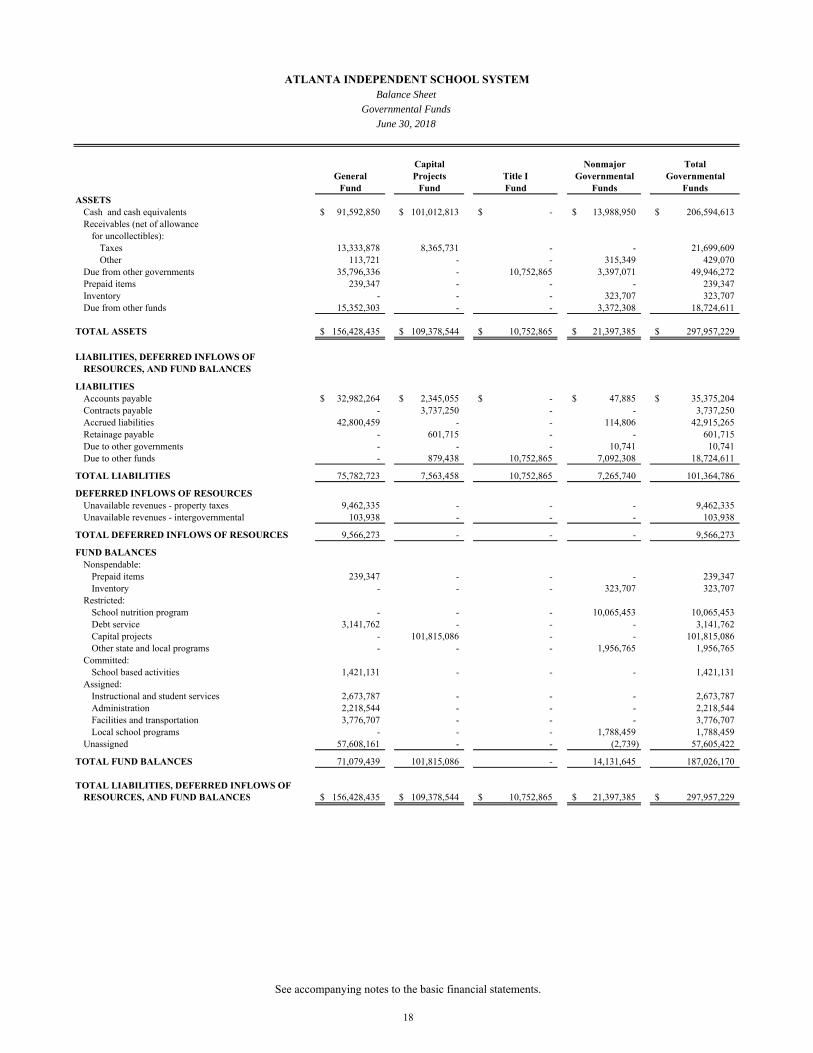
Capital Nonmajor TotalGeneral Projects Title I Governmental Governmental
Fund Fund Fund Funds FundsASSETS
Cash and cash equivalents 91,592,850$ 101,012,813$ -$ 13,988,950$ 206,594,613$ Receivables (net of allowance
for uncollectibles):Taxes 13,333,878 8,365,731 - - 21,699,609 Other 113,721 - - 315,349 429,070
Due from other governments 35,796,336 - 10,752,865 3,397,071 49,946,272 Prepaid items 239,347 - - - 239,347 Inventory - - - 323,707 323,707 Due from other funds 15,352,303 - - 3,372,308 18,724,611
TOTAL ASSETS 156,428,435$ 109,378,544$ 10,752,865$ 21,397,385$ 297,957,229$
LIABILITIES, DEFERRED INFLOWS OFRESOURCES, AND FUND BALANCES
LIABILITIESAccounts payable 32,982,264$ 2,345,055$ -$ 47,885$ 35,375,204$ Contracts payable - 3,737,250 - - 3,737,250 Accrued liabilities 42,800,459 - - 114,806 42,915,265 Retainage payable - 601,715 - - 601,715 Due to other governments - - - 10,741 10,741 Due to other funds - 879,438 10,752,865 7,092,308 18,724,611
TOTAL LIABILITIES 75,782,723 7,563,458 10,752,865 7,265,740 101,364,786
DEFERRED INFLOWS OF RESOURCESUnavailable revenues - property taxes 9,462,335 - - - 9,462,335 Unavailable revenues - intergovernmental 103,938 - - - 103,938
TOTAL DEFERRED INFLOWS OF RESOURCES 9,566,273 - - - 9,566,273
FUND BALANCESNonspendable:
Prepaid items 239,347 - - - 239,347 Inventory - - - 323,707 323,707
Restricted:School nutrition program - - - 10,065,453 10,065,453 Debt service 3,141,762 - - - 3,141,762 Capital projects - 101,815,086 - - 101,815,086 Other state and local programs - - - 1,956,765 1,956,765
Committed:School based activities 1,421,131 - - - 1,421,131
Assigned:Instructional and student services 2,673,787 - - - 2,673,787 Administration 2,218,544 - - - 2,218,544 Facilities and transportation 3,776,707 - - - 3,776,707 Local school programs - - - 1,788,459 1,788,459
Unassigned 57,608,161 - - (2,739) 57,605,422
TOTAL FUND BALANCES 71,079,439 101,815,086 - 14,131,645 187,026,170
TOTAL LIABILITIES, DEFERRED INFLOWS OF RESOURCES, AND FUND BALANCES 156,428,435$ 109,378,544$ 10,752,865$ 21,397,385$ 297,957,229$
ATLANTA INDEPENDENT SCHOOL SYSTEMBalance Sheet
Governmental Funds
June 30, 2018
See accompanying notes to the basic financial statements.
18
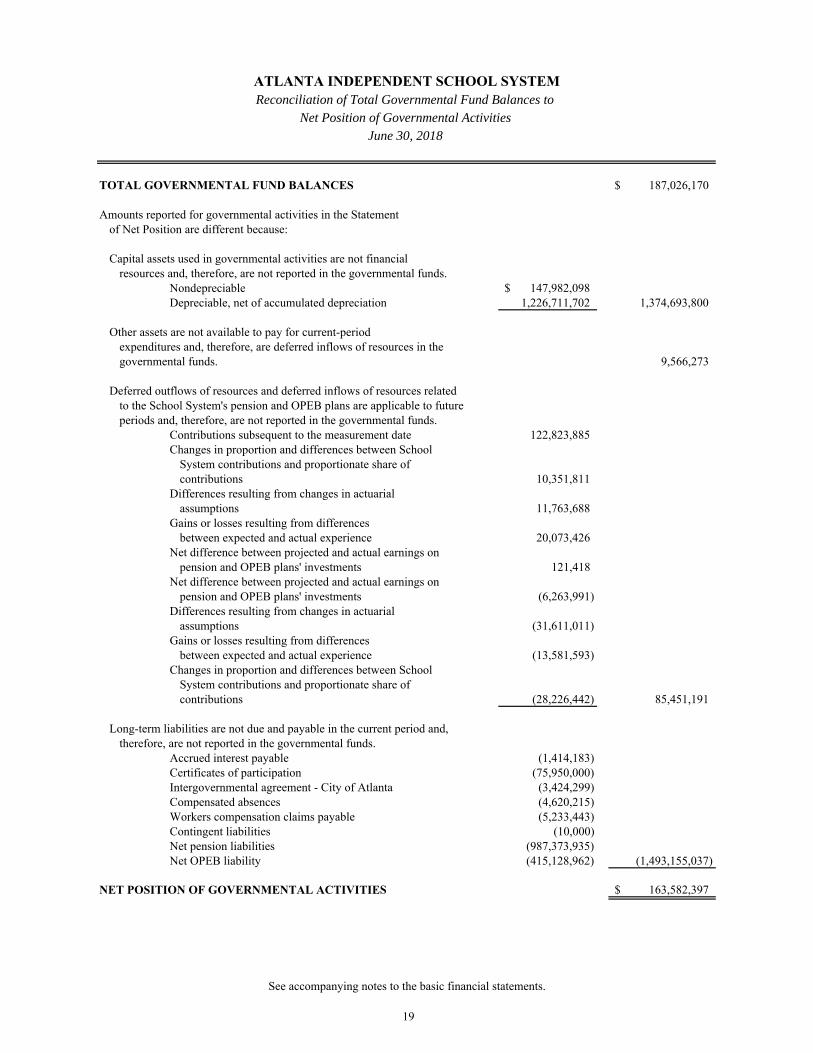
TOTAL GOVERNMENTAL FUND BALANCES 187,026,170$
Amounts reported for governmental activities in the Statementof Net Position are different because:
Capital assets used in governmental activities are not financial resources and, therefore, are not reported in the governmental funds.
Nondepreciable 147,982,098$ Depreciable, net of accumulated depreciation 1,226,711,702 1,374,693,800
Other assets are not available to pay for current-periodexpenditures and, therefore, are deferred inflows of resources in thegovernmental funds. 9,566,273
Deferred outflows of resources and deferred inflows of resources relatedto the School System's pension and OPEB plans are applicable to future periods and, therefore, are not reported in the governmental funds.
Contributions subsequent to the measurement date 122,823,885 Changes in proportion and differences between School
System contributions and proportionate share ofcontributions 10,351,811
Differences resulting from changes in actuarialassumptions 11,763,688
Gains or losses resulting from differencesbetween expected and actual experience 20,073,426
Net difference between projected and actual earnings onpension and OPEB plans' investments 121,418
Net difference between projected and actual earnings onpension and OPEB plans' investments (6,263,991)
Differences resulting from changes in actuarialassumptions (31,611,011)
Gains or losses resulting from differencesbetween expected and actual experience (13,581,593)
Changes in proportion and differences between SchoolSystem contributions and proportionate share ofcontributions (28,226,442) 85,451,191
Long-term liabilities are not due and payable in the current period and,therefore, are not reported in the governmental funds.
Accrued interest payable (1,414,183) Certificates of participation (75,950,000) Intergovernmental agreement - City of Atlanta (3,424,299) Compensated absences (4,620,215) Workers compensation claims payable (5,233,443) Contingent liabilities (10,000) Net pension liabilities (987,373,935) Net OPEB liability (415,128,962) (1,493,155,037)
NET POSITION OF GOVERNMENTAL ACTIVITIES 163,582,397$
ATLANTA INDEPENDENT SCHOOL SYSTEMReconciliation of Total Governmental Fund Balances to
Net Position of Governmental ActivitiesJune 30, 2018
See accompanying notes to the basic financial statements.
19
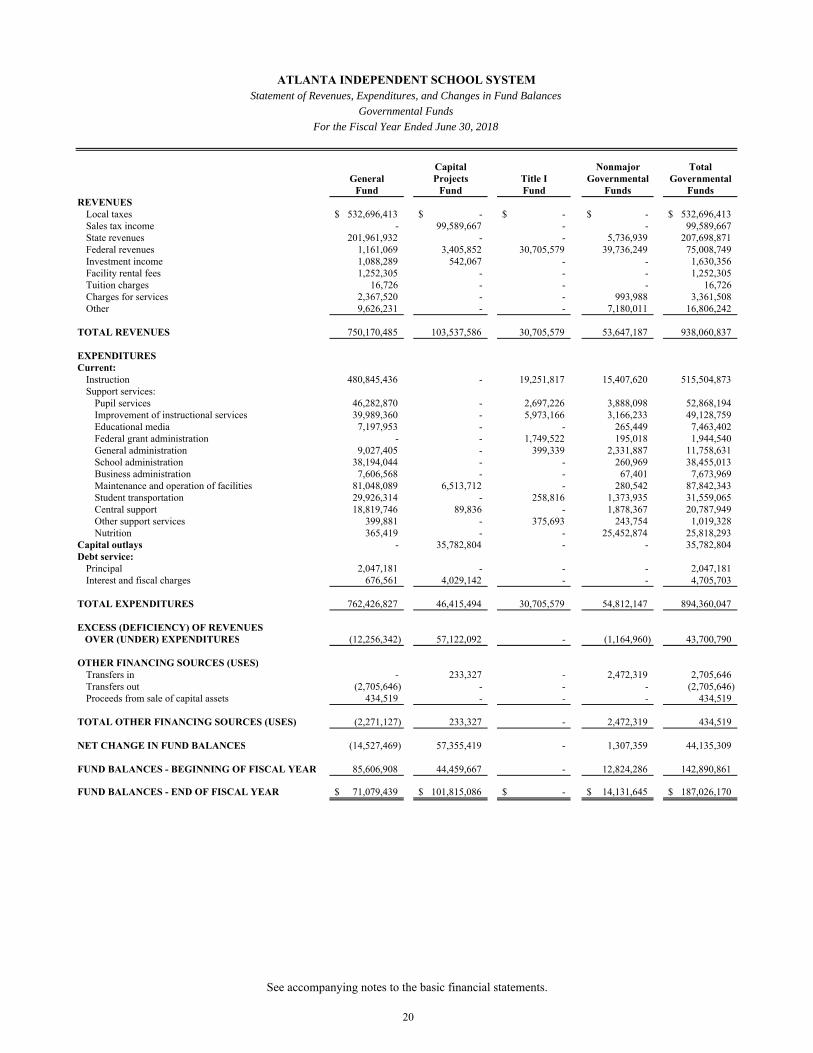
Capital Nonmajor TotalGeneral Projects Title I Governmental Governmental
Fund Fund Fund Funds FundsREVENUES
Local taxes 532,696,413$ -$ -$ -$ 532,696,413$ Sales tax income - 99,589,667 - - 99,589,667 State revenues 201,961,932 - - 5,736,939 207,698,871 Federal revenues 1,161,069 3,405,852 30,705,579 39,736,249 75,008,749 Investment income 1,088,289 542,067 - - 1,630,356 Facility rental fees 1,252,305 - - - 1,252,305 Tuition charges 16,726 - - - 16,726 Charges for services 2,367,520 - - 993,988 3,361,508 Other 9,626,231 - - 7,180,011 16,806,242
TOTAL REVENUES 750,170,485 103,537,586 30,705,579 53,647,187 938,060,837
EXPENDITURESCurrent:
Instruction 480,845,436 - 19,251,817 15,407,620 515,504,873 Support services:
Pupil services 46,282,870 - 2,697,226 3,888,098 52,868,194 Improvement of instructional services 39,989,360 - 5,973,166 3,166,233 49,128,759 Educational media 7,197,953 - - 265,449 7,463,402 Federal grant administration - - 1,749,522 195,018 1,944,540 General administration 9,027,405 - 399,339 2,331,887 11,758,631 School administration 38,194,044 - - 260,969 38,455,013 Business administration 7,606,568 - - 67,401 7,673,969 Maintenance and operation of facilities 81,048,089 6,513,712 - 280,542 87,842,343 Student transportation 29,926,314 - 258,816 1,373,935 31,559,065 Central support 18,819,746 89,836 - 1,878,367 20,787,949 Other support services 399,881 - 375,693 243,754 1,019,328 Nutrition 365,419 - - 25,452,874 25,818,293
Capital outlays - 35,782,804 - - 35,782,804 Debt service:
Principal 2,047,181 - - - 2,047,181 Interest and fiscal charges 676,561 4,029,142 - - 4,705,703
TOTAL EXPENDITURES 762,426,827 46,415,494 30,705,579 54,812,147 894,360,047
EXCESS (DEFICIENCY) OF REVENUES OVER (UNDER) EXPENDITURES (12,256,342) 57,122,092 - (1,164,960) 43,700,790
OTHER FINANCING SOURCES (USES)Transfers in - 233,327 - 2,472,319 2,705,646 Transfers out (2,705,646) - - - (2,705,646) Proceeds from sale of capital assets 434,519 - - - 434,519
TOTAL OTHER FINANCING SOURCES (USES) (2,271,127) 233,327 - 2,472,319 434,519
NET CHANGE IN FUND BALANCES (14,527,469) 57,355,419 - 1,307,359 44,135,309
FUND BALANCES - BEGINNING OF FISCAL YEAR 85,606,908 44,459,667 - 12,824,286 142,890,861
FUND BALANCES - END OF FISCAL YEAR 71,079,439$ 101,815,086$ -$ 14,131,645$ 187,026,170$
ATLANTA INDEPENDENT SCHOOL SYSTEMStatement of Revenues, Expenditures, and Changes in Fund Balances
Governmental Funds
For the Fiscal Year Ended June 30, 2018
See accompanying notes to the basic financial statements.
20
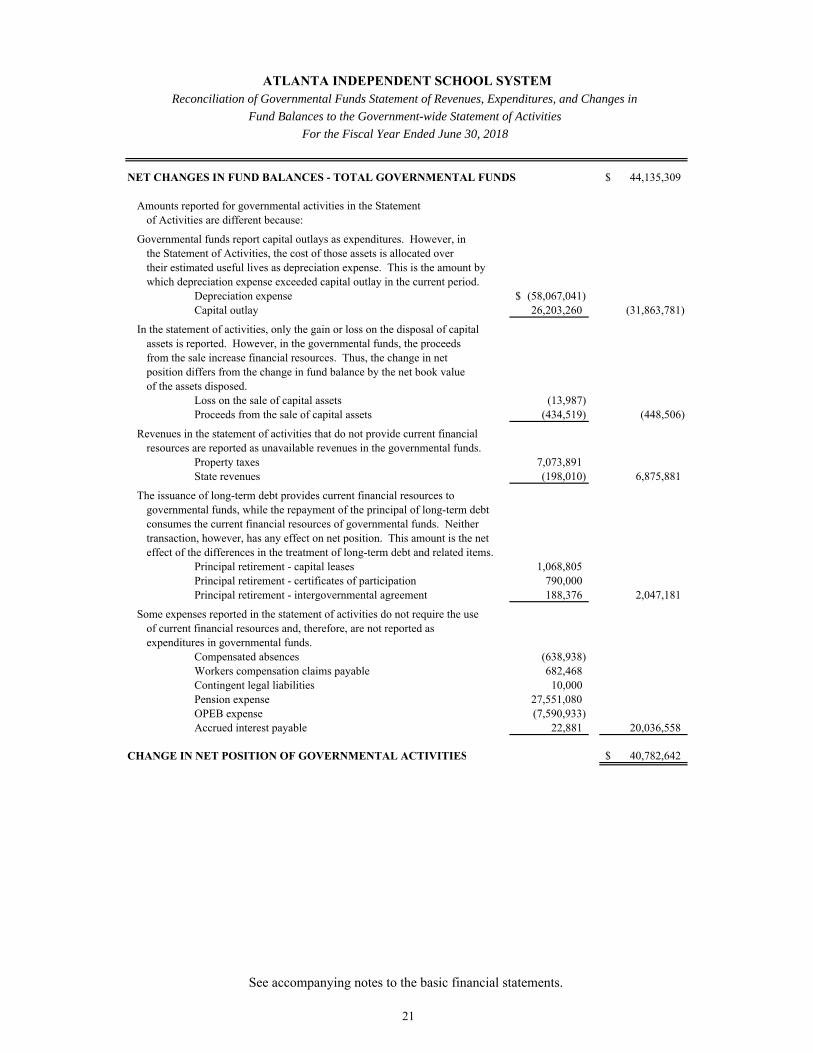
NET CHANGES IN FUND BALANCES - TOTAL GOVERNMENTAL FUNDS 44,135,309$
Amounts reported for governmental activities in the Statementof Activities are different because:
Governmental funds report capital outlays as expenditures. However, inthe Statement of Activities, the cost of those assets is allocated over their estimated useful lives as depreciation expense. This is the amount bywhich depreciation expense exceeded capital outlay in the current period.
Depreciation expense (58,067,041)$ Capital outlay 26,203,260 (31,863,781)
In the statement of activities, only the gain or loss on the disposal of capitalassets is reported. However, in the governmental funds, the proceedsfrom the sale increase financial resources. Thus, the change in netposition differs from the change in fund balance by the net book valueof the assets disposed.
Loss on the sale of capital assets (13,987) Proceeds from the sale of capital assets (434,519) (448,506)
Revenues in the statement of activities that do not provide current financialresources are reported as unavailable revenues in the governmental funds.
Property taxes 7,073,891 State revenues (198,010) 6,875,881
The issuance of long-term debt provides current financial resources togovernmental funds, while the repayment of the principal of long-term debtconsumes the current financial resources of governmental funds. Neithertransaction, however, has any effect on net position. This amount is the neteffect of the differences in the treatment of long-term debt and related items.
Principal retirement - capital leases 1,068,805 Principal retirement - certificates of participation 790,000 Principal retirement - intergovernmental agreement 188,376 2,047,181
Some expenses reported in the statement of activities do not require the useof current financial resources and, therefore, are not reported asexpenditures in governmental funds.
Compensated absences (638,938) Workers compensation claims payable 682,468 Contingent legal liabilities 10,000 Pension expense 27,551,080 OPEB expense (7,590,933) Accrued interest payable 22,881 20,036,558
CHANGE IN NET POSITION OF GOVERNMENTAL ACTIVITIES 40,782,642$
For the Fiscal Year Ended June 30, 2018
ATLANTA INDEPENDENT SCHOOL SYSTEMReconciliation of Governmental Funds Statement of Revenues, Expenditures, and Changes in
Fund Balances to the Government-wide Statement of Activities
See accompanying notes to the basic financial statements.
21
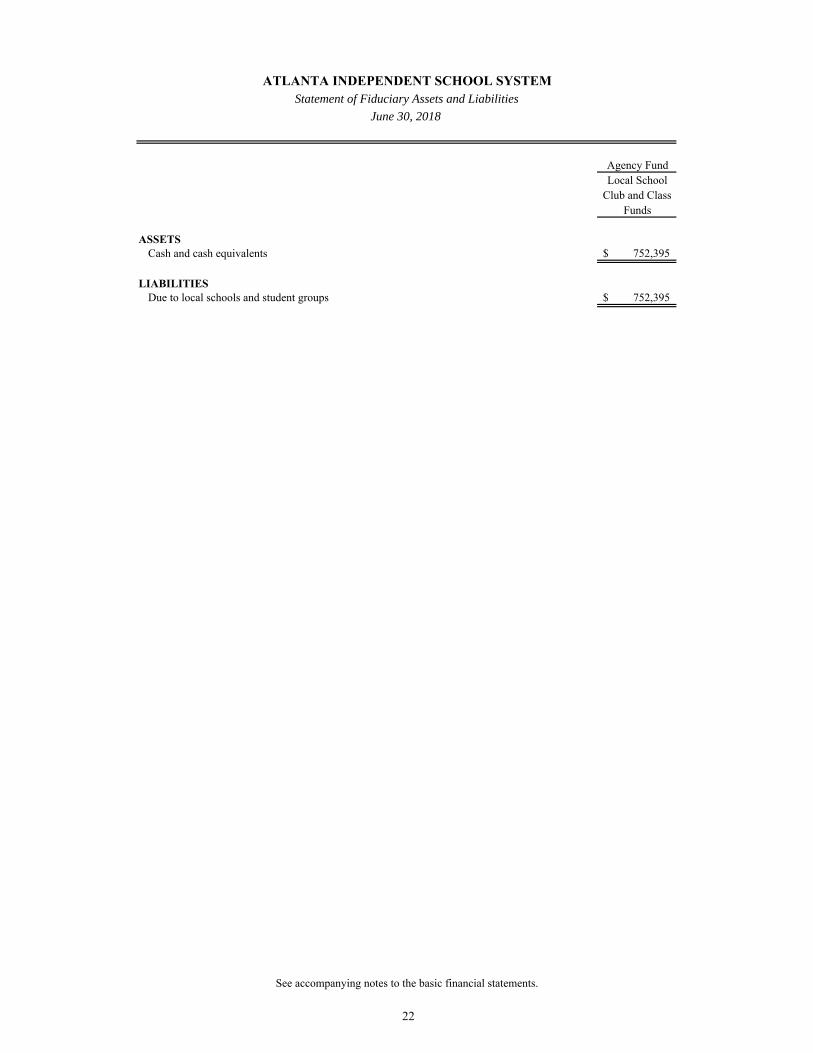
Agency FundLocal School
Club and ClassFunds
ASSETSCash and cash equivalents 752,395$
LIABILITIESDue to local schools and student groups 752,395$
ATLANTA INDEPENDENT SCHOOL SYSTEM Statement of Fiduciary Assets and Liabilities
June 30, 2018
See accompanying notes to the basic financial statements.
22

23
Atlanta Independent School System
Notes to the Basic Financial Statements
June 30, 2018
A. Summary of Significant Accounting Policies The financial statements of the School System have been prepared in conformity with accounting principles generally accepted in the United States of America (GAAP) as applicable to governmental units. The more significant of the School System's accounting policies are summarized here.
1. Reporting Entity The Atlanta Independent School System (School System or the District) was established bythe Georgia State Legislature and is composed of nine publicly elected members serving four-year terms. The School System has the authority to approve its own budget and to provide forthe levy of taxes to cover the cost of operations and maintenance and to cover debt servicepayments. Additionally, the School System has decision-making authority, the power toapprove selection of management personnel, the ability to significantly influence operations,and primary accountability for fiscal matters. Accordingly, the School System is a primarygovernment and consists of all the organizations that compose its legal entity.
2. Government-Wide and Fund Financial Statements
The government-wide financial statements (i.e., the Statement of Net Position and theStatement of Activities) report information on all of the non-fiduciary activities of the SchoolSystem and its component units (if any). As a general rule, the effect of interfund activity hasbeen eliminated from the government-wide financial statements. However, any interfundservices provided and used are not eliminated as this process would distort the direct costs andprogram revenues reported in the various functions. Governmental activities, which normallyare supported by taxes and intergovernmental revenues, are reported separately from Business-type activities, which rely to a significant extent on fees and charges for support.
The Statement of Activities demonstrates the degree to which the direct expenses of a givenfunction or segments are offset by program revenues. Direct expenses are those that are clearlyidentifiable with a specific function or segment. Program revenues include 1) fees and chargesto applicants who use, or directly benefit from goods, services or privileges provided by a givenfunction or segment, and 2) grants and contributions that are restricted to meeting theoperational or capital requirements of a particular function or segment. Taxes and other itemsnot included among program revenues are reported instead as general revenues.
Separate financial statements are provided for governmental funds, proprietary funds, andfiduciary funds, even though the latter are excluded from the government-wide financialstatements. Major individual governmental funds are reported as separate columns in thegovernmental fund financial statements.
24
3. Measurement Focus, Basis of Accounting, and Financial Statement Presentation
The government-wide financial statements are reported using the economic resourcesmeasurement focus and the accrual basis of accounting, as are the proprietary fund andfiduciary fund financial statements. The agency fund does not have a measurement focus.Revenues are recorded when earned and expenses are recorded when a liability is incurred,regardless of the timing of related cash flows. Property taxes are recognized as revenues inthe fiscal year for which they are levied. Grants, private donations, and similar items arerecognized as revenue in the fiscal year in which all eligibility requirements imposed by theprovider have been satisfied.
Governmental fund financial statements are reported using the current financial resourcesmeasurement focus and the modified accrual basis of accounting. Revenues are recognized assoon as they are both measurable and available. Revenues are considered to be available whenthey are collectible within the current period or soon enough thereafter to pay liabilities of thecurrent period. For this purpose, the School System considers revenues from taxes to beavailable if they are collected within 30 days of the end of the current fiscal period. Otherrevenues susceptible to accrual are considered available if they are collected within 180 daysof the end of the current fiscal period.
The State of Georgia reimburses the School System for teachers’ salaries and operating coststhrough the Quality Basic Education (QBE) Formula Earnings program. State of Georgia lawdefines the formula driven grant that determines the cost of an academic school year and theState of Georgia’s share in this cost. Generally, teachers are contracted for the fiscal year(July 1 – June 30) and paid over a twelve month contract period, generally August 31 throughAugust 15. In accordance with the requirements of the enabling legislation of the QBEprogram, the State of Georgia reimburses the School System over the same twelve monthperiod in which teachers are paid, funding the academic school year expenditures. At June 30,the amount of teachers’ salaries incurred but not paid until July and August of the subsequentyear are accrued as the State of Georgia has only postponed the final payment of their share ofthe cost until the subsequent appropriations for cash management purposes. By June 30 ofeach fiscal year, the State of Georgia has a signed appropriation that includes this final amount,which represents the State of Georgia’s intent to fund this final payment. Based on guidancein Governmental Accounting Standards Board (GASB) Statement No. 33, paragraph 74, theState of Georgia recognizes its QBE liability for the July and August salaries at June 30, andthe School System recognizes the same QBE as a receivable and revenue, consistent withsymmetrical recognition.
Property taxes, sales taxes, intergovernmental revenues, and interest associated with thecurrent fiscal period are all considered to be susceptible to accrual and so have been recognizedas revenues of the current fiscal period. All other revenue items are considered to bemeasurable and available only when cash is received by the School System.
25
Expenditures are generally recorded when a liability is incurred, as under accrual accounting. However, debt service expenditures, as well as expenditures related to compensated absences and claims and judgments, are recorded only when payment is due.
Fund Financial Statements
The School System uses funds to segregate transactions related to certain School System functions or activities in order to maintain its financial records during the fiscal year. Fund financial statements are provided for governmental and fiduciary funds.
Governmental Funds – Governmental funds are those through which most governmental functions are typically financed. Governmental funds employ the financial position measurement focus and are accounted for on the modified accrual basis of accounting at the fund level. Major individual governmental funds are reported in separate columns. All remaining governmental funds are aggregated and reported as nonmajor funds.
The School System reports the following major governmental funds:
General Fund - The General Fund is the School System’s primary operating fund. It accounts for all financial transactions of the School System, except those required to be accounted for in another fund.
Capital Projects Fund - This fund accounts for resources which are used exclusively for acquiring school sites, constructing and equipping new school facilities, and renovating existing facilities. The major revenue sources are from debt proceeds, bond sales, property taxes, the State of Georgia, and special purpose local option sales tax (SPLOST). SPLOST receipts are tax proceeds required to be used for capital outlay for educational purposes as authorized by local referendum.
Title I Fund - This is a special revenue fund used to account for the use of Title I grant revenues received from the federal government. The revenues must be used in accordance with the requirements of the federal government. The overall goal of the federal program is to help children from low-income families achieve academic success.
Fiduciary Funds – Fiduciary funds account for assets held by the School System in a trustee capacity or as an agent on behalf of others.
The School System reports the following fiduciary fund:
Agency Fund - This fund is used to account for local school student club and class accounts. It is custodial in nature, and does not involve measurement of the results of operations.
The fiduciary fund is excluded from the government-wide financial statements.
26
4. Assets, Liabilities, and Net Position or Equity
a. Cash Equivalents
The School System considers all highly liquid investments with a maturity of three monthsor less when purchased from authorized financial institutions to be cash equivalents.Georgia Law, OCGA 45-8-14, authorizes the School System to deposit its funds in one ormore solvent banks or insured Federal savings and loan associations.
b. Investments The Official Code of Georgia Annotated Section 36-83-4 authorizes the School System toinvest its funds. In selecting among options for investment or among institutional bids fordeposits, the highest rate of return shall be the objective, given equivalent conditions ofsafety and liquidity. Funds may be invested in the following:
1) Obligations issued by the State of Georgia or by other states;
2) Obligations issued by the United States Government;
3) Obligations fully insured or guaranteed by the United States Government or aUnited States government agency;
4) Obligations of any corporation of the United States Government;
5) Prime banker’s acceptances;
6) The Local Government Investment Pool (i.e., Georgia Fund 1) administered by theState of Georgia, Office of Treasury;
7) Repurchase agreements; and
8) Obligations of other political subdivisions of the State of Georgia.
The local government investment pool, “Georgia Fund 1,” created by OCGA 36-83-8, is a stable asset value investment pool, which follows Standard and Poor’s criteria for AAAf rated money market funds and is regulated by the Georgia Office of the State Treasurer. The pool is not registered with the SEC as an investment company. The pool’s primary objectives are safety of capital, investment income, liquidity and diversification while maintaining principal ($1 per share value). The asset value is calculated weekly to ensure stability. The pool distributes earnings (net of management fees) on a monthly basis and determines participants’ shares sold and redeemed based on $1 per share. The pool also adjusts the value of its investments to fair market value as of year-end and the School System’s investment in the Georgia Fund 1 is reported at fair value. The School System considers amounts held in Georgia Fund 1 as cash equivalents for financial statement presentation. Increases or decreases in the fair value during the year are recognized as a component of interest income.
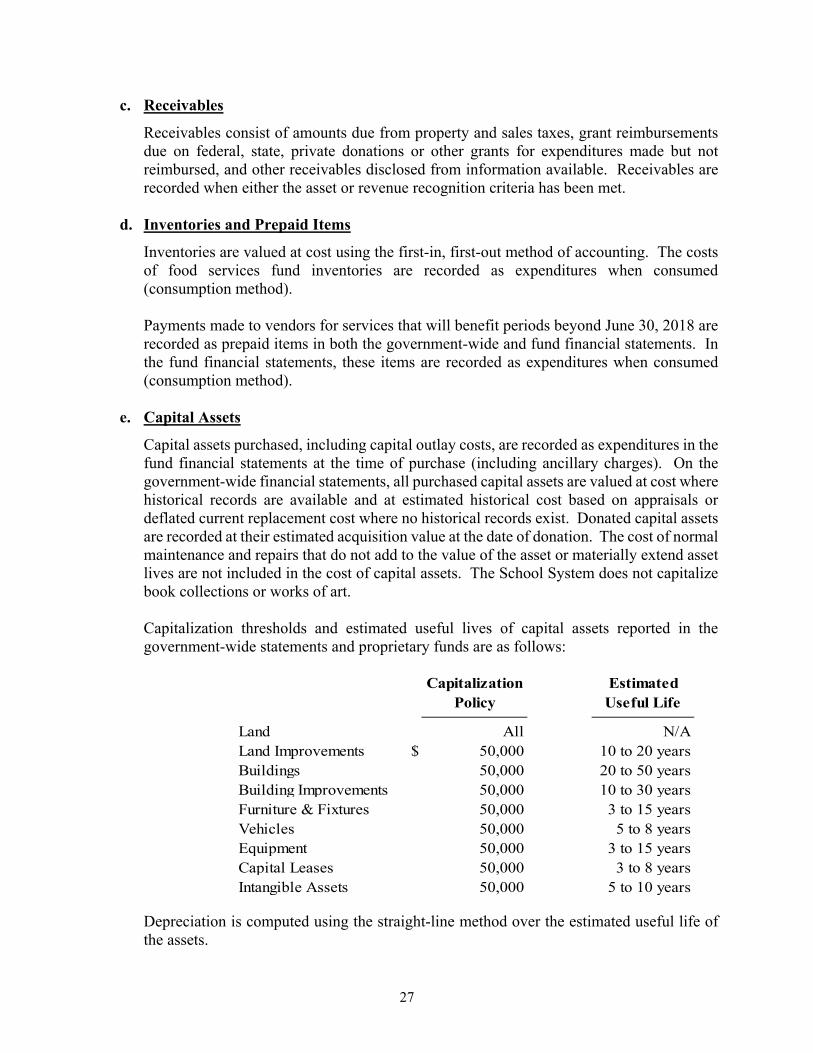
27
c. Receivables Receivables consist of amounts due from property and sales taxes, grant reimbursementsdue on federal, state, private donations or other grants for expenditures made but notreimbursed, and other receivables disclosed from information available. Receivables arerecorded when either the asset or revenue recognition criteria has been met.
d. Inventories and Prepaid Items Inventories are valued at cost using the first-in, first-out method of accounting. The costsof food services fund inventories are recorded as expenditures when consumed(consumption method).
Payments made to vendors for services that will benefit periods beyond June 30, 2018 arerecorded as prepaid items in both the government-wide and fund financial statements. Inthe fund financial statements, these items are recorded as expenditures when consumed(consumption method).
e. Capital Assets Capital assets purchased, including capital outlay costs, are recorded as expenditures in thefund financial statements at the time of purchase (including ancillary charges). On thegovernment-wide financial statements, all purchased capital assets are valued at cost wherehistorical records are available and at estimated historical cost based on appraisals ordeflated current replacement cost where no historical records exist. Donated capital assetsare recorded at their estimated acquisition value at the date of donation. The cost of normalmaintenance and repairs that do not add to the value of the asset or materially extend assetlives are not included in the cost of capital assets. The School System does not capitalizebook collections or works of art.
Capitalization thresholds and estimated useful lives of capital assets reported in thegovernment-wide statements and proprietary funds are as follows:
Capitalization Policy
Estimated Useful Life
Land All N/ALand Improvements $ 50,000 10 to 20 yearsBuildings 50,000 20 to 50 yearsBuilding Improvements 50,000 10 to 30 yearsFurniture & Fixtures 50,000 3 to 15 yearsVehicles 50,000 5 to 8 yearsEquipment 50,000 3 to 15 yearsCapital Leases 50,000 3 to 8 yearsIntangible Assets 50,000 5 to 10 years
Depreciation is computed using the straight-line method over the estimated useful life of the assets.
28
f. Compensated Absences
The Atlanta Independent School System’s Board authorizes annual leave for personnelemployed on a twelve-month basis as follows: less than ten years of service 3.750 hoursper pay period; ten to twenty years of service 4.875 hours per pay period; and twenty ormore years of service 5.625 hours per pay period. Employees on 220-day assignment priorto May 13, 1986 who continue in said assignment are authorized annual leave as follows:less than 10 years of service 1.0227 hours per pay period; ten to twenty years of service2.0454 hours per pay period; and twenty or more years of service 3.0681 hours per payperiod. An employee may accrue annual leave days up to a maximum of 225 hours (30working days). Vacation benefits are accrued as a liability as the benefits are earned if theemployees’ rights to receive salary related compensation are attributable to services alreadyrendered and it is probable that the School System will compensate the employees for thebenefits through paid time off or some other means. Amounts of vested or accumulatedvacation leave that are not expected to be liquidated with expendable available financialresources are reported as long-term obligations in the government-wide financialstatements and are not liabilities of the governmental funds.
g. Long-term Debt and Obligations In the governmental-wide financial statements and proprietary fund types in the fundfinancial statements, long-term debt and other long-term obligations are reported asliabilities in the applicable governmental activities or business-type activities statement ofnet position. Long-term debt and other long-term liabilities that will be paid fromgovernmental funds are not recognized as a liability in the fund financial statements untildue but are reported in the government-wide statements as long-term debt.
h. Implementation of New GASB Standards In fiscal year 2018, the School System implemented GASB Statement No. 75, Accountingand Financial Reporting for Postemployment Benefits Other Than Pensions. Inconjunction with the implementation of GASB Statement No. 75, the School System isrequired to change its accounting treatment of the Other Postemployment Benefit (OPEB)liabilities and the related OPEB expense. The new standard requires that the SchoolSystem’s proportionate share of the net OPEB liability be recorded on the statement of netposition for its governmental activities. Additional information about this new standard canbe found in Notes O and T.
i. Pensions For purposes of measuring the net pension liability, deferred outflows of resources anddeferred inflows of resources related to pensions, and pension expense, information aboutthe fiduciary net position of the Teachers Retirement System of Georgia (TRS) andadditions to/deductions from TRS’s fiduciary net position have been determined on thesame basis as they are reported by TRS. For this purpose, benefit payments (includingrefunds of employee contributions) are recognized when due and payable in accordancewith the benefit terms. Investments are reported at fair value.
29
For purposes of measuring the net pension liability, deferred outflows of resources and deferred inflows of resources related to pensions, and pension expense, information about the fiduciary net position of the City of Atlanta General Employees’ Pension Plan (the “Plan”) and additions to/deductions from the Plan's fiduciary net position have been determined on the same basis as they are reported by the Plan. For this purpose, benefit payments (including refunds of employee contributions) are recognized when due and payable in accordance with the benefit terms. Investments are reported at fair value.
j. Other Postemployment Benefits
For purposes of measuring the net OPEB liability, deferred outflows of resources anddeferred inflows of resources related to OPEB, and OPEB expense, information about thefiduciary net position of the Georgia School Postemployment Benefit Fund (School OPEBFund) and additions to/deductions from the School OPEB Fund’s fiduciary net positionhave been determined on the same basis as they are reported by the School OPEB Fund.For this purpose, benefit payments (including refunds of employee contributions) arerecognized when due and payable in accordance with the benefit terms. Investments arereported at fair value.
k. Fund Equity In the fund financial statements, governmental funds report limitations on the purpose forwhich all or a portion of the resources of the fund balance can be used. The limitations canvary depending upon their source. Financial statements for governmental funds report upto five components of fund balance:
Nonspendable – Fund balance amounts that cannot be spent either because they are in anonspendable form or because they are legally or contractually required to be maintainedintact.
Restricted – Fund balance amounts that can be spent only for specific purposes because ofstate or federal laws, or externally imposed conditions by grantors or creditors.
Committed – Fund balance amounts that can be used only for specific purposes determinedby formal action by the Board of Education. The Board of Education is the SchoolDistrict’s highest level of decision-making authority and the formal action that is requiredto be taken to establish, modify, or rescind a fund balance commitment is a resolutionapproved by the Board.
Assigned – Fund balance amounts are reported as assigned when amounts are constrainedby the School System’s intent to be used for specific purposes, but are neither restrictednor committed. The Board has expressly delegated the Superintendent or designee (ChiefFinancial Officer) the authority to assign fund balances for a particular purpose.
30
Unassigned – Residual fund balance that has not been restricted, committed or assigned to specific purposes or other funds. The School System reports positive unassigned fund balance only in the General Fund. Negative unassigned fund balances may be reported in all funds.
When multiple categories of fund balance are available for expenditure, the School System will use restricted amounts first, and then unrestricted amounts as they are needed. For unrestricted amounts of fund balance, the School System will use fund balance in the following order: committed, assigned, and then unassigned.
Net Position
Net position represents the difference between assets, deferred outflows of resources, deferred inflows of resources, and liabilities in reporting which utilizes the economic resources measurement focus. Net investment in capital assets consists of capital assets, net of accumulated depreciation, reduced by the outstanding balances of any borrowings used for the acquisition, construction, or improvement of those assets. Net position is reported as restricted when there are limitations imposed on their use either through external restrictions imposed by creditors, grantors or laws or regulations of other governments. All other net position is reported as unrestricted.
The School System applies restricted resources when an expense is incurred for purposes for which both restricted and unrestricted net positions are available.
l. Deferred Outflows of Resources and Deferred Inflows of Resources
In addition to liabilities, the governmental funds balance sheet will sometimes report aseparate section for deferred inflows of resources. This separate financial statementelement represents an acquisition of fund balance that applies to future period(s) and sowill not be recognized as an inflow of resources (revenue) until that time. The SchoolSystem has only one type of item, which arises only under a modified accrual basis ofaccounting that qualifies for reporting in this category. Accordingly, the item, unavailablerevenue, is reported only in the governmental funds balance sheet. The governmental fundsreport unavailable revenue from property taxes and intergovernmental grants as theseamounts are deferred and will be recognized as an inflow of resources in the period inwhich the amounts become available.
The School System also has deferred inflows of resources and deferred outflows ofresources related to the recording of changes in its net pension liability and net otherpostemployment benefits (OPEB) liability. Certain changes in the net pension liability andnet OPEB liability are recognized as pension and OPEB expenses over time instead of allbeing recognized in the year of occurrence. Experience gains or losses result from periodicstudies by the School System’s actuary which adjust the net pension liability and net OPEBliability for actual experience for certain trend information that was previously assumed,for example the assumed dates of retirement of Plan members. These experience gains orlosses are recorded as deferred outflows of resources or deferred inflows of resources and
31
are amortized into pension and OPEB expenses over the expected remaining service lives of Plan members. Changes in actuarial assumptions, changes in proportion, and the difference between School System contributions and the proportionate share of contributions, which adjust the net pension liability and net OPEB liability, are also recorded as deferred outflows of resources or deferred inflows of resources and are amortized into pension and OPEB expense over the expected remaining service lives of Plan members. The difference between projected investment return on pension investments and actual return on those investments is also deferred and amortized against pension and OPEB expense over a five-year period. Additionally, any contributions made by the School System to the pension and OPEB plans before fiscal year end but subsequent to the measurement date of the School System’s net pension liability and net OPEB liability are reported as deferred outflows of resources.
Use of Estimates
The preparation of financial statements in accordance with GAAP requires management to make estimates and assumptions that affect the amounts of assets, deferred outflows of resources, liabilities, deferred inflows of resources, revenue, and expenses including the disclosure of contingent assets and liabilities. Actual amounts could differ from those estimates.
Workers’ Compensation:
The School System recognizes in the government-wide statements the liabilities for estimated losses to be incurred from pending worker compensation claims and for worker compensation claims incurred but not reported (IBNR). IBNR claims are estimates of claims that are incurred through the end of the fiscal year but have not yet been reported. These liabilities are based on actuarial valuations.
B. Budgets and Budgetary Accounting
Atlanta Independent School System employs zero-based budgeting for budget preparation. The zero-based budgeting process provides for the identification and prioritization of School System activities and resources starting from zero, and accumulating to the targeted funding level. Each activity is linked to the goal, objectives, and mission of the System and ranked as to its importance. As the proposed budget moves through each level of the organization, program activities and goals are aggregated further and ranked again. The final budget produced, and presented is one, which includes all program activities ranked in order of importance in reaching the System’s mission. The District’s basis of budget presentation is in accordance with GAAP.
The School System follows these procedures in establishing the budgetary data reflected in the financial statements:
1. Budget requests are normally completed in January.

32
2. Proposed budgets are consolidated and reviewed by the Budget Department, then submittedto the Senior Cabinet of the District and Budget Commission for additional review prior tothe approval by the Atlanta Independent School System’s Board.
3. Public hearings on the proposed budget are normally held in March and April.
4. The annual budget is legally adopted by the Board in April for the General Fund and SpecialRevenue Funds (in aggregate).
5. The administrative level of budgetary control upon adoption is at the program level. Transferof budgeted amounts between object categories within programs requires the approval of thebudget center manager.
6. Revenues and expenditures of the Capital Projects Fund are budgeted on an annual basis.
7. The Atlanta Independent School System’s Board legally adopts the budget for the SpecialRevenue Funds as a whole, which is the legal level of budgetary control (the level at whichexpenditures may not legally exceed appropriations). The combined Special Revenue Fundsbudget to actual schedule does not include the Proprietary Fund, which is included whenprovided to the board for approval.
C. Excess Expenditures over Appropriations of Individual Funds and Deficit Fund Equity
GENERAL FUNDPupil Services $ 1,950,534 General Administration 1,330,773 Maintenance and Operation of Facilities 85,708 Other Support Services 3,377 Debt Service - Principal 1,547,181 Debt Service - Interest 376,561 Transfers Out 71,665
CAPITAL PROJECTS FUNDCentral Support Services $ 89,836
These expenditures in excess of appropriations were funded by greater than anticipated revenues and available fund balance, as applicable. For financial statement purposes, the General Fund includes revenues of $3,547,807 and expenditures of $3,115,464 resulting from local school activity accounts. The District does not budget for these Pupil Service specific expenditures.
The Lottery Grants Fund had a fund deficit of $2,739 as of June 30, 2018 which will be reduced through General Fund appropriations, as necessary.
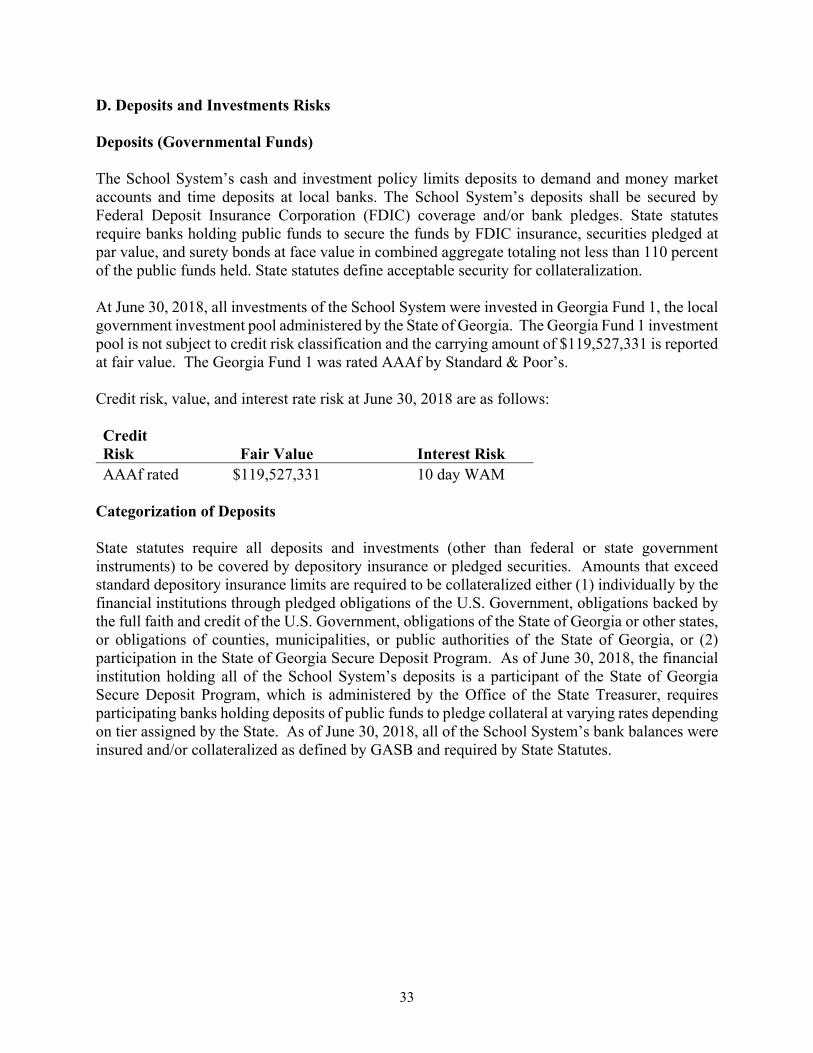
33
D. Deposits and Investments Risks
Deposits (Governmental Funds)
The School System’s cash and investment policy limits deposits to demand and money market accounts and time deposits at local banks. The School System’s deposits shall be secured by Federal Deposit Insurance Corporation (FDIC) coverage and/or bank pledges. State statutes require banks holding public funds to secure the funds by FDIC insurance, securities pledged at par value, and surety bonds at face value in combined aggregate totaling not less than 110 percent of the public funds held. State statutes define acceptable security for collateralization.
At June 30, 2018, all investments of the School System were invested in Georgia Fund 1, the local government investment pool administered by the State of Georgia. The Georgia Fund 1 investment pool is not subject to credit risk classification and the carrying amount of $119,527,331 is reported at fair value. The Georgia Fund 1 was rated AAAf by Standard & Poor’s.
Credit risk, value, and interest rate risk at June 30, 2018 are as follows:
Credit Risk Fair Value Interest Risk AAAf rated $119,527,331 10 day WAM
Categorization of Deposits
State statutes require all deposits and investments (other than federal or state government instruments) to be covered by depository insurance or pledged securities. Amounts that exceed standard depository insurance limits are required to be collateralized either (1) individually by the financial institutions through pledged obligations of the U.S. Government, obligations backed by the full faith and credit of the U.S. Government, obligations of the State of Georgia or other states, or obligations of counties, municipalities, or public authorities of the State of Georgia, or (2) participation in the State of Georgia Secure Deposit Program. As of June 30, 2018, the financial institution holding all of the School System’s deposits is a participant of the State of Georgia Secure Deposit Program, which is administered by the Office of the State Treasurer, requires participating banks holding deposits of public funds to pledge collateral at varying rates depending on tier assigned by the State. As of June 30, 2018, all of the School System’s bank balances were insured and/or collateralized as defined by GASB and required by State Statutes.
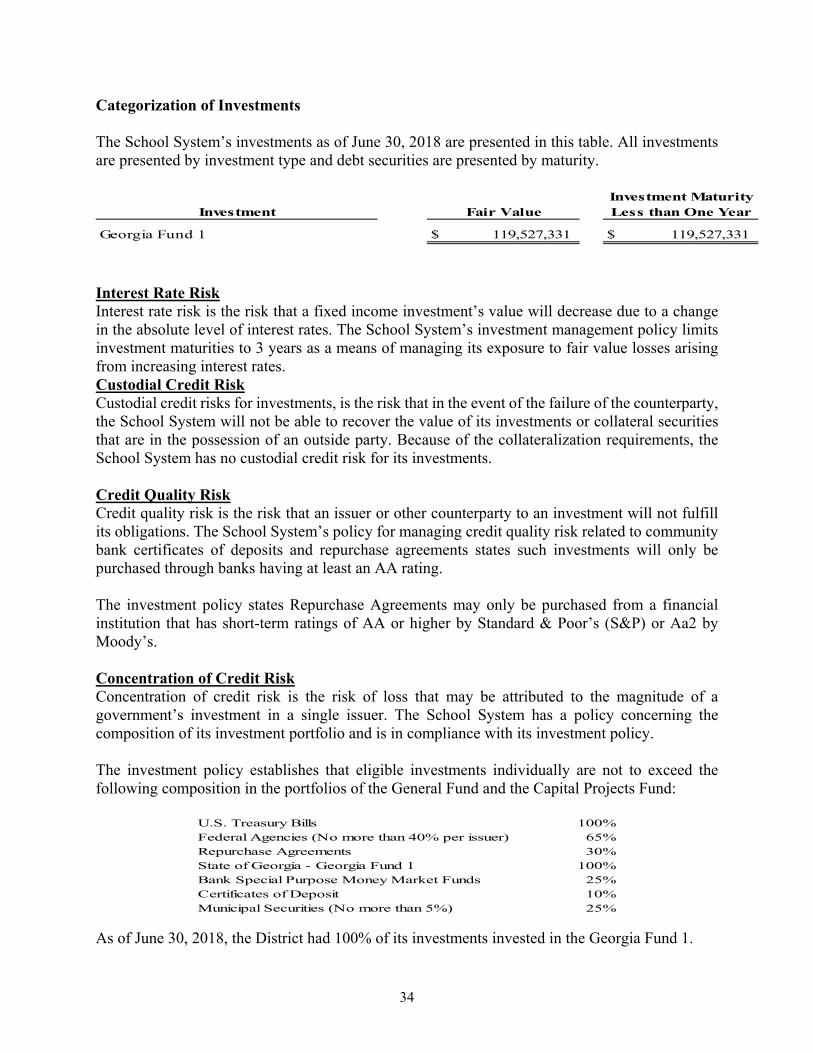
34
Categorization of Investments
The School System’s investments as of June 30, 2018 are presented in this table. All investments are presented by investment type and debt securities are presented by maturity.
Investment
Georgia Fund 1 $ 119,527,331 $ 119,527,331
Investment MaturityLess than One YearFair Value
Interest Rate Risk Interest rate risk is the risk that a fixed income investment’s value will decrease due to a change in the absolute level of interest rates. The School System’s investment management policy limits investment maturities to 3 years as a means of managing its exposure to fair value losses arising from increasing interest rates. Custodial Credit Risk Custodial credit risks for investments, is the risk that in the event of the failure of the counterparty, the School System will not be able to recover the value of its investments or collateral securities that are in the possession of an outside party. Because of the collateralization requirements, the School System has no custodial credit risk for its investments.
Credit Quality Risk Credit quality risk is the risk that an issuer or other counterparty to an investment will not fulfill its obligations. The School System’s policy for managing credit quality risk related to community bank certificates of deposits and repurchase agreements states such investments will only be purchased through banks having at least an AA rating.
The investment policy states Repurchase Agreements may only be purchased from a financial institution that has short-term ratings of AA or higher by Standard & Poor’s (S&P) or Aa2 by Moody’s.
Concentration of Credit Risk Concentration of credit risk is the risk of loss that may be attributed to the magnitude of a government’s investment in a single issuer. The School System has a policy concerning the composition of its investment portfolio and is in compliance with its investment policy.
The investment policy establishes that eligible investments individually are not to exceed the following composition in the portfolios of the General Fund and the Capital Projects Fund:
U.S. Treasury Bills 100%Federal Agencies (No more than 40% per issuer) 65%Repurchase Agreements 30%State of Georgia - Georgia Fund 1 100%Bank Special Purpose Money Market Funds 25%Certificates of Deposit 10%Municipal Securities (No more than 5%) 25%
As of June 30, 2018, the District had 100% of its investments invested in the Georgia Fund 1.
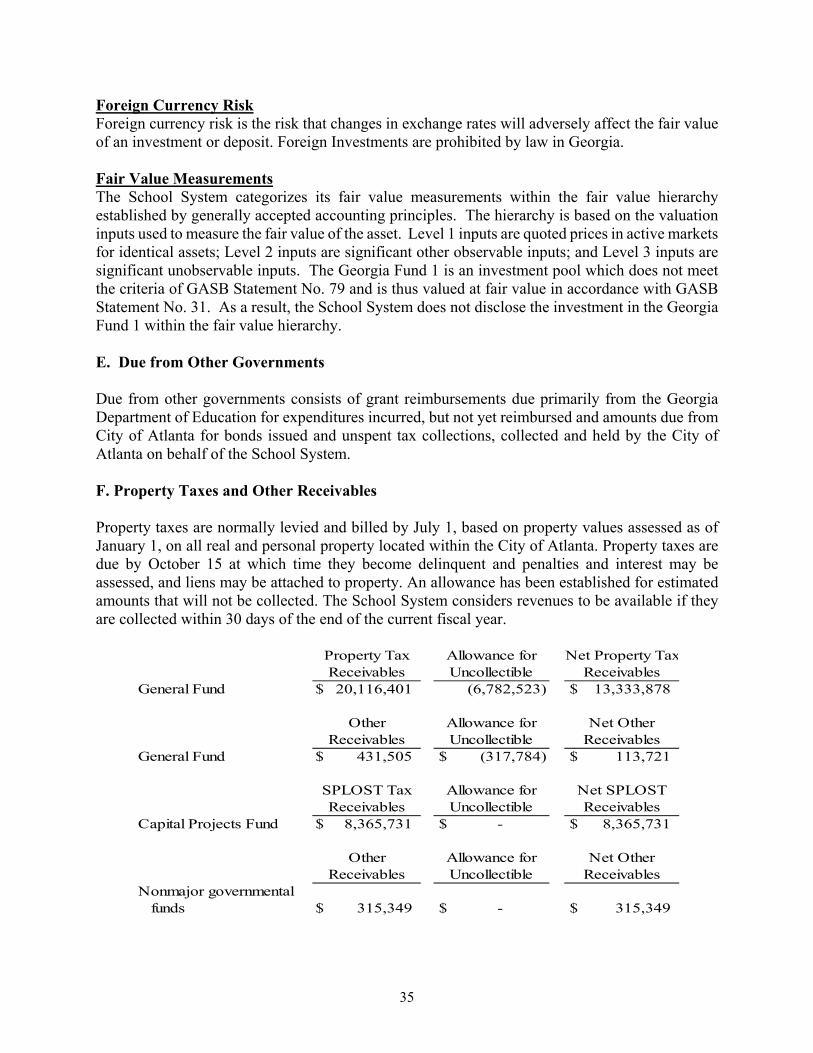
35
Foreign Currency Risk Foreign currency risk is the risk that changes in exchange rates will adversely affect the fair value of an investment or deposit. Foreign Investments are prohibited by law in Georgia.
Fair Value Measurements The School System categorizes its fair value measurements within the fair value hierarchy established by generally accepted accounting principles. The hierarchy is based on the valuation inputs used to measure the fair value of the asset. Level 1 inputs are quoted prices in active markets for identical assets; Level 2 inputs are significant other observable inputs; and Level 3 inputs are significant unobservable inputs. The Georgia Fund 1 is an investment pool which does not meet the criteria of GASB Statement No. 79 and is thus valued at fair value in accordance with GASB Statement No. 31. As a result, the School System does not disclose the investment in the Georgia Fund 1 within the fair value hierarchy.
E. Due from Other Governments
Due from other governments consists of grant reimbursements due primarily from the Georgia Department of Education for expenditures incurred, but not yet reimbursed and amounts due from City of Atlanta for bonds issued and unspent tax collections, collected and held by the City of Atlanta on behalf of the School System.
F. Property Taxes and Other Receivables
Property taxes are normally levied and billed by July 1, based on property values assessed as of January 1, on all real and personal property located within the City of Atlanta. Property taxes are due by October 15 at which time they become delinquent and penalties and interest may be assessed, and liens may be attached to property. An allowance has been established for estimated amounts that will not be collected. The School System considers revenues to be available if they are collected within 30 days of the end of the current fiscal year.
General Fund $ 20,116,401 (6,782,523) $ 13,333,878
General Fund $ 431,505 $ (317,784) $ 113,721
Capital Projects Fund $ 8,365,731 $ - $ 8,365,731
Nonmajor governmentalfunds $ 315,349 $ - $ 315,349
Net OtherReceivables
Net SPLOSTReceivables
Property TaxReceivables
Allowance forUncollectible
Net Property TaxReceivables
OtherReceivables
SPLOST TaxReceivables
UncollectibleAllowance for
Receivables Uncollectible Receivables
Allowance forUncollectible
Other Allowance for Net Other

36
G. Capital Assets
The following is a summary of changes in capital assets during the fiscal year ended June 30, 2018:
EndingBalance
Governmental Activities:Land $ 117,802,163 $ 41,901 $ (53,006) $ 117,791,058Construction in Progress 133,281,282 24,176,396 (127,266,638) 30,191,040
Total Non-Depreciable Assets 251,083,445 24,218,297 (127,319,644) 147,982,098
Buildings 1,216,190,263 1,819,100 (395,500) 1,217,613,863Building Improvements 420,066,286 101,797,873 - 521,864,159Land Improvements 63,987,466 25,468,765 - 89,456,231Equipment 15,079,199 - (149,000) 14,930,199Furniture & Fixtures 56,030 - - 56,030Vehicles 30,605,692 165,863 - 30,771,555
Total Depreciable Assets 1,745,984,936 129,251,601 (544,500) 1,874,692,037 Total at Historical Cost 1,997,068,381 153,469,898 (127,864,144) 2,022,674,135
Less Accumulated DepreciationBuildings 388,102,962 23,732,100 - 411,835,062Building Improvements 138,393,887 27,221,455 - 165,615,342Land Improvements 21,743,314 5,663,342 - 27,406,656Equipment 14,234,759 489,306 (149,000) 14,575,065Furniture & Fixtures 45,291 5,603 - 50,894Vehicles 27,542,081 955,235 - 28,497,316
Total Accumulated Depreciation 590,062,294 58,067,041 (149,000) 647,980,335
Govermental Activities Capital Assets, Net $ 1,407,006,087 $ 95,402,857 $ (127,715,144) $ 1,374,693,800
Decreases &BeginningBalance Increases to In Service
Transfers
Depreciation expense was charged to governmental functions as follows:
$ 53,246,333
2,428,1681,456,992
935,548
$ 58,067,041
Nutrition
Total
InstructionSupport Services:
Student TransportationMaintenance & Operations
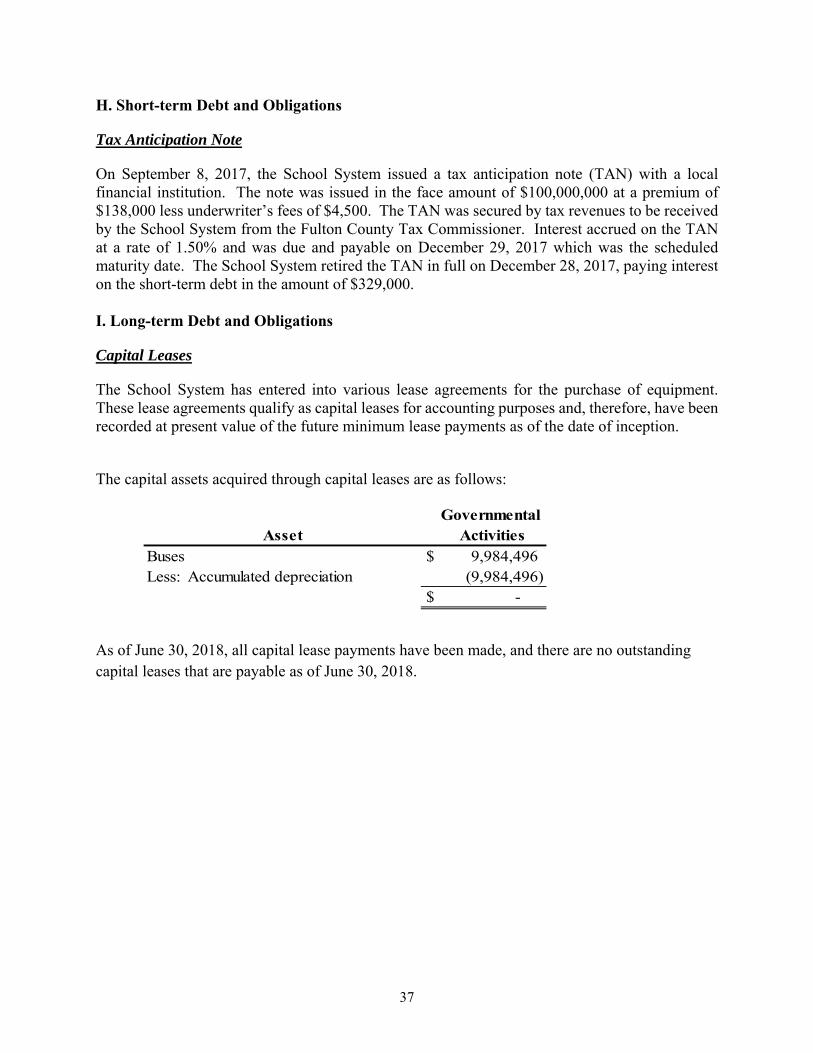
37
H. Short-term Debt and Obligations
Tax Anticipation Note
On September 8, 2017, the School System issued a tax anticipation note (TAN) with a local financial institution. The note was issued in the face amount of $100,000,000 at a premium of $138,000 less underwriter’s fees of $4,500. The TAN was secured by tax revenues to be received by the School System from the Fulton County Tax Commissioner. Interest accrued on the TAN at a rate of 1.50% and was due and payable on December 29, 2017 which was the scheduled maturity date. The School System retired the TAN in full on December 28, 2017, paying interest on the short-term debt in the amount of $329,000.
I. Long-term Debt and Obligations
Capital Leases
The School System has entered into various lease agreements for the purchase of equipment. These lease agreements qualify as capital leases for accounting purposes and, therefore, have been recorded at present value of the future minimum lease payments as of the date of inception.
The capital assets acquired through capital leases are as follows:
Governmental Asset Activities
Buses $ 9,984,496Less: Accumulated depreciation (9,984,496)
$ -
As of June 30, 2018, all capital lease payments have been made, and there are no outstanding capital leases that are payable as of June 30, 2018.
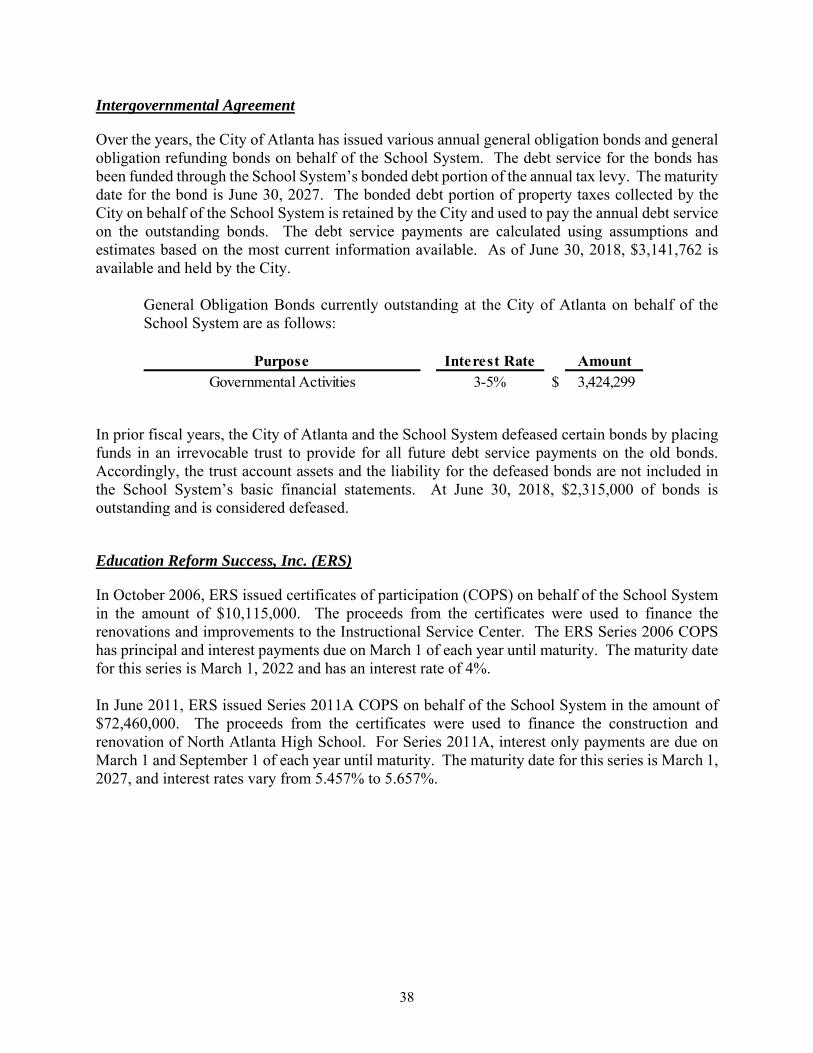
38
Intergovernmental Agreement
Over the years, the City of Atlanta has issued various annual general obligation bonds and general obligation refunding bonds on behalf of the School System. The debt service for the bonds has been funded through the School System’s bonded debt portion of the annual tax levy. The maturity date for the bond is June 30, 2027. The bonded debt portion of property taxes collected by the City on behalf of the School System is retained by the City and used to pay the annual debt service on the outstanding bonds. The debt service payments are calculated using assumptions and estimates based on the most current information available. As of June 30, 2018, $3,141,762 is available and held by the City.
General Obligation Bonds currently outstanding at the City of Atlanta on behalf of the School System are as follows:
Purpose Interest Rate AmountGovernmental Activities 3-5% $ 3,424,299
In prior fiscal years, the City of Atlanta and the School System defeased certain bonds by placing funds in an irrevocable trust to provide for all future debt service payments on the old bonds. Accordingly, the trust account assets and the liability for the defeased bonds are not included in the School System’s basic financial statements. At June 30, 2018, $2,315,000 of bonds is outstanding and is considered defeased.
Education Reform Success, Inc. (ERS)
In October 2006, ERS issued certificates of participation (COPS) on behalf of the School System in the amount of $10,115,000. The proceeds from the certificates were used to finance the renovations and improvements to the Instructional Service Center. The ERS Series 2006 COPS has principal and interest payments due on March 1 of each year until maturity. The maturity date for this series is March 1, 2022 and has an interest rate of 4%.
In June 2011, ERS issued Series 2011A COPS on behalf of the School System in the amount of $72,460,000. The proceeds from the certificates were used to finance the construction and renovation of North Atlanta High School. For Series 2011A, interest only payments are due on March 1 and September 1 of each year until maturity. The maturity date for this series is March 1, 2027, and interest rates vary from 5.457% to 5.657%.

39
Changes in long-term debt and obligations during the fiscal year ended June 30, 2018 were as follows:
Governmental activities:Long-term debt
Capital leases $ 1,068,805 $ - $ (1,068,805) $ - $ - Intergovernmental agreement-
City of Atlanta 3,612,675 - (188,376) 3,424,299 227,300ERS, Inc (COPS, Series 2006/2007) 4,280,000 - (790,000) 3,490,000 820,000ERS, Inc (COPS, Series 2011A) 72,460,000 - - 72,460,000 -
Total long-term debt 81,421,480 - (2,047,181) 79,374,299 1,047,300
Other long-term liabilitiesNet pension liabilities 1,097,870,624 121,677,115 (232,173,804) 987,373,935 - Net OPEB liability 449,210,568 22,530,545 (56,612,151) 415,128,962 - Compensated absences 3,981,277 3,736,579 (3,097,641) 4,620,215 3,955,816Contingent legal liabilities 20,000 10,000 (20,000) 10,000 10,000 Workers' compensation 5,915,911 3,180,835 (3,863,303) 5,233,443 2,512,288
Total other long-term liabilities 1,556,998,380 151,135,074 (295,766,899) 1,412,366,555 6,478,104
Total long-term obligations $ 1,638,419,860 $ 151,135,074 $ (297,814,080) $ 1,491,740,854 $ 7,525,404
Amounts Due within One Year
Beginning Balance
Ending Balance Additions Deductions
Restated
The beginning balances for governmental activities long-term debt and obligations has been restated as a result of the School System implementing GASB 75, Accounting and Reporting for Postemployment Benefits Other Than Pensions. For further discussions, see footnotes O and T. The General Fund has been typically used to liquidate the liability for the net pension liabilities, net OPEB liability, compensated absences, contingent liabilities, and workers’ compensation.
The remainder of this page has been left blank intentionally
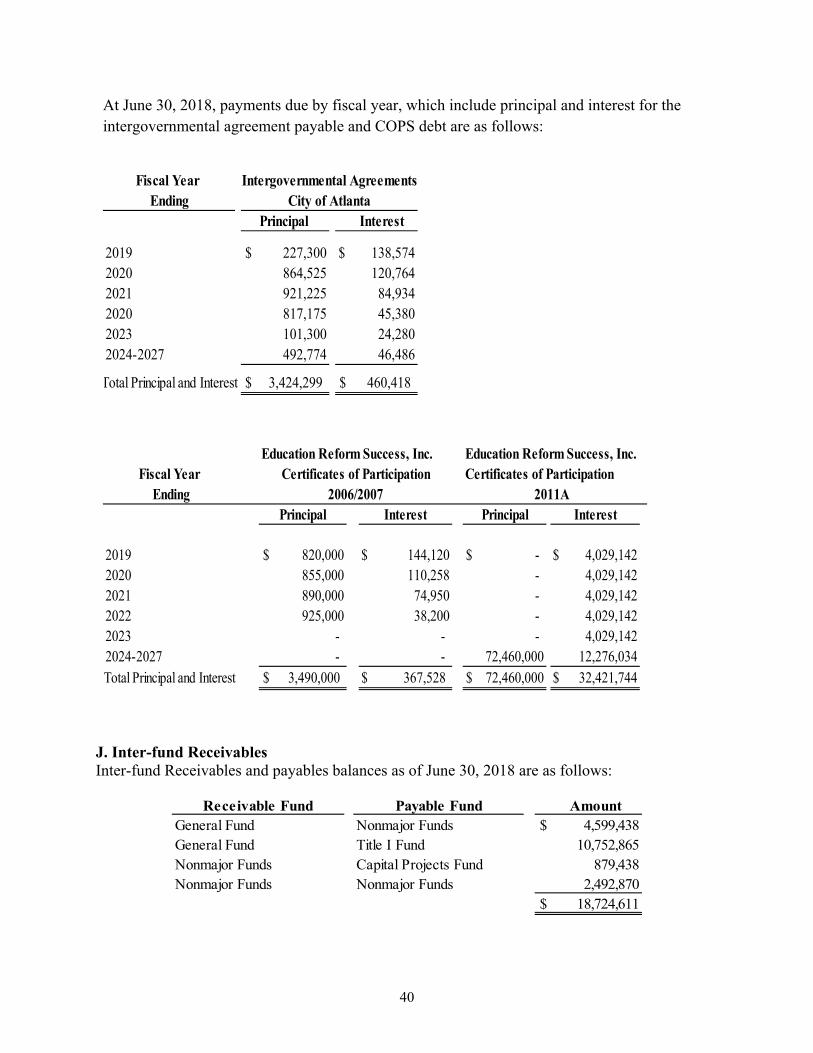
40
At June 30, 2018, payments due by fiscal year, which include principal and interest for the intergovernmental agreement payable and COPS debt are as follows:
Fiscal Year Ending
2019 $ 227,300 $ 138,5742020 864,525 120,7642021 921,225 84,9342020 817,175 45,3802023 101,300 24,2802024-2027 492,774 46,486
Total Principal and Interest $ 3,424,299 $ 460,418
Intergovernmental Agreements
Principal InterestCity of Atlanta
Fiscal Year Ending
2019 $ 820,000 $ 144,120 $ - $ 4,029,1422020 855,000 110,258 - 4,029,1422021 890,000 74,950 - 4,029,1422022 925,000 38,200 - 4,029,1422023 - - - 4,029,1422024-2027 - - 72,460,000 12,276,034Total Principal and Interest $ 3,490,000 $ 367,528 $ 72,460,000 $ 32,421,744
Education Reform Success, Inc.
2011A
Education Reform Success, Inc.Certificates of Participation
Principal Interest Principal Interest
Certificates of Participation2006/2007
J. Inter-fund ReceivablesInter-fund Receivables and payables balances as of June 30, 2018 are as follows:
Receivable Fund Payable Fund AmountGeneral Fund Nonmajor Funds $ 4,599,438General Fund Title I Fund 10,752,865Nonmajor Funds Capital Projects Fund 879,438Nonmajor Funds Nonmajor Funds 2,492,870
$ 18,724,611
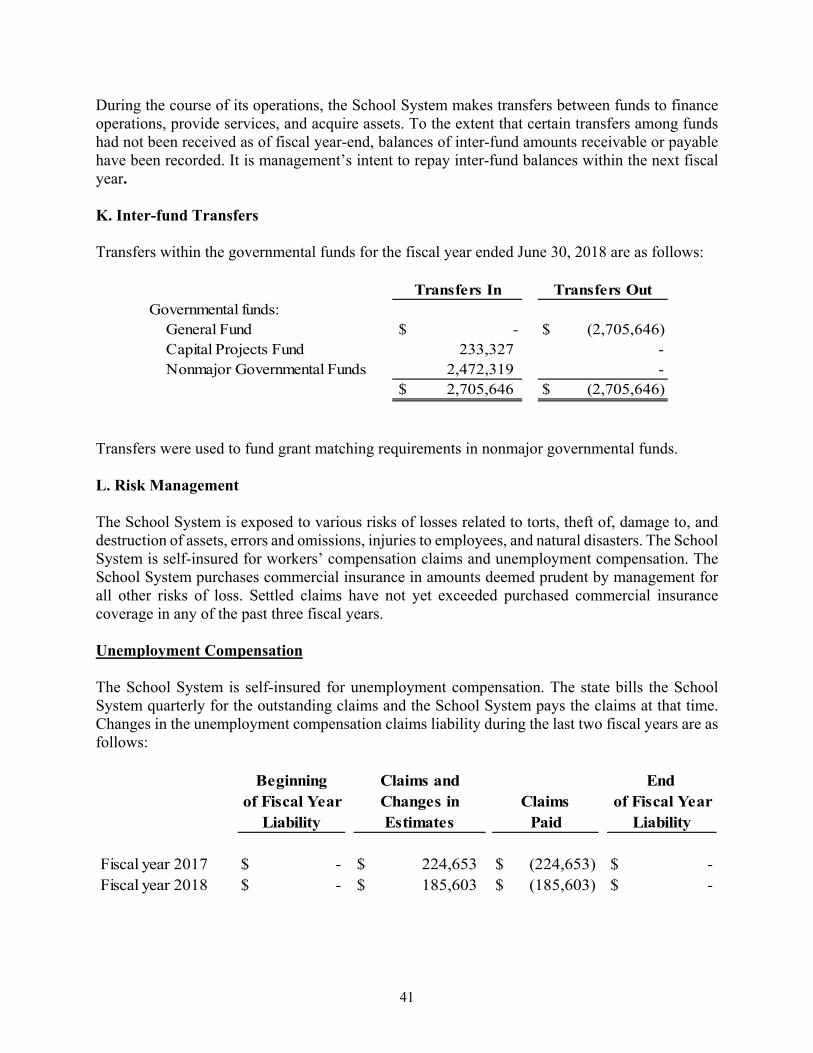
41
During the course of its operations, the School System makes transfers between funds to finance operations, provide services, and acquire assets. To the extent that certain transfers among funds had not been received as of fiscal year-end, balances of inter-fund amounts receivable or payable have been recorded. It is management’s intent to repay inter-fund balances within the next fiscal year.
K. Inter-fund Transfers
Transfers within the governmental funds for the fiscal year ended June 30, 2018 are as follows:
Governmental funds: General Fund $ - $ (2,705,646) Capital Projects Fund 233,327 -
Nonmajor Governmental Funds 2,472,319 -$ 2,705,646 $ (2,705,646)
Transfers In Transfers Out
Transfers were used to fund grant matching requirements in nonmajor governmental funds.
L. Risk Management
The School System is exposed to various risks of losses related to torts, theft of, damage to, and destruction of assets, errors and omissions, injuries to employees, and natural disasters. The School System is self-insured for workers’ compensation claims and unemployment compensation. The School System purchases commercial insurance in amounts deemed prudent by management for all other risks of loss. Settled claims have not yet exceeded purchased commercial insurance coverage in any of the past three fiscal years.
Unemployment Compensation
The School System is self-insured for unemployment compensation. The state bills the School System quarterly for the outstanding claims and the School System pays the claims at that time. Changes in the unemployment compensation claims liability during the last two fiscal years are as follows:
Fiscal year 2017 $ - $ 224,653 $ (224,653) $ -Fiscal year 2018 $ - $ 185,603 $ (185,603) $ -
Beginningof Fiscal Year
Liability
Claims andChanges inEstimates
ClaimsPaid
End of Fiscal Year
Liability
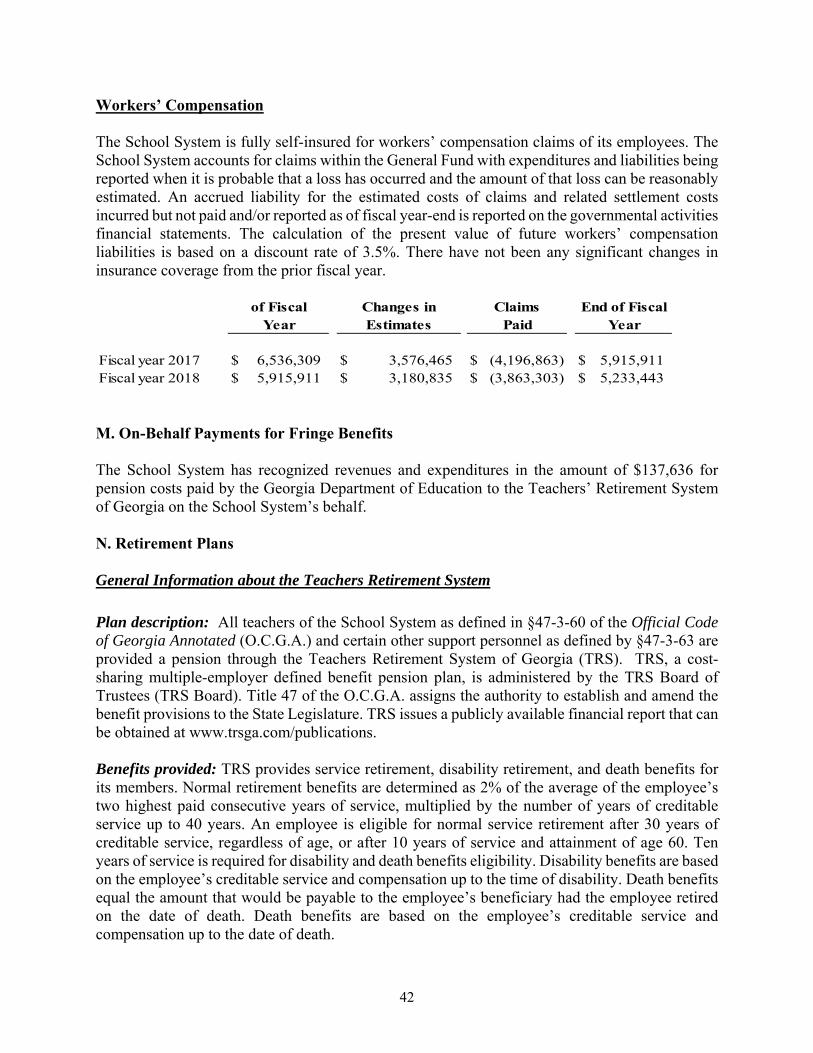
42
Workers’ Compensation
The School System is fully self-insured for workers’ compensation claims of its employees. The School System accounts for claims within the General Fund with expenditures and liabilities being reported when it is probable that a loss has occurred and the amount of that loss can be reasonably estimated. An accrued liability for the estimated costs of claims and related settlement costs incurred but not paid and/or reported as of fiscal year-end is reported on the governmental activities financial statements. The calculation of the present value of future workers’ compensation liabilities is based on a discount rate of 3.5%. There have not been any significant changes in insurance coverage from the prior fiscal year.
Fiscal year 2017 $ 6,536,309 $ 3,576,465 $ (4,196,863) $ 5,915,911Fiscal year 2018 $ 5,915,911 $ 3,180,835 $ (3,863,303) $ 5,233,443
ClaimsPaid
End of FiscalYear
of FiscalYear
Changes inEstimates
M. On-Behalf Payments for Fringe Benefits
The School System has recognized revenues and expenditures in the amount of $137,636 for pension costs paid by the Georgia Department of Education to the Teachers’ Retirement System of Georgia on the School System’s behalf.
N. Retirement Plans
General Information about the Teachers Retirement System
Plan description: All teachers of the School System as defined in §47-3-60 of the Official Code of Georgia Annotated (O.C.G.A.) and certain other support personnel as defined by §47-3-63 are provided a pension through the Teachers Retirement System of Georgia (TRS). TRS, a cost-sharing multiple-employer defined benefit pension plan, is administered by the TRS Board of Trustees (TRS Board). Title 47 of the O.C.G.A. assigns the authority to establish and amend the benefit provisions to the State Legislature. TRS issues a publicly available financial report that can be obtained at www.trsga.com/publications.
Benefits provided: TRS provides service retirement, disability retirement, and death benefits for its members. Normal retirement benefits are determined as 2% of the average of the employee’s two highest paid consecutive years of service, multiplied by the number of years of creditable service up to 40 years. An employee is eligible for normal service retirement after 30 years of creditable service, regardless of age, or after 10 years of service and attainment of age 60. Ten years of service is required for disability and death benefits eligibility. Disability benefits are based on the employee’s creditable service and compensation up to the time of disability. Death benefits equal the amount that would be payable to the employee’s beneficiary had the employee retired on the date of death. Death benefits are based on the employee’s creditable service and compensation up to the date of death.
43
Contributions: Per Title 47 of the O.C.G.A., contribution requirements of active employees and participating employers, as actuarially determined, are established and may be amended by the TRS Board. Pursuant to O.C.G.A. §47-3-63, the employer contributions for certain full-time public school support personnel are funded on behalf of the employer by the State of Georgia. Contributions are expected to finance the costs of benefits earned by employees during the year, with an additional amount to finance any unfunded accrued liability. Employees were required to contribute 6.00 % of their annual pay during fiscal year 2018. The School System’s contractually required contribution rate for the fiscal year ended June 30, 2018 was 16.81 % of annual payroll. School System contributions to TRS were $54,605,691 for the fiscal year ended June 30, 2018.
Pension Liabilities, Pension Expense, and Deferred Outflows of Resources, and Deferred Inflows of Resources Related to Pensions
At June 30, 2018, the School System reported a liability for its proportionate share of the net pension liability that reflected a reduction for support provided to the School System by the State of Georgia for certain public school support personnel. The amount recognized by the School System as its proportionate share of the net pension liability, the related State of Georgia support, and the total portion of the net pension liability that was associated with the School System were as follows:
School System’s proportionate share of the net pension liability $ 536,634,228 State of Georgia’s proportionate share of the net pension liability 2,085,643 Total $ 538,719,871
The net pension liability was measured as of June 30, 2017. The total pension liability used to calculate the net pension liability was based on an actuarial valuation as of June 30, 2016. An expected total pension liability as of June 30, 2017 was determined using standard roll-forward techniques. The School System’s proportion of the net pension liability was based on contributions to TRS during the fiscal year ended June 30, 2017. At June 30 2017, the School System’s proportion was 2.887411%, which was a decrease of 0.036123% from its proportion measured as of June 30, 2016.
For the fiscal year ended June 30, 2018, the School System recognized pension expense of $60,369,183 and revenue of $53,018 for support provided by the State of Georgia for certain support personnel. At June 30, 2018, the School System reported deferred outflows of resources and deferred inflows of resources related to pensions from the following sources:
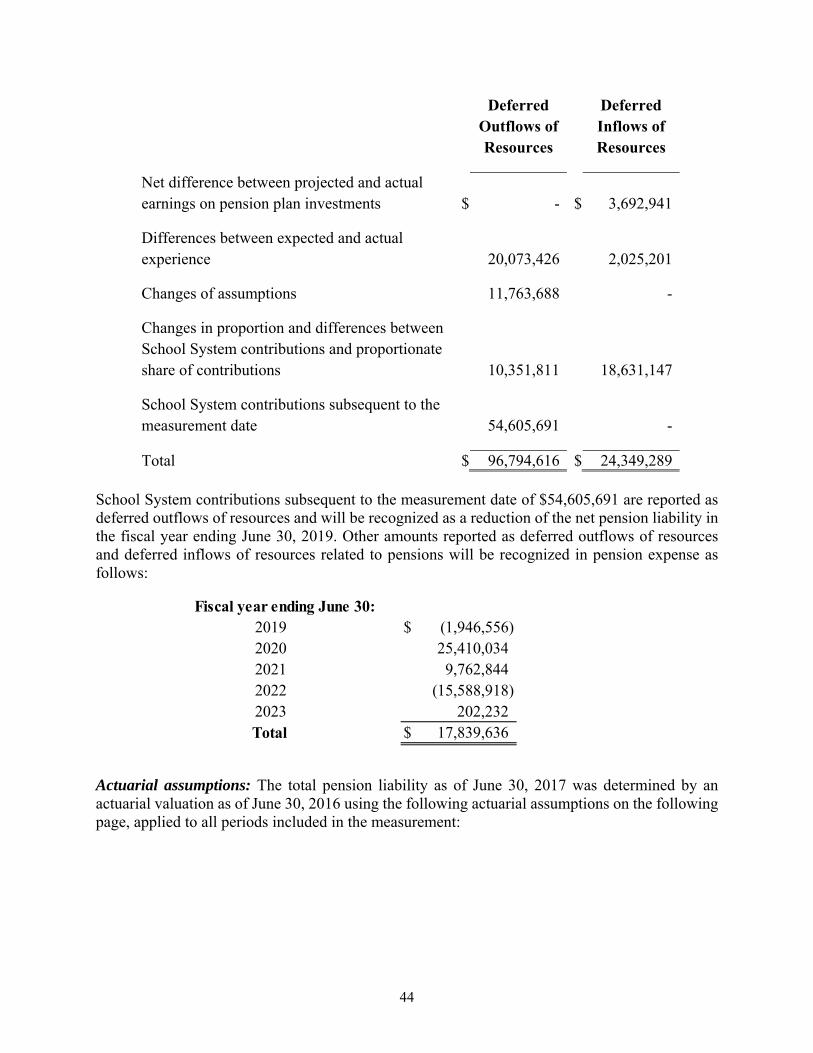
44
Deferred Outflows of Resources
Deferred Inflows of Resources
Net difference between projected and actual earnings on pension plan investments $ - $ 3,692,941
Differences between expected and actual experience 20,073,426 2,025,201
Changes of assumptions 11,763,688 -
Changes in proportion and differences between School System contributions and proportionate share of contributions 10,351,811 18,631,147
School System contributions subsequent to the measurement date 54,605,691 -
Total $ 96,794,616 $ 24,349,289
School System contributions subsequent to the measurement date of $54,605,691 are reported as deferred outflows of resources and will be recognized as a reduction of the net pension liability in the fiscal year ending June 30, 2019. Other amounts reported as deferred outflows of resources and deferred inflows of resources related to pensions will be recognized in pension expense as follows:
Fiscal year ending June 30:2019 $ (1,946,556) 2020 25,410,034 2021 9,762,844 2022 (15,588,918) 2023 202,232 Total $ 17,839,636
Actuarial assumptions: The total pension liability as of June 30, 2017 was determined by an actuarial valuation as of June 30, 2016 using the following actuarial assumptions on the following page, applied to all periods included in the measurement:
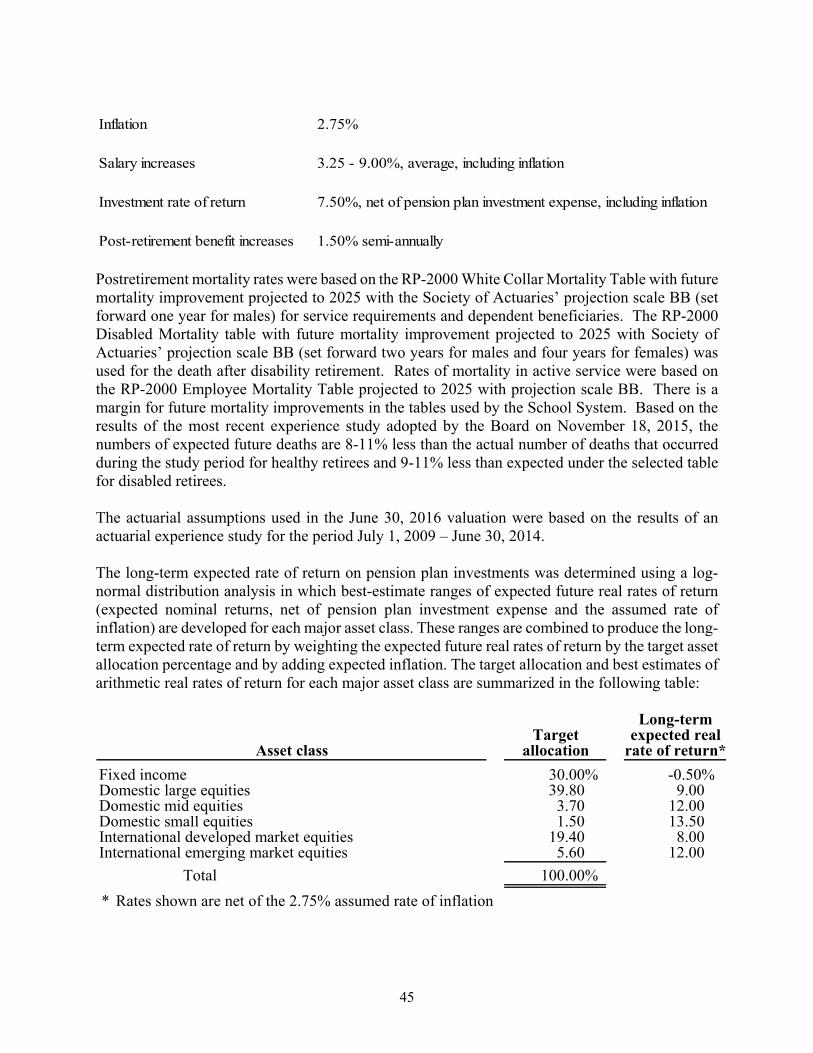
45
Inflation 2.75%
Salary increases 3.25 - 9.00%, average, including inflation
Investment rate of return 7.50%, net of pension plan investment expense, including inflation
Post-retirement benefit increases 1.50% semi-annually
Postretirement mortality rates were based on the RP-2000 White Collar Mortality Table with future mortality improvement projected to 2025 with the Society of Actuaries’ projection scale BB (set forward one year for males) for service requirements and dependent beneficiaries. The RP-2000 Disabled Mortality table with future mortality improvement projected to 2025 with Society of Actuaries’ projection scale BB (set forward two years for males and four years for females) was used for the death after disability retirement. Rates of mortality in active service were based on the RP-2000 Employee Mortality Table projected to 2025 with projection scale BB. There is a margin for future mortality improvements in the tables used by the School System. Based on the results of the most recent experience study adopted by the Board on November 18, 2015, the numbers of expected future deaths are 8-11% less than the actual number of deaths that occurred during the study period for healthy retirees and 9-11% less than expected under the selected table for disabled retirees.
The actuarial assumptions used in the June 30, 2016 valuation were based on the results of an actuarial experience study for the period July 1, 2009 – June 30, 2014.
The long-term expected rate of return on pension plan investments was determined using a log-normal distribution analysis in which best-estimate ranges of expected future real rates of return (expected nominal returns, net of pension plan investment expense and the assumed rate of inflation) are developed for each major asset class. These ranges are combined to produce the long-term expected rate of return by weighting the expected future real rates of return by the target asset allocation percentage and by adding expected inflation. The target allocation and best estimates of arithmetic real rates of return for each major asset class are summarized in the following table:
Long-termTarget expected real
Asset class allocation rate of return*
Fixed income 30.00% -0.50%Domestic large equities 39.80 9.00Domestic mid equities 3.70 12.00Domestic small equities 1.50 13.50International developed market equities 19.40 8.00International emerging market equities 5.60 12.00
Total 100.00%
* Rates shown are net of the 2.75% assumed rate of inflation
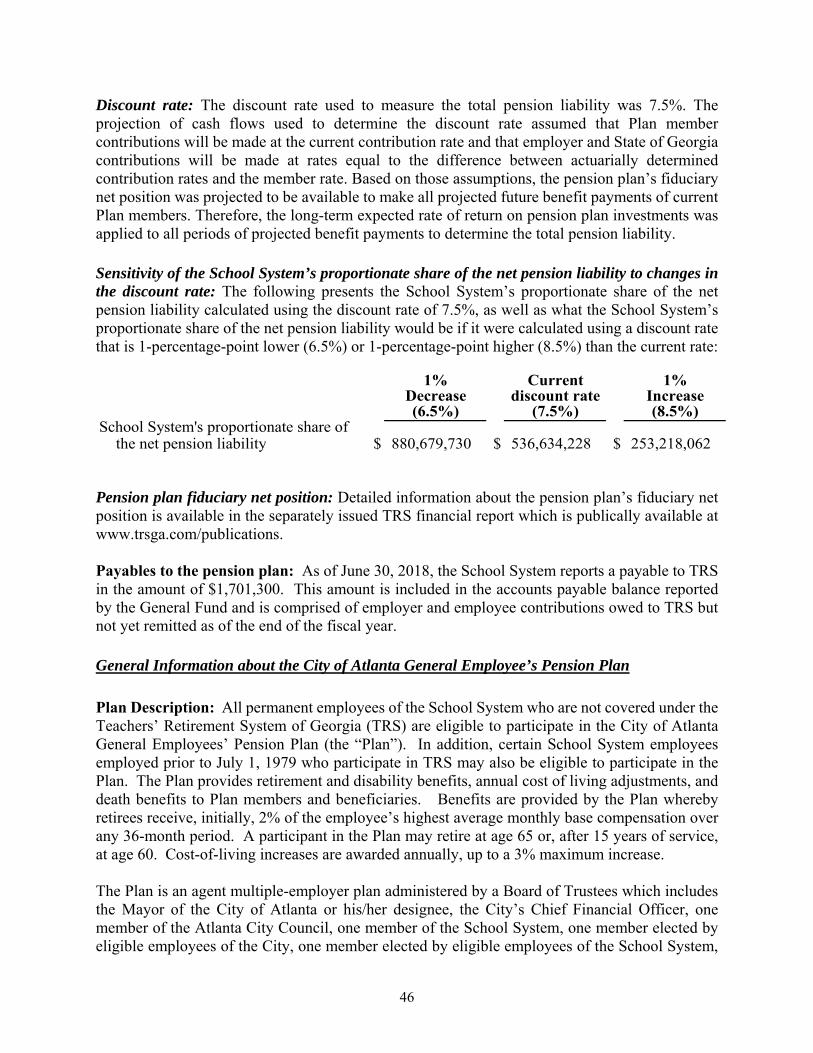
46
Discount rate: The discount rate used to measure the total pension liability was 7.5%. The projection of cash flows used to determine the discount rate assumed that Plan member contributions will be made at the current contribution rate and that employer and State of Georgia contributions will be made at rates equal to the difference between actuarially determined contribution rates and the member rate. Based on those assumptions, the pension plan’s fiduciary net position was projected to be available to make all projected future benefit payments of current Plan members. Therefore, the long-term expected rate of return on pension plan investments was applied to all periods of projected benefit payments to determine the total pension liability.
Sensitivity of the School System’s proportionate share of the net pension liability to changes in the discount rate: The following presents the School System’s proportionate share of the net pension liability calculated using the discount rate of 7.5%, as well as what the School System’s proportionate share of the net pension liability would be if it were calculated using a discount rate that is 1-percentage-point lower (6.5%) or 1-percentage-point higher (8.5%) than the current rate:
1% Current 1%Decrease discount rate Increase(6.5%) (7.5%) (8.5%)
School System's proportionate share ofthe net pension liability $ 880,679,730 $ 536,634,228 $ 253,218,062
Pension plan fiduciary net position: Detailed information about the pension plan’s fiduciary net position is available in the separately issued TRS financial report which is publically available at www.trsga.com/publications.
Payables to the pension plan: As of June 30, 2018, the School System reports a payable to TRS in the amount of $1,701,300. This amount is included in the accounts payable balance reported by the General Fund and is comprised of employer and employee contributions owed to TRS but not yet remitted as of the end of the fiscal year.
General Information about the City of Atlanta General Employee’s Pension Plan
Plan Description: All permanent employees of the School System who are not covered under the Teachers’ Retirement System of Georgia (TRS) are eligible to participate in the City of Atlanta General Employees’ Pension Plan (the “Plan”). In addition, certain School System employees employed prior to July 1, 1979 who participate in TRS may also be eligible to participate in the Plan. The Plan provides retirement and disability benefits, annual cost of living adjustments, and death benefits to Plan members and beneficiaries. Benefits are provided by the Plan whereby retirees receive, initially, 2% of the employee’s highest average monthly base compensation over any 36-month period. A participant in the Plan may retire at age 65 or, after 15 years of service, at age 60. Cost-of-living increases are awarded annually, up to a 3% maximum increase.
The Plan is an agent multiple-employer plan administered by a Board of Trustees which includes the Mayor of the City of Atlanta or his/her designee, the City’s Chief Financial Officer, one member of the Atlanta City Council, one member of the School System, one member elected by eligible employees of the City, one member elected by eligible employees of the School System,

47
one member elected by retired employees of the School System, and one member elected by retired employees of the City. The Board of Trustees has the authority to establish and amend the benefit provisions of the Plan. The Plan issues a publicly available financial report that includes all financial statements and required supplementary information for the Plan. The report may be obtained from the following address:
GEM Group 225 Peachtree Street, Northeast
Suite 1460 Atlanta, Georgia 30303
404-525-4191
Plan Membership. As of July 1, 2017, the date of the most recent actuarial valuation, the pension plan membership consisted of the following:
Retired participants and beneficiaries currently receiving benefits 2,005
Terminated participants entitled to but not receiving benefits 148
Active Plan members 663 Total 2,816
Contributions. Obligations to contribute to the Plan are subject to minimum funding standards of the Georgia Public Retirement Systems Standards law and are established by the Board of Trustees. Previously, the School System’s policy was to contribute to the Plan based on a level percent of payroll amortization method using a closed amortization period with 12.5 years remaining. By resolution adopted by the Atlanta Independent School System’s Board on June 2, 2014, the School System changed its funding policy whereby each year’s employer contribution will be equal to the prior year’s amount, increased by 3%, until the Plan is fully funded. In addition, active participants are required to contribute 7% of pay to the Plan (8% if a participant is married or elects to name a covered beneficiary). For the fiscal year ended June 30, 2018, the School System’s contributions to the Plan were $53,400,000.
Net Pension Liability of the School System. The School System’s net pension liability was measured as of June 30, 2017. The total pension liability used to calculate the net pension liability was determined by an actuarial valuation as July 1, 2016 with update procedures performed by the actuary to roll forward to the total pension liability measured as of June 30, 2017.
Actuarial assumptions. The total pension liability in the July 1, 2016 actuarial valuation was determined using the following actuarial assumptions, applied to all periods included in the measurement:
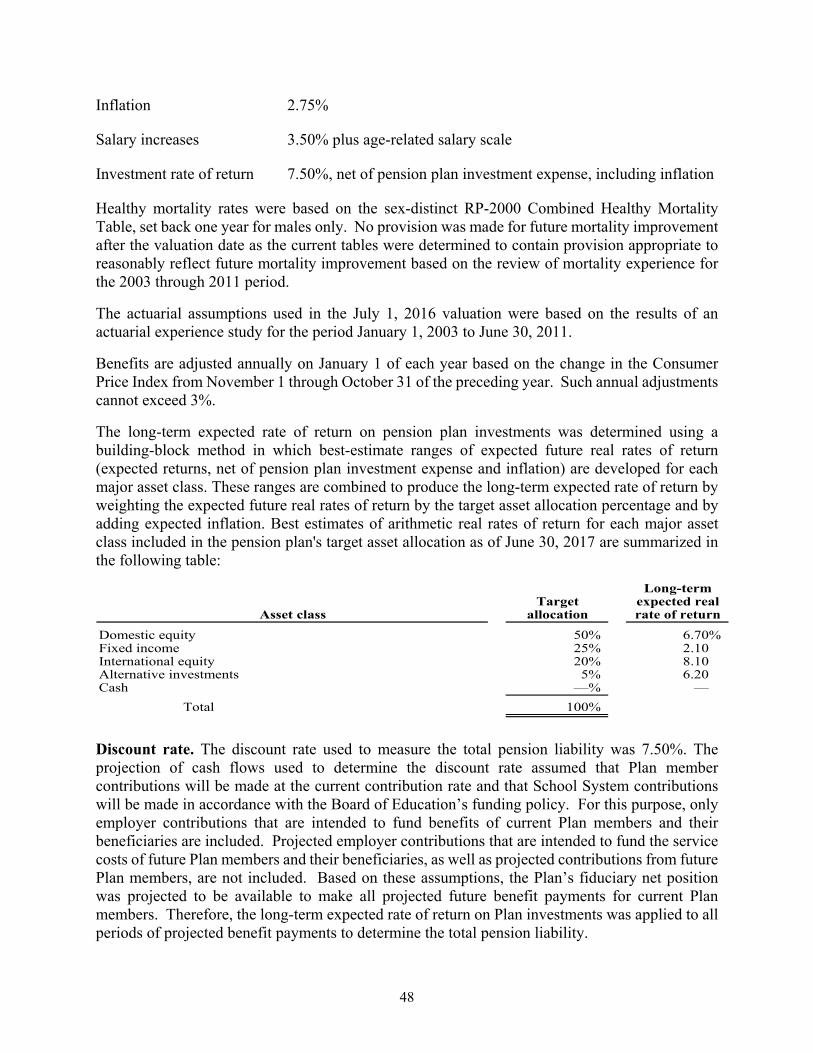
48
Inflation 2.75%
Salary increases 3.50% plus age-related salary scale
Investment rate of return 7.50%, net of pension plan investment expense, including inflation
Healthy mortality rates were based on the sex-distinct RP-2000 Combined Healthy Mortality Table, set back one year for males only. No provision was made for future mortality improvement after the valuation date as the current tables were determined to contain provision appropriate to reasonably reflect future mortality improvement based on the review of mortality experience for the 2003 through 2011 period.
The actuarial assumptions used in the July 1, 2016 valuation were based on the results of an actuarial experience study for the period January 1, 2003 to June 30, 2011.
Benefits are adjusted annually on January 1 of each year based on the change in the Consumer Price Index from November 1 through October 31 of the preceding year. Such annual adjustments cannot exceed 3%.
The long-term expected rate of return on pension plan investments was determined using a building-block method in which best-estimate ranges of expected future real rates of return (expected returns, net of pension plan investment expense and inflation) are developed for each major asset class. These ranges are combined to produce the long-term expected rate of return by weighting the expected future real rates of return by the target asset allocation percentage and by adding expected inflation. Best estimates of arithmetic real rates of return for each major asset class included in the pension plan's target asset allocation as of June 30, 2017 are summarized in the following table:
Long-termTarget expected real
Asset class allocation rate of return
Domestic equity 50% 6.70%Fixed income 25% 2.10International equity 20% 8.10Alternative investments 5% 6.20Cash —% —
Total 100%
Discount rate. The discount rate used to measure the total pension liability was 7.50%. The projection of cash flows used to determine the discount rate assumed that Plan member contributions will be made at the current contribution rate and that School System contributions will be made in accordance with the Board of Education’s funding policy. For this purpose, only employer contributions that are intended to fund benefits of current Plan members and their beneficiaries are included. Projected employer contributions that are intended to fund the service costs of future Plan members and their beneficiaries, as well as projected contributions from future Plan members, are not included. Based on these assumptions, the Plan’s fiduciary net position was projected to be available to make all projected future benefit payments for current Plan members. Therefore, the long-term expected rate of return on Plan investments was applied to all periods of projected benefit payments to determine the total pension liability.
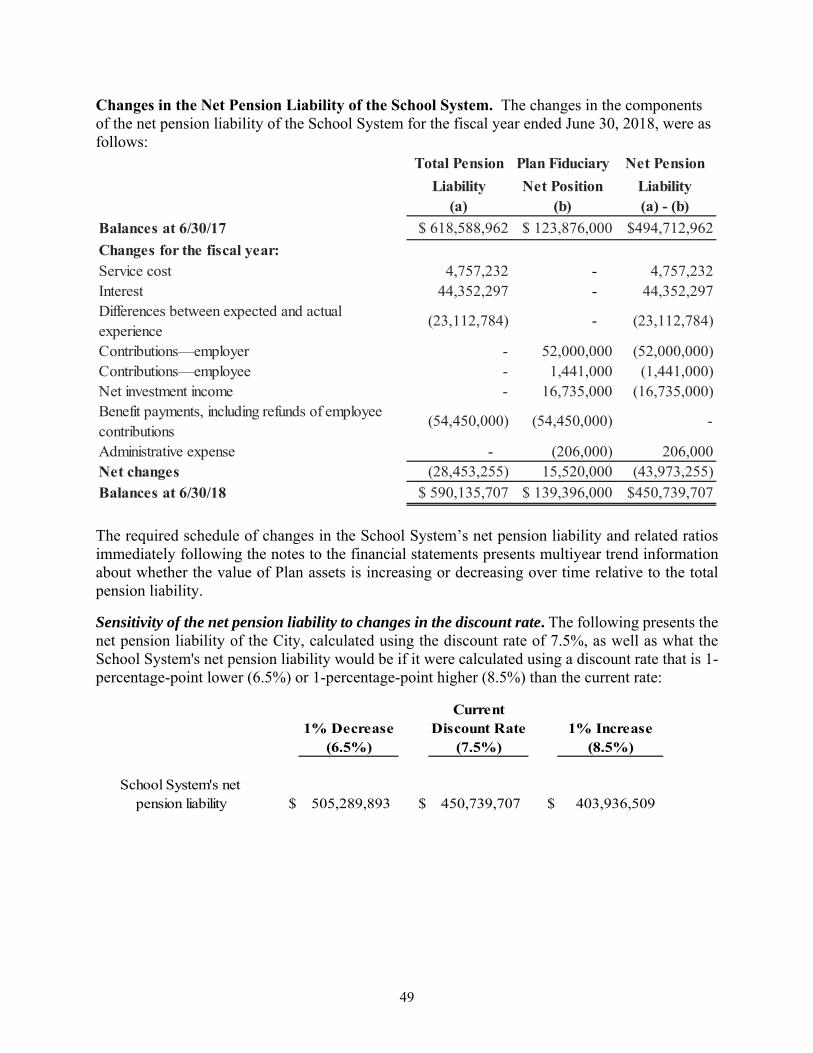
49
Changes in the Net Pension Liability of the School System. The changes in the components of the net pension liability of the School System for the fiscal year ended June 30, 2018, were as follows:
Total Pension Plan Fiduciary Net Pension
Liability Net Position Liability(a) (b) (a) - (b)
Balances at 6/30/17 $ 618,588,962 $ 123,876,000 $494,712,962
Changes for the fiscal year:Service cost 4,757,232 - 4,757,232Interest 44,352,297 - 44,352,297Differences between expected and actual experience
(23,112,784) - (23,112,784)
Contributions—employer - 52,000,000 (52,000,000)Contributions—employee - 1,441,000 (1,441,000)Net investment income - 16,735,000 (16,735,000)Benefit payments, including refunds of employee contributions
(54,450,000) (54,450,000) -
Administrative expense - (206,000) 206,000 Net changes (28,453,255) 15,520,000 (43,973,255)
Balances at 6/30/18 $ 590,135,707 $ 139,396,000 $450,739,707
The required schedule of changes in the School System’s net pension liability and related ratios immediately following the notes to the financial statements presents multiyear trend information about whether the value of Plan assets is increasing or decreasing over time relative to the total pension liability.
Sensitivity of the net pension liability to changes in the discount rate. The following presents the net pension liability of the City, calculated using the discount rate of 7.5%, as well as what the School System's net pension liability would be if it were calculated using a discount rate that is 1-percentage-point lower (6.5%) or 1-percentage-point higher (8.5%) than the current rate:
Current1% Decrease Discount Rate 1% Increase
(6.5%) (7.5%) (8.5%)
School System's net pension liability $ 505,289,893 $ 450,739,707 $ 403,936,509
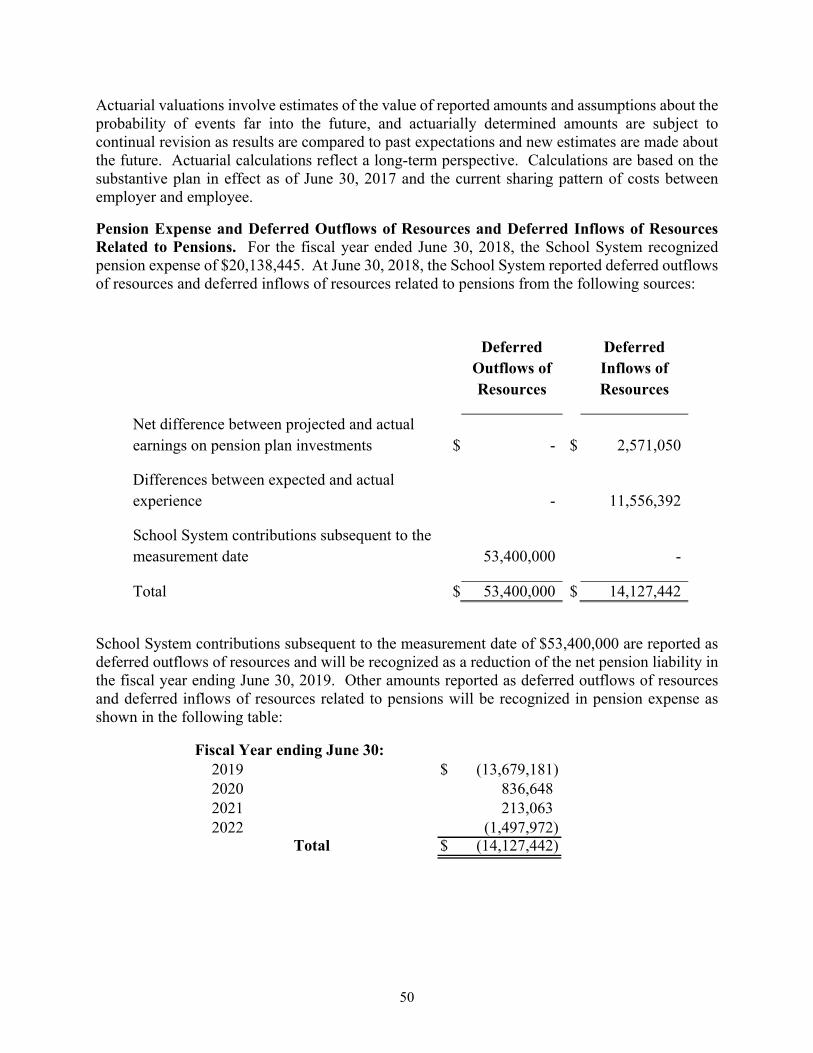
50
Actuarial valuations involve estimates of the value of reported amounts and assumptions about the probability of events far into the future, and actuarially determined amounts are subject to continual revision as results are compared to past expectations and new estimates are made about the future. Actuarial calculations reflect a long-term perspective. Calculations are based on the substantive plan in effect as of June 30, 2017 and the current sharing pattern of costs between employer and employee.
Pension Expense and Deferred Outflows of Resources and Deferred Inflows of Resources Related to Pensions. For the fiscal year ended June 30, 2018, the School System recognized pension expense of $20,138,445. At June 30, 2018, the School System reported deferred outflows of resources and deferred inflows of resources related to pensions from the following sources:
Deferred Outflows of Resources
Deferred Inflows of Resources
Net difference between projected and actual earnings on pension plan investments $ - $ 2,571,050
Differences between expected and actual experience - 11,556,392
School System contributions subsequent to the measurement date 53,400,000 -
Total $ 53,400,000 $ 14,127,442
School System contributions subsequent to the measurement date of $53,400,000 are reported as deferred outflows of resources and will be recognized as a reduction of the net pension liability in the fiscal year ending June 30, 2019. Other amounts reported as deferred outflows of resources and deferred inflows of resources related to pensions will be recognized in pension expense as shown in the following table:
Fiscal Year ending June 30:2019 $ (13,679,181) 2020 836,648 2021 213,063 2022 (1,497,972)
Total $ (14,127,442)
51
O. Other Postemployment Benefits
Georgia School Employees Postemployment Benefit Fund
Plan Description: The School System participates in the State of Georgia School Employees Postemployment Benefit Fund (the School OPEB Fund) which is an other postemployment benefit (OPEB) plan administered by the State of Georgia Department of Community Health (DCH). Certified teachers and non-certified employees of the School System as defined in §20-2-875 of the Official Code of Georgia Annotated (O.C.G.A.) are provided OPEB through the School OPEB Fund - a cost-sharing multiple-employer defined benefit postemployment healthcare plan, reported as an employee trust fund of the State of Georgia and administered by a Board of Community Health (DCH Board). Title 20 of the O.C.G.A. assigns the authority to establish and amend the benefit terms of the group health plan to the DCH Board. The School OPEB Fund is included in the State of Georgia Comprehensive Annual Financial Report which is publicly available and can be obtained at https://sao.georgia.gov/comprehensive-annual-financial-reports.
Benefits: The School OPEB Fund provides healthcare benefits for retirees and their dependents due under the group health plan for public school teachers, including librarians, other certified employees of public schools, regional educational service agencies, and non-certified public school employees. Retiree medical eligibility is attained when an employee retires and is immediately eligible to draw a retirement annuity from Employees’ Retirement System (ERS), Georgia Judicial Retirement System (JRS), Legislative Retirement System (LRS), Teachers Retirement System (TRS) or Public School Employees Retirement System (PSERS). If elected, dependent coverage starts on the same day as retiree coverage. Medicare-eligible retirees are offered Standard and Premium Medicare Advantage plan options. Non-Medicare eligible retiree plan options include Health Reimbursement Arrangement (HRA), Health Maintenance Organization (HMO) and a High Deductible Health Plan (HDHP). The School OPEB Fund also pays for administrative expenses of the fund. By law, no other use of the assets of the School OPEB Fund is permitted.
Contributions: As established by the Board of Community Health, the School OPEB Fund is substantially funded on a pay-as-you-go basis; that is, annual cost of providing benefits will be financed in the same year as claims occur. Contributions required and made to the School OPEB Fund from the School System were $14,818,194 for the fiscal year ended June 30, 2018. Active employees are not required to contribute to the School OPEB Fund.
OPEB Liabilities, OPEB Expense, and Deferred Outflows of Resources and Deferred Inflows of Resources Related to OPEB. Effective July 1, 2017, the School System implemented the provisions of GASB Statement No. 75, Accounting and Financial Reporting for Postemployment Benefits Other Than Pensions, which significantly changed the School System’s accounting for OPEB amounts. The information disclosed in this note is presented in accordance with this new standard.
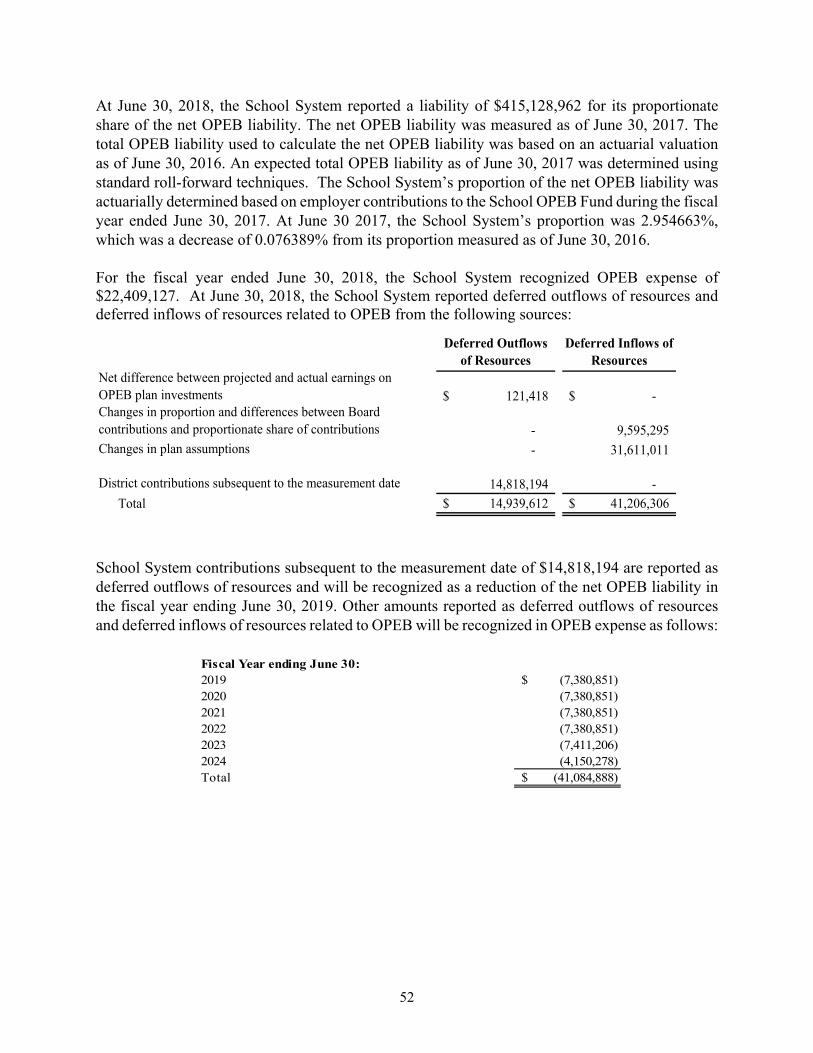
52
At June 30, 2018, the School System reported a liability of $415,128,962 for its proportionate share of the net OPEB liability. The net OPEB liability was measured as of June 30, 2017. The total OPEB liability used to calculate the net OPEB liability was based on an actuarial valuation as of June 30, 2016. An expected total OPEB liability as of June 30, 2017 was determined using standard roll-forward techniques. The School System’s proportion of the net OPEB liability was actuarially determined based on employer contributions to the School OPEB Fund during the fiscal year ended June 30, 2017. At June 30 2017, the School System’s proportion was 2.954663%, which was a decrease of 0.076389% from its proportion measured as of June 30, 2016.
For the fiscal year ended June 30, 2018, the School System recognized OPEB expense of $22,409,127. At June 30, 2018, the School System reported deferred outflows of resources and deferred inflows of resources related to OPEB from the following sources:
Deferred Outflows of Resources
Deferred Inflows of Resources
Net difference between projected and actual earnings on OPEB plan investments 121,418$ -$ Changes in proportion and differences between Board contributions and proportionate share of contributions - 9,595,295Changes in plan assumptions - 31,611,011
District contributions subsequent to the measurement date 14,818,194 -
Total 14,939,612$ 41,206,306$
School System contributions subsequent to the measurement date of $14,818,194 are reported as deferred outflows of resources and will be recognized as a reduction of the net OPEB liability in the fiscal year ending June 30, 2019. Other amounts reported as deferred outflows of resources and deferred inflows of resources related to OPEB will be recognized in OPEB expense as follows:
Fiscal Year ending June 30:2019 (7,380,851)$ 2020 (7,380,851) 2021 (7,380,851) 2022 (7,380,851) 2023 (7,411,206) 2024 (4,150,278) Total (41,084,888)$
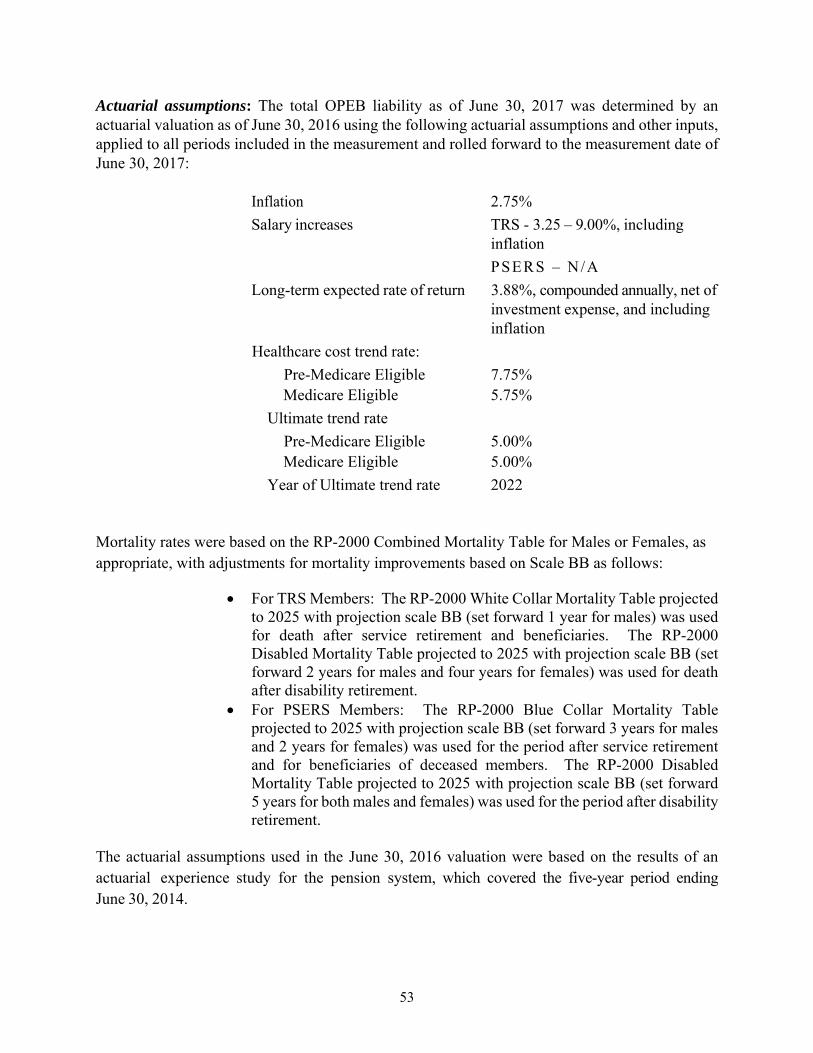
53
Actuarial assumptions: The total OPEB liability as of June 30, 2017 was determined by an actuarial valuation as of June 30, 2016 using the following actuarial assumptions and other inputs, applied to all periods included in the measurement and rolled forward to the measurement date of June 30, 2017:
Inflation 2.75%
Salary increases TRS - 3.25 – 9.00%, including inflation
PSERS – N/A
Long-term expected rate of return 3.88%, compounded annually, net of investment expense, and including inflation
Healthcare cost trend rate:
Pre-Medicare Eligible 7.75% Medicare Eligible 5.75%
Ultimate trend rate
Pre-Medicare Eligible 5.00% Medicare Eligible 5.00%
Year of Ultimate trend rate 2022
Mortality rates were based on the RP‐2000 Combined Mortality Table for Males or Females, as appropriate, with adjustments for mortality improvements based on Scale BB as follows:
For TRS Members: The RP‐2000 White Collar Mortality Table projectedto 2025 with projection scale BB (set forward 1 year for males) was usedfor death after service retirement and beneficiaries. The RP-2000Disabled Mortality Table projected to 2025 with projection scale BB (setforward 2 years for males and four years for females) was used for deathafter disability retirement.
For PSERS Members: The RP‐2000 Blue Collar Mortality Tableprojected to 2025 with projection scale BB (set forward 3 years for malesand 2 years for females) was used for the period after service retirementand for beneficiaries of deceased members. The RP-2000 DisabledMortality Table projected to 2025 with projection scale BB (set forward5 years for both males and females) was used for the period after disabilityretirement.
The actuarial assumptions used in the June 30, 2016 valuation were based on the results of an actuarial experience study for the pension system, which covered the five-year period ending June 30, 2014.
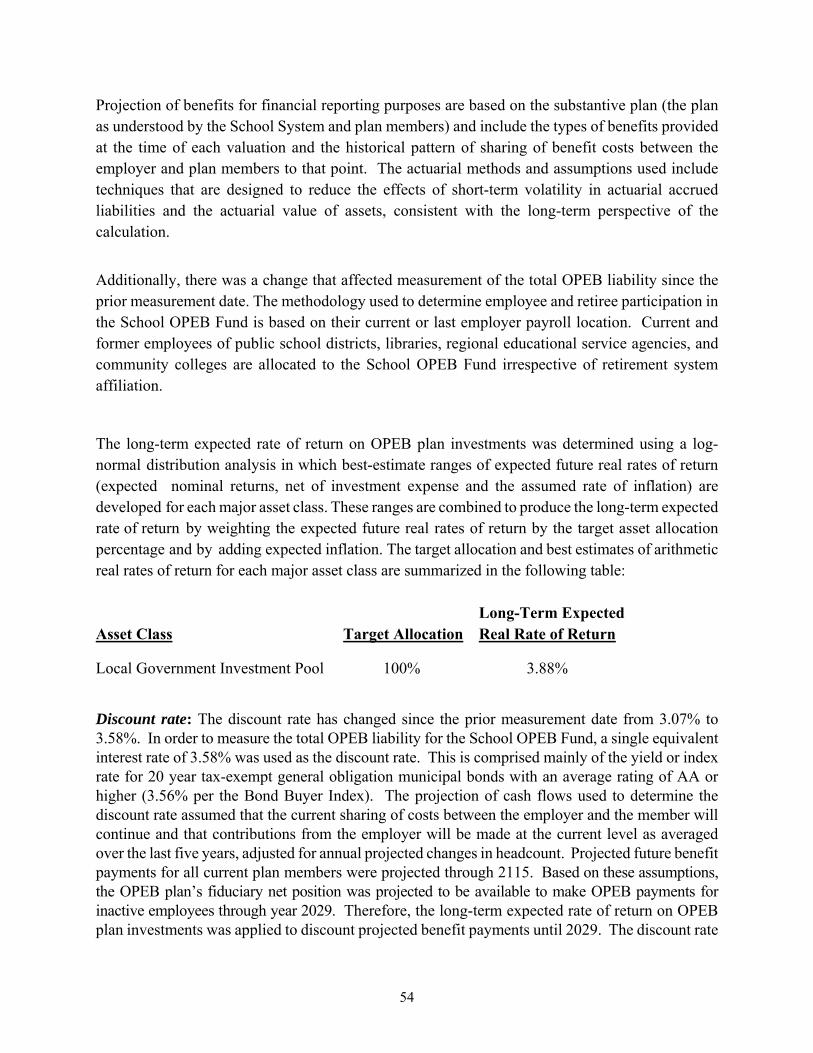
54
Projection of benefits for financial reporting purposes are based on the substantive plan (the plan as understood by the School System and plan members) and include the types of benefits provided at the time of each valuation and the historical pattern of sharing of benefit costs between the employer and plan members to that point. The actuarial methods and assumptions used include techniques that are designed to reduce the effects of short-term volatility in actuarial accrued liabilities and the actuarial value of assets, consistent with the long-term perspective of the calculation.
Additionally, there was a change that affected measurement of the total OPEB liability since the prior measurement date. The methodology used to determine employee and retiree participation in the School OPEB Fund is based on their current or last employer payroll location. Current and former employees of public school districts, libraries, regional educational service agencies, and community colleges are allocated to the School OPEB Fund irrespective of retirement system affiliation.
The long‐term expected rate of return on OPEB plan investments was determined using a log‐normal distribution analysis in which best‐estimate ranges of expected future real rates of return (expected nominal returns, net of investment expense and the assumed rate of inflation) are developed for each major asset class. These ranges are combined to produce the long‐term expected rate of return by weighting the expected future real rates of return by the target asset allocation percentage and by adding expected inflation. The target allocation and best estimates of arithmetic real rates of return for each major asset class are summarized in the following table:
Long-Term Expected Asset Class Target Allocation Real Rate of Return
Local Government Investment Pool 100% 3.88%
Discount rate: The discount rate has changed since the prior measurement date from 3.07% to 3.58%. In order to measure the total OPEB liability for the School OPEB Fund, a single equivalent interest rate of 3.58% was used as the discount rate. This is comprised mainly of the yield or index rate for 20 year tax-exempt general obligation municipal bonds with an average rating of AA or higher (3.56% per the Bond Buyer Index). The projection of cash flows used to determine the discount rate assumed that the current sharing of costs between the employer and the member will continue and that contributions from the employer will be made at the current level as averaged over the last five years, adjusted for annual projected changes in headcount. Projected future benefit payments for all current plan members were projected through 2115. Based on these assumptions, the OPEB plan’s fiduciary net position was projected to be available to make OPEB payments for inactive employees through year 2029. Therefore, the long-term expected rate of return on OPEB plan investments was applied to discount projected benefit payments until 2029. The discount rate
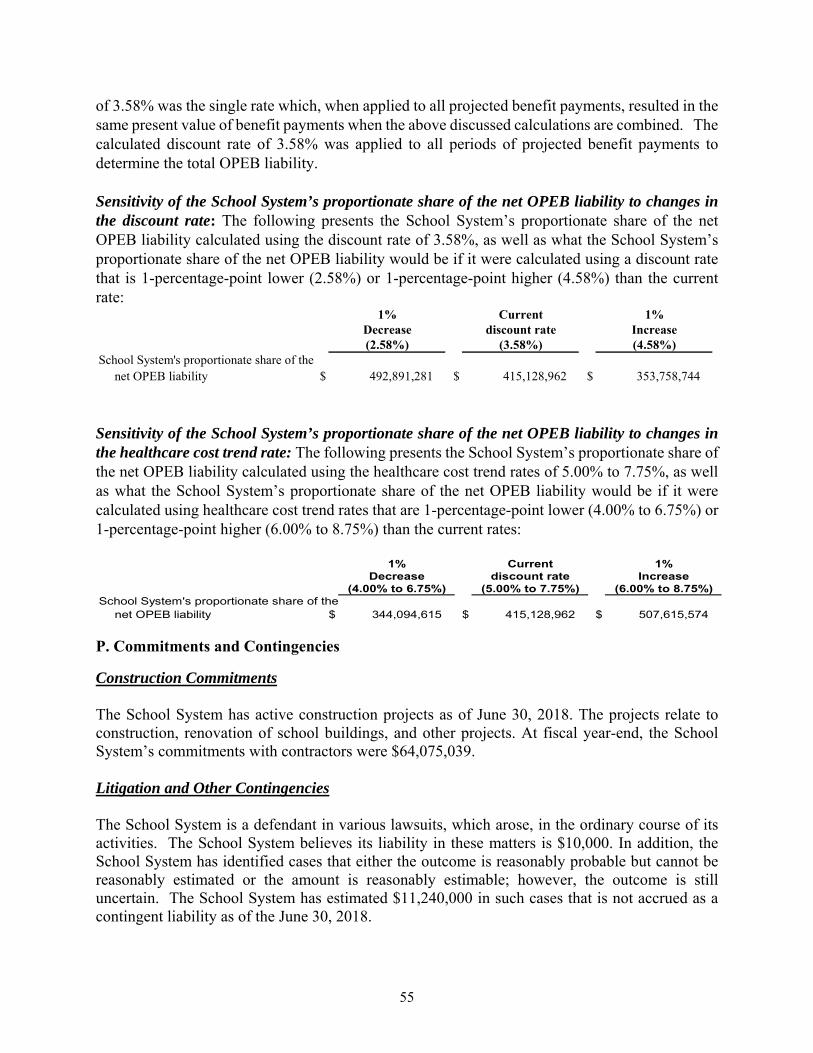
55
of 3.58% was the single rate which, when applied to all projected benefit payments, resulted in the same present value of benefit payments when the above discussed calculations are combined. The calculated discount rate of 3.58% was applied to all periods of projected benefit payments to determine the total OPEB liability.
Sensitivity of the School System’s proportionate share of the net OPEB liability to changes in the discount rate: The following presents the School System’s proportionate share of the net OPEB liability calculated using the discount rate of 3.58%, as well as what the School System’s proportionate share of the net OPEB liability would be if it were calculated using a discount rate that is 1-percentage-point lower (2.58%) or 1-percentage-point higher (4.58%) than the current rate:
1% Current 1%Decrease discount rate Increase(2.58%) (3.58%) (4.58%)
School System's proportionate share of thenet OPEB liability $ 492,891,281 $ 415,128,962 $ 353,758,744
Sensitivity of the School System’s proportionate share of the net OPEB liability to changes in the healthcare cost trend rate: The following presents the School System’s proportionate share of the net OPEB liability calculated using the healthcare cost trend rates of 5.00% to 7.75%, as well as what the School System’s proportionate share of the net OPEB liability would be if it were calculated using healthcare cost trend rates that are 1-percentage-point lower (4.00% to 6.75%) or 1-percentage-point higher (6.00% to 8.75%) than the current rates:
1% Current 1%Decrease discount rate Increase
(4.00% to 6.75%) (5.00% to 7.75%) (6.00% to 8.75%)School System's proportionate share of the
net OPEB liability $ 344,094,615 $ 415,128,962 $ 507,615,574
P. Commitments and Contingencies
Construction Commitments
The School System has active construction projects as of June 30, 2018. The projects relate to construction, renovation of school buildings, and other projects. At fiscal year-end, the School System’s commitments with contractors were $64,075,039.
Litigation and Other Contingencies
The School System is a defendant in various lawsuits, which arose, in the ordinary course of its activities. The School System believes its liability in these matters is $10,000. In addition, the School System has identified cases that either the outcome is reasonably probable but cannot be reasonably estimated or the amount is reasonably estimable; however, the outcome is still uncertain. The School System has estimated $11,240,000 in such cases that is not accrued as a contingent liability as of the June 30, 2018.
56
In December 2016, the School System received a letter from the City of Atlanta claiming that the School System owes the City related to the City’s defeasement of certain City bonds, which included bonds issued by the City for school purposes. The bonds were defeased in 2014 and 2015 with accumulated balances in the City’s bond sinking fund. The letter claims that the City disproportionately contributed to the accumulated balances in the debt sinking funds used to defease the bonds and asks the School System to pay to the City $11,146,937. The School System disputes this liability and contends that it is not legally obligated to pay the sums requested by the City. As a result, the School System considers this to be a contingent liability where the amount is reasonably estimable however, the outcome is still uncertain and, therefore, the School System has disclosed this amount that is not accrued in its financial statements as of June 30, 2018.
Amounts received or receivable from the federal government are subject to audit and review by grantor agencies. This could result in requests for reimbursement to the grantor agency for any costs which are disallowed under grant terms. The School System believes that such disallowances, if any, will be immaterial to its overall financial position.
Q. Pollution Remediation Obligations
GASB Statement No. 49, Accounting and Financial Reporting for Pollution Remediation Obligations, establishes accounting and financial reporting criteria for liabilities that address current or potential detrimental effects of existing pollution by participating in pollution remediation activities. When one of five obligating events identified by the GASB occurs, the components of the expected pollution remediation outlays must be estimated and a determination made whether the outlays should be accrued as a liability or capitalized when goods and services are acquired, as appropriate. Pollution remediation liabilities must be measured based on the pollution remediation outlays expected to be incurred to settle these liabilities. It must be based on “reasonable and supportable” assumptions of future events that may affect the eventual settlement of the liability, and should be measured and reported at current value. The current value of the liability should be based on applicable federal, state or local laws or regulations that have been approved, regardless of their effective date, and the technology expected to be used for the cleanup. Outlays for pollution remediation obligations should be recognized as liabilities if goods and services used for pollution remediation activities are liquidated with expendable available financial resources (modified accrual accounting). However, pollution remediation outlays should be capitalized in the government-wide or proprietary fund statements when goods and services are acquired for certain specific purposes; these amounts are recorded as expenditures at the fund level. In government-wide and proprietary fund financial statements, the liability should be recorded at the current value of the costs the government expects to incur to perform the work. This amount should be estimated using the expected cash flow technique, which measures the liability as the sum of probability-weighted amounts in a range of possible estimated amounts – the estimated mean or average.
The School System paid $1,332,476 during fiscal year 2018 for remediation activities which included removal of mold, asbestos, and other waste from various sites owned by the School System. Each of these activities were undertaken on an as needed basis and completed and thus there is no further liability for remediation activities at these sites.
57
R. Tax Abatements
For the fiscal year ended June 30, 2018, School System tax revenues were reduced by $8,090,204 and $5,504,451 as a result of agreements entered into by the Development Authority of Fulton County and the City of Atlanta, respectively. Under these agreements, taxes on both real and personal property are reduced based on incentives and economic development programs offered by the Development Authority of Fulton County and the City of Atlanta, respectively.
S. Subsequent Event
On August 29, 2018, the School System issued a short-term Tax Anticipation Note (TAN), Series 2018 in the par amount of $60,000,000. The TAN carries an interest rate of 2.06% and must be repaid prior to December 31, 2018.
T. Restatements
In conjunction with the implementation of Governmental Accounting Standards (GASB) Statement No. 75, Accounting and Financial Reporting for Postemployment Benefits Other Than Pensions, the School System is required to change its accounting treatment of the net OPEB liabilities and the related OPEB expense. The new standard requires that the School System’s proportionate share of the net OPEB liability be recorded on the statement of net position for its governmental activities. Therefore, in conjunction with the implementation of statement No. 75, the following restatement was required to the beginning net position of governmental activities to properly recognize the District’s net OPEB liability and related deferred outflows of resources for contributions subsequent to the measurement date as of the end of the prior period.
Net position, as previously reported $ 556,604,478 Restatement for implementation of GASB Statement No. 75: Net OPEB liability as of June 30, 2017 (449,210,568)
Deferred outflows of resources - OPEB contributions 15,405,845 Net position, as restated $ 122,799,755
Governmental Activities

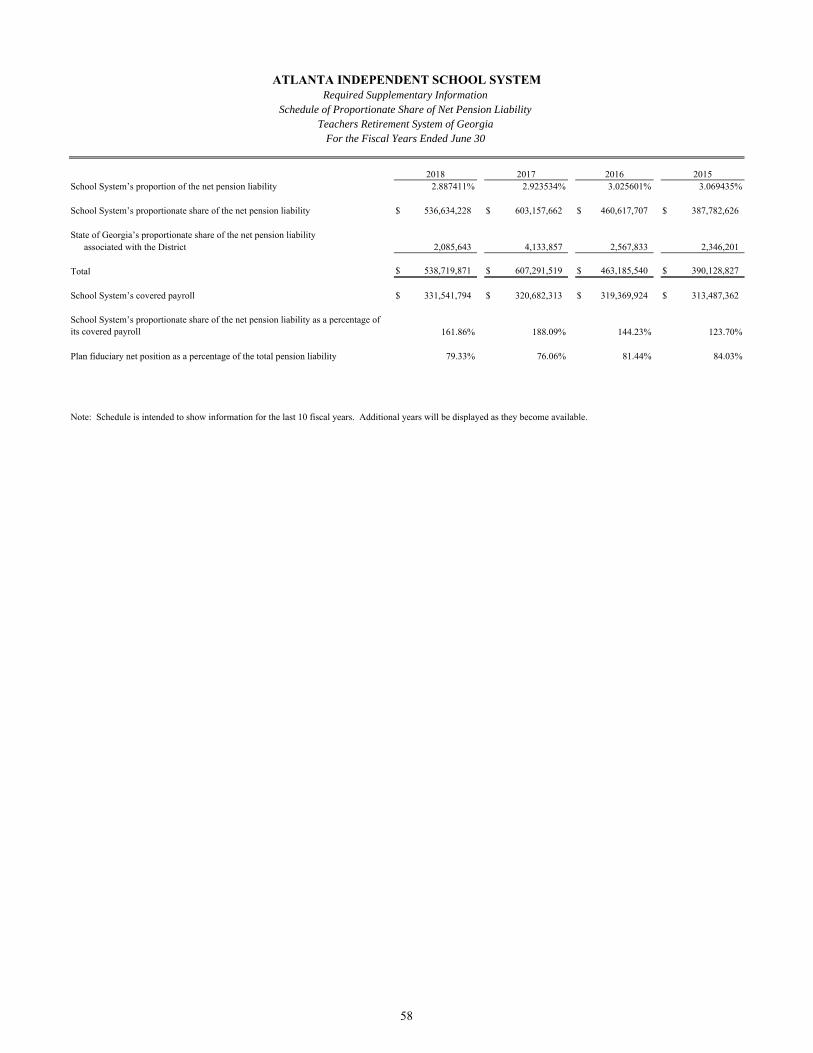
School System’s proportion of the net pension liability 2.887411% 2.923534% 3.025601% 3.069435%
School System’s proportionate share of the net pension liability $ 536,634,228 $ 603,157,662 $ 460,617,707 $ 387,782,626
State of Georgia’s proportionate share of the net pension liability associated with the District 2,085,643 4,133,857 2,567,833 2,346,201
Total $ 538,719,871 $ 607,291,519 $ 463,185,540 $ 390,128,827
School System’s covered payroll $ 331,541,794 $ 320,682,313 $ 319,369,924 $ 313,487,362
161.86% 188.09% 144.23% 123.70%
Plan fiduciary net position as a percentage of the total pension liability 79.33% 76.06% 81.44% 84.03%
Note: Schedule is intended to show information for the last 10 fiscal years. Additional years will be displayed as they become available.
Teachers Retirement System of GeorgiaFor the Fiscal Years Ended June 30
2015
School System’s proportionate share of the net pension liability as a percentage of its covered payroll
ATLANTA INDEPENDENT SCHOOL SYSTEMRequired Supplementary Information
Schedule of Proportionate Share of Net Pension Liability
2017 20162018
58
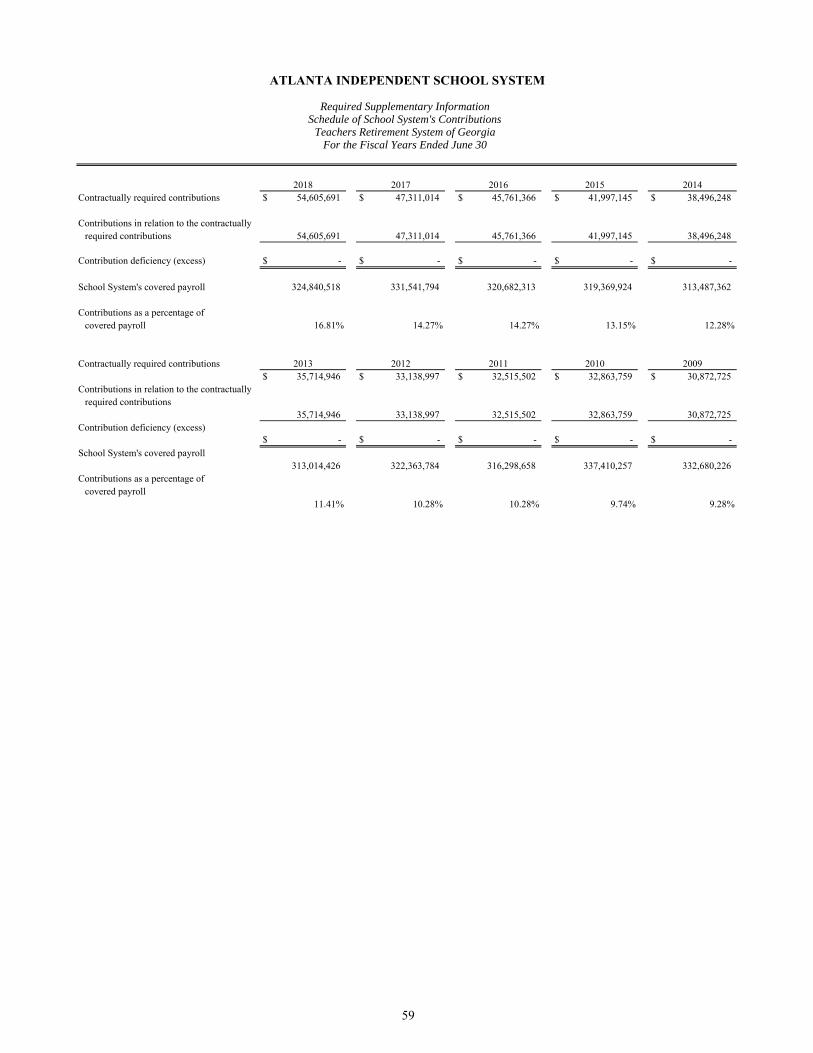
Contractually required contributions $ 54,605,691 $ 47,311,014 $ 45,761,366 $ 41,997,145 $ 38,496,248
Contributions in relation to the contractuallyrequired contributions 54,605,691 47,311,014 45,761,366 41,997,145 38,496,248
Contribution deficiency (excess) $ - $ - $ - $ - $ -
School System's covered payroll 324,840,518 331,541,794 320,682,313 319,369,924 313,487,362
Contributions as a percentage of covered payroll 16.81% 14.27% 14.27% 13.15% 12.28%
Contractually required contributions$ 35,714,946 $ 33,138,997 $ 32,515,502 $ 32,863,759 $ 30,872,725
Contributions in relation to the contractuallyrequired contributions
35,714,946 33,138,997 32,515,502 32,863,759 30,872,725 Contribution deficiency (excess)
$ - $ - $ - $ - $ -
School System's covered payroll313,014,426 322,363,784 316,298,658 337,410,257 332,680,226
Contributions as a percentage of covered payroll
11.41% 10.28% 10.28% 9.74% 9.28%
2017 2016 2015 2014
2013 2012 2011 2010 2009
2018
For the Fiscal Years Ended June 30
ATLANTA INDEPENDENT SCHOOL SYSTEM
Required Supplementary InformationSchedule of School System's Contributions
Teachers Retirement System of Georgia
59

Valuation date June 30, 2016Measurement date June 30, 2017Reporting date June 30, 2018Actuarial cost method Entry ageAmortization method Level percentage of payroll, openRemaining amortization period 29 yearsAsset valuation method 5-year smoothed marketInflation rate 2.75%Salary increases 3.25 - 9.00%, including inflation.Investment Rate of Return 7.50%, net of pension plan investment expense including inflation.Post-Retirement Benefit Increases 1.50% semi-annually
ATLANTA INDEPENDENT SCHOOL SYSTEM
Notes to Required Supplementary InformationTeachers Retirement System of Georgia
Changes of assumptions: In 2010 and later, the expectation of retired life mortality was changed to the RP-2000 Mortality Tables from the 1994Group Annuity Mortality Table. In 2010, rates of withdrawal, retirement, disability and mortality were adjusted to more closely reflect actualexperience. In 2010, assumed rates of salary increase were adjusted to more closely reflect actual and anticipated experience. On November 18,2015, the Board adopted recommended changes to the economic and demographic assumptions utilized by the System. Primary among thechanges were the updates to rates of mortality, retirement, disability, withdrawal and salary increases. The expectation of retired life mortality waschanged to RP-2000 White Collar Mortality Table with future mortality improvement projected to 2025 with the Society of Actuaries’ projectionscale BB (set forward one year for males).
Method and assumptions used in calculations of actuarially determined contributions: The actuarially determined contribution rates in theschedule of employer contributions are calculated as of June 30, three years prior to the end of the fiscal year in which contributions are reported(June 30, 2017 employer contributions were determined in the June 30, 2014 valuation). The following actuarial methods and assumptions wereused to determine the most recent contribution rate reported in that schedule:
The actuarial assumptions used in the June 30, 2016 valuation were based on the results of an actuarial experience study for the period July 1, 2009 – June 30, 2014.
60
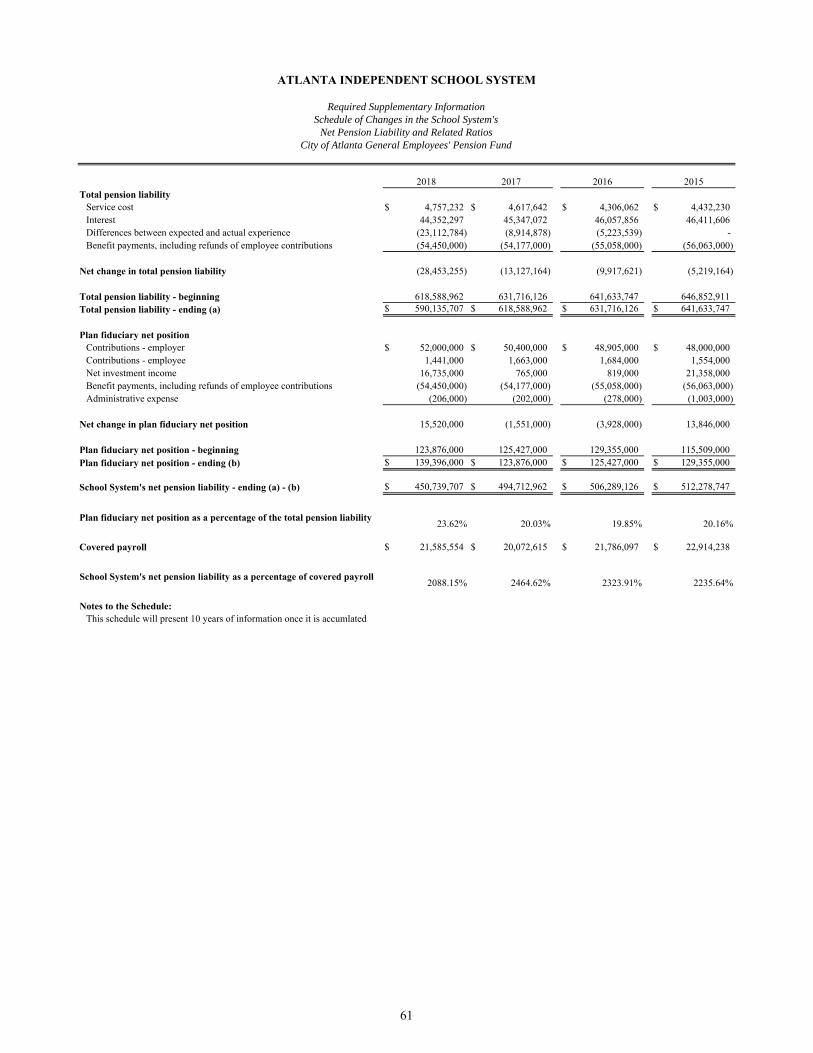
Total pension liabilityService cost $ 4,757,232 $ 4,617,642 $ 4,306,062 $ 4,432,230 Interest 44,352,297 45,347,072 46,057,856 46,411,606 Differences between expected and actual experience (23,112,784) (8,914,878) (5,223,539) - Benefit payments, including refunds of employee contributions (54,450,000) (54,177,000) (55,058,000) (56,063,000)
Net change in total pension liability (28,453,255) (13,127,164) (9,917,621) (5,219,164)
Total pension liability - beginning 618,588,962 631,716,126 641,633,747 646,852,911 Total pension liability - ending (a) $ 590,135,707 $ 618,588,962 $ 631,716,126 $ 641,633,747
Plan fiduciary net positionContributions - employer $ 52,000,000 $ 50,400,000 $ 48,905,000 $ 48,000,000 Contributions - employee 1,441,000 1,663,000 1,684,000 1,554,000 Net investment income 16,735,000 765,000 819,000 21,358,000 Benefit payments, including refunds of employee contributions (54,450,000) (54,177,000) (55,058,000) (56,063,000) Administrative expense (206,000) (202,000) (278,000) (1,003,000)
Net change in plan fiduciary net position 15,520,000 (1,551,000) (3,928,000) 13,846,000
Plan fiduciary net position - beginning 123,876,000 125,427,000 129,355,000 115,509,000 Plan fiduciary net position - ending (b) $ 139,396,000 $ 123,876,000 $ 125,427,000 $ 129,355,000
School System's net pension liability - ending (a) - (b) $ 450,739,707 $ 494,712,962 $ 506,289,126 $ 512,278,747
Plan fiduciary net position as a percentage of the total pension liability23.62% 20.03% 19.85% 20.16%
Covered payroll $ 21,585,554 $ 20,072,615 $ 21,786,097 $ 22,914,238
School System's net pension liability as a percentage of covered payroll2088.15% 2464.62% 2323.91% 2235.64%
Notes to the Schedule:This schedule will present 10 years of information once it is accumlated
2015
ATLANTA INDEPENDENT SCHOOL SYSTEM
Required Supplementary InformationSchedule of Changes in the School System's
Net Pension Liability and Related RatiosCity of Atlanta General Employees' Pension Fund
2017 20162018
61
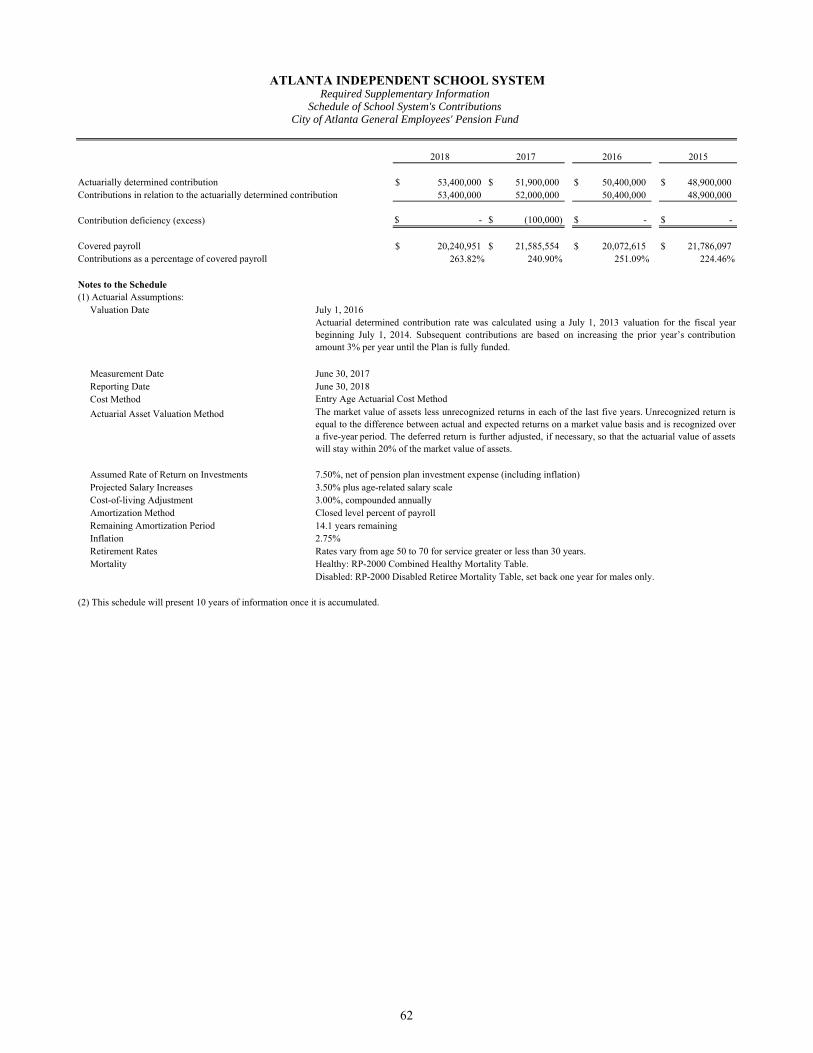
Actuarially determined contribution $ 53,400,000 $ 51,900,000 $ 50,400,000 $ 48,900,000 Contributions in relation to the actuarially determined contribution 53,400,000 52,000,000 50,400,000 48,900,000
Contribution deficiency (excess) $ - $ (100,000) $ - $ -
Covered payroll $ 20,240,951 $ 21,585,554 $ 20,072,615 $ 21,786,097 Contributions as a percentage of covered payroll 263.82% 240.90% 251.09% 224.46%
Notes to the Schedule(1) Actuarial Assumptions:
Valuation Date July 1, 2016
Measurement Date June 30, 2017 Reporting Date June 30, 2018 Cost Method
Actuarial Asset Valuation Method
Assumed Rate of Return on Investments 7.50%, net of pension plan investment expense (including inflation) Projected Salary Increases 3.50% plus age-related salary scale Cost-of-living Adjustment 3.00%, compounded annually Amortization Method Closed level percent of payroll Remaining Amortization Period 14.1 years remaining Inflation 2.75% Retirement Rates Rates vary from age 50 to 70 for service greater or less than 30 years. Mortality Healthy: RP-2000 Combined Healthy Mortality Table.
Disabled: RP-2000 Disabled Retiree Mortality Table, set back one year for males only.
(2) This schedule will present 10 years of information once it is accumulated.
The market value of assets less unrecognized returns in each of the last five years. Unrecognized return isequal to the difference between actual and expected returns on a market value basis and is recognized overa five-year period. The deferred return is further adjusted, if necessary, so that the actuarial value of assetswill stay within 20% of the market value of assets.
2015
ATLANTA INDEPENDENT SCHOOL SYSTEMRequired Supplementary Information
Schedule of School System's ContributionsCity of Atlanta General Employees' Pension Fund
2017 20162018
Actuarial determined contribution rate was calculated using a July 1, 2013 valuation for the fiscal yearbeginning July 1, 2014. Subsequent contributions are based on increasing the prior year’s contributionamount 3% per year until the Plan is fully funded.
Entry Age Actuarial Cost Method
62
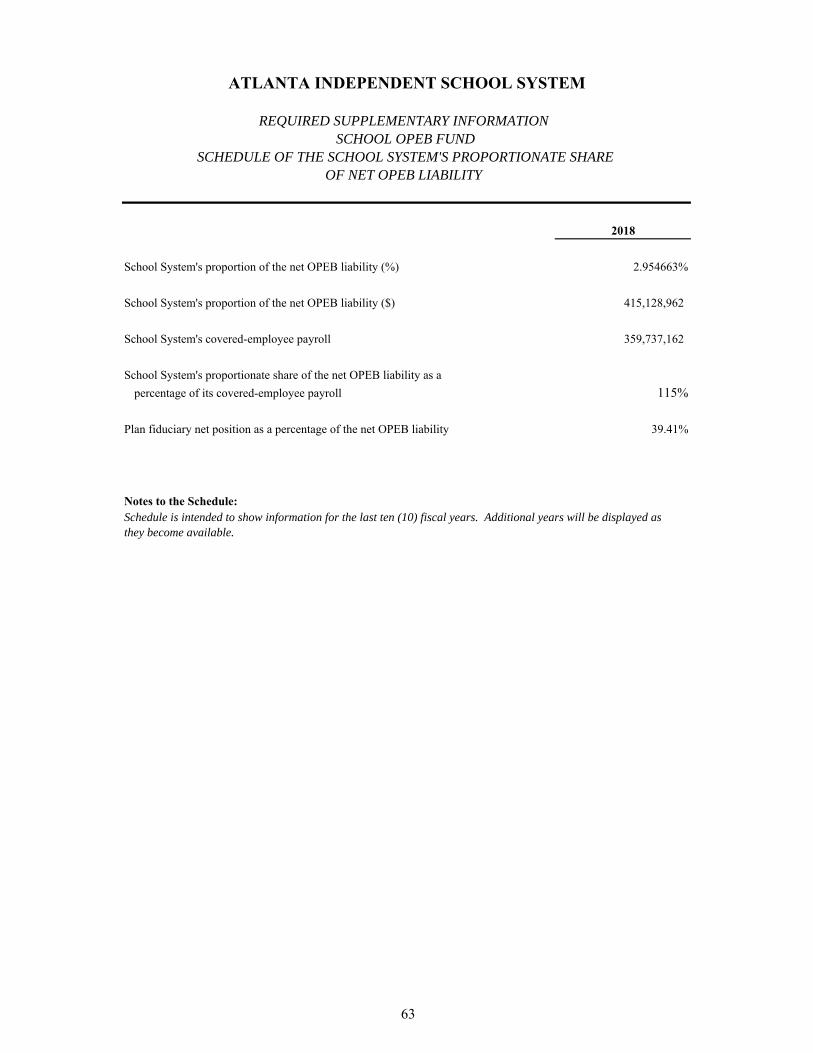
2018
School System's proportion of the net OPEB liability (%) 2.954663%
School System's proportion of the net OPEB liability ($) 415,128,962
School System's covered-employee payroll 359,737,162
School System's proportionate share of the net OPEB liability as a
percentage of its covered-employee payroll 115%
Plan fiduciary net position as a percentage of the net OPEB liability 39.41%
Notes to the Schedule:Schedule is intended to show information for the last ten (10) fiscal years. Additional years will be displayed as they become available.
ATLANTA INDEPENDENT SCHOOL SYSTEM
REQUIRED SUPPLEMENTARY INFORMATION SCHOOL OPEB FUND
SCHEDULE OF THE SCHOOL SYSTEM'S PROPORTIONATE SHAREOF NET OPEB LIABILITY
63
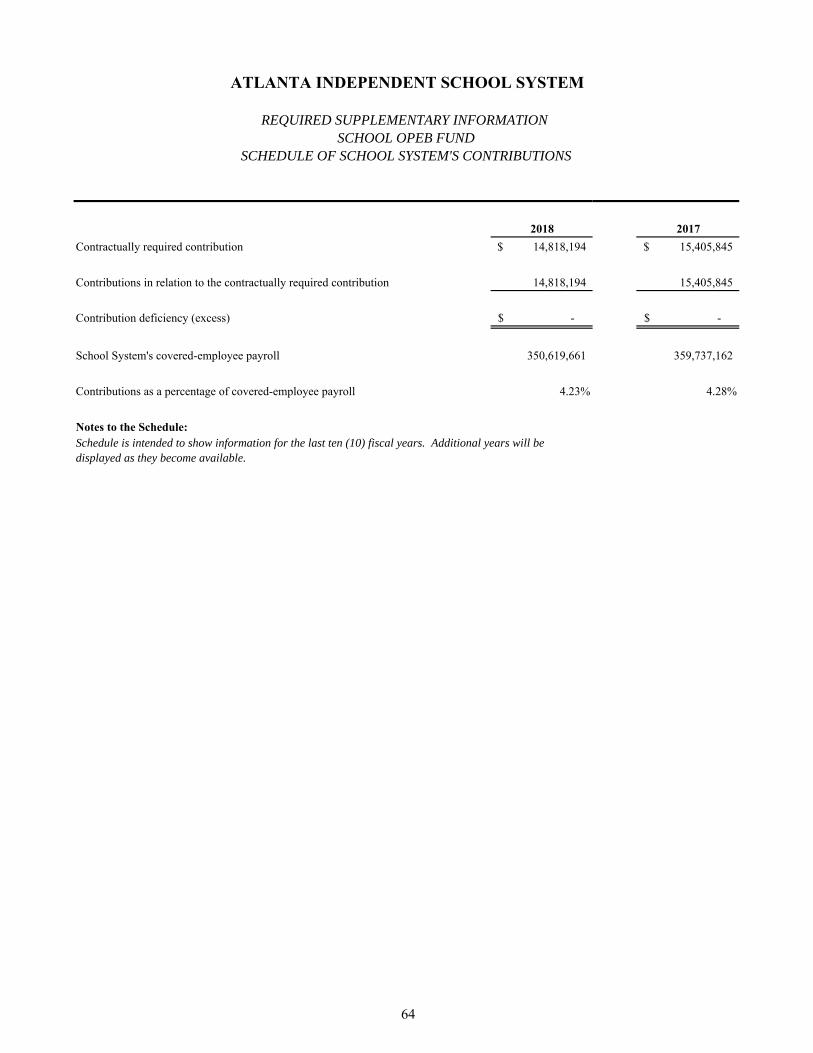
ATLANTA INDEPENDENT SCHOOL SYSTEM
REQUIRED SUPPLEMENTARY INFORMATION SCHOOL OPEB FUND
SCHEDULE OF SCHOOL SYSTEM'S CONTRIBUTIONS
2018 2017
Contractually required contribution 14,818,194$ 15,405,845$
Contributions in relation to the contractually required contribution 14,818,194 15,405,845
Contribution deficiency (excess) -$ -$
School System's covered-employee payroll 350,619,661 359,737,162
Contributions as a percentage of covered-employee payroll 4.23% 4.28%
Notes to the Schedule:Schedule is intended to show information for the last ten (10) fiscal years. Additional years will be displayed as they become available.
64
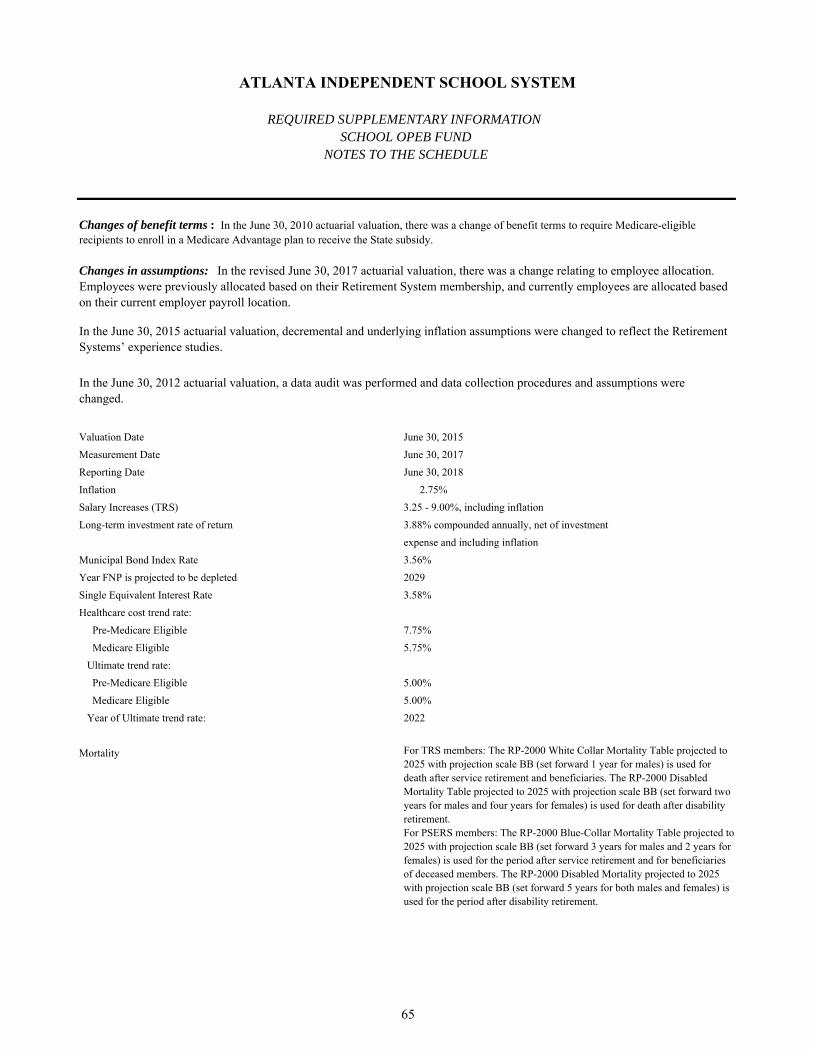
Valuation Date June 30, 2015
Measurement Date June 30, 2017
Reporting Date June 30, 2018
Inflation 2.75%
Salary Increases (TRS) 3.25 - 9.00%, including inflation
Long-term investment rate of return 3.88% compounded annually, net of investment
expense and including inflation
Municipal Bond Index Rate 3.56%
Year FNP is projected to be depleted 2029
Single Equivalent Interest Rate 3.58%
Healthcare cost trend rate:
Pre-Medicare Eligible 7.75%
Medicare Eligible 5.75%
Ultimate trend rate:
Pre-Medicare Eligible 5.00%
Medicare Eligible 5.00%
Year of Ultimate trend rate: 2022
Mortality For TRS members: The RP-2000 White Collar Mortality Table projected to 2025 with projection scale BB (set forward 1 year for males) is used for death after service retirement and beneficiaries. The RP-2000 Disabled Mortality Table projected to 2025 with projection scale BB (set forward two years for males and four years for females) is used for death after disability retirement.For PSERS members: The RP-2000 Blue-Collar Mortality Table projected to 2025 with projection scale BB (set forward 3 years for males and 2 years for females) is used for the period after service retirement and for beneficiaries of deceased members. The RP-2000 Disabled Mortality projected to 2025 with projection scale BB (set forward 5 years for both males and females) is used for the period after disability retirement.
Changes in assumptions: In the revised June 30, 2017 actuarial valuation, there was a change relating to employee allocation. Employees were previously allocated based on their Retirement System membership, and currently employees are allocated based on their current employer payroll location.
In the June 30, 2015 actuarial valuation, decremental and underlying inflation assumptions were changed to reflect the Retirement Systems’ experience studies.
In the June 30, 2012 actuarial valuation, a data audit was performed and data collection procedures and assumptions were changed.
ATLANTA INDEPENDENT SCHOOL SYSTEM
REQUIRED SUPPLEMENTARY INFORMATION SCHOOL OPEB FUND
NOTES TO THE SCHEDULE
Changes of benefit terms : In the June 30, 2010 actuarial valuation, there was a change of benefit terms to require Medicare-eligible recipients to enroll in a Medicare Advantage plan to receive the State subsidy.
65
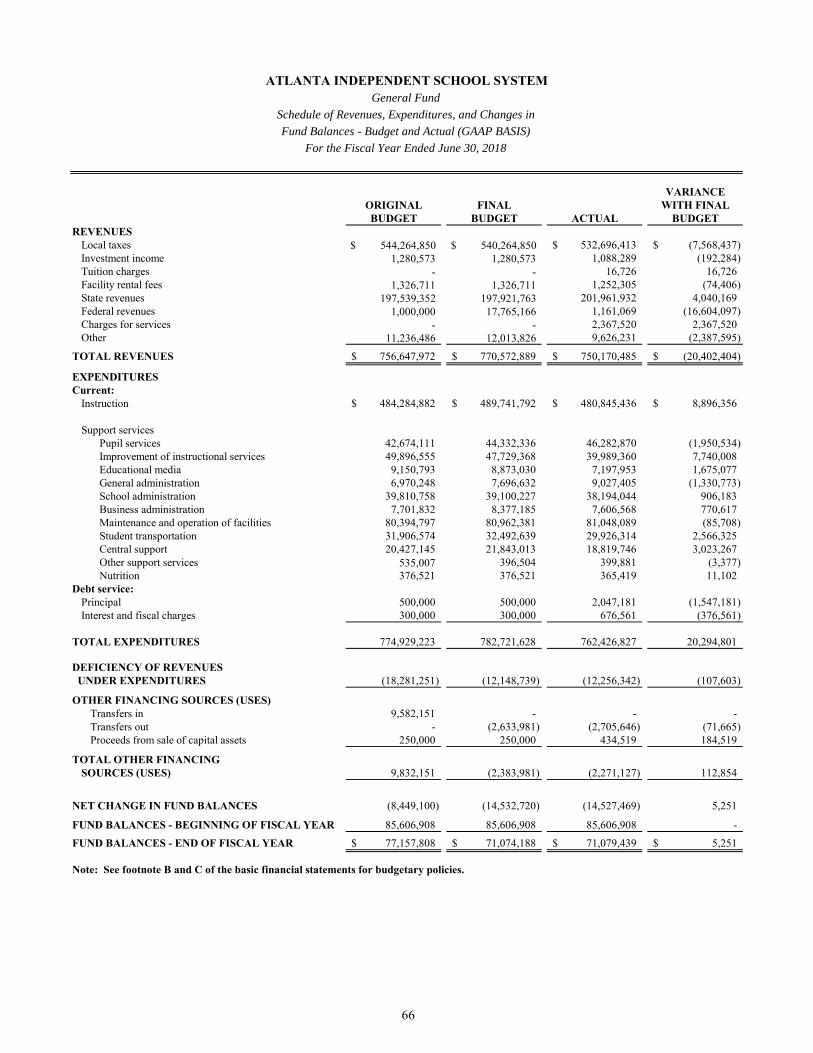
VARIANCEORIGINAL FINAL WITH FINALBUDGET BUDGET ACTUAL BUDGET
REVENUESLocal taxes $ 544,264,850 $ 540,264,850 532,696,413$ (7,568,437)$ Investment income 1,280,573 1,280,573 1,088,289 (192,284) Tuition charges - - 16,726 16,726Facility rental fees 1,326,711 1,326,711 1,252,305 (74,406) State revenues 197,539,352 197,921,763 201,961,932 4,040,169 Federal revenues 1,000,000 17,765,166 1,161,069 (16,604,097) Charges for services - - 2,367,520 2,367,520 Other 11,236,486 12,013,826 9,626,231 (2,387,595)
TOTAL REVENUES 756,647,972$ 770,572,889$ 750,170,485$ (20,402,404)$
EXPENDITURESCurrent:
Instruction 484,284,882$ 489,741,792$ 480,845,436$ 8,896,356$
Support servicesPupil services 42,674,111 44,332,336 46,282,870 (1,950,534) Improvement of instructional services 49,896,555 47,729,368 39,989,360 7,740,008 Educational media 9,150,793 8,873,030 7,197,953 1,675,077 General administration 6,970,248 7,696,632 9,027,405 (1,330,773) School administration 39,810,758 39,100,227 38,194,044 906,183Business administration 7,701,832 8,377,185 7,606,568 770,617Maintenance and operation of facilities 80,394,797 80,962,381 81,048,089 (85,708) Student transportation 31,906,574 32,492,639 29,926,314 2,566,325 Central support 20,427,145 21,843,013 18,819,746 3,023,267 Other support services 535,007 396,504 399,881 (3,377) Nutrition 376,521 376,521 365,419 11,102
Debt service:Principal 500,000 500,000 2,047,181 (1,547,181) Interest and fiscal charges 300,000 300,000 676,561 (376,561)
TOTAL EXPENDITURES 774,929,223 782,721,628 762,426,827 20,294,801
DEFICIENCY OF REVENUES UNDER EXPENDITURES (18,281,251) (12,148,739) (12,256,342) (107,603)
OTHER FINANCING SOURCES (USES)Transfers in 9,582,151 - - -Transfers out - (2,633,981) (2,705,646) (71,665) Proceeds from sale of capital assets 250,000 250,000 434,519 184,519
TOTAL OTHER FINANCINGSOURCES (USES) 9,832,151 (2,383,981) (2,271,127) 112,854
NET CHANGE IN FUND BALANCES (8,449,100) (14,532,720) (14,527,469) 5,251
FUND BALANCES - BEGINNING OF FISCAL YEAR 85,606,908 85,606,908 85,606,908 -
FUND BALANCES - END OF FISCAL YEAR 77,157,808$ 71,074,188$ 71,079,439$ 5,251$
Note: See footnote B and C of the basic financial statements for budgetary policies.
For the Fiscal Year Ended June 30, 2018
ATLANTA INDEPENDENT SCHOOL SYSTEM
Schedule of Revenues, Expenditures, and Changes inFund Balances - Budget and Actual (GAAP BASIS)
General Fund
66


Combining and Individual Fund Statements and Schedules:
Combining Balance Sheet – Nonmajor Governmental Funds
Combining Statement of Revenues, Expenditures, and Changes in Fund Balances – Nonmajor Governmental Funds
Schedules of Revenues, Expenditures, and Changes in Fund Balances – Budget and Actual – All Special Revenue Funds:
Title II Fund
Title VI-B Fund
School Food Service Fund
Lottery Grants Fund
Other Federal Programs Fund
Other Special Projects Fund
Schedules of Revenues, Expenditures, and Changes in Fund Balances – Budget and Actual – Capital Projects Fund
Combining Statement of Changes in Fiduciary Assets and Liabilities – Agency Fund
NONMAJOR GOVERNMENTAL FUNDS
Special Revenue Funds
Special Revenue Funds are used to account for the proceeds of specific revenues that are legally restricted or committed for specific purposes.
The School System’s Special Revenue Funds have been established primarily on the basis of program purpose and include the following funds and primary funding sources:
Title II Fund was established to account for federal grant funds passed through the Georgia Department of Education, for the purpose of improving teacher quality and increasing the number of highly quality teachers, para-professionals, and principals.
Title VI-B Fund was established to account for federal grant funds passed through the Georgia Department of Education, for the purpose of providing special education programs for children in pre-kindergarten through the twelfth grade.
School Food Service Fund was established to account for the operation of the School System’s school nutrition program and includes federal grant funds from the U.S. Department of Agriculture passed through the Georgia Department of Education as well as the charges for services related to meals served at each of the schools.
Lottery Grants Fund was established to account for State of Georgia lottery funds passing through the State of Georgia Department of Education for various programs as established by the state.
Other Federal Programs Fund was established to account for other federal funds for which separate presentation is not considered necessary.
Other Special Projects Fund was established to account for other state and local funds for which separate presentation in not considered necessary.
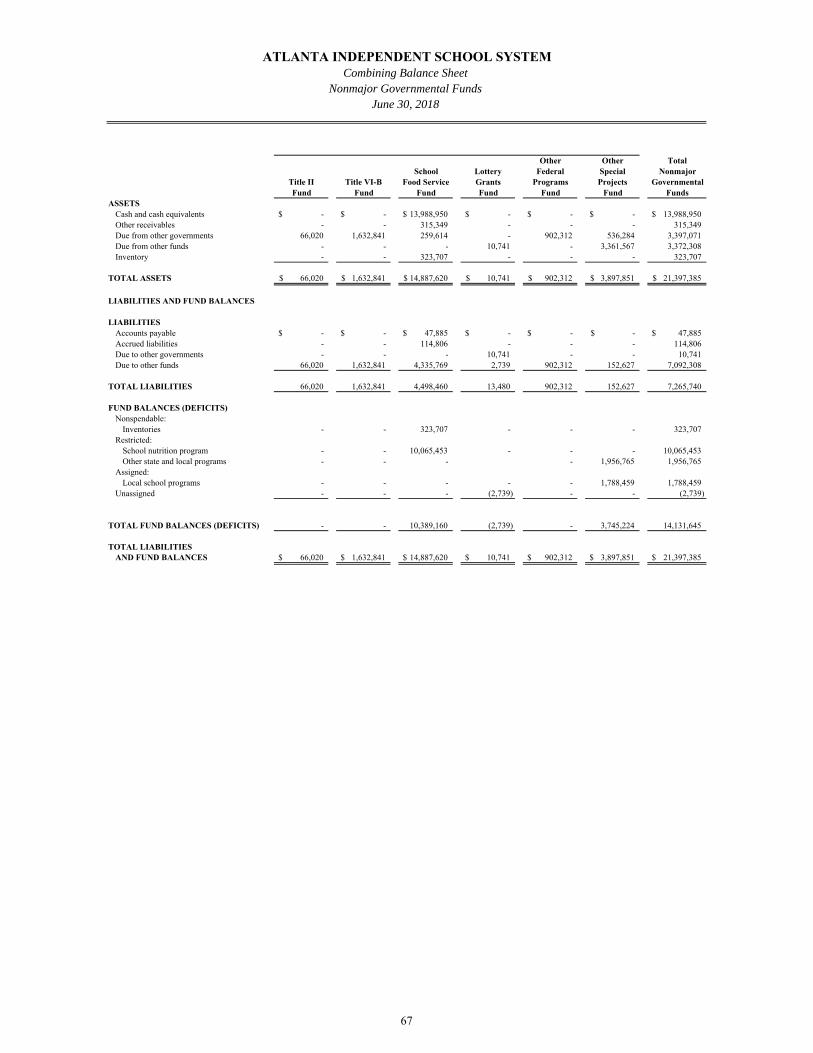
Other Other TotalSchool Lottery Federal Special Nonmajor
Title II Title VI-B Food Service Grants Programs Projects GovernmentalFund Fund Fund Fund Fund Fund Funds
ASSETSCash and cash equivalents -$ -$ 13,988,950$ -$ -$ -$ 13,988,950$ Other receivables - - 315,349 - - - 315,349 Due from other governments 66,020 1,632,841 259,614 - 902,312 536,284 3,397,071 Due from other funds - - - 10,741 - 3,361,567 3,372,308 Inventory - - 323,707 - - - 323,707
TOTAL ASSETS 66,020$ 1,632,841$ 14,887,620$ 10,741$ 902,312$ 3,897,851$ 21,397,385$
LIABILITIES AND FUND BALANCES
LIABILITIESAccounts payable -$ -$ 47,885$ -$ -$ -$ 47,885$ Accrued liabilities - - 114,806 - - - 114,806 Due to other governments - - - 10,741 - - 10,741 Due to other funds 66,020 1,632,841 4,335,769 2,739 902,312 152,627 7,092,308
TOTAL LIABILITIES 66,020 1,632,841 4,498,460 13,480 902,312 152,627 7,265,740
FUND BALANCES (DEFICITS)Nonspendable:
Inventories - - 323,707 - - - 323,707 Restricted:
School nutrition program - - 10,065,453 - - - 10,065,453 Other state and local programs - - - - 1,956,765 1,956,765
Assigned:Local school programs - - - - - 1,788,459 1,788,459
Unassigned - - - (2,739) - - (2,739)
TOTAL FUND BALANCES (DEFICITS) - - 10,389,160 (2,739) - 3,745,224 14,131,645
TOTAL LIABILITIES AND FUND BALANCES 66,020$ 1,632,841$ 14,887,620$ 10,741$ 902,312$ 3,897,851$ 21,397,385$
ATLANTA INDEPENDENT SCHOOL SYSTEM
June 30, 2018Nonmajor Governmental Funds
Combining Balance Sheet
67
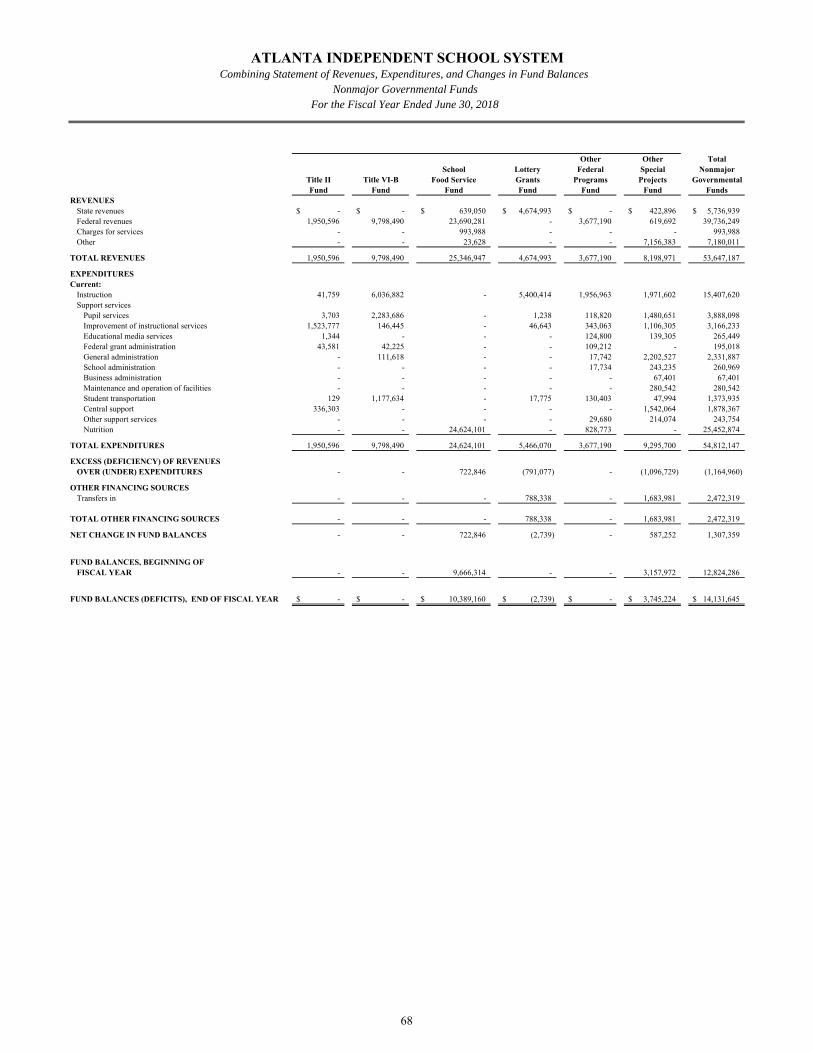
Other Other TotalSchool Lottery Federal Special Nonmajor
Title II Title VI-B Food Service Grants Programs Projects GovernmentalFund Fund Fund Fund Fund Fund Funds
REVENUESState revenues -$ -$ 639,050$ 4,674,993$ -$ 422,896$ 5,736,939$ Federal revenues 1,950,596 9,798,490 23,690,281 - 3,677,190 619,692 39,736,249 Charges for services - - 993,988 - - - 993,988 Other - - 23,628 - - 7,156,383 7,180,011
TOTAL REVENUES 1,950,596 9,798,490 25,346,947 4,674,993 3,677,190 8,198,971 53,647,187
EXPENDITURESCurrent:
Instruction 41,759 6,036,882 - 5,400,414 1,956,963 1,971,602 15,407,620 Support services
Pupil services 3,703 2,283,686 - 1,238 118,820 1,480,651 3,888,098 Improvement of instructional services 1,523,777 146,445 - 46,643 343,063 1,106,305 3,166,233 Educational media services 1,344 - - - 124,800 139,305 265,449 Federal grant administration 43,581 42,225 - - 109,212 - 195,018 General administration - 111,618 - - 17,742 2,202,527 2,331,887 School administration - - - - 17,734 243,235 260,969 Business administration - - - - - 67,401 67,401 Maintenance and operation of facilities - - - - - 280,542 280,542 Student transportation 129 1,177,634 - 17,775 130,403 47,994 1,373,935 Central support 336,303 - - - - 1,542,064 1,878,367 Other support services - - - - 29,680 214,074 243,754 Nutrition - - 24,624,101 - 828,773 - 25,452,874
TOTAL EXPENDITURES 1,950,596 9,798,490 24,624,101 5,466,070 3,677,190 9,295,700 54,812,147
EXCESS (DEFICIENCY) OF REVENUES OVER (UNDER) EXPENDITURES - - 722,846 (791,077) - (1,096,729) (1,164,960)
OTHER FINANCING SOURCES Transfers in - - - 788,338 - 1,683,981 2,472,319
TOTAL OTHER FINANCING SOURCES - - - 788,338 - 1,683,981 2,472,319
NET CHANGE IN FUND BALANCES - - 722,846 (2,739) - 587,252 1,307,359
FUND BALANCES, BEGINNING OFFISCAL YEAR - - 9,666,314 - - 3,157,972 12,824,286
FUND BALANCES (DEFICITS), END OF FISCAL YEAR -$ -$ 10,389,160$ (2,739)$ -$ 3,745,224$ 14,131,645$
ATLANTA INDEPENDENT SCHOOL SYSTEM
For the Fiscal Year Ended June 30, 2018Nonmajor Governmental Funds
Combining Statement of Revenues, Expenditures, and Changes in Fund Balances
68
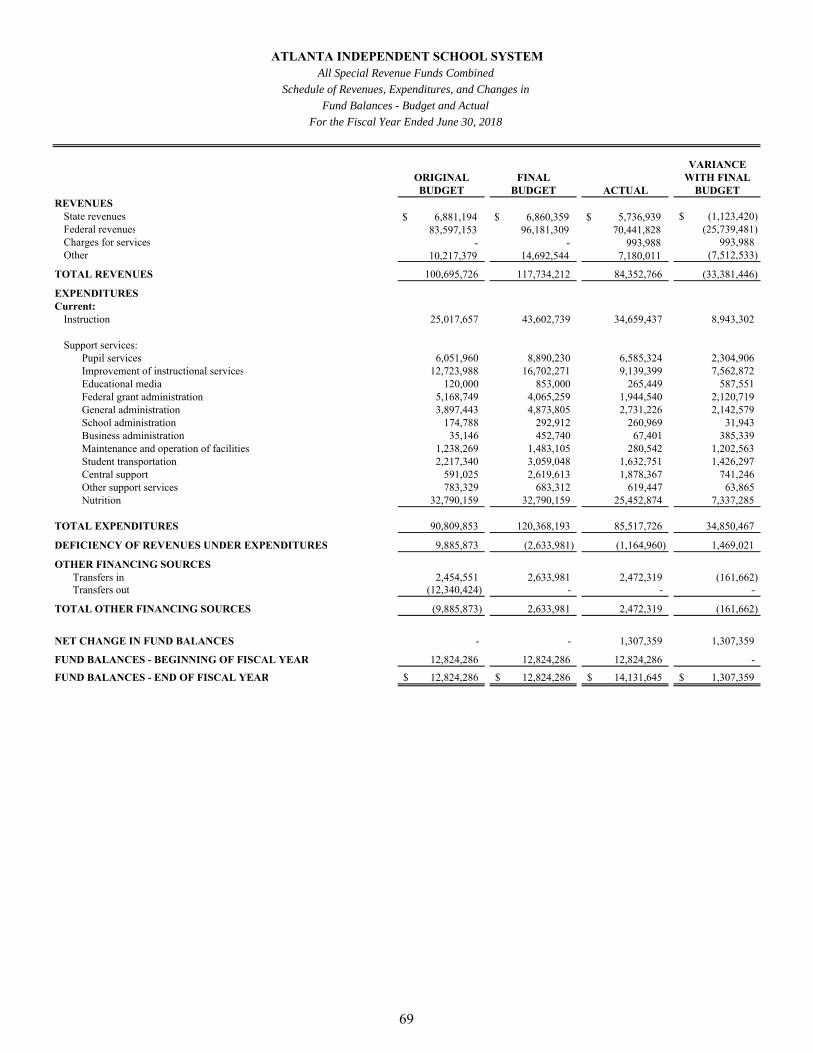
VARIANCEORIGINAL FINAL WITH FINALBUDGET BUDGET ACTUAL BUDGET
REVENUESState revenues $ 6,881,194 $ 6,860,359 $ 5,736,939 (1,123,420)$ Federal revenues 83,597,153 96,181,309 70,441,828 (25,739,481) Charges for services - - 993,988 993,988 Other 10,217,379 14,692,544 7,180,011 (7,512,533)
TOTAL REVENUES 100,695,726 117,734,212 84,352,766 (33,381,446)
EXPENDITURESCurrent:
Instruction 25,017,657 43,602,739 34,659,437 8,943,302
Support services:Pupil services 6,051,960 8,890,230 6,585,324 2,304,906 Improvement of instructional services 12,723,988 16,702,271 9,139,399 7,562,872 Educational media 120,000 853,000 265,449 587,551 Federal grant administration 5,168,749 4,065,259 1,944,540 2,120,719 General administration 3,897,443 4,873,805 2,731,226 2,142,579 School administration 174,788 292,912 260,969 31,943 Business administration 35,146 452,740 67,401 385,339 Maintenance and operation of facilities 1,238,269 1,483,105 280,542 1,202,563 Student transportation 2,217,340 3,059,048 1,632,751 1,426,297 Central support 591,025 2,619,613 1,878,367 741,246 Other support services 783,329 683,312 619,447 63,865 Nutrition 32,790,159 32,790,159 25,452,874 7,337,285
TOTAL EXPENDITURES 90,809,853 120,368,193 85,517,726 34,850,467
DEFICIENCY OF REVENUES UNDER EXPENDITURES 9,885,873 (2,633,981) (1,164,960) 1,469,021
OTHER FINANCING SOURCES Transfers in 2,454,551 2,633,981 2,472,319 (161,662) Transfers out (12,340,424) - - -
TOTAL OTHER FINANCING SOURCES (9,885,873) 2,633,981 2,472,319 (161,662)
NET CHANGE IN FUND BALANCES - - 1,307,359 1,307,359
FUND BALANCES - BEGINNING OF FISCAL YEAR 12,824,286 12,824,286 12,824,286 -
FUND BALANCES - END OF FISCAL YEAR 12,824,286$ 12,824,286$ 14,131,645$ 1,307,359$
ATLANTA INDEPENDENT SCHOOL SYSTEMAll Special Revenue Funds Combined
Schedule of Revenues, Expenditures, and Changes in
Fund Balances - Budget and Actual
For the Fiscal Year Ended June 30, 2018
69
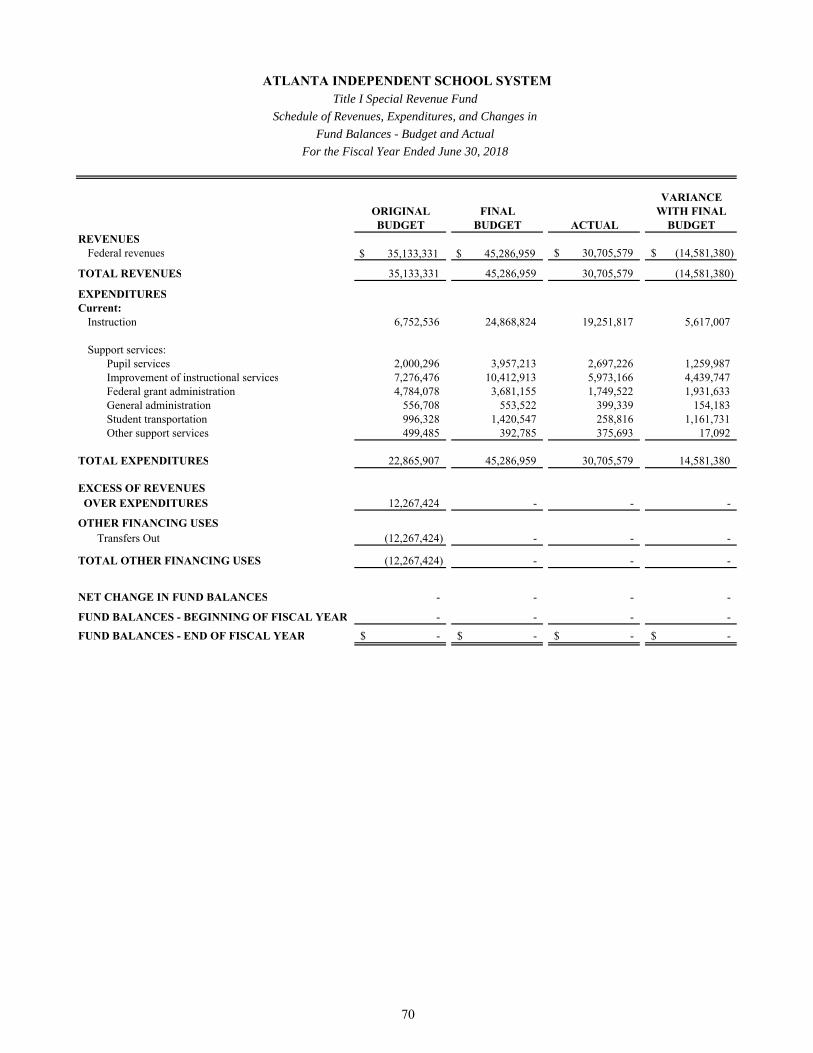
VARIANCEORIGINAL FINAL WITH FINALBUDGET BUDGET ACTUAL BUDGET
REVENUESFederal revenues $ 35,133,331 $ 45,286,959 30,705,579$ (14,581,380)$
TOTAL REVENUES 35,133,331 45,286,959 30,705,579 (14,581,380)
EXPENDITURESCurrent:
Instruction 6,752,536 24,868,824 19,251,817 5,617,007
Support services:Pupil services 2,000,296 3,957,213 2,697,226 1,259,987 Improvement of instructional services 7,276,476 10,412,913 5,973,166 4,439,747 Federal grant administration 4,784,078 3,681,155 1,749,522 1,931,633 General administration 556,708 553,522 399,339 154,183 Student transportation 996,328 1,420,547 258,816 1,161,731 Other support services 499,485 392,785 375,693 17,092
TOTAL EXPENDITURES 22,865,907 45,286,959 30,705,579 14,581,380
EXCESS OF REVENUES OVER EXPENDITURES 12,267,424 - - -
OTHER FINANCING USESTransfers Out (12,267,424) - - -
TOTAL OTHER FINANCING USES (12,267,424) - - -
NET CHANGE IN FUND BALANCES - - - -
FUND BALANCES - BEGINNING OF FISCAL YEAR - - - -
FUND BALANCES - END OF FISCAL YEAR -$ -$ -$ -$
ATLANTA INDEPENDENT SCHOOL SYSTEMTitle I Special Revenue Fund
Schedule of Revenues, Expenditures, and Changes in
Fund Balances - Budget and Actual
For the Fiscal Year Ended June 30, 2018
70
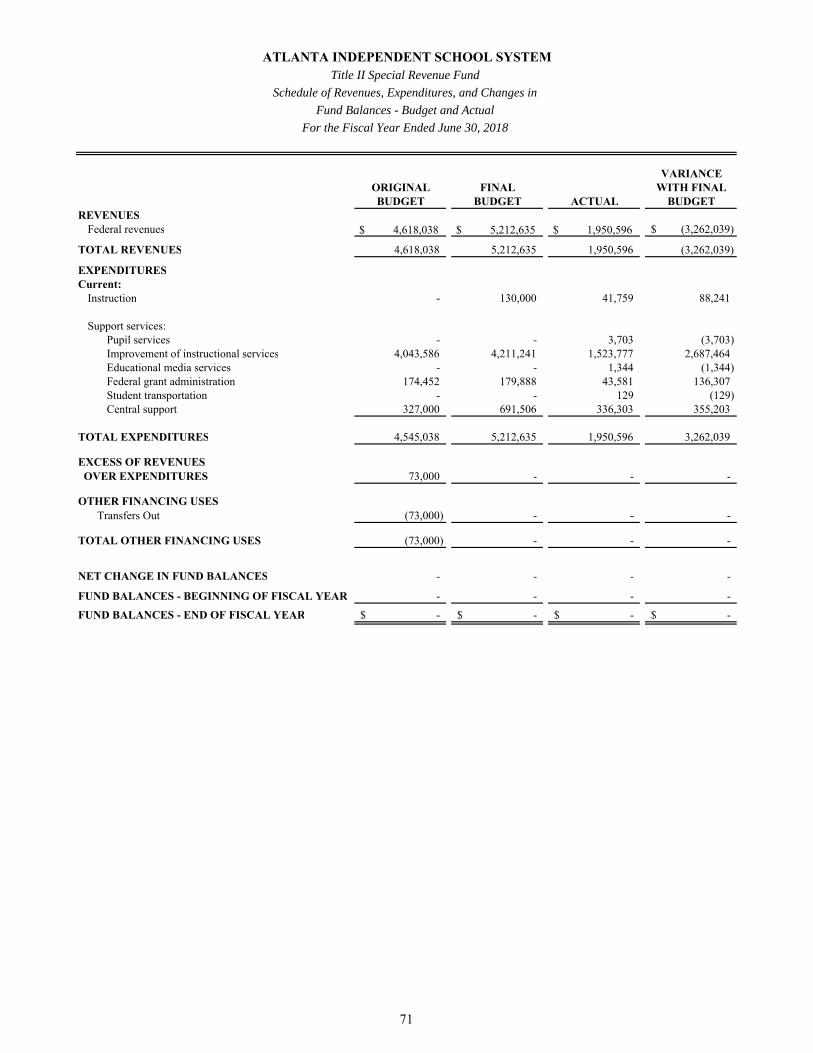
VARIANCEORIGINAL FINAL WITH FINALBUDGET BUDGET ACTUAL BUDGET
REVENUESFederal revenues $ 4,618,038 $ 5,212,635 $ 1,950,596 (3,262,039)$
TOTAL REVENUES 4,618,038 5,212,635 1,950,596 (3,262,039)
EXPENDITURESCurrent:
Instruction - 130,000 41,759 88,241
Support services:Pupil services - - 3,703 (3,703) Improvement of instructional services 4,043,586 4,211,241 1,523,777 2,687,464 Educational media services - - 1,344 (1,344) Federal grant administration 174,452 179,888 43,581 136,307 Student transportation - - 129 (129) Central support 327,000 691,506 336,303 355,203
TOTAL EXPENDITURES 4,545,038 5,212,635 1,950,596 3,262,039
EXCESS OF REVENUES OVER EXPENDITURES 73,000 - - -
OTHER FINANCING USESTransfers Out (73,000) - - -
TOTAL OTHER FINANCING USES (73,000) - - -
NET CHANGE IN FUND BALANCES - - - -
FUND BALANCES - BEGINNING OF FISCAL YEAR - - - -
FUND BALANCES - END OF FISCAL YEAR -$ -$ -$ -$
ATLANTA INDEPENDENT SCHOOL SYSTEMTitle II Special Revenue Fund
Schedule of Revenues, Expenditures, and Changes in
Fund Balances - Budget and Actual
For the Fiscal Year Ended June 30, 2018
71
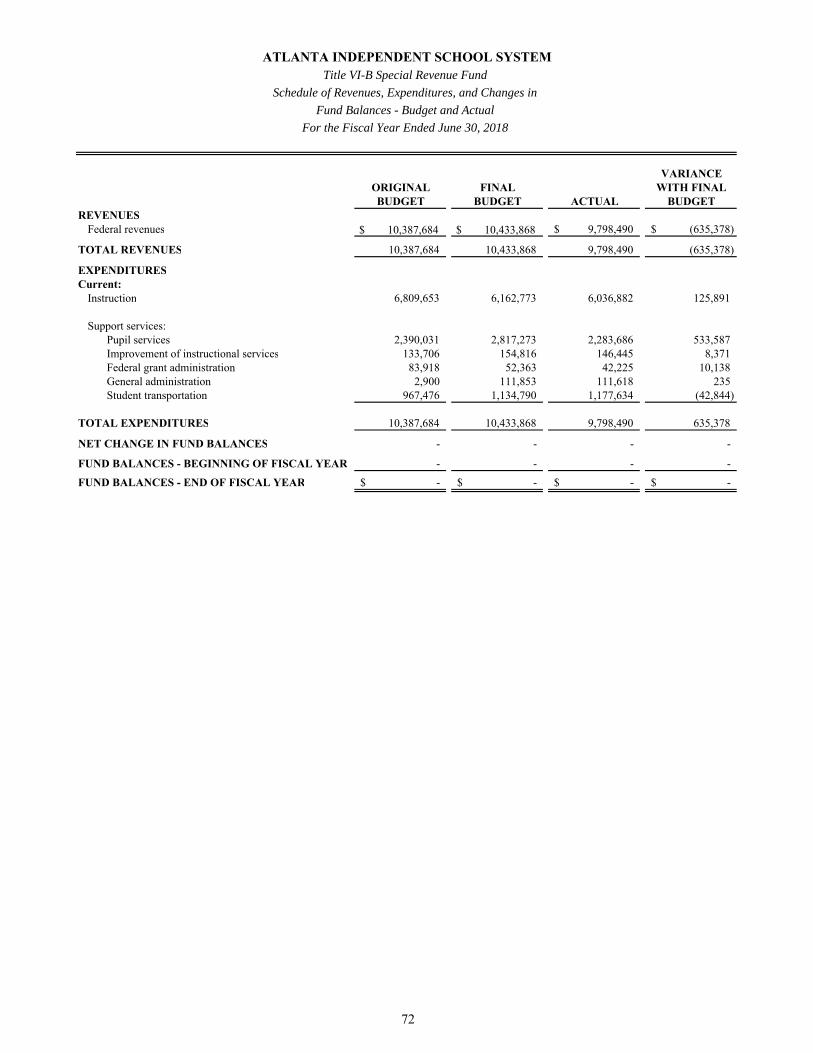
VARIANCEORIGINAL FINAL WITH FINALBUDGET BUDGET ACTUAL BUDGET
REVENUESFederal revenues $ 10,387,684 $ 10,433,868 9,798,490$ (635,378)$
TOTAL REVENUES 10,387,684 10,433,868 9,798,490 (635,378)
EXPENDITURESCurrent:
Instruction 6,809,653 6,162,773 6,036,882 125,891
Support services:Pupil services 2,390,031 2,817,273 2,283,686 533,587 Improvement of instructional services 133,706 154,816 146,445 8,371 Federal grant administration 83,918 52,363 42,225 10,138 General administration 2,900 111,853 111,618 235 Student transportation 967,476 1,134,790 1,177,634 (42,844)
TOTAL EXPENDITURES 10,387,684 10,433,868 9,798,490 635,378
NET CHANGE IN FUND BALANCES - - - -
FUND BALANCES - BEGINNING OF FISCAL YEAR - - - -
FUND BALANCES - END OF FISCAL YEAR -$ -$ -$ -$
ATLANTA INDEPENDENT SCHOOL SYSTEMTitle VI-B Special Revenue Fund
Schedule of Revenues, Expenditures, and Changes in
Fund Balances - Budget and Actual
For the Fiscal Year Ended June 30, 2018
72
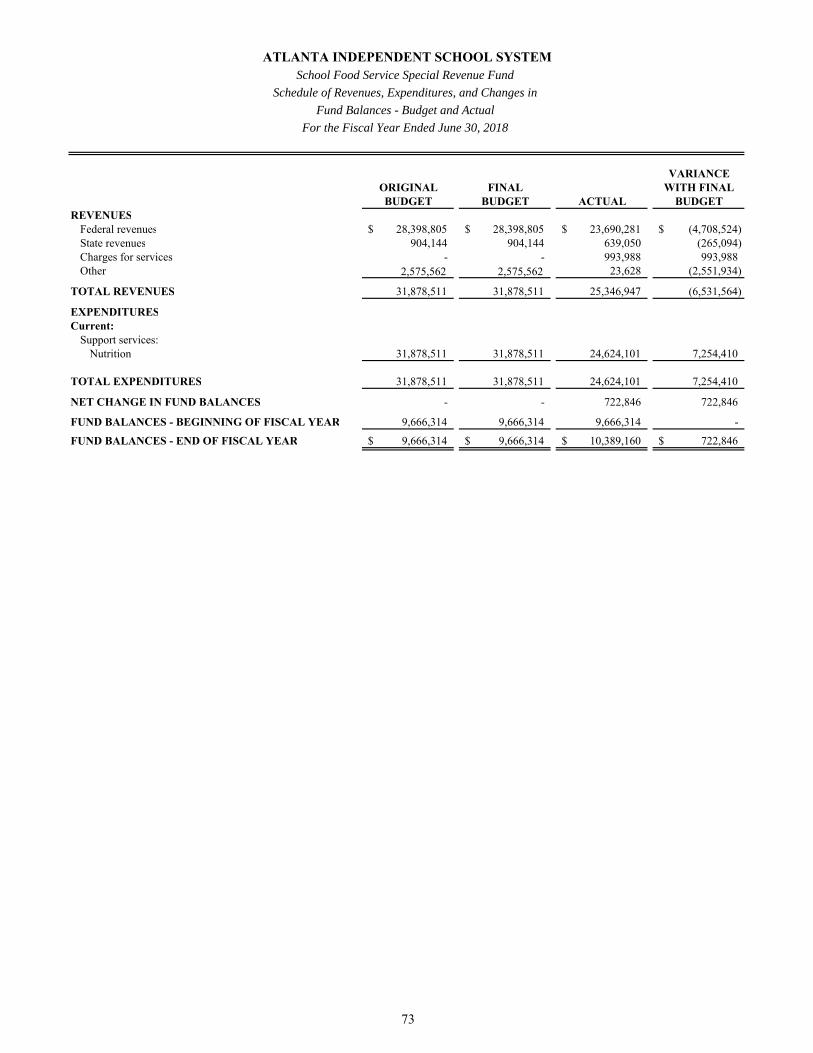
VARIANCEORIGINAL FINAL WITH FINALBUDGET BUDGET ACTUAL BUDGET
REVENUESFederal revenues 28,398,805$ 28,398,805$ 23,690,281$ (4,708,524)$ State revenues 904,144 904,144 639,050 (265,094) Charges for services - - 993,988 993,988 Other 2,575,562 2,575,562 23,628 (2,551,934)
TOTAL REVENUES 31,878,511 31,878,511 25,346,947 (6,531,564)
EXPENDITURESCurrent:
Support services:Nutrition 31,878,511 31,878,511 24,624,101 7,254,410
TOTAL EXPENDITURES 31,878,511 31,878,511 24,624,101 7,254,410
NET CHANGE IN FUND BALANCES - - 722,846 722,846
FUND BALANCES - BEGINNING OF FISCAL YEAR 9,666,314 9,666,314 9,666,314 -
FUND BALANCES - END OF FISCAL YEAR 9,666,314$ 9,666,314$ 10,389,160$ 722,846$
ATLANTA INDEPENDENT SCHOOL SYSTEMSchool Food Service Special Revenue Fund
Schedule of Revenues, Expenditures, and Changes in
Fund Balances - Budget and Actual
For the Fiscal Year Ended June 30, 2018
73
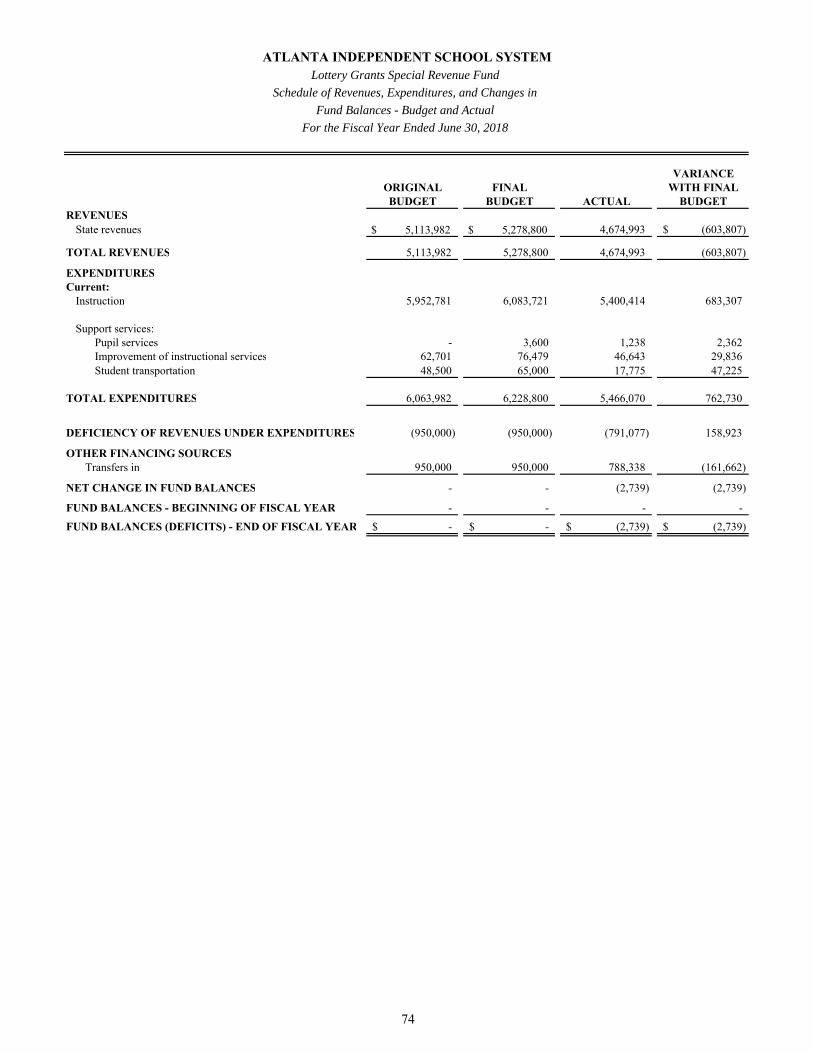
VARIANCEORIGINAL FINAL WITH FINALBUDGET BUDGET ACTUAL BUDGET
REVENUESState revenues $ 5,113,982 $ 5,278,800 4,674,993 (603,807)$
TOTAL REVENUES 5,113,982 5,278,800 4,674,993 (603,807)
EXPENDITURESCurrent:
Instruction 5,952,781 6,083,721 5,400,414 683,307
Support services:Pupil services - 3,600 1,238 2,362 Improvement of instructional services 62,701 76,479 46,643 29,836 Student transportation 48,500 65,000 17,775 47,225
TOTAL EXPENDITURES 6,063,982 6,228,800 5,466,070 762,730
DEFICIENCY OF REVENUES UNDER EXPENDITURES (950,000) (950,000) (791,077) 158,923
OTHER FINANCING SOURCES Transfers in 950,000 950,000 788,338 (161,662)
NET CHANGE IN FUND BALANCES - - (2,739) (2,739)
FUND BALANCES - BEGINNING OF FISCAL YEAR - - - -
FUND BALANCES (DEFICITS) - END OF FISCAL YEAR -$ -$ (2,739)$ (2,739)$
ATLANTA INDEPENDENT SCHOOL SYSTEMLottery Grants Special Revenue Fund
Schedule of Revenues, Expenditures, and Changes in
Fund Balances - Budget and Actual
For the Fiscal Year Ended June 30, 2018
74
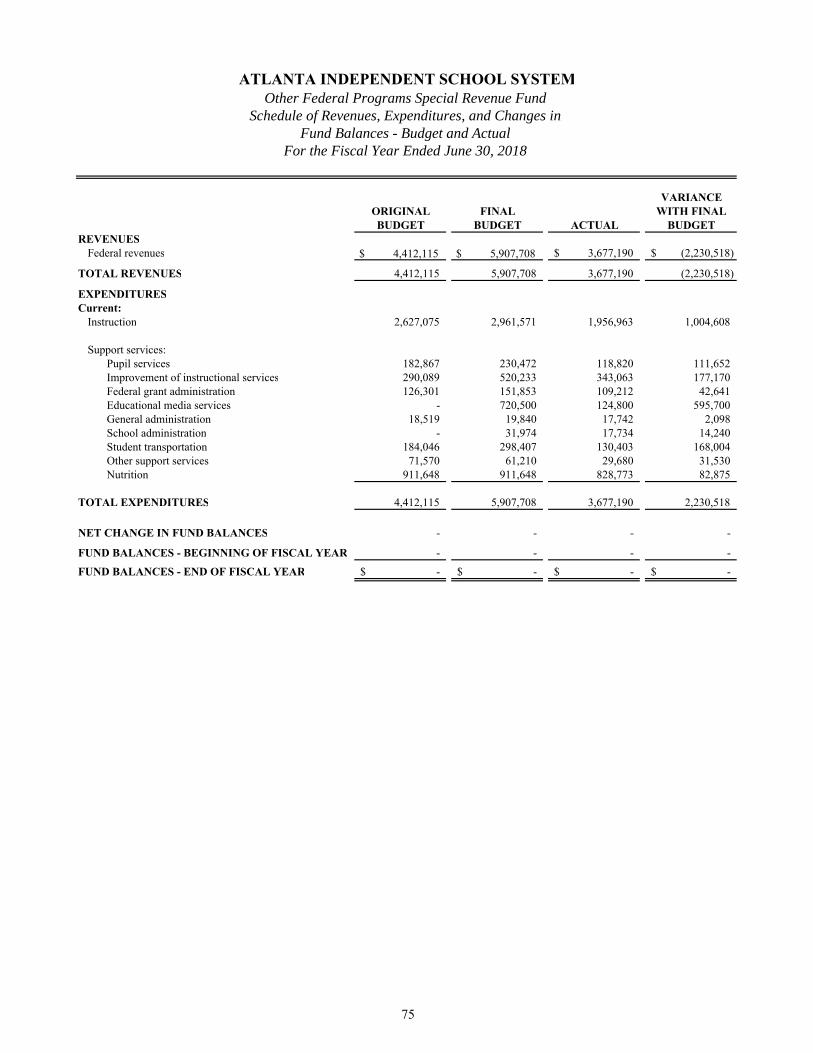
VARIANCEORIGINAL FINAL WITH FINALBUDGET BUDGET ACTUAL BUDGET
REVENUESFederal revenues $ 4,412,115 $ 5,907,708 3,677,190$ (2,230,518)$
TOTAL REVENUES 4,412,115 5,907,708 3,677,190 (2,230,518)
EXPENDITURESCurrent:
Instruction 2,627,075 2,961,571 1,956,963 1,004,608
Support services:Pupil services 182,867 230,472 118,820 111,652 Improvement of instructional services 290,089 520,233 343,063 177,170 Federal grant administration 126,301 151,853 109,212 42,641 Educational media services - 720,500 124,800 595,700 General administration 18,519 19,840 17,742 2,098 School administration - 31,974 17,734 14,240 Student transportation 184,046 298,407 130,403 168,004 Other support services 71,570 61,210 29,680 31,530 Nutrition 911,648 911,648 828,773 82,875
TOTAL EXPENDITURES 4,412,115 5,907,708 3,677,190 2,230,518
NET CHANGE IN FUND BALANCES - - - -
FUND BALANCES - BEGINNING OF FISCAL YEAR - - - -
FUND BALANCES - END OF FISCAL YEAR -$ -$ -$ -$
ATLANTA INDEPENDENT SCHOOL SYSTEMOther Federal Programs Special Revenue Fund
Schedule of Revenues, Expenditures, and Changes inFund Balances - Budget and Actual
For the Fiscal Year Ended June 30, 2018
75

VARIANCEORIGINAL FINAL WITH FINALBUDGET BUDGET ACTUAL BUDGET
REVENUESState revenues $ 863,068 677,415$ $ 422,896 (254,519)$ Federal revenues 647,180 941,334 619,692 (321,642) Other 7,641,817 12,116,982 7,156,383 (4,960,599)
TOTAL REVENUES 9,152,065 13,735,731 8,198,971 (5,536,760)
EXPENDITURESCurrent:
Instruction 2,875,612 3,395,850 1,971,602 1,424,248
Support services:Pupil services 1,478,766 1,881,672 1,480,651 401,021 Improvement of instructional services 917,430 1,326,589 1,106,305 220,284 Educational media services 120,000 132,500 139,305 (6,805) General administration 3,319,316 4,188,590 2,202,527 1,986,063 School administration 174,788 260,938 243,235 17,703 Business administration 35,146 452,740 67,401 385,339 Maintenance and operation of facilities 1,238,269 1,483,105 280,542 1,202,563 Student transportation 20,990 140,304 47,994 92,310 Central support 264,025 1,928,107 1,542,064 386,043 Other support services 212,274 229,317 214,074 15,243
TOTAL EXPENDITURES 10,656,616 15,419,712 9,295,700 6,124,012
DEFICIENCY OF REVENUES UNDER EXPENDITURES (1,504,551) (1,683,981) (1,096,729) 587,252
OTHER FINANCING SOURCES Transfers in 1,504,551 1,683,981 1,683,981 -
TOTAL OTHER FINANCING SOURCES 1,504,551 1,683,981 1,683,981 -
NET CHANGE IN FUND BALANCES - - 587,252 587,252
FUND BALANCES - BEGINNING OF FISCAL YEAR 3,157,972 3,157,972 3,157,972 -
FUND BALANCES - END OF FISCAL YEAR 3,157,972$ 3,157,972$ 3,745,224$ 587,252$
ATLANTA INDEPENDENT SCHOOL SYSTEMOther Special Projects Special Revenue Fund
Schedule of Revenues, Expenditures, and Changes inFund Balances - Budget and Actual
For the Fiscal Year Ended June 30, 2018
76
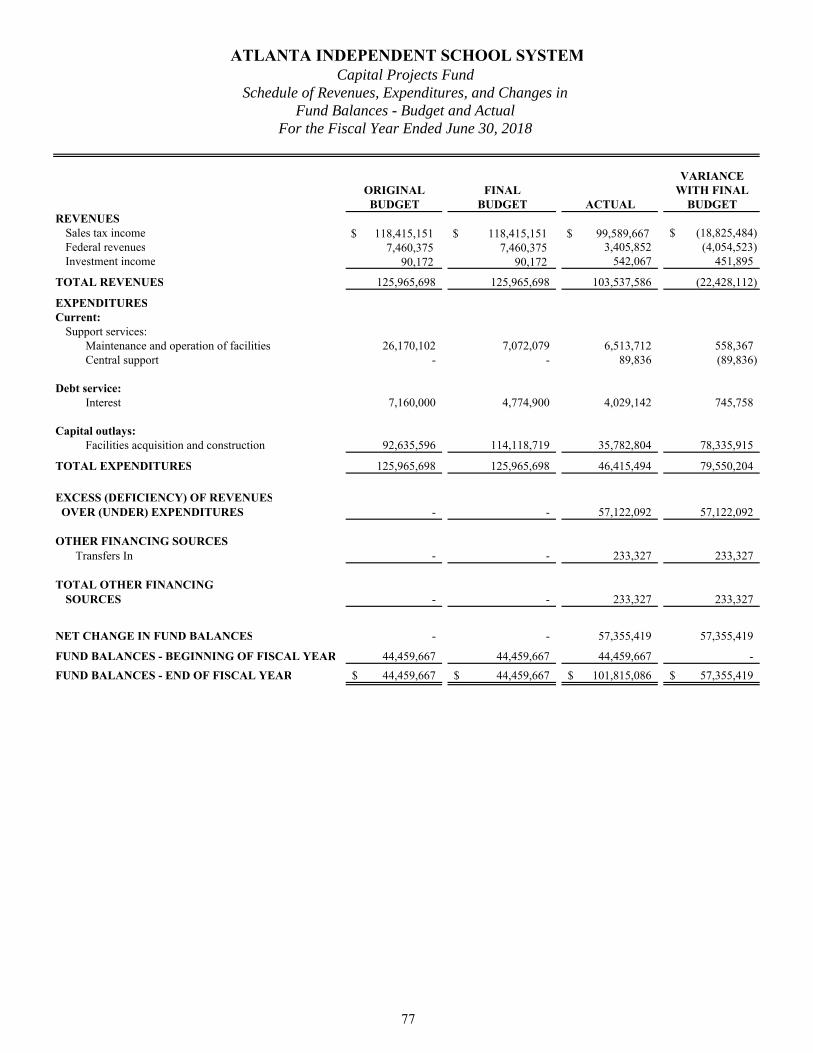
VARIANCEORIGINAL FINAL WITH FINALBUDGET BUDGET ACTUAL BUDGET
REVENUESSales tax income $ 118,415,151 $ 118,415,151 $ 99,589,667 (18,825,484)$ Federal revenues 7,460,375 7,460,375 3,405,852 (4,054,523) Investment income 90,172 90,172 542,067 451,895
TOTAL REVENUES 125,965,698 125,965,698 103,537,586 (22,428,112)
EXPENDITURESCurrent:
Support services:Maintenance and operation of facilities 26,170,102 7,072,079 6,513,712 558,367 Central support - - 89,836 (89,836)
Debt service:Interest 7,160,000 4,774,900 4,029,142 745,758
Capital outlays:Facilities acquisition and construction 92,635,596 114,118,719 35,782,804 78,335,915
TOTAL EXPENDITURES 125,965,698 125,965,698 46,415,494 79,550,204
EXCESS (DEFICIENCY) OF REVENUES OVER (UNDER) EXPENDITURES - - 57,122,092 57,122,092
OTHER FINANCING SOURCES Transfers In - - 233,327 233,327
TOTAL OTHER FINANCINGSOURCES - - 233,327 233,327
NET CHANGE IN FUND BALANCES - - 57,355,419 57,355,419
FUND BALANCES - BEGINNING OF FISCAL YEAR 44,459,667 44,459,667 44,459,667 -
FUND BALANCES - END OF FISCAL YEAR 44,459,667$ 44,459,667$ 101,815,086$ 57,355,419$
ATLANTA INDEPENDENT SCHOOL SYSTEMCapital Projects Fund
Schedule of Revenues, Expenditures, and Changes inFund Balances - Budget and Actual
For the Fiscal Year Ended June 30, 2018
77
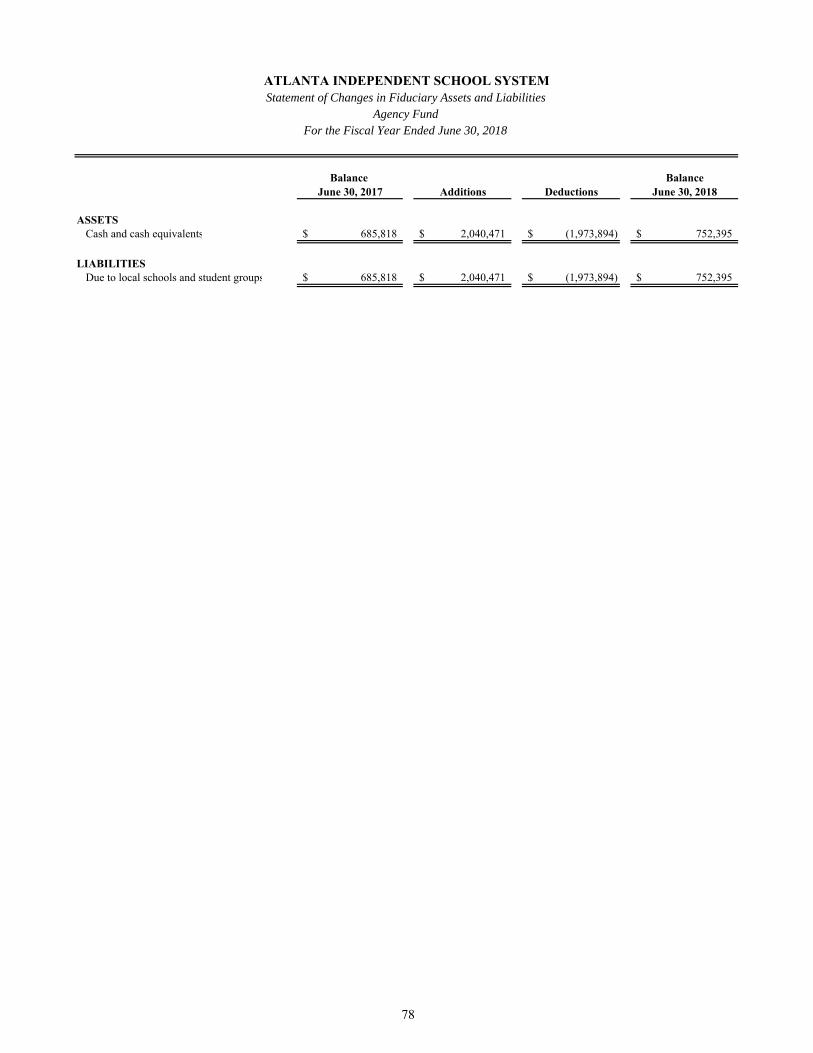
Balance BalanceJune 30, 2017 Additions Deductions June 30, 2018
ASSETSCash and cash equivalents 685,818$ 2,040,471$ (1,973,894)$ 752,395$
LIABILITIESDue to local schools and student groups 685,818$ 2,040,471$ (1,973,894)$ 752,395$
ATLANTA INDEPENDENT SCHOOL SYSTEM
For the Fiscal Year Ended June 30, 2018Agency Fund
Statement of Changes in Fiduciary Assets and Liabilities
78
Quality Basic Education Programs – Program Expenditures
General Fund – Quality Basic Education Project (QBE) – Schedule of Allotments and Expenditures by Program
Lottery Programs – Schedule of Expenditures by Object
Schedule of Approved Local Options Sales Tax Projects
Schedule of State Revenues

79
Atlanta Independent School System Quality Basic Education Programs -
Program Expenditures For the Fiscal Year Ended June 30, 2018
The Official Code of Georgia Annotated Section 20-2-172 (a) Expenditure Controls for fiscal years 2007 and 2008 state:
For each program identified in Code Section 20-2-161, each local School System shall spend 100 percent of funds designated for direct instructional costs on the direct instructional costs of such program on one or more of the programs identified in Code Section 20-2-161 at the system level, with no requirement that the School System spend any specific portion of such funds at the site where such funds were earned.
The following pages are presented for purposes of additional analysis and reflect overall minimum expenditure requirements compared to overall program expenditures made by the School System as described above and also reflect minimum program expenditure requirements compared to actual expenditures made by the School System on a program basis.
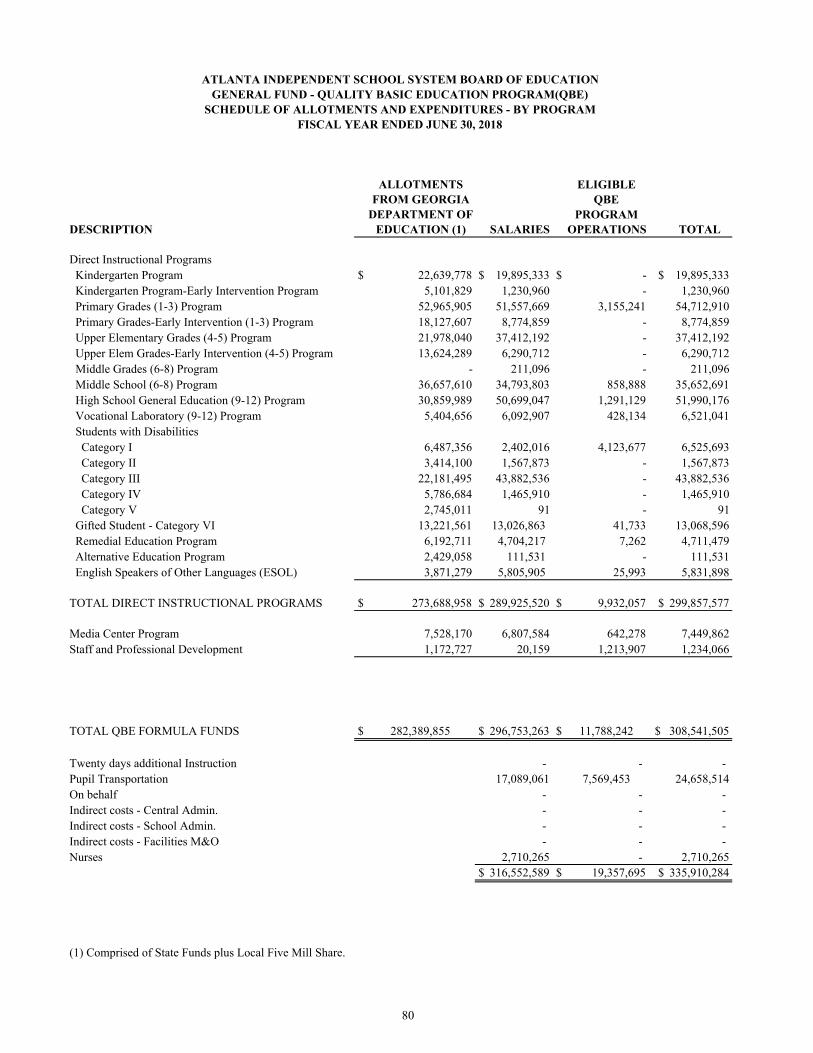
ALLOTMENTSFROM GEORGIA
DEPARTMENT OFDESCRIPTION EDUCATION (1) SALARIES OPERATIONS TOTAL
Direct Instructional Programs Kindergarten Program $ 22,639,778 $ 19,895,333 $ - $ 19,895,333 Kindergarten Program-Early Intervention Program 5,101,829 1,230,960 - 1,230,960 Primary Grades (1-3) Program 52,965,905 51,557,669 3,155,241 54,712,910 Primary Grades-Early Intervention (1-3) Program 18,127,607 8,774,859 - 8,774,859 Upper Elementary Grades (4-5) Program 21,978,040 37,412,192 - 37,412,192 Upper Elem Grades-Early Intervention (4-5) Program 13,624,289 6,290,712 - 6,290,712 Middle Grades (6-8) Program - 211,096 - 211,096 Middle School (6-8) Program 36,657,610 34,793,803 858,888 35,652,691 High School General Education (9-12) Program 30,859,989 50,699,047 1,291,129 51,990,176 Vocational Laboratory (9-12) Program 5,404,656 6,092,907 428,134 6,521,041 Students with Disabilities Category I 6,487,356 2,402,016 4,123,677 6,525,693 Category II 3,414,100 1,567,873 - 1,567,873 Category III 22,181,495 43,882,536 - 43,882,536 Category IV 5,786,684 1,465,910 - 1,465,910 Category V 2,745,011 91 - 91 Gifted Student - Category VI 13,221,561 13,026,863 41,733 13,068,596 Remedial Education Program 6,192,711 4,704,217 7,262 4,711,479 Alternative Education Program 2,429,058 111,531 - 111,531 English Speakers of Other Languages (ESOL) 3,871,279 5,805,905 25,993 5,831,898
TOTAL DIRECT INSTRUCTIONAL PROGRAMS $ 273,688,958 $ 289,925,520 $ 9,932,057 $ 299,857,577
Media Center Program 7,528,170 6,807,584 642,278 7,449,862Staff and Professional Development 1,172,727 20,159 1,213,907 1,234,066
TOTAL QBE FORMULA FUNDS $ 282,389,855 $ 296,753,263 $ 11,788,242 $ 308,541,505
Twenty days additional Instruction - - -Pupil Transportation 17,089,061 7,569,453 24,658,514On behalf - - -Indirect costs - Central Admin. - - -Indirect costs - School Admin. - - -Indirect costs - Facilities M&O - - -Nurses 2,710,265 - 2,710,265
$ 316,552,589 $ 19,357,695 $ 335,910,284
(1) Comprised of State Funds plus Local Five Mill Share.
ATLANTA INDEPENDENT SCHOOL SYSTEM BOARD OF EDUCATIONGENERAL FUND - QUALITY BASIC EDUCATION PROGRAM(QBE)
SCHEDULE OF ALLOTMENTS AND EXPENDITURES - BY PROGRAMFISCAL YEAR ENDED JUNE 30, 2018
ELIGIBLE QBE
PROGRAM
80
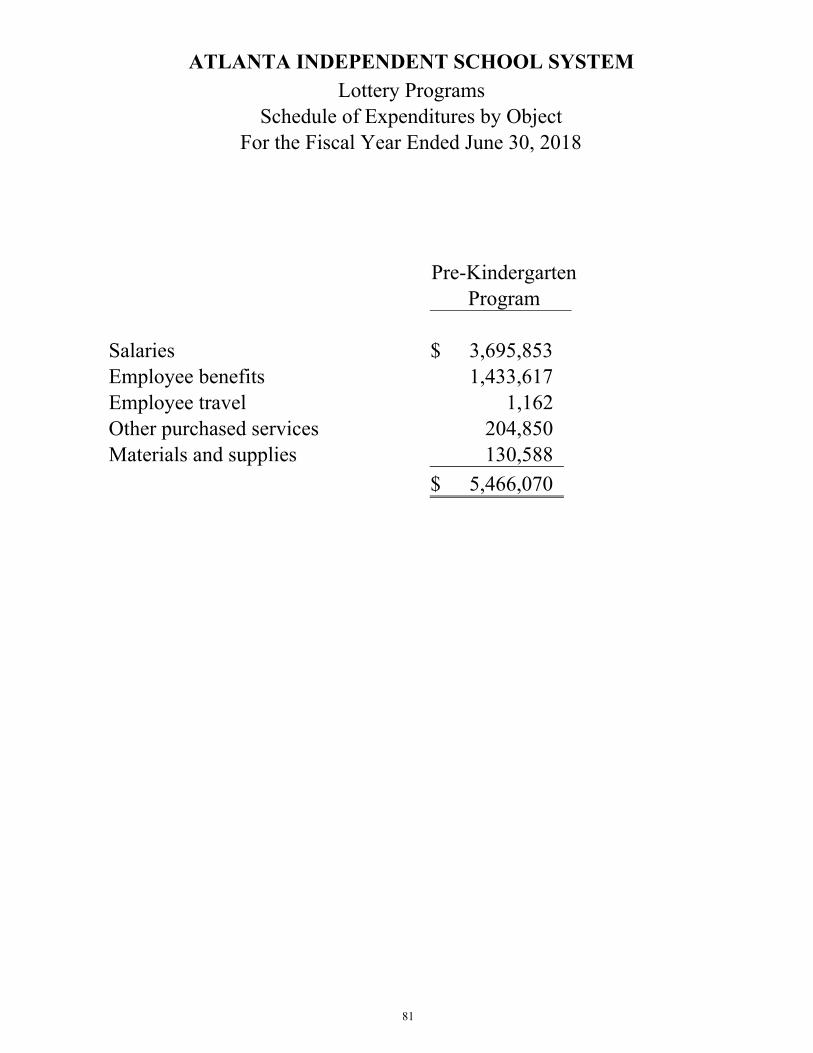
Pre-KindergartenProgram
Salaries $ 3,695,853 Employee benefits 1,433,617 Employee travel 1,162 Other purchased services 204,850 Materials and supplies 130,588
$ 5,466,070
ATLANTA INDEPENDENT SCHOOL SYSTEMLottery Programs
Schedule of Expenditures by ObjectFor the Fiscal Year Ended June 30, 2018
81
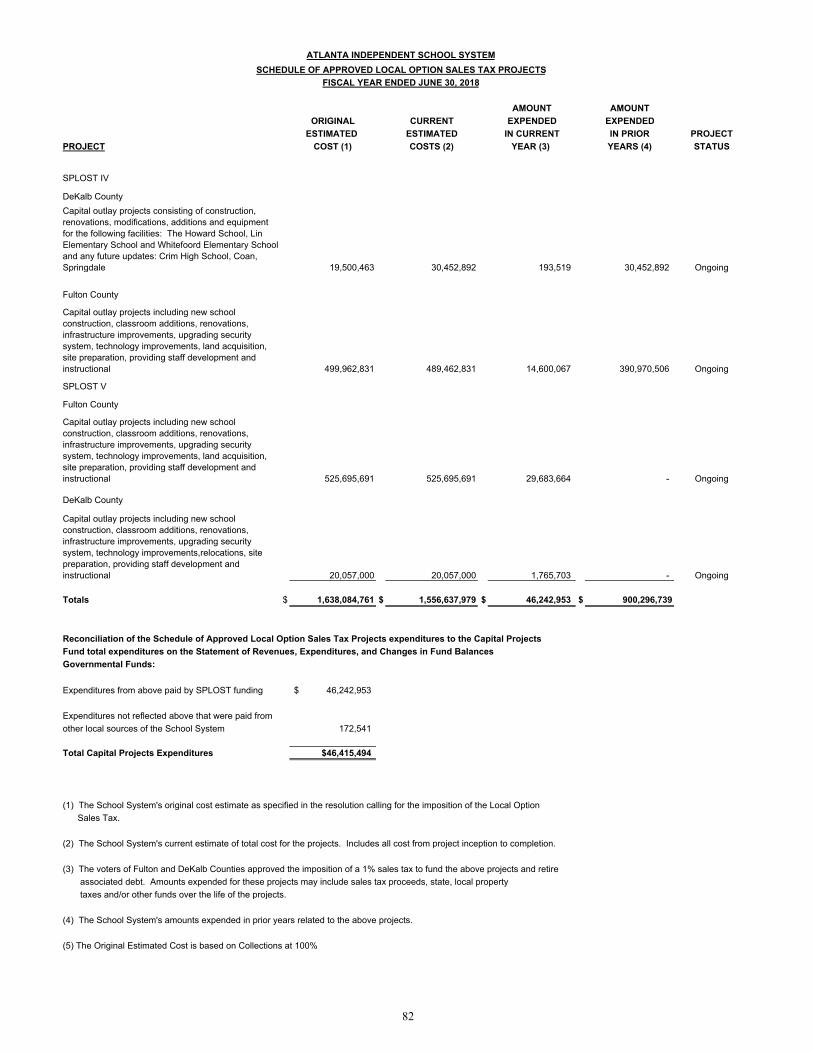
AMOUNT AMOUNTORIGINAL CURRENT EXPENDED EXPENDED
ESTIMATED ESTIMATED IN CURRENT IN PRIOR PROJECTPROJECT COST (1) COSTS (2) YEAR (3) YEARS (4) STATUS
SPLOST IV
DeKalb CountyCapital outlay projects consisting of construction, renovations, modifications, additions and equipment for the following facilities: The Howard School, Lin Elementary School and Whitefoord Elementary School and any future updates: Crim High School, Coan, Springdale 19,500,463 30,452,892 193,519 30,452,892 Ongoing
Fulton County
Capital outlay projects including new school construction, classroom additions, renovations, infrastructure improvements, upgrading security system, technology improvements, land acquisition, site preparation, providing staff development and instructional 499,962,831 489,462,831 14,600,067 390,970,506 Ongoing
SPLOST V
Fulton County
Capital outlay projects including new school construction, classroom additions, renovations, infrastructure improvements, upgrading security system, technology improvements, land acquisition, site preparation, providing staff development and instructional 525,695,691 525,695,691 29,683,664 - Ongoing
DeKalb County
Capital outlay projects including new school construction, classroom additions, renovations, infrastructure improvements, upgrading security system, technology improvements,relocations, site preparation, providing staff development and instructional 20,057,000 20,057,000 1,765,703 - Ongoing
Totals $ 1,638,084,761 $ 1,556,637,979 $ 46,242,953 $ 900,296,739
Reconciliation of the Schedule of Approved Local Option Sales Tax Projects expenditures to the Capital ProjectsFund total expenditures on the Statement of Revenues, Expenditures, and Changes in Fund BalancesGovernmental Funds:
Expenditures from above paid by SPLOST funding 46,242,953$
Expenditures not reflected above that were paid from other local sources of the School System 172,541
Total Capital Projects Expenditures $46,415,494
(1) The School System's original cost estimate as specified in the resolution calling for the imposition of the Local OptionSales Tax.
(2) The School System's current estimate of total cost for the projects. Includes all cost from project inception to completion.
(3) The voters of Fulton and DeKalb Counties approved the imposition of a 1% sales tax to fund the above projects and retireassociated debt. Amounts expended for these projects may include sales tax proceeds, state, local propertytaxes and/or other funds over the life of the projects.
(4) The School System's amounts expended in prior years related to the above projects.
(5) The Original Estimated Cost is based on Collections at 100%
ATLANTA INDEPENDENT SCHOOL SYSTEMSCHEDULE OF APPROVED LOCAL OPTION SALES TAX PROJECTS
FISCAL YEAR ENDED JUNE 30, 2018
82
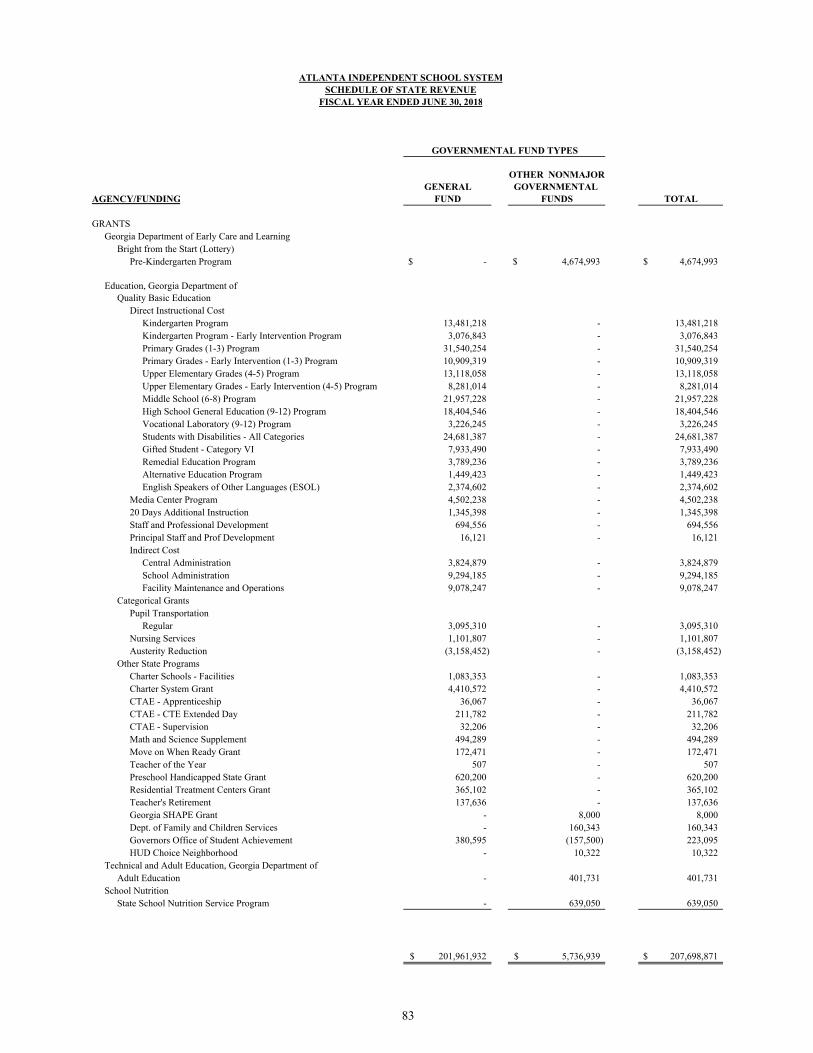
ATLANTA INDEPENDENT SCHOOL SYSTEMSCHEDULE OF STATE REVENUE
FISCAL YEAR ENDED JUNE 30, 2018
OTHER NONMAJORGENERAL GOVERNMENTAL
AGENCY/FUNDING FUND FUNDS TOTAL
GRANTSGeorgia Department of Early Care and Learning
Bright from the Start (Lottery)Pre-Kindergarten Program -$ 4,674,993$ 4,674,993$
Education, Georgia Department ofQuality Basic Education
Direct Instructional CostKindergarten Program 13,481,218 - 13,481,218 Kindergarten Program - Early Intervention Program 3,076,843 - 3,076,843 Primary Grades (1-3) Program 31,540,254 - 31,540,254 Primary Grades - Early Intervention (1-3) Program 10,909,319 - 10,909,319 Upper Elementary Grades (4-5) Program 13,118,058 - 13,118,058 Upper Elementary Grades - Early Intervention (4-5) Program 8,281,014 - 8,281,014 Middle School (6-8) Program 21,957,228 - 21,957,228 High School General Education (9-12) Program 18,404,546 - 18,404,546 Vocational Laboratory (9-12) Program 3,226,245 - 3,226,245 Students with Disabilities - All Categories 24,681,387 - 24,681,387 Gifted Student - Category VI 7,933,490 - 7,933,490 Remedial Education Program 3,789,236 - 3,789,236 Alternative Education Program 1,449,423 - 1,449,423 English Speakers of Other Languages (ESOL) 2,374,602 - 2,374,602
Media Center Program 4,502,238 - 4,502,238 20 Days Additional Instruction 1,345,398 - 1,345,398 Staff and Professional Development 694,556 - 694,556 Principal Staff and Prof Development 16,121 - 16,121 Indirect Cost
Central Administration 3,824,879 - 3,824,879 School Administration 9,294,185 - 9,294,185 Facility Maintenance and Operations 9,078,247 - 9,078,247
Categorical GrantsPupil Transportation
Regular 3,095,310 - 3,095,310 Nursing Services 1,101,807 - 1,101,807 Austerity Reduction (3,158,452) - (3,158,452)
Other State ProgramsCharter Schools - Facilities 1,083,353 - 1,083,353 Charter System Grant 4,410,572 - 4,410,572 CTAE - Apprenticeship 36,067 - 36,067 CTAE - CTE Extended Day 211,782 - 211,782 CTAE - Supervision 32,206 - 32,206 Math and Science Supplement 494,289 - 494,289 Move on When Ready Grant 172,471 - 172,471 Teacher of the Year 507 - 507 Preschool Handicapped State Grant 620,200 - 620,200 Residential Treatment Centers Grant 365,102 - 365,102 Teacher's Retirement 137,636 - 137,636 Georgia SHAPE Grant - 8,000 8,000 Dept. of Family and Children Services - 160,343 160,343 Governors Office of Student Achievement 380,595 (157,500) 223,095 HUD Choice Neighborhood - 10,322 10,322
Technical and Adult Education, Georgia Department ofAdult Education - 401,731 401,731
School NutritionState School Nutrition Service Program - 639,050 639,050
201,961,932$ 5,736,939$ 207,698,871$
GOVERNMENTAL FUND TYPES
83

Atlanta Independent School System
Introduction to the Statistical Section
(Unaudited)
This part of Atlanta Independent School Systems Comprehensive Annual Financial Report presents detailed
information as a context for understanding this fiscal year’s financial statements, note disclosures, and supplementary
information. This information is unaudited.
Contents Pages
Financial Trends 84-90
These tables contain trend information that may assist the reader in assessing the School System’s current financial
performance by placing it in a historical perspective.
Revenue Capacity 91-97
The schedules contain information to help the reader assess the School System’s major revenue sources.
Debt Capacity 98-100
These schedules contain information to help the reader assess the affordability of the School System’s current
levels of outstanding debt and the ability to issue additional debt in the future.
Demographic and Economic Information 101-106
These tables present demographic and economic information intended (1) to assist users in understanding the
socioeconomic environment within which the School System operates and (2) to provide information that
facilitates comparisons of financial statement information over time.
Operating Information 107-110
These tables contain service indicators that can inform ones’ understanding how the information in the School
System’s financial statements relates to the services the School System provides and the activities it performs.
Data Source:
Unless otherwise noted, the information in these tables is derived from the Comprehensive Annual Financial
Report for the applicable fiscal year.
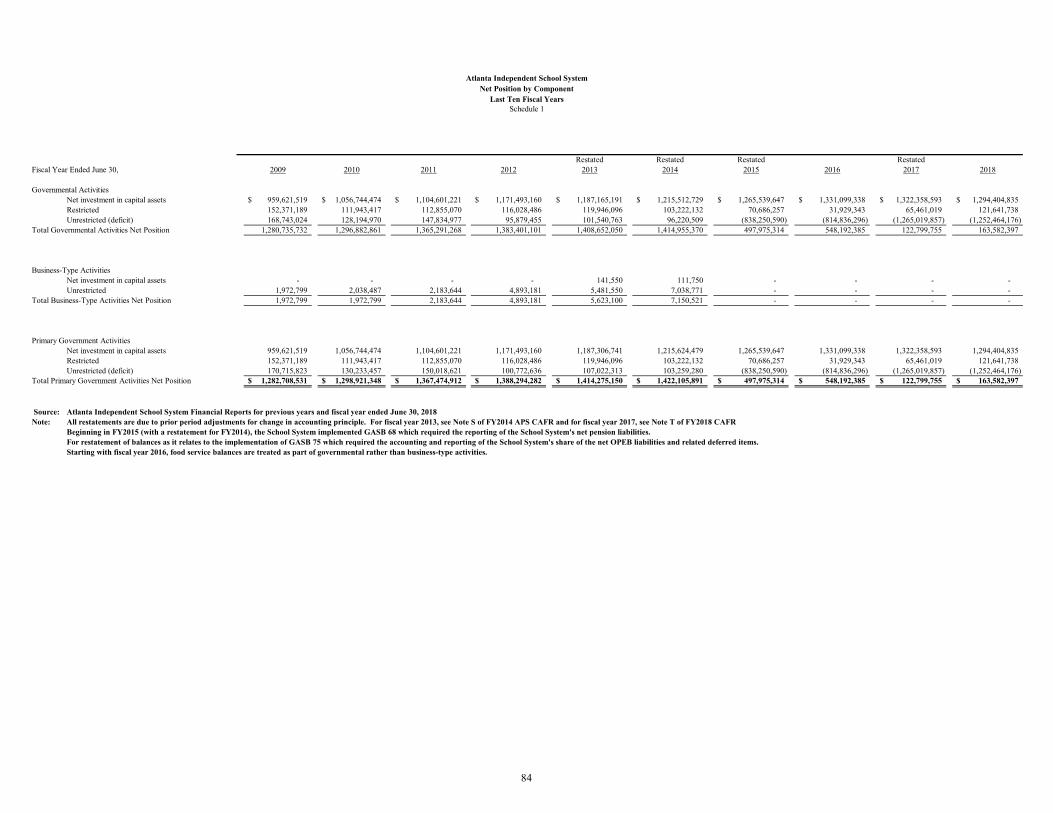
Restated Restated Restated RestatedFiscal Year Ended June 30, 2009 2010 2011 2012 2013 2014 2015 2016 2017 2018
Governmental ActivitiesNet investment in capital assets 959,621,519$ 1,056,744,474$ 1,104,601,221$ 1,171,493,160$ 1,187,165,191$ 1,215,512,729$ 1,265,539,647$ 1,331,099,338$ 1,322,358,593$ 1,294,404,835$ Restricted 152,371,189 111,943,417 112,855,070 116,028,486 119,946,096 103,222,132 70,686,257 31,929,343 65,461,019 121,641,738 Unrestricted (deficit) 168,743,024 128,194,970 147,834,977 95,879,455 101,540,763 96,220,509 (838,250,590) (814,836,296) (1,265,019,857) (1,252,464,176)
Total Governmental Activities Net Position 1,280,735,732 1,296,882,861 1,365,291,268 1,383,401,101 1,408,652,050 1,414,955,370 497,975,314 548,192,385 122,799,755 163,582,397
Business-Type ActivitiesNet investment in capital assets - - - - 141,550 111,750 - - - -Unrestricted 1,972,799 2,038,487 2,183,644 4,893,181 5,481,550 7,038,771 - - - -
Total Business-Type Activities Net Position 1,972,799 1,972,799 2,183,644 4,893,181 5,623,100 7,150,521 - - - -
Primary Government ActivitiesNet investment in capital assets 959,621,519 1,056,744,474 1,104,601,221 1,171,493,160 1,187,306,741 1,215,624,479 1,265,539,647 1,331,099,338 1,322,358,593 1,294,404,835 Restricted 152,371,189 111,943,417 112,855,070 116,028,486 119,946,096 103,222,132 70,686,257 31,929,343 65,461,019 121,641,738 Unrestricted (deficit) 170,715,823 130,233,457 150,018,621 100,772,636 107,022,313 103,259,280 (838,250,590) (814,836,296) (1,265,019,857) (1,252,464,176)
Total Primary Government Activities Net Position 1,282,708,531$ 1,298,921,348$ 1,367,474,912$ 1,388,294,282$ 1,414,275,150$ 1,422,105,891$ 497,975,314$ 548,192,385$ 122,799,755$ 163,582,397$
Source: Atlanta Independent School System Financial Reports for previous years and fiscal year ended June 30, 2018Note: All restatements are due to prior period adjustments for change in accounting principle. For fiscal year 2013, see Note S of FY2014 APS CAFR and for fiscal year 2017, see Note T of FY2018 CAFR
Beginning in FY2015 (with a restatement for FY2014), the School System implemented GASB 68 which required the reporting of the School System's net pension liabilities.For restatement of balances as it relates to the implementation of GASB 75 which required the accounting and reporting of the School System's share of the net OPEB liabilities and related deferred items.Starting with fiscal year 2016, food service balances are treated as part of governmental rather than business-type activities.
Atlanta Independent School SystemNet Position by Component
Last Ten Fiscal YearsSchedule 1
84
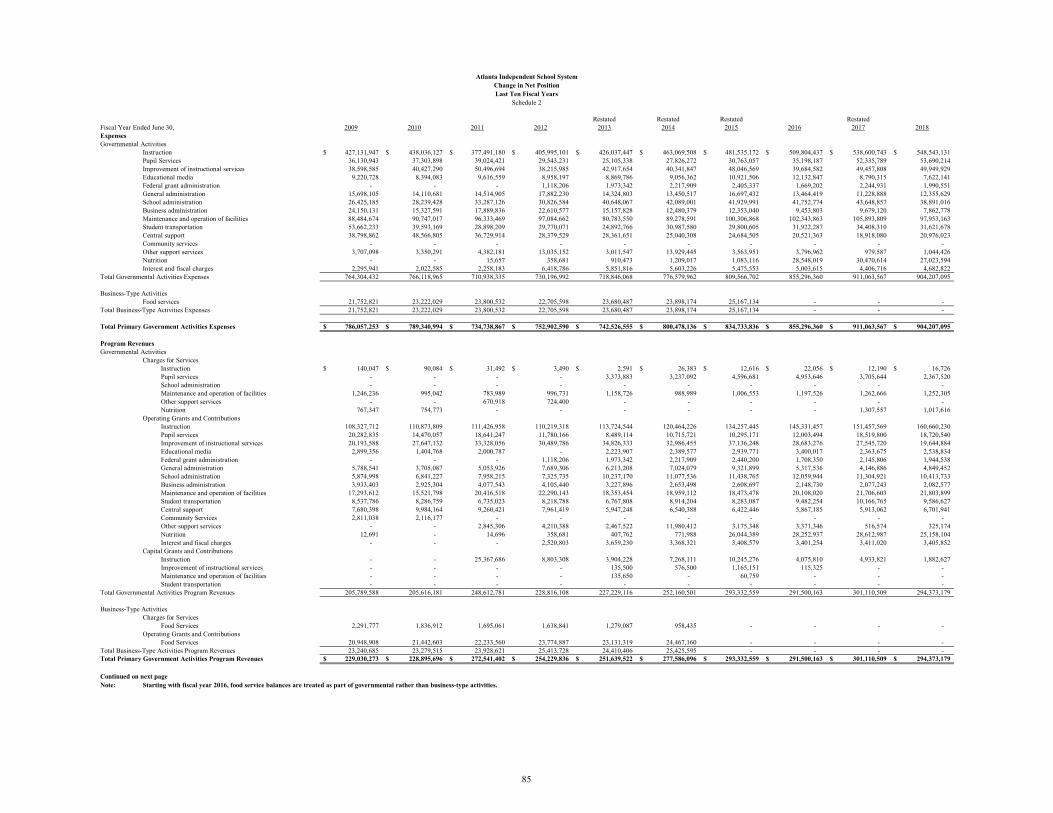
Restated Restated Restated RestatedFiscal Year Ended June 30, 2009 2010 2011 2012 2013 2014 2015 2016 2017 2018ExpensesGovernmental Activities
Instruction 427,131,947$ 438,036,127$ 377,491,180$ 405,995,101$ 426,037,447$ 463,069,508$ 481,535,172$ 509,804,437$ 538,600,743$ 548,543,131$ Pupil Services 36,130,943 37,303,898 39,024,421 29,543,231 25,105,338 27,826,272 30,763,057 35,198,187 52,335,789 53,690,214 Improvement of instructional services 38,598,585 40,427,290 50,496,694 38,215,985 42,917,654 40,341,847 48,046,569 39,684,582 49,457,808 49,949,929 Educational media 9,220,728 8,394,083 9,616,559 8,958,197 8,869,786 9,056,362 10,921,506 12,132,847 8,790,315 7,622,141 Federal grant administration - - - 1,118,206 1,973,342 2,217,909 2,405,337 1,669,202 2,244,931 1,990,551 General administration 15,698,105 14,110,681 14,514,905 17,882,230 14,324,803 13,450,517 16,697,432 13,464,419 11,228,888 12,355,629 School administration 26,425,185 28,239,428 33,287,126 30,826,584 40,648,067 42,089,001 41,929,991 41,752,774 43,648,857 38,891,016 Business administration 24,150,131 15,327,591 17,889,836 22,610,577 15,157,828 12,480,379 12,353,040 9,453,803 9,679,120 7,862,778 Maintenance and operation of facilities 88,484,674 90,747,017 96,333,469 97,084,662 80,783,550 89,278,591 100,306,868 102,343,863 105,893,809 97,953,163 Student transportation 53,662,233 39,593,169 28,898,209 29,770,071 24,892,766 30,987,580 29,800,605 31,922,287 34,408,310 31,621,678 Central support 38,798,862 48,566,805 36,729,914 28,379,529 28,361,651 25,040,308 24,684,505 20,521,363 18,918,080 20,976,023 Community services - - - - - - - - - - Other support services 3,707,098 3,350,291 4,382,181 13,035,152 3,011,547 13,929,445 3,563,951 3,796,962 979,587 1,044,426 Nutrition - - 15,657 358,681 910,473 1,209,017 1,083,116 28,548,019 30,470,614 27,023,594 Interest and fiscal charges 2,295,941 2,022,585 2,258,183 6,418,786 5,851,816 5,603,226 5,475,553 5,003,615 4,406,716 4,682,822
Total Governmental Activities Expenses 764,304,432 766,118,965 710,938,335 730,196,992 718,846,068 776,579,962 809,566,702 855,296,360 911,063,567 904,207,095
Business-Type ActivitiesFood services 21,752,821 23,222,029 23,800,532 22,705,598 23,680,487 23,898,174 25,167,134 - - -
Total Business-Type Activities Expenses 21,752,821 23,222,029 23,800,532 22,705,598 23,680,487 23,898,174 25,167,134 - - -
Total Primary Government Activities Expenses 786,057,253$ 789,340,994$ 734,738,867$ 752,902,590$ 742,526,555$ 800,478,136$ 834,733,836$ 855,296,360$ 911,063,567$ 904,207,095$
Program RevenuesGovernmental Activities
Charges for ServicesInstruction 140,047$ 90,084$ 31,492$ 3,490$ 2,591$ 26,383$ 12,616$ 22,056$ 12,190$ 16,726$ Pupil services - - - - 3,373,883 3,237,092 4,596,681 4,953,646 3,705,644 2,367,520 School administration - - - - - - - - - - Maintenance and operation of facilities 1,246,236 995,042 783,989 996,731 1,158,726 988,989 1,006,553 1,197,526 1,262,666 1,252,305 Other support services - - 670,918 724,400 - - - - - - Nutrition 767,347 754,773 - - - - - - 1,307,557 1,017,616
Operating Grants and ContributionsInstruction 108,327,712 110,873,809 111,426,958 110,219,318 113,724,544 120,464,226 134,257,445 145,331,457 151,457,569 160,660,230 Pupil services 20,282,835 14,470,057 18,641,247 11,780,166 8,489,114 10,715,721 10,295,171 12,003,494 18,519,800 18,720,540 Improvement of instructional services 20,193,588 27,647,132 33,328,056 30,489,786 34,826,333 32,986,455 37,136,248 28,683,276 27,545,720 19,644,884 Educational media 2,899,356 1,404,768 2,000,787 - 2,223,907 2,389,577 2,939,771 3,400,017 2,363,675 2,538,834 Federal grant administration - - - 1,118,206 1,973,342 2,217,909 2,440,200 1,708,350 2,145,806 1,944,538 General administration 5,788,541 3,705,087 5,053,926 7,689,306 6,213,208 7,024,079 9,321,899 5,317,536 4,146,886 4,849,452 School administration 5,874,998 6,841,227 7,958,215 7,325,735 10,237,170 11,077,536 11,438,765 12,059,944 11,304,921 10,413,733 Business administration 3,933,403 2,925,304 4,077,543 4,105,440 3,227,896 2,653,498 2,608,697 2,148,730 2,077,243 2,082,577 Maintenance and operation of facilities 17,293,612 15,521,798 20,416,518 22,290,143 18,353,454 18,959,112 18,473,478 20,108,020 21,706,603 21,803,899 Student transportation 8,537,786 8,286,759 6,735,023 8,218,788 6,767,808 8,914,204 8,283,087 9,482,254 10,166,765 9,586,627 Central support 7,680,398 9,984,164 9,260,421 7,961,419 5,947,248 6,540,388 6,422,446 5,867,185 5,913,062 6,701,941 Community Services 2,811,038 2,116,177 - - - - - - - - Other support services - - 2,845,306 4,210,388 2,467,522 11,980,412 3,175,348 3,371,346 516,574 325,174 Nutrition 12,691 - 14,696 358,681 407,762 771,988 26,044,389 28,252,937 28,612,987 25,158,104 Interest and fiscal charges - - - 2,520,803 3,659,230 3,368,321 3,408,579 3,401,254 3,411,020 3,405,852
Capital Grants and ContributionsInstruction - - 25,367,686 8,803,308 3,904,228 7,268,111 10,245,276 4,075,810 4,933,821 1,882,627 Improvement of instructional services - - - - 135,500 576,500 1,165,151 115,325 - - Maintenance and operation of facilities - - - - 135,650 - 60,759 - - - Student transportation - - - - - - - - - -
Total Governmental Activities Program Revenues 205,789,588 205,616,181 248,612,781 228,816,108 227,229,116 252,160,501 293,332,559 291,500,163 301,110,509 294,373,179
Business-Type ActivitiesCharges for Services
Food Services 2,291,777 1,836,912 1,695,061 1,638,841 1,279,087 958,435 - - - - Operating Grants and Contributions
Food Services 20,948,908 21,442,603 22,233,560 23,774,887 23,131,319 24,467,160 - - - - Total Business-Type Activities Program Revenues 23,240,685 23,279,515 23,928,621 25,413,728 24,410,406 25,425,595 - - - - Total Primary Government Activities Program Revenues 229,030,273$ 228,895,696$ 272,541,402$ 254,229,836$ 251,639,522$ 277,586,096$ 293,332,559$ 291,500,163$ 301,110,509$ 294,373,179$
Continued on next pageNote: Starting with fiscal year 2016, food service balances are treated as part of governmental rather than business-type activities.
Atlanta Independent School SystemChange in Net PositionLast Ten Fiscal Years
Schedule 2
85
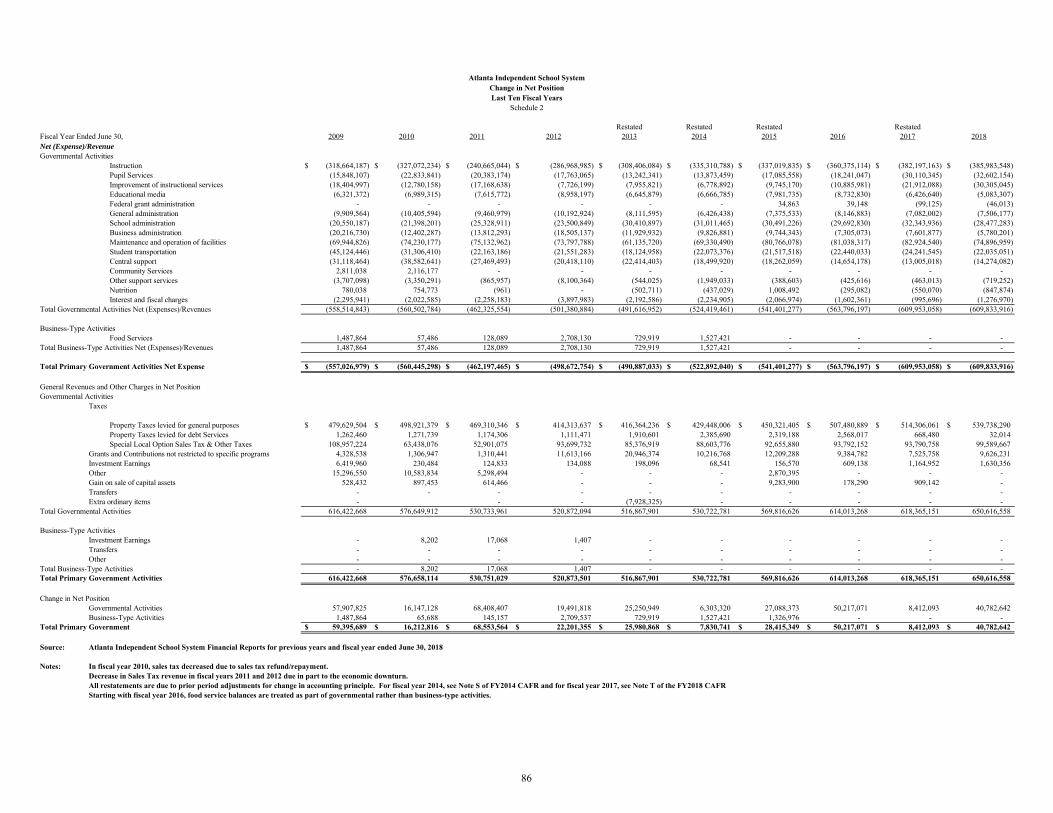
Restated Restated Restated RestatedFiscal Year Ended June 30, 2009 2010 2011 2012 2013 2014 2015 2016 2017 2018Net (Expense)/RevenueGovernmental Activities
Instruction (318,664,187)$ (327,072,234)$ (240,665,044)$ (286,968,985)$ (308,406,084)$ (335,310,788)$ (337,019,835)$ (360,375,114)$ (382,197,163)$ (385,983,548)$ Pupil Services (15,848,107) (22,833,841) (20,383,174) (17,763,065) (13,242,341) (13,873,459) (17,085,558) (18,241,047) (30,110,345) (32,602,154) Improvement of instructional services (18,404,997) (12,780,158) (17,168,638) (7,726,199) (7,955,821) (6,778,892) (9,745,170) (10,885,981) (21,912,088) (30,305,045) Educational media (6,321,372) (6,989,315) (7,615,772) (8,958,197) (6,645,879) (6,666,785) (7,981,735) (8,732,830) (6,426,640) (5,083,307) Federal grant administration - - - - - - 34,863 39,148 (99,125) (46,013) General administration (9,909,564) (10,405,594) (9,460,979) (10,192,924) (8,111,595) (6,426,438) (7,375,533) (8,146,883) (7,082,002) (7,506,177) School administration (20,550,187) (21,398,201) (25,328,911) (23,500,849) (30,410,897) (31,011,465) (30,491,226) (29,692,830) (32,343,936) (28,477,283) Business administration (20,216,730) (12,402,287) (13,812,293) (18,505,137) (11,929,932) (9,826,881) (9,744,343) (7,305,073) (7,601,877) (5,780,201) Maintenance and operation of facilities (69,944,826) (74,230,177) (75,132,962) (73,797,788) (61,135,720) (69,330,490) (80,766,078) (81,038,317) (82,924,540) (74,896,959) Student transportation (45,124,446) (31,306,410) (22,163,186) (21,551,283) (18,124,958) (22,073,376) (21,517,518) (22,440,033) (24,241,545) (22,035,051) Central support (31,118,464) (38,582,641) (27,469,493) (20,418,110) (22,414,403) (18,499,920) (18,262,059) (14,654,178) (13,005,018) (14,274,082) Community Services 2,811,038 2,116,177 - - - - - - - - Other support services (3,707,098) (3,350,291) (865,957) (8,100,364) (544,025) (1,949,033) (388,603) (425,616) (463,013) (719,252) Nutrition 780,038 754,773 (961) - (502,711) (437,029) 1,008,492 (295,082) (550,070) (847,874) Interest and fiscal charges (2,295,941) (2,022,585) (2,258,183) (3,897,983) (2,192,586) (2,234,905) (2,066,974) (1,602,361) (995,696) (1,276,970)
Total Governmental Activities Net (Expenses)/Revenues (558,514,843) (560,502,784) (462,325,554) (501,380,884) (491,616,952) (524,419,461) (541,401,277) (563,796,197) (609,953,058) (609,833,916)
Business-Type ActivitiesFood Services 1,487,864 57,486 128,089 2,708,130 729,919 1,527,421 - - - -
Total Business-Type Activities Net (Expenses)/Revenues 1,487,864 57,486 128,089 2,708,130 729,919 1,527,421 - - - -
Total Primary Government Activities Net Expense (557,026,979)$ (560,445,298)$ (462,197,465)$ (498,672,754)$ (490,887,033)$ (522,892,040)$ (541,401,277)$ (563,796,197)$ (609,953,058)$ (609,833,916)$
General Revenues and Other Charges in Net PositionGovernmental Activities
Taxes
Property Taxes levied for general purposes 479,629,504$ 498,921,379$ 469,310,346$ 414,313,637$ 416,364,236$ 429,448,006$ 450,321,405$ 507,480,889$ 514,306,061$ 539,738,290$ Property Taxes levied for debt Services 1,262,460 1,271,739 1,174,306 1,111,471 1,910,601 2,385,690 2,319,188 2,568,017 668,480 32,014 Special Local Option Sales Tax & Other Taxes 108,957,224 63,438,076 52,901,075 93,699,732 85,376,919 88,603,776 92,655,880 93,792,152 93,790,758 99,589,667
Grants and Contributions not restricted to specific programs 4,328,538 1,306,947 1,310,441 11,613,166 20,946,374 10,216,768 12,209,288 9,384,782 7,525,758 9,626,231 Investment Earnings 6,419,960 230,484 124,833 134,088 198,096 68,541 156,570 609,138 1,164,952 1,630,356 Other 15,296,550 10,583,834 5,298,494 - - - 2,870,395 - - - Gain on sale of capital assets 528,432 897,453 614,466 - - - 9,283,900 178,290 909,142 - Transfers - - - - - - - - - - Extra ordinary items - - - (7,928,325) - - - - -
Total Governmental Activities 616,422,668 576,649,912 530,733,961 520,872,094 516,867,901 530,722,781 569,816,626 614,013,268 618,365,151 650,616,558
Business-Type ActivitiesInvestment Earnings - 8,202 17,068 1,407 - - - - - - Transfers - - - - - - - - - - Other - - - - - - - - - -
Total Business-Type Activities - 8,202 17,068 1,407 - - - - - - Total Primary Government Activities 616,422,668 576,658,114 530,751,029 520,873,501 516,867,901 530,722,781 569,816,626 614,013,268 618,365,151 650,616,558
Change in Net PositionGovernmental Activities 57,907,825 16,147,128 68,408,407 19,491,818 25,250,949 6,303,320 27,088,373 50,217,071 8,412,093 40,782,642 Business-Type Activities 1,487,864 65,688 145,157 2,709,537 729,919 1,527,421 1,326,976 - - -
Total Primary Government 59,395,689$ 16,212,816$ 68,553,564$ 22,201,355$ 25,980,868$ 7,830,741$ 28,415,349$ 50,217,071$ 8,412,093$ 40,782,642$
Source: Atlanta Independent School System Financial Reports for previous years and fiscal year ended June 30, 2018
Notes: In fiscal year 2010, sales tax decreased due to sales tax refund/repayment.Decrease in Sales Tax revenue in fiscal years 2011 and 2012 due in part to the economic downturn. All restatements are due to prior period adjustments for change in accounting principle. For fiscal year 2014, see Note S of FY2014 CAFR and for fiscal year 2017, see Note T of the FY2018 CAFRStarting with fiscal year 2016, food service balances are treated as part of governmental rather than business-type activities.
Atlanta Independent School SystemChange in Net PositionLast Ten Fiscal Years
Schedule 2
86
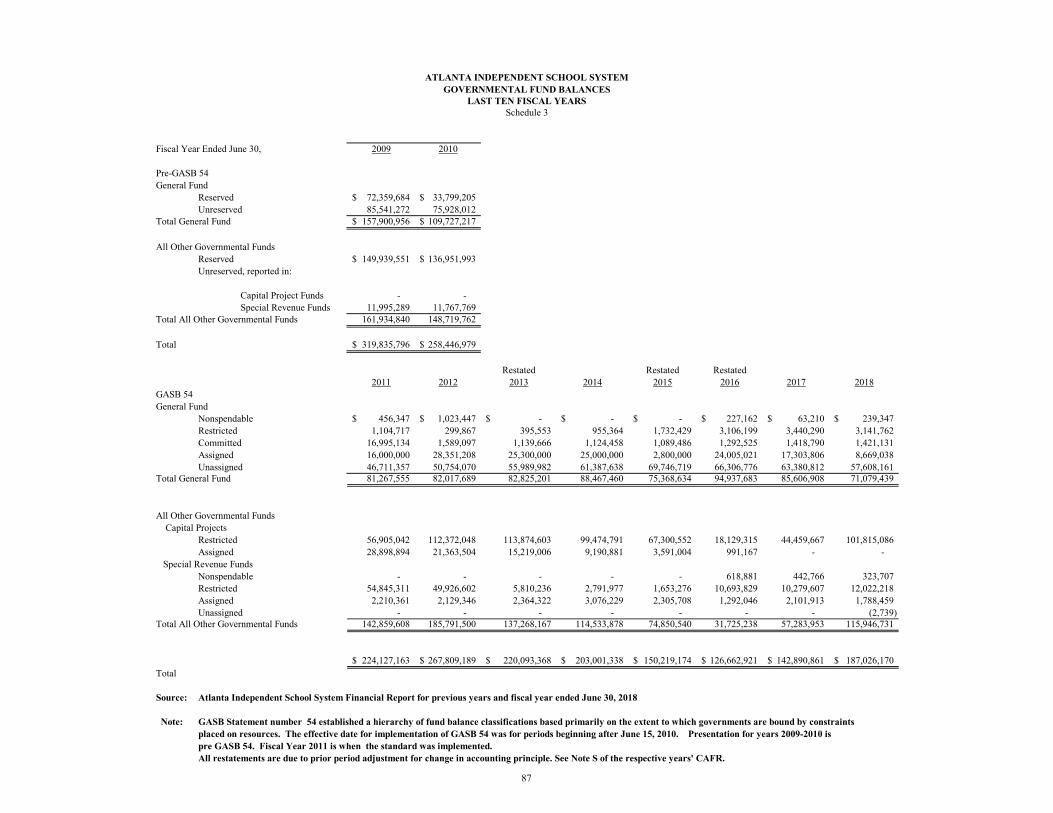
Fiscal Year Ended June 30, 2009 2010
Pre-GASB 54General Fund
Reserved 72,359,684$ 33,799,205$ Unreserved 85,541,272 75,928,012
Total General Fund 157,900,956$ 109,727,217$
All Other Governmental FundsReserved 149,939,551$ 136,951,993$ Unreserved, reported in:
Capital Project Funds - - Special Revenue Funds 11,995,289 11,767,769
Total All Other Governmental Funds 161,934,840 148,719,762
Total 319,835,796$ 258,446,979$
Restated Restated Restated2011 2012 2013 2014 2015 2016 2017 2018
GASB 54General Fund
Nonspendable 456,347$ 1,023,447$ -$ -$ -$ 227,162$ 63,210$ 239,347$ Restricted 1,104,717 299,867 395,553 955,364 1,732,429 3,106,199 3,440,290 3,141,762 Committed 16,995,134 1,589,097 1,139,666 1,124,458 1,089,486 1,292,525 1,418,790 1,421,131 Assigned 16,000,000 28,351,208 25,300,000 25,000,000 2,800,000 24,005,021 17,303,806 8,669,038 Unassigned 46,711,357 50,754,070 55,989,982 61,387,638 69,746,719 66,306,776 63,380,812 57,608,161
Total General Fund 81,267,555 82,017,689 82,825,201 88,467,460 75,368,634 94,937,683 85,606,908 71,079,439
All Other Governmental Funds Capital Projects
Restricted 56,905,042 112,372,048 113,874,603 99,474,791 67,300,552 18,129,315 44,459,667 101,815,086 Assigned 28,898,894 21,363,504 15,219,006 9,190,881 3,591,004 991,167 - -
Special Revenue FundsNonspendable - - - - - 618,881 442,766 323,707 Restricted 54,845,311 49,926,602 5,810,236 2,791,977 1,653,276 10,693,829 10,279,607 12,022,218 Assigned 2,210,361 2,129,346 2,364,322 3,076,229 2,305,708 1,292,046 2,101,913 1,788,459 Unassigned - - - - - - - (2,739)
Total All Other Governmental Funds 142,859,608 185,791,500 137,268,167 114,533,878 74,850,540 31,725,238 57,283,953 115,946,731
224,127,163$ 267,809,189$ 220,093,368$ 203,001,338$ 150,219,174$ 126,662,921$ 142,890,861$ 187,026,170$ Total
Source: Atlanta Independent School System Financial Report for previous years and fiscal year ended June 30, 2018
Note: GASB Statement number 54 established a hierarchy of fund balance classifications based primarily on the extent to which governments are bound by constraints placed on resources. The effective date for implementation of GASB 54 was for periods beginning after June 15, 2010. Presentation for years 2009-2010 is pre GASB 54. Fiscal Year 2011 is when the standard was implemented. All restatements are due to prior period adjustment for change in accounting principle. See Note S of the respective years' CAFR.
ATLANTA INDEPENDENT SCHOOL SYSTEM
LAST TEN FISCAL YEARSGOVERNMENTAL FUND BALANCES
Schedule 3
87
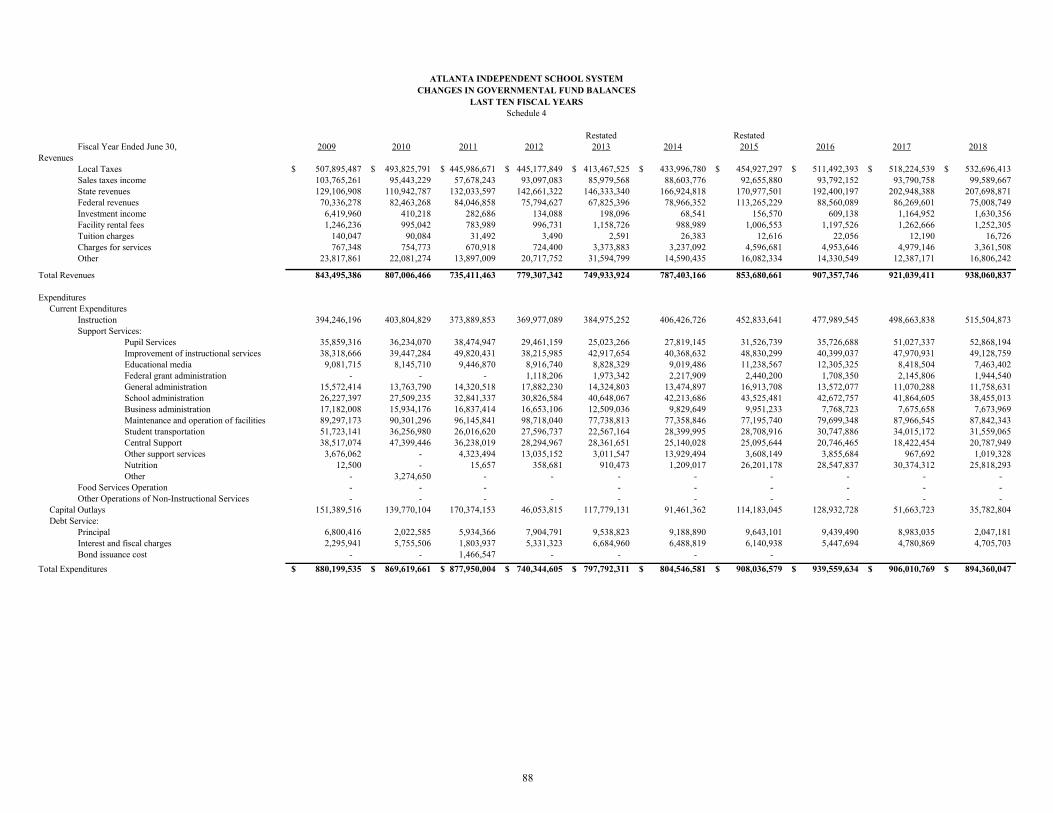
Restated RestatedFiscal Year Ended June 30, 2009 2010 2011 2012 2013 2014 2015 2016 2017 2018
RevenuesLocal Taxes 507,895,487$ 493,825,791$ 445,986,671$ 445,177,849$ 413,467,525$ 433,996,780$ 454,927,297$ 511,492,393$ 518,224,539$ 532,696,413$ Sales taxes income 103,765,261 95,443,229 57,678,243 93,097,083 85,979,568 88,603,776 92,655,880 93,792,152 93,790,758 99,589,667 State revenues 129,106,908 110,942,787 132,033,597 142,661,322 146,333,340 166,924,818 170,977,501 192,400,197 202,948,388 207,698,871 Federal revenues 70,336,278 82,463,268 84,046,858 75,794,627 67,825,396 78,966,352 113,265,229 88,560,089 86,269,601 75,008,749 Investment income 6,419,960 410,218 282,686 134,088 198,096 68,541 156,570 609,138 1,164,952 1,630,356 Facility rental fees 1,246,236 995,042 783,989 996,731 1,158,726 988,989 1,006,553 1,197,526 1,262,666 1,252,305 Tuition charges 140,047 90,084 31,492 3,490 2,591 26,383 12,616 22,056 12,190 16,726Charges for services 767,348 754,773 670,918 724,400 3,373,883 3,237,092 4,596,681 4,953,646 4,979,146 3,361,508 Other 23,817,861 22,081,274 13,897,009 20,717,752 31,594,799 14,590,435 16,082,334 14,330,549 12,387,171 16,806,242
Total Revenues 843,495,386 807,006,466 735,411,463 779,307,342 749,933,924 787,403,166 853,680,661 907,357,746 921,039,411 938,060,837
Expenditures Current Expenditures
Instruction 394,246,196 403,804,829 373,889,853 369,977,089 384,975,252 406,426,726 452,833,641 477,989,545 498,663,838 515,504,873 Support Services:
Pupil Services 35,859,316 36,234,070 38,474,947 29,461,159 25,023,266 27,819,145 31,526,739 35,726,688 51,027,337 52,868,194 Improvement of instructional services 38,318,666 39,447,284 49,820,431 38,215,985 42,917,654 40,368,632 48,830,299 40,399,037 47,970,931 49,128,759 Educational media 9,081,715 8,145,710 9,446,870 8,916,740 8,828,329 9,019,486 11,238,567 12,305,325 8,418,504 7,463,402 Federal grant administration - - - 1,118,206 1,973,342 2,217,909 2,440,200 1,708,350 2,145,806 1,944,540 General administration 15,572,414 13,763,790 14,320,518 17,882,230 14,324,803 13,474,897 16,913,708 13,572,077 11,070,288 11,758,631 School administration 26,227,397 27,509,235 32,841,337 30,826,584 40,648,067 42,213,686 43,525,481 42,672,757 41,864,605 38,455,013 Business administration 17,182,008 15,934,176 16,837,414 16,653,106 12,509,036 9,829,649 9,951,233 7,768,723 7,675,658 7,673,969 Maintenance and operation of facilities 89,297,173 90,301,296 96,145,841 98,718,040 77,738,813 77,358,846 77,195,740 79,699,348 87,966,545 87,842,343 Student transportation 51,723,141 36,256,980 26,016,620 27,596,737 22,567,164 28,399,995 28,708,916 30,747,886 34,015,172 31,559,065 Central Support 38,517,074 47,399,446 36,238,019 28,294,967 28,361,651 25,140,028 25,095,644 20,746,465 18,422,454 20,787,949 Other support services 3,676,062 - 4,323,494 13,035,152 3,011,547 13,929,494 3,608,149 3,855,684 967,692 1,019,328 Nutrition 12,500 - 15,657 358,681 910,473 1,209,017 26,201,178 28,547,837 30,374,312 25,818,293 Other - 3,274,650 - - - - - - - -
Food Services Operation - - - - - - - - -Other Operations of Non-Instructional Services - - - - - - - - - -
Capital Outlays 151,389,516 139,770,104 170,374,153 46,053,815 117,779,131 91,461,362 114,183,045 128,932,728 51,663,723 35,782,804 Debt Service:
Principal 6,800,416 2,022,585 5,934,366 7,904,791 9,538,823 9,188,890 9,643,101 9,439,490 8,983,035 2,047,181 Interest and fiscal charges 2,295,941 5,755,506 1,803,937 5,331,323 6,684,960 6,488,819 6,140,938 5,447,694 4,780,869 4,705,703 Bond issuance cost - - 1,466,547 - - - -
Total Expenditures 880,199,535$ 869,619,661$ 877,950,004$ 740,344,605$ 797,792,311$ 804,546,581$ 908,036,579$ 939,559,634$ 906,010,769$ 894,360,047$
ATLANTA INDEPENDENT SCHOOL SYSTEMCHANGES IN GOVERNMENTAL FUND BALANCES
LAST TEN FISCAL YEARSSchedule 4
88

Restated RestatedFiscal Year Ended June 30, 2009 2010 2011 2012 2013 2014 2015 2016 2017 2018
Excess / (Deficiency) of Revenues over (under) Expenditures (36,704,149)$ (62,613,195)$ (142,538,541)$ 38,962,737$ (47,858,387)$ (17,143,415)$ (54,355,918)$ (32,201,888)$ 15,028,642$ 43,700,790$
Other Financing Sources (Uses)Proceeds from Bonds - - 104,415,000 - - - - - - -Premium on bonds - - 3,097,709 - - - - - - -Proceeds from Capital Leases - - - 4,467,505 - - - - - -Proceeds from sale of capital assets 932,980 1,224,378 706,016 251,784 142,566 51,385 2,930,530 250,088 1,199,298 434,519 Proceeds from issuance of notes payable - - - - - - - - - -Transfers in 34,055,410 44,664,147 10,974,126 600,090 5,925,802 1,238,300 288,955 1,402,164 2,550,527 2,705,646 Transfers out (34,055,410) (44,664,147) (10,974,126) (600,090) (5,925,802) (1,238,300) (288,955) (1,402,164) (2,550,527) (2,705,646)
Total Other Financing Sources/(Uses) 932,980 1,224,378 108,218,725 4,719,289 142,566 51,385 2,930,530 250,088 1,199,298 434,519
Net Change in Fund Balances (35,771,169) (61,388,817) (34,319,816) 43,682,026 (47,715,821) (17,092,030) (51,425,388) (31,951,800) 16,227,940 44,135,309
Fund Balance at Beginning of Fiscal Year 355,606,965 323,846,887 258,446,979 224,127,163 267,809,189 220,093,368 210,040,109 158,614,721 126,662,921 142,890,861
Prior Period Corrections - - - - - - - - - -Change in accounting practice - (4,011,091) - - - - - - - -FUND BALANCE AT END OF FISCAL YEAR 319,835,796$ 258,446,979$ 224,127,163$ 267,809,189$ 220,093,368$ 203,001,338$ 158,614,721$ 126,662,921$ 142,890,861$ 187,026,170$
FUND BALANCE AT END OF FISCAL YEAR 319,835,796$ 258,446,979$ 224,127,163$ 267,809,189$ 220,093,368$ 203,001,338$ 158,614,721$ 126,662,921$ 142,890,861$ 187,026,170$
Debt service as a percentage of noncapital expenditures 1.26% 1.08% 1.30% 1.91% 2.39% 2.16% 1.99% 1.79% 1.58% 0.78%
Source: Atlanta Independent School System Financial Reports for previous years and fiscal year ended June 30, 2018.
Notes: Large fluctuations in expenditures due to reclasses within functions in FY2009-2011 .Decrease in Sales tax income between FY10 and FY11 was due in part to the adjustment for overpayement of SPLOST proceeds. All restatements are due to prior period adjustment for change in accounting principle. See Notes S and R of the respective years' CAFR.Starting with fiscal year 2016, food service balances are treated as part of governmental rather than business-type activities.
ATLANTA INDEPENDENT SCHOOL SYSTEMCHANGES IN GOVERNMENTAL FUND BALANCES
LAST TEN FISCAL YEARSSchedule 4
89
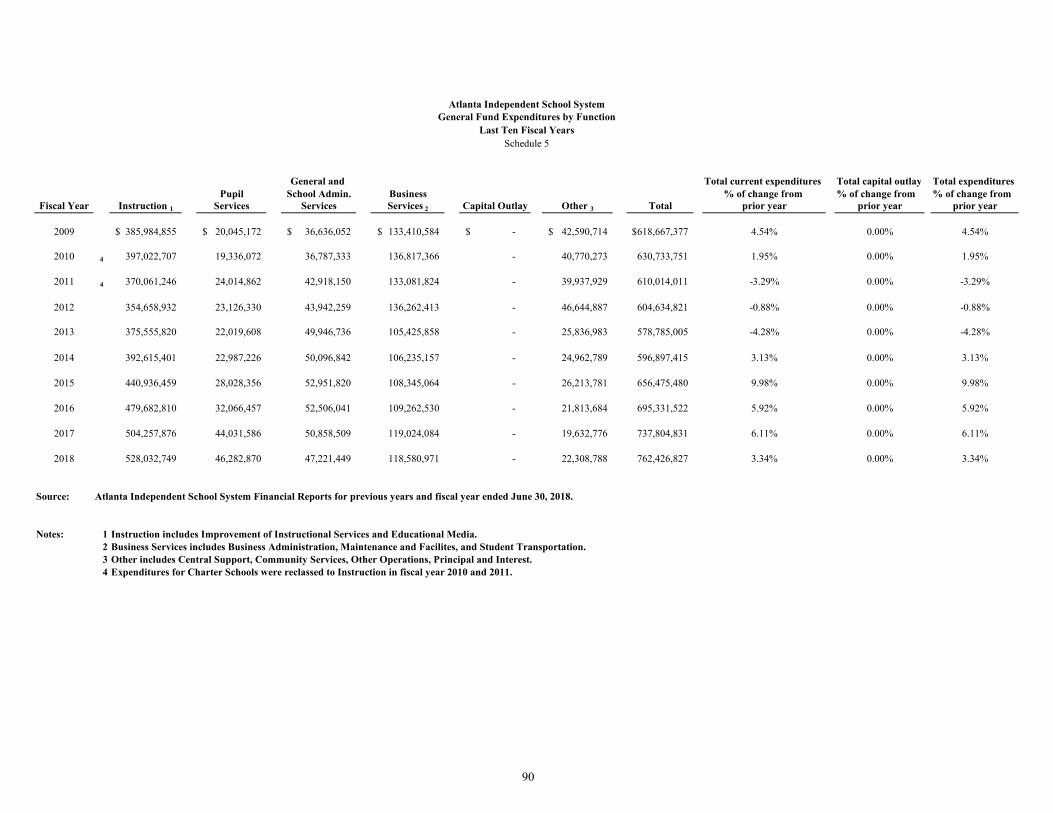
Atlanta Independent School SystemGeneral Fund Expenditures by Function
Last Ten Fiscal Years
General and Total current expenditures Total capital outlay Total expendituresPupil School Admin. Business % of change from % of change from % of change from
Fiscal Year Instruction 1 Services Services Services 2 Capital Outlay Other 3 Total prior year prior year prior year
2009 385,984,855$ 20,045,172$ 36,636,052$ 133,410,584$ -$ 42,590,714$ 618,667,377$ 4.54% 0.00% 4.54%
2010 4 397,022,707 19,336,072 36,787,333 136,817,366 - 40,770,273 630,733,751 1.95% 0.00% 1.95%
2011 4 370,061,246 24,014,862 42,918,150 133,081,824 - 39,937,929 610,014,011 -3.29% 0.00% -3.29%
2012 354,658,932 23,126,330 43,942,259 136,262,413 - 46,644,887 604,634,821 -0.88% 0.00% -0.88%
2013 375,555,820 22,019,608 49,946,736 105,425,858 - 25,836,983 578,785,005 -4.28% 0.00% -4.28%
2014 392,615,401 22,987,226 50,096,842 106,235,157 - 24,962,789 596,897,415 3.13% 0.00% 3.13%
2015 440,936,459 28,028,356 52,951,820 108,345,064 - 26,213,781 656,475,480 9.98% 0.00% 9.98%
2016 479,682,810 32,066,457 52,506,041 109,262,530 - 21,813,684 695,331,522 5.92% 0.00% 5.92%
2017 504,257,876 44,031,586 50,858,509 119,024,084 - 19,632,776 737,804,831 6.11% 0.00% 6.11%
2018 528,032,749 46,282,870 47,221,449 118,580,971 - 22,308,788 762,426,827 3.34% 0.00% 3.34%
Source: Atlanta Independent School System Financial Reports for previous years and fiscal year ended June 30, 2018.
Notes: 1 Instruction includes Improvement of Instructional Services and Educational Media. 2 Business Services includes Business Administration, Maintenance and Facilites, and Student Transportation.3 Other includes Central Support, Community Services, Other Operations, Principal and Interest.4 Expenditures for Charter Schools were reclassed to Instruction in fiscal year 2010 and 2011.
Schedule 5
90
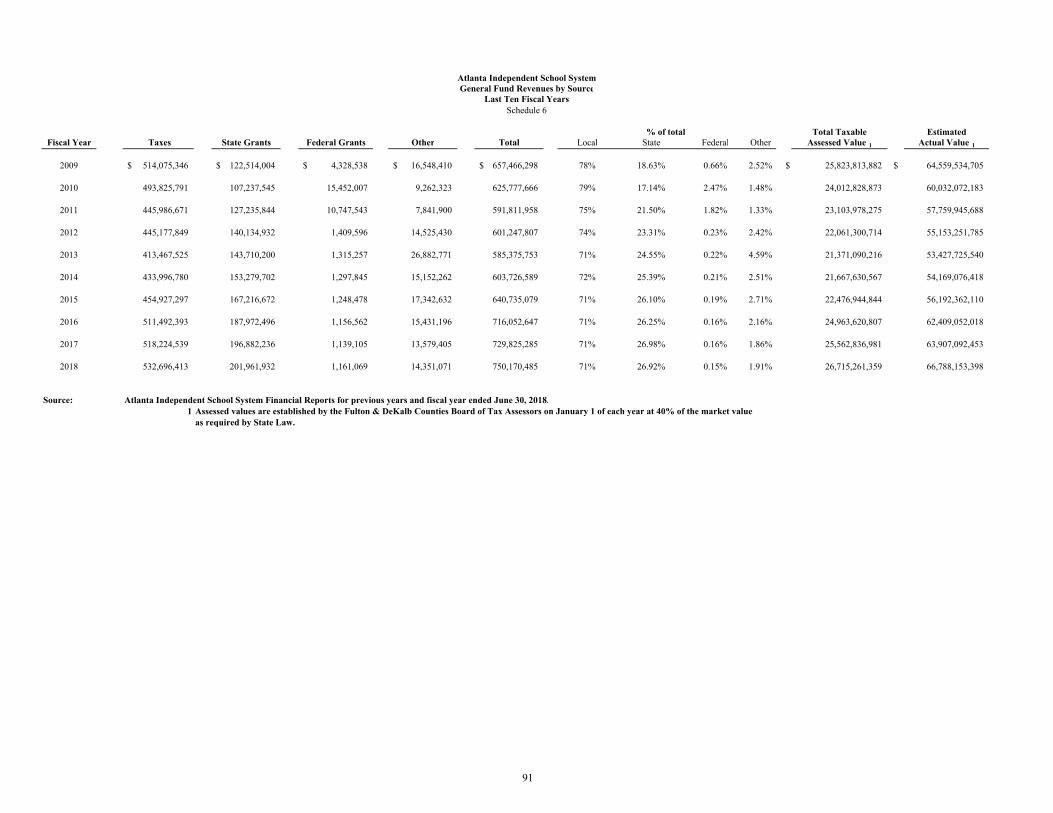
% of total Total Taxable EstimatedFiscal Year Taxes State Grants Federal Grants Other Total Local State Federal Other Assessed Value 1 Actual Value 1
2009 514,075,346$ 122,514,004$ 4,328,538$ 16,548,410$ 657,466,298$ 78% 18.63% 0.66% 2.52% $ 25,823,813,882 $ 64,559,534,705
2010 493,825,791 107,237,545 15,452,007 9,262,323 625,777,666 79% 17.14% 2.47% 1.48% 24,012,828,873 60,032,072,183
2011 445,986,671 127,235,844 10,747,543 7,841,900 591,811,958 75% 21.50% 1.82% 1.33% 23,103,978,275 57,759,945,688
2012 445,177,849 140,134,932 1,409,596 14,525,430 601,247,807 74% 23.31% 0.23% 2.42% 22,061,300,714 55,153,251,785
2013 413,467,525 143,710,200 1,315,257 26,882,771 585,375,753 71% 24.55% 0.22% 4.59% 21,371,090,216 53,427,725,540
2014 433,996,780 153,279,702 1,297,845 15,152,262 603,726,589 72% 25.39% 0.21% 2.51% 21,667,630,567 54,169,076,418
2015 454,927,297 167,216,672 1,248,478 17,342,632 640,735,079 71% 26.10% 0.19% 2.71% 22,476,944,844 56,192,362,110
2016 511,492,393 187,972,496 1,156,562 15,431,196 716,052,647 71% 26.25% 0.16% 2.16% 24,963,620,807 62,409,052,018
2017 518,224,539 196,882,236 1,139,105 13,579,405 729,825,285 71% 26.98% 0.16% 1.86% 25,562,836,981 63,907,092,453
2018 532,696,413 201,961,932 1,161,069 14,351,071 750,170,485 71% 26.92% 0.15% 1.91% 26,715,261,359 66,788,153,398
Source: Atlanta Independent School System Financial Reports for previous years and fiscal year ended June 30, 2018.1 Assessed values are established by the Fulton & DeKalb Counties Board of Tax Assessors on January 1 of each year at 40% of the market value
as required by State Law.
Atlanta Independent School SystemGeneral Fund Revenues by Source
Last Ten Fiscal YearsSchedule 6
91

LessFiscal Residential Commercial Industrial Tax-Exempt Total Taxable Estimated Total Direct
Year Ended Property Property Property Other Property 1 Property 2 Assessed Value 3 Actual Value 3 Tax Rate
June 30, 2009 $ 13,872,372,979 $ 11,249,746,299 $ 890,877,231 $ 1,720,999,874 $ 1,910,252,501 $ 25,823,813,882 $ 64,559,534,705 30.49%
June 30, 2010 12,749,326,810 11,746,535,282 806,421,455 1,542,422,321 2,831,876,995 24,012,828,873 60,032,072,183 33.63%
June 30, 2011 12,609,751,900 10,924,151,062 775,954,220 1,525,316,851 2,731,195,758 23,103,978,275 57,759,945,688 33.63%
June 30, 2012 11,506,413,986 11,148,297,009 758,400,890 1,528,992,043 2,880,803,214 22,061,300,714 55,153,251,785 33.63%
June 30, 2013 10,896,664,314 10,752,062,104 723,400,082 1,658,974,465 2,660,010,749 21,371,090,216 53,427,725,540 33.68%
June 30, 2014 11,183,385,556 10,556,075,940 687,309,657 1,671,292,251 2,430,432,837 21,667,630,567 54,169,076,418 33.49%
June 30, 2015 11,687,041,707 11,151,391,836 683,832,400 1,554,353,314 2,599,674,413 22,476,944,844 56,192,362,110 33.19%
June 30, 2016 12,848,381,757 12,774,083,537 711,630,623 1,503,577,204 2,874,052,314 24,963,620,807 62,409,052,018 33.49%
June 30, 2017 13,444,916,986 12,741,070,429 746,742,197 1,357,032,493 2,726,925,124 25,562,836,981 63,907,092,453 32.60%
June 30, 2018 13,493,027,408 14,154,056,870 843,130,074 1,210,968,574 2,985,921,567 26,715,261,359 66,788,153,398 32.56%
Source: Statistical section of the City of Atlanta, Georgia Comprehensive Annual Financial Report For the Fiscal Year Ended June 30, 2018.
Notes: 1 Other Property consists of Historical, Agricultural, Conservation, Utility, Motor Vehicle, Heavy Equipment, Timber, Motor Homes, etc.2 Tax Exempt Property consists of Basic Homestead, Elderly, Disabled Veteran, Freeport, etc.3 Assessed values are established by the Fulton & DeKalb Counties Board of Tax Assessors on January 1 of each year at 40% of the market value
as required by State Law.
Atlanta Independent School SystemAssessed and Estimated Actual Value of Taxable Property
Last Ten Fiscal YearsSchedule 7
92
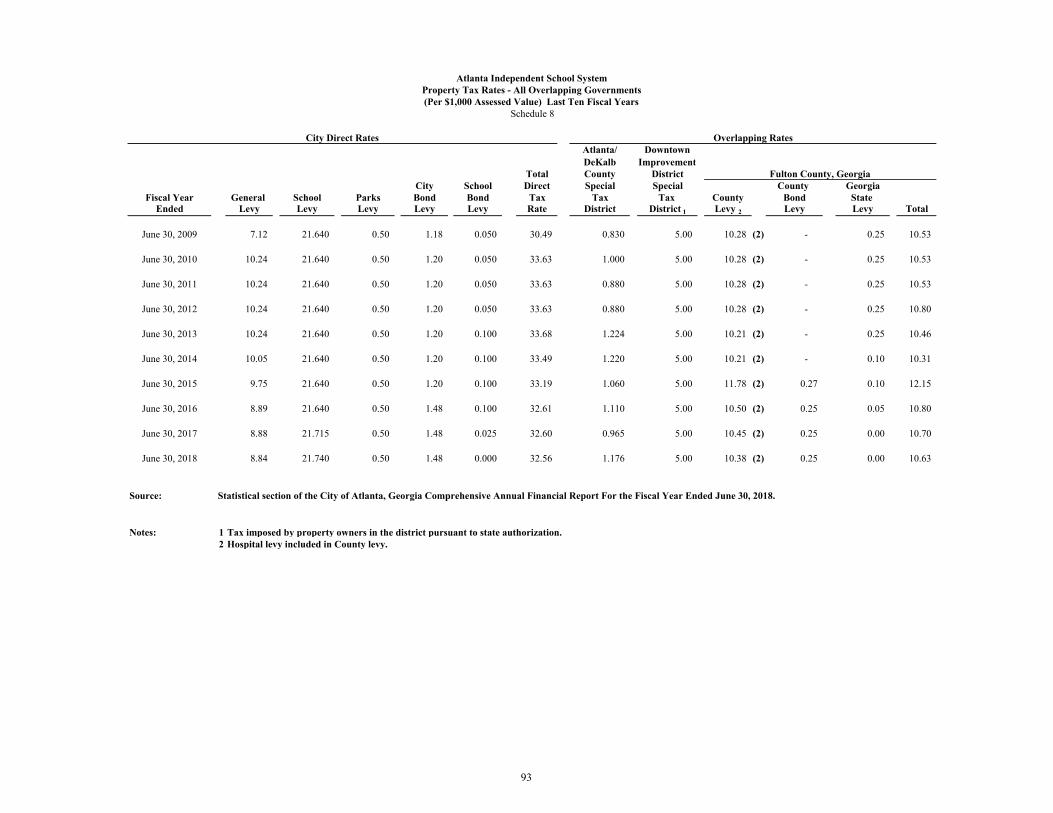
Atlanta/ DowntownDeKalb Improvement
Total County DistrictCity School Direct Special Special County Georgia
Fiscal Year General School Parks Bond Bond Tax Tax Tax County Bond State Ended Levy Levy Levy Levy Levy Rate District District 1 Levy 2 Levy Levy Total
June 30, 2009 7.12 21.640 0.50 1.18 0.050 30.49 0.830 5.00 10.28 (2) - 0.25 10.53
June 30, 2010 10.24 21.640 0.50 1.20 0.050 33.63 1.000 5.00 10.28 (2) - 0.25 10.53
June 30, 2011 10.24 21.640 0.50 1.20 0.050 33.63 0.880 5.00 10.28 (2) - 0.25 10.53
June 30, 2012 10.24 21.640 0.50 1.20 0.050 33.63 0.880 5.00 10.28 (2) - 0.25 10.80
June 30, 2013 10.24 21.640 0.50 1.20 0.100 33.68 1.224 5.00 10.21 (2) - 0.25 10.46
June 30, 2014 10.05 21.640 0.50 1.20 0.100 33.49 1.220 5.00 10.21 (2) - 0.10 10.31
June 30, 2015 9.75 21.640 0.50 1.20 0.100 33.19 1.060 5.00 11.78 (2) 0.27 0.10 12.15
June 30, 2016 8.89 21.640 0.50 1.48 0.100 32.61 1.110 5.00 10.50 (2) 0.25 0.05 10.80
June 30, 2017 8.88 21.715 0.50 1.48 0.025 32.60 0.965 5.00 10.45 (2) 0.25 0.00 10.70
June 30, 2018 8.84 21.740 0.50 1.48 0.000 32.56 1.176 5.00 10.38 (2) 0.25 0.00 10.63
Source: Statistical section of the City of Atlanta, Georgia Comprehensive Annual Financial Report For the Fiscal Year Ended June 30, 2018.
Notes: 1 Tax imposed by property owners in the district pursuant to state authorization.2 Hospital levy included in County levy.
Fulton County, Georgia
Atlanta Independent School SystemProperty Tax Rates - All Overlapping Governments(Per $1,000 Assessed Value) Last Ten Fiscal Years
City Direct Rates Overlapping Rates
Schedule 8
93
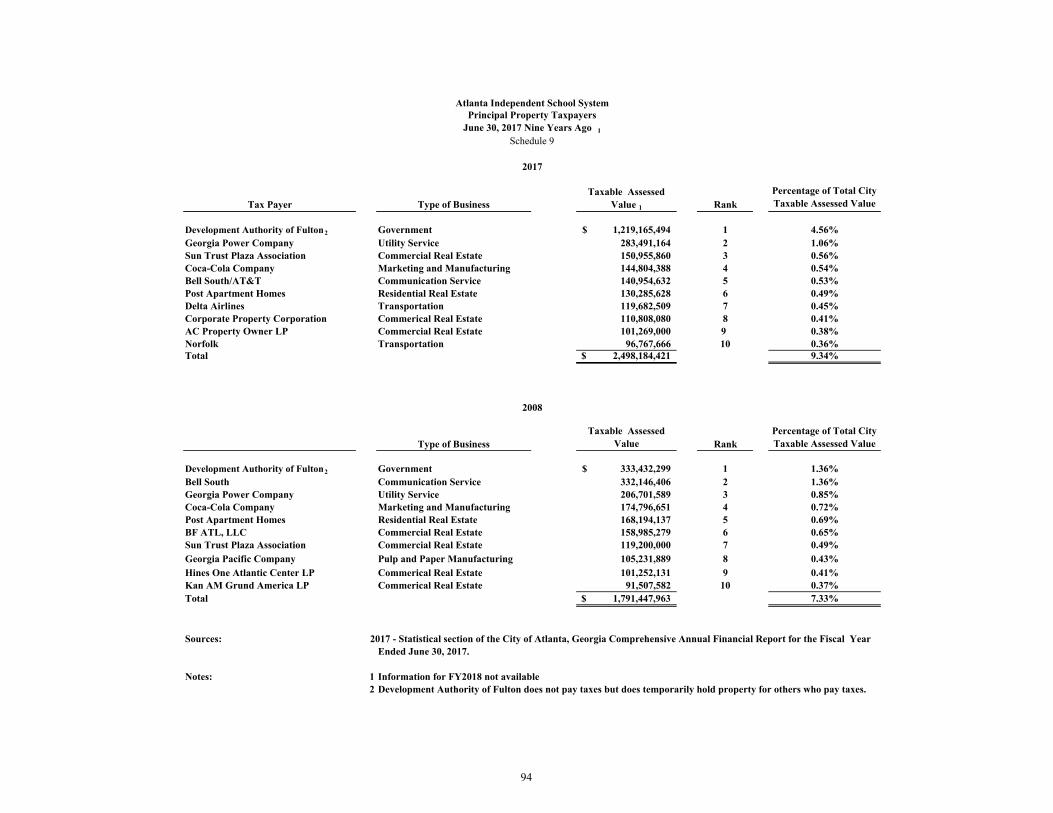
Tax Payer Type of BusinessTaxable Assessed
Value 1 RankPercentage of Total City Taxable Assessed Value
Development Authority of Fulton 2 Government 1,219,165,494$ 1 4.56%Georgia Power Company Utility Service 283,491,164 2 1.06%Sun Trust Plaza Association Commercial Real Estate 150,955,860 3 0.56%Coca-Cola Company Marketing and Manufacturing 144,804,388 4 0.54%Bell South/AT&T Communication Service 140,954,632 5 0.53%Post Apartment Homes Residential Real Estate 130,285,628 6 0.49%Delta Airlines Transportation 119,682,509 7 0.45%Corporate Property Corporation Commerical Real Estate 110,808,080 8 0.41%AC Property Owner LP Commercial Real Estate 101,269,000 9 0.38%Norfolk Transportation 96,767,666 10 0.36%Total 2,498,184,421$ 9.34%
Type of BusinessTaxable Assessed
Value RankPercentage of Total City Taxable Assessed Value
Development Authority of Fulton 2 Government 333,432,299$ 1 1.36%Bell South Communication Service 332,146,406 2 1.36%Georgia Power Company Utility Service 206,701,589 3 0.85%Coca-Cola Company Marketing and Manufacturing 174,796,651 4 0.72%Post Apartment Homes Residential Real Estate 168,194,137 5 0.69%BF ATL, LLC Commercial Real Estate 158,985,279 6 0.65%Sun Trust Plaza Association Commercial Real Estate 119,200,000 7 0.49%Georgia Pacific Company Pulp and Paper Manufacturing 105,231,889 8 0.43%Hines One Atlantic Center LP Commerical Real Estate 101,252,131 9 0.41%Kan AM Grund America LP Commerical Real Estate 91,507,582 10 0.37%Total 1,791,447,963$ 7.33%
Sources: 2017 - Statistical section of the City of Atlanta, Georgia Comprehensive Annual Financial Report for the Fiscal Year Ended June 30, 2017.
Notes: 1 Information for FY2018 not available2 Development Authority of Fulton does not pay taxes but does temporarily hold property for others who pay taxes.
2008
Atlanta Independent School SystemPrincipal Property Taxpayers
June 30, 2017 Nine Years Ago 1
Schedule 9
2017
94
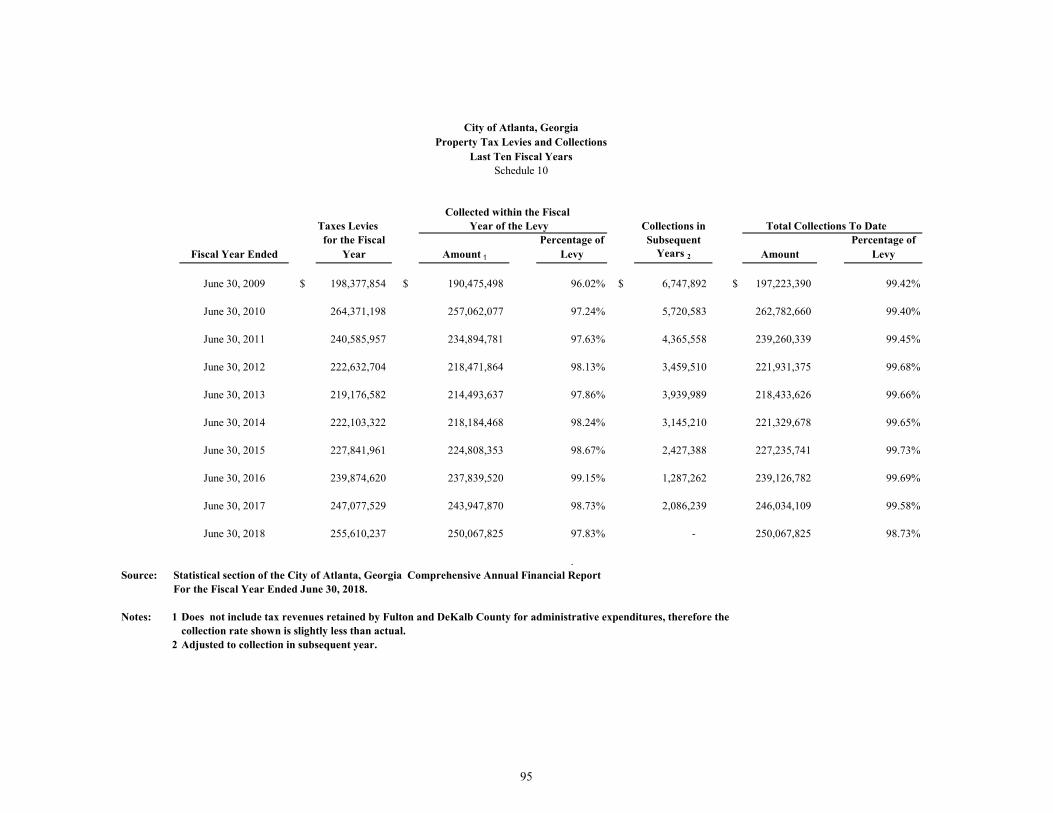
Collected within the Fiscal Taxes Levies Year of the Levy Collections in Total Collections To Datefor the Fiscal Percentage of Subsequent Percentage of
Fiscal Year Ended Year Amount 1 Levy Years 2 Amount Levy
June 30, 2009 $ 198,377,854 $ 190,475,498 96.02% $ 6,747,892 $ 197,223,390 99.42%
June 30, 2010 264,371,198 257,062,077 97.24% 5,720,583 262,782,660 99.40%
June 30, 2011 240,585,957 234,894,781 97.63% 4,365,558 239,260,339 99.45%
June 30, 2012 222,632,704 218,471,864 98.13% 3,459,510 221,931,375 99.68%
June 30, 2013 219,176,582 214,493,637 97.86% 3,939,989 218,433,626 99.66%
June 30, 2014 222,103,322 218,184,468 98.24% 3,145,210 221,329,678 99.65%
June 30, 2015 227,841,961 224,808,353 98.67% 2,427,388 227,235,741 99.73%
June 30, 2016 239,874,620 237,839,520 99.15% 1,287,262 239,126,782 99.69%
June 30, 2017 247,077,529 243,947,870 98.73% 2,086,239 246,034,109 99.58%
June 30, 2018 255,610,237 250,067,825 97.83% - 250,067,825 98.73%
.Source: Statistical section of the City of Atlanta, Georgia Comprehensive Annual Financial Report
For the Fiscal Year Ended June 30, 2018.
Notes: 1 Does not include tax revenues retained by Fulton and DeKalb County for administrative expenditures, therefore thecollection rate shown is slightly less than actual.
2 Adjusted to collection in subsequent year.
City of Atlanta, GeorgiaProperty Tax Levies and Collections
Last Ten Fiscal YearsSchedule 10
95

MAINTENANCEAND DEBT
TOTAL RATE OPERATION SERVICE
Atlanta Public Schools 21.74 21.74 0.00
Clayton County Schools 19.10 19.10 0.00
Cobb County Schools 18.90 18.90 0.00
DeKalb County Schools 23.28 23.28 0.00
Douglas County Schools 20.95 19.75 1.20
Fulton County Schools 18.55 18.55 0.00
Gwinnett County Schools 21.85 19.80 2.05
Rockdale County Schools 25.32 25.32 0.00
Sources: Department of Revenue, Tax Digest Millage Rates
Note: All tax rates are per $1000 assessed valuation.
Atlanta Independent School SystemComparison of Property Tax Millage Rates
As of June 30, 2018Schedule 11
96
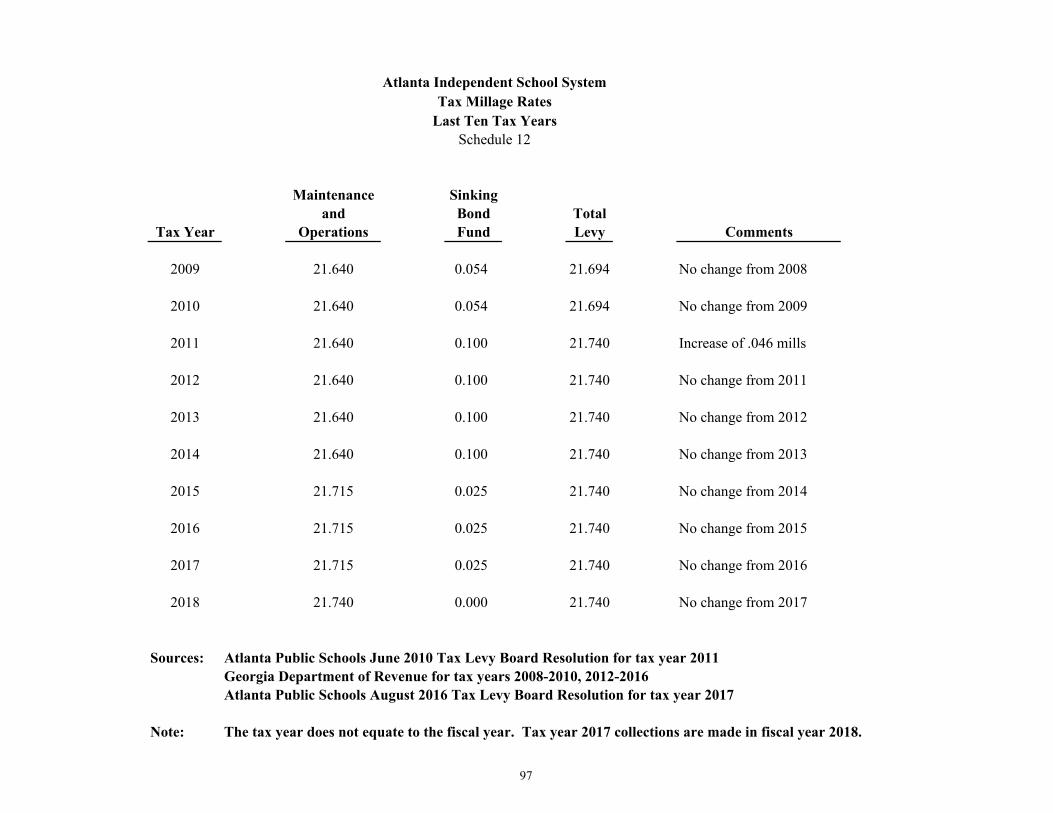
Atlanta Independent School SystemTax Millage Rates
Last Ten Tax YearsSchedule 12
Maintenance Sinkingand Bond Total
Tax Year Operations Fund Levy Comments
2009 21.640 0.054 21.694 No change from 2008
2010 21.640 0.054 21.694 No change from 2009
2011 21.640 0.100 21.740 Increase of .046 mills
2012 21.640 0.100 21.740 No change from 2011
2013 21.640 0.100 21.740 No change from 2012
2014 21.640 0.100 21.740 No change from 2013
2015 21.715 0.025 21.740 No change from 2014
2016 21.715 0.025 21.740 No change from 2015
2017 21.715 0.025 21.740 No change from 2016
2018 21.740 0.000 21.740 No change from 2017
Sources: Atlanta Public Schools June 2010 Tax Levy Board Resolution for tax year 2011Georgia Department of Revenue for tax years 2008-2010, 2012-2016Atlanta Public Schools August 2016 Tax Levy Board Resolution for tax year 2017
Note: The tax year does not equate to the fiscal year. Tax year 2017 collections are made in fiscal year 2018.
97
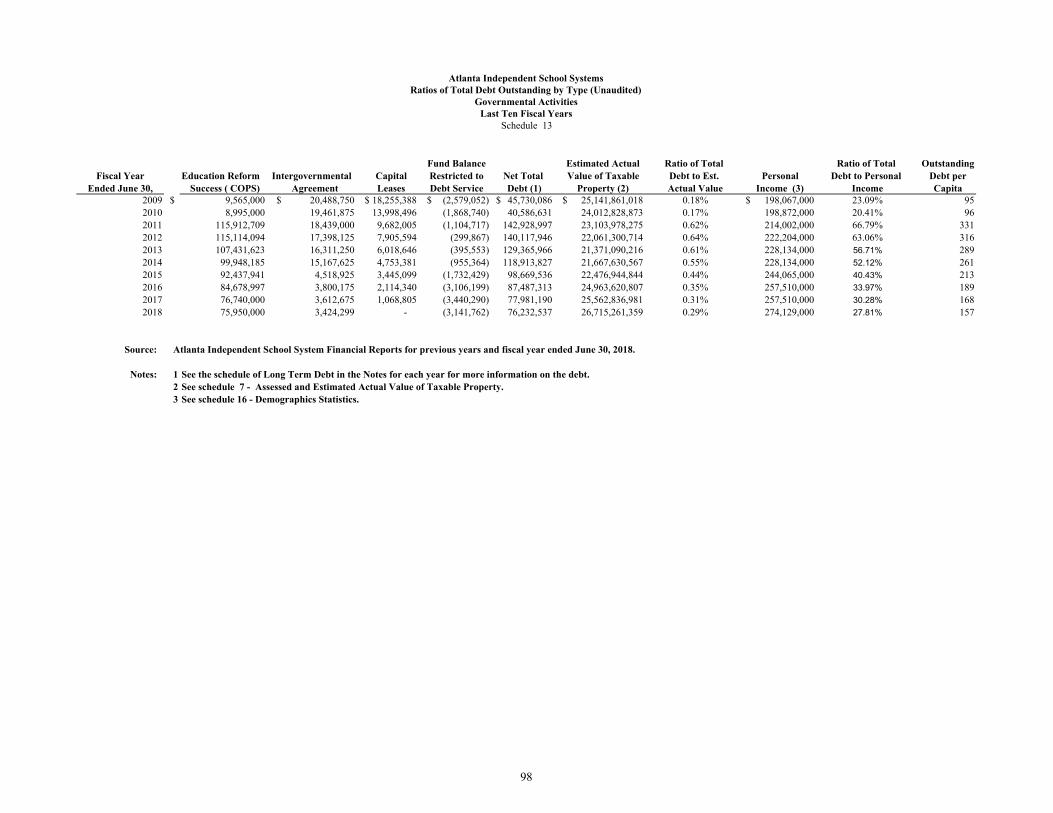
Fund Balance Estimated Actual Ratio of Total Ratio of Total OutstandingFiscal Year Education Reform Intergovernmental Capital Restricted to Net Total Value of Taxable Debt to Est. Personal Debt to Personal Debt per
Ended June 30, Success ( COPS) Agreement Leases Debt Service Debt (1) Property (2) Actual Value Income (3) Income Capita2009 $ 9,565,000 20,488,750$ 18,255,388$ (2,579,052)$ 45,730,086$ 25,141,861,018$ 0.18% 198,067,000$ 23.09% 952010 8,995,000 19,461,875 13,998,496 (1,868,740) 40,586,631 24,012,828,873 0.17% 198,872,000 20.41% 962011 115,912,709 18,439,000 9,682,005 (1,104,717) 142,928,997 23,103,978,275 0.62% 214,002,000 66.79% 3312012 115,114,094 17,398,125 7,905,594 (299,867) 140,117,946 22,061,300,714 0.64% 222,204,000 63.06% 3162013 107,431,623 16,311,250 6,018,646 (395,553) 129,365,966 21,371,090,216 0.61% 228,134,000 56.71% 2892014 99,948,185 15,167,625 4,753,381 (955,364) 118,913,827 21,667,630,567 0.55% 228,134,000 52.12% 2612015 92,437,941 4,518,925 3,445,099 (1,732,429) 98,669,536 22,476,944,844 0.44% 244,065,000 40.43% 2132016 84,678,997 3,800,175 2,114,340 (3,106,199) 87,487,313 24,963,620,807 0.35% 257,510,000 33.97% 1892017 76,740,000 3,612,675 1,068,805 (3,440,290) 77,981,190 25,562,836,981 0.31% 257,510,000 30.28% 1682018 75,950,000 3,424,299 - (3,141,762) 76,232,537 26,715,261,359 0.29% 274,129,000 27.81% 157
Source: Atlanta Independent School System Financial Reports for previous years and fiscal year ended June 30, 2018.
Notes: 1 See the schedule of Long Term Debt in the Notes for each year for more information on the debt.2 See schedule 7 - Assessed and Estimated Actual Value of Taxable Property.3 See schedule 16 - Demographics Statistics.
Atlanta Independent School SystemsRatios of Total Debt Outstanding by Type (Unaudited)
Governmental ActivitiesLast Ten Fiscal Years
Schedule 13
98
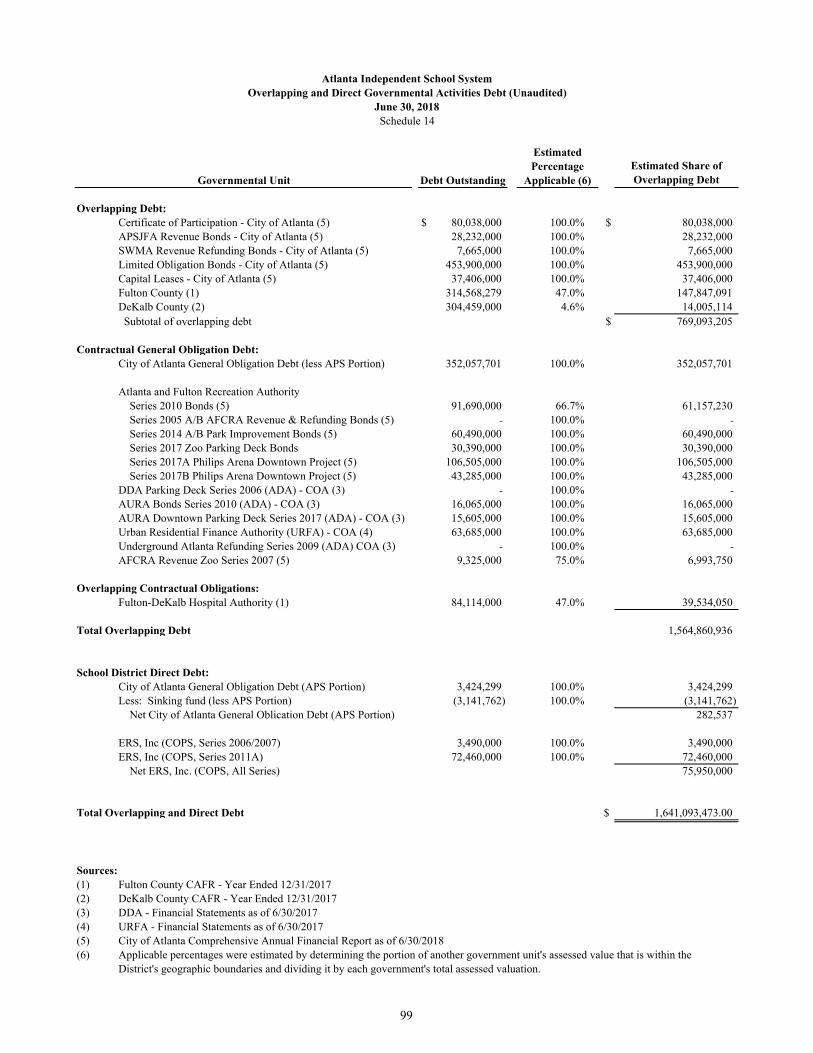
Estimated Share of Overlapping Debt
Overlapping Debt:Certificate of Participation - City of Atlanta (5) $ 80,038,000 100.0% $ 80,038,000APSJFA Revenue Bonds - City of Atlanta (5) 28,232,000 100.0% 28,232,000SWMA Revenue Refunding Bonds - City of Atlanta (5) 7,665,000 100.0% 7,665,000Limited Obligation Bonds - City of Atlanta (5) 453,900,000 100.0% 453,900,000Capital Leases - City of Atlanta (5) 37,406,000 100.0% 37,406,000Fulton County (1) 314,568,279 47.0% 147,847,091DeKalb County (2) 304,459,000 4.6% 14,005,114 Subtotal of overlapping debt $ 769,093,205
Contractual General Obligation Debt:City of Atlanta General Obligation Debt (less APS Portion) 352,057,701 100.0% 352,057,701
Atlanta and Fulton Recreation Authority Series 2010 Bonds (5) 91,690,000 66.7% 61,157,230 Series 2005 A/B AFCRA Revenue & Refunding Bonds (5) - 100.0% -
Series 2014 A/B Park Improvement Bonds (5) 60,490,000 100.0% 60,490,000 Series 2017 Zoo Parking Deck Bonds 30,390,000 100.0% 30,390,000 Series 2017A Philips Arena Downtown Project (5) 106,505,000 100.0% 106,505,000 Series 2017B Philips Arena Downtown Project (5) 43,285,000 100.0% 43,285,000DDA Parking Deck Series 2006 (ADA) - COA (3) - 100.0% -
AURA Bonds Series 2010 (ADA) - COA (3) 16,065,000 100.0% 16,065,000AURA Downtown Parking Deck Series 2017 (ADA) - COA (3) 15,605,000 100.0% 15,605,000Urban Residential Finance Authority (URFA) - COA (4) 63,685,000 100.0% 63,685,000Underground Atlanta Refunding Series 2009 (ADA) COA (3) - 100.0% -
AFCRA Revenue Zoo Series 2007 (5) 9,325,000 75.0% 6,993,750
Overlapping Contractual Obligations:Fulton-DeKalb Hospital Authority (1) 84,114,000 47.0% 39,534,050
Total Overlapping Debt 1,564,860,936
School District Direct Debt:City of Atlanta General Obligation Debt (APS Portion) 3,424,299 100.0% 3,424,299Less: Sinking fund (less APS Portion) (3,141,762) 100.0% (3,141,762) Net City of Atlanta General Oblication Debt (APS Portion) 282,537
ERS, Inc (COPS, Series 2006/2007) 3,490,000 100.0% 3,490,000ERS, Inc (COPS, Series 2011A) 72,460,000 100.0% 72,460,000 Net ERS, Inc. (COPS, All Series) 75,950,000
Total Overlapping and Direct Debt $ 1,641,093,473.00
Sources: (1) Fulton County CAFR - Year Ended 12/31/2017(2) DeKalb County CAFR - Year Ended 12/31/2017(3) DDA - Financial Statements as of 6/30/2017(4) URFA - Financial Statements as of 6/30/2017(5) City of Atlanta Comprehensive Annual Financial Report as of 6/30/2018(6) Applicable percentages were estimated by determining the portion of another government unit's assessed value that is within the
District's geographic boundaries and dividing it by each government's total assessed valuation.
Atlanta Independent School SystemOverlapping and Direct Governmental Activities Debt (Unaudited)
June 30, 2018Schedule 14
Estimated Percentage
Applicable (6)Debt OutstandingGovernmental Unit
99
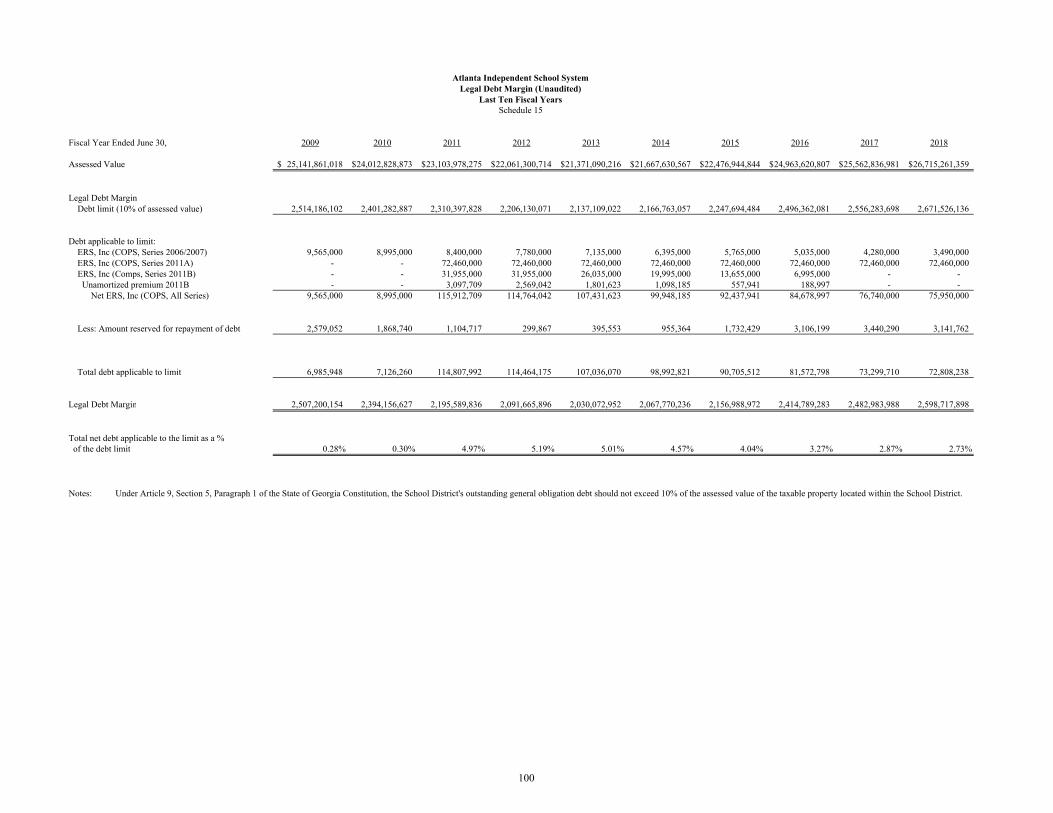
Fiscal Year Ended June 30, 2009 2010 2011 2012 2013 2014 2015 2016 2017 2018
Assessed Value 25,141,861,018$ 24,012,828,873$ 23,103,978,275$ 22,061,300,714$ 21,371,090,216$ 21,667,630,567$ 22,476,944,844$ 24,963,620,807$ 25,562,836,981$ 26,715,261,359$
Legal Debt Margin Debt limit (10% of assessed value) 2,514,186,102 2,401,282,887 2,310,397,828 2,206,130,071 2,137,109,022 2,166,763,057 2,247,694,484 2,496,362,081 2,556,283,698 2,671,526,136
Debt applicable to limit: ERS, Inc (COPS, Series 2006/2007) 9,565,000 8,995,000 8,400,000 7,780,000 7,135,000 6,395,000 5,765,000 5,035,000 4,280,000 3,490,000 ERS, Inc (COPS, Series 2011A) - - 72,460,000 72,460,000 72,460,000 72,460,000 72,460,000 72,460,000 72,460,000 72,460,000 ERS, Inc (Comps, Series 2011B) - - 31,955,000 31,955,000 26,035,000 19,995,000 13,655,000 6,995,000 - - Unamortized premium 2011B - - 3,097,709 2,569,042 1,801,623 1,098,185 557,941 188,997 - - Net ERS, Inc (COPS, All Series) 9,565,000 8,995,000 115,912,709 114,764,042 107,431,623 99,948,185 92,437,941 84,678,997 76,740,000 75,950,000
Less: Amount reserved for repayment of debt 2,579,052 1,868,740 1,104,717 299,867 395,553 955,364 1,732,429 3,106,199 3,440,290 3,141,762
Total debt applicable to limit 6,985,948 7,126,260 114,807,992 114,464,175 107,036,070 98,992,821 90,705,512 81,572,798 73,299,710 72,808,238
Legal Debt Margin 2,507,200,154 2,394,156,627 2,195,589,836 2,091,665,896 2,030,072,952 2,067,770,236 2,156,988,972 2,414,789,283 2,482,983,988 2,598,717,898
Total net debt applicable to the limit as a % of the debt limit 0.28% 0.30% 4.97% 5.19% 5.01% 4.57% 4.04% 3.27% 2.87% 2.73%
Notes: Under Article 9, Section 5, Paragraph 1 of the State of Georgia Constitution, the School District's outstanding general obligation debt should not exceed 10% of the assessed value of the taxable property located within the School District.
Atlanta Independent School SystemLegal Debt Margin (Unaudited)
Last Ten Fiscal YearsSchedule 15
100
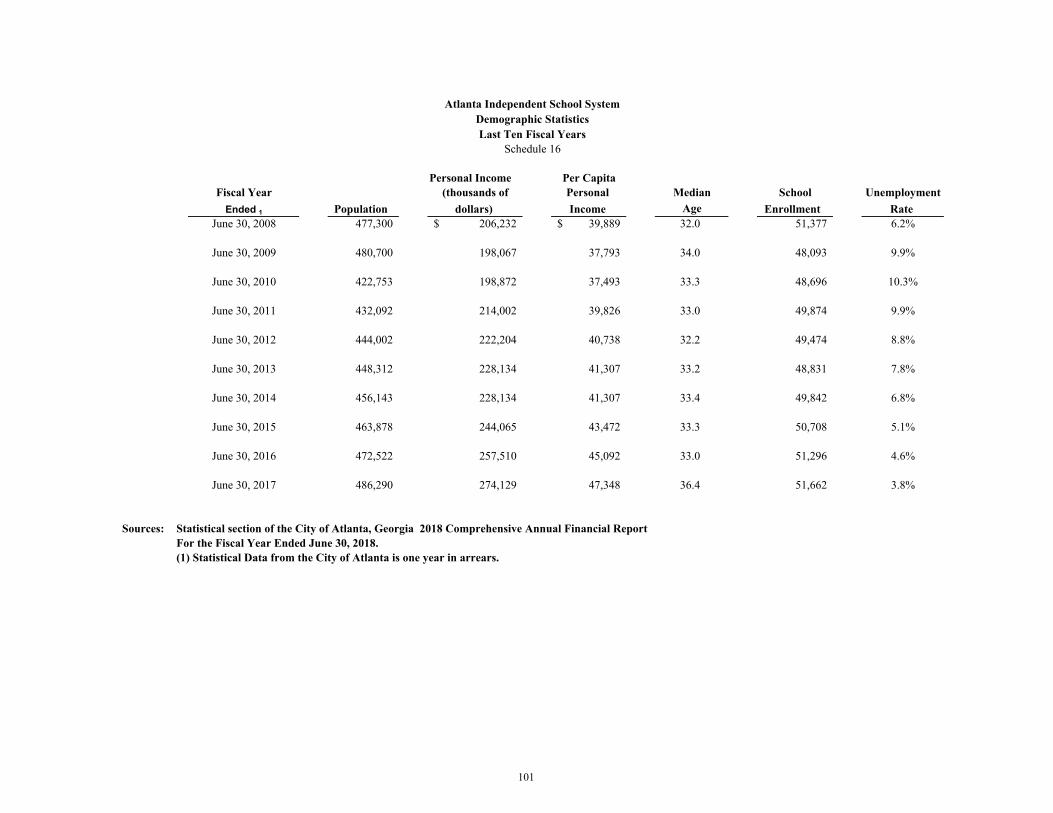
Personal Income Per CapitaFiscal Year (thousands of Personal Median School Unemployment
Ended 1 Population dollars) Income Age Enrollment Rate June 30, 2008 477,300 206,232$ 39,889$ 32.0 51,377 6.2%
June 30, 2009 480,700 198,067 37,793 34.0 48,093 9.9%
June 30, 2010 422,753 198,872 37,493 33.3 48,696 10.3%
June 30, 2011 432,092 214,002 39,826 33.0 49,874 9.9%
June 30, 2012 444,002 222,204 40,738 32.2 49,474 8.8%
June 30, 2013 448,312 228,134 41,307 33.2 48,831 7.8%
June 30, 2014 456,143 228,134 41,307 33.4 49,842 6.8%
June 30, 2015 463,878 244,065 43,472 33.3 50,708 5.1%
June 30, 2016 472,522 257,510 45,092 33.0 51,296 4.6%
June 30, 2017 486,290 274,129 47,348 36.4 51,662 3.8%
Sources: Statistical section of the City of Atlanta, Georgia 2018 Comprehensive Annual Financial Report For the Fiscal Year Ended June 30, 2018.(1) Statistical Data from the City of Atlanta is one year in arrears.
Atlanta Independent School SystemDemographic StatisticsLast Ten Fiscal Years
Schedule 16
101
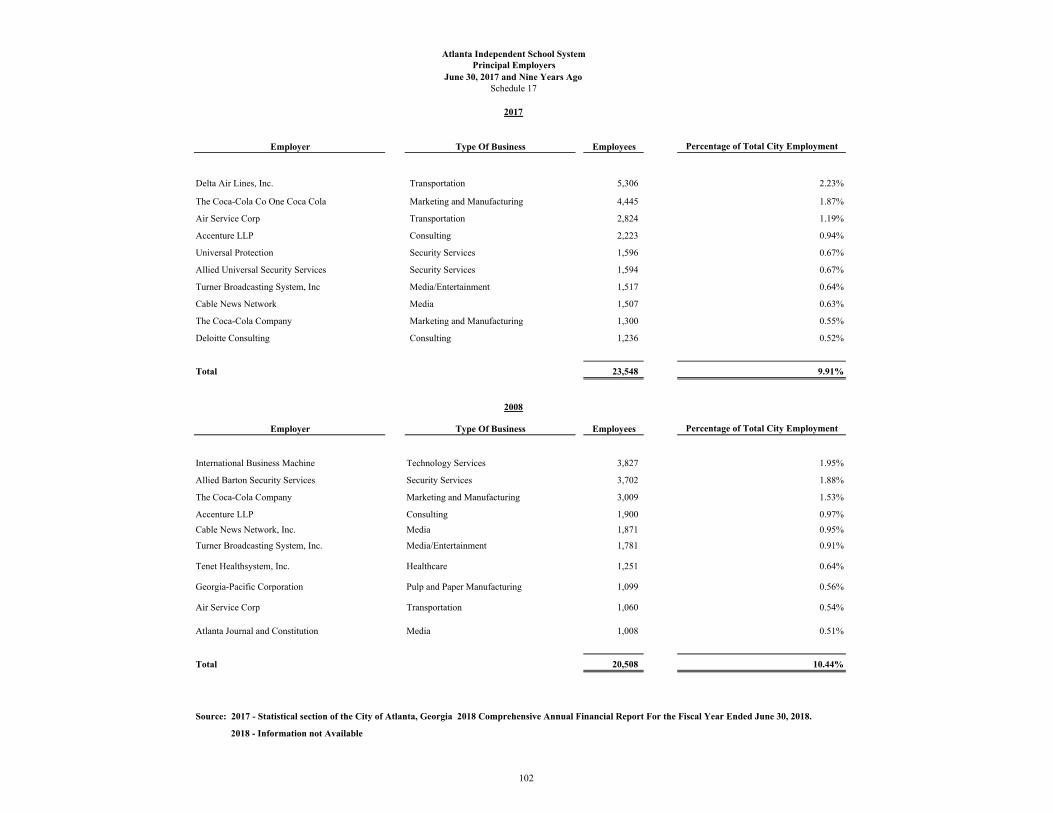
Employer Type Of Business Employees Percentage of Total City Employment
Delta Air Lines, Inc. Transportation 5,306 2.23%
The Coca-Cola Co One Coca Cola Marketing and Manufacturing 4,445 1.87%
Air Service Corp Transportation 2,824 1.19%
Accenture LLP Consulting 2,223 0.94%
Universal Protection Security Services 1,596 0.67%
Allied Universal Security Services Security Services 1,594 0.67%
Turner Broadcasting System, Inc Media/Entertainment 1,517 0.64%
Cable News Network Media 1,507 0.63%
The Coca-Cola Company Marketing and Manufacturing 1,300 0.55%
Deloitte Consulting Consulting 1,236 0.52%
Total 23,548 9.91%
Employer Type Of Business Employees Percentage of Total City Employment
International Business Machine Technology Services 3,827 1.95%
Allied Barton Security Services Security Services 3,702 1.88%
The Coca-Cola Company Marketing and Manufacturing 3,009 1.53%
Accenture LLP Consulting 1,900 0.97%
Cable News Network, Inc. Media 1,871 0.95%
Turner Broadcasting System, Inc. Media/Entertainment 1,781 0.91%
Tenet Healthsystem, Inc. Healthcare 1,251 0.64%
Georgia-Pacific Corporation Pulp and Paper Manufacturing 1,099 0.56%
Air Service Corp Transportation 1,060 0.54%
Atlanta Journal and Constitution Media 1,008 0.51%
Total 20,508 10.44%
Source: 2017 - Statistical section of the City of Atlanta, Georgia 2018 Comprehensive Annual Financial Report For the Fiscal Year Ended June 30, 2018.
2018 - Information not Available
2017
2008
Atlanta Independent School SystemPrincipal Employers
June 30, 2017 and Nine Years AgoSchedule 17
102
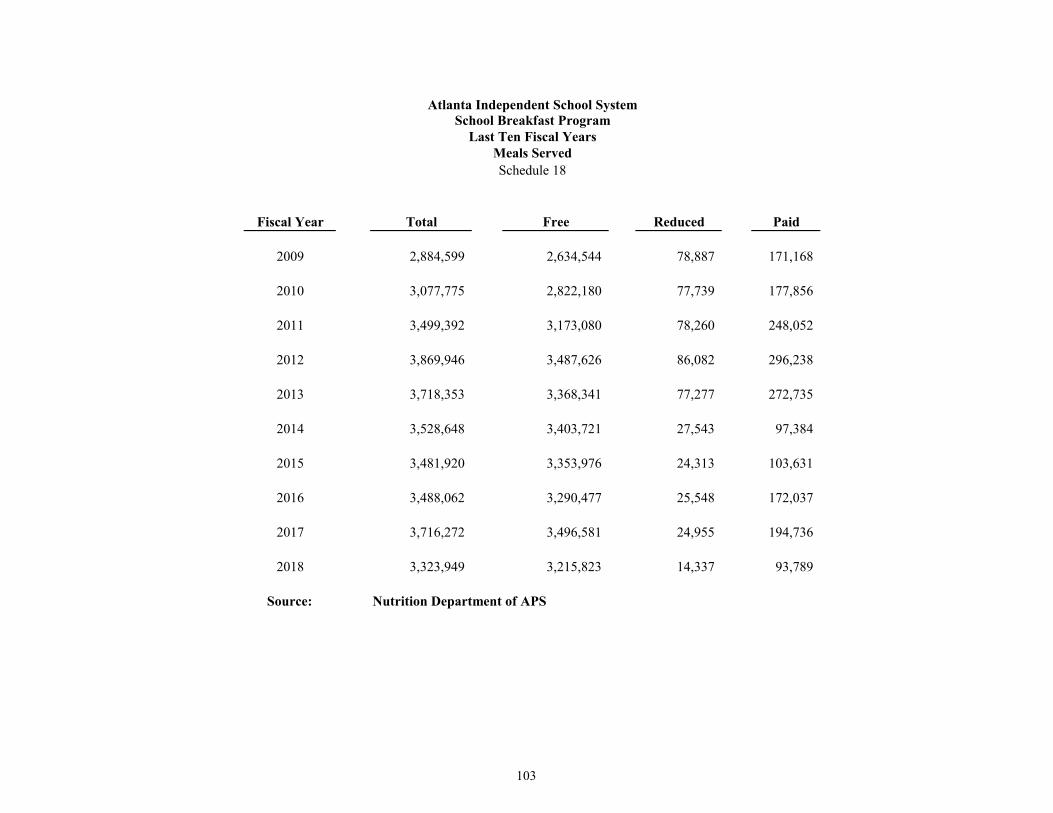
Fiscal Year Total Free Reduced Paid
2009 2,884,599 2,634,544 78,887 171,168
2010 3,077,775 2,822,180 77,739 177,856
2011 3,499,392 3,173,080 78,260 248,052
2012 3,869,946 3,487,626 86,082 296,238
2013 3,718,353 3,368,341 77,277 272,735
2014 3,528,648 3,403,721 27,543 97,384
2015 3,481,920 3,353,976 24,313 103,631
2016 3,488,062 3,290,477 25,548 172,037
2017 3,716,272 3,496,581 24,955 194,736
2018 3,323,949 3,215,823 14,337 93,789
Source: Nutrition Department of APS
Atlanta Independent School SystemSchool Breakfast Program
Last Ten Fiscal YearsMeals ServedSchedule 18
103
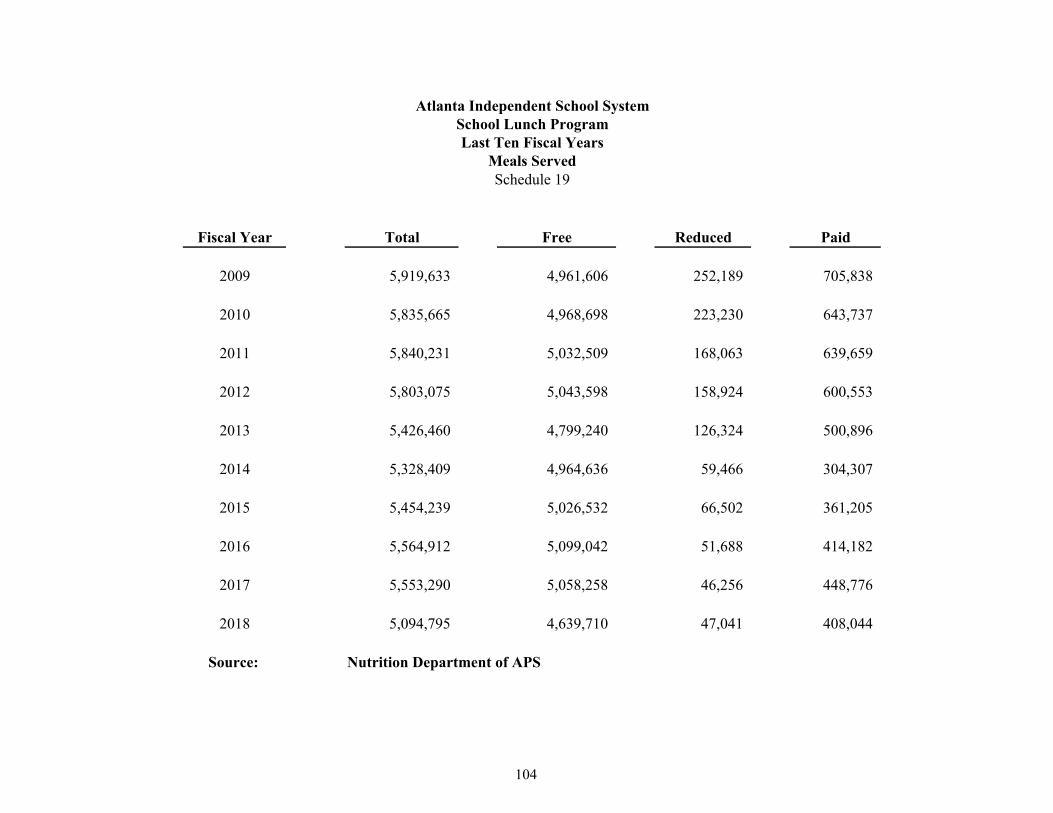
Fiscal Year Total Free Reduced Paid
2009 5,919,633 4,961,606 252,189 705,838
2010 5,835,665 4,968,698 223,230 643,737
2011 5,840,231 5,032,509 168,063 639,659
2012 5,803,075 5,043,598 158,924 600,553
2013 5,426,460 4,799,240 126,324 500,896
2014 5,328,409 4,964,636 59,466 304,307
2015 5,454,239 5,026,532 66,502 361,205
2016 5,564,912 5,099,042 51,688 414,182
2017 5,553,290 5,058,258 46,256 448,776
2018 5,094,795 4,639,710 47,041 408,044
Source: Nutrition Department of APS
Atlanta Independent School SystemSchool Lunch ProgramLast Ten Fiscal Years
Meals ServedSchedule 19
104
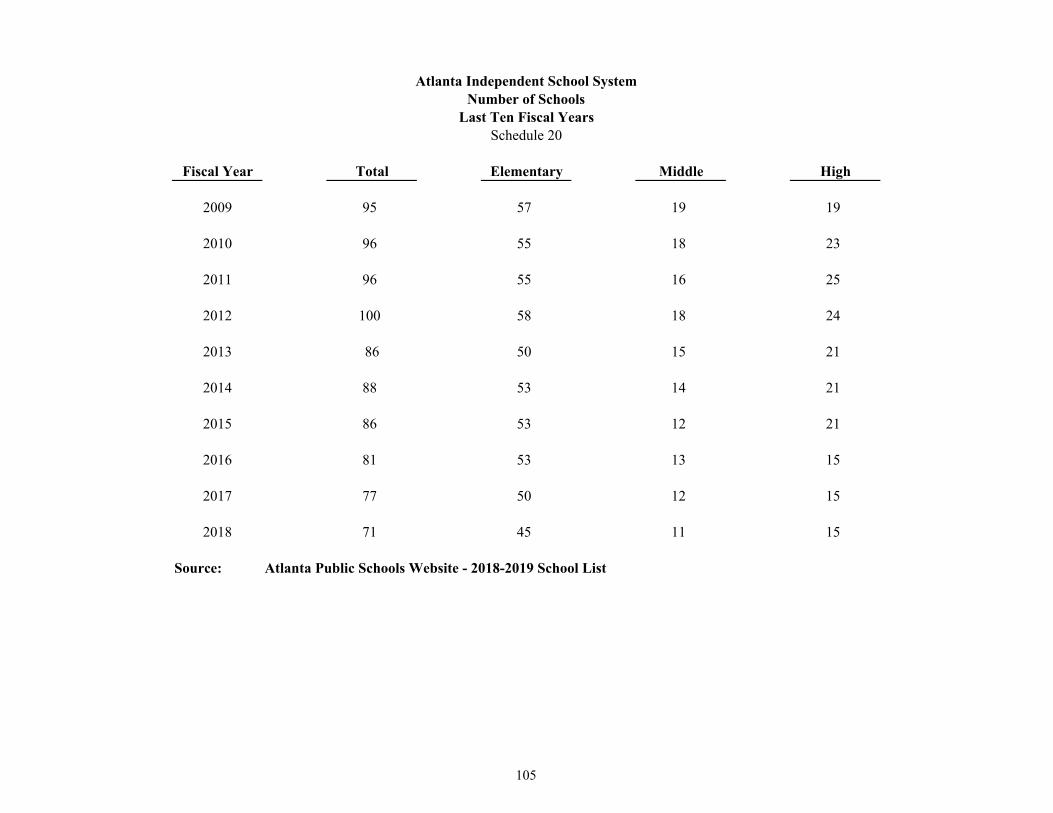
Fiscal Year Total Elementary Middle High
2009 95 57 19 19
2010 96 55 18 23
2011 96 55 16 25
2012 100 58 18 24
2013 86 50 15 21
2014 88 53 14 21
2015 86 53 12 21
2016 81 53 13 15
2017 77 50 12 15
2018 71 45 11 15
Source: Atlanta Public Schools Website - 2018-2019 School List
Atlanta Independent School SystemNumber of Schools
Last Ten Fiscal YearsSchedule 20
105
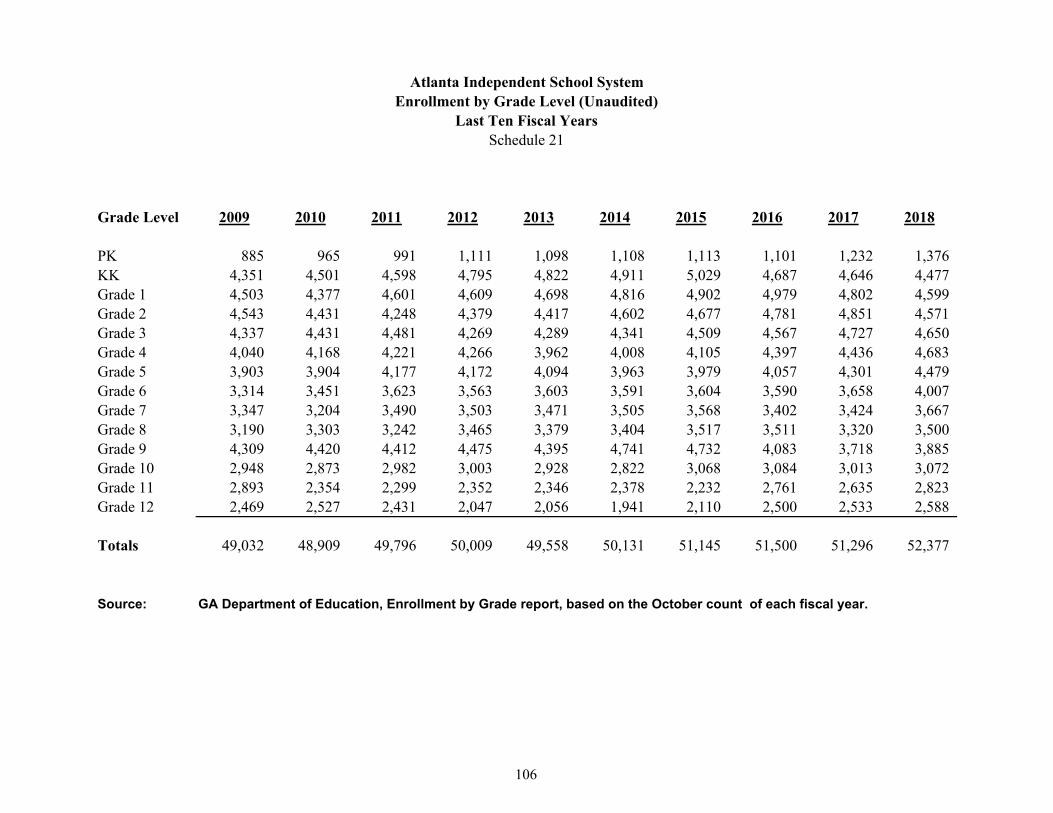
Grade Level 2009 2010 2011 2012 2013 2014 2015 2016 2017 2018
PK 885 965 991 1,111 1,098 1,108 1,113 1,101 1,232 1,376KK 4,351 4,501 4,598 4,795 4,822 4,911 5,029 4,687 4,646 4,477Grade 1 4,503 4,377 4,601 4,609 4,698 4,816 4,902 4,979 4,802 4,599Grade 2 4,543 4,431 4,248 4,379 4,417 4,602 4,677 4,781 4,851 4,571Grade 3 4,337 4,431 4,481 4,269 4,289 4,341 4,509 4,567 4,727 4,650Grade 4 4,040 4,168 4,221 4,266 3,962 4,008 4,105 4,397 4,436 4,683Grade 5 3,903 3,904 4,177 4,172 4,094 3,963 3,979 4,057 4,301 4,479Grade 6 3,314 3,451 3,623 3,563 3,603 3,591 3,604 3,590 3,658 4,007Grade 7 3,347 3,204 3,490 3,503 3,471 3,505 3,568 3,402 3,424 3,667Grade 8 3,190 3,303 3,242 3,465 3,379 3,404 3,517 3,511 3,320 3,500Grade 9 4,309 4,420 4,412 4,475 4,395 4,741 4,732 4,083 3,718 3,885Grade 10 2,948 2,873 2,982 3,003 2,928 2,822 3,068 3,084 3,013 3,072Grade 11 2,893 2,354 2,299 2,352 2,346 2,378 2,232 2,761 2,635 2,823Grade 12 2,469 2,527 2,431 2,047 2,056 1,941 2,110 2,500 2,533 2,588
Totals 49,032 48,909 49,796 50,009 49,558 50,131 51,145 51,500 51,296 52,377
Source: GA Department of Education, Enrollment by Grade report, based on the October count of each fiscal year.
Atlanta Independent School SystemEnrollment by Grade Level (Unaudited)
Last Ten Fiscal YearsSchedule 21
106
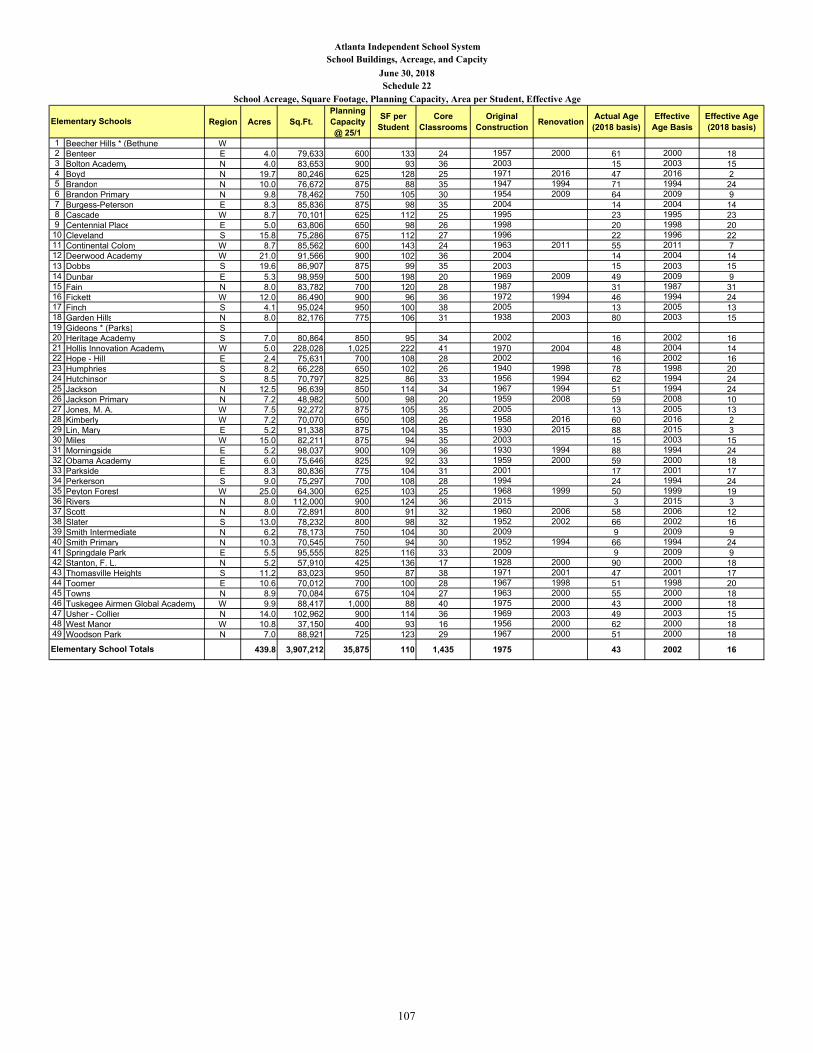
Region Acres Sq.Ft.Planning Capacity @ 25/1
SF per Student
Core Classrooms
Original Construction Renovation Actual Age
(2018 basis)Effective
Age BasisEffective Age (2018 basis)
1 Beecher Hills * (Bethune) W2 Benteen E 4.0 79,633 600 133 24 1957 2000 61 2000 183 Bolton Academy N 4.0 83,653 900 93 36 2003 15 2003 154 Boyd N 19.7 80,246 625 128 25 1971 2016 47 2016 25 Brandon N 10.0 76,672 875 88 35 1947 1994 71 1994 246 Brandon Primary N 9.8 78,462 750 105 30 1954 2009 64 2009 97 Burgess-Peterson E 8.3 85,836 875 98 35 2004 14 2004 148 Cascade W 8.7 70,101 625 112 25 1995 23 1995 239 Centennial Place E 5.0 63,806 650 98 26 1998 20 1998 20
10 Cleveland S 15.8 75,286 675 112 27 1996 22 1996 2211 Continental Colony W 8.7 85,562 600 143 24 1963 2011 55 2011 712 Deerwood Academy W 21.0 91,566 900 102 36 2004 14 2004 1413 Dobbs S 19.6 86,907 875 99 35 2003 15 2003 1514 Dunbar E 5.3 98,959 500 198 20 1969 2009 49 2009 915 Fain N 8.0 83,782 700 120 28 1987 31 1987 3116 Fickett W 12.0 86,490 900 96 36 1972 1994 46 1994 2417 Finch S 4.1 95,024 950 100 38 2005 13 2005 1318 Garden Hills N 8.0 82,176 775 106 31 1938 2003 80 2003 1519 Gideons * (Parks) S20 Heritage Academy S 7.0 80,864 850 95 34 2002 16 2002 1621 Hollis Innovation Academy W 5.0 228,028 1,025 222 41 1970 2004 48 2004 1422 Hope - Hill E 2.4 75,631 700 108 28 2002 16 2002 1623 Humphries S 8.2 66,228 650 102 26 1940 1998 78 1998 2024 Hutchinson S 8.5 70,797 825 86 33 1956 1994 62 1994 2425 Jackson N 12.5 96,639 850 114 34 1967 1994 51 1994 2426 Jackson Primary N 7.2 48,982 500 98 20 1959 2008 59 2008 1027 Jones, M. A. W 7.5 92,272 875 105 35 2005 13 2005 1328 Kimberly W 7.2 70,070 650 108 26 1958 2016 60 2016 229 Lin, Mary E 5.2 91,338 875 104 35 1930 2015 88 2015 330 Miles W 15.0 82,211 875 94 35 2003 15 2003 1531 Morningside E 5.2 98,037 900 109 36 1930 1994 88 1994 2432 Obama Academy E 6.0 75,646 825 92 33 1959 2000 59 2000 1833 Parkside E 8.3 80,836 775 104 31 2001 17 2001 1734 Perkerson S 9.0 75,297 700 108 28 1994 24 1994 2435 Peyton Forest W 25.0 64,300 625 103 25 1968 1999 50 1999 1936 Rivers N 8.0 112,000 900 124 36 2015 3 2015 337 Scott N 8.0 72,891 800 91 32 1960 2006 58 2006 1238 Slater S 13.0 78,232 800 98 32 1952 2002 66 2002 1639 Smith Intermediate N 6.2 78,173 750 104 30 2009 9 2009 940 Smith Primary N 10.3 70,545 750 94 30 1952 1994 66 1994 2441 Springdale Park E 5.5 95,555 825 116 33 2009 9 2009 942 Stanton, F. L. N 5.2 57,910 425 136 17 1928 2000 90 2000 1843 Thomasville Heights S 11.2 83,023 950 87 38 1971 2001 47 2001 1744 Toomer E 10.6 70,012 700 100 28 1967 1998 51 1998 2045 Towns N 8.9 70,084 675 104 27 1963 2000 55 2000 1846 Tuskegee Airmen Global Academy W 9.9 88,417 1,000 88 40 1975 2000 43 2000 1847 Usher - Collier N 14.0 102,962 900 114 36 1969 2003 49 2003 1548 West Manor W 10.8 37,150 400 93 16 1956 2000 62 2000 1849 Woodson Park N 7.0 88,921 725 123 29 1967 2000 51 2000 18
439.8 3,907,212 35,875 110 1,435 1975 43 2002 16
Atlanta Independent School SystemSchool Buildings, Acreage, and Capcity
June 30, 2018
School Acreage, Square Footage, Planning Capacity, Area per Student, Effective AgeSchedule 22
Elementary Schools
Elementary School Totals
107
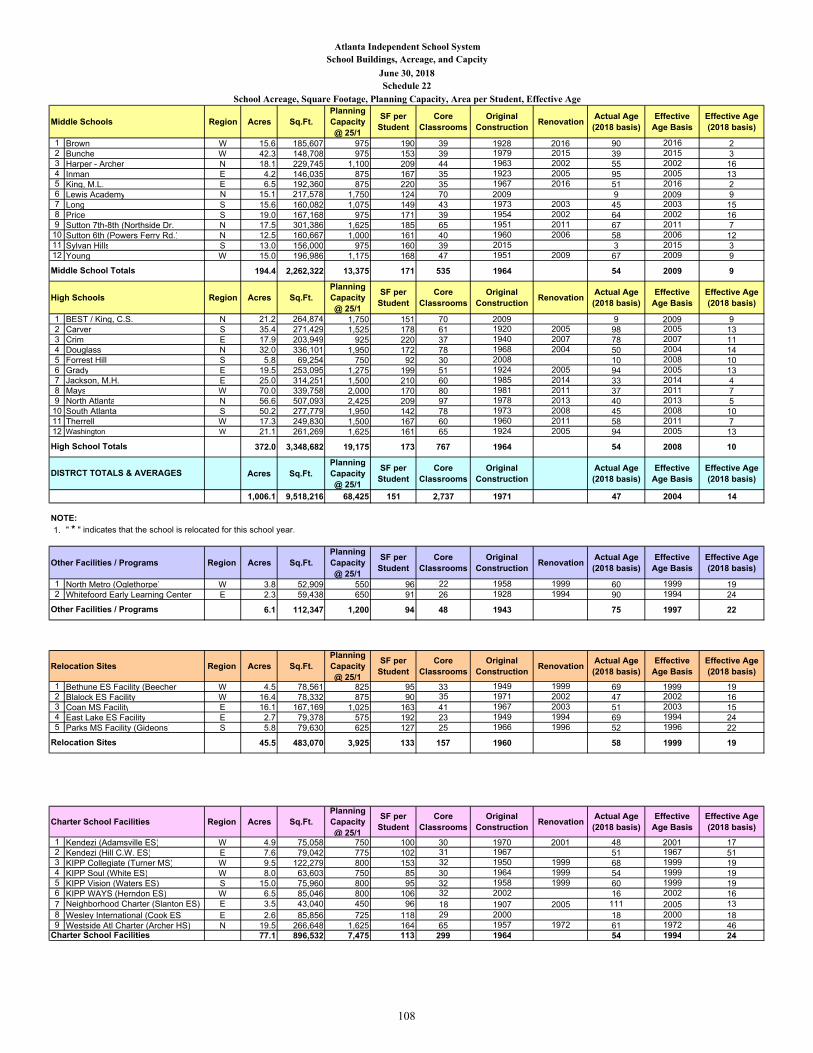
Atlanta Independent School SystemSchool Buildings, Acreage, and Capcity
June 30, 2018
School Acreage, Square Footage, Planning Capacity, Area per Student, Effective AgeSchedule 22
Middle Schools Region Acres Sq.Ft.Planning Capacity @ 25/1
SF per Student
Core Classrooms
Original Construction Renovation Actual Age
(2018 basis)Effective
Age BasisEffective Age (2018 basis)
1 Brown W 15.6 185,607 975 190 39 1928 2016 90 2016 22 Bunche W 42.3 148,708 975 153 39 1979 2015 39 2015 33 Harper - Archer N 18.1 229,745 1,100 209 44 1963 2002 55 2002 164 Inman E 4.2 146,035 875 167 35 1923 2005 95 2005 135 King, M.L. E 6.5 192,360 875 220 35 1967 2016 51 2016 26 Lewis Academy N 15.1 217,578 1,750 124 70 2009 9 2009 97 Long S 15.6 160,082 1,075 149 43 1973 2003 45 2003 158 Price S 19.0 167,168 975 171 39 1954 2002 64 2002 169 Sutton 7th-8th (Northside Dr.) N 17.5 301,386 1,625 185 65 1951 2011 67 2011 7
10 Sutton 6th (Powers Ferry Rd.) N 12.5 160,667 1,000 161 40 1960 2006 58 2006 1211 Sylvan Hills S 13.0 156,000 975 160 39 2015 3 2015 312 Young W 15.0 196,986 1,175 168 47 1951 2009 67 2009 9
194.4 2,262,322 13,375 171 535 1964 54 2009 9
High Schools Region Acres Sq.Ft.Planning Capacity @ 25/1
SF per Student
Core Classrooms
Original Construction Renovation Actual Age
(2018 basis)Effective
Age BasisEffective Age (2018 basis)
1 BEST / King, C.S. N 21.2 264,874 1,750 151 70 2009 9 2009 92 Carver S 35.4 271,429 1,525 178 61 1920 2005 98 2005 133 Crim E 17.9 203,949 925 220 37 1940 2007 78 2007 114 Douglass N 32.0 336,101 1,950 172 78 1968 2004 50 2004 145 Forrest Hill S 5.8 69,254 750 92 30 2008 10 2008 106 Grady E 19.5 253,095 1,275 199 51 1924 2005 94 2005 137 Jackson, M.H. E 25.0 314,251 1,500 210 60 1985 2014 33 2014 48 Mays W 70.0 339,758 2,000 170 80 1981 2011 37 2011 79 North Atlanta N 56.6 507,093 2,425 209 97 1978 2013 40 2013 5
10 South Atlanta S 50.2 277,779 1,950 142 78 1973 2008 45 2008 1011 Therrell W 17.3 249,830 1,500 167 60 1960 2011 58 2011 712 Washington W 21.1 261,269 1,625 161 65 1924 2005 94 2005 13
372.0 3,348,682 19,175 173 767 1964 54 2008 10
Acres Sq.Ft. Planning Capacity @ 25/1
SF per Student
Core Classrooms
Original Construction
Actual Age (2018 basis)
Effective Age Basis
Effective Age (2018 basis)
1,006.1 9,518,216 68,425 151 2,737 1971 47 2004 14
NOTE: 1. " * " indicates that the school is relocated for this school year.
Other Facilities / Programs Region Acres Sq.Ft.Planning Capacity @ 25/1
SF per Student
Core Classrooms
Original Construction Renovation Actual Age
(2018 basis)Effective
Age BasisEffective Age (2018 basis)
1 North Metro (Oglethorpe) W 3.8 52,909 550 96 22 1958 1999 60 1999 192 Whitefoord Early Learning Center E 2.3 59,438 650 91 26 1928 1994 90 1994 24
6.1 112,347 1,200 94 48 1943 75 1997 22
Relocation Sites Region Acres Sq.Ft.Planning Capacity @ 25/1
SF per Student
Core Classrooms
Original Construction Renovation Actual Age
(2018 basis)Effective
Age BasisEffective Age (2018 basis)
1 Bethune ES Facility (Beecher) W 4.5 78,561 825 95 33 1949 1999 69 1999 192 Blalock ES Facility W 16.4 78,332 875 90 35 1971 2002 47 2002 163 Coan MS Facility E 16.1 167,169 1,025 163 41 1967 2003 51 2003 154 East Lake ES Facility E 2.7 79,378 575 192 23 1949 1994 69 1994 245 Parks MS Facility (Gideons) S 5.8 79,630 625 127 25 1966 1996 52 1996 22
45.5 483,070 3,925 133 157 1960 58 1999 19
Charter School Facilities Region Acres Sq.Ft.Planning Capacity @ 25/1
SF per Student
Core Classrooms
Original Construction Renovation Actual Age
(2018 basis)Effective
Age BasisEffective Age (2018 basis)
1 Kendezi (Adamsville ES) W 4.9 75,058 750 100 30 1970 2001 48 2001 172 Kendezi (Hill C.W. ES) E 7.6 79,042 775 102 31 1967 51 1967 513 KIPP Collegiate (Turner MS) W 9.5 122,279 800 153 32 1950 1999 68 1999 194 KIPP Soul (White ES) W 8.0 63,603 750 85 30 1964 1999 54 1999 195 KIPP Vision (Waters ES) S 15.0 75,960 800 95 32 1958 1999 60 1999 196 KIPP WAYS (Herndon ES) W 6.5 85,046 800 106 32 2002 16 2002 167 Neighborhood Charter (Slanton ES) E 3.5 43,040 450 96 18 1907 2005 111 2005 138 Wesley International (Cook ES) E 2.6 85,856 725 118 29 2000 18 2000 189 Westside Atl Charter (Archer HS) N 19.5 266,648 1,625 164 65 1957 1972 61 1972 46
77.1 896,532 7,475 113 299 1964 54 1994 24Charter School Facilities
Middle School Totals
High School Totals
DISTRCT TOTALS & AVERAGES
Other Facilities / Programs
Relocation Sites
108
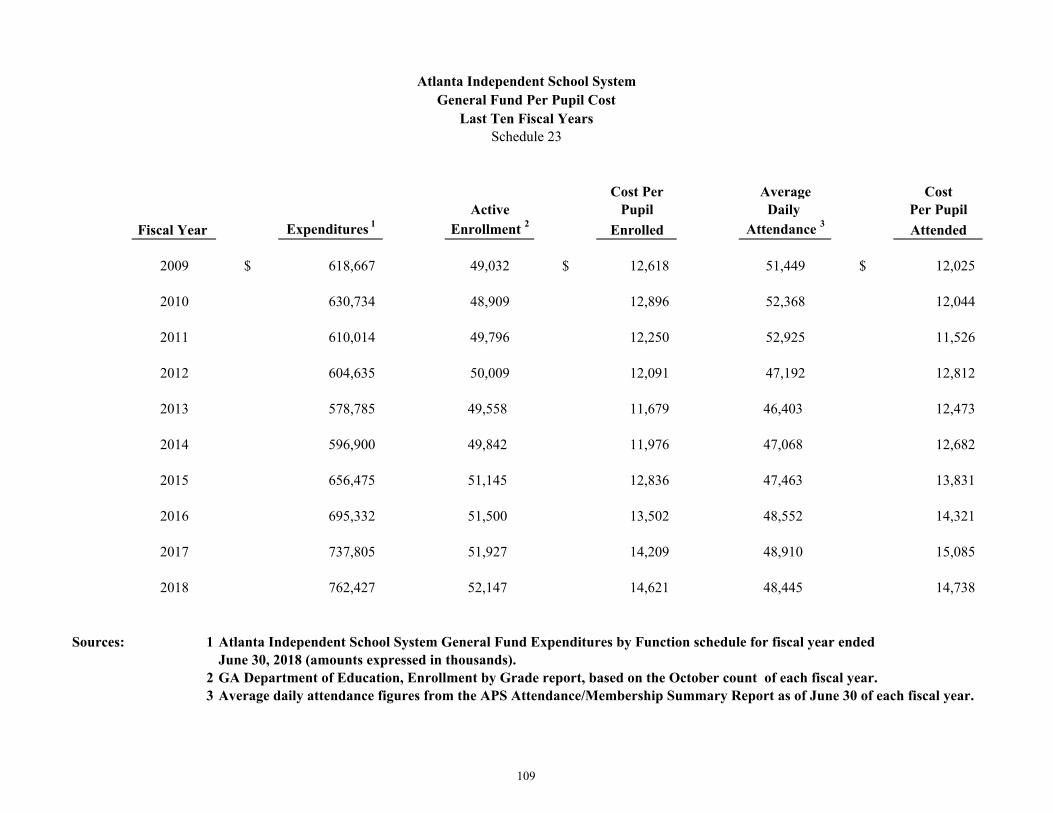
Cost Per Average CostActive Pupil Daily Per Pupil
Fiscal Year Expenditures 1 Enrollment 2 Enrolled Attendance 3 Attended
2009 $ 618,667 49,032 $ 12,618 51,449 $ 12,025
2010 630,734 48,909 12,896 52,368 12,044
2011 610,014 49,796 12,250 52,925 11,526
2012 604,635 50,009 12,091 47,192 12,812
2013 578,785 49,558 11,679 46,403 12,473
2014 596,900 49,842 11,976 47,068 12,682
2015 656,475 51,145 12,836 47,463 13,831
2016 695,332 51,500 13,502 48,552 14,321
2017 737,805 51,927 14,209 48,910 15,085
2018 762,427 52,147 14,621 48,445 14,738
Sources: 1 Atlanta Independent School System General Fund Expenditures by Function schedule for fiscal year ended June 30, 2018 (amounts expressed in thousands).
2 GA Department of Education, Enrollment by Grade report, based on the October count of each fiscal year. 3 Average daily attendance figures from the APS Attendance/Membership Summary Report as of June 30 of each fiscal year.
Atlanta Independent School SystemGeneral Fund Per Pupil Cost
Last Ten Fiscal YearsSchedule 23
109
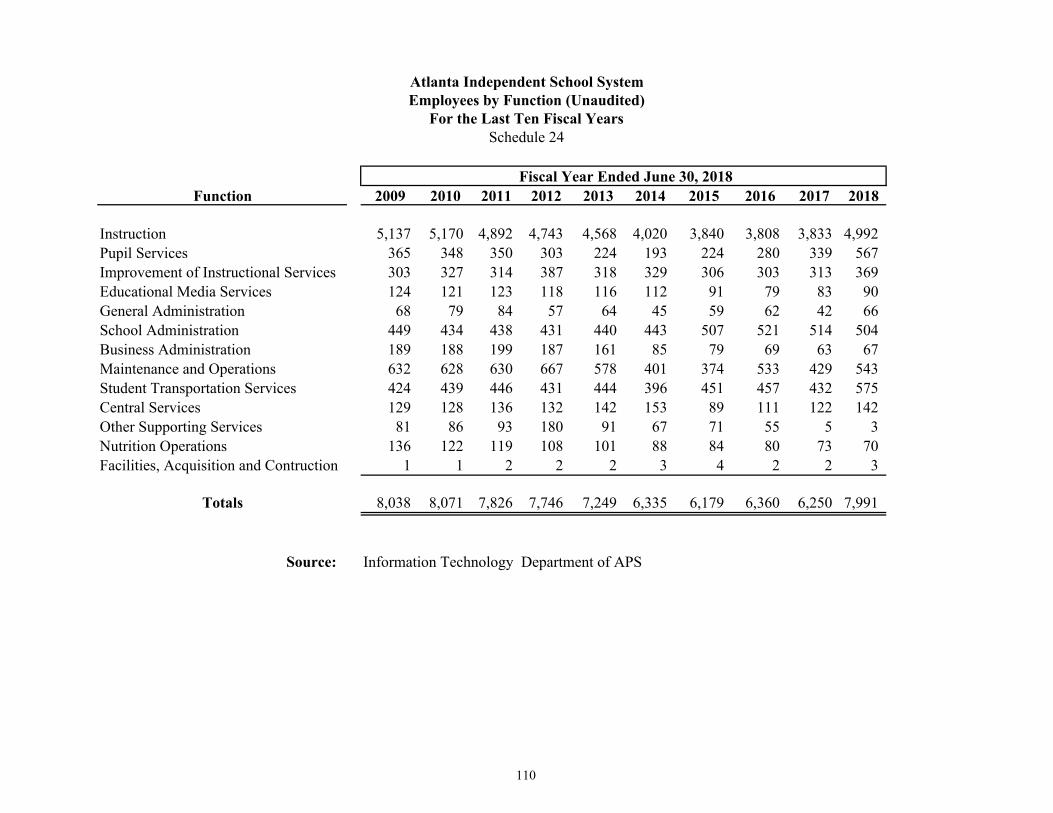
Function 2009 2010 2011 2012 2013 2014 2015 2016 2017 2018
Instruction 5,137 5,170 4,892 4,743 4,568 4,020 3,840 3,808 3,833 4,992Pupil Services 365 348 350 303 224 193 224 280 339 567Improvement of Instructional Services 303 327 314 387 318 329 306 303 313 369Educational Media Services 124 121 123 118 116 112 91 79 83 90General Administration 68 79 84 57 64 45 59 62 42 66School Administration 449 434 438 431 440 443 507 521 514 504Business Administration 189 188 199 187 161 85 79 69 63 67Maintenance and Operations 632 628 630 667 578 401 374 533 429 543Student Transportation Services 424 439 446 431 444 396 451 457 432 575Central Services 129 128 136 132 142 153 89 111 122 142Other Supporting Services 81 86 93 180 91 67 71 55 5 3Nutrition Operations 136 122 119 108 101 88 84 80 73 70Facilities, Acquisition and Contruction 1 1 2 2 2 3 4 2 2 3
Totals 8,038 8,071 7,826 7,746 7,249 6,335 6,179 6,360 6,250 7,991
Source: Information Technology Department of APS
Atlanta Independent School SystemEmployees by Function (Unaudited)
For the Last Ten Fiscal YearsSchedule 24
Fiscal Year Ended June 30, 2018
110

SINGLE AUDIT SECTION
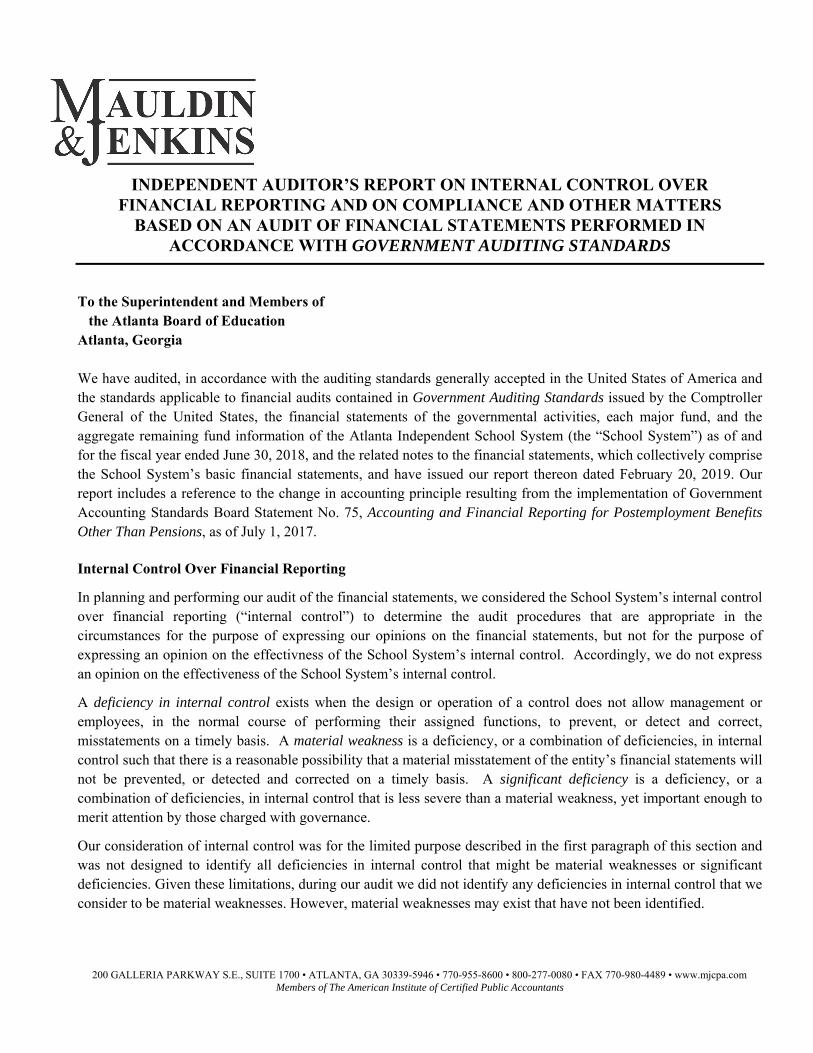
INDEPENDENT AUDITOR’S REPORT ON INTERNAL CONTROL OVER FINANCIAL REPORTING AND ON COMPLIANCE AND OTHER MATTERS
BASED ON AN AUDIT OF FINANCIAL STATEMENTS PERFORMED IN ACCORDANCE WITH GOVERNMENT AUDITING STANDARDS
To the Superintendent and Members of the Atlanta Board of Education Atlanta, Georgia
We have audited, in accordance with the auditing standards generally accepted in the United States of America and the standards applicable to financial audits contained in Government Auditing Standards issued by the Comptroller General of the United States, the financial statements of the governmental activities, each major fund, and the aggregate remaining fund information of the Atlanta Independent School System (the “School System”) as of and for the fiscal year ended June 30, 2018, and the related notes to the financial statements, which collectively comprise the School System’s basic financial statements, and have issued our report thereon dated February 20, 2019. Our report includes a reference to the change in accounting principle resulting from the implementation of Government Accounting Standards Board Statement No. 75, Accounting and Financial Reporting for Postemployment Benefits Other Than Pensions, as of July 1, 2017.
Internal Control Over Financial Reporting
In planning and performing our audit of the financial statements, we considered the School System’s internal control over financial reporting (“internal control”) to determine the audit procedures that are appropriate in the circumstances for the purpose of expressing our opinions on the financial statements, but not for the purpose of expressing an opinion on the effectivness of the School System’s internal control. Accordingly, we do not express an opinion on the effectiveness of the School System’s internal control.
A deficiency in internal control exists when the design or operation of a control does not allow management or employees, in the normal course of performing their assigned functions, to prevent, or detect and correct, misstatements on a timely basis. A material weakness is a deficiency, or a combination of deficiencies, in internal control such that there is a reasonable possibility that a material misstatement of the entity’s financial statements will not be prevented, or detected and corrected on a timely basis. A significant deficiency is a deficiency, or a combination of deficiencies, in internal control that is less severe than a material weakness, yet important enough to merit attention by those charged with governance.
Our consideration of internal control was for the limited purpose described in the first paragraph of this section and was not designed to identify all deficiencies in internal control that might be material weaknesses or significant deficiencies. Given these limitations, during our audit we did not identify any deficiencies in internal control that we consider to be material weaknesses. However, material weaknesses may exist that have not been identified.
200 GALLERIA PARKWAY S.E., SUITE 1700 • ATLANTA, GA 30339-5946 • 770-955-8600 • 800-277-0080 • FAX 770-980-4489 • www.mjcpa.com Members of The American Institute of Certified Public Accountants
112
Compliance and Other Matters
As part of obtaining reasonable assurance about whether the School System’s financial statements are free of material misstatement, we performed tests of its compliance with certain provisions of laws, regulations, contracts, and grant agreements, noncompliance with which could have a direct and material effect on the determination of financial statement amounts. However, providing an opinion on compliance with those provisions was not an objective of our audit, and accordingly, we do not express such an opinion. The results of our tests disclosed no instances of noncompliance or other matters that are required to be reported under Government Auditing Standards.
Purpose of this Report
The purpose of this report is solely to describe the scope of our testing of internal control and the results of that testing, and not to provide an opinion on the effectiveness of the entity’s internal control or on compliance. This report is an integral part of an audit performed in accordance with Government Auditing Standards in considering the entity’s internal control and compliance. Accordingly, this communication is not suitable for any other purpose.
Atlanta, Georgia February 20, 2019
INDEPENDENT AUDITOR’S REPORT ON COMPLIANCE FOR EACH MAJOR FEDERAL PROGRAM AND REPORT ON INTERNAL CONTROL
OVER COMPLIANCE AS REQUIRED BY THE UNIFORM GUIDANCE
To the Superintendent and Members of the Atlanta Board of Education Atlanta, Georgia
Report on Compliance for Each Major Federal Program
We have audited the Atlanta Independent School System’s (the "School System") compliance with the types of compliance requirements described in the OMB Compliance Supplement that could have a direct and material effect on each of the School System’s major federal programs for the fiscal year ended June 30, 2018. The School System's major federal programs are identified in the summary of auditor’s results section of the accompanying schedule of findings and questioned costs.
Management’s Responsibility
Management is reponsible for compliance with federal statutes, regulations, and the terms and conditions of its federal awards applicable to its federal programs.
Auditor’s Responsibility
Our responsibility is to express an opinon on compliance for each of the School System’s major federal programs based on our audit of the types of compliance requirements referred to above. We conducted our audit of compliance in accordance with auditing standards generally accepted in the United States of America; the standards applicable to financial audits contained in Government Auditing Standards, issued by the Comptroller General of the United States; and the audit requirements of Title 2 U.S. Code of Federal Regulations Part 200, Uniform Administrative Requirements, Cost Principles, and Audit Requirements for Federal Awards (Uniform Guidance). Those standards and the Uniform Guidance require that we plan and perform the audit to obtain reasonable assurance about whether noncompliance with the types of compliance requirements referred to above that could have a direct and material effect on a major federal program occurred. An audit includes examining, on a test basis, evidence about the School System's compliance with those requirements and performing such other procedures as we considered necessary in the circumstances.
We believe that our audit provides a reasonable basis for our opinion on compliance for each major federal program. However, our audit does not provide a legal determination of the School System's compliance.
200 GALLERIA PARKWAY S.E., SUITE 1700 • ATLANTA, GA 30339-5946 • 770-955-8600 • 800-277-0080 • FAX 770-980-4489 • www.mjcpa.com Members of The American Institute of Certified Public Accountants
114
Opinion on Each Major Federal Program
In our opinion, the Atlanta Independent School System complied, in all material respects, with the types of compliance requirements referred to above that could have a direct and material effect on each of its major federal programs for the fiscal year ended June 30, 2018.
Other Matters
The results of our auditing procedures disclosed an instance of noncompliance, which is required to be reported in accordance with the Uniform Guidance and which is described in the accompanying schedule of findings and questioned costs as item 2018-001. Our opinion on each major federal program is not modified with respect to this matter.
The School System’s response to the noncompliance finding identified in our audit is described in the accompanying schedule of findings and questioned costs and management’s corrective action plan. The School System’s response was not subjected to the auditing procedures applied in the audit of compliance and, accordingly, we express no opinion on the response.
Report on Internal Control Over Compliance
Management of the School System is responsible for establishing and maintaining effective internal control over compliance with the types of compliance requirements referred to above. In planning and performing our audit, we considered the School System's internal control over compliance with the types of requirements that could have a direct and material effect on a major federal program to determine the auditing procedures that are appropriate in the circumstances for the purpose of expressing an opinion on compliance for each major federal program and to test and report on internal control over compliance in accordance with the Uniform Guidance, but not for the purpose of expressing an opinion on the effectiveness of internal control over compliance. Accordingly, we do not express an opinion on the effectiveness of the School System’s internal control over compliance.
115
A deficiency in internal control over compliance exists when the design or operation of a control over compliance does not allow management or employees, in the normal course of performing their assigned functions, to prevent, or detect and correct, noncompliance with a type of compliance requirement of a federal program on a timely basis. A material weakness in internal control over compliance is a deficiency, or combination of deficiencies, in internal control over compliance, such that there is a reasonable possibility that material noncompliance with a type of compliance requirement of a federal program will not be prevented, or detected and corrected, on a timely basis. A significant deficiency in internal control over compliance is a deficiency, or a combination of deficiencies, in internal control over compliance with a type of compliance requirement of a federal program that is less severe than a material weakness in internal control over compliance, yet important enough to merit attention by those charged with governance.
Our consideration of internal control over compliance was for the limited purpose described in the first paragraph of this section and was not designed to identify all deficiencies in internal control over compliance that might be material weaknesses or significant deficiencies and therefore, material weaknesses or significant deficiencies may exist that were not identified. We identified a certain deficiency in internal control over compliance, as described in the accompanying schedule of findings and questioned costs as item 2018-001, that we consider to be a material weakness.
The School System’s response to the internal control over compliance finding identified in our audit is described in the accompanying schedule of findings and questioned costs and management’s corrective action plan. The School System’s response was not subjected to the auditing procedures applied in the audit of compliance and, accordingly, we express no opinion on the response.
The purpose of this report on internal control over compliance is solely to describe the scope of our testing of internal control over compliance and the results of that testing based on the requirements of the Uniform Guidance. Accordingly, this report is not suitable for any other purpose.
Atlanta, Georgia February 20, 2019
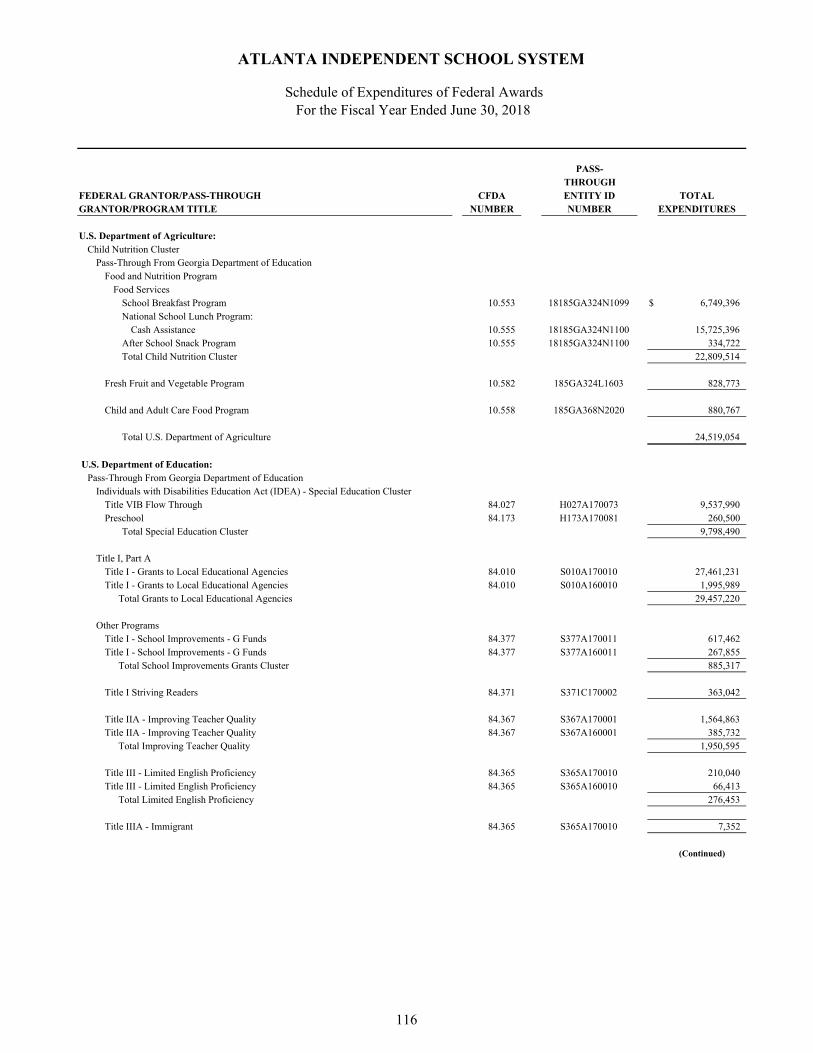
PASS-THROUGH
FEDERAL GRANTOR/PASS-THROUGH CFDA ENTITY ID TOTALGRANTOR/PROGRAM TITLE NUMBER NUMBER EXPENDITURES
U.S. Department of Agriculture:Child Nutrition Cluster
Pass-Through From Georgia Department of EducationFood and Nutrition Program
Food ServicesSchool Breakfast Program 10.553 18185GA324N1099 $ 6,749,396 National School Lunch Program:
Cash Assistance 10.555 18185GA324N1100 15,725,396 After School Snack Program 10.555 18185GA324N1100 334,722 Total Child Nutrition Cluster 22,809,514
Fresh Fruit and Vegetable Program 10.582 185GA324L1603 828,773
Child and Adult Care Food Program 10.558 185GA368N2020 880,767
Total U.S. Department of Agriculture 24,519,054
U.S. Department of Education:Pass-Through From Georgia Department of Education
Individuals with Disabilities Education Act (IDEA) - Special Education ClusterTitle VIB Flow Through 84.027 H027A170073 9,537,990 Preschool 84.173 H173A170081 260,500
Total Special Education Cluster 9,798,490
Title I, Part ATitle I - Grants to Local Educational Agencies 84.010 S010A170010 27,461,231 Title I - Grants to Local Educational Agencies 84.010 S010A160010 1,995,989
Total Grants to Local Educational Agencies 29,457,220
Other ProgramsTitle I - School Improvements - G Funds 84.377 S377A170011 617,462 Title I - School Improvements - G Funds 84.377 S377A160011 267,855
Total School Improvements Grants Cluster 885,317
Title I Striving Readers 84.371 S371C170002 363,042
Title IIA - Improving Teacher Quality 84.367 S367A170001 1,564,863 Title IIA - Improving Teacher Quality 84.367 S367A160001 385,732
Total Improving Teacher Quality 1,950,595
Title III - Limited English Proficiency 84.365 S365A170010 210,040 Title III - Limited English Proficiency 84.365 S365A160010 66,413
Total Limited English Proficiency 276,453
Title IIIA - Immigrant 84.365 S365A170010 7,352
(Continued)
ATLANTA INDEPENDENT SCHOOL SYSTEM
Schedule of Expenditures of Federal AwardsFor the Fiscal Year Ended June 30, 2018
116

PASS-THROUGH
FEDERAL GRANTOR/PASS-THROUGH CFDA ENTITY ID TOTALGRANTOR/PROGRAM TITLE NUMBER NUMBER EXPENDITURES
U.S. Department of Education (continued):Pass-Through From Georgia Department of Education (continued)
Title IV - Education for Homeless Children and Youth 84.196 S196A170011 $ 66,413 Title IV - Education for Homeless Children and Youth 84.196 S196A160011 34,358
Total Education for Homeless Children and Youth 100,771
Pass-Through From Georgia Department of EducationVocational Education - Basic Grants to States CTE Perkins IV - Program Improvement 84.048 V048A170010 638,813
Pass-Through From Georgia Department of EducationCharter Schools - Federal Implementation Grants 84.282 U282A160016 434,275
Pass-Through From Georgia Department of EducationTitle IVA - Student Support and Academic Enrichment 84.424 S424A180011 282,717
Pass-Through From Georgia Department of Education21st Century Community Learning Centers 84.287 S287C170010 984,122 21st Century Community Learning Centers 84.287 S287C160010 14,119
Total 21st Century Community Learning Centers 998,241
Pass-Through From Georgia Department of Technical and Adult EducationAdult Literacy 84.002 V002A180010 619,692
Pass-Through From Georgia State UniversityCrest Education 84.336 U336S140036 109,796
Total U.S. Department of Education 45,922,774
U. S. Department of Defense:R.O.T.C. Program-Army 12. unknown N/A 1,161,069
Total U.S. Department of Defense 1,161,069
Total Expenditures of Federal Awards $ 71,602,897
See the Notes to the Schedule of Expenditures of Federal Awards
Schedule of Expenditures of Federal AwardsFor the Fiscal Year Ended June 30, 2018
ATLANTA INDEPENDENT SCHOOL SYSTEM
117
118
ATLANTA INDEPENDENT SCHOOL SYSTEM
Notes to the Schedule of Expenditures of Federal Awards For the Fiscal Year Eneded June 30, 2018
NOTE 1. BASIS OF PRESENTATION
The Schedule of Expenditures of Federal Awards includes the federal grant activity of the Atlanta Independent School System and is presented on the accrual basis of accounting.
The information in this schedule is presented in accordance with the requirements of Title 2 U.S. Code of Federal Regulations Part 200, Uniform Administrative Requirements, Cost Principles and Audit Requirements for Federal Awards. Therefore, some amounts presented in this schedule may differ from amounts presented in or used in the preparation of the financial statements.
NOTE 2. INDIRECT COST RATE
The School System did not utilize the 10% de minimus indirect cost rate permitted by the Uniform Guidance.
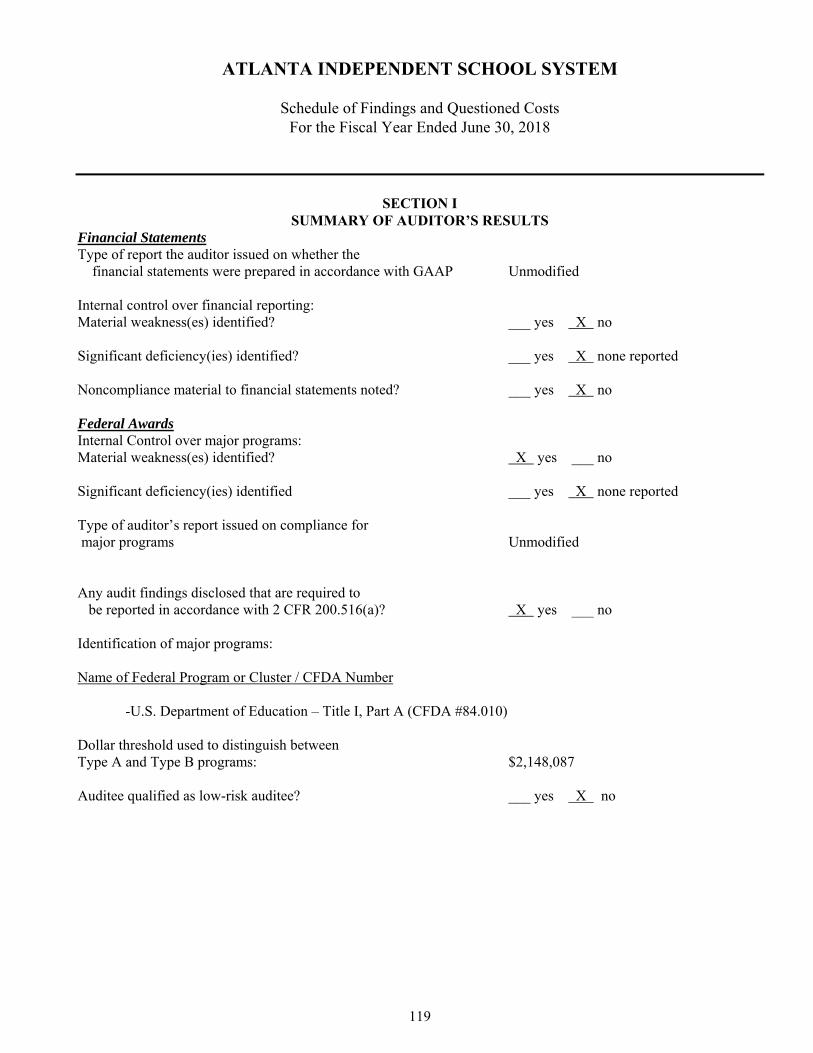
119
ATLANTA INDEPENDENT SCHOOL SYSTEM
Schedule of Findings and Questioned Costs For the Fiscal Year Ended June 30, 2018
SECTION I SUMMARY OF AUDITOR’S RESULTS
Financial Statements Type of report the auditor issued on whether the financial statements were prepared in accordance with GAAP Unmodified
Internal control over financial reporting: Material weakness(es) identified? ___ yes X no
Significant deficiency(ies) identified? ___ yes X none reported
Noncompliance material to financial statements noted? ___ yes X no
Federal Awards Internal Control over major programs: Material weakness(es) identified? X yes ___ no
Significant deficiency(ies) identified ___ yes X none reported
Type of auditor’s report issued on compliance for major programs Unmodified
Any audit findings disclosed that are required to be reported in accordance with 2 CFR 200.516(a)? X yes ___ no
Identification of major programs:
Name of Federal Program or Cluster / CFDA Number
-U.S. Department of Education – Title I, Part A (CFDA #84.010)
Dollar threshold used to distinguish between Type A and Type B programs: $2,148,087
Auditee qualified as low-risk auditee? ___ yes X no

120
ATLANTA INDEPENDENT SCHOOL SYSTEM
Schedule of Findings and Questioned Costs For the Fiscal Year Ended June 30, 2018
SECTION II FINANCIAL STATEMENT FINDINGS AND RESPONSES
None reported
SECTION III FEDERAL AWARDS FINDINGS AND QUESTIONED COSTS
2018-001 Procurement Requirements for Federally Funded Projects – U.S. Department of Education Title I, Part A (CFDA #84.010)
Criteria: Internal controls should be in place to ensure that every contract includes any clauses required by Federal statutes and executive orders and their implementing regulations. Local governments should use procurement procedures that conform to applicable Federal law and regulations and standards identified in the Uniform Guidance. The Uniform Guidance states that non-Federal entities are prohibited from contracting with or making sub-awards under covered transactions to parties that are suspended or debarred or whose principals are suspended or debarred.
Condition and Context: During our testing of procurement, suspension, and debarment for covered transactions, we noted the School System was not aware of the requirement regarding testing of certain vendors for inclusion on the Federal suspended or debarred list. One (1) out of nine (9) vendors reviewed during our testing was not reviewed by the School System in accordance with the procurement, suspension, and debarment compliance requirement.
Cause: The School System was not aware of the requirement until halfway through fiscal year 2018 and therefore did not test this vendor prior to entering into covered transactions; however, during our testing, there were no parties noted on the excluded parties listing.
Effects: Not performing a verification check for covered transactions, by checking the Excluded Parties List System (EPLS), collecting a certification from the vendor, or adding a clause or condition to the covered transaction with the vendor could result in Federal funds being used to pay a vendor who has been suspended or debarred.
Questioned Costs: None
Recommendation: We recommend the School System take necessary steps in the future to ensure there is a verification check for covered transactions, by checking the EPLS, collecting a certification from the vendor, or adding a clause or condition to the contract with a vendor prior to paying any Federal funds to a particular entity.
Auditee’s Response: The Procurement and Title departments met to discuss and are revising internal processes so that all purchases under the APS threshold for competitive solicitation or on the APS exempt list are checked on the SAM.gov website for suspension or debament status. All other purchases are already being checked.
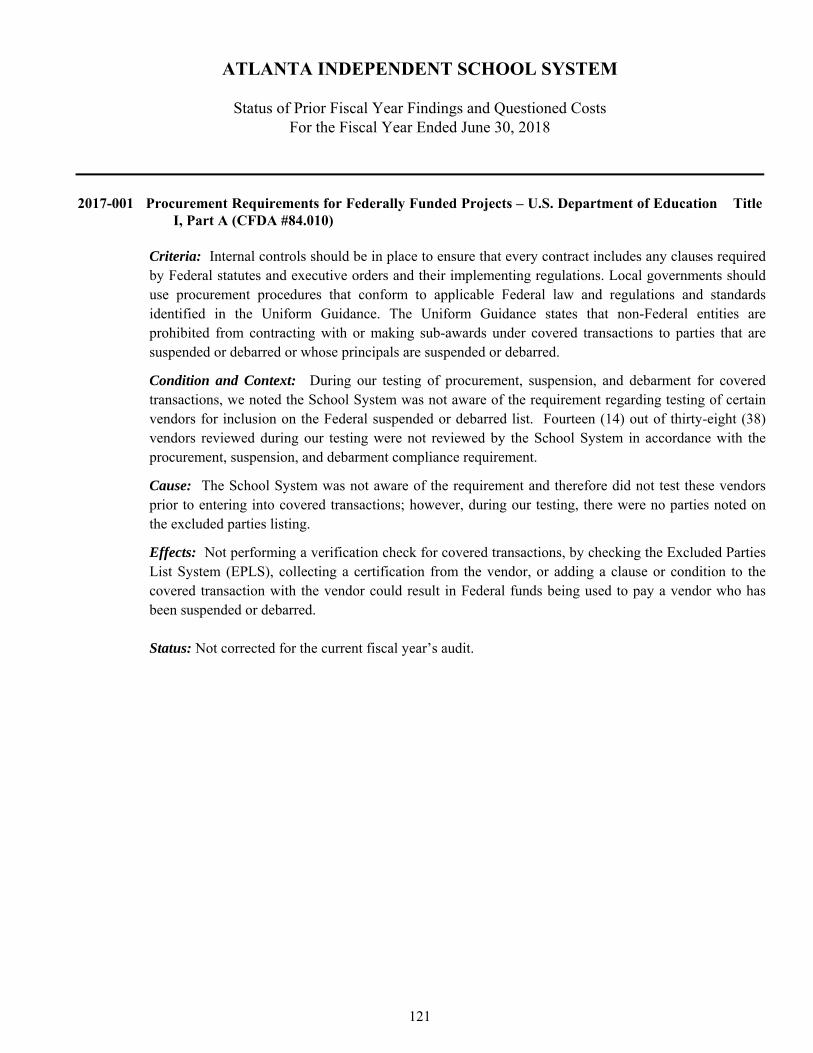
121
ATLANTA INDEPENDENT SCHOOL SYSTEM
Status of Prior Fiscal Year Findings and Questioned Costs For the Fiscal Year Ended June 30, 2018
2017-001 Procurement Requirements for Federally Funded Projects – U.S. Department of Education Title I, Part A (CFDA #84.010)
Criteria: Internal controls should be in place to ensure that every contract includes any clauses required by Federal statutes and executive orders and their implementing regulations. Local governments should use procurement procedures that conform to applicable Federal law and regulations and standards identified in the Uniform Guidance. The Uniform Guidance states that non-Federal entities are prohibited from contracting with or making sub-awards under covered transactions to parties that are suspended or debarred or whose principals are suspended or debarred.
Condition and Context: During our testing of procurement, suspension, and debarment for covered transactions, we noted the School System was not aware of the requirement regarding testing of certain vendors for inclusion on the Federal suspended or debarred list. Fourteen (14) out of thirty-eight (38) vendors reviewed during our testing were not reviewed by the School System in accordance with the procurement, suspension, and debarment compliance requirement.
Cause: The School System was not aware of the requirement and therefore did not test these vendors prior to entering into covered transactions; however, during our testing, there were no parties noted on the excluded parties listing.
Effects: Not performing a verification check for covered transactions, by checking the Excluded Parties List System (EPLS), collecting a certification from the vendor, or adding a clause or condition to the covered transaction with the vendor could result in Federal funds being used to pay a vendor who has been suspended or debarred.
Status: Not corrected for the current fiscal year’s audit.
122
Management’s Corrective Action Plan For the Fiscal Year Ended June 30, 2018
2018-001 Procurement Requirements for Federally Funded Projects
Name of the Contact Person Responsible for the Corrective Action Plan:
Alisa Morningstar, Executive Director Purchasing & Warehouse Ops Kathleen Yarbrough. Executive Director of Federal Programs
Corrective Action Plan:
Procurement is checking www.sam.gov for suspension/debarment for all requisitions that are not on a contract awarded by procurement through the competitive solicitation process or an approved Single/Sole Source request before converting to a purchase order and releasing to the vendor. All sam.gov verifications are saved to a common location on the Procurement network so that staff can determine if verification has been done for the year. This was implemented in during fiscal year 2019 and it is an ongoing process that has become part of our standard process for converting requisitions to POs.
Anticipated Completion Date:
The new process was implemented at the beginning of fiscal year 2019.
130 Trinity Ave., SW Atlanta, GA 30303
(404)802-3500atlantapublicschools.us