ateneo de manila university survey reportwatson.brown.edu/biari/files/biari/imce/attachment1...an...
TRANSCRIPT

An International Survey Initiative on
“Students, Consumption and Environment”:
Ateneo de Manila University
SURVEY REPORT
In collaboration with:
Prepared by:
C. Kendra Gotangco and Kevin Bartolome
Department of Environmental Science
April 2014

2
Acknowledgements
This project is funded by the Watson Institute of Brown University under the Brown International
Advanced Research Institute (BIARI) on Climate Change Seed Grants. It is being housed under the
Department of Environmental Science of the Ateneo de Manila University, with Dr. Charlotte Kendra
Gotangco as the ADMU lead implementer, and Kevin Bartolome (BS ES) as the student assistant.
The project was conceptualized after the dissertation work entitled “Students, Consumption and
Nature Protection: ‘Fashion is to Look Green’” of Dr. Maria Cecilia Trannin, and is being implemented
as part of an international initiative in conjunction with Dr. Trannin at the Universidade Estácio de
Sá, Rio de Janeiro, Brazil, and Dr. Chaochao Gao in Zheijiang University, China.
Many thanks to Mrs. Abigail Favis, coordinator of the Ateneo Environmental Management Council,
and Dr. Inez Ponce de Leon, Science Communication consultant, who helped review and edit the
pilot survey; and to the students of Science 10 FF, the Environmental Science Society (ESS) and the
Environmental Science majors who helped disseminate and pilot test the survey. Thank you also to
Joaquin J. Agatarap of the Registrar’s Office and Glenn Año of the Office of Management of
Information Systems (MIS) for their assistance in sampling the undergraduate enrollees and creating
the email list.
Thank you to the Ateneo Statistics Circle (ASTAT) who implemented statistical analysis of project
results. The team includes Project Director Shaun Wesley Que, analysts Sean Timothy Cheng, Louis
de Jesus, Luigi dela Peña, Joel Mediana, and the AVP for Research and Consultancy, Mary Kryslette
Bunyi. Their output is attached as a separate report.
3
Table of Contents
I. Introduction ………………………………………………………………….. 4
II. Methodology ………………………………………………………………….. 5
III. Results ………………………………………………………………….. 7
IV. Discussion and Recommendations ……………………………………. 38
Attachments:
Attachment A: Survey Questionnaire
Attachment B: Comparisons across Schools
Attachment C: Comparisons across Year Levels
Attachment D: Comparisons of ES and non-ES Majors
Attachment E: Comparisons of Male and Female Students
Attachment F: Comparisons of ES 10/12 and Non-ES 10/12 Students
Attachment G: Comparisons of Sci 10 and Non-Sci 10 Students
Attachment H: Comparisons of Working vs. Non-Working Students
Attachment I: Data Analysis Report of the Ateneo Statistics Circle

4
I. Introduction
The International Survey Initiative on “Students, Consumption and Environment” aims to
contribute to improving environmental education and sustainability programs by helping universities
evaluate students’ consumption patterns vis-à-vis their perceptions of impacts of human activities
and awareness of global environmental issues, particularly climate change. The project, supported
by the Watson Institute of Brown University, involves a comparative analysis of environmental
awareness and consumption across schools in Brazil (Universidade Estácio de Sá), China (Zhejiang
University) and the Philippines (Ateneo de Manila University). The grant award is being utilized to
develop and field-test the survey instrument, so that recommendations can be made on the survey
protocol for a larger, worldwide survey for longer-term collaborative benchmarking and assessment.
The survey initiative project is officially being implemented from November 30, 2012 to October 31,
2013.
In the Philippines, the survey project is being implemented under the Department of
Environmental Science (ES) at the Ateneo de Manila University (ADMU). ADMU, as Jesuit school that
places itself in service of national development, has made addressing sustainability and
environmental issues one of its top priorities. ADMU was the first and only to offer a Bachelor of
Science degree in Environmental Science (BS ES) in the country. Other degree programs offered are
the Master of Science in Environmental Science (MS ES) and the Master in Environmental
Management (MEM). Currently, the ES department is a Commission on Higher Education (CHED)
Center for Development. The department strives to develop curricula that provide the holistic and
interdisciplinary approach needed to meet today’s challenges. Aside from undergraduate and
graduate courses for environmental science/management majors, the department also offers
Environmental Science (ES 10/12) as a general course open to non-science majors, and, under the
School of Science and Engineering, Science and Society (Sci 10), which aim to educate students on
range of issues in the science-society nexus, including the environment and sustainable
development.
Aside from using the results for international benchmarking, the survey initiative can
therefore serve as a tool to help ADMU evaluate whether its goals for environmental education are
being met. This study aims to investigate whether current programs have to done enough to raise
environmental awareness among students, and affect students’ attitudes and lifestyles. The results
can be used to identify specific issues, misperceptions, and consumption patterns that need to be
targeted through more innovative means in either existing or new courses, or co-curricular activities.
The results will also serve as input to the Department of Environmental Science, to the School of
Science and Engineering (SOSE) Science and Society coordinator and faculty, the Ateneo
Environmental Management Council (AEMC), and the Ateneo Institute of Sustainability Program on
Campus Sustainability, to inform the content, design, and implementation of environmental courses
and university campus initiatives.

5
II. Methodology
A. SURVEY DESIGN
The survey instrument was developed jointly by the three universities, based on the original
survey of Dr. Trannin used in her dissertation work, “Students, Consumption and Nature Protection:
‘Fashion is to Look Green’” and other sources. The full survey is presented in the Results section and
is also attached (Attachment A). The questionnaire is organized into four parts:
1. Personal Information
This section collects basic information on the respondents such as their age, gender,
course, year of study, whether they are also currently working, and whether they have taken
courses related to the environment. This information will be used to create comparative
analyses (e.g. contrasting responses of freshmen and sophomores vs. juniors and seniors, of
those who have taken environmentally-related courses vs. those who have not).
2. Activities and Lifestyle
This sections aims to collect information describing the consumption profile and
priorities of students. It includes questions on how students spend their time and money,
and on their actual practices regarding diet, transport, energy usage, water usage, purchase
of products and waste generation. The mobile phone or cellphone is used here to highlight
attitudes in the purchase of new technologies since this is the most common electronic
device used by students.
3. Perceptions of Impact
This section probes the students’ perceived impacts of their activities and lifestyles.
They are asked to gauge the extent (e.g. personal or family level, community-level, city level,
etc.) and the type (e.g. social, economic, environmental) of impact their decisions might
cause. They are also asked whether they are aware of their household’s resource usage, and
if the extent they consider their lifestyles to be environmentally-friendly. Lastly, students are
asked who they feel should be responsible for taking care of the environment.
4. Attitudes and Beliefs on Climate Change
This section focuses on specifically on climate change, whether respondents believe
it is happening, and if so, what may be causing it. Students are asked to identify what they
feel is the most serious impact of climate change, and the extent to which different units
(e.g. family, city, country) are affected. On a more personal level, students are asked to rate
whether their lifestyle decisions and consumption habits contribute to the impacts of
climate change. Lastly, students are asked for their top-rated sources of information on
climate change and environmental information, and the level of trust in the different
sources of communication.

6
B. PILOT-TESTING
The pilot survey was conducted online at ADMU from January 20, 2013 until February 6,
2013 through SurveyMonkey (www.surveymonkey.com). A feedback section was added to the end
of the survey to collect comments on the clarity and length of the survey and on any technical errors
that may have been encountered. Students of different courses under a Science and Society class,
the Environmental Science Society (ESS), and environmental science majors were asked to answer
and disseminate the pilot survey among their networks.
The main feedback from the respondents concerned the length of the survey. Revisions
were then implemented in Parts 2 and 4 to shorten the survey. Some questions were also revised to
clarify their meaning or to add more options to the possible responses based on the suggestions of
the pilot testers. As an additional precaution also to ensure that the answers to certain questions
were not unduly influenced by the order of presentation of options, the randomization mechanism
of SurveyMonkey was implemented for questions asking for motivation (e.g. why students buy
beverages in PET bottles or what would make them pay more for a product) or ranking/identification
of top impact (e.g. what is the most serious impact of climate change in your country). Lastly,
technical errors were corrected and re-tested. For more information on the pilot survey and the
revisions made, please see the separate Pilot Survey Report.
C. SURVEY IMPLEMENTATION and ANALYSIS
The main survey was implemented from February 18 to April 5, 2013 (the end of the school
year) targeting undergraduate students of the ADMU Loyola Schools. A sample of 1,215 students
out of the 8,154 enrollees was created by requesting for the email addresses of every 5th
student in
an alphabetized list of students per year level. These students were sent targeted emails and weekly
reminders to participate in the survey. However, since not all who were emailed opted to complete
the survey, flyers were also disseminated through email to faculty and online student groups. A few
flyers were also posted in public places on campus.
The survey was designed not to collect any uniquely identifying information. Thus, a
common link was distributed to everyone rather than customizing links per person. Respondents
were given the chance to “opt out” at any point should they prefer not to continue for whatever
reason; however, they were also given the chance to return to the survey and start over should they
fail to complete it the first time. For these reasons, only the complete responses were used in the
survey analysis.
Survey results were summarized in graph form, as seen in the Results section. Additional
analyses were conducted by making comparisons between the following groups (Attachments B to
H):
� By year level (Freshmen vs. Sophomores vs. Juniors vs. Seniors)
� By school (Science and Engineering vs. Social Sciences vs. Humanities vs. Management)
� Environmental Science Majors vs. Non-Environmental Science Majors
� Took ES 10/12 ( Introduction to Environmental Science lecture/lab) vs. Did not take ES
10/12

7
� Took Sci 10 (Science and Society) vs. Did not take Sci 10
� Working (e.g. on thesis, assistantships, internships) vs. Non-working1
� Male vs. Female
It should be noted, however, that while the sample of respondents was large enough for reasonable
confidence levels and intervals for the undergraduate population as a whole, the number of
respondents per sub-group above may not necessarily be representative of that sub-group.
Testing for differences between groups was implemented by the Ateneo Statistics Circle
using a chi-square test (Attachment I) at 90%, 95% and 99% confidence levels. This testing excluded
ES Majors vs. Non-ES Majors due to the low response rate from the ES Majors, and the Working vs.
Non-Working group1.
III. Results
In total, during the survey period, out of the 1,215 students who were sent weekly emails
and others who received flyers through online groups of their professors, only 578 visits were made
to the survey site. Of these 578 visits, only 441 were complete responses and were therefore used in
the analysis. This yields a 4.54 confidence interval at a 95% confidence level.
The breakdown by school is as follows: School of Science and Engineering (SOSE) = 156
respondents; John Gokongwei School of Management (JGSOM) = 144 respondents; School of Social
Science = 101 respondents; and School of Humanities = 40 respondents. Twenty-one (21)
respondents were Environmental Science majors. The breakdown in terms of year level and gender
are included in Part A of the survey presented below.
The survey results for all the completed responses are presented here and are discussed in
the next section. Plots of comparisons across groups as well as the statistical analysis of these
comparisons are included as attachments to this report.
1 The analysis of working vs. non-working sub-groups is a carry-over from the original design of Dr. Trannin,
and was based on the assumption that those who are employed and have to support household expenses may
have a different perspective regarding personal and household usage of resources. This was first implemented
at the Universidade Estácio de Sá, which had students of working age already. This may not translate as well in
the Ateneo context, however, since our “working” undergraduates are limited to thesis students, interns and
research or administrative assistants.
8
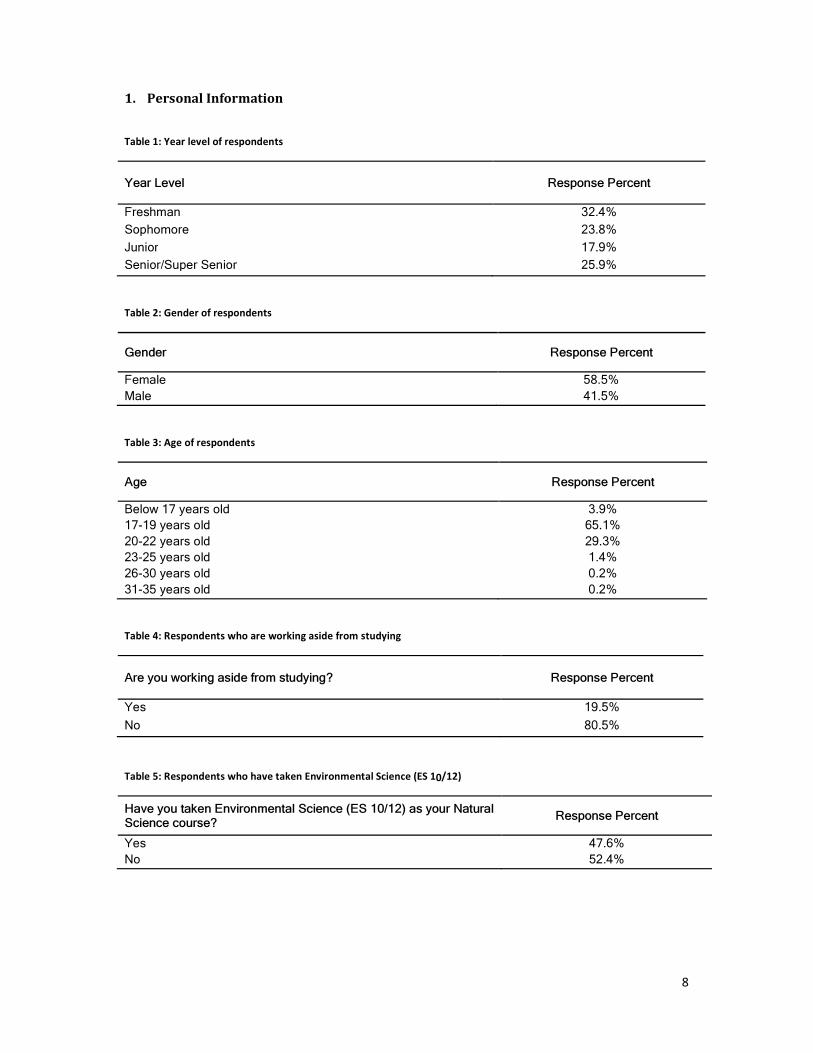
1. Personal Information
Table 1: Year level of respondents
Year Level Response Percent
Freshman 32.4%
Sophomore 23.8%
Junior 17.9%
Senior/Super Senior 25.9%
Table 2: Gender of respondents
Gender Response Percent
Female 58.5%
Male 41.5%
Table 3: Age of respondents
Age Response Percent
Below 17 years old 3.9%
17-19 years old 65.1%
20-22 years old 29.3%
23-25 years old 1.4%
26-30 years old 0.2%
31-35 years old 0.2%
Table 4: Respondents who are working aside from studying
Are you working aside from studying? Response Percent
Yes 19.5%
No 80.5%
Table 5: Respondents who have taken Environmental Science (ES 10/12)
Have you taken Environmental Science (ES 10/12) as your Natural Science course?
Response Percent
Yes 47.6%
No 52.4%

9
Table 6: Respondents who have taken Science and Society (Sci 10)
Have you taken Science and Society (Sci 10)? Response Percent
Yes 44.9%
No 55.1%
Table 7: Respondents who have taken other courses on the environment
Have you taken any other course on the environment? Response Percent
Yes 7.9%
No 88.2%
I am an Environmental Science major and have taken several courses on the environment.
3.9%
Table 8: Course distribution of respondents
Course Response Percent
BS Biology 1.59%
BS Chemistry 0.45%
BS Chemistry with BS Applied Computer Systems 0.23%
BS Chemistry with B.S. Materials Science and Engineering 2.95%
BS Computer Engineering 0.91%
BS Computer Science 0.91%
BS/MS Computer Science 0.45%
BS Electronics and Communications Engineering 3.17%
BS Environmental Science 4.76%
BS Health Sciences 3.40%
BS Life Sciences 2.95%
BS Management Information Systems 5.22%
BS Management Information Systems/MS Computer Science 2.04%
BS Mathematics 0.23%
BS/M Applied Mathematics, Major in Mathematical Finance 4.76%
BS Physics 0.45%
BS Applied Physics/BS Applied Computer Systems 0.68%
BS Applied Physics/BS Materials Science and Engineering 0.23%
AB Chinese Studies 0.23%

10
AB Communication 3.40%
AB Development Studies 1.36%
AB Diplomacy and International Relations with Specialization in East and Southeast Asian Studies
0.23%
AB Economics 1.36%
AB Economics-Honors 1.13%
AB European Studies 1.36%
AB History 0.68%
AB Management Economics 2.04%
AB Political Science 2.27%
AB/MA Political Science (Major in Global Politics) 0.45%
AB Political Science – Masters in Public Management 0.23%
AB Psychology 2.04%
BS Psychology 5.44%
AB Social Sciences 0.68%
BFA Major in Art Management 0.23%
BFA Major in Creative Writing 0.91%
BFA Major in Information Design 3.17%
AB Humanitites 0.23%
AB Interdisciplinary Studies 2.72%
AB Literature - English 0.91%
AB Philosophy 0.68%
AB Philosophy: Pre-DIvinity Track 0.23%
BS Communications Technology Management 6.35%
BS Information Technology Entrepreneurship 0.23%
BS Legal Management 3.85%
BS Management 11.79%
BS Management Honors 1.13%
BS Management Engineering 7.71%
BS Management of Applied Chemistry 1.59%
11
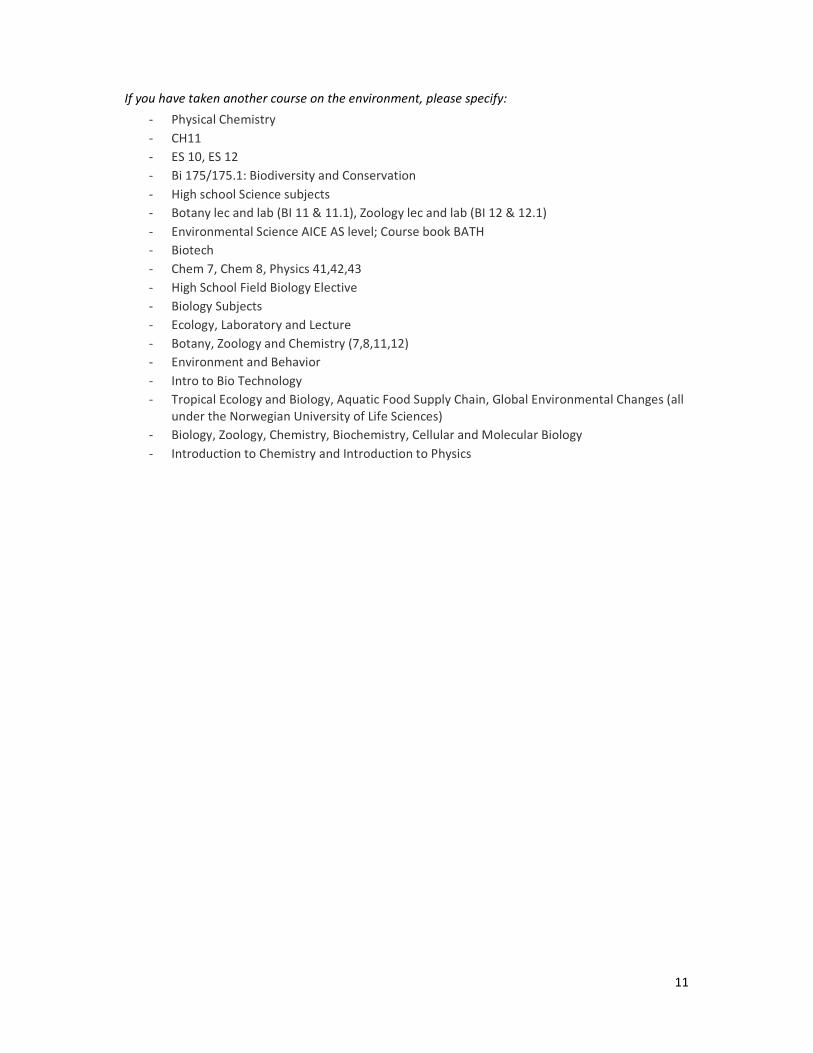
If you have taken another course on the environment, please specify:
- Physical Chemistry
- CH11
- ES 10, ES 12
- Bi 175/175.1: Biodiversity and Conservation
- High school Science subjects
- Botany lec and lab (BI 11 & 11.1), Zoology lec and lab (BI 12 & 12.1)
- Environmental Science AICE AS level; Course book BATH
- Biotech
- Chem 7, Chem 8, Physics 41,42,43
- High School Field Biology Elective
- Biology Subjects
- Ecology, Laboratory and Lecture
- Botany, Zoology and Chemistry (7,8,11,12)
- Environment and Behavior
- Intro to Bio Technology
- Tropical Ecology and Biology, Aquatic Food Supply Chain, Global Environmental Changes (all
under the Norwegian University of Life Sciences)
- Biology, Zoology, Chemistry, Biochemistry, Cellular and Molecular Biology
- Introduction to Chemistry and Introduction to Physics

12
2. Activities and Lifestyle
Figure 1: How students spend most of their time
0.0% 20.0% 40.0% 60.0% 80.0% 100.0%
Studying or working
Reading (e.g. books, magazines, online articles
apart from study/work)
Shopping/Malling
Listening to music, singing, or dancing
Drawing, painting, sculpting
Going to museums and other educational
centers
Playing videogames
Watching TV or movies
Playing sports or working out
Traveling
Social Networking (Facebook, Twitter,
Texting/Messaging, Blogging, etc.)
Volunteering or engaging in community service
How do you spend most of your time?

13
Figure 2: What students usually eat (Note: lower values indicate higher ranking)
0.00 0.50 1.00 1.50 2.00 2.50 3.00 3.50 4.00 4.50
Meat (pork, beef, chicken)
Fish and seafood
Vegetables and fruits
Rice, corn or other grains
Bread, potatoes, camote/sweet potato
What do you usually eat?

14
Figure 3: How students usually travel from home to school
0.0%
5.0%
10.0%
15.0%
20.0%
25.0%
30.0%
35.0%
40.0%
45.0%
Walking Cycling Riding a
motorcycle
Using a private
vehicle
Carpooling Riding a
schoolbus
Public transport -
tricycle
Public transport -
taxi-cab
Mass public
transport (e.g.
bus, jeep, train,
FX)
How do you usually travel from home to school?

15
Figure 4: How long students take to shower
Table 9: How often students leave the faucet running while brushing their teeth or shaving
How often do you leave the faucet running while brushing your teeth or shaving?
Response Percent
Always 5.9%
Sometimes 34.2%
Never 59.9%
0.0%
10.0%
20.0%
30.0%
40.0%
50.0%
60.0%
Less than 10
minutes
10-20 minutes 20-30 minutes More than 30
minutes
I generally don't
take showers - I
use a pail and
dipper instead
I generally don't
take showers - I
fill up the
bathtub instead
On the average, how long does it take you to
shower?

16
Figure 5: How often students buy water or beverages in plastic PET bottles
0.0%
5.0%
10.0%
15.0%
20.0%
25.0%
30.0%
35.0%
40.0%
45.0%
Once a day or
more
A few times a
week
A few times a
month
A few times a
year
I do not buy
products in
plastic PET
bottles
I do not know
what plastic PET
bottles are
How often do you buy water or bevereges in
plastic PET bottles?
17
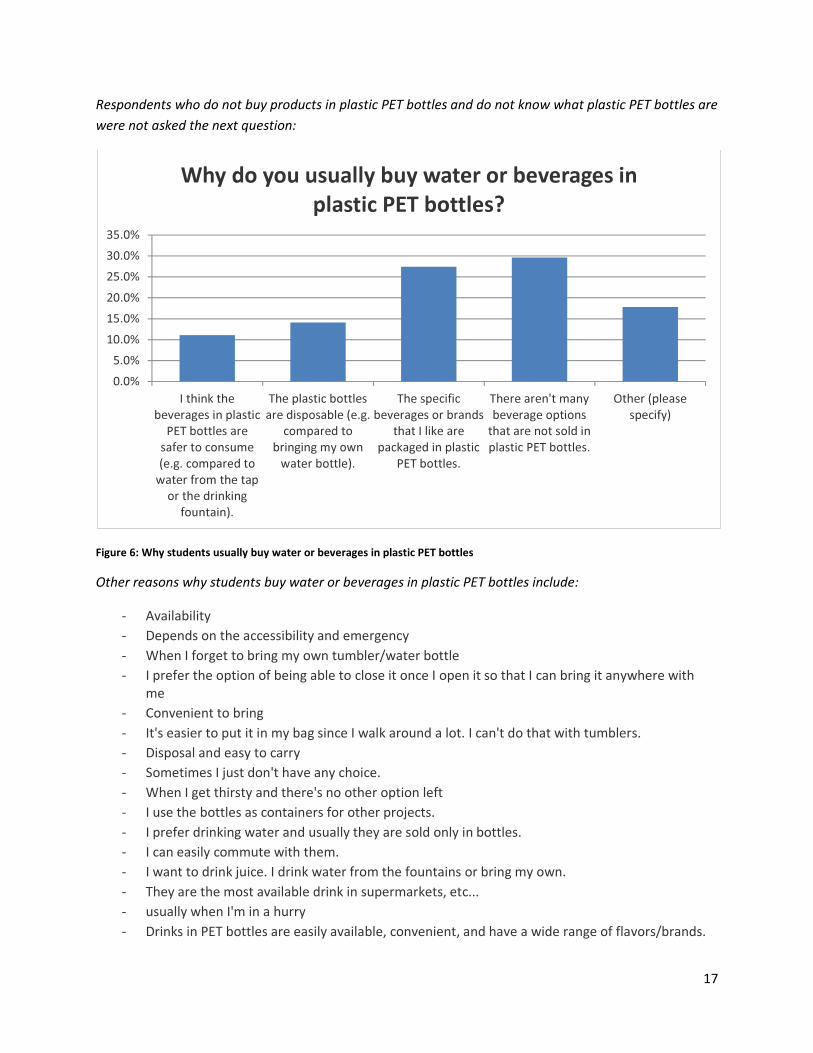
Respondents who do not buy products in plastic PET bottles and do not know what plastic PET bottles are
were not asked the next question:
Figure 6: Why students usually buy water or beverages in plastic PET bottles
Other reasons why students buy water or beverages in plastic PET bottles include:
- Availability
- Depends on the accessibility and emergency
- When I forget to bring my own tumbler/water bottle
- I prefer the option of being able to close it once I open it so that I can bring it anywhere with
me
- Convenient to bring
- It's easier to put it in my bag since I walk around a lot. I can't do that with tumblers.
- Disposal and easy to carry
- Sometimes I just don't have any choice.
- When I get thirsty and there's no other option left
- I use the bottles as containers for other projects.
- I prefer drinking water and usually they are sold only in bottles.
- I can easily commute with them.
- I want to drink juice. I drink water from the fountains or bring my own.
- They are the most available drink in supermarkets, etc...
- usually when I'm in a hurry
- Drinks in PET bottles are easily available, convenient, and have a wide range of flavors/brands.
0.0%
5.0%
10.0%
15.0%
20.0%
25.0%
30.0%
35.0%
I think the
beverages in plastic
PET bottles are
safer to consume
(e.g. compared to
water from the tap
or the drinking
fountain).
The plastic bottles
are disposable (e.g.
compared to
bringing my own
water bottle).
The specific
beverages or brands
that I like are
packaged in plastic
PET bottles.
There aren't many
beverage options
that are not sold in
plastic PET bottles.
Other (please
specify)
Why do you usually buy water or beverages in
plastic PET bottles?

18
- I usually buy 500ml Cola which is only available in plastic PET bottles
- They're colder than the drinking fountains
- I do not have/ ran out of water (from the water bottle I brought)
- Outdoor activities
- It's convenient to acquire and the bottle is reusable.
- Coke taste better in the bottle than in can (such a shallow answer but true, sorry)
- water from the drinking fountain tastes weird for me.
Figure 7: How often students use air conditioning (AC) units at home or in their dorm
0.0%
10.0%
20.0%
30.0%
40.0%
50.0%
60.0%
Everyday Once or twice a
week
A few times a
month
We have AC units
but don’t generally
use them.
We don’t have AC
units.
How often do you use air conditioning (AC) units
at home or in your dorm?

19
Respondents who indicated that they do use air conditioners (whether everyday, once or twice a week, or
a few times a month) were asked the next two questions:
Figure 8: Number of hours a day air conditioning units are turned on
Figure 9: Students’ usual temperature setting of thermostat of air conditioning unit
0.0%
10.0%
20.0%
30.0%
40.0%
50.0%
60.0%
1-4 5-8 9-12 more than 12
When you do use air conditioning units, how
many hours a day are they turned on?
0.0%
5.0%
10.0%
15.0%
20.0%
25.0%
30.0%
35.0%
40.0%
45.0%
Below 16° Between 16-20°C Between 20-24°C Above 25°C I do not know, my
AC unit does not
have exact
temperature
settings.
What temperature would you usually set the
thermostat of your air conditioning unit to feel
comfortable?

20
Table 10: Respondents who segregate their waste at home
Do you segregate your waste at home? Response Percent
Yes 50.3%
No 49.7%
Respondents who do not segregate their waste at home were asked the next question:
Figure 10: Reasons why students do not segregate their waste at home
Other reasons why students do not segregate their waste at home include:
- We only segregate those materials that may be sold (plastic & glass bottles, tin cans); my family
members are not convinced of the necessity to segregate other wastes.
- My other family members are not that inclined to segregation
- People in the dorm does not do it so there is no effect if I do so
- No separate bins at home
- We don't segregate our separate wastes. We do the overall (i.e Kitchen, outside trash can)
- (In the dorm) My roommates don't separate them. It's tiring to be the only one separating
them.
- All of the above
- I don't bother at home although I follow the policy while in school
- the head of my family thinks that it is a waste of time
- frankly, i don't care, sorry
- I want to, but my family does not practice segregation.
0.0%
5.0%
10.0%
15.0%
20.0%
25.0%
30.0%
35.0%
40.0%
My community
still does not
have this policy.
I am not used to
it yet or do not
know.
I do not have
the space or
time at home to
segregate my
waste.
The garbage
collectors mix
the waste
anyway
I do not have
access to a
recycling center
or Materials
Recovery Facility
(MRF).
Other (please
specify)
If you do not segregate your waste at home, why not?

21
- All of the above, except the 2nd option.
- Housemates not cooperative
- Hassle to organize it with room mates
- I am not in charge of this
Table 111: How often respondents purchase a new mobile phone
How often do you purchase a new mobile phone? Response Percent
Every few months. 0.2%
Every year. 5.9%
Every few years. 48.8%
I do not purchase mobile phones but only replace when given a gift or secondhand model.
43.3%
I have only had one mobile. 1.8%
I do not have a mobile phone. 0.0%
Respondents who indicate that they have purchased new mobile phones (whether the replacement if
done every few months, every year, or every few years) were asked the next question:
Figure 51: Respondents' reasons for purchasing a new mobile phone
Other reasons for purchasing a new mobile phone include:
- old phone so want a new one
- renewal of plan every 2 years
- I keep looking for the phones that would be ideal for my lifestyle
0.0%
10.0%
20.0%
30.0%
40.0%
50.0%
60.0%
70.0%
What is your top reason for purchasing a new
mobile phone?

22
- I only buy a new phone when i lose or break the phone I'm using
- old phone is not as efficient anymore, new features
- Not up-to-date and slow
Table 12: How often respondents bring their own reusable bags when shopping
How often do you currently bring your own canvass or paper bags when shopping?
Response Percent
Always 24.7%
Sometimes 51.2%
Never 24.0%
Figure 6: What respondents do with damaged products
0
50
100
150
200
250
300
Nu
mb
er
or
Re
spo
nd
en
ts
If the following products are damaged, which
action would you normally do?
Keep if old or damaged
Dispose of (i.e. in the trash) and
replace
Try to re-sell as secondhand or give
away/donate
Repair or re-use for another
purpose
N/A; I do not own this

23
Figure 7: Factors in deciding to buy a product
0
50
100
150
200
250
300
350
400
450
Car or
Motorcycles
Clothing and
Accessories
Food Electronics
(computers
and cellular
phones)
Personal
services
(wellness
products,
salon
services, gym
membership)
Nu
mb
er
of
Re
spo
nse
sWhat factors into your decision to buy these
products?
Price
Quality
Trendiness/Popularity
Environmental-friendliness
Latest release/cutting-edge
technology

24
Figure 8: Reasons why respondents would be willing to pay more for a product
0.0% 10.0% 20.0% 30.0% 40.0% 50.0% 60.0% 70.0% 80.0% 90.0%
It is a quality-certified product
The product is rare or hard to find
The product is organic or ecologically-friendly.
The product is multi-purpose
The product utilizes superior technology.
The product is good for one’s health.
The product is a status symbol or is fashionable.
The product is from a company that cares about or gives part of its…
The product is from a company that implements fair labor practices.
The garbage produced from the product (e.g. packaging, by-products) is…
My friend has one.
I urgently need the product
I would not pay more for a product whenever possible.
Other (please specify)
What reasons would make you willing to pay more for a product?

25
Other reasons why respondents would be willing to pay more for a product include:
- It interests me
- The product is durable and can be used for a long period of time.
- its the cheaper alternative instead of the branded stuff
- if the seller is Chinese
- how easy it is to acquire from that specific place
- When I desperately want the product (which rarely happens)
- It has a good price to quality ratio
- If the product is made in China, because I am a Chinese.
- If I really really really like it and I feel it's really worth it
- Usefulness
Table 13: How often respondents have decided not to buy a product given that the product is not environmentally friendly
How often have you decided not to buy a product that you knew was not environmentally friendly? (e.g. food in disposable packaging, a plastic bag at checkout for small items, etc.)
Response Percent
Always 9.8%
Sometimes 81.2%
Never 9.1%
What else do you normally do to limit your negative environmental impacts (or enhance positive
impacts) that has not yet been mentioned in this survey?
- Endangered species
- Moderating water and electricity consumption 2.) Walking to and from the jeepney (un)loading
station instead of riding a tricycle 3.) Commuting instead of using our family car
- I walk around to get to places whenever possible.
- Dine in instead of take out and bring Baunan to school
- Bringing people with me in the car, never driving alone to save gas with other people. Projects
and research that are good for clean up
- recycle papers
- self control
- I do not use straws.
- Finish everything in the food that I bought. Try to carefully place my trash in the proper trash
bin (if bins are segregated).
- Conserve water
- not throwing trash anywhere.
- turn off electrical devices when not in use.
- read up on news about this.
- use canvas bag instead of plastic bags
- Attend coastal clean-ups
- Hand carry stuff I buy in groceries, if possible.
- Pick up litter on the ground and properly dispose them
- We do recycle plastic bags from before.

26
- I try to keep my trash in my bag until I can find suitable trash cans to throw it in
- I don't burn my trash.
- participate in recycling projects in school, I use scratch papers often
- Use food wastes for composts
- I admit I don't do much. I try to segregate my trash, bring a bag, and turn off the lights and such.
I admit I'm lazy about these things.
- I make sure to recycle when in school, or in places that do practice recycling, unlike at home.
- share resources as much as possible
- During the daylight I don't use electric fans or air conditions and instead open the windows to
let the air come in.
- Buying Local
- Does growing plants/trees count?
- Keep plastic bags
- Read books
- Whenever I can't find a trash bin, I keep first my trash until I see one.
- Try to get others into doing these practices too
- not use too many plastics
- limit usage of non-environmental friendly things
- use recycled boxes as containers of grocery materials
- just don't buy
- Use biodegradable starch cups, utensils and plates instead of those made of paper, laminated
paper or polystyrene foam. Reuse used tarpaulins and turn them into bags.
- Engage in activities/programs inclined to protecting the environment
- Segregating trash in school (not just at home)
- try to live a simple life
- I don't usually throw garbage/trash randomly anywhere. I dispose them properly as much as
possible.
- Use of tumblers
- We all sleep in one room in the house even if my sister and I have our own rooms.
- I keep all paper bags and reuse those for all my purchases.
- Less tissue paper wastage
- I turn off the shower when I put soap or shampoo on myself
- maintain our vehicles at the best condition to lessen increased emissions due to neglect
- Reuse things. e.g. shoe boxes to container for books/school stuff
- My TV's eco-saving setting is set to high
- Try to remind others about their negative impacts and what they can do about it.
- Right now, my research paper is about implementing the replacement of all jeepneys by e-
jeepneys in the Philippines so as to lessen air pollution.
- Remove electronics from the plug when not in use. Take care of plants.
- Refraining from using disposable plastics or styrofoams, Not eating at fast food chains
- I don't ask for a plastic when shopping.
- Recycle water used in bathing to be used in flushing toilets
- Support plastic ban in my city.
- not use straw if i can sip from the glass
- We try to maximize the usage of an item to gain the most we can from it.
- By reusing my pants if it's still clean to save on water.
- I know we re-use the rinse water from doing the laundry. We try to schedule trips so we can all
ride together in a car at home.

27
- My home uses washing machine greywater for our garden.
- Reuse stuff that's busted. Fix it. Recreate it into something new
- We use a tabo and a bucket for bathing.
- We refuse to use tarpaulins to promote in our organization, I do not buy notebooks and instead
use the back of used paper
- I always check on the back of food products to make sure of what's in it.
- I smoke, and I know that doing so contributes to pollution, so I'm working on reducing my
consumption, and eventually quitting altogether.
- lessen meat in my diet - bring reusable bags every time I shop (or simply refuse plastics and put
the item in my bag whenever it fits) - reuse boxes and paper cups - use natural light - work from
home
- thrift shop
- When I buy bags, I buy cloth-material ones, not synthetic or plastic.
- Take care of my belongings so that I would not replace them immediately
- Our city in Batangas promotes the e-code where in stores are not supposed to use plastic
anymore.
- I buy products made from recycled materials.
- I drive in a way that uses less fuel.
- selling recyclable materials to junk shops
- Use of a hybrid car on weekends
- support (economically, environmentally, socially) sustainable businesses/organizations
28
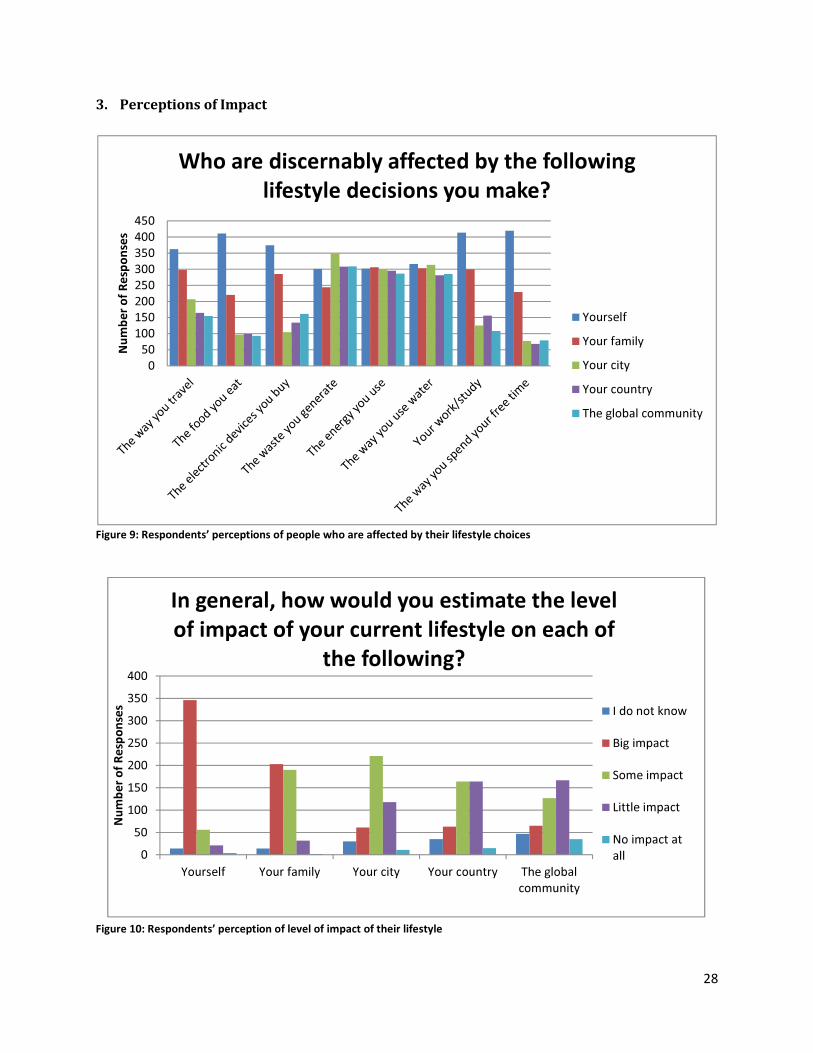
3. Perceptions of Impact
Figure 9: Respondents’ perceptions of people who are affected by their lifestyle choices
Figure 10: Respondents’ perception of level of impact of their lifestyle
0
50
100
150
200
250
300
350
400
450
Nu
mb
er
of
Re
spo
nse
s
Who are discernably affected by the following
lifestyle decisions you make?
Yourself
Your family
Your city
Your country
The global community
0
50
100
150
200
250
300
350
400
Yourself Your family Your city Your country The global
community
Nu
mb
er
of
Re
spo
nse
s
In general, how would you estimate the level
of impact of your current lifestyle on each of
the following?
I do not know
Big impact
Some impact
Little impact
No impact at
all

29
Figure 11: Respondents’ perceptions of the kind of impact of their lifestyle choices (Note that respondents were allowed to
choose more than one or none.)
0
50
100
150
200
250
300
350
400
450
Nu
mb
er
of
Re
spo
nse
sFor the following questions, select the kind of
impact (Social, Economic or Environmental) of
your lifestyle choices.
Social Impact
Economic Impact
Environmental Impact

30
Figure 128: Respondents' awareness of household’s resource use and waste generation
0
50
100
150
200
250
300
350
400
How much your
household’s
electric bill is
each month?
Whether your
appliances are
energy-efficient
or have an eco-
label?
How much your
household’s
water
consumption is
each month?
How much your
household
spends on fuel
or gasoline each
month?
How much
organic waste
your household
generates each
month?
How much
recyclable waste
your household
generates each
month?
How much non-
recyclable waste
your household
generates each
month?
Where your
waste goes?
Nu
mb
er
of
Re
spo
nse
s
Do you know or have an idea of...
Yes
No
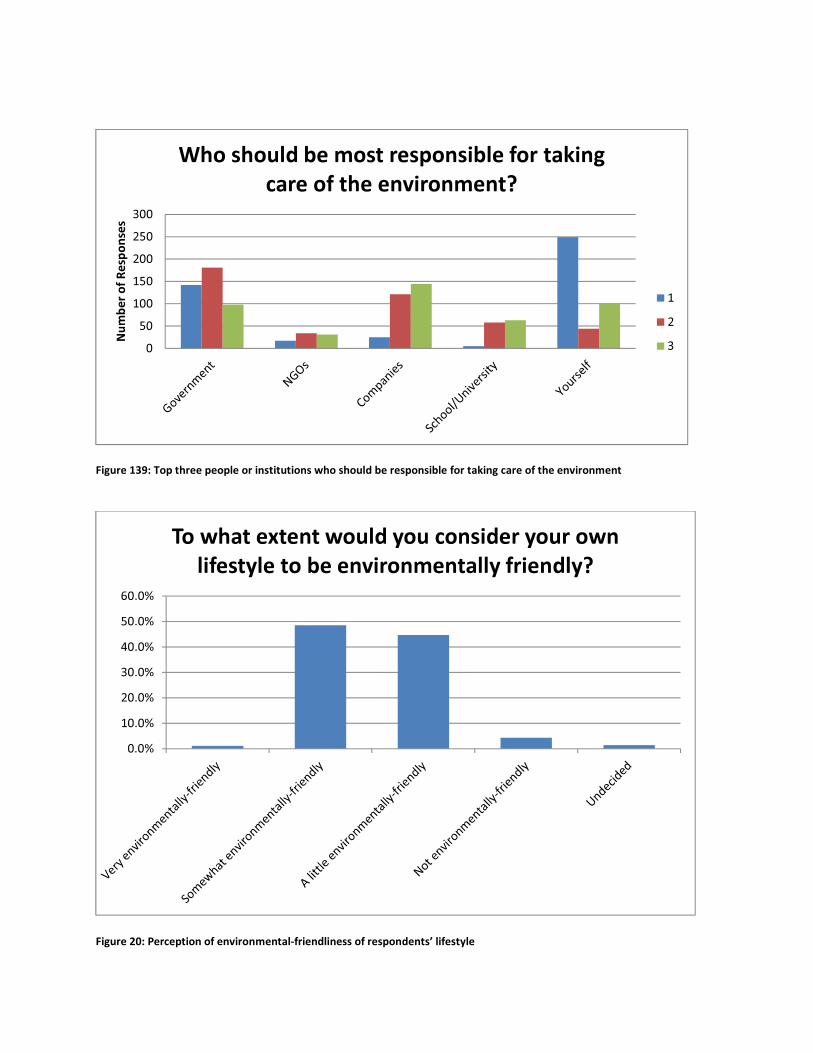
Figure 139: Top three people or institutions who should be responsible for taking care of the environment
Figure 20: Perception of environmental-friendliness of respondents’ lifestyle
0
50
100
150
200
250
300
Nu
mb
er
of
Re
spo
nse
s
Who should be most responsible for taking
care of the environment?
1
2
3
0.0%
10.0%
20.0%
30.0%
40.0%
50.0%
60.0%
To what extent would you consider your own
lifestyle to be environmentally friendly?

32
4. Attitudes and Beliefs on Climate Change
Figure 141: Top global challenges today
Other responses include:
- Can all be checked?
- government failure
- access to healthcare
- how people try to turn a blind eye to every bad thing they see
- bigotry
- US' and Japan's excessive and abusive intervention in all world matters
- United States and its allies
- Dysfunctional resources distribution system
- governments suck/ people who have power don’t maximize it to their full potential
- Decline in moral interest/application
0.0% 10.0% 20.0% 30.0% 40.0% 50.0% 60.0% 70.0% 80.0%
poverty and social inequality
population growth and urban crowding
pollution and waste management
climate change
food security
declining natural resources and biodiversity loss
disasters
worsening health conditions
corruption
wars/conflict
lack of access to education
Other (please specify)
In your opinion, what are the three top global
challenges today? Choose only 3.

33
Table 144: Respondents' belief on whether climate change is currently happening
Do you believe climate change is currently happening? Response Percent
Yes 95.0%
No 2.0%
I don’t know 2.9%
Respondents who believe that climate change is currently happening were asked the next question:
Table 155: Causes of recent climate change
If you answered “Yes” above, what do you think is causing recent climate change (e.g. in the past 150 years)?
Response Percent
It is caused mostly by human activities. 42.5%
It is caused mostly by natural changes in the environment. 0.5%
It is caused by both human activities and natural changes. 56.8%
I don’t know. 0.0%
Other (please specify) 0.2%
Other responses include:
- Both naturally and by human activities
Table 166: How worried respondents are about climate change
How worried are you about climate change? Response Percent
Very worried 22.6%
Moderately worried 51.7%
A little worried 24.3%
Not at all worried 1.4%
Undecided 0.0%

34
Figure 152: Most serious impact of climate change on the country
Other responses include:
- Extreme weather events
- everyone just don't care or don't care enough
- change in typhoon paths
- Addition to global problems that are already present
- It will slow down the development of China.
- all of the above
- EXTREME heat
- ALL OF THE ABOVE
Populations at risk to more frequent or severe
extreme weather events
Displaced populations due to sea level rise
Decreased food supply
Loss of biodiversity
Decreased capacity of ecosystem services (e.g.
carbon sequestration, climate regulation, water…
Coral bleaching
Increase in climate-sensitive diseases or health
issues
Other (please specify)
0.0% 5.0% 10.0% 15.0% 20.0% 25.0% 30.0% 35.0% 40.0% 45.0%
What, in your opinion, is the most serious impact
of climate change on your country?

35
Figure 163: Extent of effects of climate change
Figure 174: Contribution of activities to the impacts of climate change
0
50
100
150
200
250
300
350
400
You,
personally
Your family Your city Your
country
People in
developing
countries
People in
developed
countries
Nu
mb
er
of
Re
spo
nse
sTo what extent do you feel climate change will
affect the following?
Not affected
A little affected
Moderately affected
Greatly affected
I don't know
0
50
100
150
200
250
Nu
mb
er
of
Re
spo
nse
s
In general, how would you estimate the
contribution of your current lifestyle to the
impacts of climate change?
None at all
A little
Some amount
A lot
I don't know

36
Figure 185: Sources of information about climate change and environmental issues
Other responses include:
- Studies
- My high school professor was really influential in promoting environmental awareness among
his students
- class
- Textbooks
- Benefactor/Grandfather like figure
- Company Publications
- Own research
- Environmental organization talks and events (Ateneo ESS)
- School orgs
0.0%
10.0%
20.0%
30.0%
40.0%
50.0%
60.0%
70.0%
80.0%
90.0%
100.0%
Where do you normally get your information in
climate change and environmental issues?
(Select your 3 most important sources only)

37
Figure 196: How much the respondents trust different sources about climate change and environmental issues
0 100 200 300 400
Scientists
National government officials
Local government officials
Teachers / university officials
Radio and Television
Newspapers
Magazines
Private companies
Internet sources
Family
Friends
Number of Responses
How much do you trust the following as sources
of information on climate change and
environmental issues?
I don't know
A lot
A moderate amount
A little
None at all

38
IV. Discussion and Recommendations
Activities and Lifestyle:
The survey results describe the typical lifestyle of a middle- to upper-middle-class
undergraduate student of this Ateneo. Students mostly spend their time studying/working, social
networking, watching TV or movies, or listening to music, singing or dancing. The top-ranked dietary
components are meat and rice, and beverages in plastic PET bottles are purchased a few times a week
on average, mainly due to preference and convenience. Each day, most students take 10-20 minutes to
shower and use air conditioning units for 5-8 hours at a 16-20°C setting. Private vehicles are the primary
means of transport to the university, followed by the public mass transport system and walking (many
students opt to live in apartments or off-campus dormitories within walking distance).
At home, approximately half the respondents do not practice waste segregation, because they
claim to lack the support system and because the mainly see the effort as futile because they believe the
garbage collections mix the waste anyway. However, when asked what respondents do with their old or
damaged belongings, re-sell or donation, repair or re-purpose, or in the case of books, just keeping the
old/damaged item, were more dominant practices over simply disposing of the product. Cellphone
purchase was used as an indicator of consumption in this survey, and most respondents indicated that
they only purchase a new unit every few years when their current ones are broken, lost or stolen.
In terms of being proactive by not patronizing products that are not environmentally-friendly,
81.2% of the respondents answered that they would sometimes do this. Price and quality are the clear
top factors in deciding whether to purchase a product rather than environmental performance (except
for cars and motorcycles). When asked what factors would make them willing to spend more for a
product, respondents cited more pragmatic factors such as urgency of need, quality of the product,
multi-purpose use, health benefits, and rarity. Less than 50% valued the ecological aspect of the
product, and the environmental/social justice practices of the manufacturer, and only 31.3% considered
the waste produced from the product and its packaging.
Given the above results, the student respondents have perhaps correctly self-diagnosed their
lifestyles and attitudes as “little” to “moderately environmentally friendly.” Interesting patterns arise,
however, in the section on perceptions of impact.
Perceptions of Impact:
When asked to identify the types of impacts – whether economic, social or environmental
impact, more than one or none – of their lifestyle choices, students primarily identified water use,
energy use and waste generation as having predominantly environmental impacts. However, while
students more students claimed to be aware of household water, electricity and fuel use, fewer were
aware of the types of volumes of waste they produce and where these go after they are thrown away.
Modes of travel, food consumption and electronics consumption were identified has having
primarily economic impacts. How they spend study/work or spend their free time were identified as

39
having primarily social impacts. These results are interesting compared to responses to the previous
section on lifestyle choices. Students’ preferred activities (e.g. TV/movie watching and listening to
music) and everyday habits (e.g. air conditioning use, travel via private vehicles, purchase of beverages
in PET bottles) do have environmental and economic repercussions as well, but these did not seem to
have factored significantly into the responses on perceptions of impacts. This seems to denote the
following:
(1) That awareness of environmental impacts relating to water, energy and waste is
divorced or compartmentalized from (rather than integrated into) their understanding
of the economic and social systems;
(2) That knowledge gaps may still exist with regards to the environmental impacts of
agriculture and the electronics industry impacts, and the waste management chain as
contextualized through a more comprehensive life cycle analysis.
(3) That little connection is seen between what they learned of environmental issues and
their personal lifestyle choices.
Students may not have internalized classroom lessons enough to be aware of their personal
footprints, and to translate these lessons into concrete actions. This is ironic considering that the entity
identified in the survey as being most responsible for taking care of the environment is oneself. The
above trend is further supported by respondents’ answers to the question of who they see as being
discernibly affected by their lifestyle decisions. Fewer respondents ranked themselves as being affected
by water and energy usage and waste generation compared to the mode of transport, food and
electronics consumption, and study/work and recreational activities. Conversely, impacts on the city,
country and global communities were ranked low in the latter set of lifestyle parameters.
Attitudes and Beliefs on Climate Change:
The trends/themes from the section on perceptions vis-à-vis actual lifestyle choices do echo through
the results from the last section on attitudes and beliefs on climate change. In this section, respondents
were asked to select the three top global challenges of today. Poverty and social inequality ranked first
(68.5%), followed by pollution and waste management (51.9%), and declining natural resources and
biodiversity loss (34.7%). Climate change ranked fifth (31.5%). These results again reflect a discrepancy
in that students believed pollution, waste management and natural resource management to be among
the top global challenges, but are not making the connection to their own ecological footprints and
waste generation on a personal or household level.
95% of the student population believe that climate change is happening. Most (51.7%) are
“moderately worried” as they see the impacts of climate change affecting them and their families
“moderately”, while the greater impacts are to be felt over the rest of the city, country, and people in
both developing and developed countries in general. The most serious impact of climate change in the
Philippines was perceived to be the risk posed by more frequent or severe extreme weather events
(40.3%) followed by decreased capacity of ecosystem services (23.4%).

40
When asked to estimate the contributions of their personal lifestyle choices to the impacts of
climate, again, energy and water usage and waste generation were ranked as having more contribution
than travel and food and electronics consumption. The way the students spend their time through study
or recreation was predominantly ranked as having “a little” impact, consistent with the results in the
previous section.
Comparisons Across Groups:
The aforementioned indication of a seeming lack of internalization of the holistic environmental-
economic-social impacts of their lifestyle choices seems to persist regardless of whether the student has
taken ES 10/12 or Sci 10, and even regardless of whether they are ES majors or not (though it should be
noted that ES majors represent a small pool of respondents, more than half of which were still at the
sophomore level and therefore have not yet taken more advanced ES subjects).
Statistical differences did emerge between groups. The most number of statistically significant
differences were noted in the “Year Level” classification, with 38.62% of tests registering significant
differences, mostly at a 99% confidence level. These differences lay mainly in question #25 (what
respondents do with damaged products), question #26 (what factors into decisions to buy products),
and question #27 (what would make them willing to pay more for a product). However, although the
numbers for each choice may be statistically different across year levels, the overall trends within the
year levels are still similar. For example, in question #25, majority of respondents, regardless of year
level, opt to re-sell or donate clothes, shoes and bags, and keep books even if old or damaged. One
difference is with the electronics – most freshmen opt to re-sell/donate or repair re-use, most
sophomore dispose of them or repair, most juniors dispose or resell/donate and most seniors re-
sell/donate or dispose of these items.
In question 26, all year levels have price and quality as the highest deciding factors with
environmental-friendliness only substantially relevant for cars or motorcycles. The top reasons for
willingness to pay for products are likewise the same across the year levels. There were 2 statements
that explicitly highlighted the environment and that indicated statistically significant differences at the
99% confidence level. These are
• “The garbage produced from the product (e.g. packaging, by-products) is recyclable or
biodegradable.” – Majority: Sophomores
• “The product is from a company that cares about or gives part of its profits to the
environment and/or social causes.” – Majority: Freshmen
It was hypothesized that as Ateneo students progressed through their years at the university,
they would gain more exposure to environmental and sustainable development issues such that seniors
would exhibit greater environmental awareness over freshmen. However, this does not seem to be
supported by the survey results.
Following the tests across year levels are the tests between males and females with 30.16% of
registering significant differences. The differences are mainly in question #10 (how they spend their
time), question #25 (what respondents do with damaged products), question #33 (awareness of
41
household consumption), and questions #42 (contribution of water use and waste generation). For
question 33, for example, more males know (compared to males who don’t know, not compared to
females who know) whether their appliances are energy efficient. However, other than that, the trends
within the group are still similar – while respondents, both male and female, were aware of their
electricity, water and fuel consumption, they were less knowledgeable of the breakdown of the
different wastes they produced and where these wastes go. In terms of contributions of lifestyle choices
to climate change, the proportion of females that answered “a lot” rather than “some” or less for water
and waste is greater than among the males. For both groups, however, their personal work/study
practices and the way they spend their free time received mostly the answer “a little.”
Differences in responses across those who took ES10/12 and those who did not, those who took
Sci10 and those who did not, and across schools varied only in the 10-20% range. (For more details, refer
to the report prepared by the Ateneo Statistics Circle in Attachment I.)
Issues/Gaps to Address:
The results of the survey highlight important issues that the university could focus on in its
evaluation of environmental- and development-related programs and courses, in order to translate
knowledge into an integrated understanding of the issues, then into personal reflection, and then,
finally into action. These issues arising from survey include the following:
(1) The need to better connect classroom lessons to the students’ own personal and household
impacts, and then to challenges being experienced at a bigger scale.
(2) The need to further highlight and emphasize the integrated “triple bottomline” approach of
sustainable development which considers social, economic and environmental dimensions
of the choices we make and the actions we take, and the interconnections and interactions
among these dimensions as seen in issues like climate change, environmental degradation
and social justice.
(3) The need to reconcile pragmatism (e.g. concerns regarding price) with being
environmentally-friendly in terms of purchase and consumption decisions.
(4) The need to work with parents and communities to provide support mechanisms so that
what is taught in the university can be reinforced and continued at home.
Survey results showed that the trust level of students in their teachers, professors and in scientists is
high compared to other sources of information so the university is well-positioned to catalyse action.