atacraids tutorial -...
TRANSCRIPT

ATACRAIDS Tutorial
B A I R A n a l y t i c s
6 4 0 P l a z a D r i v e , S u i t e 3 4 0
H i g h l a n d s R a n c h
C o l o r a d o , 8 0 1 2 9
( 3 0 3 ) 3 4 6 - 6 0 0 0
1 1 / 1 / 2 0 1 1
Share data with all agencies in the nation, create private
data sharing groups, or prohibit anyone from seeing your
crime data. Your agency has complete control over which
agencies in the ATACRAIDS system can view your data.

1
Table of Contents Overview ...........................................................................................................................................4
ATACRAIDS ................................................................................................................................................ 4
Customized dashboard analytics .............................................................................................................. 4
National information and intelligence sharing ......................................................................................... 4
Works with any RMS or CAD system ......................................................................................................... 4
Robust offense data, including narratives ................................................................................................ 5
User Management .............................................................................................................................6
Adding new Users ..................................................................................................................................... 6
Deleting Users ........................................................................................................................................... 7
Changing Password ................................................................................................................................... 7
Logging Out ............................................................................................................................................... 8
Classifying crimes ...................................................................................................................................... 8
ATACRAIDS Window ..........................................................................................................................9
Using ATACRAIDS to query data ....................................................................................................... 10
Searching for an Address .................................................................................................................. 11
Jump directly to a city. ............................................................................................................................ 12
Navigating to a city from the national map ...................................................................................... 12
Using the buffer feature .......................................................................................................................... 13
Zooming in and out on the map .............................................................................................................. 13
Visualization of the map layer ................................................................................................................ 14
Layer Description ............................................................................................................................. 15
Area Codes .............................................................................................................................................. 15
Congressional Districts ............................................................................................................................ 15
Diversity .................................................................................................................................................. 15
Federal and Tribal Lands ......................................................................................................................... 15
Gender ..................................................................................................................................................... 15
Governmental Units ................................................................................................................................ 15
Labor Force Participation Rate................................................................................................................ 15
Median Age ............................................................................................................................................. 15
Median Home Value ............................................................................................................................... 16

2
Median Household Income ..................................................................................................................... 16
Median Household Net Worth ................................................................................................................ 16
Natural Hazards ...................................................................................................................................... 16
Owner-Occupied Housing........................................................................................................................ 16
Population Change .................................................................................................................................. 16
Population Density .................................................................................................................................. 16
Projected Population Change .................................................................................................................. 16
Rail Network ............................................................................................................................................ 17
Retail Spending Potential ........................................................................................................................ 17
Social Vulnerability to Disaster Events .................................................................................................... 17
Tapestry Segmentation ........................................................................................................................... 17
Time Zones .............................................................................................................................................. 17
Unemployment........................................................................................................................................ 17
Weather Forecast .................................................................................................................................... 17
Weather Hazards .................................................................................................................................... 17
Zip Codes ................................................................................................................................................. 18
Panning the map.............................................................................................................................. 18
Adjust which crime types are displayed ............................................................................................ 18
Selecting a date range from the Quick Date drop list ......................................................................... 19
Adjusting the Start and End Dates .......................................................................................................... 19
Turning on the density feature ................................................................................................................ 20
Viewing crimes in the Data Grid ....................................................................................................... 20
Moving Columns ..................................................................................................................................... 22
Sorting data ............................................................................................................................................ 23
Adding Filters .......................................................................................................................................... 23
Using Wildcards ...................................................................................................................................... 24
Clearing Filters ........................................................................................................................................ 24
Searching Fields or Narrative .................................................................................................................. 25
Paging through records ........................................................................................................................... 25
Switching to the relational view .............................................................................................................. 26
Downloading/Exporting Data ................................................................................................................. 26

3
Viewing the Total number of records in view ......................................................................................... 27
Selecting crimes by Police Department ................................................................................................... 27
Analytics .......................................................................................................................................... 28
Viewing crimes in the Analytics tab ........................................................................................................ 28
Adding / Removing Analytics .................................................................................................................. 29
Moving analytics around the Analytical Dashboard ............................................................................... 29
Creating Reports in ATACRAIDS ........................................................................................................ 30
Viewing crimes in the Metadata tab ................................................................................................. 34
Crime type definitions ...................................................................................................................... 34

4
Overview
ATACRAIDS ATACRAIDS is a web-based analysis product that allows LEA's to view their own crime data alongside
that of others from adjacent agencies. Law Enforcement Agencies have full control on what data is
shared and can restrict access to certain crime types they do not want other agencies to have access to.
Customized dashboard analytics
Descriptive graphics help users visualize crime patterns and trends across jurisdictional lines. Users can choose from over 70 dashboard modules that help users visualize review nearly every aspect of their data. Each user can have a custom dashboard layout with up to 8 dashboard modules in view at one time. Crime hotspot maps and custom predictive analytics can be created with one click against any data on the map, even data spanning multiple jurisdictions. Best of all, users can download this robust crime data from ATACRAIDS, including narratives, for further analysis.
National information and intelligence sharing Crime data is automatically extracted and cleaned to present a single, standardized format for use by participating agencies, without affecting the data integrity of the original data. Standardization of format in this manner supports improving data quality standards and promotes multi-agency collaboration. Users can easily view, analyze and download crime data from neighboring jurisdictions and agencies, or from participating agencies across the nation.
Works with any RMS or CAD system ATACRAIDS is never directly connected to an agencies CAD or RMS system. ATACRAIDS translates data
from disparate data sources into a seamless, standardized data set that makes it easy to view, analyze
and share data between departments. ATACRAIDS is updated through an automated data feed that
works with any CAD or RMS. The extracted data is saved locally within the agency and the data is pushed
into ATACRAIDS with no action necessary on the part of the user. Once the process has been adapted to
fit the needs of an agency, updating can be achieved either periodically or manually. If the user chooses

5
periodic updates, they select the frequency (every day(s) or week(s)) and our software will automatically
refresh the data as directed.
Robust offense data, including narratives
The ATACRAIDS system includes more than 95+ variables of Modus Operandi, Persons and Vehicle crime data related to each incident, including the incident’s narrative. Users can view all of the information for the incident, including detailed offense information, suspect and victim descriptions, and descriptions of any vehicles related to the incident. Narratives and other note fields are also included. Agencies can also limit the amount of information being shared and can even choose to hide entire records if necessary.
6
ATACRAIDS Tutorial
While ATACRAIDS works with several browsers, it works best with Internet
Explorer 7+, Firefox or Chrome.
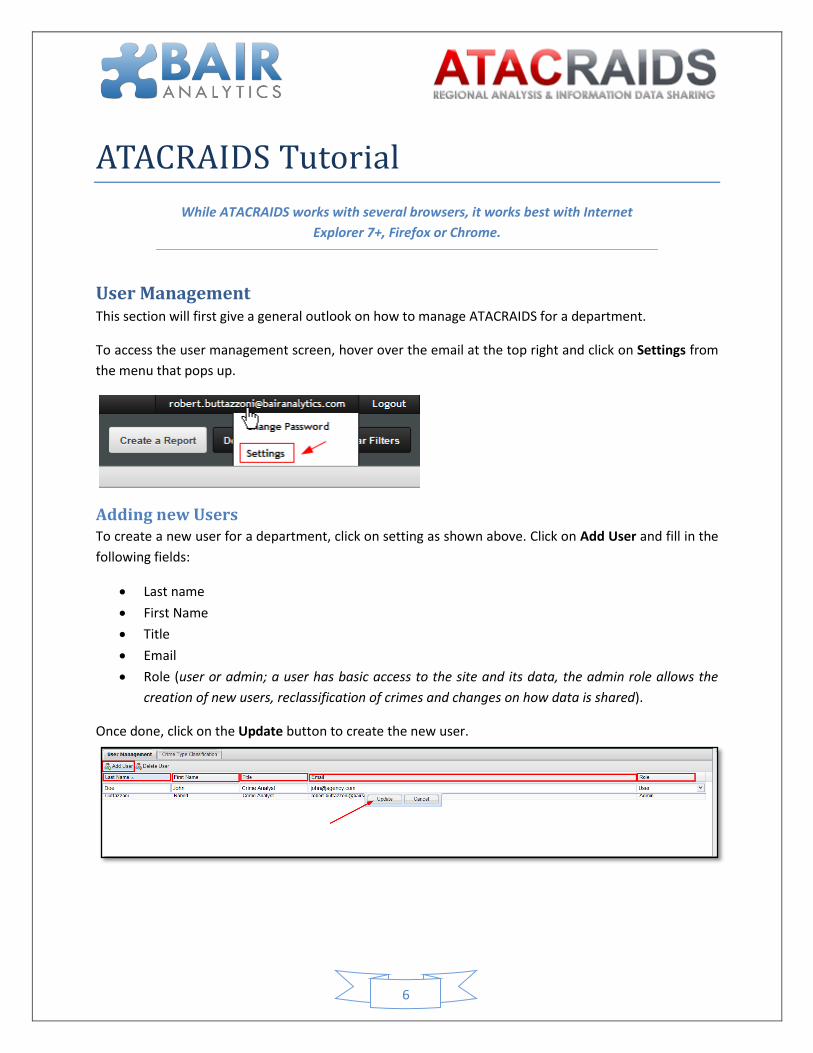
User Management This section will first give a general outlook on how to manage ATACRAIDS for a department.
To access the user management screen, hover over the email at the top right and click on Settings from
the menu that pops up.
Adding new Users To create a new user for a department, click on setting as shown above. Click on Add User and fill in the
following fields:
Last name
First Name
Title
Role (user or admin; a user has basic access to the site and its data, the admin role allows the
creation of new users, reclassification of crimes and changes on how data is shared).
Once done, click on the Update button to create the new user.

7
Deleting Users Deleting users is achieved via Settings - User Management tab. Select the user to be removed and click
on the Delete User button. To finalize the action, select Update as shown in the graphic below.
Changing Password To change a password, hover over the email at the top right and click on Change Password from the
menu that pops up.
Users will need to type in the following information:
Current Password
New Password
Confirm Password
Once done, click on Change Password for the change to take effect.

8
Logging Out To logout, click on Logout at the top right corner of the screen
Classifying crimes Once the translation is in place and the department has started uploading cases to ATACRAIDS, users
can start classifying crimes. To do so, click on Settings at the top right corner of the screen and select
Crime Type Classification.
The Crime Type Classification tab allows users to edit the classification of crime, manage
access/visibility and provide spatial offsets to mask the true location of crime for privacy purposes.
Under Viewable By users can set if they want the crimes to be viewed by Law Enforcement Only, Public
and Law Enforcement or Do not Import. Users can also add a random offset to hide the true location
were the crime occurred by checking the box under Add Random Offset.
When this is completed, make sure to click on Save at the bottom of the screen.
Note: There is a 30-min timer on the site. If users don’t make any changes to the page for 30-mins the
session will be timed out and any changes will be lost. In a previous iteration of ATACRAIDS, users had to
save every 30-mins regardless of whether they made any changes or not. The timer now starts from the
time the user last makes any change to the page.

9
ATACRAIDS Window
The ATACRAIDS window is made up of three regions:
- Account Management.
- Display window, which includes tabs that allow users to determine what the region displays and
summary details.
- Menu window, which allows users to query data and apply hot spots
Account Management is where users set passwords, crime classifications and perform account
management functions (add/delete users, set access rights etc.)
Display Window, which not only displays information, but has the controls to set how the data will be
displayed, be it: Spatial, Tabular, Charts or in a summarized format by agency.
Menu Window, which allows users to set the parameters to extract data based on location, crime type
and time. The menu window also contains an analytic layer to apply hot spot analysis to the map view.

10
Using ATACRAIDS to query data
The primary ways users select data using ATACRAIDS is via three tabs in the menu window. Those tabs
are:
- Search Address
- Crime Types
- Date Range
In addition to the primary options, ATACRAIDS users also have the option to minimize their data by use
of filters and a search window found within the Data grid view.
Filters are a powerful way of tailoring/refining data, but filters remain in place
until such time as they are cleared. This can result in analysts running a second
query and already having filters applied from a previous query (adding
inappropriate bias to the data).

11
Searching for an Address
To search for an address, click on the Search address tab and then type an address in the
Address field. Users will need the following information:
1. Street Number
2. Street Name
3. City
4. State
Once the information has been entered, click the Go to Address.

12
Jump directly to a city.
To jump to a city, click on the Jump to City drop list and select the city to view crime data for
(cities are ordered alphabetically by State).
Navigating to a city from the national map
To navigate from the National Map, click on a dark blue-shaded State on the map. An info
window containing participating cities for the state will appear. Users can then click on the city
of choice.

13
Using the buffer feature
The buffer layer allows users to set a perimeter around an address. To create a buffer, click the
checkbox labeled On under the Buffer section.
To adjust the size of the buffer, select a distance from the buffer distance drop list menu. To view
crime within the buffer, click the Only display crimes within buffer checkbox.
Zooming in and out on the map
Zooming in and out is done by either using the scroll wheel on the mouse or the slider at the
upper left portion of the map. The cursor will need to be over the map for the scroll wheel on the
mouse to work as a zoom tool.

14
Visualization of the map layer
To change the map layer, click the Map, Satellite or Canvas, buttons in the upper right side of
the screen.
Each layer provides a different level of precision. The Canvas view allows the inclusions of data layers.
These layers provide additional information and supplement the crime data displayed.

15
Layer Description
The following section explain more in depth the different layers and the additional value they provide
Area Codes This map shows the current area codes used in the United States.
Congressional Districts This map presents the 112th Congressional Districts for the United States.
Diversity This web map combines a summary of racial and ethnic diversity in the United States. The darker the
blue color, the more diverse the population. This map shows ESRI's 2010 estimates using Census 2000
geographies.
Federal and Tribal Lands This map represents the federal and tribal owned land areas of the United States.
Gender This web map shows the relative percentage of males and females in the United States in 2010. Blue
areas on the map have relatively more males. Pink areas have relatively more females.
Governmental Units This map displays the USGS governmental unit boundaries service outlines for States, Territories,
Federal and Native American lands, counties, and incorporated places such as cities and towns.
Labor Force Participation Rate This web map combines the rates of labor force participation of working-age people in the United States
in 2010. This map shows Esri's 2010 estimate using Census 2000 geographies.
Median Age This web map combines the median age of people in the United States in 2010. The darker the brown
color, the higher the median age. This map shows Esri's 2010 estimates using Census 2000 geographies.
16
Median Home Value This web map combines the median home value in the United States in 2010. The darker the green
color, the higher the median home value.
Median Household Income This web map combines the USA median household income for the United States in 2010. The darker
the green color, the higher the median household income.
Median Household Net Worth This web map combines the median household net worth in the United States in 2010. Dark green
shows the areas with the highest median net worth, dark purple the lowest.
Natural Hazards This map presents the current natural hazards events (hurricanes, earthquakes, wildfires, etc.) in the
United States. This map was developed as part of the United States Geological Survey’s (USGS) Natural
Hazards Support System (NHSS) which is available at http://nhss.cr.usgs.gov.
Owner-Occupied Housing This web map combines the rates of owner occupied housing in the United States in 2010. The darker
the purple color, the higher the rate of owner occupied housing.
Population Change This thematic map indicates the annual rate of total population change in the United States from 2000
to 2010. Green represents a population gain, red a decline.
Population Density This web map combines the population density in the United States in 2010 with a reference overlay.
The darker the color in the map, the more dense the population.
Projected Population Change This thematic map indicates the annual compound rate of total population change in the United States
from 2010 to 2015. Green represents a population gain, red a decline.

17
Rail Network This map shows the nation's railway system, from the Federal Railroad Administration (FRA) rail network
database, this map provides location and information for all railways.
Retail Spending Potential This thematic map illustrates the ESRI Spending Potential Index (SPI) for retail goods in the United States
in 2010. Dark purple illustrates large amounts of retail spending and dark brown shows low retail
spending.
Social Vulnerability to Disaster Events This thematic map provides a simple summary of the social vulnerability of populations in each state or
county in the United States in 2009. The darker the shading the more vulnerable an area is.
Tapestry Segmentation This thematic map classifies U.S. neighborhoods into 65 segments [PDF] based on their socioeconomic
and demographic composition [PDF].
Time Zones This map illustrates all of the world time zones.
Unemployment This thematic map illustrates the unemployment rates in the United States in 2010. Dark purple shows
areas with the highest unemployment rates and the light purple shows areas with lower unemployment
rates. This map shows ESRI's 2010 estimates using Census 2000 geographies.
Weather Forecast This map contains major US city locations with links to US Weather Service 3 and 7 day forecasts.
Weather Hazards This map presents information about current United States weather watches and warnings that
have been issued by NOAA’s National Weather Service (NWS). This map was developed as part
of the United States Geological Survey’s (USGS) Natural Hazards Support System (NHSS)
which is available at http://nhss.cr.usgs.gov

18
Zip Codes
Panning the map
Users can move the map by left clicking and dragging or by clicking the arrows located in the
upper-left portion of the map.
The data visible in the map view is also the data that will be presented in the data grid.
This allows users to reduce the dataset they are looking at based on location.
Adjust which crime types are displayed
To adjust the crimes in the view, click on the Crime Types menu in the sidebar and then select
the required crime(s).

19
Alternatively, click the Select All button at the bottom of the menu to view all crimes or click the
Deselect All button to remove all crimes from view.
Selecting a date range from the Quick Date drop list
To select a pre-defined data range, click on the Quick Date drop list and select the desired date
range.
Adjusting the Start and End Dates
To select specific start and end dates, select the dates from the Start Date and End Date
calendar under the Date Range section.

20
Turning on the density feature
A density map, or hot spot analysis, provides a spatial analysis of where crime is clustering.
Users can choose to generate density maps based on single or multiple crime types. To switch,
the user simply selects a new crime type and clicks on Calculate.
Viewing crimes in the Data Grid To view crime data in tabular form, click on the Data Grid tab highlighted below.

21

22
The Data grid allows users to view the details associated with crimes, both within their own
jurisdiction and, if available, in neighboring jurisdictions to identify possible relationships. To
view the total number of records in view, look at the bottom right corner in the Data Grid view.
Moving Columns
To re-order the columns, click on a column header and drag it to another location.

23
Sorting data
To sort data within the Data Grid, click on the arrow that appears on the right-hand of the
header, then select Sort Ascending or Sort Descending.
Adding Filters Filters allow specific searches by allowing users to enter keywords to limit the number of cases shown.
By clicking on the downward arrow, at the end of a column and selecting Filters, users can enter a
keyword like “residence”. This will only show the Location types entered as residence. It is also possible
to add filters to every field in the database.

24
Using Wildcards In addition to searching for words, a user may also use wild cards to search for multiple variables at once
within the query field.
Ex: To search or the following beats: D5, D9, D8
Use the following expression: D[598]
For a more complex query using multiple numbers, a dash can be added to separate the values.
Ex: To search for 1955, 1959, 1978
Use the following expression: 19{55-59-78}
This will be helpful to gather multiple values and provides an additional tool to gather information.
Clearing Filters To clear all filters, for all fields, click on Clear Filters.

25
Searching Fields or Narrative Searching for data is made easy by allowing users to either search the Fields or the Narrative of the
cases. Clicking on the Eyeglass starts the search.
Type in the Search box the information/string required. Users can then either click on Notes to search
the narrative or All Fields to search all the fields.
Paging through records
To cycle through the pages of crimes in the Data Grid, click on the navigation arrows in the
toolbar below the grid. Arrows will move either backward, or forward one page and the double
arrows will either move to the first or last page of crime in view.

26
Switching to the relational view The primary view presents a single record for each discrete incident. To switch to the relational view,
click Switch to Relational View tab as highlighted below. The relational view displays all records
associated with a single incident number.
Downloading/Exporting Data Users can download records by typing a file name, selecting a format and clicking on Download Data
under the Data Grid view. Users can download records to .atx format (ATAC format), .kmz, .csv, .xls or
.mdb formats.
In addition, checking Full Query will allow to query a maximum amount of 100 000 records.

27
Viewing the Total number of records in view
Selecting crimes by Police Department The Data Grid view provides the ability to select data based on very precise search criteria. In this
section we will demonstrate how to select data for only one Police Department.
The following grid view shows 3 distinct police departments. All crimes in this view are mixed and
difficult to analyze without proper sorting.
By writing the name of the department under the filter box, the Data Grid view will sort all crimes and
select only those for the department specified.

28
Users will now be able to see the crimes for just that Police department in the Map view.
Analytics ATACRAIDS offers a much more robust analytics suite than RAIDS Online and provides a vast array of
charts and graphics to analyze data.
Viewing crimes in the Analytics tab The Analytics tab provides graphs and charts to help better understand the crime situation in any given
area. To view the analytics, click on the Analytics tab on the upper left portion of the map.

29
Adding / Removing Analytics ATACRAIDS provides users complete control over the layout and content of their Analytics view.
Managing the contents is accomplished via the Add/Remove Analytics tab located at the bottom of the
screen.
Moving analytics around the Analytical Dashboard
Move any visual representation of the data by clicking on its title bar and dragging it to the
desired position.

30
Creating Reports in ATACRAIDS
Generating reports using ATACRAIDS is a straightforward process and users can determine the
frequency of reports as well as the variables used within them. In addition to having reports sent to
themselves, users can email reports to other ATACRAIDS addressees within their own department.
Note: While we could enable analysts to have additional addressees directly, we appreciate errors can
and do happen and believe a stop gap is appropriate. Once they have the report, users can forward
reports manually or create an auto forward.
The first part of the process is determining what is required in the report. As far as the charts and graphs
are concerned, what is set up in the display is what will be outputted to the report. For this example, the
user has a relatively high number of crimes per week and wants to generate a weekly summary for
major crimes to include: Day of Week, Hour of Day, Crime Class and by Beat. Users can also use the filter
options in the data grid to select by beat, specific day-of-week etc.
The format/placement of the graphics has been set and the next part of the process is to create the
report. This is the first run at generating a report, so we recommend generating a one-time-download to
review how the data is laid out etc. Once the format is how the user wants it, return to the create report
option and select how often the report is required and who the audience is.

31
Generating a report
Select the Create a Report button at the top right hand corner of the ATACRAIDS screen.
Screen 1: Add a report name and the
format required.
Next
Screen 2: Select the export formats
required.
Next
Screen 3: Review the report.
Finish
Screen 4: To download the report,
click on here

32
Scheduling Reports
If a user wishes to build a report and then have it repeated weekly, or monthly the process is as follows.
Create the query you want to have run. Select your Address, Crime types and Date range and apply any
filters you might want to use.
The date range will automatically adapt for follow on reports. For example, if the
user sets the date range as being from Monday March, 5th through to Sunday
March, 11th and build the report to run every Wednesday starting on March 14th,
subsequent reports will be adjusted to generate the equivalent date range. So, on
Wednesday 21st the report will use the date range 12-18 March. So the report
dates selected adapt to meet future requirements.
The basic report format is listed on the previous page, but for clarity the entire process required to
create periodic reports is demonstrated below.
Screen 1:
Report Name: weekly
Scheduled Email
Next
Screen 2:
Analytics PDF:
KML Map
Next

33
While users will only be able to render 500 records for viewing in ATACRAIDS ONLINE, when a report is
generated to PDF and/or KML format up to 10,000 records will be used for the report. The 500 records
rendering is a feature of the web browser and not ATACRAIDS. To see over 500 records in the report the
user needs to select Include Full Query at Screen 1.
Screen 5: Summary of what the user has requested:
Screen 3: Add emails addressees from
the list as required.
Next
Screen 4: Enter the Frequency and use the drop
downs to set time and day.
Next
34
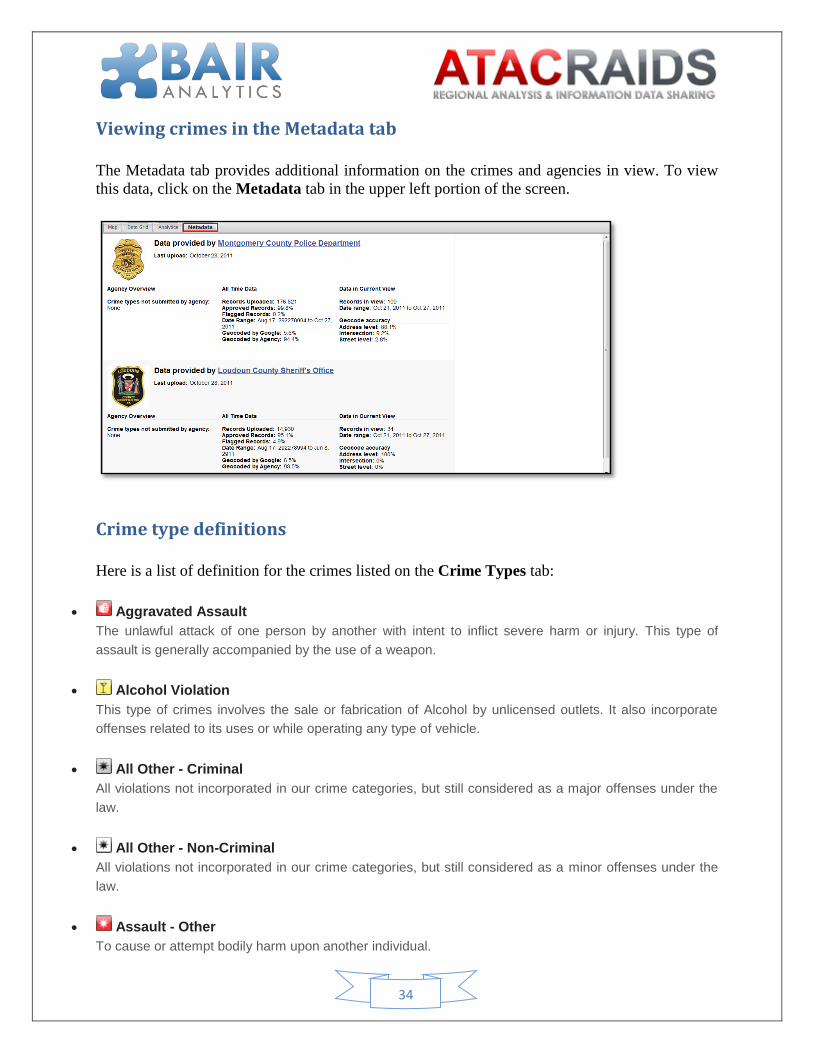
Viewing crimes in the Metadata tab
The Metadata tab provides additional information on the crimes and agencies in view. To view
this data, click on the Metadata tab in the upper left portion of the screen.
Crime type definitions
Here is a list of definition for the crimes listed on the Crime Types tab:
Aggravated Assault
The unlawful attack of one person by another with intent to inflict severe harm or injury. This type of
assault is generally accompanied by the use of a weapon.
Alcohol Violation
This type of crimes involves the sale or fabrication of Alcohol by unlicensed outlets. It also incorporate
offenses related to its uses or while operating any type of vehicle.
All Other - Criminal
All violations not incorporated in our crime categories, but still considered as a major offenses under the
law.
All Other - Non-Criminal
All violations not incorporated in our crime categories, but still considered as a minor offenses under the
law.
Assault - Other
To cause or attempt bodily harm upon another individual.

35
Arson
The act of setting fires to structures or wild areas with malicious intent.
Attempted Homicide
Acting deliberately and intentionally or recklessly with complete disregard for human life to kill another
person.
Burglary - Commercial
Breaking and entering into a commercial property with intent to steal valuables from its premise.
Burglary from Motor Vehicle
The theft or attempted theft of personal objects inside a motor vehicle
Burglary - Residential
Breaking and entering into a residence with intent to steal private belongings.
Death Investigation
An investigation regarding the events leading to the death of an individual, criminal or not.
Disorderly Conduct
Any action that goes against decency, public peace or has the outcome of shocking the public’s sense of
morality.
DUI (Driving Under the Influence)
Drivng a vehicle while being physically or mentally impaired by the use of alcohol or illegal substances.
Drugs / Narcotic Violation
Any offense regarding the manufacturing, distribution or use of illegal substances (narcotics).
Fraud
Any offense involving the distortion of the truth to gain personal gain or wealth.
Motor Vehicle Theft
The theft or attempted theft of a motor vehicle.
Homicide
The killing of another human being (non-negligent).
Robbery - Commercial
Any offense involving the act of stealing from a business by using threats or force.

36
Robbery - Individual
Any offense involving the act of stealing from an individual by using threats or force.
Sexual Assault
The carnal knowledge of an individual, forcibly and against their will.
Sexual Offense: Other
An offense against chastity, morality or decency (Incest, indecent exposure, and statutory rape).
Shoplifting
To steal merchandise from a business while they are opened for business.
Theft
The unlawful taking, carrying, leading, or riding away of property from the possession or constructive
possession of another.
Theft - Other
Other related theft crimes
Traffic Incident
A non-expected collision with a vehicle. This includes land, sea and air.
Vandalism
To willfully damage, deface or destroy public or private property.
Weapon Violation
The violation of laws prohibiting the manufacture, possession, transportation, sale, purchase,
concealment or use of weapons. This includes firearms, explosives, chemicals, knives and other forms of
weapon.

37
Thank you For choosing
BAIR Analytics