at the navajo mine-- impact of mining on … mexico bureau of mines and mineral resources open-file...
TRANSCRIPT

New Mexico Bureau of Mines and Mineral Resources
Open-File Report 282
PHASE-I11 RECHARGE STUDY
AT THE NAVAJO MINE--
IMPACT OF MINING ON RECHARGE
bY
William J. Stone Senior Hydrogeologist
November 1987

CONTENTS Paqe
1 1 7 7
8
10 9
11
Introduction Overview of Recharge Background of Study Problems and Purpose
Regional setting
Isotope Study Methods Hole 1: Custer Depression Hole 2: Pinto Depression Hole 3: North Barber Depression Recovery of Reclaimed Areas
Impact of Mining on Recharge Local Recharge Areal Extent of Settings Areal and Regional Recharge
Discussion and Conclusions
Acknowledgments
References Cited
Figures 1 Location of Navajo Mine and sampling holes. 2 Premining landscape settings, mine area 1 3 Premining landscape settings] mine area 2 4 Example of post-mining landscape settings. 5 Chloride profile, Custer depression 6 Stable-isotope/tritium profiles, Custer depression 7 Oxygen-l8/deuterium plot, Custer depression 8 Chloride profile, Pinto depression 9 Stable-isotope/tritium profiles] Pinto depression 10 Oxygen-l8/deuterium plot, Pinto depression 11 Chloride profile, North Barber depression 12 Isotope profiles] North Barber depression 13 Oxygen-l8/deuterium plot, North Barber depression 14 Stable-isotope/tritium profiles, Yazzie depression 15 Oxygen-l8/deuterium plot, Yazzie depression 16 Frequency of occurrence of local recharge values
Tables 1 Summary of local recharge values, Phase I11 2 Local recharge values, all settings at Navajo Mine 3 Volumetric recharge at Navajo Mine
Appendices A Isotope data B Brief field descriptions of samples C Summary of premining landscapes
15 15 19
26 26 27 30
31
32
33
2 4 5 6 12 13 14 16 17 18 20 21 22
25 24
28
23 26 29
36 40 44
INTRODUCTION
Surface mining regulations call for protection of the
hydrologic balance of a mine area. More specifically, they
require restoration of ground-water recharge through reclamation.
This is a tall order as it assumes several things: 1) that
recharge can indeed be measured, 2) that mines will have both
pre- and post-mining recharge data, and 3 ) that a desired
recharge rate can be achieved by customizing reclamation
practices. Nonetheless, efforts have been made over the paqt
three years to learn as much as possible of recharge in
undisturbed and reclaimed areas at BHP-Utah’s Navajo Mine, San
Juan County, New Mexico (Figure 1). This is the third and final
report on those recharge studies conducted by the Bureau.
OVERVIEW OF RECHARGE
Recharge is an important but elusive part of the hydrologic
cycle. Water that infiltrates into arid-land soils is subjsct to
rapid evaporation and transpiration back to the atmosphere. Most
water escaping the root zone eventually reaches the water table,
where it is added to (recharges) the saturated zone. This
assumes vertical movement under piston-flow conditions. Thst is,
for every slug of water that enters the top of the soil-watl-r
column, an equal slug moves downward. However, low permeability
horizons (silty or clayey beds) may become temporarily saturated
or cause overlying material to become saturated, resulting in
lateral flow. Such flow may also occur without impeding layers
in response to topography (McCord and Stephens, 1987).
Recharge has been shown to vary with landscape setting

4 8 i
I'
.. .
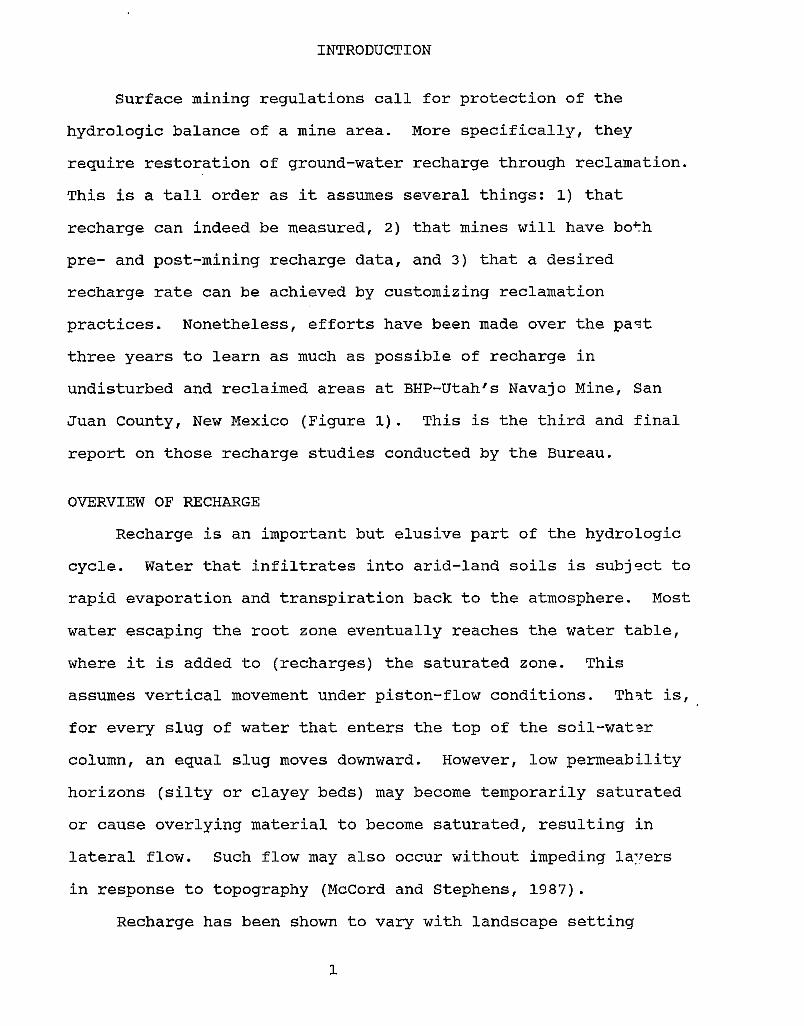
(Allison and others, 1985; Stone, 1986~). Each setting is a
unique combination of geology, landuse, soils, topography, and
vegetation. Premining (undisturbed) settings differ from post-
mining (reclaimed) settings (Figures 2, 3, 4). In order to
evaluate impact of mining, recharge under both conditions must be
compared.
Recharge may be addressed in different ways. For example,
it may be expressed in terms of a velocity-style value or rate,
associated with a point in a given setting, or as a volumetric
flux, associated with the area covered by one or more settings.
Also, recharge may be viewed at three different scales: local,
areal, and regional. Local recharge is the rate of deep
percolation for a given setting as measured or estimated at a
point. It may be a single observation or the average of se-reral
such measurements. Areal recharge is the volumetric flux for the
entire extent in the study region of a given setting (local
recharge times area). Regional recharge is merely the sum of all
of the areal recharge fluxes in the study region. Average
recharge is a velocity-style value obtained by dividing regional
recharge by the total area of the study region.
In these studies, local recharge has been determined b:r the
chloride mass-balance method. Chloride is useful because it is a
conservative natural tracer. Details of the method are giv'sn in
the Phase-I and -11 reports (Stone, 1984 and 1986). Briefly,
however, it is based on the premise advanced by Allison and
Hughes (1978) and others, that average annual precipitation (P)
times the total annual chloride content of precipitation (Clp)
should equal the annual recharge rate (R) times the average
J

0 - 1 nri
Figure 2- Premining landscape settings, mine erea 1. ' I I :
.. .
.,
:I
'I
' 11. . 1 '
! .\ , I . I .
3
i

0 - 1 mi
_. .-
Figure 3 - Premining landscape settings, mine area 2.

\ I - N
0
0 Other reclaimed settings
1979 year revegetated
(ave. 98%) I .
(ave. 2%) \ / "____.. -. -_ . .. ". . -
. -. -. . . . _" Figure 4 - Example of post-mining landscape settings.

chloride content of soil water (Clsw). Shown mathematically,
this is PClp = RClsw. Rewritten for recharge it becomes R =
(ClP/ClSW) - P. BACKGROUND OF STUDY
The evaluation of recharge at the Navajo Mine was
accomplished in three phases. Phase I was conducted to test the
applicability of the chloride mass-balance method of determining
recharge to conditions in northwest New Mexico and to obtain
preliminary estimates of local recharge for major landscape
settings (three undisturbed and two reclaimed) recognized at the
mine. Phase I1 was an expanded study of local recharge in
reclaimed settings. Phase 111, that reported on here, focu-jed on
areal and regional recharge volumes and the net impact of mining
on recharge.
PROBLEMS AND PURPOSE
The chloride mass-balance method gives reasonable rech3rge
estimates in undisturbed settings (Allison and Hughes, 1978), but
to my knowledge, it had not been applied to reclaimed settings
prior to the Phase-I study. Even more chloride vs depth pr,2files
for reclaimed ground were obtained in the Phase-I1 study (S'one,
1986a). Examination of these profiles reveals that all are one of
three basic types. Some show large variation in chloride
content, suggesting equilibrium had not yet been regained.
Others have uniformly low chloride values, in some cases above a
deep peak (flushing bulge?). Still others are characterized by a
shallow peak above lower values at depth, as in profiles from
undisturbed settings.
7

These observations raise two important questions. Which
profile type represents equilibrium conditions and is thus a good
source of local recharge values? How can this equilibrium be
tested? The Phase-I1 study suggested natural isotopes may be a
useful means of testing these profiles.
In order to get at impact of mining on recharge, pre- and
post-mining regional recharge fluxes must be compared. This
requires local recharge rates, as discussed above, and areal-
extent values. Several questions arise as to areal extent. What
was the distribution of premining landscape settings? What will
be the distribution of post-mining settings? How can their areas
be approximated without exhaustive surveys?
The purposes of this study were, therefore, 1) to further
evaluate chloride mass-balance results for reclaimed ground by
means of natural isotopes, 2) to determine areal extents fo- the
major landscape settings, 3 ) to calculate volumetric recharl-Je
fluxes for each of these settings, and 4 ) to assess impact of
mining on recharge at the Navajo Mine.
REGIONAL SETTING
The Navajo Mine lies in the northwestern part of the
structural feature known as the San Juan Basin, a Laramide (Late
Cretaceous-Early Tertiary) depression at the eastern edge of the
Colorado Plateau. More specifically, it is situated just east of
the Hogback Mountain Monocline which separates the Four Corxers
Platform from the central San Juan Basin in northwestern New
Mexico.
Coal is strip-mined from the Fruitland Formation
a

(Cretaceous) which lies at the surface in this area. The
Fruitland is generally 2 0 0 - 3 0 0 ft thick and consists of
interbedded sandy shale, carbonaceous shale, clayey sandstoye,
coal, and sandstone (Stone and others, 1983).
Data collected at the mine (Utah International Inc., 1981)
indicate the climate is arid with an average annual rainfall of
5.7 inches, based on the period 1962-1980. Greatest
precipitation occurs in the period August through October.
Average annual class-A pan-evaporation rate is 55.9 inches or
nearly 10 times the rainfall.
The reclaimed areas studied in Phase I11 were regraded or
revegetated during the period 1975 to 1979. Water added during
irrigation generally did not exceed 6 inches/year. The see3 mix
most commonly applied for revegetation includes alkali sacaton,
galleta, globe mallow, Indian rice grass, saltbush, and san'l
dropseed. The average rooting depth is probably <2 ft.
The mine area is drained by the San Juan River and its
tributaries (Figure 1). The San Juan is perennial, but the
tributaries are ephemeral.
ISOTOPE STUDY
Chloride recharge values from one undisturbed upland flat
site and one reclaimed depression were checked by the stable
isotopes oxygen-18 (0-18) and deuterium (D), as well as tritium
(T), in the Phase-I1 study. Stable isotopes confirmed the
chloride recharge rate in the undisturbed site, but suggestt..-d the
reclaimed site was not yet in equilibrium, 6 yrs after
revegetation. A major task of the Phase-I11 study was to
9

resample three of the Phase-I1 sites, each characterized by one
of the three basic ch1,oride profile types.
METHODS
Sample preparation and analysis methods for isotopes were
the same as in the Phase-I1 study (Stone, 1986). Samples were
taken by coring with a hollow-stem auger rig, as in the cas? of
chloride. No water, mud, or air were introduced during drilling.
Samples were placed in covered 500 ml widemouth plastic bottles.
The caps were sealed with plastic tape, bottles were placed in
large zip-top plastic bags, and bags were stored out of dir?ct
sunlight to minimize evaporation.
Soil water was extracted by solvent distillation using
toluene, as described by Snell and Biffen (1964). Samples were
analyzed commercially (Environmental Isotope Laboratory,
University of Waterloo, Waterloo, Ontario, Canada). Data are
given in Appendix A. Concentration vs depth profiles and 0-18 vs
deuterium plots were made by hand. Regressions and correlation
coefficients were determined on a hand-held calculator.
0-18/D values for precipitation plot along a line having a
slope of 8 . This is called the meteoric water line (Craig,
1961). In arid settings, 018/D data plot on a line below and
diagonal to the meteoric line (slopes of 5 or less). The
decrease in slope results from less negative values in the
shallow part of the profile because of enrichment (evaporat,ion).
Displacement of deuterium from the meteoric line (D) provides
recharge (R) using a proportionality constant (k) : R=(k/D) 'I2 (Allison and others, 1983).
10

HOLE 1: CUSTER DEPRESSION
This site was chosen to test an erratic chloride profile.
Hole 1 was drilled approximately 10 ft due east of Hole 16 in the
Phase-I1 study. More specifically, it lies in a depression just
south of Ramp 6 in the Custer area. It was located southwest of
a large rock pile and southwest of a Forest Service experimental
plot sign.
Although the area was reclaimed in 1975, the chloride
profile is quite variable, suggesting equilibrium has not y?-t
been regained (Figure 5). Total depth was 56 ft. A brief field
log of the hole is given in Appendix B.
Oxygen-18 and deuterium profiles parallel each other qlite
well, except for the deepest point (Figure 6). The hard drilling
that caused sampling to be halted at 56 ft may have resu1te"l in
heating the water in the sample and altering its isotopic mskeup.
Stable-isotope points plot on an evaporation line below and
diagonal to the meteoric line having a slope of approximately 6
(Figure 7 ) . Regression analysis gives a good correlation
coefficient (r = 0.88). Deuterium displacement gives a recharge
rate of 0.04 in/yr; chloride gave 0.03 in/yr for the same site
(Hole 16, Phase 11). Although results of the two methods agree
quite well, the deuterium displacement method may not be
appropriate for this profile.
Tritium results look quite erratic (Figure 6). This may be
due to inequilibrium or movement of water (and T) in the vapor as
well as liquid phase in these arid conditions.
11

'I 'I ""1
- c '", 5 a 4c V D
60
II"
80
..
U
. . -. . -,
Chloride (mg/t) 0 500 1000 1500 -2000
I I
.
NV It 1b
Figure 5 - Chloride profile, Custer depression (hole NV I1 16).

I I
I 1
1
Ol
. v) m

. NV
.Y

HOLE 2: PINTO DEPRESSION
This site was chosen as an example of the undisturbed-type
chloride profile. Hole 2 was drilled approximately 20 ft
northeast of Hole 19 of the Phase-I1 study. More specifically,
it lies in a depression north of the road above a deep open cut
and east of a radio tower.
Like Hole 1, it was reclaimed in 1975/1976. By contra-;t,
however, the chloride profile looks like those of undisturbsd
areas (Figure 8). Total depth was 25 ft; a log appears in
Appendix B.
At first glance 0-18,and D profiles don’t seem to parallel
each other very well (Figure 9). However, closer examination
reveals that only two points are not in agreement (those at 10
and 5 4 ft, respectively).
Points plot on an evaporation line with a slope of
approximately 4 (Figure 10). Regression analysis shows a high
degree of correlation (r = 0.94). Deuterium displacement gives a
recharge rate of 0.06 in/yr. Chloride gives a value of 0.0%
in/yr . Interestingly, the tritium vs depth plot resembles the
chloride profile (Figures 8 and 9) and may be reasonable. The
implication is that this profile is in equilibrium, 10 yrs after
reclamation.
HOLE 3 : NORTH BARBER DEPRESSION
This site was chosen to evaluate the flushed profile. Hole
3 was drilled approximately 25 ft southwest of Hole 24 of the
Phase-I1 study. More specifically, it lies in a large depr?ssion
15

Moirlure (rn'/ml) Chloride (mg/L) 0.4 . 0.6 1000 1 so0
E
2 20
40J 1 . _ NVll'o
Figure 8 - Chloride.profile, Pinto depression (hole NV I1 19).

*
11'
0
4 7
.
Y
Y
- "
I. . ,
. ..
0
(7

..
.
.
.
.
.
.
.
.
.
..
60”, NV I 1 19
-
. 80-
- h
\ 8
0’ 0 w 100-
. . . . . m -
120-
-
140 1 1 1 1 ~ 1 1 1 1 1 1 1 1 1 1 1 1
-20 -1 5 -1 0 -5 0
~o‘8(o/oo) . . ”. - ” - . . .. .
Figure 10 - Oxygen-l8/deuterium plot, Pinto depression (h71e NV I1 19). . .
.

(the second one north of Ramp 2 in the North Barber area).
The area was reclaimed in 1979. The chloride profile shows
a possible flushing bulge at a depth of approximately 35 ft
(Figure 11). Total depth was 60 ft; a log is given in Appendix
B.
The 0-18/D profiles track each other very well and als-, show
a bulge at depth (Figure 12). The stable-isotope bulge is
curiously 1 0 ft deeper than the chloride bulge. It may be that
sampling for isotopes missed the small upper peak seen in the
chloride profile.
In the 0-18/D plot (Figure 1 3 ) points describe a line below
but nearly parallel to the meteoric line. The slope is
approximately 6 . Regression analysis gives a high correlation
coefficient (r = 0 . 9 3 ) . Recharge based on deuterium displazement
is 0.05 in/yr. Chloride gave a recharge rate of 0.16 in/yr.
The tritium profile is erratic. Vapor-phase movement may be
responsible.
RECOVERY OF RECLAIMED AREAS
The chloride and stable-isotope profiles suggest that all
three sites restudied in Phase I11 are in equilibrium. The times
of reclamation indicate that moisture and solute profiles are re-
established between 6 and 1 0 yrs after revegetation. This is
based on the equilibrium behavior of stable isotopes for all
sites reclaimed 1 0 yrs previously (Holes 1 and 2 ) and 1 of 2
sites reclaimed 6 years previously (Hole 3 ) . Another hole (28 of
the Phase-I1 study), also reclaimed 6 yrs previously, was
characterized by erratic stable-isotope/depth profiles (Figlre
1 9

Moisiure ( r n 3 / r n 3 )
0 0.2 0.4 0.6 0 I . I
20 - s_ 5 40- a
- u
60-
80 -
0 500 1000 1500 2000 ’ Chloride (rng/L)
. -.
Figure 11 - Chloride profile, North Barber depression (tole NV 11 2 4 ) .
i

...
a I
a a
S t
c
. n
a a Ol
a
-.
I

~ . .
.
.
. h
8 z
20,
40
. .
60
80
. . ..
100
120
T
.
Y
140 -
NV I t 24 ' /
Figure 13 -'Oxygen-l8/deuterium plot, North Barber depression (hole NV I1 24).
!

14). Slope of the evaporation line for these data is 3 . 3 and the
correlation coefficient is only 0.54 (Figure 15).
The flushing bulge seen in Hole 3 and others is appareltly
more a matter of active recharge than nonequilibrium. Periodic
flooding of such depressions by runon enhances recharge (Allison
and others, 1985; Stone, 1984a, b). On the several occasio7s the
North Barber depression was visited, the clayey bottom was soft.
Great care had to be taken to not get the field vehicle and
drilling rig stuck during sampling.
Local recharge values obtained for just the reclaimed
depressions evaluated in Phase I11 are summarized in Table 1.
Values (based on chloride) range from 0.03-0.16 in/yr. The
median is 0.095 in/yr; the mean is 0 . 0 8 in/yr. For other
reclaimed area rates see Table 2.
Table 1. Summary of loca l recharge va lues for rec la imed depress ions s tud ied i n Phase 111.
Year Hole No. Depress ion Rec la imed Pro f i le Type Rcl ( i n / y r ) 2 RDd ( i n / y r ) 3
Chlor ide
1 (11 16)' Custer 1975 v a r i a b l e 0.03 0.04
2 (11 19) P in to 1975/76 equ i l ib r ium 0.04 0.06
3 ( I 1 24) North Barber 1979 f l u s h i n g 0.16 0.05
II 28 Yazzie 1979 v a r i a b l e / f l u s h i n g ( ? ) 0.36 #A4
numbers preceded by "II" are Phase- I1 ho le numbers Rcl = recharge based on chloride mass-balance method RDd = recharge based on deuterium displacement; may n o t b e a p p l i c a b l e t o t h e s e p r o f i l e s NA = no t app l i cab le ; s tab le i so topes do n o t t r a c k one another
23

2 h
0
0
-0
0
s'q
+o
t
9
0
0
0
N
8 F I
v). I
m
rg
- I
5 0
. i 1 i
4
tu N
N
M cd L
v1
rl tu
I I
I 1
I'
I I
l(
l1
0
!-I a
.. I .. I
Y
i

u 4
J '.
' '.i
-1'00 1 I I I I I I I 1 I 1 I 1 - 0 -10 -5
". 60 1 8 (O/OO)
Figure 15 - Oxygen-l8/deuterium plot, Yazzie depression (hole NV I1 2 8 ) .
i

Table 2 . Local recharge rates for Navajo Mine landscape settings. See Stone (1984 and 1986) for specific values.
No. of Range 2 Median Mean Ranking 3 4 5
Setting sites (inlyr) (inlyr) (inlyr) by recharge
UNDISTURBED (7) (0 .002 -0 .09 ) (0 .046 ) (0 .03 )
badlands 31 0.002-0.01 0.006 0.006 5
upland flat 3 0.02 -0.05 0.035 0.03 4
valley terrace 1 0.09 0.09 0.09 2
RECLAIMED ( 2 2 ) (0.01 -0 .49 ) ( 0 . 2 5 ) ( 0 . 0 9 )
depression 9 0 . 0 3 - 0.49 0.26 0.16 1
flat 13 0.01- 0.23 0.12 0.04 3
1 .
recharge values based on mean (not median) Clsu
includes valley bottom site of Phase-I study as in badlands
median = (range12) + low value mean = totallnumber of values I = highest; 5 = louest
IMPACT OF MINING ON RECHARGE
The ultimate objective of the Bureau’s recharge studies at
the Navajo Mine was to determine the net change in recharge
capacity due to mining, especially the impact of depression2 in
reclaimed areas. This change may be assessed by comparing
premining and postmining recharge values. For example, local
recharge rates may give an indication of change. Better ye?, the
total volume of water recharged before and after mining
(reclamation) can be compared.
LOCAL RECHARGE
The first step in calculating volumetric recharge is t-,
26

determine local recharge rates. Values were obtained in Phxses I
and I1 of this study (Stone, 1984b and 1986a) and the isoto?e
work in Phase I11 shows that such values are usable. Local
recharge rates for settings recognized at Navajo Mine are
summarized in Table 2.
Local recharge ranges from 0.002 in/yr (Bitsui badland:
valley) to 0.49 in/yr (Doby depression). The frequency of
occurrence of local recharge values is shown in Figure 16. The
vast majority of values fall below 0.10 in/yr. The most comonly
obtained value is 0.02 in/yr (five sites). Three values shxe
the next most common slot: 0.01, 0.03, and 0.05 in/yr (four sites
each). Values of 0.04 and 0.10 in/yr occurred at three sites
each. The values of <0.01, 0.07, 0.08, 0.09, 0.34, and 0.49
in/yr were obtained at one site each. Some values were not
obtained at any site: 0.06, 0.12-0.34, and 0.35-0.49 in/yr.
Local recharge in undisturbed areas averages 0.03 in/yr,
whereas, that in reclaimed areas averages three times that or
0.09 in/yr. Based on decreasing order of local recharge rate,
settings would be ranked as reclaimed depression, valley terrace,
reclaimed flat, undisturbed upland flat, and badlands (Table 2).
AREAL EXTENT OF SETTINGS
The next step in calculating volumetric recharge is thz
determination of the areal extent of various landscape settings
in the study region. This may be accomplished through the use of
field studies, aerial photographs, topographic maps, soils maps,
geologic maps, or some combination of these tools. Differe?t
methods should give similar results. Stone (1985a) found t’lat
27

Y 0
Figure
. .. 0
16 - Frequency of
R&&& (in/yr)
occurrence of loca l recharge values.

Table 3. Summary of pre- and postmining recharge rates and fluxes at Naval0 ~ i n e (Stone, 1987).
Recharge Median
setting (sites) (inlyr) (inlyr) range recharge
~-~"~~""""""_____________________~~~~~". U N D I S T U R B E D (7) (0.002-0.09) (0.046)
badlands (3) 0.002-0.01 upland flat (3) 0.02 -0.05
0.006 0.035
valley terrace (1) HA HA
UNDISTURBED AREA REDUCED TO MATCH RECLAIMED AREA
RECLAIMED (22) depression (9) flat (13)
RECLAIMED AREA
UNDISTURBED AREA EXPANDED TO MATCH
depression flat
U I T H O U T D E P R E S S I O N S I N RECLAIMED AREA
Mean recharge' Area (inlyr) (ac)
(0.03) (8,821) 0.006 4,240 0.03 4,090 0.09 491
Volumetric recharge (sc-ftlyr)
(16.05) 2.12 10.23 3.7
Mean regional recharge = 0.02 in/yr 2
NA NA 0.02 2,881 4.9
(0.01 -0.49) (0.25) 0.03 -0.49 0.26
(0.09) (2,881) (10.05)
0.01 -0.23 0.12 0 . 0 4 2,813 68 0.68
9.37 0.16
Mean regional recharge = 0.04 inlyr 2
(30.88)
NA NA
NA 0.16 NA 0.04
176 8.645
2.35 28.53
Mean regional recharge = 0.04 inlyr 2
HA NA 0.04 8,821 29.40 ___________"""-______________________""""""~~~~""""""""~~~~~"""""~. 1 .
weighted by acreage (volumetric recharge divided by area) slrnple arithmetic average
areal extents, and thus volumetric recharge results, based on a
geologic map were very comparable to those obtained from a soils
map of the same area.
In this study, it was necessary to determine areal extent of
premining and post-mining settings by different methods.
Premining acreages were based on soils maps made between 1953 and
1977 (Keetch and others, 1980; see Appendix C). Boundaries
between settings were determined and digitized (Figures 2 and
3 ) . Areas were determined by a digital planimeter (Table 3 ) .
Areal extent of post-mining settings was based on the latest
aerial photographs (1:6,000) and field checking. This covered
29

only areas in which mining had occurred: 1 and 2. Depression
floors were delineated on photos by means of a lox mirror
stereoscope. Depressions larger than 0.15 acres (6500 ft2) were
located in this way. Smaller ones escaped detection. Outlines
of depression floors were transferred to 1 inch-to-500 ft mine
maps and areal extents determined by means of a digital
planimeter (Figure 4). The size and location of each depression
was then verified in the field. Areal extents of postminin7
settings are given in Table 3.
AREAL AND REGIONAL RECHARGE
For a given setting, areal recharge is the product of its
local recharge rate and its areal extent, in similar units.
Local recharge is converted to ft/yr (divided by 12) and acreage
is converted to ft2 (multiplied by 43,560) . Multiplying thzse
gives a value of ft3/yr; division by 43,560 gives acre-ft/yr.
This calculation is made for both premining and post-mining
settings.
As shown in Table 3, premining areal recharge in areas 1 and
2 ranges from 2 ac-ft/yr to 10 ac-ft/yr. Upland flats accomt
for the greatest premining recharge volume ( 6 4 % ) and badlan-ls
contribute the least (13%). The valley/terrace setting is
intermediate with 23% of the recharge.
Recharge volumes for reclaimed settings are also given in
Table 3. However, the acreage is less than that of the
undisturbed area. More specifically, 67% of the area is still
taken up by open pits, ramps, roads, etc., features that wo~ld
not be present at end of mining. Recharge volumes cannot b'z
30

compared and impact of mining cannot be assessed unless pre- and
postmining areas are identical.
Areas may be made equal in two ways: reducing undisturbed
acreage to that of the reclaimed ground analyzed o r increasing
reclaimed acreage to that of the undisturbed ground. In ths
first case, recharge volume is calculated using the mean regional
recharge rate and an area of 2,881 ac (Table 3). This gives a
premining recharge volume of 4.9 ac-ft/yr as compared to a post-
mining recharge volume of 10.05 ac/ft/yr. The difference is an
increase of 5 ac-ft or 105%. In the second case, recharge volume
is calculated using the respective recharge rates and acreaJes
for the settings, based on the observation that depressions
account for only 2% of the reclaimed ground. This gives a post-
mining value of 30.88 ac-ft/yr (2.35 ac-ft/yr for depressioys and
28.53 ac-ft/yr f o r other reclaimed settings). This represe’lts an
increase in recharge with mining and reclamation of 15 ac-ft o r
108%. As recharge is higher in depressions and they are no
longer being constructed, a more realistic impact of mining can
be determined by calculating recharge volumes without
depressions. This gives 29 ac-ft/yr, o r an increase of only 83%
(Table 3).
DISCUSSION AND CONCLUSIONS
In all cases, mining and reclamation appear to increas?
recharge. Those scenarios involving depressions suggest re7harge
is approximately doubled. With no depressions the indicate83
increase in recharge is 9-22% less. The increase in recharl~e
with mining and reclamation is attributed to better infiltration
31

capacity of the spoil as well as the blow sand used for top soil,
improved vegetative cover, enhanced availability of water for
recharge in depressions due to ponding of runoff, and addition of
supplementary water during irrigation. Although the latter is
short-lived, the other conditions prevail.
An increase in recharge at Navajo Mine should not be
detrimental to the water resources of the region. As one
parameter of the hydrologic budget changes, others also change to
maintain the balance. In the case of an increase in recharge,
the expected response would be a decrease in runoff. This is not
unfavorable at Navajo Mine as the mine plan calls for zero
runoff. A further consequence would be enhanced ground-water
flow toward discharge areas. The amount of increase would be
minimal, equaling the rate of increased recharge.
Results presented here are believed to be realistic an3
representative. Additionally, this is the first time, to my
knowledge, that impact of mining on recharge has been addressed
or documented to this extent. This study should serve as a model
for such studies at other surface coal mines.
ACKNOWLEDGMENTS
Funding for sampling, isotope analyses, and recharge
calculations was provided by a contract with BHP-Utah
International Inc. Mapping and determination of areal exte-ks of
landscape settings was done by Dr. Bruce A. Buchanan (Department
of Crop and Soil Science, New Mexico State University) and Thomas
B. Korsmo (graduate research assistant, New Mexico State
University). Sterling Grogan (manager of environmental quality),
32

and Orlando Estrada (senior environmental specialist), BHP-
Utah/Navajo Mine, provided valuable assistance during the work.
Darla Curtis (undergraduate student, New Mexico Tech) assisted in
the laboratory.
REFERENCES CITED
Allison, C. B., Barnes, C. J., Hughes, M. W., and Leaney, F. W.
J., 1983, Effect of climate and vegetation on oxygen-18 and
deuterium profiles in soils: International Atomic Energy
Agency, Report SM-270120, p. 105-121.
Allison, G. B., and Hughes, M. W., 1978, The use of environTenta1
chloride and tritium to estimate total recharge to an
unconfined aquifer: Australian Journal of Soil Researcl, v.
16, p. 181-195.
Allison, G. B., Stone, W. J., and Hughes, M. W., 1985, Rechwge
through karst and dune elements of a semiarid landscap? as
indicated by natural isotopes and chloride: Journal of
Hydrology, v. 76, p . 1-25.
Buchanan, B. A., and Korsmo, T. B., 1987, Distribution and extent
of pre-mine and post-mine landscapes on the Navajo Min?-, New
Mexico: unpublished report to BHP-Utah International Inc.,
12 p.
Craig, H., 196
V. 133, p
1, Isotopic variations in meteoric water: Science,
. 1702.
33

Keetch, C. W., Ruiz, J. E., Parham, T. L., Bulloch, H. E.,
Anderson, T. J., King, D., Seagraves, C., Boyer, J., Kossie,
A., Roybal, M. W., and Childs, S., 1980, Soil survey of San
Juan County, New Mexico--eastern part: Soil Conservation
Service, 173 pp.
McCord, 3. T., and Stephens, D. B., 1987, Lateral moisture flow
beneath a sandy hillslope without an apparent impeding
layer: Hydrological Processes, v. 1, p.225-238.
Snell, F. D., and Biffen, F. M., 1964, Commercial methods of
analysis: Chemical Publishing Company, Incorporated, New
York, p. 41-43.
Stone, W. J., 1984a, Preliminary estimates of Ogallala-aquifer
recharge using chloride in the unsaturated zone, Curry
County, New Mexico: Proceedings, Ogallala Aquifer Sympxium
11, Lubbock, p. 376-391.
Stone, W. J., 198433, Preliminary estimates of recharge at the
Navajo Mine based on chloride in the unsaturated zone: New
Mexico Bureau of Mines and Mineral Resources, Open-file
Report 213, 60 p.
Stone, W. J., 1985a, Determining recharge in coal surface mining
areas: Proceedings, 2nd National Meeting of the American
Society for Surface Mining and Reclamation, Denver, p. 394-
403.
34

Stone, W. J., 1985b, A simple approach to determining recharge in
surface coal mining areas; a study guide for a mini-course
taught at the 1985 National Symposium on Surface Mining,
Hydrology, Sedimentology, and Reclamation, Lexington,
Kentucky, 63 p.
Stone, W. J., 1986a, Phase-I1 recharge study at the Navajo Mine
based on chloride, stable isotopes, and tritium in the
unsaturated zone: New Mexico Bureau of Mines and Mineral
Resources, Open-file Report 216, 244 p.
Stone, W. J., 1986b, Comparison of ground-water recharge rates
based on chloride, stable-isotope, and tritium content of
vadose water at the Navajo Mine (abs.): New Mexico Geology,
v. 8 , no. 3, p. 70.
Stone, W. J., 1986c, Natural recharge in Southwestern 1ands:apes
--examples from New Mexico: Proceedings, National Wate- Well
Association Focus Conference on Southwestern Ground-Water
Issues, Tempe, p . 595-602.
Stone, W. J., Lyford, F. P., Frenzel, P. F., Mizell, N. H., and
Padgett, E. T., 1983, Hydrogeology and water resources of
San Juan Basin, New Mexico: New Mexico Bureau of Mines and
Mineral Resources, Hydrologic Report 6, 70 p.
Utah International Inc., 1981, Permit application for Navajo
Mine, v. 1, chpt. 15.
35

APPENDIX A
ISOTOPE DATA
36

Hole 1 Custer Depression
Sample Depth (ft) Vol. (ml) 018 (o/oo) D(O/OO) T (TU)
1
2
3
4
5
6
7
8
9
1 0
11
1 2
1 3
1 4
15
1 6
1 7
1 8
1 9
2 0
0.5
1
1.5
2
2.5
3
5
6
7
8
1 0
15
2 0
2 5
3 0
35
40
45
5 1
5 6
35
35
2 5
23
45
2
45
43
3 6
25
34
35
5 0
45
43
3 0
32
32
1
38
- 3.03
- 6.48
NES * -14.63
-12.46
NES
NES
-17.3 8
-13 .78
-17.44
-14.73
- 9.70
-11.67
- 9.94
- 9.70
-12.83
NES
- 8.24
NES
- 9.80
- 51.6
- 74.7
NES
-108.5
- 97.6
NES
NES
-123.7
-112.5
-132.8
-125.5
-111.1
-112.9
-104.4
-100.6
-108.8
NES
- 87.9
NES
- 7 0 . 0
51+/-8
50+/-7
NES
22+/-8
<6+/-8
NES
NES
<6+/-8
<6+/-7
<6+/-7
34+/-8
9+/-8
<6+/-7
19+/-7
9+/-8
18+/-8
<6+/-7
2 1+/-7
NES
<6+/-7
* NES = lab reported not enough sample
37

Hole 2 P i n t o Depression
Sample Depth (ft) V o l . ( m l ) 018 (o/oo) D(o/oo) T ( T u )
2 1
22
23
24
2 5
26
27
28
29
30
1
2
3
5
6
7
1 0
15
20
2 5
43
35
32
42
4 8
38
27
22
35
33
- 1.29
- 5.60
- 8.22
-10.87
-12.58
-13.54
-14.17
-13.80
-14.21
-14.77
- 66.2
- 81.8
- 87.5
-100.1
-103.8
-107.5
-101.5
-106.7
-123.1
-123.5
38+/-8
7+/-7
13+/-8
l l + / - 7
12+/-8
21+/-7
<6+/-7
<6+/-7
<6+/-7
<6+/-8
38

Hole 3 North Barber Depression
Sample Depth (ft) Vol. (ml) 0 1 8 (o/oo) D(o/oo) T (TU)
3 1
32
33
3 4
35
3 6
3 7
3 8
39
4 0
4 1
42
43
44
45
4 6
47
48
49
5 0
5 1
0.5
1
1.5
2
2.5
3
5
6
7
1 0
15
20
25
3 0
35
40
45
5 0
5 5
60
65
37
2 6
46
46
37
35
45
38
42
35
42
28
26
2 1
27
29
49
35
70
70
27
- 3.23
- 3.90
- 6.64
- 8.72
-12.80
- 9.39
-12.94
-12.54
-12.89
NES
-11.70
NES
NES
NES
-13.17
-13.51
- 9.06
- 7.38
NES
- 6.95
NES
- 37.7
- 51.6
- 62 .1
- 6 7 . 1
- 80.2
- 83.3
-116.1
- 97.6
-101.0
NES
-104.2
NES
NES
NES
-111.8
-109.5
- 80.9
- 60.0
NES
- 72 .0
NES
41+/-7
20+/-8
<6+/-7
36+/-8
<ti+/-?
61+/-7
<6+/-7
70+/-8
6+/-7
8+/-7
<6+/-7
7+/-7
49+/-9
42+/-8
<6+/-7
<6+/-7
<6+/-8
19+/-8
35+/-9
7+/-8
54+/-8
3 9

APPENDIX B
BRIEF FIELD DESCRIPTION OF SAMPLES
4 0

Hole 1 Custer Depression
Drilled 10 ft due east of hole 16 of Phase-I1 study.
Sample No. Depth (ft) General Lithology
1-6
7-10
11
12-14
15
16
17
18
19
20
0.5-3
3-8
8-10
10-75
25-30
30-35
35-40
40-45
45-50
50-51
51-55
55-56
Spoil - light gray sandstone and some green claystone
Spoil - sandstone as above with carbonaceous shale, coaly spoil at base.
Spoil - gray carbonaceous shale/coaly spoil.
Spoil - upper 6" carbonacems shale, rest sandstone as above.
Spoil - as above except lover 1 ft carbonaceous shale.
spoil - mostly green carbo7aceous shale.
Spoil - coaly spoil in upp?r half; lower half gray claystone.
spoil - green claystone as above; some sandstone at base
Hard zone - no sample. Spoil - hard, white sandstone Hard zone - no sample. Spoil - mostly carbonaceou? sandstone.
41

Hole 2 Pinto Depression
Drilled 20 ft northeast of hole 19 of Phase-I1 study.
Sample No. Depth (ft) General Lithology
21, 22, 23 0-4 Spoil - yellow sand and green claystone
24, 25, 26, 27 4-14 Spoil - green claystone as above 28
29
15-19 Spoil - top half yellow sand; lower half claystone as above.
19-21 Spoil - upper 6" spoil; rest Fruitland Fm(?)-moist, very carbonaceous dark gra shale
21-24 Hard zone - no sample. 30 24-25 Fruitland Fm(?) as above.
42

Hole 3 North Barber Depression
Drilled 25 f t southwest of hole 24 of Phase-I1 study.
Sample No. Depth ( f t ) General Lithology
3 1-3 6
37-39
40, 41
42-43
44
45
46, 47
48
49
50
0-3
3-8
8-13
13-23
23-28
28-33
33-48
48-53
53-58
58-63
cable problem: dropped rod
~~~~~
Spoil - clayey, carbonaceox mudstone
Spoi l - a s above, but dark green
Spoi l - a s above, moist: gray sandstone a t base
hard carbonaceous mudstone Spoi l - a s above, but w i th b i t s of
carbonaceous s i l t s t o n e s p o i l a s above wi th fissile
Spoi l - dark gray carbonac?-ous claystone
Spoi l - carbonaceous shale and claystone
blocks Spoi l - loose, very coaly; some hard
base Spoi l - loose, clayey: v e ~ 7 w e t near
mudstone Spoi l - carbonaceous claystone/
no f u r t h e r sampling
43

APPENDIX C
SUMMARY OF PREMINING LANDSCAPES (modified from Buchanan and Korsmo, 1987)
4 4

S e t t i n g D e s c r i p t i o n A s s o c i a t e d S o i l S e r i e s
B a d l a n d s
U p l a n d F l a t s
b a r r e n u p l a n d s d i s s e c t e d b y e p h e m e r a l F a r b s t r e a m s , b r e a k s , h i l l s , a n d m e s a s P e r s a y o u h e r e b e d r o c k ( F r u i t l a n d F m ) i s e x p o s e d M o n i e r c o o r c o v e r e d by v e r y t h i n s o i l s
p l a t e a u s , m e s a s , h i g h t e r r a c e s , a n d a l l u v i a l f a n s u n d e r l a i n b y F r u i t l a n d F m a n d c a p p e d by a l l u v i a l a n d / o r e o l i a n d e p o s i t s ; s o i l s m a y b e t h i c k ; m o s t c o m p l e x D o a k s e t t i n g w i t h g r e a t e s t v a r i e t y o f s o i l F a r b
A v a l o n B l a c k s t o n E l a n - o t
t y p e s H u e r f a n o M a y q ' l e e n M o n i e r c o Mu f f N o t a l
S h e p q a r d P e r s a y o
S t u m b l e S h i p - o c k
U f f e q s
V a l l e y / T e r r a c e e p h e m e r a l s t r e a m - c h a n n e l f l o o r s a n d a s s o c i a t e d f l o o d p l a i n s a n d t e r r a c e s ; c o n s i s t o f a l l u v i u m ; s o i l s a r e y o u n g b u t t y p i c a l l y t h i c k
B e e b - F r u i t l a n d G l e n t o n S t u m b l e T u r l e y Y o u n 3 s t o n
45