at the european association for the study of diabetes...
TRANSCRIPT

at the European Association
for the Study of Diabetes
50th Annual Meeting September 15-19, 2014

Novo Nordisk Canada Inc. Disclaimer
This information is being provided to you as a professional service and is meant to supplement information gathered from other sources. All findings and opinions expressed in this material are solely those of the healthcare professionals who attended the EASD conference and presented to their peers. This information includes data regarding products that are not approved for use in Canada. Novo Nordisk Canada Inc. does not support product discussion that is not consistent with the approved product monographs for Novo Nordisk products.

Speaker Conflict of Interest Disclosure
• Consultant or speaker for: – NovoNordisk, Eli Lilly, Merck, Astra Zeneca, Sanofi, BD, Servier, Janssen.
• Received grant/research support from: – NovoNordisk, Eli Lilly, Merck, Sanofi, Eisai, Astra Zeneca, Servier.
• Received honoraria from: – NovoNordisk, Eli Lilly, Merck, Astra Zeneca, Sanofi, BD, Servier, Janssen.
• Received financial support from Novo Nordisk Canada Inc to attend the 50th annual meeting of the European Association for the Study of Diabetes in Vienna, Austria, September 15-19, 2014

Table of Contents
Relating to CLINICAL SCIENCE & CARE, presented at EASD 2014:
• PS 093-1094 OHA vs. insulin in GDM 5
• OP 08-045 DM as a predictor of mortality in heart failure 12
• PS 075-941 Phone intervention for insulin therapy in T2DM 19
• OP 07-038 GLP-1 once weekly in T2DM (AWARD-2) 26
• OP 07-040 Head-to-head GLP-1 trial (AWARD-6) 33
• PS 076-956 SGLT2 therapy in T1DM 40
• OP 01-001 SGLT2 / DPP-4 therapy in T2DM 47
• Symposia Early combination therapy in Type 2 diabetes 53
A Majority of Women with GDM Could Benefit from Oral Hypoglycemic Agents:
Successful glycemic control in > 60% of women taking mild doses of metformin-glyburide, with neonatal outcomes
comparable to women on insulin therapy
PS 093-1094 – Gestational Diabetes Mellitus: The First Prospective Randomised-controlled Study of Metformin-Glyburide vs. Insulin
By Ardilouze J-L, Ménard J, Hivert M-F, et al
Objective(s): To assess maternal glycemic control and neonatal issues in a group of GDM women treated with metformin-glyburide
combination vs. insulin
GDM = gestational diabetes mellitus

Results at Study Entry
At study entry* Met–Gly (n = 35)
Insulin (n = 33)
Weeks of gestation 29.3 ± 3.8 30.1 ± 3.1
Age (years) 31.1 ± 4.7 30.7 ± 4.4
Weight (kg) 85.3 ± 17.5 85.3 ± 22.9
BMI (kg/m2) 32.0 ± 5.4 32.2 ± 7.2
A1C (%) 5.5 ± 0.4 5.3 ± 0.3
Gravida/Para/Aborta 3 / 1 / 1 3 / 1 / 1
Glycemic control 2 weeks prior to study entry (mmol/L)
Fasting 2-hr pc breakfast 2-hr pc lunch 2-hr pc supper
5.3 ± 0.7 6.3 ± 0.8 6.6 ± 0.8 6.8 ± 0.8
5.3 ± 0.6 6.3 ± 0.7 6.4 ± 0.6 6.8 ± 0.9
*All p = NS Met-Gly = metformin-glyburide; BMI = body mass index; NS = not significant
Ardilouze J-L, et al. PS 093-1094, presented at the 2014 EASD Reviewed by Dr. Joanne Liutkus

Results at Delivery
At delivery* Met–Gly (n = 35)
Insulin (n = 33)
Glycemic control 2 weeks prior to study entry (mmol/L)
Fasting 2-hr pc breakfast 2-hr pc lunch 2-hr pc supper
4.7 ± 0.3 5.8 ± 0.4 5.8 ± 0.5 6.0 ± 0.5
4.8 ± 0.3 5.9 ± 0.5 5.9 ± 0.5 6.1 ± 0.5
Hypoglycemias (< 3.3) (n and %) 11 (32.4) 2 (6.3)
Weight gain (kg) 12.4 ± 6.4 12.9 ± 4.5
Insulin doses (units)
Breakfast Lunch Supper Bedtime
7.0 ± 4.2 8.5 ± 4.9 11.0 ± 4.2 11.0 ± 7.1
11.3 ± 9.0 9.6 ± 8.1 10.3 ± 6.8 18.7 ± 15.1
*All p = NS except for hypoglycemias p < 0.01
Ardilouze J-L, et al. PS 093-1094, presented at the 2014 EASD Reviewed by Dr. Joanne Liutkus

Ardilouze J-L, et al. PS 093-1094, presented at the 2014 EASD Reviewed by Dr. Joanne Liutkus
Medications of Women in the Met–Gly Group at Delivery
N (%) of women Met (mg/day)
Gly (mg/day)
Insulin (units)
8 (22.9) 844 ± 268
14 (40.0) 1,179 ± 153 3.9 ± 1.9
10 (28.6) 1,333 ± 250 8.6 ± 2.2 12.7 ± 9.9
3 (8.6) 9.4 ± 4.4
• In the 13 women taking insulin (37.2%), injections were started 4.2 ± 2.1 weeks after initiation of Met–Gly treatment

Ardilouze J-L, et al. PS 093-1094, presented at the 2014 EASD Reviewed by Dr. Joanne Liutkus
Neonatal Issues
Neonatal issues* Met (n = 35)
Insulin (n = 33)
Caesarean sections (n) 9 8
Neonates’ weight (g) 3,360 ± 389 3,227 ± 570
Gestational age (weeks) 38.7 ± 1.1 38.4 ± 1.5
Hypoglycemias (n and %) 21 (60) 15 (45)
*All p = NS

Discussion & Implications
• Take-home messages: – evidence for alternatives to insulin for women with GDM – cost implications: OADs, insulin, OADs + insulin – increased risk of hypoglycemia with Met-Gly
combination: clinical significance?
• Consider: – timing of delivery for obstetricians – home births – midwife-assisted deliveries – long-term effects of Met-Gly
Ardilouze J-L, et al. PS 093-1094, presented at the 2014 EASD Reviewed by Dr. Joanne Liutkus
OADs = oral antidiabetic drugs

OP 08-045 – Impact of Diabetes Mellitus on Long-term Prognosis in Patients with Preserved Heart Failure: A Report from the Swedish
Heart Failure Registry (S-HFR)
By Johansson I, Edner M, Rydén L, et al
Objective(s): To investigate the impact of diabetes on long-term prognosis in patients with heart failure and preserved left ventricular
function from an everyday life perspective
Assessing the Impact of Diabetes on Heart Failure with Preserved Ejection
Fraction (HFpEF)

Heart Failure Preserved Ejection Fraction (HFpEF): Background
• In the general population, prevalence of heart failure is 2% (10% after 70 years old), diabetes is 8%1
• prevalence of 30% of patients with HF have type 2 diabetes
Johansson I, et al. OP 08-045, presented at the 2014 EASD Reviewed by Dr. Éric Poulin
1McMurray JJ et al. Eur Heart J 2012; 33(14):1787-847
Clinical characteristics: • High age • Female gender • Hypertension • Obesity • Diabetes
Diagnostic criteria: 1. Symptoms 2. Signs 3. Normal/mildly reduced left
ventricular EF (≥ 40 or ≥ 50%) 4. Relevant structural heart
disease* and/or diastolic dysfunction
*Left ventricular hypertrophy / left atrium enlargement
Heart Failure in Diabetes
• Causes of heart failure in diabetes: – co-morbidities – diabetes cardiomyopathy
• more myocardial fibrosis and hypertrophy • different myocardial metabolism
Johansson I, et al. OP 08-045, presented at the 2014 EASD Reviewed by Dr. Éric Poulin

Diabetes Cardiomyopathy
• Deranged metabolism: – FFA use (oxydation) 90% vs.
60% in patients without diabetes mellitus
– glucose use (oxydation) 10% vs. 40% in patients without diabetes mellitus
• Many diabetes mellitus patients do not have artery stenosis more than 50%, but:
– microangiopathy disease – platelet hypereactivity – endothelial dysfunction
Johansson I, et al. OP 08-045, presented at the 2014 EASD Reviewed by Dr. Éric Poulin
FFA 60% Diabetes 90%
Glucose 40% Diabetes 10%
FFA oxidation
Glucose oxidation
β-oxidation
Pyruvate
Citrate
ATP
Acetyl-CoA
Acetyl-CoA
Krebs cycle
*PDH = pyruvate dehydrogenase; FFA = free fatty acid; ATP = adenosine triphosphate
PDH* complex
Intermediates
Glycolysis

Prognosis in Diabetes Mellitus and HFpEF
• Worse prognosis in T2DM, regardless of EF – CHARM trial1: even with preserved EF,
mortality at 3.5 years is 20% vs. 40% with reduced EF
• n = 7,599; diabetes mellitus in 28% • diabetes mellitus: mortality predictor in HFpEF
(HR 2.00)
• In S-HFR, better survival in patients without diabetes mellitus: – adjusted OR 1.39 (1.20–1.61)
Johansson I, et al. OP 08-045, presented at the 2014 EASD Reviewed by Dr. Éric Poulin
T2DM = type 2 diabetes mellitus; HR = hazard ratio; OR = odds ratio 1MacDonald et al. Eur Heart J 2008; 1377-85
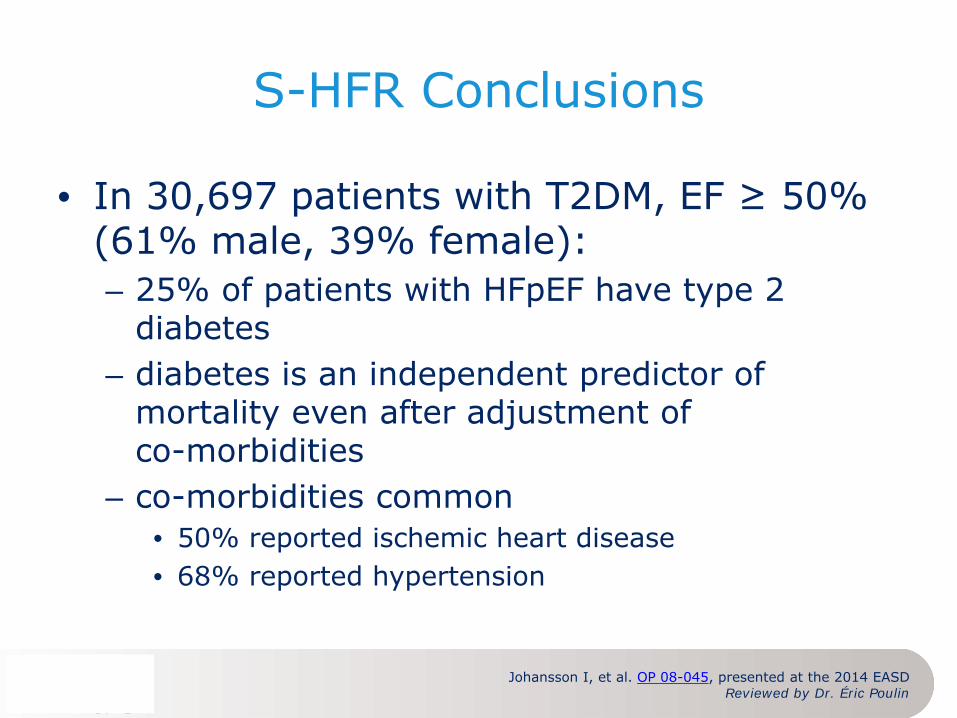
S-HFR Conclusions
• In 30,697 patients with T2DM, EF ≥ 50% (61% male, 39% female): – 25% of patients with HFpEF have type 2
diabetes – diabetes is an independent predictor of
mortality even after adjustment of co-morbidities
– co-morbidities common • 50% reported ischemic heart disease • 68% reported hypertension
Johansson I, et al. OP 08-045, presented at the 2014 EASD Reviewed by Dr. Éric Poulin

Telephone Intervention May Enhance Adherence to Insulin Therapy by Offering the Opportunity to Customize Information to Individuals Under Real-world Conditions
PS 075-941 – Adherence to Insulin Treatment in Insulin Naïve Type 2 Diabetic Patients: Results of Telephonic Intervention
By Gogas Yavuz D, Bilen H, Sancak S, et al
Objective(s): To assess the efficacy of phone-based support on insulin treatment adherence in insulin-naïve type 2 diabetic patients using different insulin treatment regimens (basal, basal-bolus and
premix) in third-care medical centres in Turkey

Methods
• 12-week, open-label, randomized multicentre study – n = 1,456 insulin-naïve patients
• Randomized to standard of care of telephonic intervention (TI)
• Primary outcome: insulin treatment adherence • TI group received 1 call every month with a detailed
series of standardized questions • Standard-of-care group received 1 call at the end of
12 weeks
Gogas Yavuz D, et al. PS 075-941, presented at the 2014 EASD Reviewed by Lori Berard, RN

Basal Demographic and Glycemic Parameters in Patients Adherent and Non-adherent to Insulin Treatment
Adherent Group (n = 224)
Non-adherent Group
(n = 1,232) P
Age (yrs) 57 ± 13 56 ± 11 0.7
Duration of diabetes (yrs)
4.9 ± 6.9 6.6 ± 6.2 0.0001
Insulin dosage (IU/d) 31.5 ± 18 31.5 ± 19 0.9
FPG (mg/dL) 231 ± 83 231.7 ± 85 0.9
PPG (mg/dL) 298 ± 96 300 ± 111 0.8
A1C (%) 10 ± 2 10.5 ± 2 0.01
Gogas Yavuz D, et al. PS 075-941, presented at the 2014 EASD Reviewed by Lori Berard, RN
IU = international unit; FPG = fasting plasma glucose; PPG = postprandial glucose

Insulin Injection Drop-off Rates According to Insulin Treatment Regimen
Insulin Treatment Regimen
Total Basal Bolus Premix Basal
Drop off at least 1 injection in a week
yes n 81 71 52 204
% *27.0% 15.0% 15.8% 18.5%
no n 219 401 277 897
% 73.0% 85.0% 84.2% 81.5%
Total 300 472 329 1,101
*p < 0.001 vs. premix and basal group
Gogas Yavuz D, et al. PS 075-941, presented at the 2014 EASD Reviewed by Lori Berard, RN

Reported Causes of Dropout for Insulin Therapy
Patient
Physician
Side effects
Healthcare system
Other56.8
4.8
12
24.8
1.6
Gogas Yavuz D, et al. PS 075-941, presented at the 2014 EASD Reviewed by Lori Berard, RN

Discussion & Implications
• Take-home messages: – TI group compliance was 83.2% vs. 70.3% in standard group – in addition to a standardized education module, telephone
support provided by trained nurses improved adherence to all insulin regimens
– significant barriers to adherence include physician attitudes
• Consider: – phone sessions ~20 minutes, adherence self-reported
• need to understand the 80-question survey
– basal-bolus might be too difficult for some, even with support – demonstrates need for self-management support – may help form insulin support programs for DECs and industry,
as insulin starts move to community
Gogas Yavuz D, et al. PS 075-941, presented at the 2014 EASD
Reviewed by Lori Berard, RN
DEC = diabetes education centre

Addition of GLP-1 Analogue May be Better than Initiating Insulin in Some
Patients Failing Oral Agents
OP 07-038 – Efficacy and Safety of Once Weekly Dulaglutide vs Insulin Glargine in Combination with Metformin and Glimepiride in
Type 2 Diabetes Patients (AWARD-2)
By Giorgino F, Benroubi M, Sun J-H, et al
Objective(s): To compare efficacy and safety of 2 doses of dulaglutide with insulin glargine in type 2 diabetes inadequately
controlled with maximally tolerated doses of metformin and glimepiride
Dulaglutide is not approved for use in Canada

Giorgino F, et al. OP 07-038, presented at the 2014 EASD Reviewed by Dr. Hasnain Khandwala
Baseline Characteristics DU 1.5 mg
n = 273 DU 0.75 mg
n = 272 Glargine n = 262
Sex, F, % 47 50 49
Age, years 56 (10) 57 (9) 57 (9)
BMI, kg/m2 31 (5) 32 (5) 32 (6)
Duration of diabetes, years 9 (6) 9 (6) 9 (6)
A1C %
mmol/mol
8.2 (1)
66 (11)
8.1 (1)
65 (11)
8.1 (1)
65 (11)
Fasting serum glucose, mmol/L 9.2 (2.7) 9.0 (2.7) 9.1 (2.7)
Treatment at screening, %
1 OAM
≥ 2 OAMs
16.5
83.5
15.4
84.6
16.2
83.8
At randomization
Metformin dose, mg/day
Glimepiride dose, mg/day
2,379 (480)
6.3 (1.7)
2,412 (495)
6.3 (1.6)
2,419 (475)
6.2 (1.6)
Values shown are for mean (standard deviation [SD]) unless otherwise noted; intention to treat (ITT) Dulaglutide is not approved for use in Canada DU = dulaglutide; BMI = body mass index; OAM = oral antidiabetic medication

Giorgino F, et al. OP 07-038, presented at the 2014 EASD Reviewed by Dr. Hasnain Khandwala
A1C Targets at 52 and 78 Weeks
#p < 0.05 vs. glargine; ##p < 0.001 vs. glargine ITT logistic regression using last observation carried forward (LOCF) analysis Dulaglutide is not approved for use in Canada
Time (Weeks)
60
50
40
30
Patien
ts (
%)
20
10
0 52
53
37
31
##
49
34 31
##
78
27
23
14
##
52
# 28
22
17
##
78
DU 1.5 mg DU 0.75 mg Glargine
A1C < 7.0% (53 mmol/mol)
A1C ≤ 6.5% (47.5 mmol/mol)

Giorgino F, et al. OP 07-038, presented at the 2014 EASD Reviewed by Dr. Hasnain Khandwala
Body Weight Change Over Time
Data presented are least squares [LS] means ± standard error [SE] ##p < 0.001 vs. glargine Dulaglutide is not approved for use in Canada ITT, Mixed-effect Model Repeated Measure (MMRM) analysis
Time (weeks)
2.5
2.0
1.5
0.0
Body
wei
ght,
ch
ange
from
bas
elin
e (k
g)
–0.5
–1.0
–2.5 024
Baseline weight = 86.3 kg
Weight Difference 3.4 kg
DU 1.5 mg DU 0.75 mg Glargine
##
1.0
0.5
–1.5
–2.0
8 14 20 26 35 44 52 65
## ## ## ## ## ##
## ##
##
## ## ## ##
##
##
## ## ## ## ##
##
78
–1.3
–1.8
1.6

Giorgino F, et al. OP 07-038, presented at the 2014 EASD Reviewed by Dr. Hasnain Khandwala
Cumulative Adverse Events Through 78 Weeks
DU 1.5 mg n = 273
DU 0.75 mg n = 272
Glargine n = 262
Any adverse event, n (%) 201 (73.6) 188 (69.1) 192 (73.3)
GI adverse event, n (%)
Nausea
Diarrhea
Vomiting
42 (15.4)##
29 (10.6)
18 (6.6)#
21 (7.7)##
25 (9.2)
10 (3.7)
4 (1.5)
15 (5.7)
3 (1.1)
Severe hypoglycemia, n (%) 2 (0.7) 0 (0.0) 2 (0.8)
Injection-site reactions, n (%) 2 (0.7) 2 (0.7) 0 (0.0)
Adjudicated pancreatitis, n (%)
Pancreatic cancer, n
2 (0.7)
0
1 (0.4)
0
0 (0.0)
0
#p < 0.05 vs. glargine; ##p < 0.001 vs. glargine Dulaglutide is not approved for use in Canada GI = gastrointestinal

Discussion & Implications
• Take-home messages: – insulin is generally considered to be best option for patients failing
oral agents – in this study, addition of 0.75 mg dulaglutide QW is as effective as
insulin glargine; 1.5 mg is superior to insulin glargine • both doses cause less hypoglycemia
– insulin glargine is associated with weight gain, whereas both doses of dulaglutide caused weight loss
– dulaglutide treatment was well tolerated with no significant increase in overall adverse reactions
– addition of a GLP-1 analogue may be a better option than initiating insulin therapy in some patients failing oral agents
– QW formulation of dulaglutide may be more acceptable to patients and may improve compliance
– further studies are needed to show if effects on glycemic control, weight etc, compared to insulin are sustained
Giorgino F, et al. OP 07-038, presented at the 2014 EASD Reviewed by Dr. Hasnain Khandwala
Dulaglutide is not approved for use in Canada QW = once weekly; GLP-1 = glucagon-like peptide-1

Once-weekly Dulaglutide 1.5 mg Demonstrates Noninferior Glycemic Control Compared to Once-daily Liraglutide 1.8 mg, with a Similar Safety and Tolerability Profile
OP 07-040 – Efficacy and Safety of Once Weekly Dulaglutide Versus Once Daily Liraglutide in Type 2 Diabetes (AWARD-6)
By Tofé Povedano S, Dungan KM, Forst T, et al
Objectives: To compare the efficacy and safety of once-weekly dulaglutide (DU) 1.5 mg with once-daily liraglutide (LIRA) 1.8 mg in
metformin-treated (≥ 1,500 mg) patients with type 2 diabetes
Dulaglutide is not approved for use in Canada

Study Design • Key inclusion criteria:
– type 2 diabetes – A1C ≥ 7.0% (≥ 53 mmol/mol) and ≤ 10.0% (≤ 86 mmol/mol) – stable dose of metformin (≥ 1,500 mg/day) for ≥ 3 months
Tofé Povedano S, et al. OP 07-040, presented at the 2014 EASD Reviewed by Dr. Irene Hramiak
aPatients received metformin ≥ 1,500 mg/day throughout the study; bPatients randomized to liraglutide were initiated at a dose of 0.6 mg/day in Week 1 then up-titrated to 1.2 mg/day in Week 2 and 1.8 mg/day in Week 3 Patients who could not tolerate the full dose for the treatment duration were required to discontinue study drug Dulaglutide is not approved for use in Canada Dungan et al. Lancet 2014 (ahead of print)
Week –2 0 26 2 30
Randomization
Liraglutide titration periodb
Final endpoint
Liraglutide 1.8 mg once daily
Treatment period Screening/lead-in Follow-up
Background therapya
Safety follow-up
Dulaglutide 1.5 mg once weekly

A1C Change from Baseline at 26 Weeks
Data presented are LS mean ± SE; †p < 0.001, noninferiority vs. liraglutide; aTreatment difference (nominal 95% CI), ITT, MMRM analysis Dulaglutide is not approved for use in Canada LS = least squares; SE = standard error; CI = confidence interval; ITT = intention to treat; MMRM = Mixed-effect Model Repeated Measure Dungan et al. Lancet 2014 (ahead of print)
Tofé Povedano S, et al. OP 07-040, presented at the 2014 EASD Reviewed by Dr. Irene Hramiak
DU 1.5 mg
LIRA 1.8 mg
Baseline A1C = 8.1% (65 mmol/mol) A1C c
han
ge
from
bas
elin
e (%
)
A1C ch
ange fro
m b
aseline
(mm
ol/m
ol)
0.0
–2.0
–4.0
–6.0
–8.0
–10.0
–12.0
–14.0
–16.0
0.0
–0.2
–0.4
–0.6
–0.8
–1.0
–1.2
–1.4
–1.6
–1.42 –1.36
†
–0.06 (–0.19, 0.07)a

Body Weight Change Over Time
Data presented are LS means ± SE; #p < 0.05 vs. dulaglutide; ITT, MMRM analysis Dulaglutide is not approved for use in Canada Dungan et al. Lancet 2014 (ahead of print)
Tofé Povedano S, et al. OP 07-040, presented at the 2014 EASD Reviewed by Dr. Irene Hramiak
–5
0
–2
–3
–4
–6
–1
0 1 2 4 8 12 20 26 Time (weeks)
Body
wei
ght,
ch
ange
from
bas
elin
e (k
g)
Baseline weight = 94.1 kg
Weight difference 0.7 kg
DU 1.5 mg LIRA 1.8 mg
# #
# #
#

Cumulative Adverse Events Through 26 Weeks
DU 1.5 mg n = 299
LIRA 1.8 mg n = 300
Any AE, n (%) 185 (61.9) 189 (63.0)
GI adverse events, n (%) Nausea Vomiting Diarrhea Dyspepsia
107 (35.8) 61 (20.4) 21 (7.0) 36 (12.0) 24 (8.0)
107 (35.7) 54 (18.0) 25 (8.3) 36 (12.0) 18 (6.0)
Study/study drug discontinuations for GI AE 9 (3.0) 13 (4.3)
Hypoglycemia ( ≤ 3.9 mmol/L ± symptoms) Total (events/pt/year), mean (SD) Severe hypoglycemia
0.02 (0.08)
0
0.03 (0.17)
0
Injection-site reactions, n (%) 1 (0.3) 2 (0.7)
Adjudicated pancreatitis, n Pancreatic cancer, n
0 0
0 0
Dulaglutide is not approved for use in Canada AE = adverse event; GI = gastrointestinal; SD = standard deviation Dungan et al. Lancet 2014 (ahead of print)
Tofé Povedano S, et al. OP 07-040, presented at the 2014 EASD Reviewed by Dr. Irene Hramiak

Discussion & Implications
• Take-home messages: – liraglutide is the current comparator for GLP-1 trials of QW
products – dulaglutide has shown non-inferiority for glycemic control – liraglutide provides better weight loss – advantage of once-daily GLP-1 for patient compliance remains
to be established
• Consider: – will probably have 2 QW analogues in next 12 months – some QW analogue preparations require reconstitution and
special injection techniques
Tofé Povedano S, et al. OP 07-040, presented at the 2014 EASD Reviewed by Dr. Irene Hramiak
Dulaglutide is not approved for use in Canada GLP-1 = glucagon-like peptide-1; QW = once weekly

Empagliflozin Improves Glucose Variability in Type 1 Diabetes
PS 076-956 – Sodium Glucose Co-transporter-2 (SGLT2) Inhibitor Empagliflozin in Type 1 Diabetes (T1D):
Impact on Diurnal Glycemic Patterns
By Perkins B, Cherney D, Partridge H, et al
Objective: To assess how 8 weeks’ treatment with empagliflozin as adjunct to insulin therapy in T1DM impacts diurnal CGM patterns, as
well as time spent in hyper- and hypoglycemia Empagliflozin is not approved for use in Canada CGM = continuous glucose monitoring

Study Design
• Proof-of-concept study, 2 months in duration
Perkins B, et al. PS 076-956, presented at the 2014 EASD Reviewed by Dr. Sorin Beca
Follow-up Screening Run-in Open-label empagliflozin
25 mg qd
2 weeks 8 weeks 2 weeks 1 week
2-week CGM analysis
Insulin titration†
CGM
†Basal and bolus insulin doses were reduced at onset of treatment with empagliflozin as recommended by the investigator and adjusted thereafter
2-week CGM analysis
2-week CGM analysis
2-week CGM analysis
Empagliflozin is not approved for use in Canada

Study Cohort Characteristics Clinical characteristics, n = 40
Male sex (%) 20 (50)
Age (years) 24.3 ± 5.1
Diabetes duration (years) > 1 to 5 > 5
4 (10) 36 (90)
Insulin regimen Insulin pump MDI
26 (65) 14 (35)
Total daily insulin (U) 54.7 ± 20.4
BMI (kg/m2) 24.5 ± 3.2
Urine albumin to creatinine ratio (mg/mmol) 1.2 ± 0.9
GFRINULIN (mL/min/1.73 m2) 154 ± 33
A1C (%) 8.0 ± 0.9
Perkins B, et al. PS 076-956, presented at the 2014 EASD Reviewed by Dr. Sorin Beca
Data are mean ± standard deviation (SD) or n (%) Empagliflozin is not approved for use in Canada MDI = multiple dose insulin; BMI = body mass index; GFR = glomerular filtration rate

Visual AGP Display for a Single Subject
Perkins B, et al. PS 076-956, presented at the 2014 EASD Reviewed by Dr. Sorin Beca
The visual AGP display (for a single subject) represents data collapsed over 24 hours where the median (black line) and percentiles are indicated (25th and 75th percentile in solid red, 10th and 90th in dotted red) Empagliflozin is not approved for use in Canada AGP = ambulatory glucose profile
350
50
300
200
150
100
0
250
12:00 AM
2:00 AM
4:00 AM
6:00 AM
8:00 AM
10:00 AM
12:00 PM
2:00 PM
4:00 PM
6:00 PM
8:00 PM
10:00 PM
12:00 AM

Time Spent at Various Glycemic Levels (%)
Variables Baseline Mid-treatment
End-of-treatment
Follow-up off-
treatment
Total (md/dL)
% > 180 34.1 (14.4) 29.7 (13.4) 29.1 (14.9) 39.8 (15.7)
% > 140 54.8 (14.2) 53.4 (13.7) 51.6 (14.8) 60.0 (15.3)
% 70-140 40.2 (11.9) 42.0 (12.8) 43.1 (13.5) 35.0 (12.1)
% < 70 5.0 (4.6) 4.6 (4.0) 5.2 (6.4) 5.0 (4.9)
MDI (mg/dL)
% > 180 32.6 (10.8) 32.2 (14.9) 27.8 (14.3) 41.5 (17.4)*
% > 140 51.5 (12.2) 54.1 (15.1) 49.2 (15.2) 60.9 (16.8)*
% 70-140 40.9 (7.1) 40.1 (12.4) 41.7 (12.2) 32.2 (11.2)*
% < 70 7.6 (6.2) 5.8 (5.4) 9.1 (9.4) 6.9 (6.5)*
CSII (mg/dL)
% > 180 34.8 (16.0) 28.5 (12.7) 29.8 (15.5) 38.9 (15.0)
% > 140 56.4 (15.0) 53.1 (13.2) 52.8 (14.8) 59.6 (14.7)
% 70-140 39.9 (13.8) 42.9 (13.1) 43.9 (14.2) 36.4 (12.5)
% < 70 3.7 (2.9) 4.0 (3.1) 3.3. (2.8) 4.0 (3.5)
Glucose Variability
Data are mean standard deviation (SD). Proportion of individual values for entire period. *p < 0.05 vs. baseline. Similar pattern as for % < 70 mg/dL was seen for % < 60 mg/dL in all categories with ranges: Total: 2.4–2.6%, MDI: 3.2-5.7%, CSII: 1.1–1.8% Empagliflozin is not approved for use in Canada IQR = interquartile range; CSII = continuous subcutaneous insulin infusion
Perkins B, et al. PS 076-956, presented at the 2014 EASD Reviewed by Dr. Sorin Beca
120
*
Total IQR IQR MDI IQR CSII 0
100
80
60
40
IQR,
mg/d
L (m
ean,
SD
)
*
* *
*
Baseline Mid-treatment End-of-treatment Follow-up off-treatment
*p < 0.05 vs. baseline

Discussion & Implications
• Take-home message: – empagliflozin x 8 weeks improved glycemic control, reduced incidence
of hypoglycemic events, reduced insulin doses and weight, and improved glycemic variability in T1DM patients
• Considerations, limitations: – proof-of-concept, single-arm, open-label pilot study: short duration,
small sample size – improved night-time glycemia more prominent than daytime
• Clinical implications: – too early to assess clinical impact in Canada – future research needed to prove safety
• e.g., degree of basal/short-acting insulin adjustment upon initiation/interruption of empagliflozin
Perkins B, et al. PS 076-956, presented at the 2014 EASD Reviewed by Dr. Sorin Beca
Empagliflozin is not approved for use in Canada

Fixed-dose Combination of Empagliflozin/Linagliptin as Add-on to
Metformin in T2DM Lowers A1C More than Either Agent Alone
OP 01-001 – Fixed-dose Combinations of Empagliflozin/Linagliptin for 52 Weeks as Add-on to Metformin in Subjects with
Type 2 Diabetes
By De Fronzo RA, Lewin A, Patel S, et al
Objectives: To evaluate the efficacy and safety of fixed-dose combinations of empagliflozin/linagliptin as add-on to metformin in
subjects with type 2 diabetes mellitus (T2DM)
Empagliflozin is not approved for use in Canada

De Fronzo RA, et al. OP 01-001, presented at the 2014 EASD Reviewed by Dr. David Shu
Study Design • Phase III, double-blind, RCT in T2DM, BMI < 45 kg/m2,
eGFR > 60 mL/min/1.73 m2, on metformin ≥ 1,500 mg/day
52 weeks
Screening (n = 1,179)
2-week placebo run-in
Randomization (n = 677)
Empagliflozin 25 mg / linagliptin 5 mg (n = 137)
Empagliflozin 10 mg / linagliptin 5 mg (n = 136)
Empagliflozin 25 mg (n = 135)
Empagliflozin 10 mg (n = 134)
Linagliptin 5 mg (n = 135)
Empagliflozin is not approved for use in Canada RCT = randomized control trial; BMI = body mass index; eGFR = estimated glomerular filtration rate

De Fronzo RA, et al. OP 01-001, presented at the 2014 EASD Reviewed by Dr. David Shu
Change from Baseline in A1C at Week 52
*Significantly better (p < 0.001) vs empa 25 mg or lina 5 mg **Significantly better (p < 0.001) vs empa 10 mg or lina 5 mg ANCOVA in full analysis set with last observation carried forward (LOCF) imputation Empagliflozin is not approved for use in Canada SE = standard error; CI = confidence interval
Mean baseline 0.0
Adju
sted
mea
n (
SE)
chan
ge
from
bas
elin
e in
A1C (
%)
–0.2 –0.4 –0.6 –0.8 –1.0 –1.5
–1.4
7.90
–1.21 *
–1.05 **
7.95
–0.64
8.02
–0.69
8.00
–0.48
8.02
–0.57 (95% CI –0.77, –0.37)
p < 0.001
–0.73 (95% CI –0.93, –0.53)
p < 0.001
–0.57 (95% CI –0.77, –0.37)
p < 0.001
–0.36 (95% CI –0.56, –0.17)
p < 0.001
Empagliflozin 25 mg / linagliptin 5 mg (n = 134)
Empagliflozin 10 mg / linagliptin 5 mg (n = 135)
Empagliflozin 25 mg (n = 140)
Empagliflozin 10 mg (n = 137)
Linagliptin 5 mg (n = 128)

De Fronzo RA, et al. OP 01-001, presented at the 2014 EASD Reviewed by Dr. David Shu
Selected Adverse Events
Empagliflozin 25 mg/
linagliptin 5 mg
(n = 137)
Empagliflozin 10 mg/
linagliptin 5 mg
(n = 136)
Empagliflozin 25 mg
(n = 141)
Empagliflozin 10 mg
(n = 140)
Linagliptin 5 mg
(n = 132)
Urinary tract infectiona
Male Female
14 (10.2) 2 (2.7)
12 (18.8)
13 (9.6) 2 (2.4)
11(21.2)
19 (13.5) 2 (3.0)
17 (22.7)
16 (11.4) 3 (3.7)
13 (22.0)
20 (15.2) 3 (4.5)
17 (26.2)
Genital infectionb Male Female
3 (2.2) 2 (2.7) 1 (1.6)
8 (5.9) 2 (2.4) 6 (11.5)
12 (8.5) 3 (4.5) 9 (12.0)
11 (7.9) 5 (6.2) 6 (10.2)
3 (2.3) 2 (3.0) 1 (1.5)
Volume depletionc 1 (0.7) 2 (1.5) 2 (1.4) 1 (0.7) 4 (3.0)
Hypersensitivity reactionsd
1 (0.7) 1 (0.7) 0 0 1 (0.8)
Pancreatitise 0 0 0 0 1 (0.8)
N (%) in subjects who received ≥ 1 dose of study drug aBased on 77 preferred terms; bBased on 89 preferred terms; cBased on 8 preferred terms; dBased on 3 Standardized MedDRA Queries (SMQs); eBased on SMQ and 1 preferred term Empagliflozin is not approved for use in Canada

De Fronzo RA, et al. OP 01-001, presented at the 2014 EASD Reviewed by Dr. David Shu
Discussion & Implications
• Take-home messages: – combination therapy with empagliflozin
/linagliptin 5 mg: • lowered A1C more than either as monotherapy • provides a simple, well-tolerated therapy that
effectively lowers A1C, with minimal hypoglycemia and weight loss
Empagliflozin is not approved for use in Canada

Type II diabetes is a complex progressive disease involving many different disease
pathways that requires early onset of novel combination therapy in order to maximize
lowering of A1c while at the same time reducing the risk of hypoglycemia and weight gain.
Is there a role for early combination therapy in the management of patients with Type 2 diabetes?
Objectives: 1. To review the specific reasons why early combination therapy may be beneficial in Type 2 diabetes and 2. To review the evidence regarding effectiveness of different
combination therapies.
B. Zinman. Astra Zeneca Symposium presented at the 2014 EASD Reviewed by Dr. Joanne F. Liutkus

Specific reasons why early combination therapy may be beneficial in Type 2 diabetes
• Early robust lowering of A1c • Avoidance of clinical inertia associated with a
stepwise approach to therapy • Potential for early combination therapy to
impact Beta-cell function • Initiation of a therapeutic intervention with a
complementary mechanism of action • Potential to use less than maximal doses of
individual agents, minimizing side effect. » Zinman B. Am J Med 2011; 124:S19-34
B. Zinman. Astra Zeneca Symposium presented at the 2014 EASD Reviewed by Dr. Joanne F. Liutkus

Key Findings 1. The vast majority of patients with Type 2
diabetes eventually require combination therapy: 50% of patients at 3 years; 75% of patients at 9 years Turner RC et al for the UKPDS Group (UKPDS 49) JAMA 1999; 281: 2005-12.
2. There is significant clinical inertia in response to inadequate glycemic control (A1c >8%): specialist and primary care physicians similar except when initiating insulin therapy Shah BR, et al Diabetes Care 2005; 28: 600-6
3. Secondary failure of metformin monotherapy is increased when initial A1c is >8%: approximately 19% per year.
Brown JB, et al Diabetes Care 2010; 33: 501-6
B. Zinman. Astra Zeneca Symposium presented at the 2014 EASD Reviewed by Dr. Joanne F. Liutkus

Combination Therapy vs.. each as monotherapy
1. Metformin + SU:Hypoglycemia, weight gain, lack of durability. Morgan C et al J Clin Endocrinol Metab 2012; 97: 4605-12; Nathan DM et al. Diabetes Care 2009; 32: 193-203
2. Saxagliptin + Metformin: superior glycemic control Pfutzner A et al. Diab Obes Metab 2011; 13: 567-76.
3. Saxagliptin + Dapagliflozin+Metformin=superior 4. Sitagliptin + metformin: plus lower post meal glucose levels. Williams-Herman D, et al. Diab Obes Metab 2010; 12:442-51
5. Linagliptin + Metformin Hack T et al. Diab Obes Metab 2012; 14: 565-74
6. Metformin XR + Dapagliflozin: plus weight loss Henry RR et al. Int J Clin Pract 2012; 66:446-56
7. Exenetide BID + Metformin DeFronzo RA et al. Diabetes Care 2005; 28: 1092-100
8. Saxagliptin + Dapagliflozin Rosenstock J et al. presented at the ADA Congress 2014. Abstract #127-LB
9. Dapagliflozin + Insulin: reduction of insulin dosage by 20 units
B. Zinman. Astra Zeneca Symposium presented at the 2014 EASD Reviewed by Dr. Joanne F. Liutkus

Discussion & Implications • Take-home messages:
– Good evidence that initiating dual therapy for new onset diabetes results in:
• Improved glycemic control • Less hypoglycemia • Weight loss or no weight gain • Improved adherence • Cost effective • Reduced number of pills per day • Fewer SFX
– No threshold for A1c as to when combination therapy should be
initiated. – Need to educate both specialists and primary care providers of the
importance of early, aggressive glycemic control
• Consider: – Impact on Canadian health care system.
B. Zinman. Astra Zeneca Symposium presented at the 2014 EASD Reviewed by Dr. Joanne F. Liutkus

Questions, comments?
