at risk: our children, our future -...
TRANSCRIPT

At Risk: Our Children, Our Future
Prepared By: Peter Winograd, UNM Center for Education Policy Research Angelo Gonzales, UNM Center For Education Policy Research Amy Ballard, UNM Center For Education Policy Research Beata Thorstensen, UNM Center For Education Policy Research Meriah Heredia Griego, UNM Center For Education Policy Research
Prepared For: Painting The Picture Of Urgency 2013 Hispanic Roundtable & Lumina Unidos Project Latino Education Legislative Summit February 21, 2013 Santa Fe, New Mexico

The Context
2

New Mexico County Map Reference Guide
3

New Mexico School District Map Reference Guide (See Map Next Slide)
4
District Number District Number District Number District Number District Number
Alamogordo 1 Corona 19 Hagerman 37 Maxwell 55 Ruidoso 73
Albuquerque 2 Cuba 20 Hatch 38 Melrose 56 San Jon 74
Animas 3 Deming 21 Hobbs 39 Mesa Vista 57 Santa Fe 75
Artesia 4 Des Moines 22 Hondo Valley 40 Mora 58 Santa Rosa 76
Aztec 5 Dexter 23 House 41 Moriarty 59 Silver City 77
Belen 6 Dora 24 Jal 42 Mosquero 60 Socorro 78
Bernalillo 7 Dulce 25 Jemez Mountain 43 Mountainair 61 Springer 79
Bloomfield 8 Elida 26 Jemez Valley 44 Pecos 62 Taos 80
Capitan 9 Española 27 Lake Arthur 45 Peñasco 63 Tatum 81
Carlsbad 10 Estancia 28 Las Cruces 46 Pojoaque 64 Texico 82
Carrizozo 11 Eunice 29 Las Vegas City 47 Portales 65 Truth or Consequences 83
Central 12 Farmington 30 Logan 48 Quemado 66 Tucumcari 84
Chama Valley 13 Floyd 31 Lordsburg 49 Questa 67 Tularosa 85
Cimarron 14 Fort Sumner 32 Los Alamos 50 Raton 68 Vaughn 86
Clayton 15 Gadsden 33 Los Lunas 51 Reserve 69 Wagon Mound 87
Cloudcroft 16 Gallup-McKinley 34 Loving 52 Rio Rancho 70 West Las Vegas 88
Clovis 17 Grady 35 Lovington 53 Roswell 71 Zuni 89
Cobre 18 Grants-Cibola 36 Magdalena 54 Roy 72

New Mexico School District Reference Guide (See Legend Previous Slide)
5

Two Of New Mexico’s Most Striking Features Are Its Wide-Open Spaces And Its Wealth Of Cultures
6

New Mexico Counties: Total Population
7
The Majority Of New Mexico’s Population Is Located In A Few Counties. Even In Those Counties, However, New Mexico Is Often Rural And Spacious.
New Mexico Counties: Population Density - Persons per Square Mile
Source: U.S. Census Bureau, 2010 Population Data.
0 - 2
3 - 5
6 - 10
11 - 20
21 - 40
41 - 80
81 - 160
161 - 568
695 - 2,000
2,001 - 9,000
9,001 - 20,000
20,001 - 35,000
35,001 - 60,000
60,001 - 80,000
80,001 - 200,000
200,001 - 662,564

Percentage Of Individuals Who Speak A Language Other Than English At Home, By County
8 Source: U.S. Census, American Community Survey, 2006-2010, Five-Year Estimates.
New Mexico is Rich in
Languages:
In New Mexico, 36% of
individuals speak a
language other than
English at home,
compared to 20.1% in the
United States.
Rio Arriba County, at
62.6%, has the highest
concentration of residents
in New Mexico who
speak a language other
than English at home.
Los Alamos County, at
12%, has the lowest
concentration.

The Challenges We Face
9

Per Capita Income In New Mexico
10
Per Capita Income is a frequently-used way to measure a community’s economic health. The per capita income in most of New Mexico’s communities is below the state average of $22,966 and the national average of $27,334.
Legend
$2,077.00 - $22,966.00 (Below state & nat,l avg.)
$22,966.01 - $27,334.00 (Between state & nat'l avg.)
$27,334.01 - $81,545.00 (Above nat'l avg.)
Per Capita Income
in the Last 12 Months
(in 2010 Inflation-Adjusted
Dollars)
Legend
$46,598.01 - $81,545.00
$33,456.01 - $46,598.00
$25,857.01 - $33,456.00
$21,095.01 - $25,857.00
$16,723.01 - $21,095.00
$12,240.01 - $16,723.00
$2,077.00 - $12,240.00
Per Capita Income
For Individuals
Source: U.S. Census Bureau, 2006-2010 American Community Survey

Percentage of Hispanic Children Under 18 Years of
Age Living Below the Poverty Line, By
County
11
Source: U.S. Census, American Community Survey, 2006-2010 Five-Year Estimates. In 2010, the weighted average poverty threshold for a family of four was $22,314 (http://www.census.gov/hhes/www/poverty/data/threshld/). State and national averages are from the 2010 American Community Survey (state avg. = 30.4%; national avg. = 29.2%). The percentage of the total child population living in poverty is 26.0% (state) and 19.2% (nation).

Percentage of Individuals Over 25 Years of Age With an Associates Degree or Higher, By Census Tract
12
Source: U.S. Census, American Community Survey, 2006-2010 Five-Year Estimates. Rates are reported
by census tract. State and national averages taken from the 2010 American Community Survey (state avg.
= 32.6%; national avg. = 35.4%).
Legend
Percentage of Adults
With An AA Degree or Higher
0 - 32.6% (Below state & nat'l avg.)
32.7% - 35.4% (Between state & nat'l avg.)
35.5% - 79.4% (Above nat'l avg.)
Legend
Percentage of IndividualsOver 25 Years of AgeWith an Associates DegreeOr Higher
0% - 13.2%
13.3% - 20.8%
20.9% - 29.1%
29.2% - 38.1%
38.2% - 48.4%
48.5% - 60.7%
60.8% - 79.4%
Legend
Percentage of IndividualsOver 25 Years of AgeWith an Associates DegreeOr Higher
60.8% - 79.4%
48.5% - 60.7%
38.2% - 48.4%
29.2% - 38.1%
20.9% - 29.1%
13.3% - 20.8%
0% - 13.2%

Three National Trends In Education
13
• The skills levels required for the jobs we want for our communities are increasing.
• The educational gap between children of relatively affluent families and those of relatively poor families in widening.
• This generation of students is less likely to have more education than their parents.
Source: Duncan, G., & Murnane, R. (2011). Whither Opportunity?: Rising Inequality, Schools, and Children’s Life Chances. Russell Sage Foundation.

14
Is This Our Economic Future?
Source: www.dws.state.nm.us/dws-lmi.html.

Quality Counts Framework: A Child’s Chances For Success
• Early Foundations – Family income: Percent of children in families with incomes at least 200% of poverty level – Parental education: Percent of children with at least one parent with a postsecondary degree – Parental employment: Percent of children with at least one parent working full time and year-
round – Linguistic integration: Percent of children whose parents are fluent English speakers
• School Years – Preschool enrollment: Percent of 3- and 4-year-olds enrolled in preschool – Kindergarten enrollment: Percent of eligible children enrolled in kindergarten programs – 4th grade reading: Percent of 4th grade public school students “proficient” on NAEP – 8th grade math: Percent of 8th grade public school students “proficient” on NAEP – High school graduation: Percent of public high school students who graduate with a diploma – Young adult (18 – 24) education: Percent of young adults (18 – 24) enrolled in postsecondary
education or with a degree
• Adult Outcomes – Adult educational attainment: Percent of adults (25 – 64) with a 2- or 4-year postsecondary
degree – Annual income: Percent of adults (25 – 64) with incomes at or above national median – Steady employment: Percent of adults (25 – 64) in labor force working full time and year-
round
Source: Education Week, Quality Counts, http://www.edweek.org/ew/qc/index.html. 15

A Child’s Chances For Success Impact The Generations That Follow For Better or Worse
16 Source: Education Week, Quality Counts, http://www.edweek.org/ew/qc/index.html.
Early Foundations
School Years
Adult Outcomes
Early Foundations
School Years
Adult Outcomes
Early Foundations • Family income • Parental education • Parental employment • Linguistic integration School Years • Preschool enrollment • Kindergarten enrollment • 4th grade reading • 8th grade mathematics • High school graduation • Young adult [18-24] education Adult Outcomes • Adult educational attainment • Annual income • Steady employment

TX
AK
CA
MT
MI
AZ
ID
NV
NM
CO
OR
ILUT
WY
KS
IA
MN
NE
SD
FL
WI
ND
OK
WA
MO
GAAL
LA
NY
NC
AR
IN
PA
VA
MS
TN
OH
KY
ME
SC
WVMD
VT
NJ
MA
NH
CT
DE
RI
AK
HI
HI
A-
B+
B
B-
C+
C
C-
D+
D
New Mexico Children’s Chances For Success Are Among The Worst In The Nation
2013 Quality Counts Children’s Chances For Success Index is based on measures of Family Status, Progress Through School, and Adult Outcomes.
Source: Education Week, Quality Counts, http://www.edweek.org/ew/qc/index.html.
A-
B+
B
B-
C+
C
C-
D+
D
17

Teen Births Per 1000, 2009
18
Data from Annie E. Casey Foundation website: http://datacenter.kidscount.org/data/ for 2009.
Teen Births per 1000
16 - 28
28.01 - 41
41.01 - 53
53.01 - 64
53.01 - 64
45
41

Source: New Mexico Birth Certificate Database, Bureau of Vital Records and Health Statistics, New Mexico Department of Health.
No Prenatal Care or 3rd Trimester Only
3%
4% - 6%
7% - 8%
9% - 11%
12% - 16%
12% - 16%
Percentage Of Birth Mothers Receiving No Or Only Third Trimester Prenatal Care
19
These data reflect the number of women not receiving early prenatal care as a percentage of total birth mothers, averaged over the period from 2000-2011.

Research has shown a link between parental education levels and child outcomes such as educational experience, attainment, and academic achievement.
Percentage Of Birth Mothers Without A High School Diploma, By New Mexico School District
Legend
Percent of BirthMothers Without A High School Diploma
No Data
1.0% - 17.65%
17.66% - 27.29%
27.3% - 38.3%
38.31% - 50.37%
20
Source: New Mexico Birth Certificate Database, Bureau of Vital Records and Health Statistics, New Mexico Department of Health.

21 Source: New Mexico Department of Health Data IBIS http://ibis.health.state.nm.us/indicator/view_numbers/ChildAbuse.Total.Cnty.html
Ratio of Total Substantiated Child Abuse Allegations per 1,000 Children in the Population by County, 2010. The state average is 18.5 with a lower and upper confidence level of 14.8 and 22.2, respectively.
Data Notes: It is possible that one investigated report may include multiple types of substantiated abuse of one or more children in a family. In addition, it is possible for an individual child to have more than one substantiated investigation of abuse or neglect for a single reporting period.
Child Abuse Allegations
0.0 - 8.9
Child Abuse Allegationsper 1,000 Children
0.0 - 8.9
9.0 - 14.7
14.8 - 22.3
22.4 - 77.2

These Data are for All Students By District. The Statewide Average for All Students, All Schools, Scoring Proficient and Above was 52.4%. Districts with Less than 10 Students Tested are Not Reported.
Source: New Mexico Public Education Department, NMSBA Proficiencies By Grade, All Students, School Year 2011-2012.
22
Percentage of 3rd Grade Students Proficient And Above On The 2012 New Mexico Standards Based Assessments In Reading
81% - 100%
61% - 80%
41% - 60%
21% - 40%
0% - 20%
Data Not Available
Data Not Available

These Data are for All Students By District. The Statewide Average for All Students, All Schools, Scoring Proficient and Above was 52.7%. Districts with Less than 10 Students Tested are Not Reported.
Source: New Mexico Public Education Department, NMSBA Proficiencies By Grade, All Students, School Year 2011-2012. 23
Percentage Of 3rd Grade Students Proficient And Above On The 2012 New Mexico Standards Based Assessments In Math
81% - 100%
61% - 80%
41% - 60%
21% - 40%
0% - 20%
Data Not Available
Data Not Available

Percent of NM 4th Grade Students Scoring At or Above
Proficient in Reading By Ethnicity*
(NAEP 1992-2011)
34 31
36 35 34 36
40
35 34
12 13
9
18
24
15 13
17
12 15 14 15
13 14 16
14 15
8 6 5 6 6
8
13 10
12
0
5
10
15
20
25
30
35
40
45
1992 1994 1998 2002 2003 2005 2007 2009 2011
White
African American
Hispanic
Native American
Asian
*Asian/Pacific Islander is not reported in all years because NAEP reporting standards have not been met. African American data is not reported in all years because NAEP reporting standards have not been met.
24

Student Achievement Comparisons
NAEP Grade 4 Reading Students At or Above Proficiency
25

Percent of NM 4th Grade Students Scoring At or Above Proficient in
Math By Ethnicity*
(NAEP 1992-2011)
18 22 22
33 34
43 47 48
3
10 6
18 19 19
5 5 6 10
13 16
18
23
3 2 3 7
9
17 14 15
0
10
20
30
40
50
60
70
1992 1996 2000 2003 2005 2007 2009 2011
White
African American
Hispanic
Native American
Asian/Pacific Islander
*Asian/Pacific Islander is not reported in all years because NAEP reporting standards have not been met. African American data is not reported in all years because NAEP reporting standards have not been met.
26

Student Achievement Comparisons
NAEP Grade 4 Math Students At or Above Proficiency
*Florida data in the year 2000 was unavailable as of 11.11.11
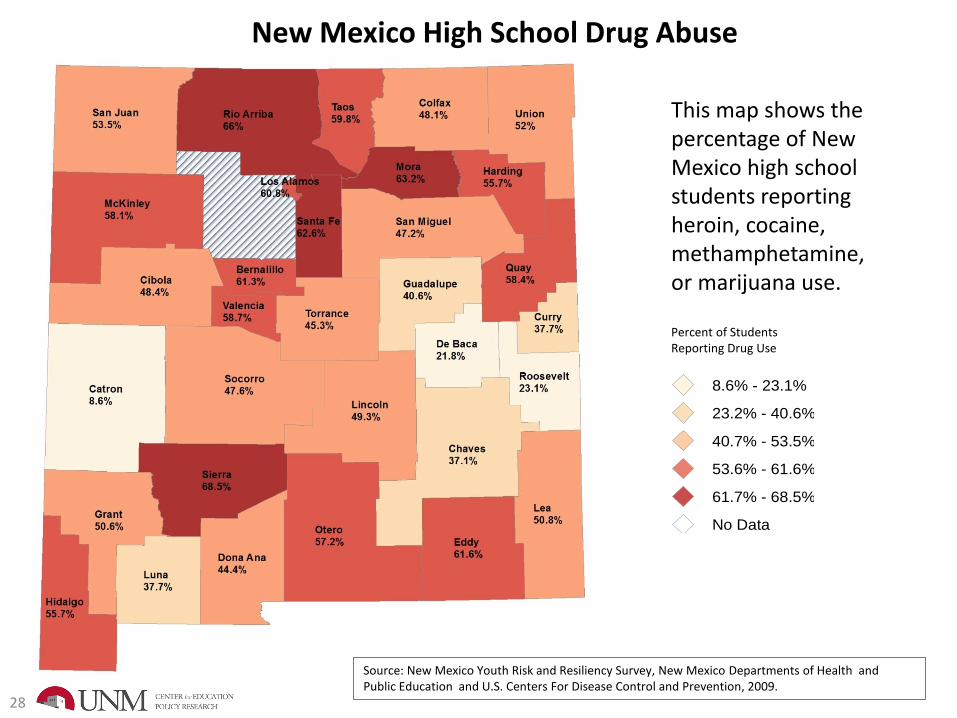
This map shows the percentage of New Mexico high school students reporting heroin, cocaine, methamphetamine, or marijuana use.
8.6% - 23.1%
23.2% - 40.6%
40.7% - 53.5%
53.6% - 61.6%
61.7% - 68.5%
No Data
Percent of Students Reporting Drug Use
New Mexico High School Drug Abuse
28
Source: New Mexico Youth Risk and Resiliency Survey, New Mexico Departments of Health and Public Education and U.S. Centers For Disease Control and Prevention, 2009.

Percentage of Albuquerque Public High School Students Who Reported Using Heroin, Cocaine, or Meth at Least Once in their Lives
29
Source: APS and state high school data taken from New Mexico Youth Risk and Resiliency Survey, 2009. Students were asked the following three questions: “During your life, how many times have you used any form of cocaine, including powder, crack, or freebase?” “During your life, how many times have you used heroin (also called smack, junk, or China White)?” “During your life, how many times have you used methamphetamines (also called speed, crystal, crank, or ice)?” The percentages reported here reflect respondents who reported using the given drug one or more times. National data taken from High School Youth Risk Behavior Survey, 2009, Centers for Disease Control & Prevention.
3%
5% 4%
7%
5%
9%
4%
6%
7%
4%
9%
7% 7% 7%
9%
3%
13%
15%
19%
14%
17%
11%
13% 13%
16%
13%
14%
13%
11%
16%
4%
6%
5%
9%
8%
11%
7% 7%
8%
7%
9% 9%
7%
8%
10%
0%
2%
4%
6%
8%
10%
12%
14%
16%
18%
20%
Heroin Cocaine Methamphetamine

Percentage Of High School Students Who Were Habitually Truant, By School District In 2011-2012
30
Source: New Mexico Public Education Department, 2009-2010 School Year. A student is identified as a Habitual Truant when the student has accumulated 10 or more unexcused absences.

4-Year High School Graduation Rate, All Students, By District, Class Of 2012
31 Source: New Mexico Public Education Department, 4-Year Cohort High School Graduation Rate, Class of 2012.
81% - 90%
71% - 80%
tl_2008_35_unsd
Less than 70%
Greater than 90%
No Data

Persons 18-24 Not In Labor Force Or School, No Degree Above HS, 2010
32
< -1.5 Std. Dev.
-1.5 - -0.50 Std. Dev.
-0.50 - 0.50 Std. Dev.
0.50 - 1.5 Std. Dev.
1.5 - 2.2 Std. Dev.
This map shows percent of population that is not in the labor force or attending school, with no degree beyond high school. Colors indicate distance from national mean with redder states having higher rates of unemployed persons not attending school or having beyond a high school degree.
Source: Annie E. Casey Foundation, KIDS COUNT Data Center, www.kidscount.org .
Hawaii 17%
Alaska 20%

33 Source: U.S. Census, American Community Survey 2010, 5-Year Estimates.
Percentage Of 16-19 Year Olds Not In School Or Labor Force

New Mexico’s College Graduation Rates Are Among The Worst In The Nation
34
Source: The National Center For Higher Education Management Systems Information Center for Higher Education Policymaking and Analysis.
The 2009 six-year graduation rates of bachelor degree students by state for the entering cohort of 2003. The average college graduation rate for the U.S. is 55.5%.
26.9% - 40%
40.1% - 55.4% (Below nat'l avg.)
55.5% - 60.2% (Above nat'l avg.)
60.3% - 69.2%

UNM Graduation Gap, By Gender and Race & Ethnicity, 2004 Cohort
35 Sources: UNM OIR Freshman Tracking Cohort Report; UNM Division of Equity & Inclusion
37.7%
41.0%
20.0%
42.6%
31.6%
8.0%
49.5%
52.7% 51.0%
45.5% 43.7%
27.5%
0.00%
10.00%
20.00%
30.00%
40.00%
50.00%
60.00%
Total Population White African American Asian Hispanic Native American
Male Female

36
We Can Heal The Inequalities That Divide Our State And Threaten Our Future

New Mexico Can Meet The Challenge
37
• Ensure that all students have effective teachers and principals, and meaningful curriculum.
• Schools can’t do it alone; families and communities can’t do it alone. We must work together to address the challenges that students face.
• Policy-makers, educators, parents, community and business leaders must advocate for our children, both in and out of school, all along the pathway from early childhood to high school and college.
• Policy-makers, educators, parents, community and business leaders must hold each other accountable for ensuring that our plans are implemented effectively.

Opportunities To Break The Cycle Of Generational Poverty: The 2013 Legislative Session
38
• Early Childhood Education
• Home Visiting
• School and Adolescent Health
• Truancy
• Afterschool Programs
• Assessment And Accountability Costs and Effectiveness
• Dual Credit
• Early College High Schools
• College Lottery
• Adult Education
• Economic And Workforce Development
Governor Bruce King: “Some of my friends are for it and some of my friends are against it, and I will support my friends.”

CEPR.UNM.EDU
39