at january 2008 issue
TRANSCRIPT
www.activetradermag.comPrinted in the U.S.A.$4.95 U.S. / CANADA
INSIDE INFORMATIONSTEPHEN MCCLELLAN PULLS BACKthe Wall Street curtain p. 47
TRACKING INSIDER BUYING p. 14
SEA CHANGE FOR T-NOTES?Find out if the trend has turned p. 34
REVERSAL OF FORTUNE:Symmetrical reversal days p. 30
TRADING THE EQUITY CURVEwith a twist p. 38
PUTTING A PIVOT-DAY SYSTEM TO THE TEST p. 22
Market Pulse8 The inside track
Find out how Dow stocks have performed after company “insiders” took positions in them.By David Bukey
Trading Strategies13 Designing and testing a pattern-based trading system
This system identifies potential reversals around pivot highsand lows.By Howard Bandy
19 Symmetrical reversal barsWhen price closely mimics the behavior of the previous day — in reverse — is it a sign of an imminent price move?By Active Trader staff
Advanced Strategies22 Bonds and the first rule of trading
Where do we stand after a 25-year bond bull market? Get ready to adjust your T-bond and T-note strategies.By Howard L. Simons
26 Trading System LabReverse-trade equity managementHow will trading a system based on the direction of its equity curve affect performance?By Volker Knapp
On the Market30 Why is the sky blue … and why do traders trade?
Do traders lose money because they are overconfident, or because they pick the wrong stocks? It might be both.By Active Trader staff
TRADING STRATEGIES FOR THE FINANCIAL MARKETS®
1 www.activetradermag.com • January 2008 • ACTIVE TRADER
CONTENTS:JANUARY 2008 • VOLUME 9, NO. 1
3 Editor’s Note
4 Contributors
5 Letters
6 Opening Trades
39 Global MarketplaceInternational market performance.
40 ETF SnapshotVolume, volatility, and momentumstatistics for exchange-traded funds.
41 Futures & Stocks SnapshotVolume, volatility, and momentumstatistics for futures and stocks.
60 Trading ResourcesNew products, services, and books.
62 Trading Calendar
64 Key Concepts
65 Upcoming Events
In every issue…
2 www.activetradermag.com • January 2008 • ACTIVE TRADER
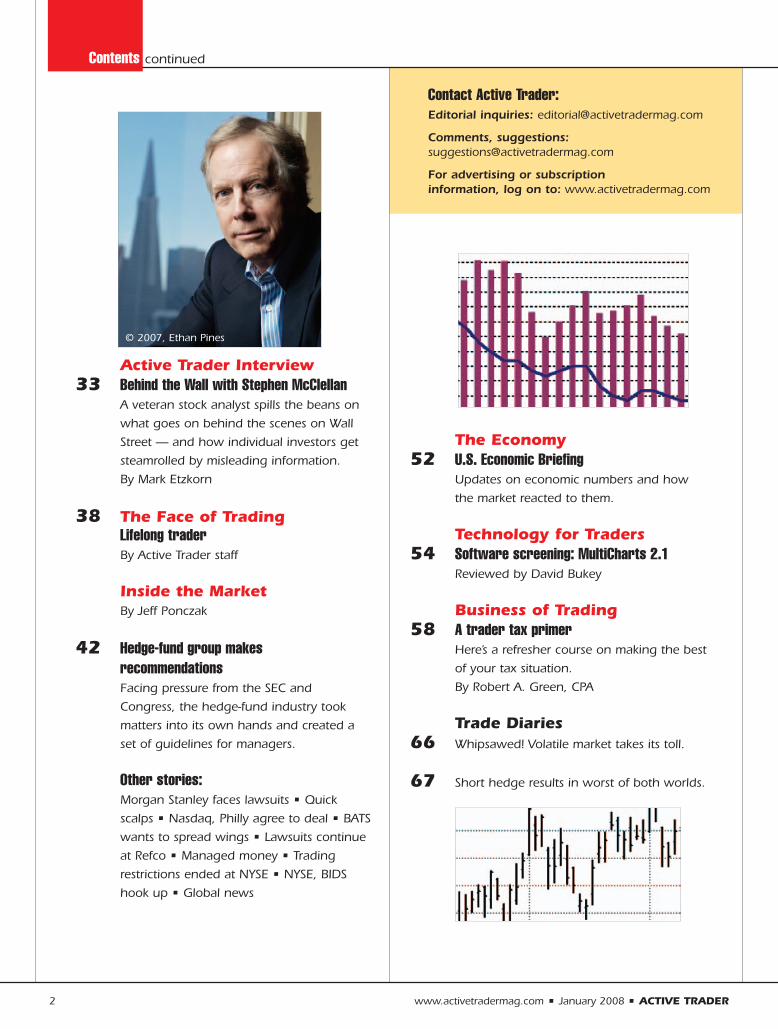
Active Trader Interview 33 Behind the Wall with Stephen McClellan
A veteran stock analyst spills the beans on what goes on behind the scenes on Wall Street — and how individual investors get steamrolled by misleading information.By Mark Etzkorn
38 The Face of Trading Lifelong traderBy Active Trader staff
Inside the MarketBy Jeff Ponczak
42 Hedge-fund group makes recommendationsFacing pressure from the SEC and Congress, the hedge-fund industry took matters into its own hands and created a set of guidelines for managers.
Other stories: Morgan Stanley faces lawsuits • Quick scalps • Nasdaq, Philly agree to deal • BATSwants to spread wings • Lawsuits continue at Refco • Managed money • Trading restrictions ended at NYSE • NYSE, BIDS hook up • Global news
Contact Active Trader:Editorial inquiries: [email protected]
Comments, suggestions:[email protected]
For advertising or subscription information, log on to: www.activetradermag.com
Contents continued
The Economy52 U.S. Economic Briefing
Updates on economic numbers and how the market reacted to them.
Technology for Traders54 Software screening: MultiCharts 2.1
Reviewed by David Bukey
Business of Trading58 A trader tax primer
Here’s a refresher course on making the best of your tax situation.By Robert A. Green, CPA
Trade Diaries66 Whipsawed! Volatile market takes its toll.
67 Short hedge results in worst of both worlds.
© 2007, Ethan Pines
F rom Jan. 1, 2000 through Oct.
24, 2007, the Shanghai
Composite Index (SSEC)
quadrupled in value on a closing basis;
the S&P 500 index gained 3.18 percent
during the same period.
From the Aug. 16 global equity market
low through Oct. 26, the iShares
FTSE/Xinhua China 25 Fund (FXI), an
exchange-traded fund (ETF) that tracks
the performance of the 25 largest Chinese
stocks traded on the Hong Kong Stock
Exchange, gained 70 percent — nearly
10 times the S&P 500’s 7.4-percent gain.
The FXI was averaging more than four
million shares a day in volume at the end
of October.
But how much do you know about the
stocks in this fund? Do you know what
sectors they represent? Do you know any-
thing about how the Chinese markets
work — what regulation they have, or
don’t have? Do you know the difference
between this fund and the Powershares
Golden Dragon Halter USX China Fund
(PGJ)? Did you know that foreign
investors are prohibited from trading the
stocks in the Shanghai Composite index?
Let’s be honest: The only thing most of
us know is that China is hot. No doubt
about it, it has been the place to be for at
least the past two years. Some day it will
not be. Whether that day comes next
month, next year, next decade, or next
century, I have no idea. (I have owned
both of the previously mentioned ETFs,
although I did not at the time of this
writing.) But I do know when people
flock to something without any real
understanding of it, be it technology
stocks, real estate, or the restaurant busi-
ness, bad things can happen.
In this case, Chinese individual
investors are the ones doing some of the
most intense flocking, at least in the case
of the Shanghai index. One can only
speculate about the level of investor
sophistication and the amount of emo-
tional speculation involved. (And we who
live in glass houses should not be hurling
stones.) But it’s not as if the country has a
long history of financial markets and a
generation of seasoned investors under its
belt. This stock-trading stuff is still pretty
new to them.
On Thursday, Oct. 25 the world found
out China had enjoyed another quarter of
double-digit growth (11.5 percent).
There’s nothing worse than nay saying a
huge stock rally — shouting “the sky is
falling” for months (or years) on end as
the market moves inexorably higher, and
ultimately claiming you were correct
when a big correction or turnaround
finally does happen.
Since the spring, at least, there have
been numerous warnings, including one
from Alan Greenspan, about the potential
for a crash in the Chinese market.
They’ve all been premature.
If China really is destined to be the
power of the 21st century, the Shanghai
index will someday be much higher than
it is now. (It was only a little more than
20 years ago that the Dow Industrials tra-
versed 1,000 for the first time.) But a
stock market that can rally 70 percent in
a little more than two months has the
potential for proportionally large down-
drafts. Investors and traders have to
know whether they can stomach the
roller coaster ride.
Mark Etzkorn, Editor-in-chief
Editor’s NOTE
Bubble, bubble, toil and trouble
3 www.activetradermag.com • January 2008 • ACTIVE TRADER
A stock market that
can rally 70 percent
in a little more than
two months has
the potential for
proportionally large
downdrafts.
Editor-in-chief: Mark Etzkorn
Managing editor: Molly Flynn
Senior editor: Jeff Ponczak
Senior editor:David Bukey
Associate editor:Chris Peters
Contributing writers: Thom Hartle, Howard L. Simons, Marc Chandler,Keith Schap, Thomas Stridsman, Robert A. Green,
Jim Kharouf
Editorial assistant and Webmaster:Kesha Green
Art director: Laura Coyle
President: Phil Dorman
Publisher, Ad sales East Coast and Midwest:
Ad sales West Coast and Southwest only:
Allison [email protected]
Classified ad sales:Mark Seger
Volume 9, Issue 1 Active Trader is published monthlyby TechInfo, Inc., 161 N. Clark Street, Suite 4915,Chicago, IL 60601. Copyright © 2008 TechInfo, Inc. Allrights reserved. Information in this publication may notbe stored or reproduced in any form without writtenpermission from the publisher. Annual subscription rateis $59.40.
The information in Active Trader magazine is intendedfor educational purposes only. It is not meant to rec-ommend, promote or in any way imply the effective-ness of any trading system, strategy or approach.Traders are advised to do their own research and test-ing to determine the validity of a trading idea. Tradingand investing carry a high level of risk. Past perform-ance does not guarantee future results.
4 www.activetradermag.com • January 2008 • ACTIVE TRADER
For all subscriber services: Active Trader Magazine
P.O. Box 567 Mt. Morris, IL 61054-0567
•(800) 341-9384
•www.activetradermag.com
Dr. Howard Bandy has degrees in mathematics, physics, engineering, and
computer science. He was a university professor of computer science and mathe-
matics, vice president and designer of the major product for a company that pro-
duced programs for stock selection and timing, and senior research analyst for a
commodity trading advisor, where he held a Series 3 license. He is the author of
the book, Quantitative Trading Systems, which expands on topics discussed in this
month’s article. Information about the book is available at www.quantitativetrad-
ingsystems.com. Dr. Bandy can be contacted at howard@quantitativetradingsys-
tems.com.
Howard L. Simons is president of Rosewood Trading Inc. and
a strategist for Bianco Research. He writes and speaks frequently on
a wide range of economic and financial market issues.
Robert A. Green, CPA, is CEO of Green & Company CPAs,
LLC (GreenTraderTax.com), a CPA firm focused on traders and
investment management businesses. He is the author of The Tax
Guide for Traders (McGraw-Hill, 2004). GreenTrader provides tax
preparation, accounting, consulting, entity, and retirement-plan
formation services; IRS/state tax exam representation; and sells trade-accounting
software. GreenTrader also provides a full line of services to hedge funds includ-
ing launch services, compliance, accounting, software, and tax. For more informa-
tion or to participate in free conference calls, chat rooms, and message boards,
visit www.greencompany.com or call (877) 662-2014 or (646) 216-8061.
Volker Knapp has been a trader, system developer, and
researcher for more than 20 years. His diverse background encom-
passes positions such as German National Hockey team player,
coach of the Malaysian National Hockey team, and president of
VTAD (the German branch of the International Federation of
Technical Analysts). In 2001 he became a partner in Wealth-Lab Inc.
(www.wealth-lab.com), which he is still running.
Jim Kharouf is a business writer and editor with more than 10 years of experi-
ence covering stocks, futures, and options worldwide. He has written extensively
on equities, indices, commodities, currencies, and bonds in the U.S., Europe, and
Asia. Kharouf has covered international derivatives exchanges, money managers,
and traders for a variety of publications.
This Month’s CONTRIBUTORS®
ACTIVE TRADER • January 2008 • www.activetradermag.com 5
LETTERS
What a coincidenceThe Trade Diaries in the October issue of Active Trader (p. 87 and 88) outlined a short-ing strategy and what stunned me was the similarity with what I am doing. I have reada zillion books, been to a zillion shows, and heard a zillion strategies, but the articles[described an approach] that is identical to what I am doing in my private portfolio.
For example, prior to market close yesterday, I saw that BBT was faltering on astrong market. I shorted at 41.96 and as I write, it is down 2.09 percent. I keep doingthis all the time (I’m serious).
I gave up a CEO position in June to trade a small portfolio. My CEO status did notpay me the sums received by John Chambers and Larry Ellison, but I was confidentenough to risk a “secure” job for the rewards and risks of the market.
In the last week I saw the exponential rises of SHLD and GRMN, and I consistentlykeep seeing these moves. I appreciate that the market can humble traders, but I haveincreased confidence in my abilities, regardless of market direction. (Yes, I am perfectlycomfortable shorting and, in fact, find it much easier to predict.)
Who wrote the Trade Diaries? I would like to approach him/her to see if I can tradealongside them for a day or two. I would love to find a trader who is successful, andwho shares my strategies. I have looked around for months, and though I find manywheelers and dealers, the article took me aback, in that it emulated what I do. I do,however, need tutelage.
Is there a publication containing examples of trades similar the Trade Diaries fromthe October issue? There are many books on the market but it seems that a simplecompilation of trades containing hundreds of successful and losing trades would be an excellent educational tool for people like me. If it doesn’t exist, you should do one!
Back to the markets I go.
–Stephen C.
Our trader wished to remain anonymous, but he informed us that he still needs tutelage andexperience himself. We don’t know of any publications that contain what the above writerdescribed, but we will continue to publish Trade Diaries in all our magazines.
Straight answer on linear regressionIn “Short-term T-Bond Trading”(Active Trader, October 2002), yourefer to a slope line derived from alinear regression calculation. I useTradeStation and don’t see it listedas an analysis technique, indicator,etc. Is it under another name, ordoes it have to be written inEasyLanguage? Or, can I substituteanother indicator that will give methe same input view?
–Randy G.
TradeStation has two linear regres-sion tools in its indicator section:“linear reg line” and “linear regcurve.” You can access them byselecting Insert Analysis Techniques> Indicators.
Finding articlesI am a little frustrated finding an index topast reports. Specifically, I am looking forarticles on placing spread orders.
–Lawrence C.
We have two online article indexes. The first,www.activetradermag.com/article_index.htm,simply lists articles by year and magazinesection. The Active Trader Store(http://store.activetradermag.com) is moreadvanced — it has a search feature used tofind articles by name, subject, keyword,author, and issue.
6 www.activetradermag.com • January 2008 • ACTIVE TRADER
OPENING TradesInternational ETF roller coaster: What’s in a range?While the performance of many global
and regional ETFs in 2007 has been
quite impressive, their volatility has not
been for the feint of heart.
More than 33 percent of the 49 “geo-
graphic” ETFs have gained more than 25
percent, led by the Brazil index (EWZ),
which is up 77.72 percent (through Nov.
9) and the FTSE/Xinhua China 25 index
(FXI; 63.3 percent).
However, those gains have not come
without setbacks. More than 20 of these
ETFs have had 2007 ranges (high price
minus low price, divided by low price)
of more than 40 percent, with the
Golden Dragon Halter USX China index
(PGJ) joining EWZ and FXI with a triple-
digit range.
For comparison’s sake, the Nasdaq
100 index tracking stock (QQQQ) has
not had a range of more than 30 percent
in the past four years, including 2007.
The FXI’s 2007 range of 144.58 percent
is on par with QQQQ’s 2001 range of
154.14 percent. In 2006, FXI’s range was
81 percent, although in 2005 it was only
27 percent.
In early March, EWZ, FXI, and PGJ all
dropped at least 12 percent from the
2006 close.
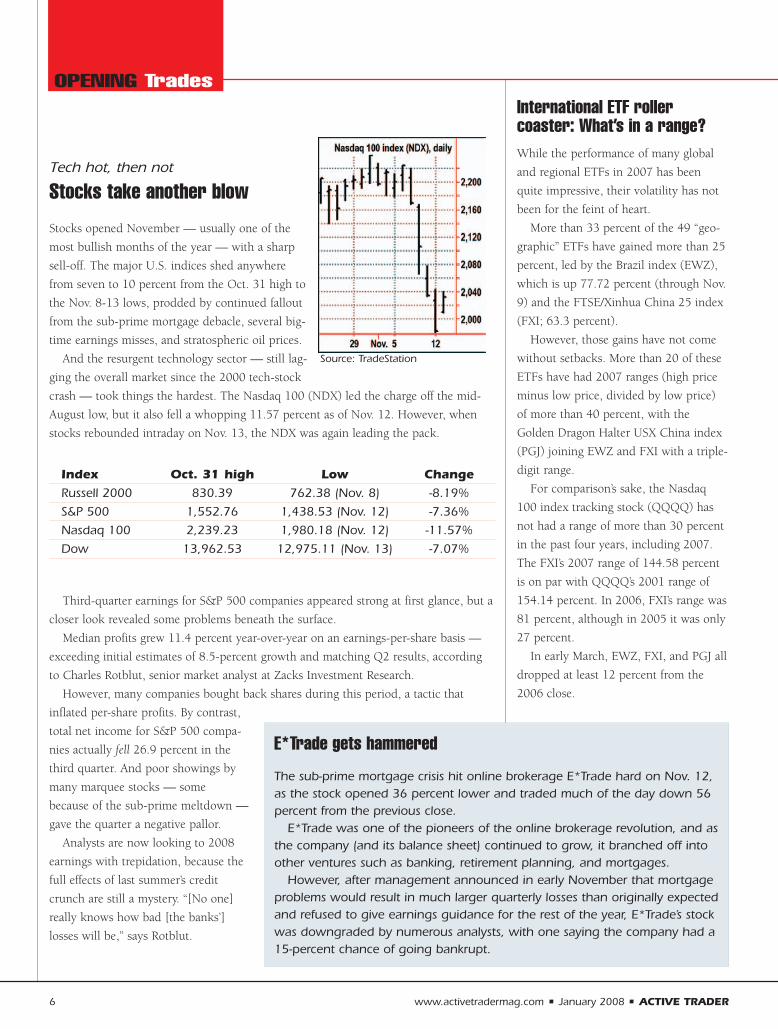
Tech hot, then not
Stocks take another blow Stocks opened November — usually one of the
most bullish months of the year — with a sharp
sell-off. The major U.S. indices shed anywhere
from seven to 10 percent from the Oct. 31 high to
the Nov. 8-13 lows, prodded by continued fallout
from the sub-prime mortgage debacle, several big-
time earnings misses, and stratospheric oil prices.
And the resurgent technology sector — still lag-
ging the overall market since the 2000 tech-stock
crash — took things the hardest. The Nasdaq 100 (NDX) led the charge off the mid-
August low, but it also fell a whopping 11.57 percent as of Nov. 12. However, when
stocks rebounded intraday on Nov. 13, the NDX was again leading the pack.
Index Oct. 31 high Low ChangeRussell 2000 830.39 762.38 (Nov. 8) -8.19%S&P 500 1,552.76 1,438.53 (Nov. 12) -7.36%Nasdaq 100 2,239.23 1,980.18 (Nov. 12) -11.57%Dow 13,962.53 12,975.11 (Nov. 13) -7.07%
Third-quarter earnings for S&P 500 companies appeared strong at first glance, but a
closer look revealed some problems beneath the surface.
Median profits grew 11.4 percent year-over-year on an earnings-per-share basis —
exceeding initial estimates of 8.5-percent growth and matching Q2 results, according
to Charles Rotblut, senior market analyst at Zacks Investment Research.
However, many companies bought back shares during this period, a tactic that
inflated per-share profits. By contrast,
total net income for S&P 500 compa-
nies actually fell 26.9 percent in the
third quarter. And poor showings by
many marquee stocks — some
because of the sub-prime meltdown —
gave the quarter a negative pallor.
Analysts are now looking to 2008
earnings with trepidation, because the
full effects of last summer’s credit
crunch are still a mystery. “[No one]
really knows how bad [the banks’]
losses will be,” says Rotblut.
Source: TradeStation
E*Trade gets hammered
The sub-prime mortgage crisis hit online brokerage E*Trade hard on Nov. 12,as the stock opened 36 percent lower and traded much of the day down 56percent from the previous close.
E*Trade was one of the pioneers of the online brokerage revolution, and asthe company (and its balance sheet) continued to grow, it branched off intoother ventures such as banking, retirement planning, and mortgages.
However, after management announced in early November that mortgageproblems would result in much larger quarterly losses than originally expectedand refused to give earnings guidance for the rest of the year, E*Trade’s stockwas downgraded by numerous analysts, with one saying the company had a15-percent chance of going bankrupt.
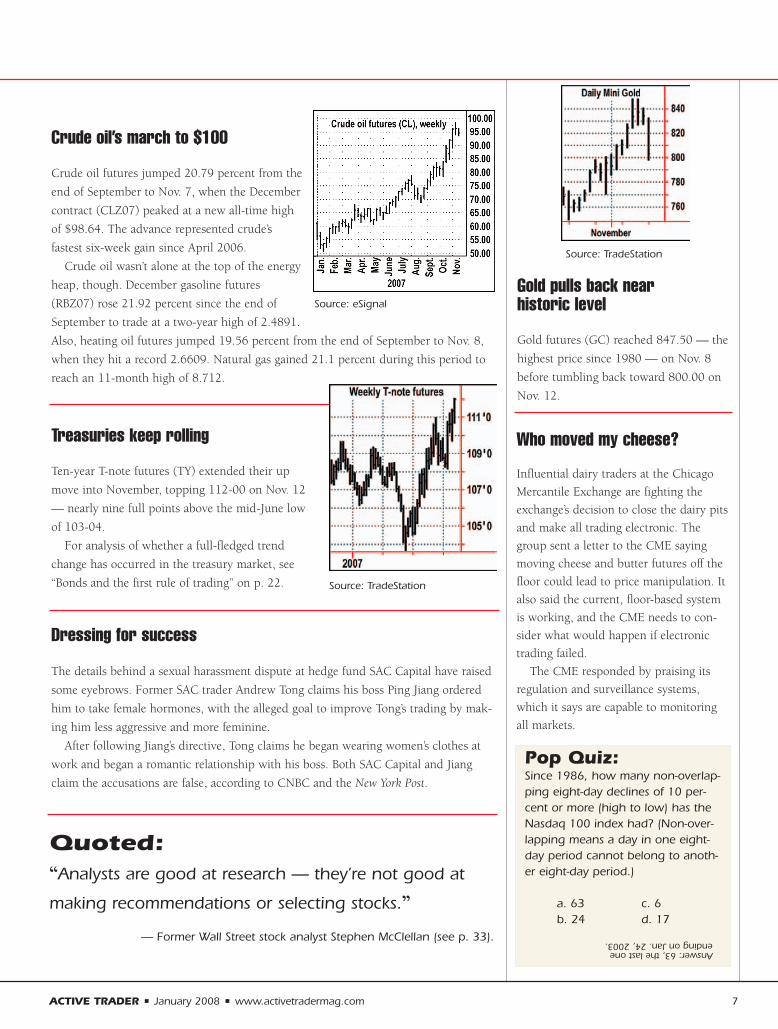
Crude oil’s march to $100
Crude oil futures jumped 20.79 percent from the
end of September to Nov. 7, when the December
contract (CLZ07) peaked at a new all-time high
of $98.64. The advance represented crude’s
fastest six-week gain since April 2006.
Crude oil wasn’t alone at the top of the energy
heap, though. December gasoline futures
(RBZ07) rose 21.92 percent since the end of
September to trade at a two-year high of 2.4891.
Also, heating oil futures jumped 19.56 percent from the end of September to Nov. 8,
when they hit a record 2.6609. Natural gas gained 21.1 percent during this period to
reach an 11-month high of 8.712.
Treasuries keep rolling
Ten-year T-note futures (TY) extended their up
move into November, topping 112-00 on Nov. 12
— nearly nine full points above the mid-June low
of 103-04.
For analysis of whether a full-fledged trend
change has occurred in the treasury market, see
“Bonds and the first rule of trading” on p. 22.
Dressing for success
The details behind a sexual harassment dispute at hedge fund SAC Capital have raised
some eyebrows. Former SAC trader Andrew Tong claims his boss Ping Jiang ordered
him to take female hormones, with the alleged goal to improve Tong’s trading by mak-
ing him less aggressive and more feminine.
After following Jiang’s directive, Tong claims he began wearing women’s clothes at
work and began a romantic relationship with his boss. Both SAC Capital and Jiang
claim the accusations are false, according to CNBC and the New York Post.
ACTIVE TRADER • January 2008 • www.activetradermag.com 7
Source: eSignal
Source: TradeStation
Source: TradeStation
Who moved my cheese?
Influential dairy traders at the ChicagoMercantile Exchange are fighting theexchange’s decision to close the dairy pitsand make all trading electronic. Thegroup sent a letter to the CME sayingmoving cheese and butter futures off thefloor could lead to price manipulation. Italso said the current, floor-based systemis working, and the CME needs to con-sider what would happen if electronictrading failed.
The CME responded by praising itsregulation and surveillance systems,which it says are capable to monitoringall markets.
Pop Quiz:Since 1986, how many non-overlap-ping eight-day declines of 10 per-cent or more (high to low) has theNasdaq 100 index had? (Non-over-lapping means a day in one eight-day period cannot belong to anoth-er eight-day period.)
a. 63 c. 6b. 24 d. 17
Gold pulls back near historic level
Gold futures (GC) reached 847.50 — the
highest price since 1980 — on Nov. 8
before tumbling back toward 800.00 on
Nov. 12.
Quoted:“Analysts are good at research — they’re not good at
making recommendations or selecting stocks.”
— Former Wall Street stock analyst Stephen McClellan (see p. 33).
Answer: 63, the last oneending on Jan. 24, 2003.
S everal days after
Caterpillar Inc. (CAT)
fell 8.9 percent
overnight on Oct. 20,
2005, Director Peter A. Magowan
bought $7.5 million of Caterpillar
stock. Magowan bought this large
stake when CAT traded just above its
three-month low. The stock jumped
51.65 percent within six months.
This purchase wasn’t confidential,
because the Securities and Exchange
Commission (SEC) requires “insid-
ers” — all officers and directors of pub-
licly traded companies — to report any
trades in their stock. Magowan reported
this transaction within two days of his
initial purchase.
But are insiders always good investors?
Admittedly, this is a cherry-picked exam-
ple; not all insiders buy at such fortuitous
times. However, when insiders buy their
stock directly, they expect it to climb.
By contrast, insiders sell their stock for
countless reasons — to diversify their
holdings, pay bills, exercise options —
not necessarily because they think the
company’s stock will tank. Bill Gates, for
example, sold at least $570 million of
Microsoft (MSFT) as it fell 8.72 percent in
February. But he also sold another $348
million in July, just before it soared 31
percent within six months. Clearly, Gates
didn’t sell his stock because he lost faith
in Microsoft.
Insider-buying reports are easier to
interpret than insider-selling reports,
but neither offers clear indications of
what might be motivating company
insiders. Blindly following an insider’s
lead is no better than taking a “hot”
stock tip from a friend.
Despite this caveat, several academic
studies have shown stocks tend to rally
within 12 months after insider buying.
However, much of this research is
decades old. To determine if this tenden-
cy still exists, the following study gauges
how the 30 stocks in the Dow Jones
Industrial Average (DJIA) behaved up to
six months after insiders reported buying
significant amounts of their stock since
April 2005.
Are insiders really buying?Each time company insiders trade, they
must file a “Form 4” with the SEC, which
lists several details about the trade: type
(buy or sell), date, share amount, stock
price, and so on. Form 4 includes a great
deal of information, including whether
insiders bought shares directly and if that
purchase was part of their total compen-
sation package.
8 www.activetradermag.com • January 2008 • ACTIVE TRADER
MARKET Pulse
BY DAVID BUKEY
The inside trackRiding the coattails of insider buyers might offer a trading edge for the rest of us.
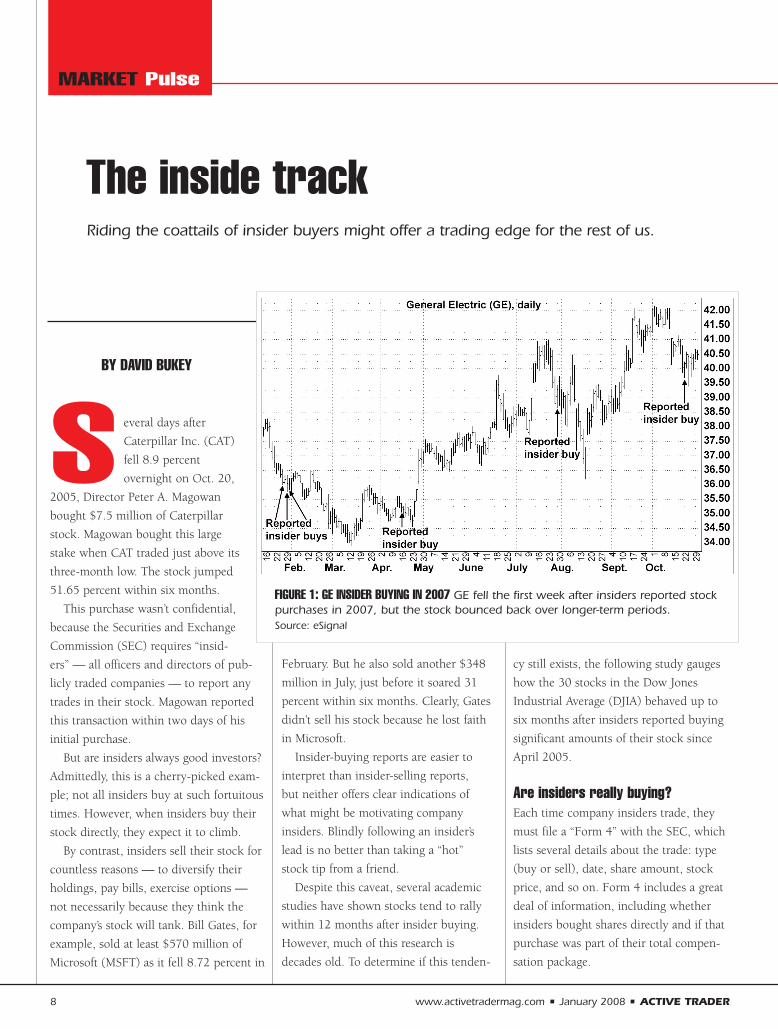
FIGURE 1: GE INSIDER BUYING IN 2007 GE fell the first week after insiders reported stockpurchases in 2007, but the stock bounced back over longer-term periods. Source: eSignal
Traders who study these reports often
search for insiders — especially the top
brass (CEOs, CFOs, COOs) — who have
bought a significant number of shares
directly on the open market. Ideally,
executives will use money from their
own pockets.
On the other hand, automatic, sched-
uled purchases, such as stock rewards,
are more arbitrary. Any purchase is prob-
ably part of a compensation package if it
includes a stock price of $0, or if the
document’s footnotes discuss different
types of stock (converted, restricted, or
deferred) or options.
MethodologyThis study examined insider-buying
reports provided by Edgar-Online.com
and SecForm4.com. This data is also
available free at the SEC’s Web site
(www.sec.gov), and Edgar Online lists a
limited amount of free data at Yahoo
Finance (http://finance.yahoo.com).
Significant insider buys were
defined as:
1. Purchases of $50,000 or more.
2. Open-market purchases that
weren’t included in an executive’s
total compensation, listed as “Buy”
at Edgar-Online.com.
3. “Direct” purchases that benefit only
that executive — not another firm,
trust, or foundation.
The study focused on insider-buying
reports from the 30 Dow components
over the past two-and-a-half years — 98
transactions from 24 Dow stocks
between April 2005 to October 2007.
The analysis excluded six Dow stocks
ACTIVE TRADER • January 2008 • www.activetradermag.com 9
continued on p. 1 0
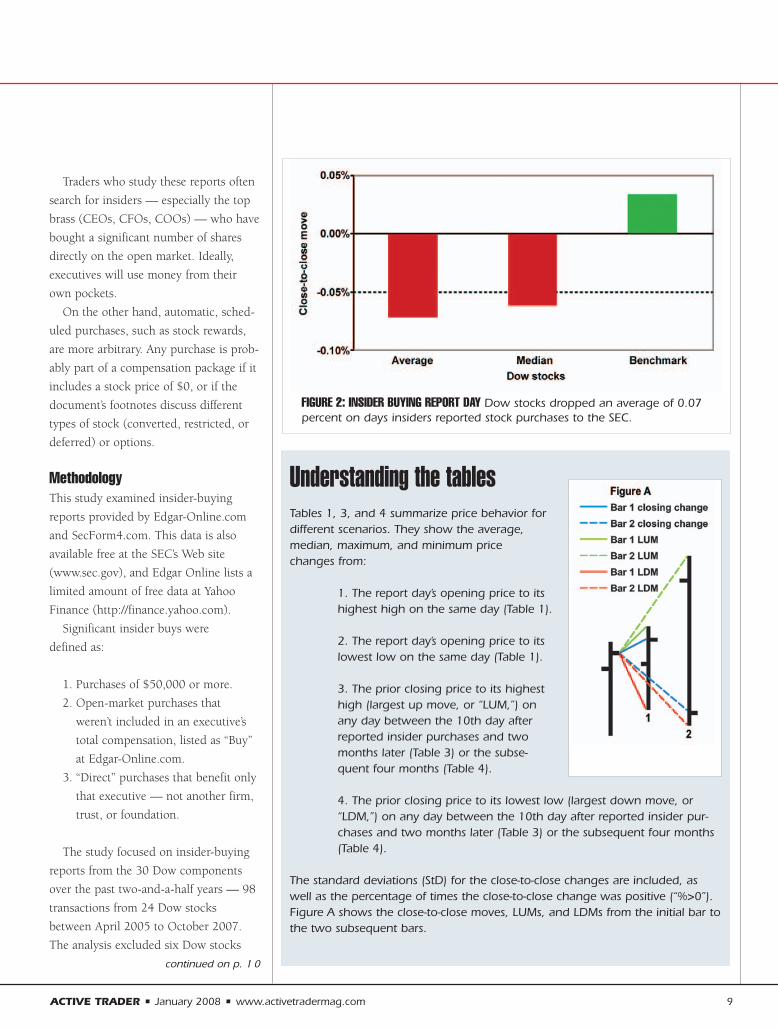
FIGURE 2: INSIDER BUYING REPORT DAY Dow stocks dropped an average of 0.07percent on days insiders reported stock purchases to the SEC.
Understanding the tablesTables 1, 3, and 4 summarize price behavior fordifferent scenarios. They show the average,median, maximum, and minimum price changes from:
1. The report day’s opening price to itshighest high on the same day (Table 1).
2. The report day’s opening price to itslowest low on the same day (Table 1).
3. The prior closing price to its highesthigh (largest up move, or “LUM,”) onany day between the 10th day afterreported insider purchases and twomonths later (Table 3) or the subse-quent four months (Table 4).
4. The prior closing price to its lowest low (largest down move, or“LDM,”) on any day between the 10th day after reported insider pur-chases and two months later (Table 3) or the subsequent four months(Table 4).
The standard deviations (StD) for the close-to-close changes are included, aswell as the percentage of times the close-to-close change was positive (“%>0”).Figure A shows the close-to-close moves, LUMs, and LDMs from the initial bar tothe two subsequent bars.
insiders either didn’t buy during this peri-
od, or which failed to meet the criteria:
Merck (MRK), International Business
Machines (IBM), Exxon Mobil (XOM),
Hewlett-Packard (HPQ), Proctor and
Gamble (PG), and Altria Group (MO).
Insiders typically reported their pur-
chases to the SEC one or two days after
buying shares. But the lag between trans-
action and filing dates varied from the
same day to more than a month later.
Because traders can’t exploit any price
moves before insider buying is reported
(unless they already own shares), all pat-
terns shown here began on the day insid-
ers submitted Form 4 to the SEC (report
day).
Insider buying in General ElectricInsider buying at General Electric (GE)
met our requirements 27 times during the
analysis period — far more than any
other Dow component. Although GE has
climbed 11.4 percent since April 2005,
the stock traded sideways much of the
time, so few GE insiders earned quick
profits from these trades.
The six significant insider buys in 2007
highlighted in Figure 1 (p. 8) give a
mixed picture. General Electric rallied
13.3 percent during this period, which
means all insiders have made money so
far, assuming they haven’t sold yet. But at
some point, each insider faced unrealized
losses in the first two weeks after buying.
Stocks drop on report day…Figure 2 (p. 9) shows how stocks per-
formed on the day insiders reported pur-
chases to the SEC. The figure also com-
pares this daily close-to-close perform-
ance to the average close-to-close move
since January 2005 (“benchmark”). Stocks
fell an average of 0.07 percent on report
days since April 2005 and lagged the
benchmark, which was a gain of 0.03
percent.
Table 1 (p. 9) shows the statistics
behind the report day’s loss. (For a
detailed explanation, see “Understanding
the tables.” For a discussion of the
difference between average and median,
see “Key concepts,” p. 64.) These
numbers also point to a loss: Although
individual stocks’ open-to-low moves are
10 www.activetradermag.com • January 2008 • ACTIVE TRADER
Market Pulse continued
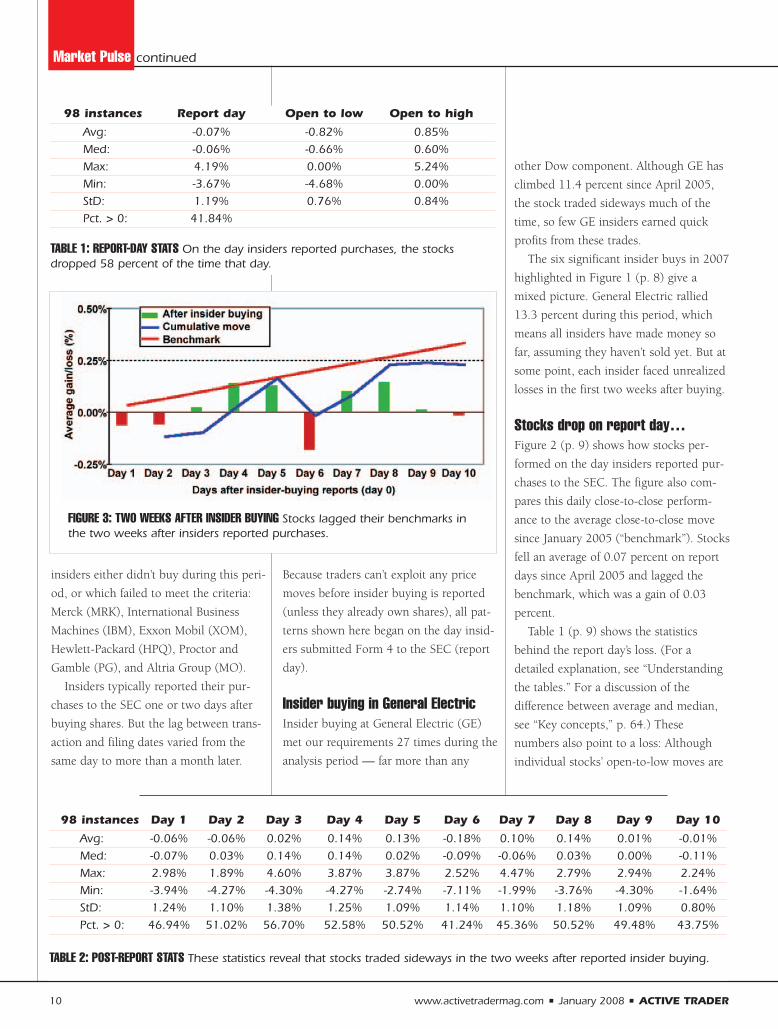
FIGURE 3: TWO WEEKS AFTER INSIDER BUYING Stocks lagged their benchmarks inthe two weeks after insiders reported purchases.
98 instances Day 1 Day 2 Day 3 Day 4 Day 5 Day 6 Day 7 Day 8 Day 9 Day 10
Avg: -0.06% -0.06% 0.02% 0.14% 0.13% -0.18% 0.10% 0.14% 0.01% -0.01%Med: -0.07% 0.03% 0.14% 0.14% 0.02% -0.09% -0.06% 0.03% 0.00% -0.11%Max: 2.98% 1.89% 4.60% 3.87% 3.87% 2.52% 4.47% 2.79% 2.94% 2.24%Min: -3.94% -4.27% -4.30% -4.27% -2.74% -7.11% -1.99% -3.76% -4.30% -1.64%StD: 1.24% 1.10% 1.38% 1.25% 1.09% 1.14% 1.10% 1.18% 1.09% 0.80%Pct. > 0: 46.94% 51.02% 56.70% 52.58% 50.52% 41.24% 45.36% 50.52% 49.48% 43.75%
TABLE 2: POST-REPORT STATS These statistics reveal that stocks traded sideways in the two weeks after reported insider buying.
98 instances Report day Open to low Open to high
Avg: -0.07% -0.82% 0.85%Med: -0.06% -0.66% 0.60%Max: 4.19% 0.00% 5.24%Min: -3.67% -4.68% 0.00%StD: 1.19% 0.76% 0.84%Pct. > 0: 41.84%
TABLE 1: REPORT-DAY STATS On the day insiders reported purchases, the stocksdropped 58 percent of the time that day.
roughly identical to their open-to-high
moves, stocks closed lower 58 percent
of the time.
…and trade sideways in the nexttwo weeksFigure 3 (p. 10) shows Dow stocks’
average daily gain or loss on each of the
next 10 days. It also compares the
cumulative average move after insider
purchases to the benchmark move (blue
and red lines, respectively).
The stocks went nowhere, lagging the
benchmarks in the two weeks after
insiders bought shares. They climbed
roughly 0.15 percent on days 4 and 5,
slid 0.18 percent on day 6, and then
rebounded at least 0.10 percent on each
of next two days. But the cumulative
move never exceeded 0.25 percent in
either direction.
Table 2 (p. 10) shows the statistics
from Figure 3 and adds evidence to this
argument. No single day (or multi-day
period) stands out as especially bullish
or bearish. For instance, stocks neither
climb nor drop more than 59 percent of
the time on any day in Table 2.
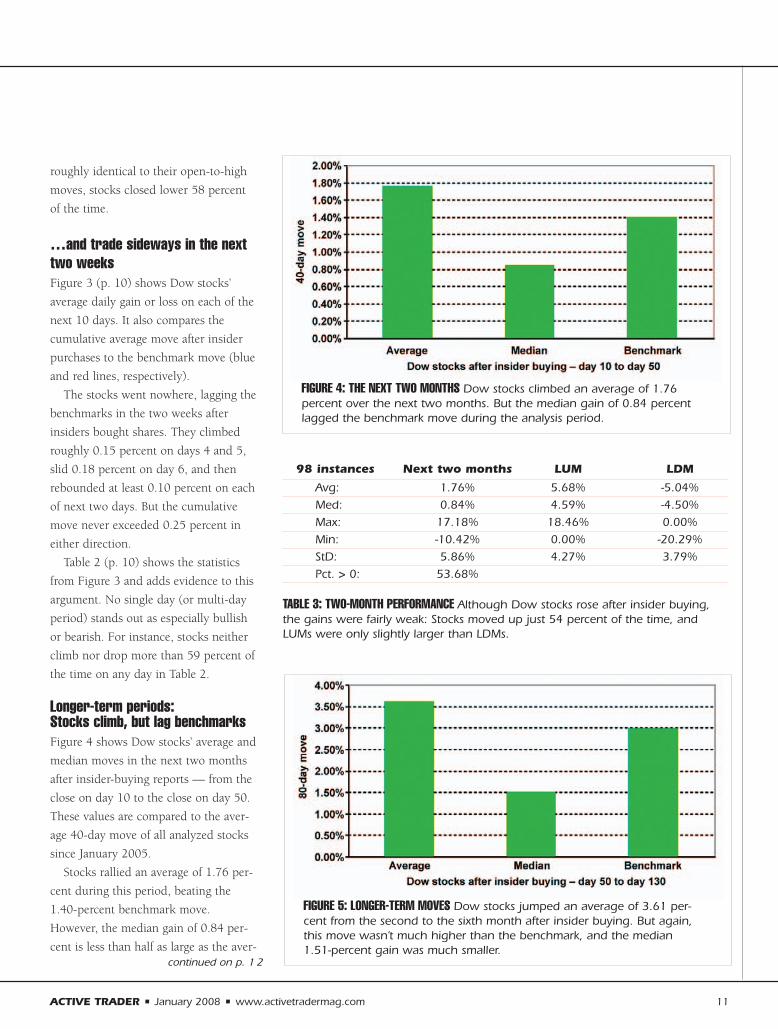
Longer-term periods: Stocks climb, but lag benchmarksFigure 4 shows Dow stocks’ average and
median moves in the next two months
after insider-buying reports — from the
close on day 10 to the close on day 50.
These values are compared to the aver-
age 40-day move of all analyzed stocks
since January 2005.
Stocks rallied an average of 1.76 per-
cent during this period, beating the
1.40-percent benchmark move.
However, the median gain of 0.84 per-
cent is less than half as large as the aver-
ACTIVE TRADER • January 2008 • www.activetradermag.com 11
continued on p. 1 2
FIGURE 4: THE NEXT TWO MONTHS Dow stocks climbed an average of 1.76 percent over the next two months. But the median gain of 0.84 percentlagged the benchmark move during the analysis period.
FIGURE 5: LONGER-TERM MOVES Dow stocks jumped an average of 3.61 per-cent from the second to the sixth month after insider buying. But again,this move wasn’t much higher than the benchmark, and the median 1.51-percent gain was much smaller.
98 instances Next two months LUM LDM
Avg: 1.76% 5.68% -5.04%Med: 0.84% 4.59% -4.50%Max: 17.18% 18.46% 0.00%Min: -10.42% 0.00% -20.29%StD: 5.86% 4.27% 3.79%Pct. > 0: 53.68%
TABLE 3: TWO-MONTH PERFORMANCE Although Dow stocks rose after insider buying,the gains were fairly weak: Stocks moved up just 54 percent of the time, andLUMs were only slightly larger than LDMs.
12 www.activetradermag.com • January 2008 • ACTIVE TRADER
age value, a discrepancy that implies a
few big gains have skewed the average
higher, which makes the median value
more representative of the typical price
behavior. Although stocks jumped during
this period, it’s likely they didn’t outper-
form the broader market.
Table 3 (p. 11) shows the details
behind Figure 4’s two-month move. At
first glance, the statistics are bullish: The
LUMs are larger than the LDMs and
stocks posted gains more often than loss-
es. But this up move wasn’t particularly
compelling — stocks climbed just 54 per-
cent of the time, and the 0.84-percent
median gain trailed the benchmark gain.
In short, the DJIA rose 32.62 percent dur-
ing the analysis period, so this behavior
could largely be the result of stocks drift-
ing higher with the overall market.
Figure 5 (p. 11) is similar to Figure 4,
but it shows stocks’ average and median
moves in the subsequent four months (80
days) — from the close on day 50 to the
close on day 130. It tells a familiar story
as stocks advanced but still lagged the
benchmark. Stocks jumped 3.61 percent,
on average, in the second to sixth month
after insider buying, but the median gain
of 1.51 percent is much smaller than both
the average and benchmark (3 percent).
Again, the discrepancy between aver-
age and median moves suggests individ-
ual stocks’ typical gains after insider pur-
chases are less dramatic than they seem.
The relationships among average, median,
and benchmark gains in Figures 4 and 5
are nearly identical, which suggests this
pattern lasts up to six months.
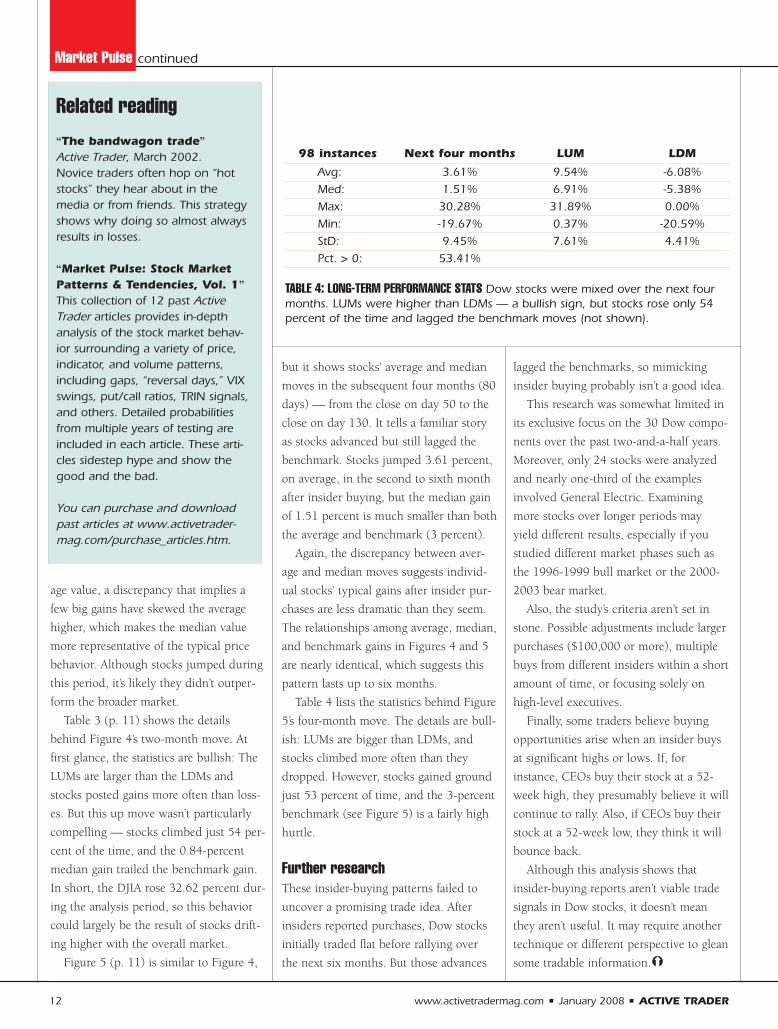
Table 4 lists the statistics behind Figure
5’s four-month move. The details are bull-
ish: LUMs are bigger than LDMs, and
stocks climbed more often than they
dropped. However, stocks gained ground
just 53 percent of time, and the 3-percent
benchmark (see Figure 5) is a fairly high
hurtle.
Further researchThese insider-buying patterns failed to
uncover a promising trade idea. After
insiders reported purchases, Dow stocks
initially traded flat before rallying over
the next six months. But those advances
lagged the benchmarks, so mimicking
insider buying probably isn’t a good idea.
This research was somewhat limited in
its exclusive focus on the 30 Dow compo-
nents over the past two-and-a-half years.
Moreover, only 24 stocks were analyzed
and nearly one-third of the examples
involved General Electric. Examining
more stocks over longer periods may
yield different results, especially if you
studied different market phases such as
the 1996-1999 bull market or the 2000-
2003 bear market.
Also, the study’s criteria aren’t set in
stone. Possible adjustments include larger
purchases ($100,000 or more), multiple
buys from different insiders within a short
amount of time, or focusing solely on
high-level executives.
Finally, some traders believe buying
opportunities arise when an insider buys
at significant highs or lows. If, for
instance, CEOs buy their stock at a 52-
week high, they presumably believe it will
continue to rally. Also, if CEOs buy their
stock at a 52-week low, they think it will
bounce back.
Although this analysis shows that
insider-buying reports aren’t viable trade
signals in Dow stocks, it doesn’t mean
they aren’t useful. It may require another
technique or different perspective to glean
some tradable information.!
Market Pulse continued
Related reading “The bandwagon trade”Active Trader, March 2002.Novice traders often hop on “hotstocks” they hear about in themedia or from friends. This strategyshows why doing so almost alwaysresults in losses.
“Market Pulse: Stock MarketPatterns & Tendencies, Vol. 1”This collection of 12 past ActiveTrader articles provides in-depthanalysis of the stock market behav-ior surrounding a variety of price,indicator, and volume patterns,including gaps, “reversal days,” VIXswings, put/call ratios, TRIN signals,and others. Detailed probabilitiesfrom multiple years of testing areincluded in each article. These arti-cles sidestep hype and show thegood and the bad.
You can purchase and download past articles at www.activetrader-mag.com/purchase_articles.htm.
98 instances Next four months LUM LDM
Avg: 3.61% 9.54% -6.08%Med: 1.51% 6.91% -5.38%Max: 30.28% 31.89% 0.00%Min: -19.67% 0.37% -20.59%StD: 9.45% 7.61% 4.41%Pct. > 0: 53.41%
TABLE 4: LONG-TERM PERFORMANCE STATS Dow stocks were mixed over the next fourmonths. LUMs were higher than LDMs — a bullish sign, but stocks rose only 54percent of the time and lagged the benchmark moves (not shown).
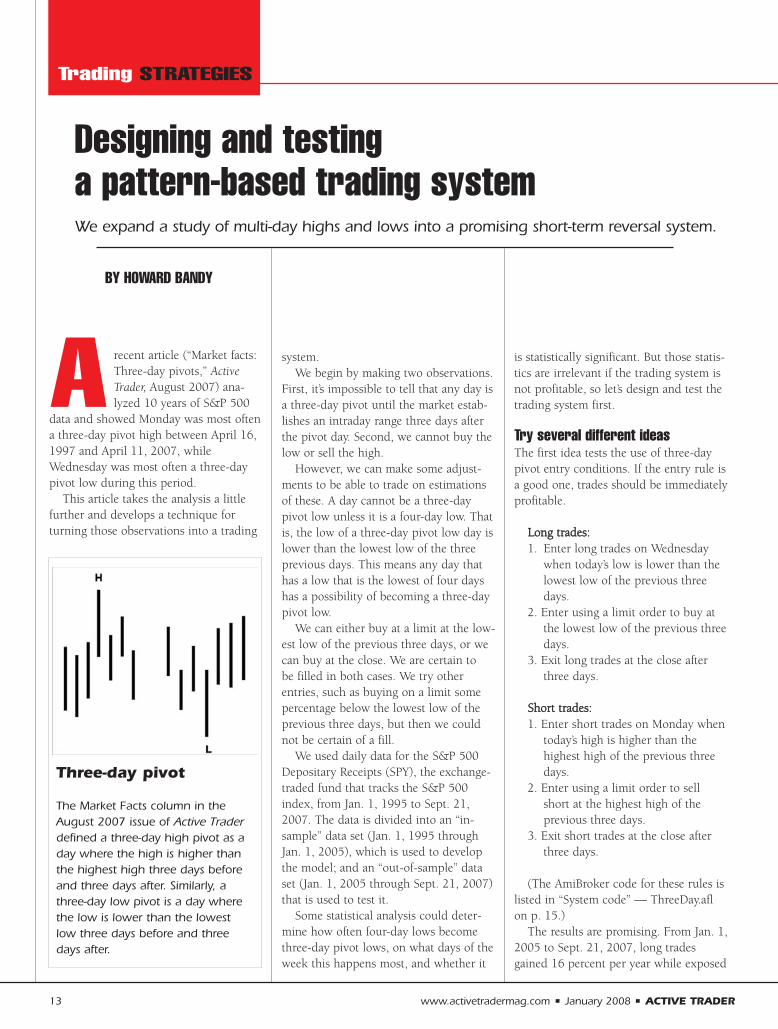
A recent article (“Market facts:Three-day pivots,” ActiveTrader, August 2007) ana-lyzed 10 years of S&P 500
data and showed Monday was most oftena three-day pivot high between April 16,1997 and April 11, 2007, whileWednesday was most often a three-daypivot low during this period.
This article takes the analysis a littlefurther and develops a technique forturning those observations into a trading
system.We begin by making two observations.
First, it’s impossible to tell that any day isa three-day pivot until the market estab-lishes an intraday range three days afterthe pivot day. Second, we cannot buy thelow or sell the high.
However, we can make some adjust-ments to be able to trade on estimationsof these. A day cannot be a three-daypivot low unless it is a four-day low. Thatis, the low of a three-day pivot low day islower than the lowest low of the threeprevious days. This means any day thathas a low that is the lowest of four dayshas a possibility of becoming a three-daypivot low.
We can either buy at a limit at the low-est low of the previous three days, or wecan buy at the close. We are certain to be filled in both cases. We try otherentries, such as buying on a limit somepercentage below the lowest low of theprevious three days, but then we couldnot be certain of a fill.
We used daily data for the S&P 500Depositary Receipts (SPY), the exchange-traded fund that tracks the S&P 500index, from Jan. 1, 1995 to Sept. 21,2007. The data is divided into an “in-sample” data set (Jan. 1, 1995 throughJan. 1, 2005), which is used to developthe model; and an “out-of-sample” dataset (Jan. 1, 2005 through Sept. 21, 2007)that is used to test it.
Some statistical analysis could deter-mine how often four-day lows becomethree-day pivot lows, on what days of theweek this happens most, and whether it
is statistically significant. But those statis-tics are irrelevant if the trading system isnot profitable, so let’s design and test thetrading system first.
Try several different ideasThe first idea tests the use of three-daypivot entry conditions. If the entry rule isa good one, trades should be immediatelyprofitable.
LLoonngg ttrraaddeess::1. Enter long trades on Wednesday
when today’s low is lower than the lowest low of the previous three days.
2. Enter using a limit order to buy at the lowest low of the previous three days.
3. Exit long trades at the close after three days.
SShhoorrtt ttrraaddeess::1. Enter short trades on Monday when
today’s high is higher than the highest high of the previous three days.
2. Enter using a limit order to sell short at the highest high of the previous three days.
3. Exit short trades at the close after three days.
(The AmiBroker code for these rules islisted in “System code” — ThreeDay.aflon p. 15.)
The results are promising. From Jan. 1,2005 to Sept. 21, 2007, long tradesgained 16 percent per year while exposed
13 www.activetradermag.com • January 2008 • ACTIVE TRADER
Designing and testing a pattern-based trading system
BY HOWARD BANDY
Trading STRATEGIES
We expand a study of multi-day highs and lows into a promising short-term reversal system.
Three-day pivot
The Market Facts column in theAugust 2007 issue of Active Traderdefined a three-day high pivot as aday where the high is higher thanthe highest high three days beforeand three days after. Similarly, athree-day low pivot is a day wherethe low is lower than the lowestlow three days before and threedays after.
18 percent of the time — a net risk-adjusted return (RAR) of 89 percent andan annual RAR of 32 percent per year.Short trades earned 0.5 percent whileexposed 18 percent of the time for anannual RAR of 1 percent. For all trades,the system climbed 16 percent whileexposed 35 percent of the time — anannual RAR of 16 percent. (See “Analysisdefinitions” for definitions of RAR,MaxDD, and K-ratio.)
Although no optimization was per-formed before testing this system, the arti-cle that inspired it was certainly the resultof data mining. Therefore, these tradingresults should be treated as in-sampleresults — and because in-sample resultsare unreliable in regard to future prof-itability, validation is advisable.
Validation is usually done by testingthe system on out-of-sample data — datathat has not been used during its devel-opment. Since there is no period of timethat has not been used in developing thesystem, data from other exchange-tradedfunds (ETFs), indices, and stocks will beused as the out-of-sample data.
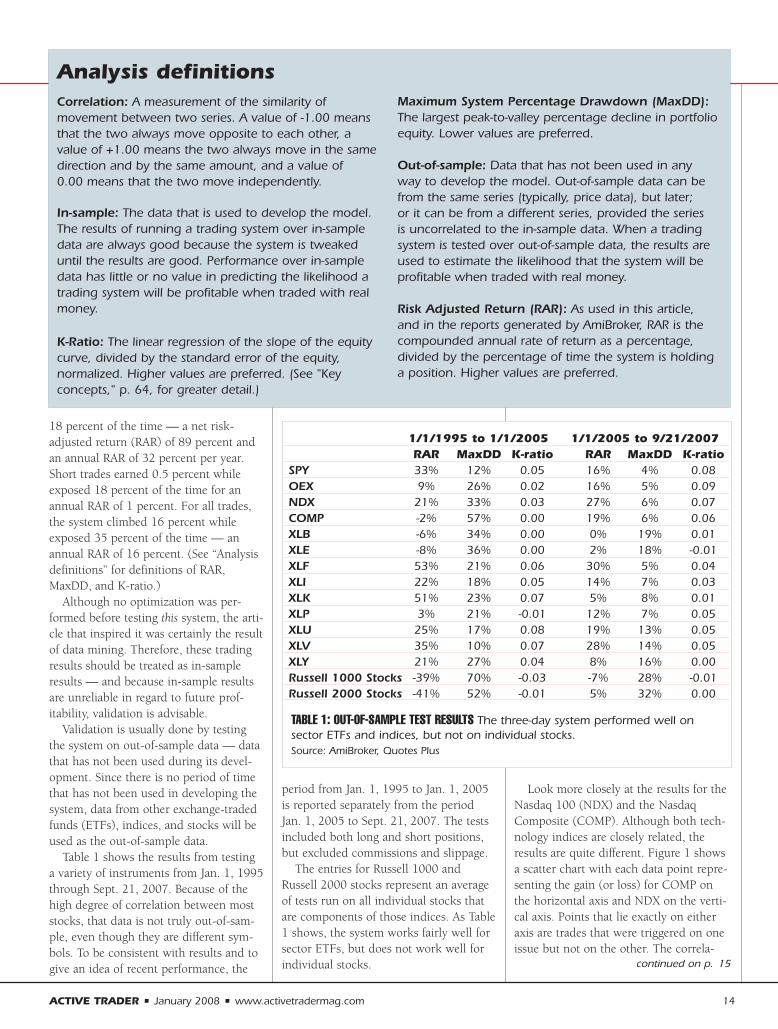
Table 1 shows the results from testinga variety of instruments from Jan. 1, 1995through Sept. 21, 2007. Because of thehigh degree of correlation between moststocks, that data is not truly out-of-sam-ple, even though they are different sym-bols. To be consistent with results and togive an idea of recent performance, the
period from Jan. 1, 1995 to Jan. 1, 2005is reported separately from the periodJan. 1, 2005 to Sept. 21, 2007. The testsincluded both long and short positions,but excluded commissions and slippage.
The entries for Russell 1000 andRussell 2000 stocks represent an averageof tests run on all individual stocks thatare components of those indices. As Table1 shows, the system works fairly well forsector ETFs, but does not work well forindividual stocks.
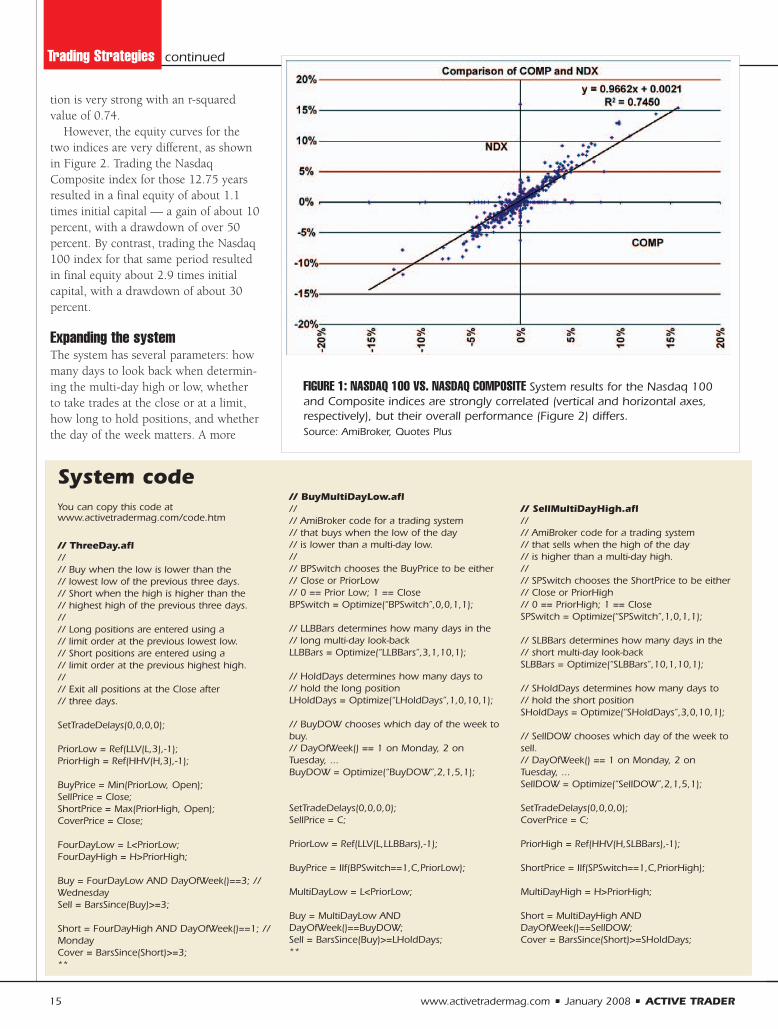
Look more closely at the results for theNasdaq 100 (NDX) and the NasdaqComposite (COMP). Although both tech-nology indices are closely related, theresults are quite different. Figure 1 showsa scatter chart with each data point repre-senting the gain (or loss) for COMP onthe horizontal axis and NDX on the verti-cal axis. Points that lie exactly on eitheraxis are trades that were triggered on oneissue but not on the other. The correla-
ACTIVE TRADER • January 2008 • www.activetradermag.com 14
continued on p. 15
Analysis definitionsCorrelation: A measurement of the similarity of movement between two series. A value of -1.00 meansthat the two always move opposite to each other, avalue of +1.00 means the two always move in the samedirection and by the same amount, and a value of 0.00 means that the two move independently.
In-sample: The data that is used to develop the model.The results of running a trading system over in-sampledata are always good because the system is tweakeduntil the results are good. Performance over in-sample data has little or no value in predicting the likelihood atrading system will be profitable when traded with realmoney.
K-Ratio: The linear regression of the slope of the equitycurve, divided by the standard error of the equity, normalized. Higher values are preferred. (See "Key concepts," p. 64, for greater detail.)
Maximum System Percentage Drawdown (MaxDD):The largest peak-to-valley percentage decline in portfolioequity. Lower values are preferred.
Out-of-sample: Data that has not been used in any way to develop the model. Out-of-sample data can befrom the same series (typically, price data), but later; or it can be from a different series, provided the series is uncorrelated to the in-sample data. When a tradingsystem is tested over out-of-sample data, the results areused to estimate the likelihood that the system will beprofitable when traded with real money.
Risk Adjusted Return (RAR): As used in this article, and in the reports generated by AmiBroker, RAR is thecompounded annual rate of return as a percentage,divided by the percentage of time the system is holdinga position. Higher values are preferred.
1/1/1995 to 1/1/2005 1/1/2005 to 9/21/2007RAR MaxDD K-ratio RAR MaxDD K-ratio
SPY 33% 12% 0.05 16% 4% 0.08OEX 9% 26% 0.02 16% 5% 0.09NDX 21% 33% 0.03 27% 6% 0.07COMP -2% 57% 0.00 19% 6% 0.06XLB -6% 34% 0.00 0% 19% 0.01XLE -8% 36% 0.00 2% 18% -0.01XLF 53% 21% 0.06 30% 5% 0.04XLI 22% 18% 0.05 14% 7% 0.03XLK 51% 23% 0.07 5% 8% 0.01XLP 3% 21% -0.01 12% 7% 0.05XLU 25% 17% 0.08 19% 13% 0.05XLV 35% 10% 0.07 28% 14% 0.05XLY 21% 27% 0.04 8% 16% 0.00Russell 1000 Stocks -39% 70% -0.03 -7% 28% -0.01Russell 2000 Stocks -41% 52% -0.01 5% 32% 0.00
TABLE 1: OUT-OF-SAMPLE TEST RESULTS The three-day system performed well on sector ETFs and indices, but not on individual stocks.Source: AmiBroker, Quotes Plus
15 www.activetradermag.com • January 2008 • ACTIVE TRADER
Trading Strategies continued
System codeYou can copy this code at www.activetradermag.com/code.htm
// ThreeDay.afl//// Buy when the low is lower than the // lowest low of the previous three days.// Short when the high is higher than the// highest high of the previous three days.//// Long positions are entered using a // limit order at the previous lowest low.// Short positions are entered using a // limit order at the previous highest high.//// Exit all positions at the Close after // three days.
SetTradeDelays(0,0,0,0);
PriorLow = Ref(LLV(L,3),-1);PriorHigh = Ref(HHV(H,3),-1);
BuyPrice = Min(PriorLow, Open);SellPrice = Close;ShortPrice = Max(PriorHigh, Open);CoverPrice = Close;
FourDayLow = L<PriorLow;FourDayHigh = H>PriorHigh;
Buy = FourDayLow AND DayOfWeek()==3; //WednesdaySell = BarsSince(Buy)>=3;
Short = FourDayHigh AND DayOfWeek()==1; //MondayCover = BarsSince(Short)>=3;**
// BuyMultiDayLow.afl//// AmiBroker code for a trading system// that buys when the low of the day// is lower than a multi-day low.//// BPSwitch chooses the BuyPrice to be either// Close or PriorLow// 0 == Prior Low; 1 == CloseBPSwitch = Optimize(“BPSwitch”,0,0,1,1);
// LLBBars determines how many days in the // long multi-day look-backLLBBars = Optimize(“LLBBars”,3,1,10,1);
// HoldDays determines how many days to// hold the long positionLHoldDays = Optimize(“LHoldDays”,1,0,10,1);
// BuyDOW chooses which day of the week tobuy.// DayOfWeek() == 1 on Monday, 2 onTuesday, ...BuyDOW = Optimize(“BuyDOW”,2,1,5,1);
SetTradeDelays(0,0,0,0);SellPrice = C;
PriorLow = Ref(LLV(L,LLBBars),-1);
BuyPrice = IIf(BPSwitch==1,C,PriorLow);
MultiDayLow = L<PriorLow;
Buy = MultiDayLow ANDDayOfWeek()==BuyDOW;Sell = BarsSince(Buy)>=LHoldDays;**
// SellMultiDayHigh.afl//// AmiBroker code for a trading system// that sells when the high of the day// is higher than a multi-day high.//// SPSwitch chooses the ShortPrice to be either// Close or PriorHigh// 0 == PriorHigh; 1 == CloseSPSwitch = Optimize(“SPSwitch”,1,0,1,1);
// SLBBars determines how many days in the // short multi-day look-backSLBBars = Optimize(“SLBBars”,10,1,10,1);
// SHoldDays determines how many days to// hold the short positionSHoldDays = Optimize(“SHoldDays”,3,0,10,1);
// SellDOW chooses which day of the week tosell.// DayOfWeek() == 1 on Monday, 2 onTuesday, ...SellDOW = Optimize(“SellDOW”,2,1,5,1);
SetTradeDelays(0,0,0,0);CoverPrice = C;
PriorHigh = Ref(HHV(H,SLBBars),-1);
ShortPrice = IIf(SPSwitch==1,C,PriorHigh);
MultiDayHigh = H>PriorHigh;
Short = MultiDayHigh ANDDayOfWeek()==SellDOW;Cover = BarsSince(Short)>=SHoldDays;
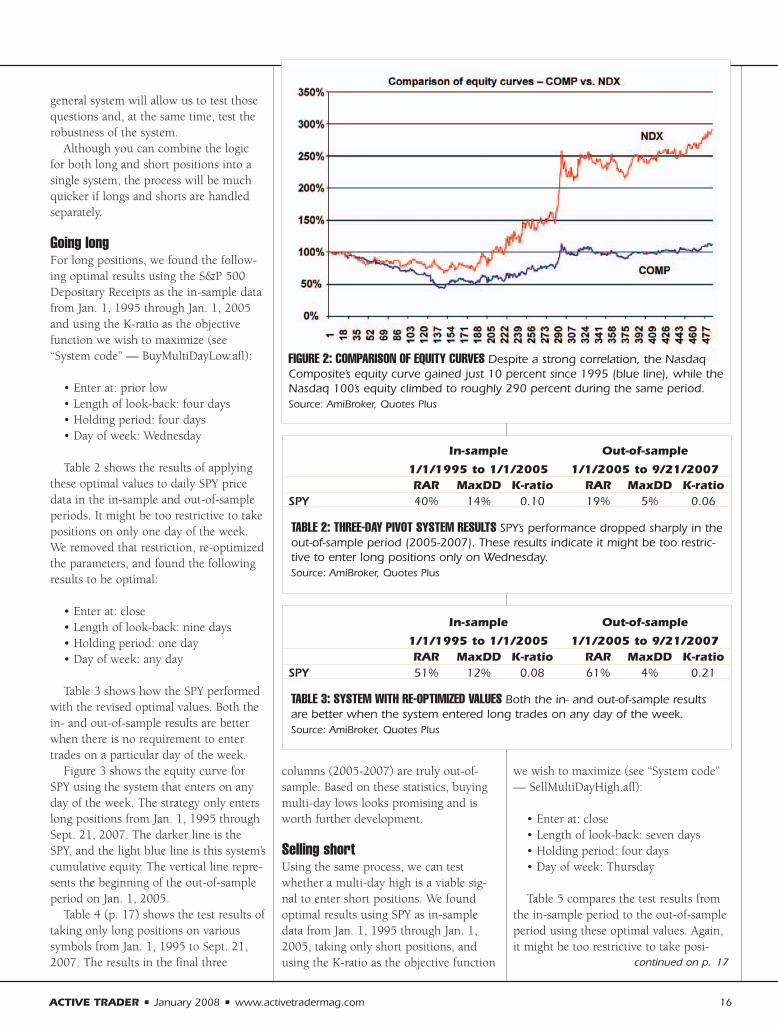
tion is very strong with an r-squaredvalue of 0.74.
However, the equity curves for thetwo indices are very different, as shownin Figure 2. Trading the NasdaqComposite index for those 12.75 yearsresulted in a final equity of about 1.1times initial capital — a gain of about 10percent, with a drawdown of over 50percent. By contrast, trading the Nasdaq100 index for that same period resultedin final equity about 2.9 times initialcapital, with a drawdown of about 30percent.
Expanding the systemThe system has several parameters: howmany days to look back when determin-ing the multi-day high or low, whetherto take trades at the close or at a limit,how long to hold positions, and whetherthe day of the week matters. A more
FIGURE 1: NASDAQ 100 VS. NASDAQ COMPOSITE System results for the Nasdaq 100and Composite indices are strongly correlated (vertical and horizontal axes,respectively), but their overall performance (Figure 2) differs.Source: AmiBroker, Quotes Plus
general system will allow us to test thosequestions and, at the same time, test therobustness of the system.
Although you can combine the logicfor both long and short positions into asingle system, the process will be muchquicker if longs and shorts are handledseparately.
Going longFor long positions, we found the follow-ing optimal results using the S&P 500Depositary Receipts as the in-sample datafrom Jan. 1, 1995 through Jan. 1, 2005and using the K-ratio as the objectivefunction we wish to maximize (see“System code” — BuyMultiDayLow.afl):
• Enter at: prior low• Length of look-back: four days• Holding period: four days• Day of week: Wednesday
Table 2 shows the results of applyingthese optimal values to daily SPY pricedata in the in-sample and out-of-sampleperiods. It might be too restrictive to takepositions on only one day of the week.We removed that restriction, re-optimizedthe parameters, and found the followingresults to be optimal:
• Enter at: close• Length of look-back: nine days• Holding period: one day• Day of week: any day
Table 3 shows how the SPY performedwith the revised optimal values. Both thein- and out-of-sample results are betterwhen there is no requirement to entertrades on a particular day of the week.
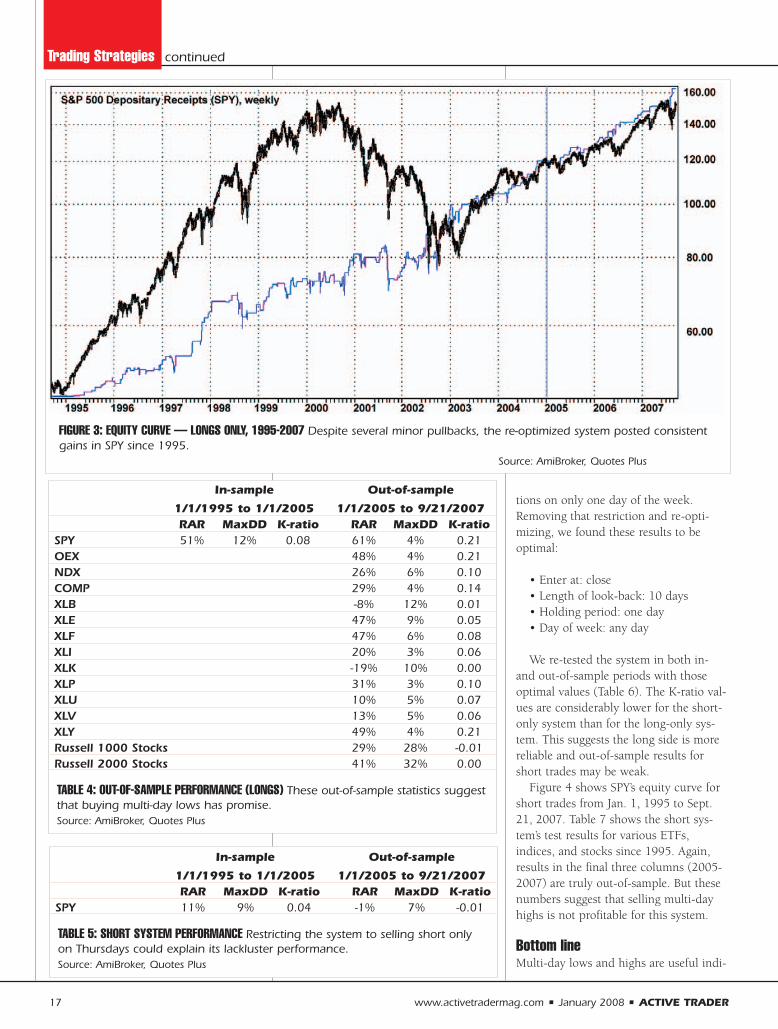
Figure 3 shows the equity curve forSPY using the system that enters on anyday of the week. The strategy only enterslong positions from Jan. 1, 1995 throughSept. 21, 2007. The darker line is theSPY, and the light blue line is this system’scumulative equity. The vertical line repre-sents the beginning of the out-of-sampleperiod on Jan. 1, 2005.
Table 4 (p. 17) shows the test results oftaking only long positions on varioussymbols from Jan. 1, 1995 to Sept. 21,2007. The results in the final three
columns (2005-2007) are truly out-of-sample. Based on these statistics, buyingmulti-day lows looks promising and isworth further development.
Selling shortUsing the same process, we can testwhether a multi-day high is a viable sig-nal to enter short positions. We foundoptimal results using SPY as in-sampledata from Jan. 1, 1995 through Jan. 1,2005, taking only short positions, andusing the K-ratio as the objective function
we wish to maximize (see “System code”— SellMultiDayHigh.afl):
• Enter at: close• Length of look-back: seven days• Holding period: four days• Day of week: Thursday
Table 5 compares the test results fromthe in-sample period to the out-of-sampleperiod using these optimal values. Again,it might be too restrictive to take posi-
ACTIVE TRADER • January 2008 • www.activetradermag.com 16
continued on p. 17
FIGURE 2: COMPARISON OF EQUITY CURVES Despite a strong correlation, the NasdaqComposite’s equity curve gained just 10 percent since 1995 (blue line), while theNasdaq 100’s equity climbed to roughly 290 percent during the same period.Source: AmiBroker, Quotes Plus
In-sample Out-of-sample
1/1/1995 to 1/1/2005 1/1/2005 to 9/21/2007RAR MaxDD K-ratio RAR MaxDD K-ratio
SPY 40% 14% 0.10 19% 5% 0.06
TABLE 2: THREE-DAY PIVOT SYSTEM RESULTS SPY’s performance dropped sharply in theout-of-sample period (2005-2007). These results indicate it might be too restric-tive to enter long positions only on Wednesday. Source: AmiBroker, Quotes Plus
In-sample Out-of-sample
1/1/1995 to 1/1/2005 1/1/2005 to 9/21/2007RAR MaxDD K-ratio RAR MaxDD K-ratio
SPY 51% 12% 0.08 61% 4% 0.21
TABLE 3: SYSTEM WITH RE-OPTIMIZED VALUES Both the in- and out-of-sample resultsare better when the system entered long trades on any day of the week.Source: AmiBroker, Quotes Plus
17 www.activetradermag.com • January 2008 • ACTIVE TRADER
FIGURE 3: EQUITY CURVE — LONGS ONLY, 1995-2007 Despite several minor pullbacks, the re-optimized system posted consistentgains in SPY since 1995.
Source: AmiBroker, Quotes Plus
tions on only one day of the week.Removing that restriction and re-opti-mizing, we found these results to beoptimal:
• Enter at: close• Length of look-back: 10 days• Holding period: one day• Day of week: any day
We re-tested the system in both in-and out-of-sample periods with thoseoptimal values (Table 6). The K-ratio val-ues are considerably lower for the short-only system than for the long-only sys-tem. This suggests the long side is morereliable and out-of-sample results forshort trades may be weak.
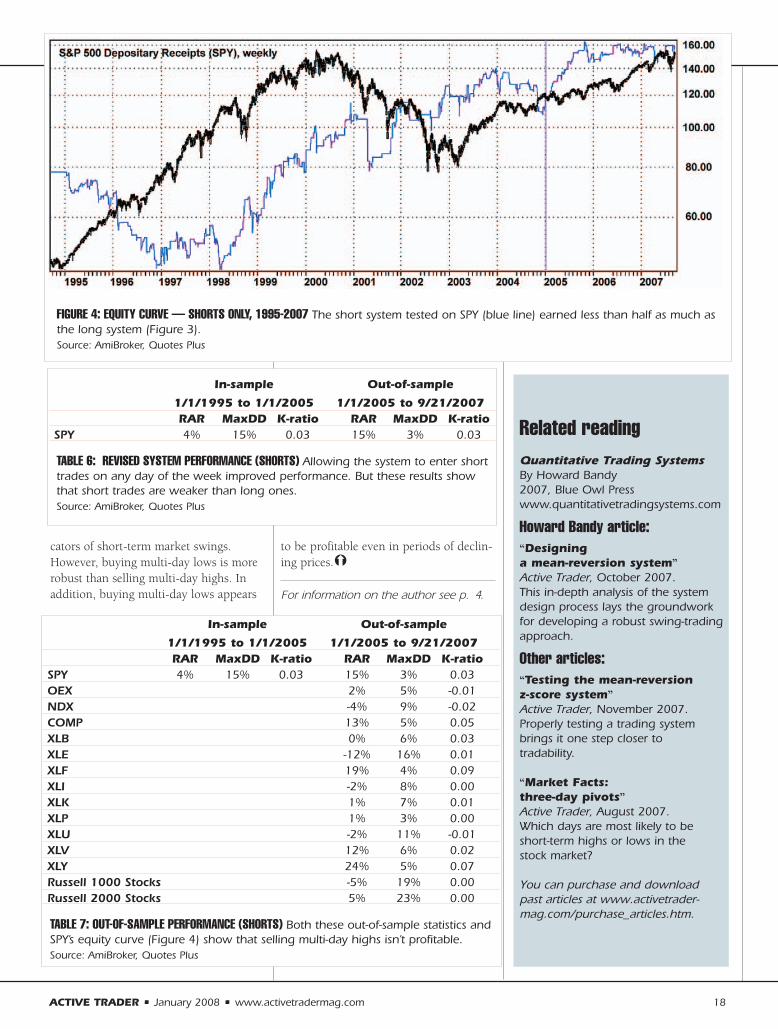
Figure 4 shows SPY’s equity curve forshort trades from Jan. 1, 1995 to Sept.21, 2007. Table 7 shows the short sys-tem’s test results for various ETFs,indices, and stocks since 1995. Again,results in the final three columns (2005-2007) are truly out-of-sample. But thesenumbers suggest that selling multi-dayhighs is not profitable for this system.
Bottom lineMulti-day lows and highs are useful indi-
Trading Strategies continued
In-sample Out-of-sample
1/1/1995 to 1/1/2005 1/1/2005 to 9/21/2007RAR MaxDD K-ratio RAR MaxDD K-ratio
SPY 11% 9% 0.04 -1% 7% -0.01
TABLE 5: SHORT SYSTEM PERFORMANCE Restricting the system to selling short onlyon Thursdays could explain its lackluster performance. Source: AmiBroker, Quotes Plus
In-sample Out-of-sample
1/1/1995 to 1/1/2005 1/1/2005 to 9/21/2007RAR MaxDD K-ratio RAR MaxDD K-ratio
SPY 51% 12% 0.08 61% 4% 0.21OEX 48% 4% 0.21NDX 26% 6% 0.10COMP 29% 4% 0.14XLB -8% 12% 0.01XLE 47% 9% 0.05XLF 47% 6% 0.08XLI 20% 3% 0.06XLK -19% 10% 0.00XLP 31% 3% 0.10XLU 10% 5% 0.07XLV 13% 5% 0.06XLY 49% 4% 0.21Russell 1000 Stocks 29% 28% -0.01Russell 2000 Stocks 41% 32% 0.00
TABLE 4: OUT-OF-SAMPLE PERFORMANCE (LONGS) These out-of-sample statistics suggest that buying multi-day lows has promise. Source: AmiBroker, Quotes Plus
cators of short-term market swings.However, buying multi-day lows is morerobust than selling multi-day highs. Inaddition, buying multi-day lows appears
to be profitable even in periods of declin-ing prices.!
For information on the author see p. 4.
ACTIVE TRADER • January 2008 • www.activetradermag.com 18
Related reading Quantitative Trading SystemsBy Howard Bandy2007, Blue Owl Press www.quantitativetradingsystems.com
Howard Bandy article:“Designing a mean-reversion system”Active Trader, October 2007.This in-depth analysis of the systemdesign process lays the groundworkfor developing a robust swing-tradingapproach.
Other articles:“Testing the mean-reversion z-score system”Active Trader, November 2007.Properly testing a trading systembrings it one step closer to tradability.
“Market Facts: three-day pivots” Active Trader, August 2007.Which days are most likely to beshort-term highs or lows in the stock market?
You can purchase and download past articles at www.activetrader-mag.com/purchase_articles.htm.
In-sample Out-of-sample
1/1/1995 to 1/1/2005 1/1/2005 to 9/21/2007RAR MaxDD K-ratio RAR MaxDD K-ratio
SPY 4% 15% 0.03 15% 3% 0.03OEX 2% 5% -0.01NDX -4% 9% -0.02COMP 13% 5% 0.05XLB 0% 6% 0.03XLE -12% 16% 0.01XLF 19% 4% 0.09XLI -2% 8% 0.00XLK 1% 7% 0.01XLP 1% 3% 0.00XLU -2% 11% -0.01XLV 12% 6% 0.02XLY 24% 5% 0.07Russell 1000 Stocks -5% 19% 0.00Russell 2000 Stocks 5% 23% 0.00
TABLE 7: OUT-OF-SAMPLE PERFORMANCE (SHORTS) Both these out-of-sample statistics andSPY’s equity curve (Figure 4) show that selling multi-day highs isn’t profitable. Source: AmiBroker, Quotes Plus
FIGURE 4: EQUITY CURVE — SHORTS ONLY, 1995-2007 The short system tested on SPY (blue line) earned less than half as much asthe long system (Figure 3). Source: AmiBroker, Quotes Plus
In-sample Out-of-sample
1/1/1995 to 1/1/2005 1/1/2005 to 9/21/2007RAR MaxDD K-ratio RAR MaxDD K-ratio
SPY 4% 15% 0.03 15% 3% 0.03
TABLE 6: REVISED SYSTEM PERFORMANCE (SHORTS) Allowing the system to enter shorttrades on any day of the week improved performance. But these results showthat short trades are weaker than long ones.Source: AmiBroker, Quotes Plus
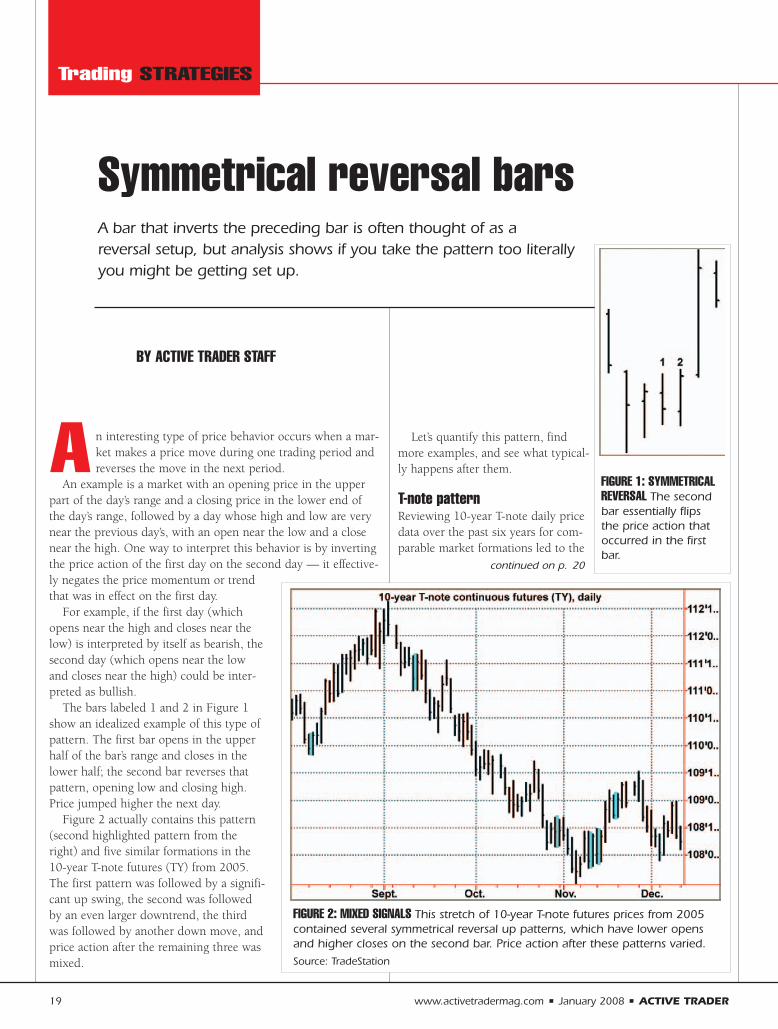
A n interesting type of price behavior occurs when a mar-ket makes a price move during one trading period andreverses the move in the next period.
An example is a market with an opening price in the upperpart of the day’s range and a closing price in the lower end ofthe day’s range, followed by a day whose high and low are verynear the previous day’s, with an open near the low and a closenear the high. One way to interpret this behavior is by invertingthe price action of the first day on the second day — it effective-ly negates the price momentum or trendthat was in effect on the first day.
For example, if the first day (whichopens near the high and closes near thelow) is interpreted by itself as bearish, thesecond day (which opens near the lowand closes near the high) could be inter-preted as bullish.
The bars labeled 1 and 2 in Figure 1show an idealized example of this type ofpattern. The first bar opens in the upperhalf of the bar’s range and closes in thelower half; the second bar reverses thatpattern, opening low and closing high.Price jumped higher the next day.
Figure 2 actually contains this pattern(second highlighted pattern from theright) and five similar formations in the10-year T-note futures (TY) from 2005.The first pattern was followed by a signifi-cant up swing, the second was followedby an even larger downtrend, the thirdwas followed by another down move, andprice action after the remaining three wasmixed.
Let’s quantify this pattern, findmore examples, and see what typical-ly happens after them.
T-note patternReviewing 10-year T-note daily pricedata over the past six years for com-parable market formations led to the
19 www.activetradermag.com • January 2008 • ACTIVE TRADER
Symmetrical reversal bars
BY ACTIVE TRADER STAFF
FIGURE 2: MIXED SIGNALS This stretch of 10-year T-note futures prices from 2005contained several symmetrical reversal up patterns, which have lower opensand higher closes on the second bar. Price action after these patterns varied.Source: TradeStation
Trading STRATEGIES
A bar that inverts the preceding bar is often thought of as a reversal setup, but analysis shows if you take the pattern too literallyyou might be getting set up.
FIGURE 1: SYMMETRICALREVERSAL The secondbar essentially flips the price action thatoccurred in the firstbar.
continued on p. 20
20 www.activetradermag.com • January 2008 • ACTIVE TRADER
Trading Strategies continued
following pattern definition, which willbe referred to as symmetrical reversalbars:
1. Today’s high and today’s low are both within 2/32nds of yesterday’s high and low.
2. Yesterday’s open is in the top half of the day’s range and its close is in the bottom half of the day’s range.
3. Today’s open is in the bottom half of the day’s range and its close is in the top half of the day’s range.
As simple formulas, the rules are:
1. ABS(H1 - H0) < 0.06252. ABS(L1 - L0) < 0.06253. (O1-L1)/(H1-L1) > 0.50 4. (C1-L1)/(H1-L1) < 0.505. (O0-L0)/(H0-L0) < 0.50 6. (C0-L0)/(H0-L0) > 0.50
where
L = low of the dayH = high of the dayC = close of the day
ABS = absolute valueSubscripts0,1.., denote today, one day ago, etc.
Note: T-note prices trade in 32nds and halves of 32nds; prices have been converted to decimal equivalents for allthe calculations. (For T-note futures pricing conventions, see “Treasury refresher” in “Key concepts” on p. 64.)Code can be copied from www.active-tradermag.com/code.htm.
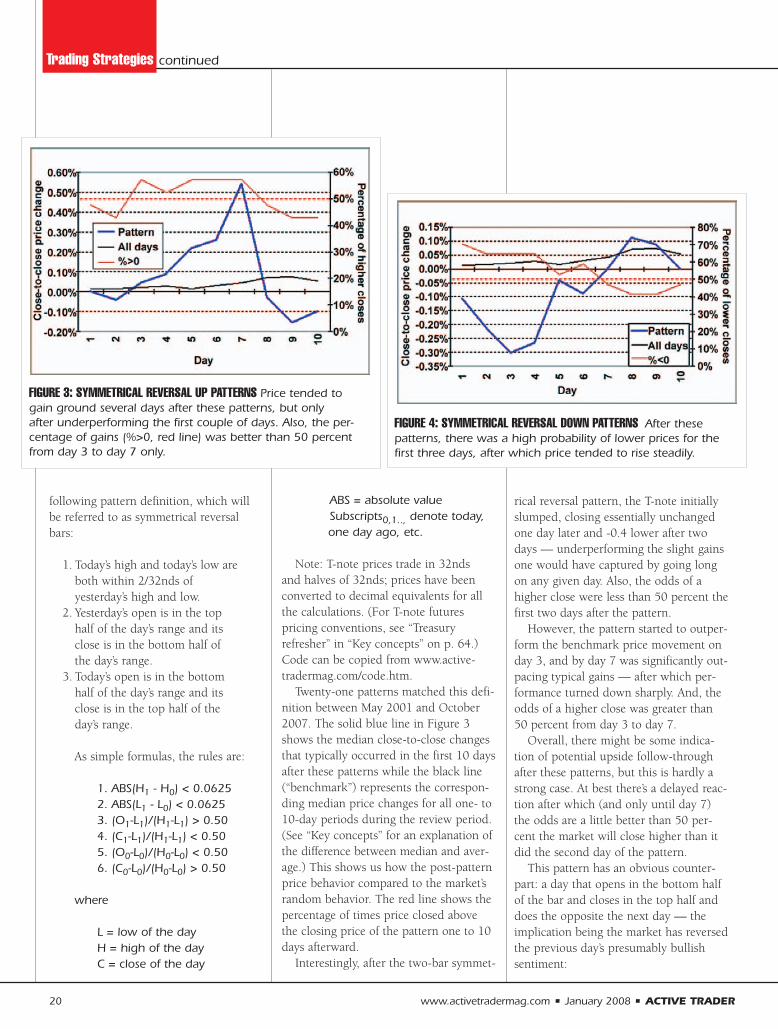
Twenty-one patterns matched this defi-nition between May 2001 and October2007. The solid blue line in Figure 3shows the median close-to-close changesthat typically occurred in the first 10 daysafter these patterns while the black line(“benchmark”) represents the correspon-ding median price changes for all one- to10-day periods during the review period.(See “Key concepts” for an explanation ofthe difference between median and aver-age.) This shows us how the post-patternprice behavior compared to the market’srandom behavior. The red line shows thepercentage of times price closed abovethe closing price of the pattern one to 10days afterward.
Interestingly, after the two-bar symmet-
rical reversal pattern, the T-note initiallyslumped, closing essentially unchangedone day later and -0.4 lower after twodays — underperforming the slight gainsone would have captured by going longon any given day. Also, the odds of ahigher close were less than 50 percent thefirst two days after the pattern.
However, the pattern started to outper-form the benchmark price movement onday 3, and by day 7 was significantly out-pacing typical gains — after which per-formance turned down sharply. And, theodds of a higher close was greater than50 percent from day 3 to day 7.
Overall, there might be some indica-tion of potential upside follow-throughafter these patterns, but this is hardly astrong case. At best there’s a delayed reac-tion after which (and only until day 7)the odds are a little better than 50 per-cent the market will close higher than itdid the second day of the pattern.
This pattern has an obvious counter-part: a day that opens in the bottom halfof the bar and closes in the top half anddoes the opposite the next day — theimplication being the market has reversedthe previous day’s presumably bullishsentiment:
FIGURE 3: SYMMETRICAL REVERSAL UP PATTERNS Price tended togain ground several days after these patterns, but only after underperforming the first couple of days. Also, the per-centage of gains (%>0, red line) was better than 50 percentfrom day 3 to day 7 only.
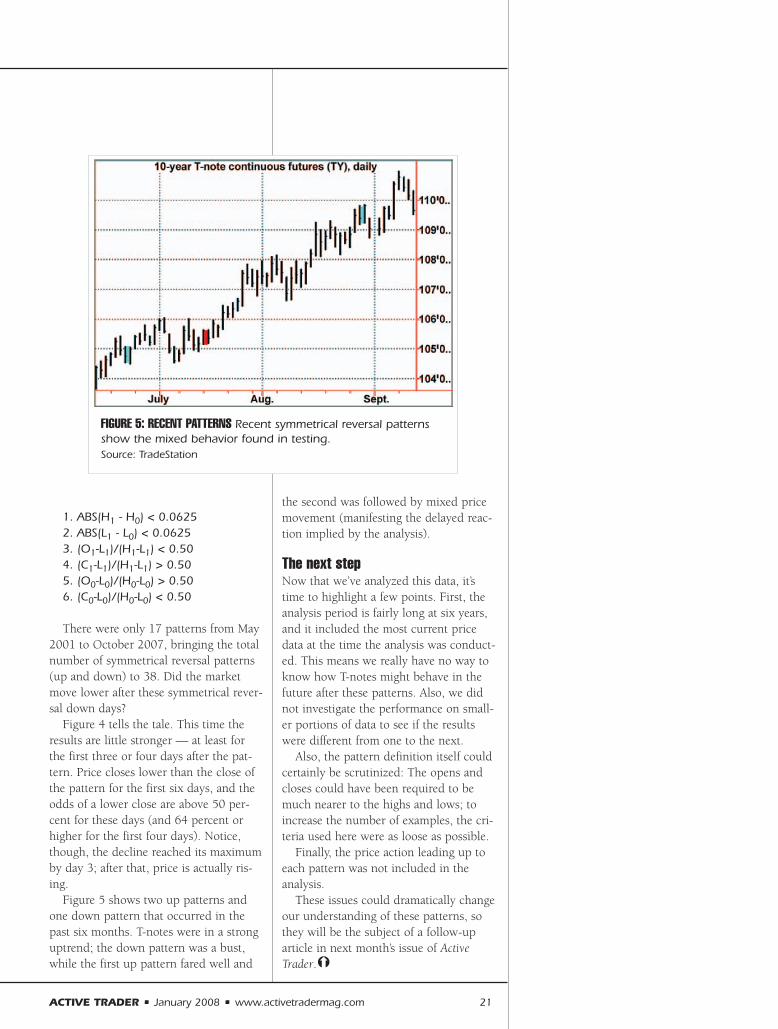
FIGURE 4: SYMMETRICAL REVERSAL DOWN PATTERNS After these patterns, there was a high probability of lower prices for the first three days, after which price tended to rise steadily.
1. ABS(H1 - H0) < 0.06252. ABS(L1 - L0) < 0.06253. (O1-L1)/(H1-L1) < 0.50 4. (C1-L1)/(H1-L1) > 0.505. (O0-L0)/(H0-L0) > 0.50 6. (C0-L0)/(H0-L0) < 0.50
There were only 17 patterns from May2001 to October 2007, bringing the totalnumber of symmetrical reversal patterns(up and down) to 38. Did the marketmove lower after these symmetrical rever-sal down days?
Figure 4 tells the tale. This time theresults are little stronger — at least forthe first three or four days after the pat-tern. Price closes lower than the close ofthe pattern for the first six days, and theodds of a lower close are above 50 per-cent for these days (and 64 percent orhigher for the first four days). Notice,though, the decline reached its maximumby day 3; after that, price is actually ris-ing.
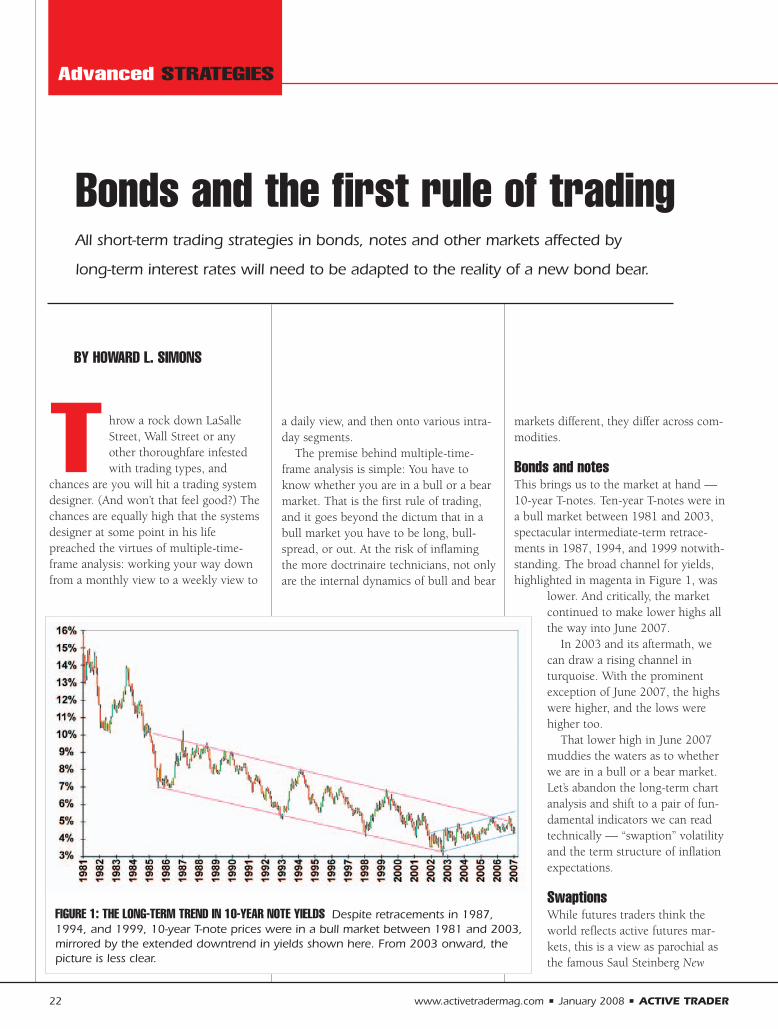
Figure 5 shows two up patterns andone down pattern that occurred in thepast six months. T-notes were in a stronguptrend; the down pattern was a bust,while the first up pattern fared well and
the second was followed by mixed pricemovement (manifesting the delayed reac-tion implied by the analysis).
The next stepNow that we’ve analyzed this data, it’stime to highlight a few points. First, theanalysis period is fairly long at six years,and it included the most current pricedata at the time the analysis was conduct-ed. This means we really have no way toknow how T-notes might behave in thefuture after these patterns. Also, we didnot investigate the performance on small-er portions of data to see if the resultswere different from one to the next.
Also, the pattern definition itself couldcertainly be scrutinized: The opens andcloses could have been required to bemuch nearer to the highs and lows; toincrease the number of examples, the cri-teria used here were as loose as possible.
Finally, the price action leading up toeach pattern was not included in theanalysis.
These issues could dramatically changeour understanding of these patterns, sothey will be the subject of a follow-uparticle in next month’s issue of ActiveTrader.!
FIGURE 5: RECENT PATTERNS Recent symmetrical reversal patternsshow the mixed behavior found in testing. Source: TradeStation
ACTIVE TRADER • January 2008 • www.activetradermag.com 21
T hrow a rock down LaSalleStreet, Wall Street or anyother thoroughfare infestedwith trading types, and
chances are you will hit a trading systemdesigner. (And won’t that feel good?) Thechances are equally high that the systemsdesigner at some point in his lifepreached the virtues of multiple-time-frame analysis: working your way downfrom a monthly view to a weekly view to
a daily view, and then onto various intra-day segments.
The premise behind multiple-time-frame analysis is simple: You have toknow whether you are in a bull or a bearmarket. That is the first rule of trading,and it goes beyond the dictum that in abull market you have to be long, bull-spread, or out. At the risk of inflamingthe more doctrinaire technicians, not onlyare the internal dynamics of bull and bear
markets different, they differ across com-modities.
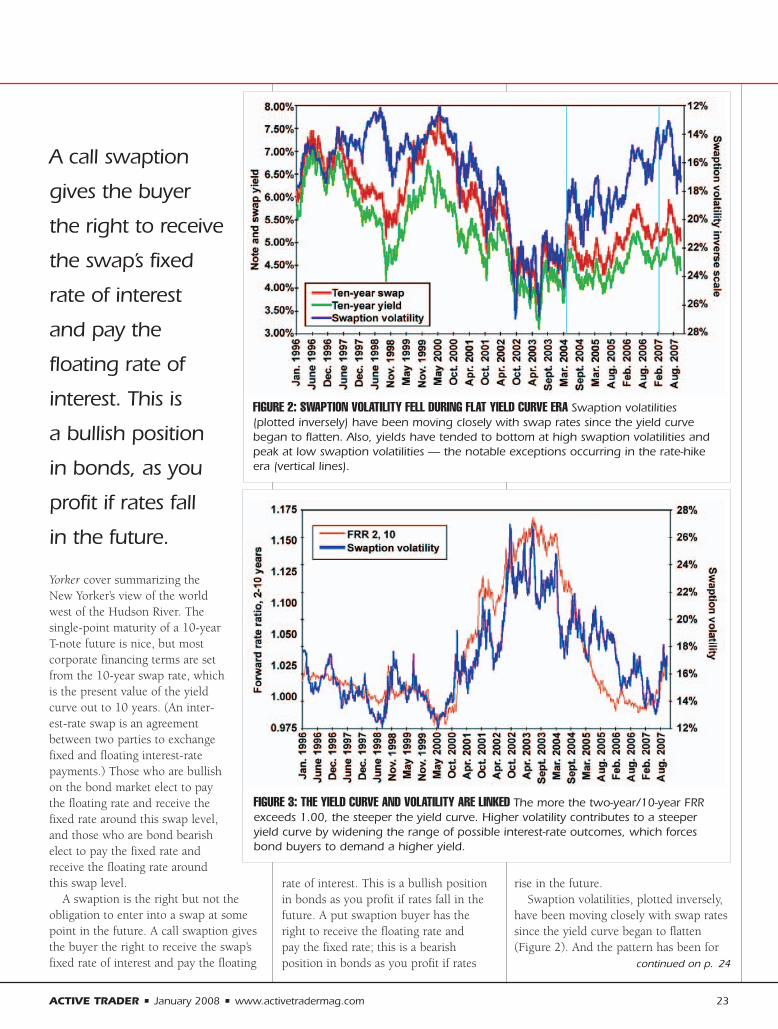
Bonds and notesThis brings us to the market at hand —10-year T-notes. Ten-year T-notes were ina bull market between 1981 and 2003,spectacular intermediate-term retrace-ments in 1987, 1994, and 1999 notwith-standing. The broad channel for yields,highlighted in magenta in Figure 1, was
lower. And critically, the marketcontinued to make lower highs allthe way into June 2007.
In 2003 and its aftermath, wecan draw a rising channel inturquoise. With the prominentexception of June 2007, the highswere higher, and the lows werehigher too.
That lower high in June 2007muddies the waters as to whetherwe are in a bull or a bear market.Let’s abandon the long-term chartanalysis and shift to a pair of fun-damental indicators we can readtechnically — “swaption” volatilityand the term structure of inflationexpectations.
SwaptionsWhile futures traders think theworld reflects active futures mar-kets, this is a view as parochial asthe famous Saul Steinberg New
22 www.activetradermag.com • January 2008 • ACTIVE TRADER
Bonds and the first rule of trading
BY HOWARD L. SIMONS
Advanced STRATEGIES
All short-term trading strategies in bonds, notes and other markets affected by
long-term interest rates will need to be adapted to the reality of a new bond bear.
FIGURE 1: THE LONG-TERM TREND IN 10-YEAR NOTE YIELDS Despite retracements in 1987,1994, and 1999, 10-year T-note prices were in a bull market between 1981 and 2003,mirrored by the extended downtrend in yields shown here. From 2003 onward, thepicture is less clear.
Yorker cover summarizing theNew Yorker’s view of the worldwest of the Hudson River. Thesingle-point maturity of a 10-yearT-note future is nice, but mostcorporate financing terms are setfrom the 10-year swap rate, whichis the present value of the yieldcurve out to 10 years. (An inter-est-rate swap is an agreementbetween two parties to exchangefixed and floating interest-ratepayments.) Those who are bullishon the bond market elect to paythe floating rate and receive thefixed rate around this swap level,and those who are bond bearishelect to pay the fixed rate andreceive the floating rate aroundthis swap level.
A swaption is the right but not theobligation to enter into a swap at somepoint in the future. A call swaption givesthe buyer the right to receive the swap’sfixed rate of interest and pay the floating
rate of interest. This is a bullish positionin bonds as you profit if rates fall in thefuture. A put swaption buyer has theright to receive the floating rate and pay the fixed rate; this is a bearish position in bonds as you profit if rates
rise in the future.Swaption volatilities, plotted inversely,
have been moving closely with swap ratessince the yield curve began to flatten(Figure 2). And the pattern has been for
ACTIVE TRADER • January 2008 • www.activetradermag.com 23
continued on p. 24
FIGURE 3: THE YIELD CURVE AND VOLATILITY ARE LINKED The more the two-year/10-year FRRexceeds 1.00, the steeper the yield curve. Higher volatility contributes to a steeperyield curve by widening the range of possible interest-rate outcomes, which forcesbond buyers to demand a higher yield.
A call swaption
gives the buyer
the right to receive
the swap’s fixed
rate of interest
and pay the
floating rate of
interest. This is
a bullish position
in bonds, as you
profit if rates fall
in the future.
FIGURE 2: SWAPTION VOLATILITY FELL DURING FLAT YIELD CURVE ERA Swaption volatilities (plotted inversely) have been moving closely with swap rates since the yield curvebegan to flatten. Also, yields have tended to bottom at high swaption volatilities andpeak at low swaption volatilities — the notable exceptions occurring in the rate-hikeera (vertical lines).
yields to have bottomed at high swaptionvolatilities and peaked at low swaptionvolatilities.
A major divergence occurred betweenthe two turquoise vertical lines: Swaptionvolatility plunged while both Treasury
and swap rates stayed relatively low. Thiswas the period when the yield curve wasflattening and inverting while the FederalReserve made 17 consecutive quarter-point rate increases.
We can highlight the strong relation-
ship between the shape of the yield curveand swaption volatility (Figure 3). Theyield curve is measured by the forwardrate ratio (FRR) between two and 10years; this is the rate at which you canlock in borrowing for eight years startingtwo years from now, divided by the 10-year rate itself. The more FRR exceeds1.00, the steeper the yield curve.
Higher volatility contributes to a steep-er yield curve as it widens the range ofpossible interest rate outcomes and forcesbond buyers to demand a higher yield ascompensation. This relationship is sostrong that any increase in swaptionvolatility will push the long end of theyield curve higher and lead to higherbond yields — lower prices for futurestraders used to thinking in these terms —as a result.
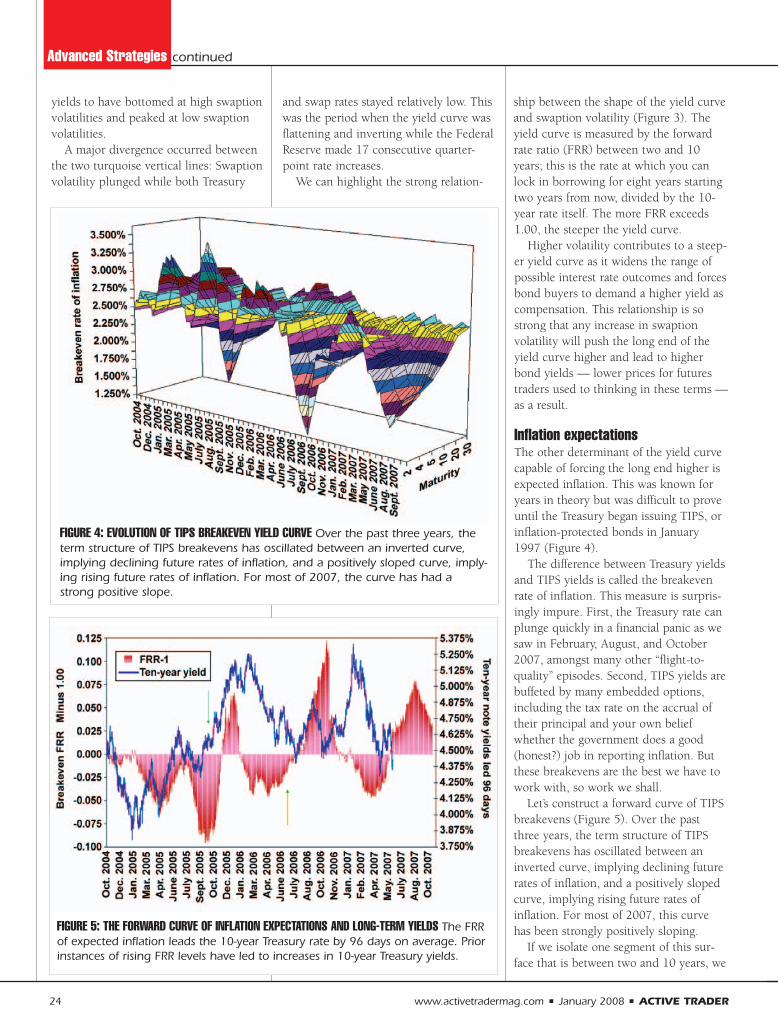
Inflation expectationsThe other determinant of the yield curvecapable of forcing the long end higher isexpected inflation. This was known foryears in theory but was difficult to proveuntil the Treasury began issuing TIPS, orinflation-protected bonds in January1997 (Figure 4).
The difference between Treasury yieldsand TIPS yields is called the breakevenrate of inflation. This measure is surpris-ingly impure. First, the Treasury rate canplunge quickly in a financial panic as wesaw in February, August, and October2007, amongst many other “flight-to-quality” episodes. Second, TIPS yields arebuffeted by many embedded options,including the tax rate on the accrual oftheir principal and your own beliefwhether the government does a good(honest?) job in reporting inflation. Butthese breakevens are the best we have towork with, so work we shall.
Let’s construct a forward curve of TIPSbreakevens (Figure 5). Over the pastthree years, the term structure of TIPSbreakevens has oscillated between aninverted curve, implying declining futurerates of inflation, and a positively slopedcurve, implying rising future rates ofinflation. For most of 2007, this curvehas been strongly positively sloping.
If we isolate one segment of this sur-face that is between two and 10 years, we
24 www.activetradermag.com • January 2008 • ACTIVE TRADER
Advanced Strategies continued
FIGURE 4: EVOLUTION OF TIPS BREAKEVEN YIELD CURVE Over the past three years, theterm structure of TIPS breakevens has oscillated between an inverted curve,implying declining future rates of inflation, and a positively sloped curve, imply-ing rising future rates of inflation. For most of 2007, the curve has had astrong positive slope.
FIGURE 5: THE FORWARD CURVE OF INFLATION EXPECTATIONS AND LONG-TERM YIELDS The FRRof expected inflation leads the 10-year Treasury rate by 96 days on average. Priorinstances of rising FRR levels have led to increases in 10-year Treasury yields.

can construct a FRR of inflationbreakevens parallel to the FRR for theTreasury yield curve itself. If we displaythe FRR as itself minus one and map itagainst 10-year Treasury yields, a strikingpattern emerges: The FRR of expectedinflation leads the 10-year Treasury rateby 96 days on average.
Previous episodes of rising FRR levels,marked with green arrows in Figure 5,have led to increases in 10-year Treasuryyields. The configuration as observed inlate October 2007 points to a similarepisode of rising yields, and this is exactlywhat we should expect. Rising inflationexpectations should lead to a steeperyield curve, and unless it is offset bylower short-term rates, a steeper yieldcurve is bearish for bonds.
Resolving the conundrumThe American economy has been import-ing disinflation from China for the betterpart of this decade. Regardless of any ofthe macroeconomic causes normally associated with rising inflation flashingred, cheap imports made possible in partby a wildly undervalued Chinese yuanhave held back inflationary pressures inthe U.S.
Moreover, the continued huge capitalinflows from foreign investors mandatedby the large and growing current accountdeficit have had the odd effect of keepingthe yield curve flatter than it would havebeen otherwise. At some point, however,foreign bond buyers are going to demandcompensation against rising inflationexpectations, rising interest-rate volatility,and a weaker dollar. All three of thosefactors will combine to push the long endof the yield curve higher for any level ofshort-term interest rates.
The question of whether we stand atthe end of a quarter century-long bullmarket in bonds or four years into a newbear market in bonds should be resolvedin favor of the bear. All short-term tradingstrategies in bonds and in markets affect-ed by long-term interest rates will need tobe adjusted to accommodate this newreality. Violate the first rule of trading andrules 2 through N will not matter.!
For information on the author see p. 4.
ACTIVE TRADER • January 2008 • www.activetradermag.com 26
Related readingOther Howard Simons articles:
“Interest-rate shocks and currency moves”Currency Trader, October 2007.Short-term interest rates are typically cited as the prime catalyst of currencymoves. This study puts that idea to the test.
“Stock shocks and the dollar”Currency Trader, September 2007.Want to know what really happens to currencies after big stock market moves?
“Currencies and Federal Reserve trade weights”Currency Trader, July 2007.The theory that a weaker dollar makes U.S. goods and services more competitive abroad sounds nice, but the facts argue otherwise.
“Why currency traders should be humbler” Currency Trader, May 2007.A close look at the historical returns of professional currency traders is not for the feint of heart.
“The stronger real: Don’t blame it on Rio”Currency Trader, April 2007.Lessons from past markets shed light on the possible future of Brazil’s high-flying currency.
“Comparing the major euro cross rates”Currency Trader, March 2007.Europe’s two major non-euro currencies — the British pound and the Swiss franc — reflect the growing new currency regime.
“Mexican peso: Who’s your padre?”Currency Trader, February 2007. The peso is one of several “emerging currencies” that have been gaining popularity. Find out about the key factor that has propped up the currency —which could disappear in a flash.
“The new iron cross” Currency Trader, January 2007. The long history of the D-mark/pound and now the euro/pound offers many lessons about economic policies and currency fluctuations.
“The pros make it look hard” Currency Trader, December 2006. Are currency traders making life unnecessarily difficult for themselves?
“Currency trends and volatility” Currency Trader, November 2006. Interesting insights come from putting currency volatility under a microscope.
“Currencies and conventional U.S. investments” Currency Trader, October 2006. The financial media often reports on moves in the stock and bond markets vis-à-vis currency fluctuations, but these relationships might not be what youexpect.
“The dollar index and ‘firm’ exchange rates”Currency Trader, December 2005.The vast majority of currency traders are familiar only with the current floating-rate system. But are we about to enter a new “firm exchange rate” era dominated by the dollar and euro?
“Howard Simons: Advanced Currency Concepts, Vol. 1”A discounted collection that includes many of the articles listed here.
You can purchase and download past articles at www.activetradermag.com/purchase_articles.htm
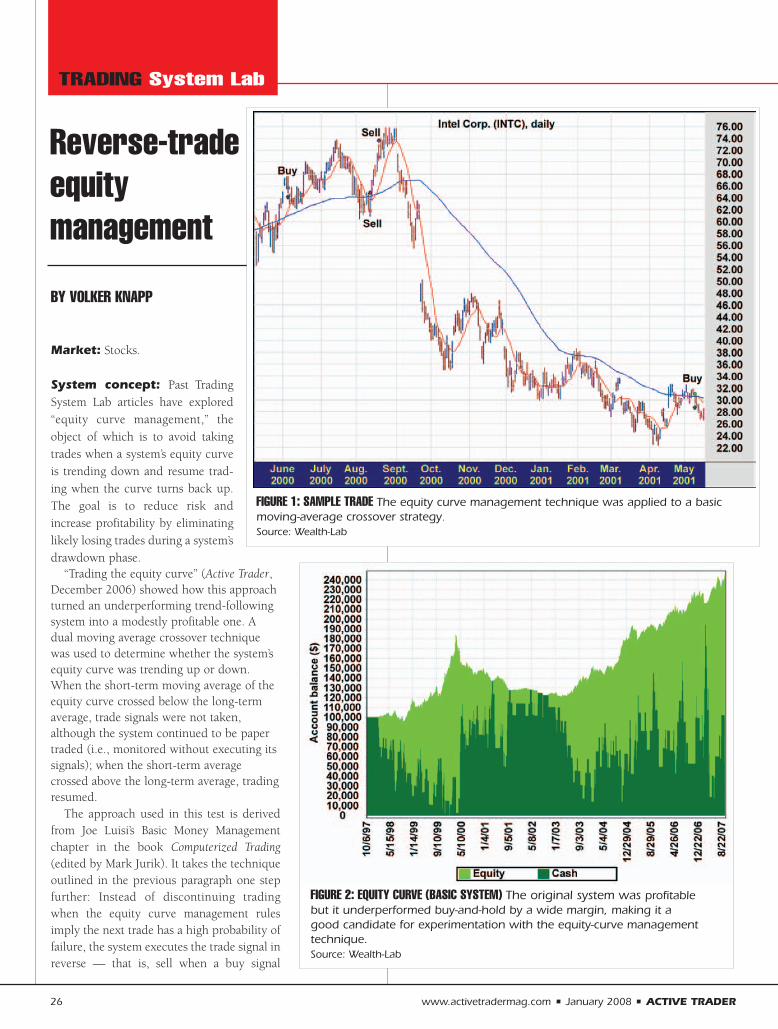
BY VOLKER KNAPP
Market: Stocks.
System concept: Past TradingSystem Lab articles have explored“equity curve management,” theobject of which is to avoid takingtrades when a system’s equity curveis trending down and resume trad-ing when the curve turns back up.The goal is to reduce risk andincrease profitability by eliminatinglikely losing trades during a system’sdrawdown phase.
“Trading the equity curve” (Active Trader,December 2006) showed how this approachturned an underperforming trend-followingsystem into a modestly profitable one. Adual moving average crossover techniquewas used to determine whether the system’sequity curve was trending up or down.When the short-term moving average of theequity curve crossed below the long-termaverage, trade signals were not taken,although the system continued to be papertraded (i.e., monitored without executing itssignals); when the short-term averagecrossed above the long-term average, tradingresumed.
The approach used in this test is derivedfrom Joe Luisi’s Basic Money Managementchapter in the book Computerized Trading(edited by Mark Jurik). It takes the techniqueoutlined in the previous paragraph one stepfurther: Instead of discontinuing tradingwhen the equity curve management rulesimply the next trade has a high probability offailure, the system executes the trade signal inreverse — that is, sell when a buy signal
TRADING System Lab
FIGURE 1: SAMPLE TRADE The equity curve management technique was applied to a basicmoving-average crossover strategy.Source: Wealth-Lab
FIGURE 2: EQUITY CURVE (BASIC SYSTEM) The original system was profitablebut it underperformed buy-and-hold by a wide margin, making it a good candidate for experimentation with the equity-curve managementtechnique.Source: Wealth-Lab
Reverse-tradeequity management
26 www.activetradermag.com • January 2008 • ACTIVE TRADER
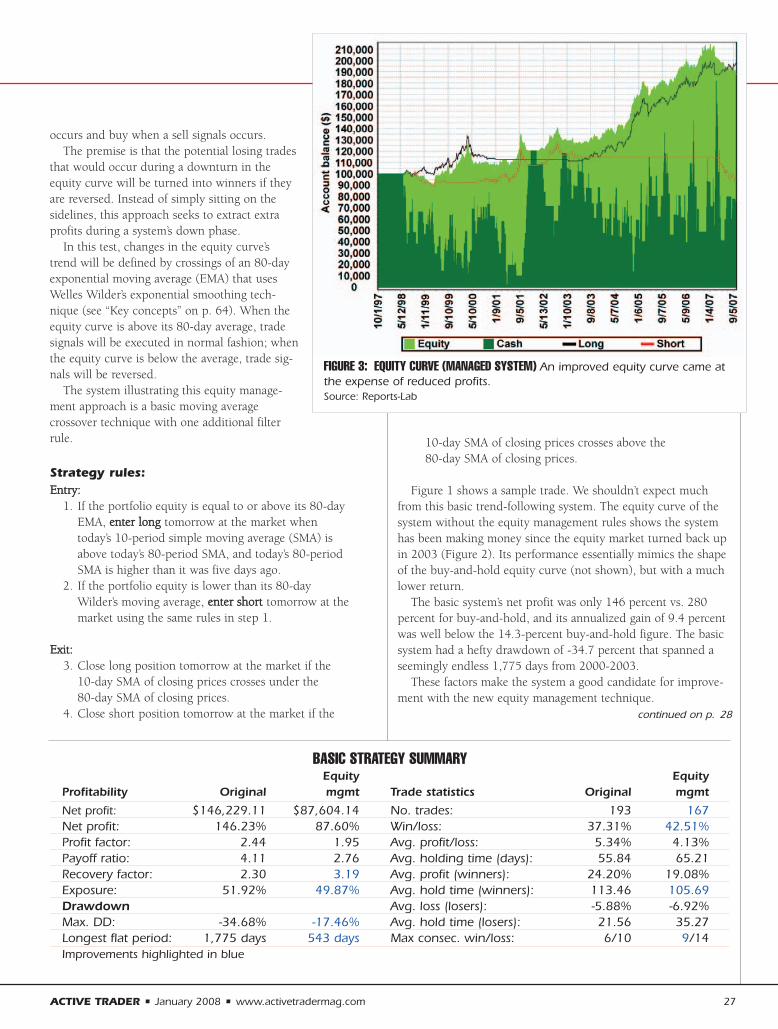
ACTIVE TRADER • January 2008 • www.activetradermag.com 27
occurs and buy when a sell signals occurs. The premise is that the potential losing trades
that would occur during a downturn in theequity curve will be turned into winners if theyare reversed. Instead of simply sitting on thesidelines, this approach seeks to extract extraprofits during a system’s down phase.
In this test, changes in the equity curve’strend will be defined by crossings of an 80-dayexponential moving average (EMA) that usesWelles Wilder’s exponential smoothing tech-nique (see “Key concepts” on p. 64). When theequity curve is above its 80-day average, tradesignals will be executed in normal fashion; whenthe equity curve is below the average, trade sig-nals will be reversed.
The system illustrating this equity manage-ment approach is a basic moving averagecrossover technique with one additional filterrule.
Strategy rules:EEnnttrryy::
1. If the portfolio equity is equal to or above its 80-day EMA, eenntteerr lloonngg tomorrow at the market when today’s 10-period simple moving average (SMA) is above today’s 80-period SMA, and today’s 80-period SMA is higher than it was five days ago.
2. If the portfolio equity is lower than its 80-day Wilder’s moving average, eenntteerr sshhoorrtt tomorrow at the market using the same rules in step 1.
EExxiitt::3. Close long position tomorrow at the market if the
10-day SMA of closing prices crosses under the 80-day SMA of closing prices.
4. Close short position tomorrow at the market if the
10-day SMA of closing prices crosses above the 80-day SMA of closing prices.
Figure 1 shows a sample trade. We shouldn’t expect muchfrom this basic trend-following system. The equity curve of thesystem without the equity management rules shows the systemhas been making money since the equity market turned back upin 2003 (Figure 2). Its performance essentially mimics the shapeof the buy-and-hold equity curve (not shown), but with a muchlower return.
The basic system’s net profit was only 146 percent vs. 280percent for buy-and-hold, and its annualized gain of 9.4 percentwas well below the 14.3-percent buy-and-hold figure. The basicsystem had a hefty drawdown of -34.7 percent that spanned aseemingly endless 1,775 days from 2000-2003.
These factors make the system a good candidate for improve-ment with the new equity management technique.
FIGURE 3: EQUITY CURVE (MANAGED SYSTEM) An improved equity curve came atthe expense of reduced profits.Source: Reports-Lab
continued on p. 28
BASIC STRATEGY SUMMARYEquity Equity
Profitability Original mgmt Trade statistics Original mgmt
Net profit: $146,229.11 $87,604.14 No. trades: 193 167Net profit: 146.23% 87.60% Win/loss: 37.31% 42.51%Profit factor: 2.44 1.95 Avg. profit/loss: 5.34% 4.13%Payoff ratio: 4.11 2.76 Avg. holding time (days): 55.84 65.21Recovery factor: 2.30 3.19 Avg. profit (winners): 24.20% 19.08%Exposure: 51.92% 49.87% Avg. hold time (winners): 113.46 105.69Drawdown Avg. loss (losers): -5.88% -6.92%Max. DD: -34.68% -17.46% Avg. hold time (losers): 21.56 35.27Longest flat period: 1,775 days 543 days Max consec. win/loss: 6/10 9/14Improvements highlighted in blue
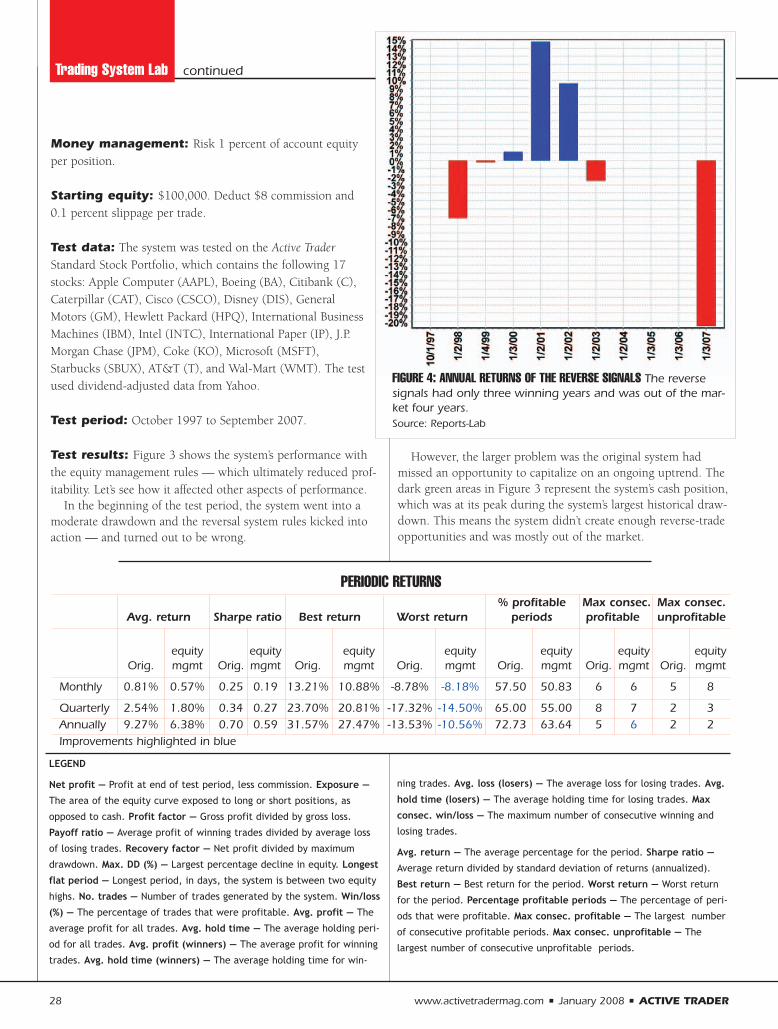
Money management: Risk 1 percent of account equityper position.
Starting equity: $100,000. Deduct $8 commission and0.1 percent slippage per trade.
Test data: The system was tested on the Active TraderStandard Stock Portfolio, which contains the following 17stocks: Apple Computer (AAPL), Boeing (BA), Citibank (C),Caterpillar (CAT), Cisco (CSCO), Disney (DIS), GeneralMotors (GM), Hewlett Packard (HPQ), International BusinessMachines (IBM), Intel (INTC), International Paper (IP), J.P.Morgan Chase (JPM), Coke (KO), Microsoft (MSFT),Starbucks (SBUX), AT&T (T), and Wal-Mart (WMT). The testused dividend-adjusted data from Yahoo.
Test period: October 1997 to September 2007.
Test results: Figure 3 shows the system’s performance withthe equity management rules — which ultimately reduced prof-itability. Let’s see how it affected other aspects of performance.
In the beginning of the test period, the system went into amoderate drawdown and the reversal system rules kicked intoaction — and turned out to be wrong.
However, the larger problem was the original system hadmissed an opportunity to capitalize on an ongoing uptrend. Thedark green areas in Figure 3 represent the system’s cash position,which was at its peak during the system’s largest historical draw-down. This means the system didn’t create enough reverse-tradeopportunities and was mostly out of the market.
Trading System Lab continued
LEGEND
Net profit — Profit at end of test period, less commission. Exposure —The area of the equity curve exposed to long or short positions, as
opposed to cash. Profit factor — Gross profit divided by gross loss.
Payoff ratio — Average profit of winning trades divided by average loss
of losing trades. Recovery factor — Net profit divided by maximum
drawdown. Max. DD (%) — Largest percentage decline in equity. Longestflat period — Longest period, in days, the system is between two equity
highs. No. trades — Number of trades generated by the system. Win/loss(%) — The percentage of trades that were profitable. Avg. profit — The
average profit for all trades. Avg. hold time — The average holding peri-
od for all trades. Avg. profit (winners) — The average profit for winning
trades. Avg. hold time (winners) — The average holding time for win-
ning trades. Avg. loss (losers) — The average loss for losing trades. Avg.hold time (losers) — The average holding time for losing trades. Maxconsec. win/loss — The maximum number of consecutive winning and
losing trades.
Avg. return — The average percentage for the period. Sharpe ratio —Average return divided by standard deviation of returns (annualized).
Best return — Best return for the period. Worst return — Worst return
for the period. Percentage profitable periods — The percentage of peri-
ods that were profitable. Max consec. profitable — The largest number
of consecutive profitable periods. Max consec. unprofitable — The
largest number of consecutive unprofitable periods.
FIGURE 4: ANNUAL RETURNS OF THE REVERSE SIGNALS The reversesignals had only three winning years and was out of the mar-ket four years.Source: Reports-Lab
PERIODIC RETURNS % profitable Max consec. Max consec.
Avg. return Sharpe ratio Best return Worst return periods profitable unprofitable
equity equity equity equity equity equity equityOrig. mgmt Orig. mgmt Orig. mgmt Orig. mgmt Orig. mgmt Orig. mgmt Orig. mgmt
Monthly 0.81% 0.57% 0.25 0.19 13.21% 10.88% -8.78% -8.18% 57.50 50.83 6 6 5 8
Quarterly 2.54% 1.80% 0.34 0.27 23.70% 20.81% -17.32% -14.50% 65.00 55.00 8 7 2 3Annually 9.27% 6.38% 0.70 0.59 31.57% 27.47% -13.53% -10.56% 72.73 63.64 5 6 2 2Improvements highlighted in blue
28 www.activetradermag.com • January 2008 • ACTIVE TRADER
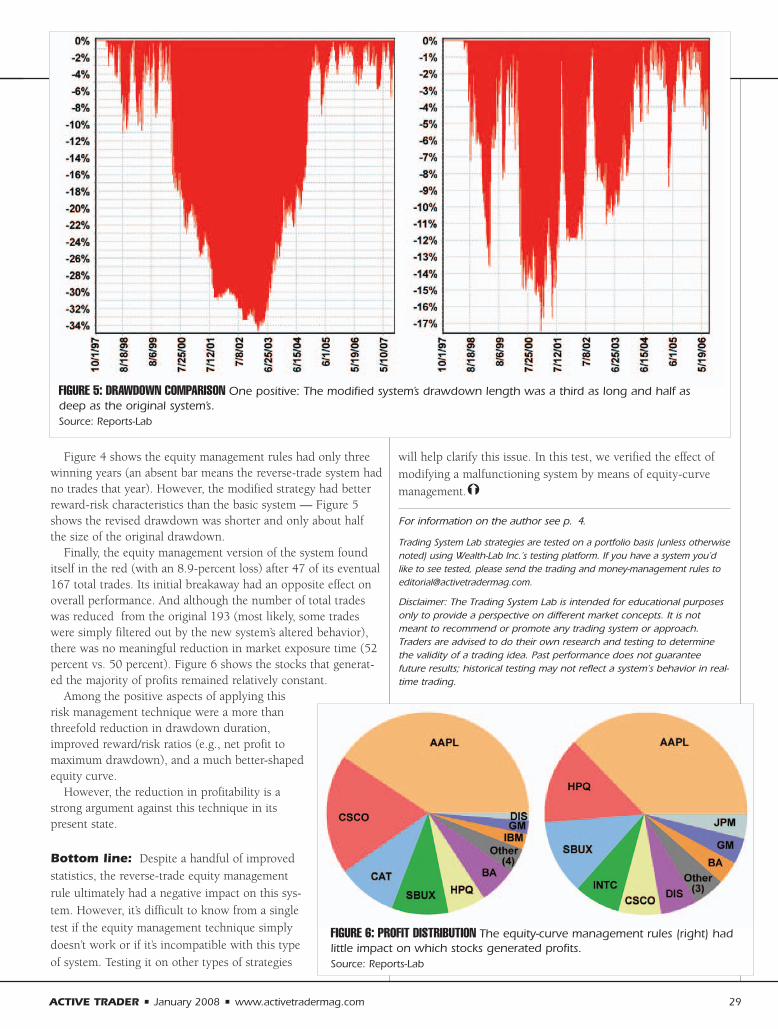
Figure 4 shows the equity management rules had only threewinning years (an absent bar means the reverse-trade system hadno trades that year). However, the modified strategy had betterreward-risk characteristics than the basic system — Figure 5shows the revised drawdown was shorter and only about halfthe size of the original drawdown.
Finally, the equity management version of the system founditself in the red (with an 8.9-percent loss) after 47 of its eventual167 total trades. Its initial breakaway had an opposite effect onoverall performance. And although the number of total tradeswas reduced from the original 193 (most likely, some tradeswere simply filtered out by the new system’s altered behavior),there was no meaningful reduction in market exposure time (52percent vs. 50 percent). Figure 6 shows the stocks that generat-ed the majority of profits remained relatively constant.
Among the positive aspects of applying thisrisk management technique were a more thanthreefold reduction in drawdown duration,improved reward/risk ratios (e.g., net profit tomaximum drawdown), and a much better-shapedequity curve.
However, the reduction in profitability is astrong argument against this technique in itspresent state.
Bottom line: Despite a handful of improvedstatistics, the reverse-trade equity managementrule ultimately had a negative impact on this sys-tem. However, it’s difficult to know from a singletest if the equity management technique simplydoesn’t work or if it’s incompatible with this typeof system. Testing it on other types of strategies
will help clarify this issue. In this test, we verified the effect ofmodifying a malfunctioning system by means of equity-curvemanagement.!
For information on the author see p. 4.
Trading System Lab strategies are tested on a portfolio basis (unless otherwisenoted) using Wealth-Lab Inc.’s testing platform. If you have a system you’dlike to see tested, please send the trading and money-management rules [email protected].
Disclaimer: The Trading System Lab is intended for educational purposesonly to provide a perspective on different market concepts. It is notmeant to recommend or promote any trading system or approach.Traders are advised to do their own research and testing to determinethe validity of a trading idea. Past performance does not guaranteefuture results; historical testing may not reflect a system’s behavior in real-time trading.
FIGURE 5: DRAWDOWN COMPARISON One positive: The modified system’s drawdown length was a third as long and half asdeep as the original system’s.Source: Reports-Lab
FIGURE 6: PROFIT DISTRIBUTION The equity-curve management rules (right) hadlittle impact on which stocks generated profits.Source: Reports-Lab
ACTIVE TRADER • January 2008 • www.activetradermag.com 29

M ultiple studies haveshown it’s difficult totrade successfully. Very
few traders actually make money, andeven some that do barely show enoughprofit to cover expenses.
Yet there’s no shortage of new entrantsinto the industry, each one with hopes ofbecoming the next George Soros. Theallure of financial freedom and the abilityto go to work each morning in your paja-mas is a big draw for potential traders,
and some do indeed buck the odds andbecome successful.
So what separates the profitable tradersfrom the ones who eventually close upshop and go back to their other jobs?
If you ask a group of professors whohave been studying traders for severalyears, one of the big reasons is overconfi-dence.
“People in general are overconfident,”says Brad Barber, professor of finance atthe University of California-DavisGraduate School of Management. “Andwhen it comes to investing, they do it tooaggressively.
“Many traders will see some new infor-mation about a stock in the Wall StreetJournal or somewhere online and thinkthey have information that gives them anadvantage. However, the returns for trad-ing are not worth it.”
In confidenceSimon Gervais, associate professor offinance at Duke’s Fuqua School ofBusiness, says traders enter the professionwithout any real knowledge of their abili-ties. It is only after a period of successesand failures that the trader can assess hisability. However, most new traders don’thave a realistic view.
“In assessing his ability, the tradertakes too much credit for his successes,”Gervais says. “This leads to overconfi-dence.”
In a report co-authored with financeprofessor Terrance Odean from Cal-
Berkeley, titled “Learning to beOverconfident,” Gervais finds that over-confidence generally tends to decrease asa trader becomes more experienced.
He says a common belief is that “non-rational” traders will underperformrational traders and eventually operateonly on the fringe of the marketplace, ifat all. However, Gervais says that is notnecessarily the case.
“Nonrational traders earn higherexpected profits than rational traders bybearing a disproportionate amount of therisk they themselves create,” Gervais says.“We have found the most overconfidentand nonrational traders are not the poor-est traders. For any given level of learningbias and trading experience, it is success-ful traders, though not necessarily themost successful traders, who are the mostoverconfident. Overconfidence does notmake traders wealthy, but the process ofbecoming wealthy can make traders over-confident.”
Looking for stocks in all the wrong placesBarber says traders are also too eager totrade “media darlings” — stocks that havebeen the subject of significant coverage,either on television or in the newspapers.
To illustrate this concept, Barber refersto Entremed (ENMD), a biotech compa-ny. In May 1998, with ENMD tradingaround $12, a lengthy story appeared inthe Sunday edition of the New York Times
BY ACTIVE TRADER STAFF
On the MARKET
Why is the sky blue … and why do traders trade?People trade certain stocks for a variety of reasons. But are they the right reasons?
Academic studies suggest many traders have inflated perceptions of their abilities,
and often use the wrong basis to select stocks.
continued on p. 31
The allure of financial
freedom and the ability
to go to work each
morning in your pajamas
is a big draw for
potential traders, and
some do indeed buck
the odds and become
successful.
30 www.activetradermag.com • January 2008 • ACTIVE TRADER
31 www.activetradermag.com • January 2008 • ACTIVE TRADER
that indicated Entremed had possiblydeveloped a new cancer-curing drug.
ENMD opened at 83 the next day andclosed at 51.81. Within three days, it wastrading below 30, although it would be afew years before it traded consistentlynear 12 again.
However, the interesting thing toBarber and his colleagues was that thisnews wasn’t news at all. More than fivemonths earlier, the scientific journalNature had reported the same thing, ashad the Times.
However, the timing and the place-ment of the most recent article senttraders scurrying to their brokerages, try-ing to get in on the action.
“The traders treated the story as amajor breakthrough,” Barber says. “Therewas a huge price spike even though thatinformation was already out.”
And sometimes traders act on informa-tion that isn’t even pertinent to the stockthey are trading. When MCI, a wirelesscommunications company that has sincedeclared bankruptcy and been boughtout by Verizon, was trading, it used thesymbol MCIC.
There is an “MCI” ticker symbol, but itrepresents Mass Mutual CorporateInvestors, a closed-end investment com-pany. Nonetheless, studies done byBarber and his colleagues showed thatwhenever there was news on the wirelesscompany, it affected the stock of theinvestment company.
Barber calls this the “limited attentionbias.” In a May 2006 report entitled“Systematic Noise,” Barber writes,“[M]any individual investors cope withthe challenge of sifting through thou-sands of potential purchases by consider-ing only stocks that otherwise catch theirattention. Using news, extreme pricemoves, and abnormally high trading vol-ume to identify when stocks may catchinvestors’ attention … individualinvestors are more likely to buy, ratherthan to sell, attention-grabbing stocks.”
Another trader mindset is the “disposi-tion effect.” This, Barber says, causestraders to concentrate on stocks that havepreviously had strong returns.
“People expect small samples and short
series of data to be representative of theunderlying population or distribution,”Barber writes in the report. “Observingstrong recent returns for a security, aninvestor might conclude that this securityis the type (or has become the type) ofsecurity that generates strong returns.Thus, past performance is extrapolated tothe future.”
Noisy tradingMany traders are what Barber considers“noise” traders — they are trading onsomething other than information. In
other words, the knowledge they haveabout a particular stock does not givethem an informational advantage overother traders.
Nonetheless, noise traders can have abig impact on stock prices. One ofBarber’s studies, done in conjunction withOdean, showed that stocks heavily pur-chased by individuals over the course of ayear (i.e., there was a greater volumeincrease among individual traders fromthe previous year than among institu-tions) underperformed stocks heavilysold by individuals by 4.4 percent in thefollowing year.
However, in shorter time periods, the
pattern was different. On a weekly basis,stocks that were heavily bought earnedstrong returns in the next week, whilestocks that were heavily sold performedpoorly the next week. This pattern holdstrue for three or four weeks before revers-ing for several weeks.
Barber believes these studies supporthis theories of traders being overconfi-dent and trading even without an infor-mational advantage. The fact that stocksthat are oversold in one year outperformthose that are overbought shows thattraders initially “follow the herd” and
have a tendency to choose stocks theirpeers are trading.
Over the course of a year, the stockloses its luster as traders are not there toaffect its price, and it tends to return toits “proper” position.
In the short term, a stock remains“hot” or “cold” for about three or fourweeks before it is ignored by traders andthe price becomes normalized.
In his report on noise traders, Barbersays, “[I]t is unlikely that the trades ofindividual investors are coordinated bythe same factors that contribute to insti-tutional herding, such as principal agentconcerns, rational information cascades,
On the market continued
“People expect small samples and short series
of data to be representative of the underlying
population or distribution. Observing strong recent
returns for a security, an investor might conclude
that this security is the type (or has become
the type) of security that generates strong returns.
Thus, past performance is extrapolated to
the future.”–Brad Barber,
University of California-Davis Graduate School of Management
ACTIVE TRADER • January 2008 • www.activetradermag.com 32
or a rational response to correlated infor-mation. Shared psychological biasesappear to contribute to coordinated trad-ing. The influence of one individualinvestor on asset prices is negligible.However, we find that buying and sellingdecisions of individuals are highly corre-lated and they cumulate over time. Thusindividual investors, sometimes referredto as noise traders, do have the potentialto affect asset prices because their noise issystematic.”
The information illusionThe amount of information available onthe Internet adds to a trader’s belief thathe or she is better informed than fellowtraders.
“There is unlimited information online,and that sounds good to traders,” Barbersays. “But the only important informationwould be something that other tradersdidn’t have. Traders go to a site wherethey can sort and filter stock according totheir criteria and they think it gives theman advantage, but anybody can do it.”
The Internet has also made it easier forpeople to trade. Barber and Odean co-authored a report that asks in its title,“Online Investors: Do the Slow DieFirst?” Traders who previously phonedtheir broker to place orders but whoswitched to online trading traded moreand were more speculative. The studyshowed that these traders, who beat themarket by 2 percent while still using aphone, lagged the market by more than 3percent annually after switching to onlinetrading.
“Reductions in market frictions (lowertrading costs, improved execution speed,greater ease of access) don’t explain thesefindings,” Odean says. “Overconfidencecan explain the trading increase and per-formance reduction.”
Barber and Odean found that traderswho switched from the phone to theInternet typically did so after a very prof-itable period, which perhaps led togreater overconfidence.
According to the report, “People alsobecome more overconfident when givenmore information on which to base aforecast (the illusion of knowledge) and
they behave as if their personal involve-ment can influence the outcome ofchance events (the illusion of control).Online investors have access to vastquantities of information, generally man-age their own portfolios, and trade at theclick of a mouse. These aspects of onlinetrading foster greater overconfidence.”
Another commonality the professorsfound involved trading stocks that hadbeen previously traded. In “Once Burned,Twice Shy: Naïve Learning,Counterfactuals, and the Repurchase ofStocks Previously Sold,” Barber andOdean found that traders tend to buyspecific stocks again if they had a prof-itable experience with them in the past.
Likewise, they tended to avoid stocksthey had previously lost money on.
“This behavior does not appear to bedriven by superior information aboutthese stocks since the investors do notearn superior returns on the previouswinners they repurchase,” Odean says.
“Counterfactuals” occur when someonecompares an actual outcome to his men-tal projection of what might have been.Selling a stock produces the obviouscounterfactual of not selling a stock. If atrader then buys that stock back, thecounterfactual moves closer to reality.However, the reality still differs from thecounterfactual, most notably in how itaffects a trader’s profit.
“If the stock is repurchased at a higherprice than it was sold for, the investor isless wealthy than he might have been hadhe not sold it to begin with; if the stock isrepurchased at a lower price, he iswealthier than he would have been hadhe not sold it at the higher price beforerepurchasing it at the lower price,” Odeansays.
The professors’ conclusion is thattraders repurchase stocks that havedecreased in value since they were soldbecause reality dominates the “neversold” counterfactual — no matter whathappens to the stock in the future, theycan always tell themselves they are betteroff than if they had never sold the stockat the higher price and then repurchasedit at the lower price.
Likewise, they refrain from repurchas-
ing stocks at a higher price than they soldthem for because that would produce acounterfactual that produced a greaterprofit.
According to the report, “Repurchasinga stock at a higher price increases regret.Even if the repurchased stock increases inprice after it is purchased, the investorwill always know that he would havedone better had he not sold it in the firstplace.”
All of these studies lean toward a com-mon theme: Traders trade stocks for myr-iad reasons — but not necessarilybecause they have researched the stockand have an informational advantage overother traders.
Trader bewareBarber’s latest study involves traders inTaiwan, where trading is very popular.Barber chose Taiwan because pertinentdata is more easily obtained there than itis in the U.S.
“We’re able to get specific data aboutwho started the trade (an individual or aninstitution); that’s not available in theU.S.,” Barber says. “Another difference isthat Taiwan is retail-dominated. About 70percent of volume comes from individualtraders.”
But Barber says the portrait betweentraders from the two countries is similar— active traders in Taiwan underperformthe market, just as is the case in the U.S.
After years of studying traders, Barberdoesn’t think trading is in the best inter-ests of anybody looking for some fastmoney.
“For the average person, I think it’s abad thing,” he says. “Far more peoplebelieve they will succeed than actuallydo. There are far too many people enter-ing the business.”
Barber says that if somebody was con-sidering opening a restaurant but discov-ered that the average restaurant losesmoney, they would question getting intothe restaurant business.
“But they hear the same thing abouttrading, and they think they are theexception,” Barber says. “They think theyare better than anybody else, but that’susually not the case.”!

Stephen McClellan wantsyou to be your ownstock analyst. He thinksyou can do it — correc-
tion, he thinks you should do it, givenwhat he knows about Wall Street and theinformation most people rely on to makeinvestment decisions.
Until retiring in 2003, McClellanspent 32 years as a highly regarded WallStreet stock analyst — 19 consecutiveyears on the Institutional Investor All-American Research team and seven yearson the Wall Street Journal poll — whoplied much of his trade at Street behe-moths Merrill Lynch and SalomonBrothers.
If you’ve always suspected there wassomething crooked at the intersection ofWall and Broad streets — and who couldblame you after the fudged numbers andanalyst complicity that emerged in thewake of the tech implosion in 2000 —McClellan’s new book, Full of Bull(Financial Times press, 2007), is prettymuch your worst fears realized.
In it McClellan recounts his three-decade career as a Street analyst and howhis profession morphed from a relativelylow-profile wing of the financial industry
BY MARK ETZKORN
ACTIVE TRADER • January 2008 • www.activetradermag.com 33
continued on p. 34
Behind the Wall with
Stephen McClellanAn industry insider explains
why you don’t matter to
Wall Street — and what you
can do about it.
© 2007, Ethan Pines
ACTIVE TRADER Interview
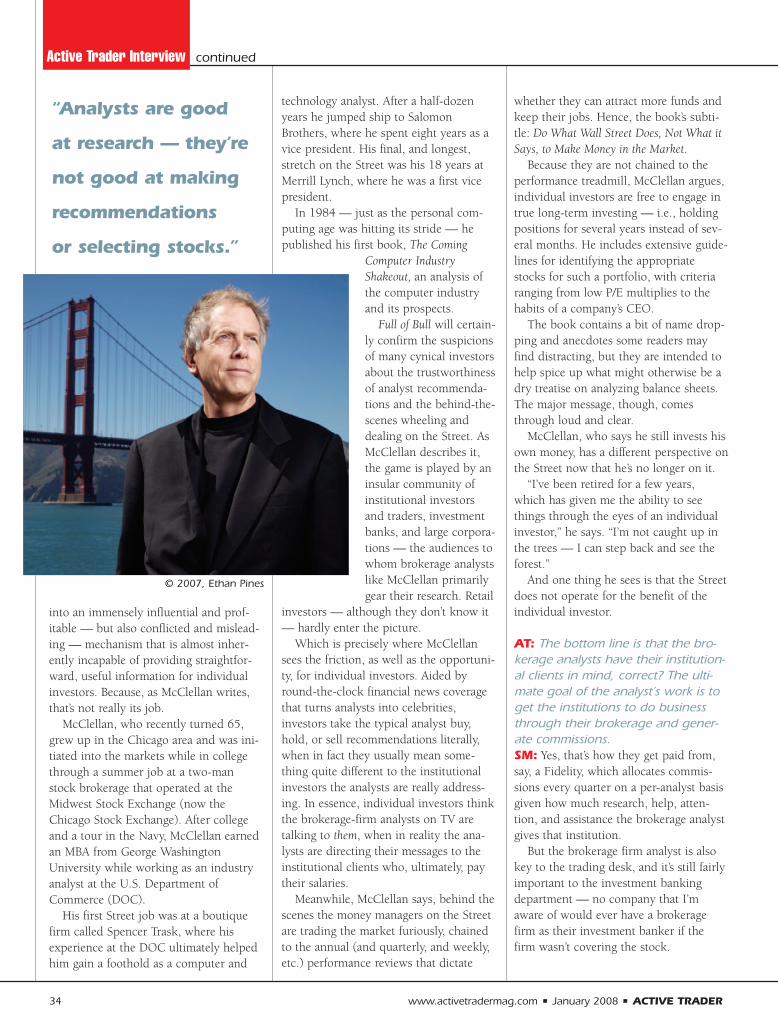
into an immensely influential and prof-itable — but also conflicted and mislead-ing — mechanism that is almost inher-ently incapable of providing straightfor-ward, useful information for individualinvestors. Because, as McClellan writes,that’s not really its job.
McClellan, who recently turned 65,grew up in the Chicago area and was ini-tiated into the markets while in collegethrough a summer job at a two-manstock brokerage that operated at theMidwest Stock Exchange (now theChicago Stock Exchange). After collegeand a tour in the Navy, McClellan earnedan MBA from George WashingtonUniversity while working as an industryanalyst at the U.S. Department ofCommerce (DOC).
His first Street job was at a boutiquefirm called Spencer Trask, where hisexperience at the DOC ultimately helpedhim gain a foothold as a computer and
technology analyst. After a half-dozenyears he jumped ship to SalomonBrothers, where he spent eight years as avice president. His final, and longest,stretch on the Street was his 18 years atMerrill Lynch, where he was a first vicepresident.
In 1984 — just as the personal com-puting age was hitting its stride — hepublished his first book, The Coming
Computer IndustryShakeout, an analysis ofthe computer industryand its prospects.
Full of Bull will certain-ly confirm the suspicionsof many cynical investorsabout the trustworthinessof analyst recommenda-tions and the behind-the-scenes wheeling anddealing on the Street. AsMcClellan describes it,the game is played by aninsular community ofinstitutional investorsand traders, investmentbanks, and large corpora-tions — the audiences towhom brokerage analystslike McClellan primarilygear their research. Retail
investors — although they don’t know it— hardly enter the picture.
Which is precisely where McClellansees the friction, as well as the opportuni-ty, for individual investors. Aided byround-the-clock financial news coveragethat turns analysts into celebrities,investors take the typical analyst buy,hold, or sell recommendations literally,when in fact they usually mean some-thing quite different to the institutionalinvestors the analysts are really address-ing. In essence, individual investors thinkthe brokerage-firm analysts on TV aretalking to them, when in reality the ana-lysts are directing their messages to theinstitutional clients who, ultimately, paytheir salaries.
Meanwhile, McClellan says, behind thescenes the money managers on the Streetare trading the market furiously, chainedto the annual (and quarterly, and weekly,etc.) performance reviews that dictate
whether they can attract more funds andkeep their jobs. Hence, the book’s subti-tle: Do What Wall Street Does, Not What itSays, to Make Money in the Market.
Because they are not chained to theperformance treadmill, McClellan argues,individual investors are free to engage intrue long-term investing — i.e., holdingpositions for several years instead of sev-eral months. He includes extensive guide-lines for identifying the appropriatestocks for such a portfolio, with criteriaranging from low P/E multiplies to thehabits of a company’s CEO.
The book contains a bit of name drop-ping and anecdotes some readers mayfind distracting, but they are intended tohelp spice up what might otherwise be adry treatise on analyzing balance sheets.The major message, though, comesthrough loud and clear.
McClellan, who says he still invests hisown money, has a different perspective onthe Street now that he’s no longer on it.
“I’ve been retired for a few years,which has given me the ability to seethings through the eyes of an individualinvestor,” he says. “I’m not caught up inthe trees — I can step back and see theforest.”
And one thing he sees is that the Streetdoes not operate for the benefit of theindividual investor.
AT: The bottom line is that the bro-kerage analysts have their institution-al clients in mind, correct? The ulti-mate goal of the analyst’s work is toget the institutions to do businessthrough their brokerage and gener-ate commissions.SM: Yes, that’s how they get paid from,say, a Fidelity, which allocates commis-sions every quarter on a per-analyst basisgiven how much research, help, atten-tion, and assistance the brokerage analystgives that institution.
But the brokerage firm analyst is alsokey to the trading desk, and it’s still fairlyimportant to the investment bankingdepartment — no company that I’maware of would ever have a brokeragefirm as their investment banker if thefirm wasn’t covering the stock.
34 www.activetradermag.com • January 2008 • ACTIVE TRADER
Active Trader Interview continued
“Analysts are good
at research — they’re
not good at making
recommendations
or selecting stocks.”
© 2007, Ethan Pines
AT: Are retail investors such an after-thought that firms don’t even consid-er the potential bump they might getfrom fanning the flames of publicinterest?SM: Individual investors are so low onthe totem pole that the research isn’t ori-ented or directed toward them. The ana-lysts certainly never have any direct con-tact with the retail brokers and the indi-vidual private clients.
The research essentially gets repack-aged and dumbed down for [the retail]audience, but they’re really a secondary— or even tertiary — concern in terms ofthe major broker-dealers.
AT: But if that’s the case, why dothey bother doing anything for retailinvestors? Why not just give the skin-ny to the big institutional clientsbehind the scenes and not evenbother going on TV and talking upthe companies?SM: Analysts like to have high profiles,get on CNBC, get quoted in the WallStreet Journal, and be well known becauseit gives them more clout with the biginstitutions.
AT: Was television really the thingthat changed the game in terms ofanalysts being perceived as expertstock pickers with the ability to movestocks just by talking about them?Did it take off in the 90s?SM: That’s basically when it started. Inthe 80s the analysts were pretty muchdoing their job — researching and focus-ing on institutions — but they certainlyweren’t moving the market, and theyweren’t TV personalities and householdnames to individual investors.
That all changed in the 90s, probablyfor the worse, because it misled millionsof investors. It certainly gave analysts abad name when the market crashed andit turned out their research was synthetic
or inept, and their opinions were superfi-cial or incorrect.
It was a disservice to investors, and Ithink the price is still being paid.Individuals are still misdirected by WallStreet. They take the Street literally —they believe a “hold” rating means “holdthe stock,” when in reality it means “sellthe stock,” and they believe the price tar-gets on stocks are real, while in realitythey’re pretty specious. They take the rec-ommendations from broker-dealer“emphasis lists,” and those lists haveproven to be no better than all the otherpositively rated stocks in the system —and in some years, the lists underperformthe overall market.
I think investors still pay too muchattention to Wall Street’s directives,whereas insiders know better than to takeWall Street literally. Insiders know howthe game is played, but individualinvestors have never had anyone beforedecode the confusing, misleading WallStreet practices.
AT: If analysts aren’t supposed to bestock pickers, and if their price tar-gets are not meant to be taken literal-ly, what is their role supposed to be? SM: An analyst is expert in doingresearch on industry sectors and compa-nies, summarizing that analysis andresearch, and putting it in reports to pro-vide a better understanding of what’s hap-pening in that industry as well as what’sgoing on operationally and directionallyat a certain company. Analysts are good atdoing research; they’re not good at mak-ing recommendations or stock selection.
AT: So they’re gathering informationand providing data in the form ofresearch, but they’re not necessarilyinterpreting the information in theform of selecting stocks or forecast-ing price moves?SM: They might interpret it and say
“that’s a positive” or “that’s a negative,”but what they traditionally haven’t beenpaid for — and therefore are not adept at— is deciding whether this is a greatstock to own now, or for how long, orwhether it should be sold, and so forth.
There’s a systemic way Wall Streetmakes it almost impossible for analysts toexpress objective opinions. The bulk of[the analysts’] audience is demandingpositive opinions, so they’re very biasedin that direction. They’re also demandingbig-company research, so analysts havetraditionally overlooked and neglectedsmall companies. These inadequaciesinhibit good, objective conclusions, rec-ommendations, and opinions.
AT: I can’t help but get the impres-sion you’re going to great lengths toavoid saying, “This is corrupt.”SM: (laughing) Well, that’s a strong word.
AT: I know. What’s a less-strongword?SM: It’s convoluted and there are manyconflicts of interest. A big institutionalinvestor, such as a big mutual fund, hasone interest and a corporate executive ata company the analyst is covering hasanother interest. Also, the traders on the[firm’s] trading desk are different, theindividual investor is different, and theanalyst is even catering to the media tosome degree. There are too many audi-ences and there are too many inert, built-in biases.
AT: You mention in the book, actual-ly, that analysts do more marketingthan research. SM: Absolutely, and that’s what every-body on the outside is so appalled by: thefact that most of an analyst’s time is spenton the road meeting with big institutionalinvestors, marketing and selling, and onthe telephone or the squawk box dis-cussing the research rather than doing theresearch.
AT: Let’s talk a little bit about the rec-ommendation game — when buyreally means sell, for example.SM: It’s hilarious. There’s a great story
ACTIVE TRADER • January 2008 • www.activetradermag.com 35
continued on p. 36
“Investors pay too much attention to Wall
Street’s directives. Insiders know better than to
take Wall Street literally.”

that happened fairly recently. An analysthad an “overweight” rating on a stock. Idon’t know what the stock price was —let’s say $40. His price target on the stockwas $30, indicating he expected the stockto go down to that level. However, hehad an overweight rating on it.
Looking further at the report revealedthe overweight rating meant the stockwould outperform the other companies inthat industry sector — they’d all godown, but the others would go downmore than this particular stock. So hisrating tells all the individual investorswho take these things pretty literally,“Well, that must be a good stock tobuy, I’ll make some money in it. Letme put that in my portfolio.” Andhe’s really saying, “It’s an ‘outperform’all right — it’s only going to go down25 percent.”
The more obvious example, whichhappens all the time, occurs when ananalyst with a buy rating on a stockmoves his rating to a “hold” or a“neutral” rating, which is a very nega-tive signal. He’s actually viewing theprospects of the stock and the com-pany as a sell, but prefers to transmitthis signal in code to save face.
AT: You mention in the book thatgoing down even one notch atany time is a bad sign.SM: Exactly. But many individualinvestors might literally decide to hold onto that stock in this situation, thinking,“Gee, the firm still has a ‘hold’ rating on it— that means I should continue to holdit.” That’s how they are misled.
But “hold” can also be a roaring,screaming buy recommendation. Say ananalyst has a rare sell rating on a stock andhe moves it up to a “hold.” That’s a posi-tive move. He’s thinking the outlook is get-ting better and the stock is not going to godown any more — things are improving.That means it’s a great time to be buyingthe stock, because his next move — sixmonths down the road — will be to movethe hold up to a buy rating.
The rating systems are absurd. Streetprofessionals know how to interpret theratings and rating changes, but outsiders— individual investors — are completely
fooled by them.
AT: One of the other examples youwrite about is when a stock has fouror five sell ratings, it’s about the timethe stock is going to bottom out. Doprofessional traders time their tradesin a contrarian way based on theseratings?SM: Traders — at least the ones on WallStreet — are good for five minutes or twohours or two days. They’re not looking attwo months.
But yes, when most of the Streetalready has a negative sell rating on astock, they pretty much understand thestock’s not going much lower, and theyare very much watching and anticipatingthe first analyst to upgrade it to a neutralor a buy. If there’s anyone left to put out asell rating, it wouldn’t impact the stockbecause it’s already completely discountedin its price.
But a move up from a sell rating whenthe bulk of the Street is already negativecan have a big positive impact on thestock.
AT: Let’s follow up on time frame.Have mutual funds — which mostpeople would probably consider theprototypical investment operations —abandoned long-term investing? SM: Oh, absolutely. Mutual funds arecaught on the quarterly performance
treadmill. They’re not just scrutinizedevery quarter — although that’s when thebiggest evaluation occurs — but alsoevery day, every week, and every month.
The portfolio managers are absolutelyon a one-year treadmill. They don’t investin stocks — they temporarily hold themfor short periods. They’ve been forcedinto being traders themselves. Mutualfunds are just hand-tied and inhibitedfrom being able to [be true long-terminvestors].
AT: And that’s where you thinkthe opportunity is for individuals— a multi-year perspective, right?SM: That’s exactly right. Individualshave the unique advantage, unlikemost of Wall Street, to be able to holda stock for, say, three to six years. If itdoesn’t do much or goes down onequarter it’s not going to kill them —while that would hurt a mutual fund’sperformance, which is getting lookedat every quarter. Individuals shouldtake advantage of this.
AT: I have to say, though, whenreading your book I thought itmight be a daunting task for anindividual investor to do the kindof research you outline, and itwould certainly take some time to
master. There seems to be a lot ofsubtlety and nuance to making judg-ments about these companies. Doyou think individuals can really dothis?SM: Most individuals can’t do anywherenear the degree [of research] that I writeabout in the book. But I lay everythingout for them so they at least have an ideaof the full scope of [what it takes] to beyour own securities analyst. If they cando a quarter or even 15 percent of what Ilay out for them, they’ll be way ahead ofwhere they are now.
And I think when they come acrossnew investment prospects, if they applysome of these things I focus on — thequality of the company, whether it has ahumble management attitude, listening tothe conference calls, and especially strate-gies about preserving capital, pickinglow-P/E-multiple stocks, and investing in
36 www.activetradermag.com • January 2008 • ACTIVE TRADER
Active Trader Interview continued
© 2007, Ethan Pines

NYSE vs. Nasdaq stocks — they will beway ahead of the game. These guidelineswill help them avoid losing as muchmoney as they’ve lost in the past and helpthem as long-term investors.
AT: What do you think shouldchange on the Street in terms of lev-eling the playing field for individualinvestors?SM: First of all, research has to be madeindependent of broker-dealer firms onWall Street. It has to be at an arm’s lengthso analysts can conduct unbiased, objec-tive research and not feel beholden tocertain audiences.
I also think there needs to be somereform regarding corporate executives.They are culpable in regard to the biasedresearch that comes out of Wall Street.They distort and warp research. Theyhave a lot of ways to penalize analystswho are not positively recommendingtheir stocks — withholding access, andso forth.
Much of the buy-side — the hedgefunds, for example — also need to bereined in and have the same regulationsthat apply to the brokerage firms andother parts of Wall Street. They are suchbig commission generators that they cantwist the arms of analysts, and brokeragefirms bend over backwards for them.
I also think the way they spreadrumors about stocks they have shortpositions in is very destructive. Brokeragefirms cannot do that, but hedge funds areable to. The reforms have to be not juston the brokerage side but also on theinstitutional investor side.
AT: The number of hedge funds hasexploded in recent years, but theyweren’t born yesterday. Why haven’tthey been subject to the same regu-lation?SM: Because they used to be pools ofvery high net worth individuals, and notso much public money. There weren’t asmany and they weren’t as big, so theydidn’t have as much clout with WallStreet brokerage firms or analysts. Theywere more private, I guess you’d say. Nowthey have pension fund investors, univer-sity endowment funds, and public money
invested in them.And of course, their success in the 90s
and the amount of money partners canmake by starting up a hedge fund hasexploded to the degree that they’re sohuge they need to play by the same rules.
AT: How likely do you think thesechanges are? Will it take a catastro-phe of some kind to have thereforms you talk about come intobeing?SM: I think it’s going to be difficult toenact many of these reforms if it’s busi-ness as usual. The bursting of the 90sInternet bubble put certain reforms inplace, but not anywhere near enough,and if we muddle through this decade,few additional reforms are likely.
It will take quite a major catalyst to getsome of these reforms done — either abad stock market, or other problems sur-facing in regards to research analysts.
AT: And you’re of the opinion thatinvestors didn’t really learn the les-sons of the Bubble?SM: No, they really didn’t. They still takethe “buy” ratings literally, they still watchCramer on CNBC, they trade right andleft, they still buy stocks with almost infi-nite P/E multiples — the Googles of thisworld — because they’re glamorous.They pay very little attention to risk, val-uation, quality, and so forth. I don’t thinkenough lessons were learned, absolutely.
AT: One conclusion a reader mightcome to after reading your book is,because of all the misleading infor-mation from the Street and conflictsof interest regarding individualstocks, it might be better to invest inthe overall market using exchangetraded funds (ETFs) or even stockindex futures.SM: I do mention exchange traded fundsin the book, which are not a bad way toown a sector of the stock market. Myonly caveat is that people are going to tryto engage in sector timing — be in a cer-tain sector for six months or a year andthen move to another sector. It is basical-ly impossible to be consistently correctwith that form of fairly active trading and
market timing. So, yes, if you don’t havethe time or inclination to do seriousinvesting on your own, [ETFs] are theway to go — they are probably preferableto mutual funds. They don’t encompassdividends, though, and almost half of thetotal market returns stem from dividends.
But my book is really oriented to peo-ple who are doing their own stock invest-ing. There are millions of them, and theycould do it a lot better. Indexes wouldplay a role, perhaps, but it’s not reallywhat I’m focusing on.
There have been a few tell-all booksabout the wild 90s, but there’s never beenan investment advice book from someonewith my background. In the past, almostevery one of them has been written byoutsiders — someone in the media, acolumnist, a professor, and once in whilea money manager from a mutual fund,like Peter Lynch.
But nobody from the stock brokerageside — no analyst — has done it. I’messentially divulging everything I’velearned over the past 32 years on WallStreet, which the outside world doesn’treally [know about].
AT: Could you have written this bookwhile you were still an analyst on theStreet?SM: I think it would be impossible towrite this book while active on WallStreet. You can’t say, “You know, a broker-age firm emphasis list doesn’t meanmuch,” or “a brokerage analyst’s stock rat-ing is pretty meaningless” and still be ananalyst on the Street.
AT: Do you know if you’ve peevedany former associates? SM: I think I will probably cause a bit ofa stir on Wall Street, but I tried to doeverything in a very arm’s length manner— I didn’t use specific names or refer-ences and made everything generic to thewhole Street.
Time will tell, because the book is justbarely hitting the bookstores this week(ending Nov. 3). I’ve talked to a few of myformer associates and they’ve said,“McClellan, you are right on.” They’re alittle amazed I’m telling it, but they’recertainly in agreement.!
ACTIVE TRADER • January 2008 • www.activetradermag.com 37

38 www.activetradermag.com • January 2008 • ACTIVE TRADER
Name: Carl WymanAge: 63Lives and works in: Seattle, WA
CC arl Wyman first discoveredtrading in 1957 when hismiddle school gave its stu-dents a brief lesson on the
stock market. Soon afterwards, through an account
opened in his father’s name, he boughtone share of Duplan for $12.25.
“The broker picked it,” Wymanremembers. “I knew nothing about it.”
The stock went up to $100 and split 2-for-1, but the company eventually wentbankrupt, leaving Wyman with nothingto show for his initial investment.However, “it was an interesting game,” hesays.
He continued pursuing this interestthroughout his teenage years, reading var-ious books. The classic How I Made $2Million In the Stock Market by NicolasDarvas was significant for him. He didn’thave any funds to invest, but on summervacations with his family, he wouldalways have a book of stock charts withhim.
Wyman earned a bachelor’s degree inchemistry, but he knew he didn’t want tospend his life in a laboratory. He also gotan MBA, focusing on the financial mar-kets. For his master’s thesis, he developeda model to predict the four-year cycles ofthe stock market. However, after businessschool, Wyman decided he wanted to dosomething more “significant” with his lifeand attended medical school.
Wyman ultimately spent 25 years prac-
ticing medicine, much of it working as anemergency room physician. However,Wyman was always trading in his sparetime, in options at first and then laterexpanding into commodities.
He likens trading to medicine in thatboth follow a set pattern.
“There is a certain protocol you followif someone comes in with chest pains,” hesays. “It’s the same in the markets. Youneed a plan for all market conditions andyou have to be able to implement thatprocedure.”
In 2000, Wyman retired from medicineand has been trading full-time since.
Trading methodology: Wyman putson about 40 trades per week, tradingindividual stocks and ETFs. He may holdsuccessful trades for a few days or even amonth, but he exits losers at the end ofthe day. He is a trend and momentumtrader and generally looks to enter tradeson pullbacks.
Wyman studies daily charts andsearches for stocks that are moving up (ordown) with strong momentum. He usesthe TC2000 software program to scan forstocks with the largest percentage gain inthe past six months.
“I’m always on the lookout for stocksthat are up,” he says.
For example, he monitors stocks thatare making new 52-week highs andwatches them for three- to five-day pullbacks with narrow range and lightvolume. He places his orders at night,after the markets are closed, entering one tick above the previous day’s high in stocks that have been consolidating
for three to five days.He will place a stop-loss a tick under
the previous day’s low, but he doesn’t givehis trades much leeway, noting that hisrule is “up or out.” He may exit a trade atthe day’s end if the stock fails to rallysharply higher.
Wyman estimates that for every 20trades, “about 12 or 13 are washes —small losers or small gains; a couple willsee decent gains; and one will see a greatgain.”
He uses trailing stops and takes partialprofits along the way. For example, if themarket has rallied for seven to 10 days,he often closes out half of his positionsand tightens stops on other trades.
Most important lesson learned:“You can really screw yourself up if youare not careful,” he says. “Anybody whohas been in this business for a while iscovered with bruises and scars. It is aconstant battle. If you want to succeedyou need to get back up and figure outwhat you did wrong.”
Best trading book: Battle ForInvestment Survival, by Gerald Loeb.
When not trading: Wyman fishes,sails, and coaches his two children’ssports programs.
Best thing about trading: “I cando it from my home,” Wyman says. “I can take a vacation whenever I want. I can do this in 20 minutes or I can sit atthe screen all day long. When the fishingis good, I’m gone.”!
Lifelong traderBY ACTIVE TRADER STAFF
The Face of TRADING Trading setup
Hardware: PC with AMD Athlon XP2500+processor, 1.83 GHz RAM,1.2 GB hard drive.
Software: TC2000, Profit.net.
Internet connection: Cable.
Brokerage: Direct access.
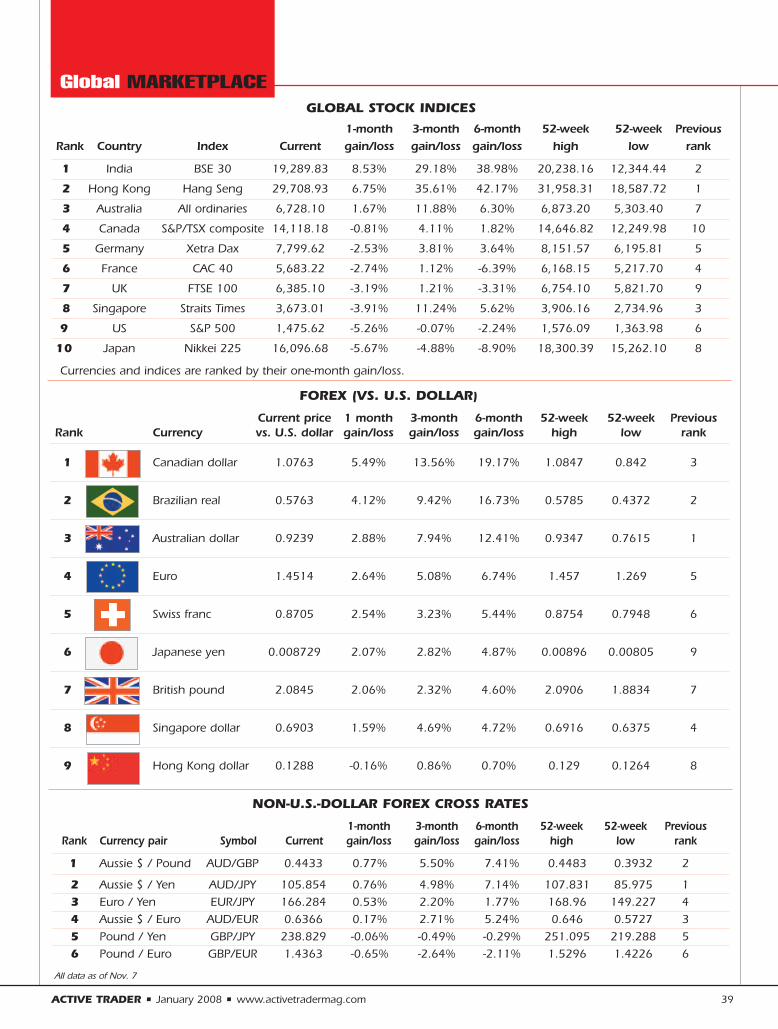
1-month 3-month 6-month 52-week 52-week PreviousRank Country Index Current gain/loss gain/loss gain/loss high low rank
1 India BSE 30 19,289.83 8.53% 29.18% 38.98% 20,238.16 12,344.44 2
2 Hong Kong Hang Seng 29,708.93 6.75% 35.61% 42.17% 31,958.31 18,587.72 1
3 Australia All ordinaries 6,728.10 1.67% 11.88% 6.30% 6,873.20 5,303.40 7
4 Canada S&P/TSX composite 14,118.18 -0.81% 4.11% 1.82% 14,646.82 12,249.98 10
5 Germany Xetra Dax 7,799.62 -2.53% 3.81% 3.64% 8,151.57 6,195.81 5
6 France CAC 40 5,683.22 -2.74% 1.12% -6.39% 6,168.15 5,217.70 4
7 UK FTSE 100 6,385.10 -3.19% 1.21% -3.31% 6,754.10 5,821.70 9
8 Singapore Straits Times 3,673.01 -3.91% 11.24% 5.62% 3,906.16 2,734.96 3
9 US S&P 500 1,475.62 -5.26% -0.07% -2.24% 1,576.09 1,363.98 6
10 Japan Nikkei 225 16,096.68 -5.67% -4.88% -8.90% 18,300.39 15,262.10 8
GLOBAL STOCK INDICES
Current price 1 month 3-month 6-month 52-week 52-week Previous Rank Currency vs. U.S. dollar gain/loss gain/loss gain/loss high low rank
1 Canadian dollar 1.0763 5.49% 13.56% 19.17% 1.0847 0.842 3
2 Brazilian real 0.5763 4.12% 9.42% 16.73% 0.5785 0.4372 2
3 Australian dollar 0.9239 2.88% 7.94% 12.41% 0.9347 0.7615 1
4 Euro 1.4514 2.64% 5.08% 6.74% 1.457 1.269 5
5 Swiss franc 0.8705 2.54% 3.23% 5.44% 0.8754 0.7948 6
6 Japanese yen 0.008729 2.07% 2.82% 4.87% 0.00896 0.00805 9
7 British pound 2.0845 2.06% 2.32% 4.60% 2.0906 1.8834 7
8 Singapore dollar 0.6903 1.59% 4.69% 4.72% 0.6916 0.6375 4
9 Hong Kong dollar 0.1288 -0.16% 0.86% 0.70% 0.129 0.1264 8
FOREX (VS. U.S. DOLLAR)
Currencies and indices are ranked by their one-month gain/loss.
NON-U.S.-DOLLAR FOREX CROSS RATES
Global MARKETPLACE
All data as of Nov. 7
1-month 3-month 6-month 52-week 52-week PreviousRank Currency pair Symbol Current gain/loss gain/loss gain/loss high low rank
1 Aussie $ / Pound AUD/GBP 0.4433 0.77% 5.50% 7.41% 0.4483 0.3932 2
2 Aussie $ / Yen AUD/JPY 105.854 0.76% 4.98% 7.14% 107.831 85.975 13 Euro / Yen EUR/JPY 166.284 0.53% 2.20% 1.77% 168.96 149.227 44 Aussie $ / Euro AUD/EUR 0.6366 0.17% 2.71% 5.24% 0.646 0.5727 35 Pound / Yen GBP/JPY 238.829 -0.06% -0.49% -0.29% 251.095 219.288 56 Pound / Euro GBP/EUR 1.4363 -0.65% -2.64% -2.11% 1.5296 1.4226 6
ACTIVE TRADER • January 2008 • www.activetradermag.com 39
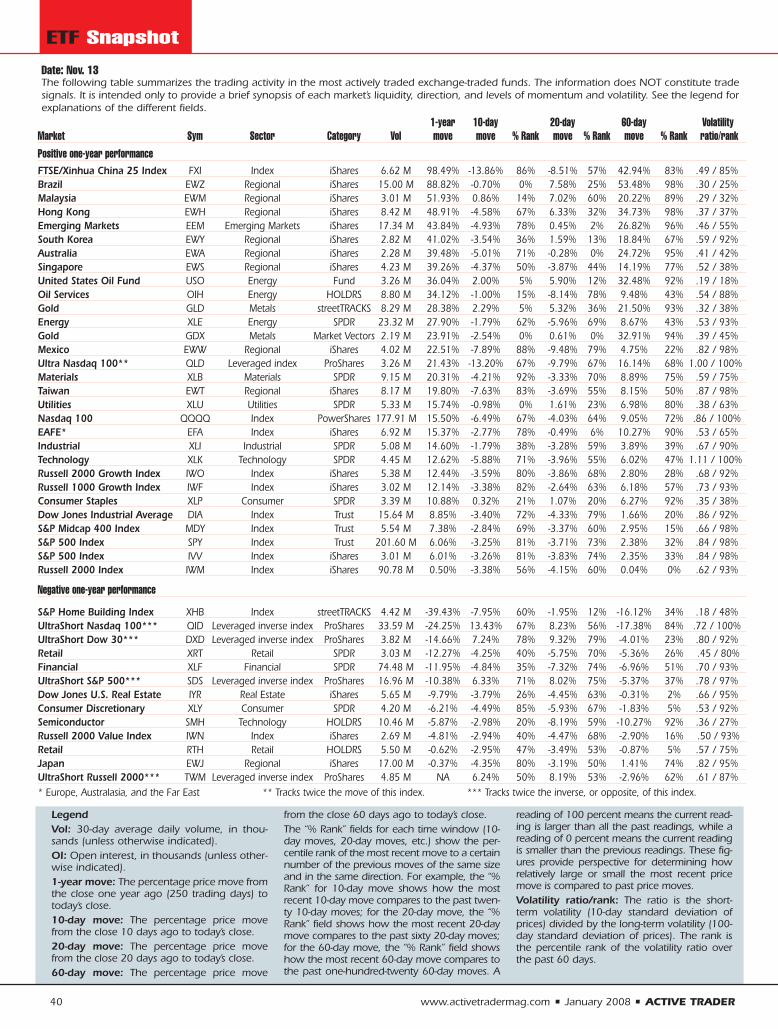
40 www.activetradermag.com • January 2008 • ACTIVE TRADER
LegendVol: 30-day average daily volume, in thou-sands (unless otherwise indicated).OI: Open interest, in thousands (unless other-wise indicated). 1-year move: The percentage price move fromthe close one year ago (250 trading days) totoday’s close.10-day move: The percentage price movefrom the close 10 days ago to today’s close.20-day move: The percentage price movefrom the close 20 days ago to today’s close.60-day move: The percentage price move
from the close 60 days ago to today’s close.The “% Rank” fields for each time window (10-day moves, 20-day moves, etc.) show the per-centile rank of the most recent move to a certainnumber of the previous moves of the same sizeand in the same direction. For example, the “%Rank” for 10-day move shows how the mostrecent 10-day move compares to the past twen-ty 10-day moves; for the 20-day move, the “%Rank” field shows how the most recent 20-daymove compares to the past sixty 20-day moves;for the 60-day move, the “% Rank” field showshow the most recent 60-day move compares tothe past one-hundred-twenty 60-day moves. A
reading of 100 percent means the current read-ing is larger than all the past readings, while areading of 0 percent means the current readingis smaller than the previous readings. These fig-ures provide perspective for determining howrelatively large or small the most recent pricemove is compared to past price moves.Volatility ratio/rank: The ratio is the short-term volatility (10-day standard deviation ofprices) divided by the long-term volatility (100-day standard deviation of prices). The rank isthe percentile rank of the volatility ratio overthe past 60 days.
Date: Nov. 13The following table summarizes the trading activity in the most actively traded exchange-traded funds. The information does NOT constitute trade signals. It is intended only to provide a brief synopsis of each market’s liquidity, direction, and levels of momentum and volatility. See the legend for explanations of the different fields.
ETF Snapshot
1-year 10-day 20-day 60-day Volatility Market Sym Sector Category Vol move move % Rank move % Rank move % Rank ratio/rankPositive one-year performanceFTSE/Xinhua China 25 Index FXI Index iShares 6.62 M 98.49% -13.86% 86% -8.51% 57% 42.94% 83% .49 / 85%Brazil EWZ Regional iShares 15.00 M 88.82% -0.70% 0% 7.58% 25% 53.48% 98% .30 / 25%Malaysia EWM Regional iShares 3.01 M 51.93% 0.86% 14% 7.02% 60% 20.22% 89% .29 / 32%Hong Kong EWH Regional iShares 8.42 M 48.91% -4.58% 67% 6.33% 32% 34.73% 98% .37 / 37%Emerging Markets EEM Emerging Markets iShares 17.34 M 43.84% -4.93% 78% 0.45% 2% 26.82% 96% .46 / 55%South Korea EWY Regional iShares 2.82 M 41.02% -3.54% 36% 1.59% 13% 18.84% 67% .59 / 92%Australia EWA Regional iShares 2.28 M 39.48% -5.01% 71% -0.28% 0% 24.72% 95% .41 / 42%Singapore EWS Regional iShares 4.23 M 39.26% -4.37% 50% -3.87% 44% 14.19% 77% .52 / 38%United States Oil Fund USO Energy Fund 3.26 M 36.04% 2.00% 5% 5.90% 12% 32.48% 92% .19 / 18%Oil Services OIH Energy HOLDRS 8.80 M 34.12% -1.00% 15% -8.14% 78% 9.48% 43% .54 / 88%Gold GLD Metals streetTRACKS 8.29 M 28.38% 2.29% 5% 5.32% 36% 21.50% 93% .32 / 38%Energy XLE Energy SPDR 23.32 M 27.90% -1.79% 62% -5.96% 69% 8.67% 43% .53 / 93%Gold GDX Metals Market Vectors 2.19 M 23.91% -2.54% 0% 0.61% 0% 32.91% 94% .39 / 45%Mexico EWW Regional iShares 4.02 M 22.51% -7.89% 88% -9.48% 79% 4.75% 22% .82 / 98%Ultra Nasdaq 100** QLD Leveraged index ProShares 3.26 M 21.43% -13.20% 67% -9.79% 67% 16.14% 68% 1.00 / 100%Materials XLB Materials SPDR 9.15 M 20.31% -4.21% 92% -3.33% 70% 8.89% 75% .59 / 75%Taiwan EWT Regional iShares 8.17 M 19.80% -7.63% 83% -3.69% 55% 8.15% 50% .87 / 98%Utilities XLU Utilities SPDR 5.33 M 15.74% -0.98% 0% 1.61% 23% 6.98% 80% .38 / 63%Nasdaq 100 QQQQ Index PowerShares 177.91 M 15.50% -6.49% 67% -4.03% 64% 9.05% 72% .86 / 100%EAFE* EFA Index iShares 6.92 M 15.37% -2.77% 78% -0.49% 6% 10.27% 90% .53 / 65%Industrial XLI Industrial SPDR 5.08 M 14.60% -1.79% 38% -3.28% 59% 3.89% 39% .67 / 90%Technology XLK Technology SPDR 4.45 M 12.62% -5.88% 71% -3.96% 55% 6.02% 47% 1.11 / 100%Russell 2000 Growth Index IWO Index iShares 5.38 M 12.44% -3.59% 80% -3.86% 68% 2.80% 28% .68 / 92%Russell 1000 Growth Index IWF Index iShares 3.02 M 12.14% -3.38% 82% -2.64% 63% 6.18% 57% .73 / 93%Consumer Staples XLP Consumer SPDR 3.39 M 10.88% 0.32% 21% 1.07% 20% 6.27% 92% .35 / 38%Dow Jones Industrial Average DIA Index Trust 15.64 M 8.85% -3.40% 72% -4.33% 79% 1.66% 20% .86 / 92%S&P Midcap 400 Index MDY Index Trust 5.54 M 7.38% -2.84% 69% -3.37% 60% 2.95% 15% .66 / 98%S&P 500 Index SPY Index Trust 201.60 M 6.06% -3.25% 81% -3.71% 73% 2.38% 32% .84 / 98%S&P 500 Index IVV Index iShares 3.01 M 6.01% -3.26% 81% -3.83% 74% 2.35% 33% .84 / 98%Russell 2000 Index IWM Index iShares 90.78 M 0.50% -3.38% 56% -4.15% 60% 0.04% 0% .62 / 93%
Negative one-year performance
S&P Home Building Index XHB Index streetTRACKS 4.42 M -39.43% -7.95% 60% -1.95% 12% -16.12% 34% .18 / 48%UltraShort Nasdaq 100*** QID Leveraged inverse index ProShares 33.59 M -24.25% 13.43% 67% 8.23% 56% -17.38% 84% .72 / 100%UltraShort Dow 30*** DXD Leveraged inverse index ProShares 3.82 M -14.66% 7.24% 78% 9.32% 79% -4.01% 23% .80 / 92%Retail XRT Retail SPDR 3.03 M -12.27% -4.25% 40% -5.75% 70% -5.36% 26% .45 / 80%Financial XLF Financial SPDR 74.48 M -11.95% -4.84% 35% -7.32% 74% -6.96% 51% .70 / 93%UltraShort S&P 500*** SDS Leveraged inverse index ProShares 16.96 M -10.38% 6.33% 71% 8.02% 75% -5.37% 37% .78 / 97%Dow Jones U.S. Real Estate IYR Real Estate iShares 5.65 M -9.79% -3.79% 26% -4.45% 63% -0.31% 2% .66 / 95%Consumer Discretionary XLY Consumer SPDR 4.20 M -6.21% -4.49% 85% -5.93% 67% -1.83% 5% .53 / 92%Semiconductor SMH Technology HOLDRS 10.46 M -5.87% -2.98% 20% -8.19% 59% -10.27% 92% .36 / 27%Russell 2000 Value Index IWN Index iShares 2.69 M -4.81% -2.94% 40% -4.47% 68% -2.90% 16% .50 / 93%Retail RTH Retail HOLDRS 5.50 M -0.62% -2.95% 47% -3.49% 53% -0.87% 5% .57 / 75%Japan EWJ Regional iShares 17.00 M -0.37% -4.35% 80% -3.19% 50% 1.41% 74% .82 / 95%UltraShort Russell 2000*** TWM Leveraged inverse index ProShares 4.85 M NA 6.24% 50% 8.19% 53% -2.96% 62% .61 / 87%* Europe, Australasia, and the Far East ** Tracks twice the move of this index. *** Tracks twice the inverse, or opposite, of this index.
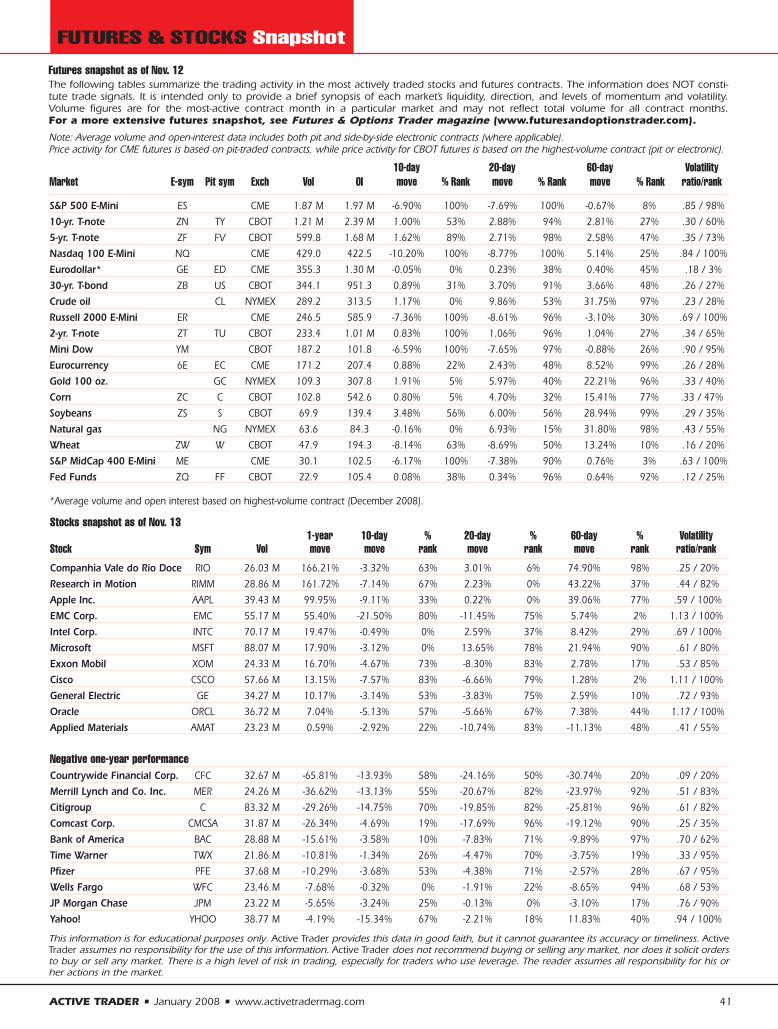
ACTIVE TRADER • January 2008 • www.activetradermag.com 41
Futures snapshot as of Nov. 12The following tables summarize the trading activity in the most actively traded stocks and futures contracts. The information does NOT consti-tute trade signals. It is intended only to provide a brief synopsis of each market’s liquidity, direction, and levels of momentum and volatility.Volume figures are for the most-active contract month in a particular market and may not reflect total volume for all contract months. For a more extensive futures snapshot, see Futures & Options Trader magazine (www.futuresandoptionstrader.com).
Note: Average volume and open-interest data includes both pit and side-by-side electronic contracts (where applicable). Price activity for CME futures is based on pit-traded contracts, while price activity for CBOT futures is based on the highest-volume contract (pit or electronic).
This information is for educational purposes only. Active Trader provides this data in good faith, but it cannot guarantee its accuracy or timeliness. ActiveTrader assumes no responsibility for the use of this information. Active Trader does not recommend buying or selling any market, nor does it solicit ordersto buy or sell any market. There is a high level of risk in trading, especially for traders who use leverage. The reader assumes all responsibility for his orher actions in the market.
FUTURES & STOCKS Snapshot
10-day 20-day 60-day Volatility Market E-sym Pit sym Exch Vol OI move % Rank move % Rank move % Rank ratio/rank
S&P 500 E-Mini ES CME 1.87 M 1.97 M -6.90% 100% -7.69% 100% -0.67% 8% .85 / 98%10-yr. T-note ZN TY CBOT 1.21 M 2.39 M 1.00% 53% 2.88% 94% 2.81% 27% .30 / 60%5-yr. T-note ZF FV CBOT 599.8 1.68 M 1.62% 89% 2.71% 98% 2.58% 47% .35 / 73%Nasdaq 100 E-Mini NQ CME 429.0 422.5 -10.20% 100% -8.77% 100% 5.14% 25% .84 / 100%Eurodollar* GE ED CME 355.3 1.30 M -0.05% 0% 0.23% 38% 0.40% 45% .18 / 3%30-yr. T-bond ZB US CBOT 344.1 951.3 0.89% 31% 3.70% 91% 3.66% 48% .26 / 27%Crude oil CL NYMEX 289.2 313.5 1.17% 0% 9.86% 53% 31.75% 97% .23 / 28%Russell 2000 E-Mini ER CME 246.5 585.9 -7.36% 100% -8.61% 96% -3.10% 30% .69 / 100%2-yr. T-note ZT TU CBOT 233.4 1.01 M 0.83% 100% 1.06% 96% 1.04% 27% .34 / 65%Mini Dow YM CBOT 187.2 101.8 -6.59% 100% -7.65% 97% -0.88% 26% .90 / 95%Eurocurrency 6E EC CME 171.2 207.4 0.88% 22% 2.43% 48% 8.52% 99% .26 / 28%Gold 100 oz. GC NYMEX 109.3 307.8 1.91% 5% 5.97% 40% 22.21% 96% .33 / 40%Corn ZC C CBOT 102.8 542.6 0.80% 5% 4.70% 32% 15.41% 77% .33 / 47%Soybeans ZS S CBOT 69.9 139.4 3.48% 56% 6.00% 56% 28.94% 99% .29 / 35%Natural gas NG NYMEX 63.6 84.3 -0.16% 0% 6.93% 15% 31.80% 98% .43 / 55%Wheat ZW W CBOT 47.9 194.3 -8.14% 63% -8.69% 50% 13.24% 10% .16 / 20%S&P MidCap 400 E-Mini ME CME 30.1 102.5 -6.17% 100% -7.38% 90% 0.76% 3% .63 / 100%Fed Funds ZQ FF CBOT 22.9 105.4 0.08% 38% 0.34% 96% 0.64% 92% .12 / 25%
*Average volume and open interest based on highest-volume contract (December 2008).
Stocks snapshot as of Nov. 131-year 10-day % 20-day % 60-day % Volatility
Stock Sym Vol move move rank move rank move rank ratio/rankCompanhia Vale do Rio Doce RIO 26.03 M 166.21% -3.32% 63% 3.01% 6% 74.90% 98% .25 / 20%Research in Motion RIMM 28.86 M 161.72% -7.14% 67% 2.23% 0% 43.22% 37% .44 / 82%Apple Inc. AAPL 39.43 M 99.95% -9.11% 33% 0.22% 0% 39.06% 77% .59 / 100%EMC Corp. EMC 55.17 M 55.40% -21.50% 80% -11.45% 75% 5.74% 2% 1.13 / 100%Intel Corp. INTC 70.17 M 19.47% -0.49% 0% 2.59% 37% 8.42% 29% .69 / 100%Microsoft MSFT 88.07 M 17.90% -3.12% 0% 13.65% 78% 21.94% 90% .61 / 80%Exxon Mobil XOM 24.33 M 16.70% -4.67% 73% -8.30% 83% 2.78% 17% .53 / 85%Cisco CSCO 57.66 M 13.15% -7.57% 83% -6.66% 79% 1.28% 2% 1.11 / 100%General Electric GE 34.27 M 10.17% -3.14% 53% -3.83% 75% 2.59% 10% .72 / 93%Oracle ORCL 36.72 M 7.04% -5.13% 57% -5.66% 67% 7.38% 44% 1.17 / 100%Applied Materials AMAT 23.23 M 0.59% -2.92% 22% -10.74% 83% -11.13% 48% .41 / 55%
Negative one-year performanceCountrywide Financial Corp. CFC 32.67 M -65.81% -13.93% 58% -24.16% 50% -30.74% 20% .09 / 20%Merrill Lynch and Co. Inc. MER 24.26 M -36.62% -13.13% 55% -20.67% 82% -23.97% 92% .51 / 83%Citigroup C 83.32 M -29.26% -14.75% 70% -19.85% 82% -25.81% 96% .61 / 82%Comcast Corp. CMCSA 31.87 M -26.34% -4.69% 19% -17.69% 96% -19.12% 90% .25 / 35%Bank of America BAC 28.88 M -15.61% -3.58% 10% -7.83% 71% -9.89% 97% .70 / 62%Time Warner TWX 21.86 M -10.81% -1.34% 26% -4.47% 70% -3.75% 19% .33 / 95%Pfizer PFE 37.68 M -10.29% -3.68% 53% -4.38% 71% -2.57% 28% .67 / 95%Wells Fargo WFC 23.46 M -7.68% -0.32% 0% -1.91% 22% -8.65% 94% .68 / 53%JP Morgan Chase JPM 23.22 M -5.65% -3.24% 25% -0.13% 0% -3.10% 17% .76 / 90%Yahoo! YHOO 38.77 M -4.19% -15.34% 67% -2.21% 18% 11.83% 40% .94 / 100%
W hile the Securities and
Exchange Com-
mission (SEC) and
the U.S. Congress
have been trying to increase hedge-fund
regulation for the last couple of years, the
hedge-fund industry took a step toward
policing itself in early November.
The Managed Funds Association
(MFA) expanded and updated recom-
mendations it made to members in 2005
after a government group suggested the
industry needed more self-regulation.
The report, which sought input from
hedge-fund managers, financial execu-
tives, accountants, and investors, focuses
on a few major points.
Overall, the MFA wants to make sure
all fund managers are on the same page
when it comes to internal policies and
practices. The report states, “MFA has
developed and updated the recommenda-
tions in the belief that the most effective
form of industry oversight is self-disci-
pline and self-monitoring by hedge-fund
managers as part of a shared responsibili-
ty with market counterparties, investors,
and regulators. The recommendations
should enhance the ability of hedge-fund
managers to manage operations, satisfy
responsibilities to investors, comply with
applicable regulations, and address unex-
pected market events.”
The recommendations are broken
down into seven sections: fund manage-
ment, relation with investors, determina-
tion of fund value, risk management, reg-
ulatory controls, relationship with coun-
terparties, and crisis management.
Fund managementThe MFA wants to ensure that a manag-
er’s goal for a fund is consistent with the
size and nature of the fund, and that
investments and risks are based on the
fund’s specific objectives. Each fund
needs to monitor the portfolio managers
it allocates capital to, and should estab-
lish procedures and policies that deal
with changes in software, data, IT, etc.
And, monitoring third parties providing
key business functions is critical.
Relation with investorsFund managers need to provide ample
information to prospective investors
about the fund’s objectives, permissible
investments, and risk factors. Investors
should be able to evaluate their interest in
the fund with this information.
Plus, fund managers need to consider
whether their actions in running the fund
(e.g., relationships with brokers and “soft-
dollar” funding) present any potential
conflicts of interest. If so, those conflicts
need to be disclosed to potential
investors. Investors need to be notified if
a manager makes a side deal or similar
arrangement that gives some investors
42 www.activetradermag.com • January 2008 • ACTIVE TRADER
BY JEFF PONCZAK
INSIDE the Market
Physician, heal thyself
Hedge-fund group makes recommendations
In this section…Morgan must account formissing e-mails 44
Quick Scalps 44
Exchange consolidation continues 45
More growth for BATS? 46
Refco still in news 47
Managed money 47
NYSE eliminates curbs 48
Stock firms 48
NYSE improves block trading 49
Global news 50
“MFA has developed
and updated the
recommendations in
the belief that the most
effective form of industry
oversight is self-discipline
and self-monitoring
by hedge-fund managers
as part of a shared
responsibility with market
counterparties, investors,
and regulators.”
— The Managed FundsAssociation Report

ACTIVE TRADER • January 2008 • www.activetradermag.com 43
preferential treatment.
A fund’s legal counsel is important
here, as it can work with the manager to
establish what disclosures need to be
made, and when.
Determination of fund valueThe report stresses that the assets and lia-
bilities of the fund need to be verified by
an independent auditor. And if the audi-
tor’s statements don’t match up perfectly
with the fund manager, procedures need
to be established to reconcile the differ-
ences.
If the manager is not ultimately
responsible for making sure the valua-
tions are correct, he needs to establish
who is accountable and disclose this
information to the investors.
Risk managementAs with fund management, risk manage-
ment, monitoring, and measurement
need to be appropriate to a fund’s size
and structure. This includes running a
“stress test” to determine how large
swings in the market and other risk fac-
tors could affect a fund’s value. However,
it’s just as important for a manager to
realize that any model used to measure or
manage risk has its limitations and
extreme situations could render the
model useless.
Before investing in an asset, a manager
needs to be aware of the liquidity charac-
teristics of that particular asset.
A big part of risk management is keep-
ing track of cash flow, and managers need
to monitor and manage current and
future expected instances of inflows or
outputs. When cash needed exceeds
available cash, managers must have a
plan. This includes keeping an open dia-
logue with credit providers.
Regulatory controlsFund managers need to create an envi-
ronment where compliance with regula-
tors and other authority groups is
stressed. This includes understanding
rules and laws in jurisdictions outside
where the fund is located. A code of
ethics, which would specifically list the
expected behavior of the manager and all
fund employees, is recommended, as is
its regular updating.
And, as was the case with fund valua-
tion, if the fund manager is not ultimately
responsible for making sure all rules and
regulations are followed, he needs to des-
ignate a person for that role.
Relationship with counterpartiesThe fund managers need to make sure
transactions are executable, and should
always seek best execution. Relationships
should be reviewed periodically to ensure
the fund’s counterparties are still provid-
ing the same services initially sought.
Crisis managementThe fund manager should have a compre-
hensive plan for employees and outside
service providers in the case of unexpect-
ed events such as terrorist attacks, fires,
natural disasters, etc. This plan should
include a way to protect employees in the
event a crisis makes the workplace
unsafe, and contingencies for succession
in the fund if a key member passes away.
Crisis management also includes plan-
ning for events such as the failure of a
third-party fund administrator, credit
provider, or other important party that
would impact a fund’s market, credit, or
liquidity risk. These plans should be
reviewed at least once a year, and man-
agers should be aware that federal and
local authorities can assist in the prepara-
tion of the plan.
“Most of us were doing just about all
of these things before, but having the
MFA compile and distribute them to
managers will hopefully cause the slack-
ers to pick things up,” says a hedge fund
manager. “There’s a common belief that if
we as fund managers don’t show we’re
serious about self-regulation, Congress or
the SEC will force us into things we don’t
want or [things that] are
inappropriate.”!
“There’s a common
belief that if we as fund
managers don’t show
we’re serious about
self-regulation, Congress
or the SEC will force
us into things we
don’t want or [things
that] are inappropriate.”
— Hedge-fund manager
44 www.activetradermag.com • January 2008 • ACTIVE TRADER
Inside the Market continued
Quick Scalps
A rbitration has been the
savior of some traders
who couldn’t make any
headway in a dispute
with their brokerage.
However, evidence uncovered in a
high-profile lawsuit between Morgan
Stanley and one of its wealthiest cus-
tomers could put the venerable Wall
Street firm at risk for hundreds of law-
suits.
Morgan Stanley was sued last year by
Ron Perelman, a billionaire who made his
fortune by buying out distressed compa-
nies. Perelman said Morgan Stanley gave
him poor advice on two companies he
was considering buying, and he lost hun-
dreds of millions in the transactions.
Perelman was awarded $1.45 billion in
the case, although Morgan won a reversal
on appeal, and the case is still in legal
limbo. However, in its defense, Morgan
essentially admitted it gave inaccurate
information, but argued that Perelman
was too savvy to fall for it.
The information revealed in the trial
caused the Financial Industry Regulatory
Authority (FINRA) to investigate Morgan
Stanley, and it found the brokerage did
not provide its clients headed to arbitra-
tion access to e-mails that could have
proved their cases.
Morgan initially claimed the e-mails
were destroyed in the terrorist attacks of
Sept. 11, 2001, but FINRA found backup
files, plus evidence that the deleted e-
mails continued into early 2005.
Additionally, some of the tapes that stored
the backup e-mails were re-used, erasing
the original content.
The brokerage has offered payouts of
$3,000 to $5,000 for clients affected by
the cover-up, but in many cases investors
lost hundreds of thousands of dollars.
The discovery of the deleted e-mails
has caused lawyers to prepare hundreds
of new lawsuits against Morgan Stanley.
Darren Blum, an attorney in Coral
Springs, Fla., has set up a Web site —
www.SueMorganStanley.com — to bring
attention to the situation.
While Morgan Stanley neither admit-
ted nor denied destroying the e-mails, the
brokerage is expected to sign a waiver
prohibiting it from taking any action that
“We’re not basing our
case on the stocks that
were affected. We will
base our case on how
they cheated investors
in arbitration.”
— Darren Blum, Attorney
The early bird gets the volumeIn an effort to begin trading earlier,the New York Stock Exchangeannounced it would automate theopening of some stocks while allow-ing specialists to handle more activestocks. Larry Liebowitz, executive vicepresident of the NYSE, said thechanges would make the exchangemore efficient. Although tradingbegins at the 9:30 a.m. ET openingbell, specialists sometimes need afew minutes if they are responsiblefor more than one stock. By allowingsome stocks to open electronically,specialists can concentrate on issueswhere there is an order imbalance.The exchange hopes the electronicopening will persuade more tradersto send their opening orders to theNYSE during the first 30 minutes oftrading. More than 10 percent ofdaily volume occurs during that timeperiod.
That toddlin’ exchangeThe Chicago Stock Exchange setrecords for both share and trade vol-ume in October. The exchange aver-aged 40.7 million shares daily — a45-percent increase over September— and had a 100-percent increasefrom trade-volume records set inAugust. Chicago CEO Dave Herronsays the record volume is an indica-tion that traders have recognized theattraction of the exchange’s tradingmodel, which is not dependent oncompeting ECNs or slowed by anorder delivery process. As a result ofthe record volumes, Chicago ischanging its rebate program to givecustomers that provide more than 5million average daily shares a rebateof 36 cents per 100 shares.Customers not reaching that thresh-old will receive 32 cents per 100shares.
How can they be alternativewhen trillions are invested inthem? Alternative assets, which includehedge funds as well as real estateand private equity, will receive $2.5
continued on p. 46
Back to arbitration
Deleted e-mails place brokerage at risk
ACTIVE TRADER • January 2008 • www.activetradermag.com 45
would have it directly or indirectly deny
the findings of the FINRA investigation.
Under securities law, the new lawsuits
will be settled in arbitration, and Blum
believes winning the case won’t be much
more difficult than showing up and pre-
senting the settlement.
“We’re not basing our case on the
stocks that were affected,” Blum says.
“We will base our case on how they
cheated investors in arbitration.”
However, not everybody agrees.
Chicago-based securities lawyer Dan
Schramm says investors will have to
prove their case was damaged by the
missing evidence, and most won’t be
able to.
“Not having this information and los-
ing in arbitration does not automatically
equal fraud,” he says.
Additionally, Schramm says, it’s
possible the deleted e-mails could have
helped Morgan Stanley’s position, a
defense the brokerage is likely to bring
up.
However, the fact that evidence was
destroyed will cause the arbitration panel
to question Morgan’s motives, and may
allow them to overlook the fact that
nothing directly related to the case may
have been found in the e-mail.
FINRA would not offer specifics on
the case, but there is some question as to
how valuable the settlement between
FINRA and Morgan will be. To win an
arbitration hearing the second time
around, investors would still have to
prove fraud, and nowhere in the agree-
ment does Morgan Stanley admit its
actions were fraudulent, nor does FINRA
make the claim.!
Expanding their options
Nasdaq buys Philadelphia exchange
BY JIM KHAROUF AND JEFF PONCZAK
T he Philadelphia Stock Exchange (PHLX), which has marketed itself as apotential takeover target for several months, finally got its wish in earlyNovember.
The Nasdaq bought PHLX for $652 million in an all-cash deal that will givethe Nasdaq instant recognition in the options business. The Nasdaq hadplanned to begin its own options market in late 2007, but ownership of thePHLX gives it an established exchange that has accounted for about 14 percentof U.S. options volume through the first 10 months of 2007.
“After an in-depth review of alternatives, we believe that combining withNasdaq is the best outcome for our customers, shareholders, and the tradingcommunity as a whole,” says Sandy Frucher, chairman and CEO of the PHLX.“No other exchange is better positioned for the future based on technology,products, and overall passion for continuously redefining the definition andvalue of stock exchanges around the world.”
The board of directors of both exchanges have already approved the deal,which is expected to close in the first quarter of 2008, subject to regulatoryapproval.
The Nasdaq will keep the PHLX’s current structure, which includes a hybridtrading platform for options. When the Nasdaq’s options exchange begins oper-ations in December, the Nasdaq will be the only one of the six U.S. optionsmarkets to offer customers a market-maker driven model and a price-time orderbook model.
“Philadelphia has successfully offered floor and electronic trading for sometime. We think this capability will continue to be the best approach to servingoptions traders as the options market continues to evolve,” says ChrisConcannon, the Nasdaq’s executive vice president of transaction services. “Inaddition to firmly establishing the Nasdaq’s presence in the options market, thisacquisition also enhances our organic growth strategy, which will come tofruition next month when we launch our price-time priority options platform.”
The deal will also give the Nasdaq control of the PHLX’s little-used stockexchange, as well as a futures business run by the Philadelphia Board of Tradeand the Stock Clearing Corporation of Philadelphia.
The deal was made possible only after the PHLX officially settled a classaction suit in October.
The lawsuit, brought by PHLX shareholder Chuck Ginsburg, was settled inprinciple in June but was officially resolved in the Delaware Chancery Court inOctober. Ginsburg challenged PHLX’s 2005 decision to sell 90 percent of theexchange to six large brokers and Wall Street firms, leaving the original mem-bers with 10 percent. Ginsburg contended the sale severely — and illegally —diluted original shareholders’ stakes.
“This is a very exciting time for the exchange and we are delighted that theDelaware court has approved settlement of the litigation which has createduncertainty at the exchange for the last 16 months,” Frucher said in a state-ment. “This is a good result for the exchange and all of its constituents.”!

46 www.activetradermag.com • January 2008 • ACTIVE TRADER
B ATS Trading, the upstart
Electronic Communications
Network (ECN) that has
become the No. 3 trading
venue by volume in less than two years,
is trying to increase its presence in the
U.S. while establishing one in Europe.
In early November, BATS filed with the
Securities and Exchange Commission
(SEC) to become a full-fledged exchange.
“Our motivation to become an
exchange stems from our desire to partic-
ipate directly in the national market sys-
tem,” says Joe Ratterman, BATS CEO.
“The BATS organization, and more
importantly our subscribers, will benefit
in many ways from BATS being directly
connected to the industry plans. We also
desire to be on the same regulatory play-
ing field as our primary competitors —
Nasdaq and the New York Stock
Exchange.”
Becoming an exchange would give
BATS an opportunity to list its own
quotes. Right now, it lists quotes on the
National Stock Exchange and the
International Securities Exchange.
Additionally, BATS would gain extra
revenue by sharing in tape revenue.
“In terms of the critical metric of
matched market share, BATS has clearly
established itself as the third largest mar-
ket center in the U.S.,” Ratterman says.
“Taking the necessary steps to operate our
market as a registered securities exchange
is the right thing to do and shows the
maturity and credibility that BATS brings
to participating in the national market
system.
“We want to provide our customers a
viable, competitive, and long-term alter-
native to the two incumbent exchanges.”
In October, BATS announced it was
looking into the possibility of launching
in Europe a system similar to what it has
in the U.S.
“We are in the early stages of evaluat-
ing setting up an operation in Europe and
have been approached by a number of
companies in the past year,” says Randy
Williams, a vice president at BATS.
Beginning in November, European
markets began trading on the MIFID
(markets in financial instruments direc-
tive) platform, a system created by the
European Union. MIFID is expected to
increase average daily volume at
European stock markets, and BATS is
hoping to take advantage of that.
Project Turquoise, a trading platform
funded and run by seven large European
investment banks, has been in the works
since last November, but technical prob-
lems have delayed its launch, and BATS
could be the beneficiary if it establishes a
presence soon enough.
MIFID eliminates old rules that
required market participants to use
national exchanges for trading and
reporting, thus opening the door for
alternative systems. NYSE Euronext has
already struck a deal with two banks to
help in trading large orders, while
Citigroup and Instinet also have plat-
forms in place.
BATS made its mark in the U.S. by
slashing fees and providing a cheaper
alternative to the big two exchanges. It
routinely trades 15 percent of daily
Nasdaq volume.!
On the radar
BATS eyes two new opportunities
trillion by the year 2011 from investorsaround the world, according to a researchreport by Boston-based consulting firmCasey, Quirk & Associates. Institutionalinvestment is expected to exceed $1 tril-lion. The report says these assets will beinexpensive to trade, leading to theirappeal, and about one-third of the moneywill be invested in swap contracts or otherexchange-listed products that mimic theunderlying investment.
Coming up shortNew York-based Sandell AssetManagement agreed to an $8.2-millionsettlement after the Securities andExchange Commission (SEC) found thefirm illegally sold short the shares of aNew Orleans bank in the wake ofHurricane Katrina. The SEC said that inan effort to offset losses in a long posi-tion in Hibernia Bank, Sandell shortedshares it did not own, a techniqueknown as naked shorting. The firmgave back the $6.7 million it made fromthe trades, plus interest and a$650,000 fine. The firm’s founder,Thomas E. Sandell, agreed to a$100,000 fine, and two employeeswere fined $90,000. Sandell and itsemployees neither admitted nor deniedany wrongdoing.
Jury finds Merrill Lynch full of bullMerrill Lynch was ordered by a Floridajury to pay $6 million to the daughtersof a philanthropist. George Rothmanand his wife had $32 million in assets ina Merrill Lynch account, but both weredeclared mentally incompetent in 1999.A jury agreed with the Rothman daugh-ters that Merrill Lynch took advantage ofthe situation by transferring theRothmans’ money into investments thatpaid higher commissions. GeorgeRothman died in 2004. His lawyers sayMerrill Lynch made at least $2.5 millionin fees on investments the Rothmansknew nothing about. In a statement,Merrill said, “The verdict is astonishing inlight of the undisputed fact that theRothmans, who were wealthy, sophisti-cated investors, made $10 million onthe annuities at issue, and did not losemoney.”
Quick Scalpscontinued from p. 44
Inside the Market continued
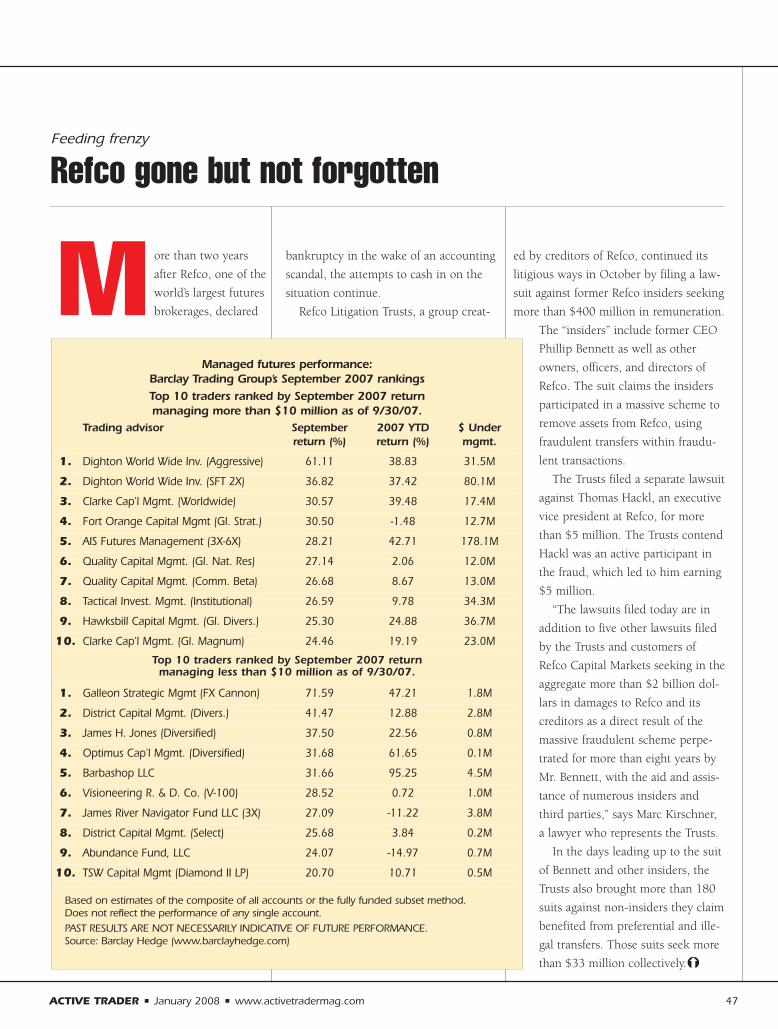
M ore than two years
after Refco, one of the
world’s largest futures
brokerages, declared
bankruptcy in the wake of an accounting
scandal, the attempts to cash in on the
situation continue.
Refco Litigation Trusts, a group creat-
ed by creditors of Refco, continued its
litigious ways in October by filing a law-
suit against former Refco insiders seeking
more than $400 million in remuneration.
The “insiders” include former CEO
Phillip Bennett as well as other
owners, officers, and directors of
Refco. The suit claims the insiders
participated in a massive scheme to
remove assets from Refco, using
fraudulent transfers within fraudu-
lent transactions.
The Trusts filed a separate lawsuit
against Thomas Hackl, an executive
vice president at Refco, for more
than $5 million. The Trusts contend
Hackl was an active participant in
the fraud, which led to him earning
$5 million.
“The lawsuits filed today are in
addition to five other lawsuits filed
by the Trusts and customers of
Refco Capital Markets seeking in the
aggregate more than $2 billion dol-
lars in damages to Refco and its
creditors as a direct result of the
massive fraudulent scheme perpe-
trated for more than eight years by
Mr. Bennett, with the aid and assis-
tance of numerous insiders and
third parties,” says Marc Kirschner,
a lawyer who represents the Trusts.
In the days leading up to the suit
of Bennett and other insiders, the
Trusts also brought more than 180
suits against non-insiders they claim
benefited from preferential and ille-
gal transfers. Those suits seek more
than $33 million collectively.!
ACTIVE TRADER • January 2008 • www.activetradermag.com 47
Managed futures performance: Barclay Trading Group’s September 2007 rankingsTop 10 traders ranked by September 2007 return managing more than $10 million as of 9/30/07.
Trading advisor September 2007 YTD $ Under return (%) return (%) mgmt.
1. Dighton World Wide Inv. (Aggressive) 61.11 38.83 31.5M
2. Dighton World Wide Inv. (SFT 2X) 36.82 37.42 80.1M
3. Clarke Cap'l Mgmt. (Worldwide) 30.57 39.48 17.4M
4. Fort Orange Capital Mgmt (Gl. Strat.) 30.50 -1.48 12.7M
5. AIS Futures Management (3X-6X) 28.21 42.71 178.1M
6. Quality Capital Mgmt. (Gl. Nat. Res) 27.14 2.06 12.0M
7. Quality Capital Mgmt. (Comm. Beta) 26.68 8.67 13.0M
8. Tactical Invest. Mgmt. (Institutional) 26.59 9.78 34.3M
9. Hawksbill Capital Mgmt. (Gl. Divers.) 25.30 24.88 36.7M
10. Clarke Cap'l Mgmt. (Gl. Magnum) 24.46 19.19 23.0M
Top 10 traders ranked by September 2007 returnmanaging less than $10 million as of 9/30/07.
1. Galleon Strategic Mgmt (FX Cannon) 71.59 47.21 1.8M
2. District Capital Mgmt. (Divers.) 41.47 12.88 2.8M
3. James H. Jones (Diversified) 37.50 22.56 0.8M
4. Optimus Cap'l Mgmt. (Diversified) 31.68 61.65 0.1M
5. Barbashop LLC 31.66 95.25 4.5M
6. Visioneering R. & D. Co. (V-100) 28.52 0.72 1.0M
7. James River Navigator Fund LLC (3X) 27.09 -11.22 3.8M
8. District Capital Mgmt. (Select) 25.68 3.84 0.2M
9. Abundance Fund, LLC 24.07 -14.97 0.7M
10. TSW Capital Mgmt (Diamond II LP) 20.70 10.71 0.5M
Based on estimates of the composite of all accounts or the fully funded subset method.Does not reflect the performance of any single account.PAST RESULTS ARE NOT NECESSARILY INDICATIVE OF FUTURE PERFORMANCE.Source: Barclay Hedge (www.barclayhedge.com)
Feeding frenzy
Refco gone but not forgotten
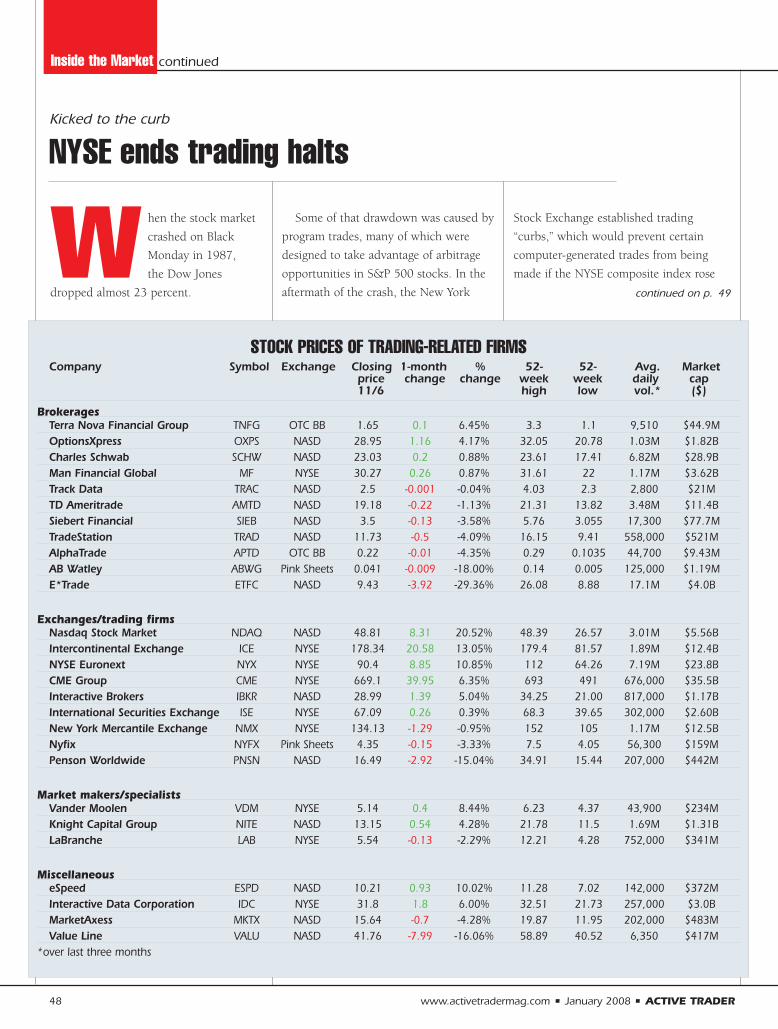
48 www.activetradermag.com • January 2008 • ACTIVE TRADER
Inside the Market continued
W hen the stock market
crashed on Black
Monday in 1987,
the Dow Jones
dropped almost 23 percent.
Some of that drawdown was caused by
program trades, many of which were
designed to take advantage of arbitrage
opportunities in S&P 500 stocks. In the
aftermath of the crash, the New York
Stock Exchange established trading
“curbs,” which would prevent certain
computer-generated trades from being
made if the NYSE composite index rose
Kicked to the curb
NYSE ends trading halts
STOCK PRICES OF TRADING-RELATED FIRMSCompany Symbol Exchange Closing 1-month % 52- 52- Avg. Market
price change change week week daily cap11/6 high low vol.* ($)
BrokeragesTerra Nova Financial Group TNFG OTC BB 1.65 0.1 6.45% 3.3 1.1 9,510 $44.9MOptionsXpress OXPS NASD 28.95 1.16 4.17% 32.05 20.78 1.03M $1.82BCharles Schwab SCHW NASD 23.03 0.2 0.88% 23.61 17.41 6.82M $28.9BMan Financial Global MF NYSE 30.27 0.26 0.87% 31.61 22 1.17M $3.62BTrack Data TRAC NASD 2.5 -0.001 -0.04% 4.03 2.3 2,800 $21MTD Ameritrade AMTD NASD 19.18 -0.22 -1.13% 21.31 13.82 3.48M $11.4BSiebert Financial SIEB NASD 3.5 -0.13 -3.58% 5.76 3.055 17,300 $77.7MTradeStation TRAD NASD 11.73 -0.5 -4.09% 16.15 9.41 558,000 $521MAlphaTrade APTD OTC BB 0.22 -0.01 -4.35% 0.29 0.1035 44,700 $9.43MAB Watley ABWG Pink Sheets 0.041 -0.009 -18.00% 0.14 0.005 125,000 $1.19ME*Trade ETFC NASD 9.43 -3.92 -29.36% 26.08 8.88 17.1M $4.0B
Exchanges/trading firmsNasdaq Stock Market NDAQ NASD 48.81 8.31 20.52% 48.39 26.57 3.01M $5.56BIntercontinental Exchange ICE NYSE 178.34 20.58 13.05% 179.4 81.57 1.89M $12.4BNYSE Euronext NYX NYSE 90.4 8.85 10.85% 112 64.26 7.19M $23.8BCME Group CME NYSE 669.1 39.95 6.35% 693 491 676,000 $35.5BInteractive Brokers IBKR NASD 28.99 1.39 5.04% 34.25 21.00 817,000 $1.17BInternational Securities Exchange ISE NYSE 67.09 0.26 0.39% 68.3 39.65 302,000 $2.60BNew York Mercantile Exchange NMX NYSE 134.13 -1.29 -0.95% 152 105 1.17M $12.5BNyfix NYFX Pink Sheets 4.35 -0.15 -3.33% 7.5 4.05 56,300 $159MPenson Worldwide PNSN NASD 16.49 -2.92 -15.04% 34.91 15.44 207,000 $442M
Market makers/specialistsVander Moolen VDM NYSE 5.14 0.4 8.44% 6.23 4.37 43,900 $234MKnight Capital Group NITE NASD 13.15 0.54 4.28% 21.78 11.5 1.69M $1.31BLaBranche LAB NYSE 5.54 -0.13 -2.29% 12.21 4.28 752,000 $341M
MiscellaneouseSpeed ESPD NASD 10.21 0.93 10.02% 11.28 7.02 142,000 $372MInteractive Data Corporation IDC NYSE 31.8 1.8 6.00% 32.51 21.73 257,000 $3.0BMarketAxess MKTX NASD 15.64 -0.7 -4.28% 19.87 11.95 202,000 $483MValue Line VALU NASD 41.76 -7.99 -16.06% 58.89 40.52 6,350 $417M
*over last three months
continued on p. 49
49 www.activetradermag.com • January 2008 • ACTIVE TRADER
Inside the Market continued
or fell more than 2 percent.
However, almost 20 years to the day
after the crash, the NYSE announced it
would do away with trading curbs, saying
they had lost much of their effectiveness.
Curbs have been implemented 18
times in 2007, but in its filing with the
Securities and Exchange Commission, the
Big Board said the curbs have little impact
on volatility.
“Volatility is neither restrained nor
enhanced by the imposition of the col-
lars,” the filing said. “The exchange is
making this change since it does not
appear that the approach of market
volatility envisioned by the use of these
collars is as meaningful today as when the
rule was formalized in the late 1980s.”
The increase in electronic trading has
reduced the impact index arbitrage trades
have on the market. The latest data avail-
able from the NYSE indicates less than 5
percent of total volume is done through
those types of trades.
On Black Monday, program trades
accounted for a little more than 12 per-
cent of volume, although index arbitrage
trades were responsible for only about 3.2
percent of trading.
Even with the curbs eliminated, bro-
kerages would still have to report any
program trades, which the NYSE has clas-
sified as a basket of at least 15 stocks with
a value of at least $1 million.!
Curbs continued from p. 48
On the block
NYSE makes a BID(S) for new system
B IDS Trading, an alternative trading system developed by a consor-tium of big banks and financial firms, has made its name in themarketplace by providing an anonymous venue for trading large
blocks of shares (more than 10,000).BIDS has been a popular choice for block traders looking for a counter-
party to make a large trade without giving away their intentions in themarket. The platform traded more than 1 billion shares (double counted)in less than 125 trading days.
Because of BIDS’ success, NYSE Euronext wants in on the fun. In lateOctober, the two groups hooked up in an effort to improve executionquality and availability of liquidity for NYSE firms trading large blocks.
Both BIDS and NYSE Euronext will have a 50-percent stake in the ven-ture, which must still gain regulatory approval.
“We believe this approach with BIDS Holdings will serve our clients andmarkets well by bringing block-size orders back into contact with activetraders, algorithms, and retail flow,” says Duncan Niederauer, presidentand co-COO of NYSE Euronext.
BIDS’ platform allows traders to control how much information about atrade they want disclosed. They can auto-execute their order or choose tonegotiate for a better price, they can set a minimum block size, and theycan choose not to trade with certain parties based on past behavior.
“We expect that the joint venture will address the current inefficienciesin block trading, such as market fragmentation,” BIDS CEO Tim Mahoneysays. “Moreover, this initiative is an endorsement of our efforts to build theleading block interest discovery and trading system in the U.S.”

The UK’s Q3 GDP rose 0.8 percentfrom the previous quarter andincreased 3.3 percent on an annualbasis. The country’s unemployment ratefor June through August remained at5.4 percent compared to the previousthree-month period and fell 0.2 percentcompared to the same three months in2006.
Germany’s August unemploymentfell 0.1 percent from the previousmonth to 6.1 percent, a drop of 2.1percent compared to August 2006.
The INSEE, the French governmentagency responsible for economic releas-es in the country, has temporarilystopped publishing its unemploy-ment report, saying the usual calcula-tion methods “were no longer suitable,because of the sharply divergentchanges in the two information sourcesfrom which the series were compiled.”Nonetheless, the INSEE’s October 2007economic analysis report stated “theFrench economy is projected to createnearly 340,000 new jobs in 2007.” Thegroup predicted economic growth of0.7 percent in Q3 and 0.5 percent inQ4, despite a weaker global economicenvironment.
Russia’s third-quarter GDP grew 7.4percent on an annual basis, an increasefrom the 6.6-percent growth the coun-try enjoyed for the same period in2006. Russian economists have forecasta yearly GDP growth of 6.5 percent,although the country is ahead of thatprojection.
The Moscow Interbank CurrencyExchange (MICEX) handled morethan $2 trillion in trades through thefirst nine months of 2007, placing itamong the top 20 exchanges globallyfor the first time. The MICEX has beenaround for 15 years, and while its vol-
ume is not growing on the same paceas exchanges such as the NYSE andthose in Asia, it is attracting attentionfor the first time.
The London Stock Exchange (LSE)continues to upgrade its trading sys-tem, announcing in late October it wasincreasing the platform’s speed by 40percent to a trade execution time ofless than 10 milliseconds. TradElect, theLSE’s platform, had an average execu-tion time of 140 milliseconds when itstarted in June, the exchange said.Capacity was also increased onTradElect, from 3,000 orders per sec-ond to 4,200 orders per second.
The European Energy Exchange(EEX) and Eurex have partnered tobegin trading emissions. Members ofboth exchanges will be able to tradeEEX carbon dioxide products throughthe Eurex platform, which will guaran-tee clearing and settlement of the prod-ucts. The two exchanges have morethan 600 member firms between them,the largest international network foremissions trading. Market makers, whowill ensure liquidity, have already beenselected.
China’s foreign exchange reserveswere more than 1.43 trillion dollars atthe end of September, the country’scentral bank said. That’s an increase of45.1 percent from a year earlier. Thecountry’s trade surplus for the first ninemonths was $185.7 billion, alreadymore than in all of 2006.
Hong Kong’s Q3 unemploymentrate fell 0.1 percent from Q2 to 4.1percent, a drop of 0.6 percent from thesame quarter in 2006 and the lowestlevel in nine years. A governmentspokesman said sustained economicgrowth offset summer workers return-ing to school for the new academicyear.
Japan’s August jobless rateincreased 0.2 percent from the previousmonth to 3.8 percent, a decline of 0.3percent compared to the same monthin 2006.
Australia’s September jobless ratedropped 0.1 percent from the previousmonth to 4.2 percent, a decline of 0.5percent from the same month a yearearlier.
China’s Q3 GDP grew 11.5 percenton an annual basis. While the totalexceeded China’s forecast of 8 percentand kept the country on track for itsfifth-straight year of double-digitgrowth, it was down slightly from 11.9percent in the second quarter, primarilybecause of export reduction.
The Singapore Exchange’s net prof-its for the second quarter tripled fromthe previous quarter as volume rosesubstantially. Many regional indices hitall-time or multi-year highs, and theexchange benefited from increased list-ings from Chinese firms.
Six traders are suing the SydneyFutures Exchange (SFE), claimingthe SFE cancelled trades that led toalmost 1 million Australian dollars inlosses. The trades were cancelled inAustralian fixed-income products afterconsumer price index data wasreleased in July. The SFE says the tradeswere erased after someone at theexchange entered an incorrect numberof trades into the system, causing erro-neous pricing. While the trades madeby the six complainants were cancelled,other trades contingent on the originaldeals weren’t, leading to the losses.
The Dalian Commodity Exchange(DCX) in Beijing received approval totrade palm oil futures, the fourth newproduct launched by the DCX this yearafter zinc, rapeseed oil, and linear lowdensity polyethene. The exchange hasnot specified an exact date but said onits Web site it had completed all thepreparations necessary for launch.While China uses more palm oil thanany other country, it does not produce
ASIA &AUSTRALIA
50 www.activetradermag.com • January 2008 • ACTIVE TRADER
Inside the Market continued
EUROPE
Global News
ACTIVE TRADER • January 2008 • www.activetradermag.com 51
any. In 2006, it imported more than 5million tons of palm oil.
The National Commodity andDerivatives Exchange (NCDEX) ofIndia plans to begin a spot market —the NCDEX Spot Exchange — and saysbullion will be one of the main prod-ucts. The Spot Exchange will allowtraders to trade directly, and the priceswill be set by the international market.The NCDEX is also awaiting approval tobegin trading weather and indexfutures.
The Shenzhen Stock Exchange hasenlisted help from the Nasdaq as it pre-pares to launch a Nasdaq-like marketfor start-up firms. The two exchangessigned a memorandum of understand-ing (MOU) in October, which theNasdaq hopes will lead to smallerChinese firms listing on the Nasdaq. InSeptember, the Nasdaq receivedapproval from the Chinese governmentto establish an office in Beijing. TheNasdaq and the NYSE are the only twoforeign exchanges approved by theChinese government, although the UK,Germany, Singapore, Hong Kong, andSouth Korea have shown interest.
After an announcement by theSecurities and Exchange Board ofIndia (SEBI) roiled the Indian marketsin early October, the SEBI changed itsstance and said it would allow hedgefunds greater access to the Indian mar-kets. In an effort to minimize foreigninvolvement in the Indian markets, theSEBI initially placed restrictions on thefunds, which caused the Indian bench-mark Sensex index to fall 9 percent themorning of the announcement. TheSEBI was initially concerned that a dis-proportionate amount of foreign invest-ment could pose a systemic risk toIndia’s financial system.
Canada’s September jobless ratedropped 0.1 percent from the previousmonth to 5.9 percent, the first timesince November 1974 that Canadianunemployment was less than 6 per-
cent. Employment gains in educationalservices increased by an estimated25,000 and helped to offset declinesobserved earlier in the summer. Thisjump spurred public-sector employmentgrowth to 4.4 percent on the yearthrough October, while the private-sec-tor growth was only 0.4 percent.
Brazil’s August unemploymentrate was unchanged at 9.5 percentfrom the previous month and fell 1.1percent from the same month in 2006.
South Africa’s second-quarterunemployment remained unchanged
at 25.5 percent from the previous quar-ter. The rate dropped 0.1 percent fromthe second quarter in 2006.
The Ethiopian government is hoping anew commodity exchange will minimizethe effects of famine in the country andencourage agricultural growth. TheEthiopia Commodity Exchange(ECEX) is scheduled to begin trading inDecember. Its goal is to provide a bettermethod of pricing agricultural productsand minimize risk for producers, hope-fully leading to more citizens producingagriculture. Ethiopia’s government hasbeen notorious for micromanaging thecountry’s agriculture, although conven-tional wisdom is the exchange will helpthe country manage surplus quantitiesof grains.
AMERICAS
Interest-rate monitorThe People’s Bank of China increased its one-year yuanlending rate 0.17 percent to 7.29 percent in September.
The Bank of Norway raised its deposit rate 0.25 percentto 5 percent in late September. The bank has raised rates 25 basispoints 12 times since November 2005.
The South African Reserve Bank boosted its repurchaserate 0.5 percent in October to 10.5 percent. The increase is thethird 50-basis-point increase since June and the seventh since June2006.
The Central Bank of Turkey dropped its overnight bor-rowing rate 0.5 percent in October to 16.75 percent. The reduc-tion is the second in as many months, and it follows a period ofinactivity that stretches back to July 2006.
The National Bank of Hungary dropped its two-weekdeposit rate 0.25 percent in September to 7.5 percent, the sec-ond decline in four months after a five-month tightening period inmid- to late-2006.
The Central Bank of the Philippines dropped its overnightborrowing rate 0.25 percent in October to 5.75 percent. Thedrop comes three months after a huge 1.5-percent reduction,which was the first move in the rate since October 2005.
!!
!!
!!
!!
!!
""
AFRICA
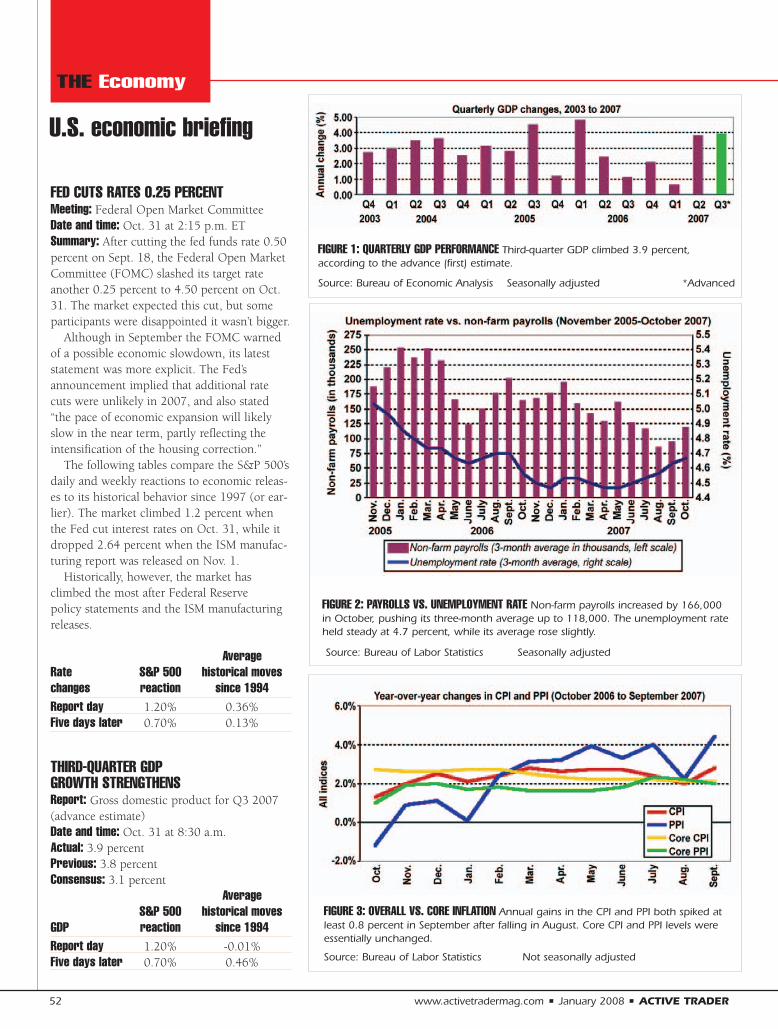
FED CUTS RATES 0.25 PERCENTMeeting: Federal Open Market Committee Date and time: Oct. 31 at 2:15 p.m. ETSummary: After cutting the fed funds rate 0.50percent on Sept. 18, the Federal Open MarketCommittee (FOMC) slashed its target rateanother 0.25 percent to 4.50 percent on Oct.31. The market expected this cut, but someparticipants were disappointed it wasn’t bigger.
Although in September the FOMC warnedof a possible economic slowdown, its lateststatement was more explicit. The Fed’sannouncement implied that additional ratecuts were unlikely in 2007, and also stated“the pace of economic expansion will likelyslow in the near term, partly reflecting theintensification of the housing correction.”
The following tables compare the S&P 500’sdaily and weekly reactions to economic releas-es to its historical behavior since 1997 (or ear-lier). The market climbed 1.2 percent whenthe Fed cut interest rates on Oct. 31, while itdropped 2.64 percent when the ISM manufac-turing report was released on Nov. 1.
Historically, however, the market hasclimbed the most after Federal Reserve policy statements and the ISM manufacturingreleases.
Average Rate S&P 500 historical moves changes reaction since 1994Report day 1.20% 0.36%Five days later 0.70% 0.13%
THIRD-QUARTER GDP GROWTH STRENGTHENS Report: Gross domestic product for Q3 2007(advance estimate)Date and time: Oct. 31 at 8:30 a.m.Actual: 3.9 percentPrevious: 3.8 percentConsensus: 3.1 percent
Average S&P 500 historical moves
GDP reaction since 1994Report day 1.20% -0.01%Five days later 0.70% 0.46%
FIGURE 3: OVERALL VS. CORE INFLATION Annual gains in the CPI and PPI both spiked atleast 0.8 percent in September after falling in August. Core CPI and PPI levels wereessentially unchanged.
Source: Bureau of Labor Statistics Not seasonally adjusted
Source: Bureau of Labor Statistics Seasonally adjusted
THE Economy
FIGURE 1: QUARTERLY GDP PERFORMANCE Third-quarter GDP climbed 3.9 percent, according to the advance (first) estimate.
Source: Bureau of Economic Analysis Seasonally adjusted *Advanced
U.S. economic briefing
52 www.activetradermag.com • January 2008 • ACTIVE TRADER
FIGURE 2: PAYROLLS VS. UNEMPLOYMENT RATE Non-farm payrolls increased by 166,000in October, pushing its three-month average up to 118,000. The unemployment rateheld steady at 4.7 percent, while its average rose slightly.
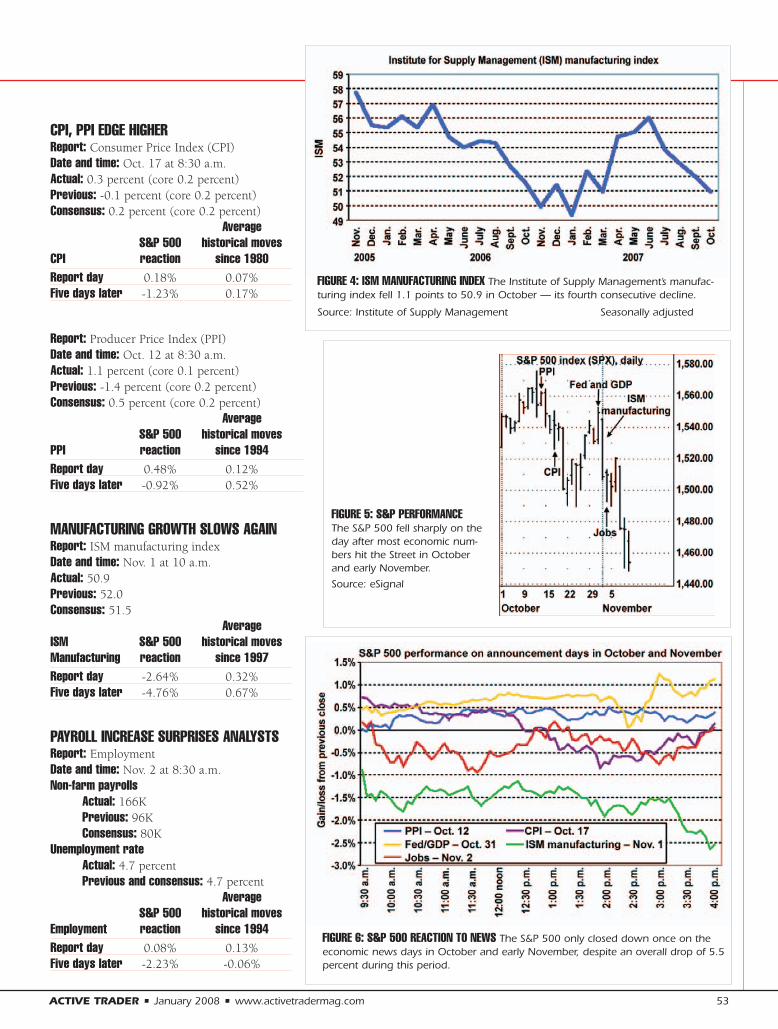
CPI, PPI EDGE HIGHERReport: Consumer Price Index (CPI)Date and time: Oct. 17 at 8:30 a.m. Actual: 0.3 percent (core 0.2 percent)Previous: -0.1 percent (core 0.2 percent)Consensus: 0.2 percent (core 0.2 percent)
Average S&P 500 historical moves
CPI reaction since 1980Report day 0.18% 0.07%Five days later -1.23% 0.17%
Report: Producer Price Index (PPI) Date and time: Oct. 12 at 8:30 a.m.Actual: 1.1 percent (core 0.1 percent)Previous: -1.4 percent (core 0.2 percent)Consensus: 0.5 percent (core 0.2 percent)
Average S&P 500 historical moves
PPI reaction since 1994Report day 0.48% 0.12%Five days later -0.92% 0.52%
MANUFACTURING GROWTH SLOWS AGAINReport: ISM manufacturing indexDate and time: Nov. 1 at 10 a.m.Actual: 50.9 Previous: 52.0Consensus: 51.5
Average ISM S&P 500 historical moves Manufacturing reaction since 1997Report day -2.64% 0.32%Five days later -4.76% 0.67%
PAYROLL INCREASE SURPRISES ANALYSTSReport: EmploymentDate and time: Nov. 2 at 8:30 a.m.Non-farm payrolls
Actual: 166KPrevious: 96KConsensus: 80K
Unemployment rateActual: 4.7 percentPrevious and consensus: 4.7 percent
Average S&P 500 historical moves
Employment reaction since 1994Report day 0.08% 0.13%Five days later -2.23% -0.06%
FIGURE 5: S&P PERFORMANCEThe S&P 500 fell sharply on theday after most economic num-bers hit the Street in Octoberand early November.Source: eSignal
FIGURE 4: ISM MANUFACTURING INDEX The Institute of Supply Management’s manufac-turing index fell 1.1 points to 50.9 in October — its fourth consecutive decline.
Source: Institute of Supply Management Seasonally adjusted
FIGURE 6: S&P 500 REACTION TO NEWS The S&P 500 only closed down once on theeconomic news days in October and early November, despite an overall drop of 5.5percent during this period.
ACTIVE TRADER • January 2008 • www.activetradermag.com 53
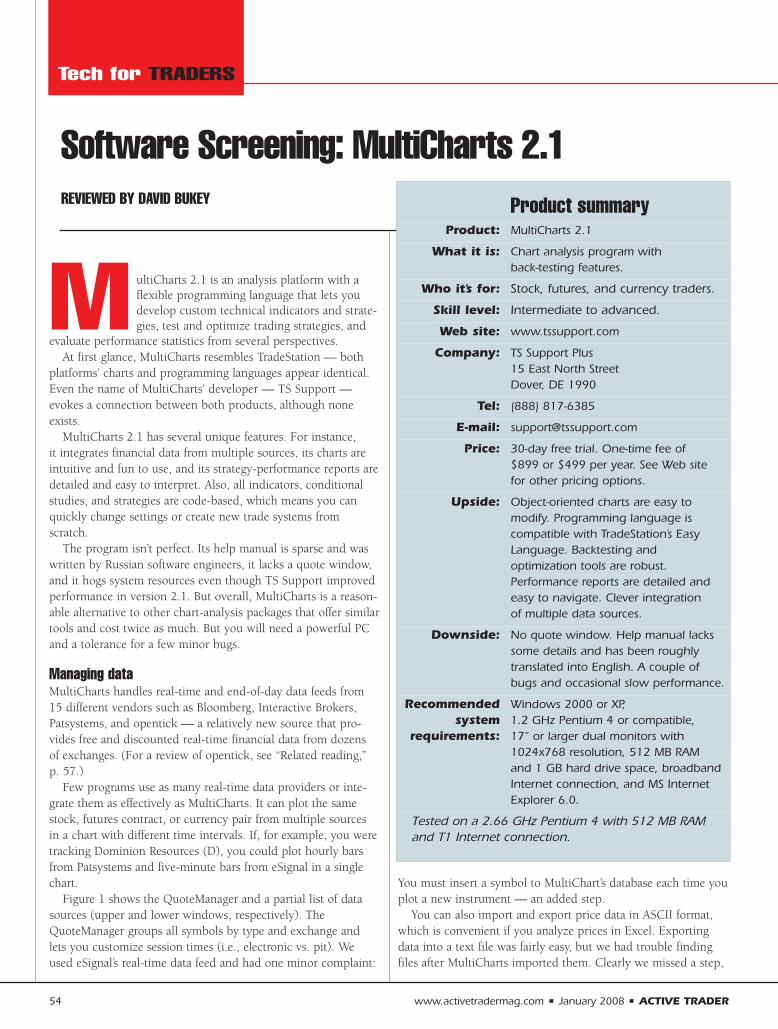
M ultiCharts 2.1 is an analysis platform with aflexible programming language that lets youdevelop custom technical indicators and strate-gies, test and optimize trading strategies, and
evaluate performance statistics from several perspectives.At first glance, MultiCharts resembles TradeStation — both
platforms’ charts and programming languages appear identical.Even the name of MultiCharts’ developer — TS Support —evokes a connection between both products, although noneexists.
MultiCharts 2.1 has several unique features. For instance, it integrates financial data from multiple sources, its charts areintuitive and fun to use, and its strategy-performance reports aredetailed and easy to interpret. Also, all indicators, conditionalstudies, and strategies are code-based, which means you canquickly change settings or create new trade systems fromscratch.
The program isn’t perfect. Its help manual is sparse and waswritten by Russian software engineers, it lacks a quote window,and it hogs system resources even though TS Support improvedperformance in version 2.1. But overall, MultiCharts is a reason-able alternative to other chart-analysis packages that offer similartools and cost twice as much. But you will need a powerful PCand a tolerance for a few minor bugs.
Managing data MultiCharts handles real-time and end-of-day data feeds from15 different vendors such as Bloomberg, Interactive Brokers,Patsystems, and opentick — a relatively new source that pro-vides free and discounted real-time financial data from dozens of exchanges. (For a review of opentick, see “Related reading,” p. 57.)
Few programs use as many real-time data providers or inte-grate them as effectively as MultiCharts. It can plot the samestock, futures contract, or currency pair from multiple sourcesin a chart with different time intervals. If, for example, you weretracking Dominion Resources (D), you could plot hourly barsfrom Patsystems and five-minute bars from eSignal in a singlechart.
Figure 1 shows the QuoteManager and a partial list of datasources (upper and lower windows, respectively). TheQuoteManager groups all symbols by type and exchange andlets you customize session times (i.e., electronic vs. pit). Weused eSignal’s real-time data feed and had one minor complaint:
You must insert a symbol to MultiChart’s database each time youplot a new instrument — an added step.
You can also import and export price data in ASCII format,which is convenient if you analyze prices in Excel. Exportingdata into a text file was fairly easy, but we had trouble findingfiles after MultiCharts imported them. Clearly we missed a step,
54 www.activetradermag.com • January 2008 • ACTIVE TRADER
Software Screening: MultiCharts 2.1
Tech for TRADERS
Product summaryProduct: MultiCharts 2.1
What it is: Chart analysis program with back-testing features.
Who it’s for: Stock, futures, and currency traders.
Skill level: Intermediate to advanced.
Web site: www.tssupport.com
Company: TS Support Plus15 East North StreetDover, DE 1990
Tel: (888) 817-6385
E-mail: [email protected]
Price: 30-day free trial. One-time fee of $899 or $499 per year. See Web site for other pricing options.
Upside: Object-oriented charts are easy to modify. Programming language is compatible with TradeStation’s Easy Language. Backtesting and optimization tools are robust. Performance reports are detailed and easy to navigate. Clever integration of multiple data sources.
Downside: No quote window. Help manual lacks some details and has been roughly translated into English. A couple of bugs and occasional slow performance.
Recommended Windows 2000 or XP, system 1.2 GHz Pentium 4 or compatible,
requirements: 17” or larger dual monitors with 1024x768 resolution, 512 MB RAM and 1 GB hard drive space, broadband Internet connection, and MS Internet Explorer 6.0.
Tested on a 2.66 GHz Pentium 4 with 512 MB RAMand T1 Internet connection.
REVIEWED BY DAVID BUKEY
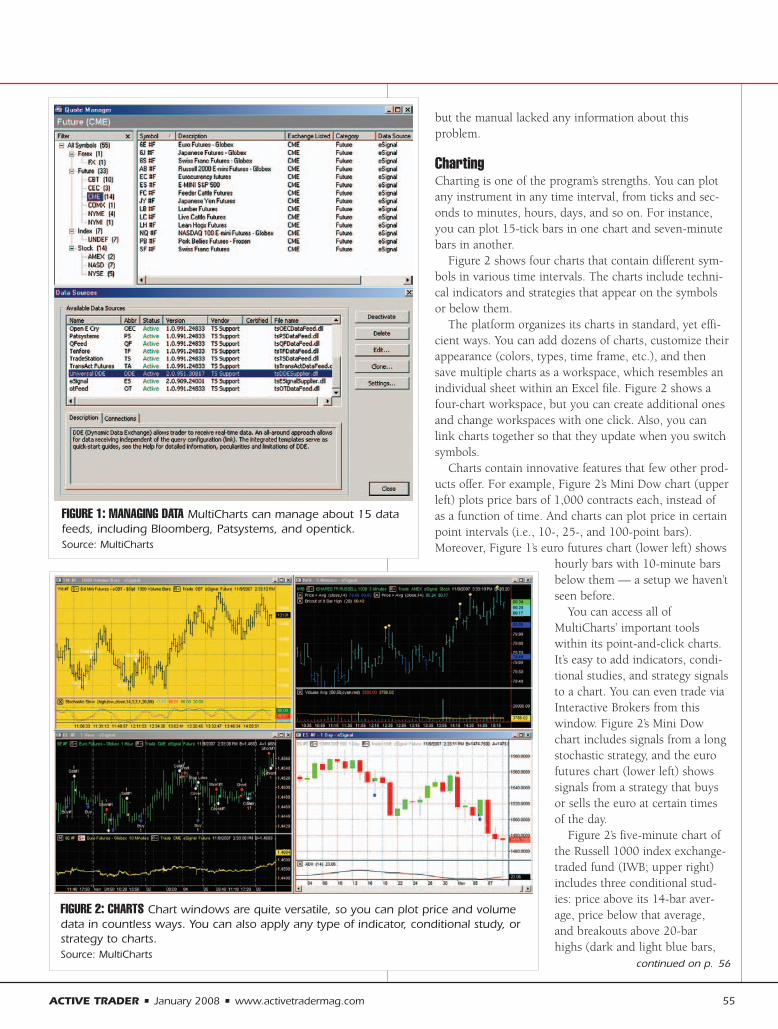
but the manual lacked any information about this problem.
ChartingCharting is one of the program’s strengths. You can plotany instrument in any time interval, from ticks and sec-onds to minutes, hours, days, and so on. For instance,you can plot 15-tick bars in one chart and seven-minutebars in another.
Figure 2 shows four charts that contain different sym-bols in various time intervals. The charts include techni-cal indicators and strategies that appear on the symbolsor below them.
The platform organizes its charts in standard, yet effi-cient ways. You can add dozens of charts, customize theirappearance (colors, types, time frame, etc.), and thensave multiple charts as a workspace, which resembles anindividual sheet within an Excel file. Figure 2 shows afour-chart workspace, but you can create additional onesand change workspaces with one click. Also, you canlink charts together so that they update when you switchsymbols.
Charts contain innovative features that few other prod-ucts offer. For example, Figure 2’s Mini Dow chart (upperleft) plots price bars of 1,000 contracts each, instead ofas a function of time. And charts can plot price in certainpoint intervals (i.e., 10-, 25-, and 100-point bars).Moreover, Figure 1’s euro futures chart (lower left) shows
hourly bars with 10-minute barsbelow them — a setup we haven’tseen before.
You can access all ofMultiCharts’ important toolswithin its point-and-click charts.It’s easy to add indicators, condi-tional studies, and strategy signalsto a chart. You can even trade viaInteractive Brokers from this window. Figure 2’s Mini Dowchart includes signals from a longstochastic strategy, and the eurofutures chart (lower left) showssignals from a strategy that buysor sells the euro at certain timesof the day.
Figure 2’s five-minute chart ofthe Russell 1000 index exchange-traded fund (IWB; upper right)includes three conditional stud-ies: price above its 14-bar aver-age, price below that average, and breakouts above 20-bar highs (dark and light blue bars,
ACTIVE TRADER • January 2008 • www.activetradermag.com 55
continued on p. 56
FIGURE 2: CHARTS Chart windows are quite versatile, so you can plot price and volumedata in countless ways. You can also apply any type of indicator, conditional study, orstrategy to charts.Source: MultiCharts
FIGURE 1: MANAGING DATA MultiCharts can manage about 15 datafeeds, including Bloomberg, Patsystems, and opentick. Source: MultiCharts
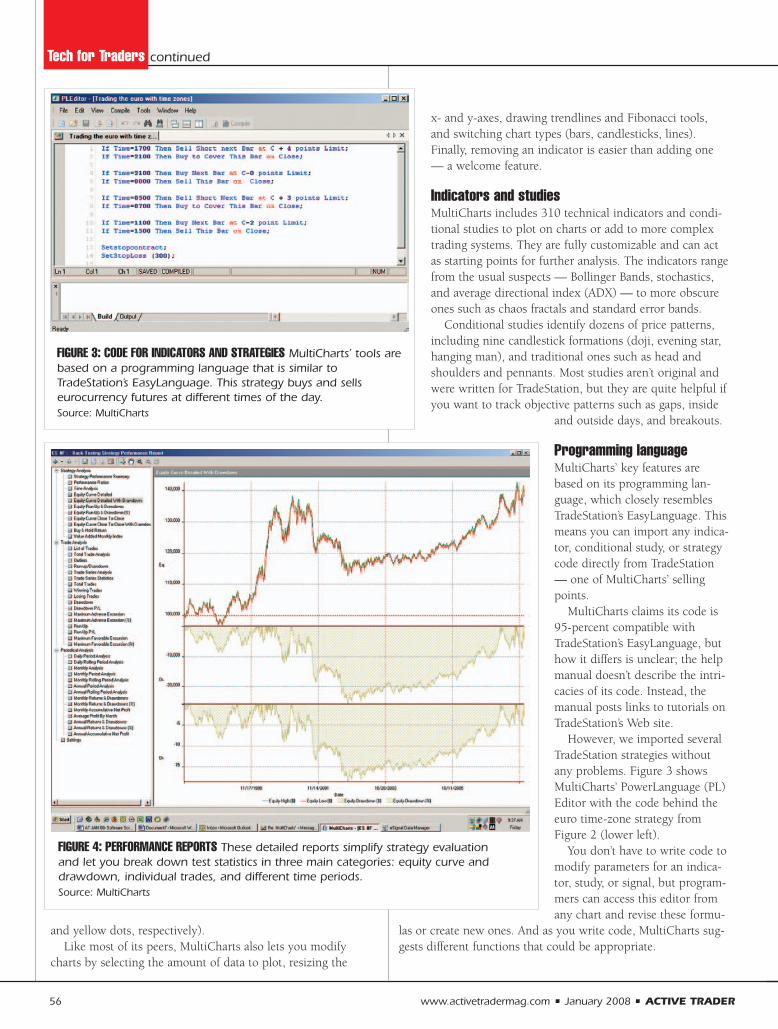
56 www.activetradermag.com • January 2008 • ACTIVE TRADER
and yellow dots, respectively). Like most of its peers, MultiCharts also lets you modify
charts by selecting the amount of data to plot, resizing the
x- and y-axes, drawing trendlines and Fibonacci tools,and switching chart types (bars, candlesticks, lines).Finally, removing an indicator is easier than adding one— a welcome feature.
Indicators and studiesMultiCharts includes 310 technical indicators and condi-tional studies to plot on charts or add to more complextrading systems. They are fully customizable and can actas starting points for further analysis. The indicators rangefrom the usual suspects — Bollinger Bands, stochastics,and average directional index (ADX) — to more obscureones such as chaos fractals and standard error bands.
Conditional studies identify dozens of price patterns,including nine candlestick formations (doji, evening star,hanging man), and traditional ones such as head andshoulders and pennants. Most studies aren’t original andwere written for TradeStation, but they are quite helpful ifyou want to track objective patterns such as gaps, inside
and outside days, and breakouts.
Programming languageMultiCharts’ key features arebased on its programming lan-guage, which closely resemblesTradeStation’s EasyLanguage. Thismeans you can import any indica-tor, conditional study, or strategycode directly from TradeStation— one of MultiCharts’ sellingpoints.
MultiCharts claims its code is95-percent compatible withTradeStation’s EasyLanguage, buthow it differs is unclear; the helpmanual doesn’t describe the intri-cacies of its code. Instead, themanual posts links to tutorials onTradeStation’s Web site.
However, we imported severalTradeStation strategies withoutany problems. Figure 3 showsMultiCharts’ PowerLanguage (PL)Editor with the code behind theeuro time-zone strategy fromFigure 2 (lower left).
You don’t have to write code tomodify parameters for an indica-tor, study, or signal, but program-mers can access this editor fromany chart and revise these formu-
las or create new ones. And as you write code, MultiCharts sug-gests different functions that could be appropriate.
Tech for Traders continued
FIGURE 3: CODE FOR INDICATORS AND STRATEGIES MultiCharts’ tools arebased on a programming language that is similar toTradeStation’s EasyLanguage. This strategy buys and sellseurocurrency futures at different times of the day.Source: MultiCharts
FIGURE 4: PERFORMANCE REPORTS These detailed reports simplify strategy evaluation and let you break down test statistics in three main categories: equity curve and drawdown, individual trades, and different time periods.Source: MultiCharts
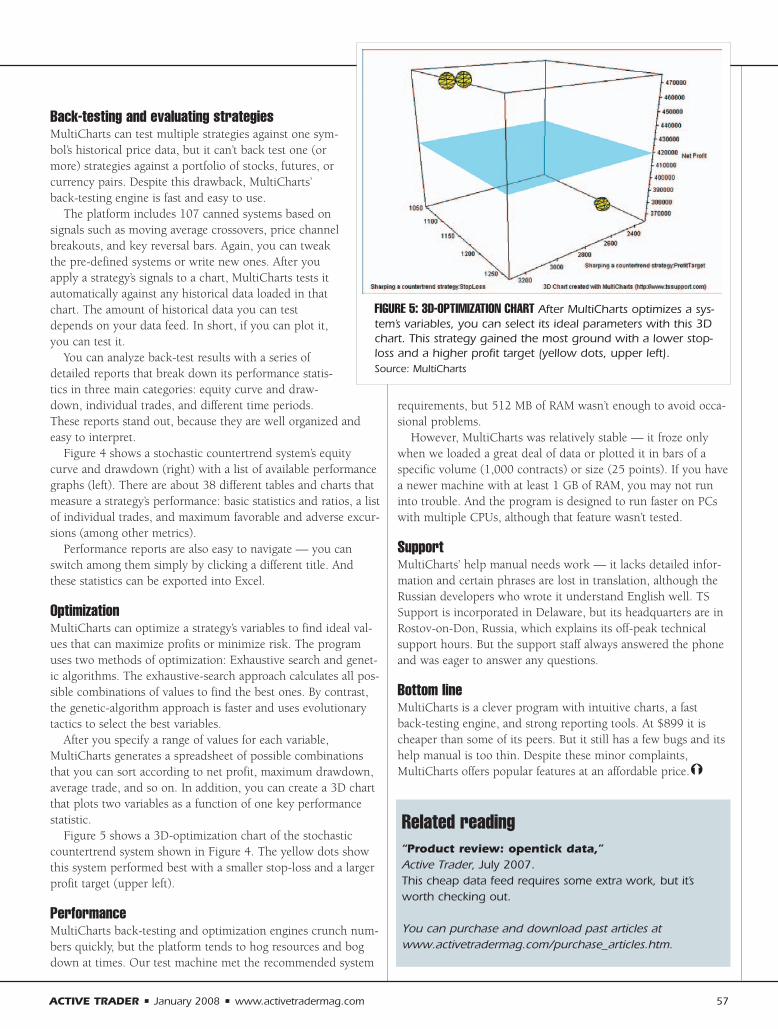
Back-testing and evaluating strategiesMultiCharts can test multiple strategies against one sym-bol’s historical price data, but it can’t back test one (ormore) strategies against a portfolio of stocks, futures, orcurrency pairs. Despite this drawback, MultiCharts’back-testing engine is fast and easy to use.
The platform includes 107 canned systems based onsignals such as moving average crossovers, price channelbreakouts, and key reversal bars. Again, you can tweakthe pre-defined systems or write new ones. After youapply a strategy’s signals to a chart, MultiCharts tests itautomatically against any historical data loaded in thatchart. The amount of historical data you can testdepends on your data feed. In short, if you can plot it,you can test it.
You can analyze back-test results with a series ofdetailed reports that break down its performance statis-tics in three main categories: equity curve and draw-down, individual trades, and different time periods.These reports stand out, because they are well organized andeasy to interpret.
Figure 4 shows a stochastic countertrend system’s equitycurve and drawdown (right) with a list of available performancegraphs (left). There are about 38 different tables and charts thatmeasure a strategy’s performance: basic statistics and ratios, a listof individual trades, and maximum favorable and adverse excur-sions (among other metrics).
Performance reports are also easy to navigate — you canswitch among them simply by clicking a different title. Andthese statistics can be exported into Excel.
OptimizationMultiCharts can optimize a strategy’s variables to find ideal val-ues that can maximize profits or minimize risk. The programuses two methods of optimization: Exhaustive search and genet-ic algorithms. The exhaustive-search approach calculates all pos-sible combinations of values to find the best ones. By contrast,the genetic-algorithm approach is faster and uses evolutionarytactics to select the best variables.
After you specify a range of values for each variable,MultiCharts generates a spreadsheet of possible combinationsthat you can sort according to net profit, maximum drawdown,average trade, and so on. In addition, you can create a 3D chartthat plots two variables as a function of one key performancestatistic.
Figure 5 shows a 3D-optimization chart of the stochasticcountertrend system shown in Figure 4. The yellow dots showthis system performed best with a smaller stop-loss and a largerprofit target (upper left).
PerformanceMultiCharts back-testing and optimization engines crunch num-bers quickly, but the platform tends to hog resources and bogdown at times. Our test machine met the recommended system
requirements, but 512 MB of RAM wasn’t enough to avoid occa-sional problems.
However, MultiCharts was relatively stable — it froze onlywhen we loaded a great deal of data or plotted it in bars of aspecific volume (1,000 contracts) or size (25 points). If you havea newer machine with at least 1 GB of RAM, you may not runinto trouble. And the program is designed to run faster on PCswith multiple CPUs, although that feature wasn’t tested.
SupportMultiCharts’ help manual needs work — it lacks detailed infor-mation and certain phrases are lost in translation, although theRussian developers who wrote it understand English well. TSSupport is incorporated in Delaware, but its headquarters are inRostov-on-Don, Russia, which explains its off-peak technicalsupport hours. But the support staff always answered the phoneand was eager to answer any questions.
Bottom lineMultiCharts is a clever program with intuitive charts, a fastback-testing engine, and strong reporting tools. At $899 it ischeaper than some of its peers. But it still has a few bugs and itshelp manual is too thin. Despite these minor complaints,MultiCharts offers popular features at an affordable price.!
Related reading“Product review: opentick data,”Active Trader, July 2007.This cheap data feed requires some extra work, but it’sworth checking out.
You can purchase and download past articles atwww.activetradermag.com/purchase_articles.htm.
ACTIVE TRADER • January 2008 • www.activetradermag.com 57
FIGURE 5: 3D-OPTIMIZATION CHART After MultiCharts optimizes a sys-tem’s variables, you can select its ideal parameters with this 3Dchart. This strategy gained the most ground with a lower stop-loss and a higher profit target (yellow dots, upper left).Source: MultiCharts
58 www.activetradermag.com • January 2008 • ACTIVE TRADER
T he majority of traders stilldon’t take advantage of all thetax breaks they are entitled to.
Unfortunately, far too many account-ants still do not know about these breaksor the many nuances and pitfalls thataccompany them. They are selling theirclients short.
The IRS lumps all traders into the“investor” category, and investors getpenalized in the tax code with restricted“investment expenses,” capital-loss limita-tions ($3,000 per year), wash-sale lossdeferrals, no retirement plans, and more.
To get tax breaks, traders must firstlearn the unpublicized rules for traders,navigate around the vague and strictqualification requirements, make certain(tricky) tax elections on time, and executethe strategies properly on tax returns(which also is somewhat difficult).
Accounting for trading gains and lossesis also the responsibility of the securitiestrader, and this adds another layer ofcomplexity. However, this problem can besolved with the proper software.
And, there are significantly differenttax rules and rates for securities vs. com-modities/futures vs. forex vs. foreignfutures vs. other types of instruments,and it’s often hard to tell which financialinstrument falls into which category.
For these reasons, one taxpayer canthink he or she owes significant taxeswhereas another taxpayer with the samefacts and circumstances might be entitledto a large tax refund. That’s way too widea gulf.
This roundup of trader tax rules willhelp traders uncover the tax breaks they
are entitled to this tax season and allowthem to fare even better in the current taxyear.
Trader tax statusThe first step toward tax savings is quali-fying for trader tax status, allowing you touse business tax treatment as opposed toinvestor tax treatment.
Business treatment gives full ordinaryloss deductions (including home-office,education, start-up expenses, margininterest, and much more) whereas invest-ment expenses are very limited, onlyallowed in excess of 2 percent of adjusted
gross income (AGI), and not deductibleagainst the nasty alternative minimum tax(AMT), which Congress is seeking torepeal.
The average trader saves more than$10,000 with trader tax status, and hedgefunds save significant taxes for theirinvestors, too.
You can still claim trader tax status forthe last tax year and even for the priorthree tax years (if you file amendedreturns). Unlike other aspects of tradertax benefits, trader tax status does notneed to be elected in advance (such asIRC 475 MTM).
Qualifying can be trickyHowever, while trader tax status does notneed to be elected in advance, you doneed to qualify for it. Full-time tradersgenerally qualify. Part-time traders canalso qualify, but it’s more difficult. Thebar is raised in the eyes of the IRS —especially if they have losses.
A business trader meets most of thefollowing qualifications:
• Trades full-time or part-time, all day every day.
• Spends more than four hours per day, every day, with few sporadic lapses.
• Makes 300 to 500 (or more)round-turn trades per year; however,there is no magic number in case law. Forex and futures trades are not listed line-by-line on the tax return (as securities trades must be), so the IRS cannot see the number of forex or futures trades.
• Makes mostly day trades or swing
BY ROBERT A. GREEN, CPA
The BUSINESS of Trading
A trader tax primerThe beginning of a new year is a good time to review trader tax rules.
In the first part of a multi-part series, we look at what it takes to qualify
as a trader and some of the benefits that come with it.
trades, and few positions are held for more than a few weeks. Investment positions are segregated.
• Has the intention to run a business and act accordingly with formal record keeping, business plans, and other documentation.
• Has significant business tools, business expenses, and a home-office.
• Has a material account size approxi-mately $20,000 or more, not the $5,000 account sometimes associated with forex trading.
If trading activity is anything less thanthe guidelines stated above, the IRS mayscrutinize and challenge your qualifica-tion for trader tax status. In this case, it’swise to consult a trader tax expert.
Statutory vs. case lawCurrently, the IRS does not provide“statutory law” with objective tests forhow to qualify for trader tax status.Subjective “case law” applies, and it’sweak on guidance; case law has notcaught up with the online business trad-ing revolution. Our previous guidelinesare based on years of experience.
Case law has a two-part test to qualifyfor trader tax status:
1. “Taxpayers’ trading activity must be substantial, regular, frequent, and continuous.”
2. “The taxpayer seeks to catch the swings in the daily market movements and profit from these short-term changes rather than profiting from long-term holding of investments.”
Case law is too broad and subject tovarying interpretation. The IRS likes tochallenge “sporadic lapses” in tradingactivity. There are several open questionsas well. Do you need to trade every day,or is just managing your trading businesson a daily basis enough to satisfy the IRS?How does the IRS treat automated trad-ing or trading forex at night?
Restricted capital losses vs. unrestricted ordinary lossesThe key to turning capital losses intoordinary losses is electing IRC 475 mark-
to-market (MTM) accounting. If youqualify for trader tax status, you candeduct business expenses for tax savings,but if you have large trading losses insecurities or futures, you will be stuckwith capital-loss treatment (capital-losscarryovers), unless you elected IRC 475on time earlier in the tax year.
Unlike declaring trader tax status, elect-ing MTM has a deadline: April 15 of thecurrent tax year for individuals andLLCs/partnerships and March 15 for S-Corps. “New” taxpayers (i.e., those whohave just formed an entity) may elect MTMinternally within 75 days of inception.
Tax-loss insuranceWith MTM, restricted capital losses($3,000 cumulative annual limit) are con-verted to unlimited ordinary losses,unlocking significant tax breaks immedi-ately, rather than being stuck with largecapital-loss carryovers to subsequent taxyears. Unutilized trading losses is thebiggest pitfall for traders.
MTM also reports year-end unrealizedgains and losses. MTM is not applied to“segregated investment positions.” So,traders can also use buy-and-hold strate-gies to defer capital gains and take advan-tage of the lower long-term capital gainstax rates, which require a 12-month hold-ing period.
Securities traders should usually electMTM, unless they already have significantcapital-loss carryovers. MTM ordinarytrading gains cannot offset capital-losscarryovers.
Short-term capital gains are taxed likeordinary income. But short-term capitallosses are limited, whereas MTM ordinarytrading losses are unlimited. Hence, MTMis free tax-loss insurance for securitiestraders.
However, futures traders should gener-ally not elect MTM in order to retainlower tax rates (60-percent long-termrates, 40-percent short-term rates, regard-less of how long the position has beenheld) on IRC 1256 contracts.
All taxpayers may elect to carry backfutures trading losses three tax years, butthey can only be applied against futuresgains. IRC 1256 contracts are alsomarked-to-market at year-end, but
it’s a different type of MTM than IRC 475.Forex traders have ordinary tax-loss
insurance by default, so they don’t needto elect MTM. Forex traders also have thebest of both worlds: They can “internally”elect out of Forex IRC 988 for the lower60/40 tax rates of futures, or they canstay in IRC 988 for ordinary loss treat-ment. Beginning forex traders are usuallysafer with IRC 988, since they may havelosses their first year.
The election to opt out of IRC 988 isfiled internally on a contemporaneousbasis.
MTM nuances and gamblesAs mentioned earlier, electing MTM ifyou have capital-loss carryovers is a gam-ble. You don’t want to skip MTM andthen generate more capital-loss carry-overs. Conversely, you don’t want to electMTM and then not be able to utilize yourcapital-loss carryovers against your MTMordinary trading gains. A new entity canhelp here.
Existing individuals and LLC/partner-ships elect MTM for the current tax yearby attaching an election statement to theirprior-year tax return or an extension dueApril 15. Existing S-Corps must file byMarch 15. Taxpayers perfect the MTMelection by filing a Form 3115 (Changeof Accounting Method) with their cur-rent-year tax return (which is due in thefollowing year).
On Form 3115, include a Section481(a) adjustment, which is your unreal-ized gain or loss on Dec. 31 of the prioryear. Since new taxpayers are adoptingMTM, they don’t need to file a Form3115.
Not following both MTM election stepsproperly may result in IRS examinationand MTM removal. So be careful. The IRSis very technical here.
Still to comeNext month, we’ll take a closer look atbusiness expenses, entities, and tech-niques for filing the proper trader-taxreturn. Remember, though, it all startswith trader tax status and electing MTMon time.!
For information on the author see p. 4.
ACTIVE TRADER • January 2008 • www.activetradermag.com 59
CQG has released version 7.5, which includes Pre-TradeAnalytics, a suite of four new studies — the DOMTracker,DOMTracker Oscillator, DOMActivity, and Older Orders Ratio.These studies track activities in the order book away from theinside market. The new Order Ticker uses a numeric displayfashioned after the classic stock ticker to display actions at theinside market and in the order book. In addition, CQG nowoffers Quantity Triggered Stop Orders, which are sent once theresting amount of orders in the order queue drops below thetrader set threshold. Other enhancements include scanning port-folios of spreads for pre-set conditions, simultaneous chartscrolling linked to news headlines, instant messaging with otherCQG traders, and live chat with CQG customer support.
Also, CQG has added the Singapore Exchange (SGX) to itsdirect trading connections. CQG has connected its hosted trad-ing gateways to SGX, giving customers the ability to tradeexchange contracts. SGX has been added to CQG’s list of trad-able exchanges, which includes CME/CBOT, Eurex, Montreal,Euronext, NYBOT, ICE, DME, NYMEX/COMEX, and SFE.
Finally, CQG and Strategy Runner have announced the inte-gration of their trading platforms. Strategy Runner’s connectionwith the CQG API will allow their FCM partners to utilizeCQG’s data and order routing services. In turn, CQG customerswill have access to Strategy Runner services and algorithmictrading solutions using Strategy Runner’s robust server-basedtechnology. For more information, visit www.cqg.com.
Market Probability is now offering SectorCheck, a free tradingtool that reports current status and trend information for stocksectors and industries. Its features include instantaneous displayof the one-day return in each sector, averaged over all memberstocks in the sector. A similar report is available for each indus-try. The tool further reports performance rankings of all sectorsand industries so users can easily judge where trading and pricemovement are most concentrated. With one click, the user cancall up a bar chart that displays the performance in any sector orindustry over the previous 30 days. The tool is available to thepublic through the company’s Web site, www.marketprobabili-ty.com.
FX Solutions has introduced GTS Pro, a forex trading platformdesigned to meet the needs of today’s currency traders. GTS Prooffers forex traders a wide range of tools including an improvedforex calculator for margin, pip, and premium calculations, 10trading screen layouts, customizable workspaces, price alarmsfor any currency pair when a certain price is reached, exportable
reporting, and custom AccuCharts. For more information, visitwww.fxsol.com.
PowerShares Capital Management has expanded its family offixed-income ETFs by listing a 1 to 30-year laddered treasuryportfolio, as well as insured New York and California municipalbond portfolios, on the American Stock Exchange. The antici-pated ticker symbols and ETF names are: PowerShares 1-30Laddered Treasury Portfolio (PLW), PowerShares InsuredCalifornia Municipal Bond Portfolio (PWZ), and PowerSharesInsured New York Municipal Bond Portfolio (PWZ). For moreinformation, visit www.powershares.com.
MarketDelta has introduced a new indicator called the TPDIndex, the first of its kind to take Market Profile concepts andlogic and apply them systematically. Named after Dr. Thomas P.Drinka, a professor who has researched Market Profile for closeto 20 years, the TPD Index has a pane that shows the 20-daysuccess rate for the indicator. The TPD Index provides a maxi-mum of one trading signal each day. It can be used with intra-day time frames as well, but all the research was done usingdaily and 30-minute data. TPD Index is currently being offeredfor a one-time fee of $997. Visit www.marketdelta.com/newsite/tpdi.aspx for more information and ordering instructions.
ICE Futures, the leading soft commodity exchange and a sub-sidiary of IntercontinentalExchange, is now offering foreignexchange futures electronically on the ICE trading platform.Listing of the foreign exchange futures contracts will occur inphases. In the initial phase, the following futures contracts willbe offered electronically 22 hours a day on the ICE platform:British pound/Japanese yen (GBP/JPY), British pound/Swiss franc(GBP/CHF), British pound/U.S. dollar (GBP/USD), euro/Britishpound (EUR/GBP), euro/Japanese yen (EUR/JPY), euro/Swissfranc (EUR/CHF), euro/U.S. dollar (EUR/USD), Swissfranc/Japanese yen (CHF/JPY), U.S. dollar/Japanese yen(USD/JPY), and U.S. dollar/Swiss franc (USD/CHF). These for-eign exchange contracts will begin electronic trading on the ICEplatform at 8 p.m. ET on Thursday, Nov. 8, for trade date Nov.9. For more information, please visit www.theice.com.!
Trading Resources is a forum for industry businesses to announce new products and upgrades. Listings are adapted from company press releases and are not endorsements or recommendations from the Active Trader Magazine Group. E-mail press releases to [email protected]. Publication is not guaranteed.
60 www.activetradermag.com • January 2008 • ACTIVE TRADER
TRADING Resources
NEW PRODUCTS & SERVICES

ACTIVE TRADER • January 2008 • www.activetradermag.com 61
Traders, Guns and Money: Knowns and Unknowns in the Dazzling World of DerivativesBy Satyajit DasPrentice Hall, 2006Paperback, 334 pages$29.99
Das chronicles his 25-year journey through theworld of financial derivatives, interweavingadvice with tales of the business. Das says thatconstructing a designer woman’s shoe, with itsalmost inexhaustible list of unknowns, is verysimilar to derivatives. This book attempts toprovide an entertaining insight into this some-times arcane sector of the markets.
Active Value Investing: Making Money in Range-Bound MarketsBy Vitaliy N. KatsenelsonWiley & Sons, 2007Hardcover, 282 pages$49.95
Although all-time stock market highs (andsome notable lows) have dominated news cov-erage in recent months, Katsenelson says focus-ing on long-term, sideways range-bound condi-tions is key to profiting from this bumpy ride.“Active value investing” — where traditionalstrategies are continually recalibrated to adaptto changing market conditions — isexplained, with charts and a practical applica-tion section.
Contrarian Ripple Trading: A Low-Risk Strategy to Profiting from Short-Term Stock TradesBy Aidan J. McNamara and Martha A. BrozynaWiley & Sons, 2008Hardcover, 190 pages$49.95
McNamara and Brozyna are a married couplethat describe their short-term trading method
— contrarian ripple trading — in this book.They boast of a trading record that includes1,225 profitable, round-trip trades in just morethan two years while using this technique. Theydon’t claim their method will make anyone rich;they instead aim to provide a way for middle-class traders to earn some extra money.
Swing Trading (Trade Secrets Course Book with DVD)By Oliver L. VelezMarketplace Books, 2007Paperback, 115 pages$29.95
This is the first in a series of book and DVD setsfor investors that expands upon Oliver Velez’s90-minute lecture on swing trading. The bookincludes definitions and self-tests to comple-ment topics including timing, Japanese candle-stick charting, buy and sell setups, and thetechnology used to find lists of stocks.
Electronic and Algorithmic Trading Technology: The Complete GuideBy Kendall KimElsevier, 2007Paperback, 203 pages$59.95
Kim covers three areas of tradeautomation — electronic, program, and algo-rithmic trading — for an audience of financialservice professionals, institutional investors,broker-dealers, and software vendors. Economicand regulatory issues are discussed, as well asstatistics and other details behind the tradeprocess of execution, confirmation, and recon-ciliation.
BOOKSHELF
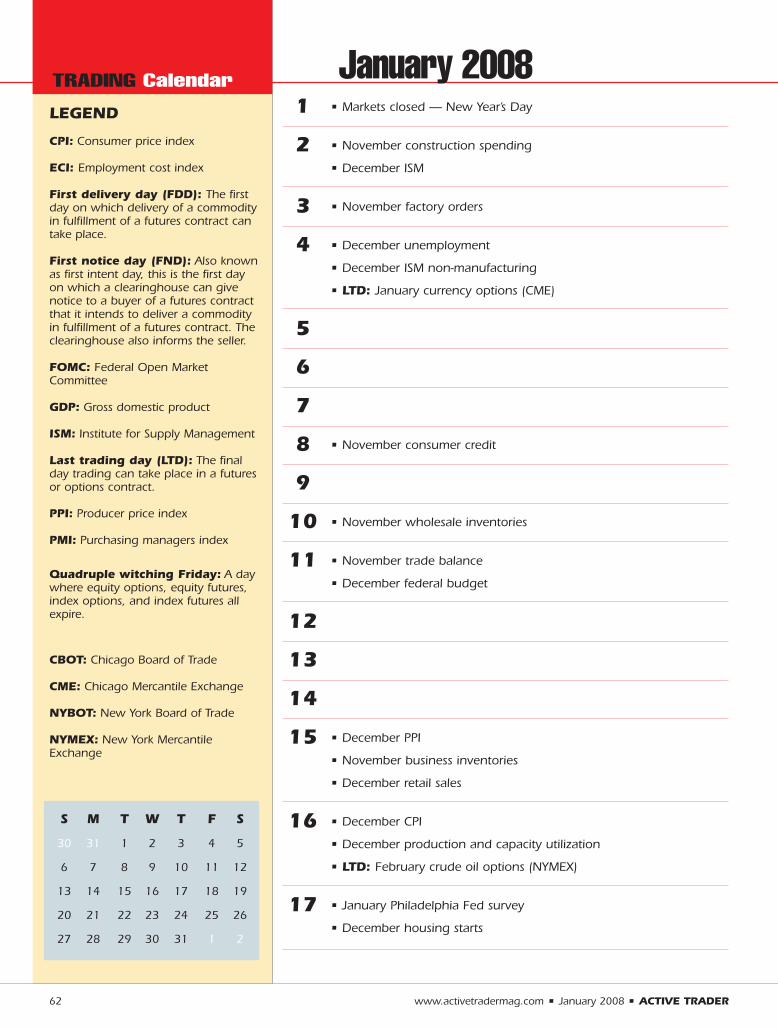
62 www.activetradermag.com • January 2008 • ACTIVE TRADER
1 • Markets closed — New Year’s Day
2 • November construction spending
• December ISM
3 • November factory orders
4 • December unemployment
• December ISM non-manufacturing
• LTD: January currency options (CME)
5
6
7
8 • November consumer credit
9
10 • November wholesale inventories
11 • November trade balance
• December federal budget
12
13
14
15 • December PPI
• November business inventories
• December retail sales
16 • December CPI
• December production and capacity utilization
• LTD: February crude oil options (NYMEX)
17 • January Philadelphia Fed survey
• December housing starts
LEGEND
CPI: Consumer price index
ECI: Employment cost index
First delivery day (FDD): The firstday on which delivery of a commodityin fulfillment of a futures contract cantake place.
First notice day (FND): Also knownas first intent day, this is the first dayon which a clearinghouse can givenotice to a buyer of a futures contractthat it intends to deliver a commodityin fulfillment of a futures contract. Theclearinghouse also informs the seller.
FOMC: Federal Open MarketCommittee
GDP: Gross domestic product
ISM: Institute for Supply Management
Last trading day (LTD): The finalday trading can take place in a futuresor options contract.
PPI: Producer price index
PMI: Purchasing managers index
Quadruple witching Friday: A daywhere equity options, equity futures,index options, and index futures allexpire.
CBOT: Chicago Board of Trade
CME: Chicago Mercantile Exchange
NYBOT: New York Board of Trade
NYMEX: New York MercantileExchange
TRADING Calendar
S M T W T F S
30 31 1 2 3 4 5
6 7 8 9 10 11 12
13 14 15 16 17 18 19
20 21 22 23 24 25 26
27 28 29 30 31 1 2
January 2008
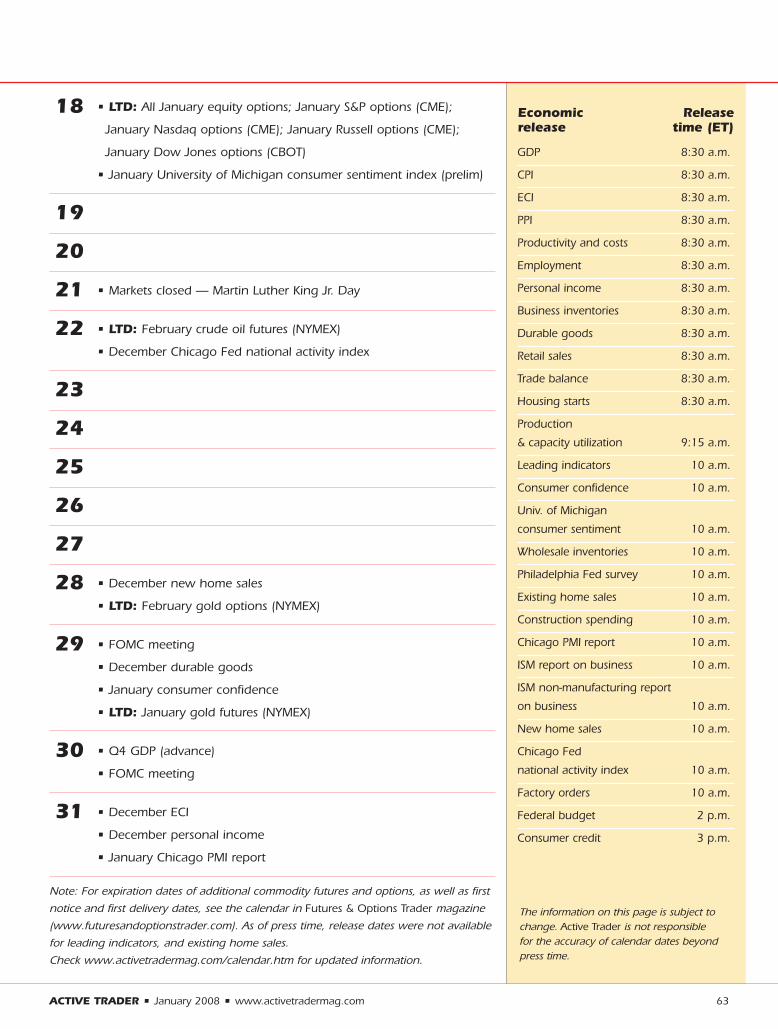
18 • LTD: All January equity options; January S&P options (CME);
January Nasdaq options (CME); January Russell options (CME);
January Dow Jones options (CBOT)
• January University of Michigan consumer sentiment index (prelim)
19
20
21 • Markets closed — Martin Luther King Jr. Day
22 • LTD: February crude oil futures (NYMEX)
• December Chicago Fed national activity index
23
24
25
26
27
28 • December new home sales
• LTD: February gold options (NYMEX)
29 • FOMC meeting
• December durable goods
• January consumer confidence
• LTD: January gold futures (NYMEX)
30 • Q4 GDP (advance)
• FOMC meeting
31 • December ECI
• December personal income
• January Chicago PMI report
Note: For expiration dates of additional commodity futures and options, as well as first notice and first delivery dates, see the calendar in Futures & Options Trader magazine(www.futuresandoptionstrader.com). As of press time, release dates were not availablefor leading indicators, and existing home sales. Check www.activetradermag.com/calendar.htm for updated information.
ACTIVE TRADER • January 2008 • www.activetradermag.com 63
Economic Release release time (ET)
GDP 8:30 a.m.
CPI 8:30 a.m.
ECI 8:30 a.m.
PPI 8:30 a.m.
Productivity and costs 8:30 a.m.
Employment 8:30 a.m.
Personal income 8:30 a.m.
Business inventories 8:30 a.m.
Durable goods 8:30 a.m.
Retail sales 8:30 a.m.
Trade balance 8:30 a.m.
Housing starts 8:30 a.m.
Production
& capacity utilization 9:15 a.m.
Leading indicators 10 a.m.
Consumer confidence 10 a.m.
Univ. of Michigan
consumer sentiment 10 a.m.
Wholesale inventories 10 a.m.
Philadelphia Fed survey 10 a.m.
Existing home sales 10 a.m.
Construction spending 10 a.m.
Chicago PMI report 10 a.m.
ISM report on business 10 a.m.
ISM non-manufacturing report
on business 10 a.m.
New home sales 10 a.m.
Chicago Fed
national activity index 10 a.m.
Factory orders 10 a.m.
Federal budget 2 p.m.
Consumer credit 3 p.m.
The information on this page is subject tochange. Active Trader is not responsible for the accuracy of calendar dates beyondpress time.
64 www.activetradermag.com • January 2008 • ACTIVE TRADER
Average and median: The mmeeaann (or average) of a set of values is the sum of the values divided by the number of values in the set.If a set consists of 10 numbers, add them and divide by 10 toget the mean.
A statistical weakness of the mean is that it can be distortedby exceptionally large or small values. For example, the mean of1, 2, 3, 4, 5, 6, 7, and 200 is 28.5 (228/8). Take away 200, andthe mean of the remaining seven numbers is 4, which is muchmore representative of the numbers in this set than 28.5.
The mmeeddiiaann can help gauge how representative a mean reallyis. The median of a data set is its middle value (when the set hasan odd number of elements) or the mean of the middle two elements (when the set has an even number of elements). Themedian is less susceptible than the mean to distortion fromextreme, non-representative values. The median of 1, 2, 3, 4, 5,6, 7, and 200 is 4.5 ((4+5)/2), which is much more in line withthe majority of numbers in the set.
The K-ratio: The K-ratio is used to evaluate the equity curve of atrading system (see Lars Kestner’s book, Quantitative TradingStrategies, McGraw-Hill, 2003).
K-ratio is calculated in the following way: Compute the equitycurve (e), which represents the value of a trading account usedto trade the series (or portfolio). If profits are reinvested,the logarithm of the equity at each bar should be used.
Compute the linear regression of the equity curve. The linearregression fits a straight line to the points in the equity curve using the least squares method. The slope of the linearregression (sl) is the numerator of the K-ratio.
The standard error (se) of the linear regression measures theamount by which the equity curve differs from the regressionline. The standard error is defined as the standard deviation ofthe error — that is, of the bar-by-bar differences between theequity curve and the regression line. Smoother equity curveshave lower se values.
The K-ratio is the quotient of the slope (sl) divided by the standard error (se), modified by two terms that attempt to normalize the indicator.
The Excel formula to compute K-ratio as it is implemented in AmiBroker (www.amibroker) is:
SLOPE(B1:B20,A1:A20)*SQRT(DEVSQ(A1:A20))/STEYX(B1:B20,A1:A20)/20
where the bar numbers are in the A column and the equityvalues are in the B column.
The K-ratio is an excellent tool for comparing alternativesgenerated by optimization — that is, it is best used to pickwhich set of arguments are best for a given set of data. It is less
valuable for comparing trading systems applied over differentsets of data, particularly when the number of data points differs.
Welles Wilder’s smoothing technique is a type of exponential movingaverage that uses the following formula:
c*(1/n) + ((n-1)/n)*p
where
c = current period’s closing price;p = the previous period’s Wilder’s exponential
moving average value;n = the number of periods in the average.
For example, if today’s close was 25 and the previous 10-period Wilder’s exponential moving average value was 26,the new Wilder’s exponential moving average value would be:
25*(1/10) + ((10-1)/10*26) = 2.5 + 23.4 = 25.9
Wilder used this formula in many of the indicators hedescribed in his book, New Trends in Technical Analysis.
Key CONCEPTS
Treasury refresherTreasury bonds and notes are debt securities issued by theUnited States Treasury. They are considered debt instru-ments because by purchasing them you are loaningmoney to the Treasury department, which then pays youinterest (determined by a “coupon rate”) on a semiannualbasis and returns the principle when the bond or notematures on the maturity date. T-bonds and T-notes arecalled “fixed-income” securities because of the fixedcoupon payment an investor receives while holding thebond or note.
T-notes are issued in maturities of two, three, five, and10 years; T-bonds have maturities greater than 10 years.The minimum bond or note size is $1,000. For example, ifyou purchased a $1,000 10-year T-note with a 4-percentcoupon, you would receive $20 every six months, totaling$40 per year; the $1,000 would be paid back to you onthe maturity date 10 years from now. A bond or note’s yieldis its coupon payment divided by the price — in this case,4 percent ($40/$1,000).
Treasury futures prices indicate a percentage of “par”price, which for any Treasury bond or note is 100. T-bondprices consist of the “handle” (e.g., 100) and 32nds of 100.For example, 98-14 is a price that translates to 98-14/32nds or $984.38 for a $1,000 T-bond. T-notes arepriced in a similar fashion, except they can include one-halfof a 32nd — for example, 98-14+ is 98-14.5/32nds, or984.53 for a $1,000 T-note.!
65 www.activetradermag.com • January 2008 • ACTIVE TRADER
Event: TradeTech Foreign Exchange Asia 2007Date: Dec. 3-4Location: Conrad Hotel, Hong KongFor more information: www.ttfxasia.com
Event: TradeStation’s Futures SymposiumDate: Dec. 6-8Location: Hallandale, Fla.For more information: www.tradestation.com/strategy
Event: Opportunity Finance Network 2007 AnnualConferenceDate: Dec. 11-14Location: Miami, Fla.For more information: www.opportunityfinance.net
Event: MTA Mid-Winter RetreatDate: Jan. 24-26Location: Don CeSar Beach Resort at St. Pete Beach (outsideTampa, Fla.)For more information: Call (646) 652-3300
Event: The World Money ShowDate: Feb. 6-9Location: Gaylord Palms Resort and Convention Center,Kissimmee, Fla.For more information: www.worldmoneyshow.com
Event: Traders Expo New YorkDate: Feb. 16-19Location: Marriott Marquis Hotel, New YorkFor more information: www.tradersexpo.com
Event: 24th Annual Risk Management ConferenceDate: March 9-11Location: Hyatt Regency Coconut Point Resort and Spa, Bonita Springs, Fla. For more information: www.cboe.com/rmc
Event: Day Trading Seminar Presented by Joe Rossand Rogerio KirchbaumDate: March 23-24Location: Sao Paulo, BrazilFor more information: E-mail [email protected]
Event: Traders Expo Los AngelesDate: June 23-26Location: Ontario Convention CenterFor more information: www.tradersexpo.com
UPCOMING EventsAdvertiser
Active Trader Bookstore
www.invest-store.com/activetradermag/bookstore
CME Group
www.cmegroup.com/tradeforex
CMS Forex
www.cmsfx.com
DME
www.dubaimerc.com
eSignal
www.esignal.com
Fidelity
www.fidelity.com
FXCM
www.fxcm.com
Global Forex Trading
www.gftfutures.com
Interactive Brokers
www.interactivebrokers.com
MB Trading
www.mbtrading.com
MetaStock
www.metastock.com/at127
PFGBEST.com
www.pfgbest.com
ProShares
www.proshares.com
Terra Nova
www.TerraNovaTrading.com/AT
Traders Expo
www.tradersexpo.com
TradeStation
www.tradestation.com/9573
Trade The News
www.TradeTheNews.com
Wealth Lab
www.wealth-lab.com
Xview
www.xview.com
ADVERTISING Index
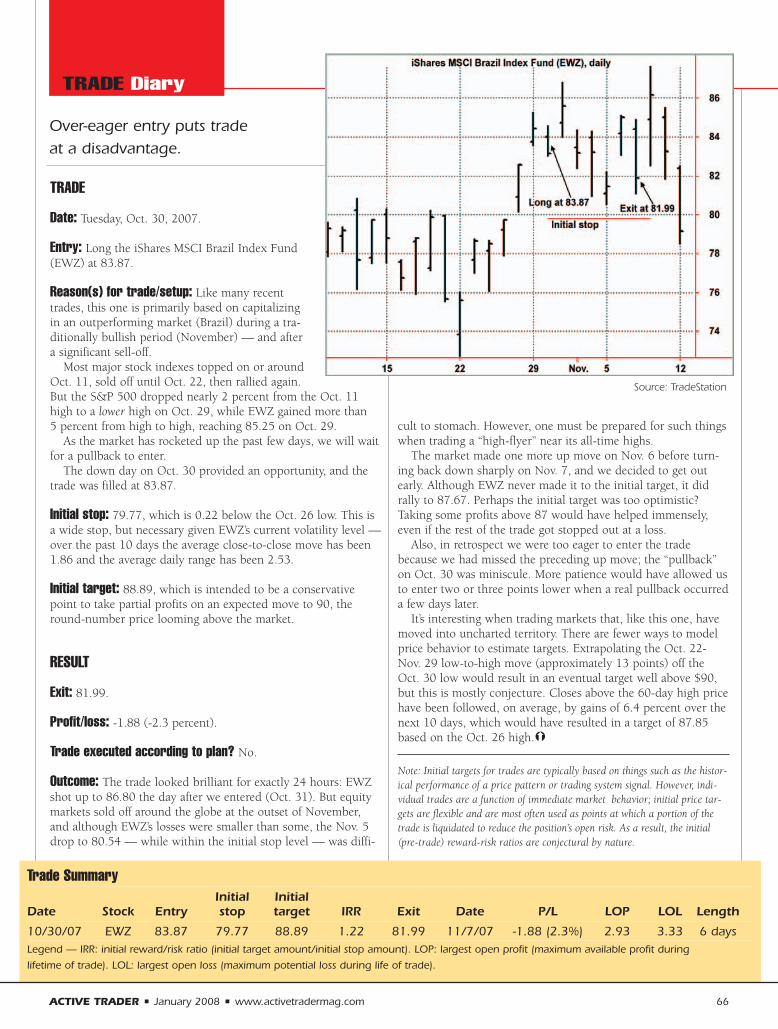
ACTIVE TRADER • January 2008 • www.activetradermag.com 66
TRADE
Date: Tuesday, Oct. 30, 2007.
Entry: Long the iShares MSCI Brazil Index Fund(EWZ) at 83.87.
Reason(s) for trade/setup: Like many recenttrades, this one is primarily based on capitalizingin an outperforming market (Brazil) during a tra-ditionally bullish period (November) — and aftera significant sell-off.
Most major stock indexes topped on or aroundOct. 11, sold off until Oct. 22, then rallied again.But the S&P 500 dropped nearly 2 percent from the Oct. 11high to a lower high on Oct. 29, while EWZ gained more than5 percent from high to high, reaching 85.25 on Oct. 29.
As the market has rocketed up the past few days, we will waitfor a pullback to enter.
The down day on Oct. 30 provided an opportunity, and thetrade was filled at 83.87.
Initial stop: 79.77, which is 0.22 below the Oct. 26 low. This isa wide stop, but necessary given EWZ’s current volatility level —over the past 10 days the average close-to-close move has been1.86 and the average daily range has been 2.53.
Initial target: 88.89, which is intended to be a conservativepoint to take partial profits on an expected move to 90, theround-number price looming above the market.
RESULT
Exit: 81.99.
Profit/loss: -1.88 (-2.3 percent).
Trade executed according to plan? No.
Outcome: The trade looked brilliant for exactly 24 hours: EWZshot up to 86.80 the day after we entered (Oct. 31). But equitymarkets sold off around the globe at the outset of November,and although EWZ’s losses were smaller than some, the Nov. 5drop to 80.54 — while within the initial stop level — was diffi-
cult to stomach. However, one must be prepared for such thingswhen trading a “high-flyer” near its all-time highs.
The market made one more up move on Nov. 6 before turn-ing back down sharply on Nov. 7, and we decided to get outearly. Although EWZ never made it to the initial target, it didrally to 87.67. Perhaps the initial target was too optimistic?Taking some profits above 87 would have helped immensely,even if the rest of the trade got stopped out at a loss.
Also, in retrospect we were too eager to enter the tradebecause we had missed the preceding up move; the “pullback”on Oct. 30 was miniscule. More patience would have allowed usto enter two or three points lower when a real pullback occurreda few days later.
It’s interesting when trading markets that, like this one, havemoved into uncharted territory. There are fewer ways to modelprice behavior to estimate targets. Extrapolating the Oct. 22-Nov. 29 low-to-high move (approximately 13 points) off theOct. 30 low would result in an eventual target well above $90,but this is mostly conjecture. Closes above the 60-day high pricehave been followed, on average, by gains of 6.4 percent over thenext 10 days, which would have resulted in a target of 87.85based on the Oct. 26 high.!
Note: Initial targets for trades are typically based on things such as the histor-ical performance of a price pattern or trading system signal. However, indi-vidual trades are a function of immediate market behavior; initial price tar-gets are flexible and are most often used as points at which a portion of thetrade is liquidated to reduce the position’s open risk. As a result, the initial(pre-trade) reward-risk ratios are conjectural by nature.
TRADE Diary
Trade SummaryInitial Initial
Date Stock Entry stop target IRR Exit Date P/L LOP LOL Length
10/30/07 EWZ 83.87 79.77 88.89 1.22 81.99 11/7/07 -1.88 (2.3%) 2.93 3.33 6 daysLegend — IRR: initial reward/risk ratio (initial target amount/initial stop amount). LOP: largest open profit (maximum available profit during lifetime of trade). LOL: largest open loss (maximum potential loss during life of trade).
Source: TradeStation
Over-eager entry puts trade at a disadvantage.
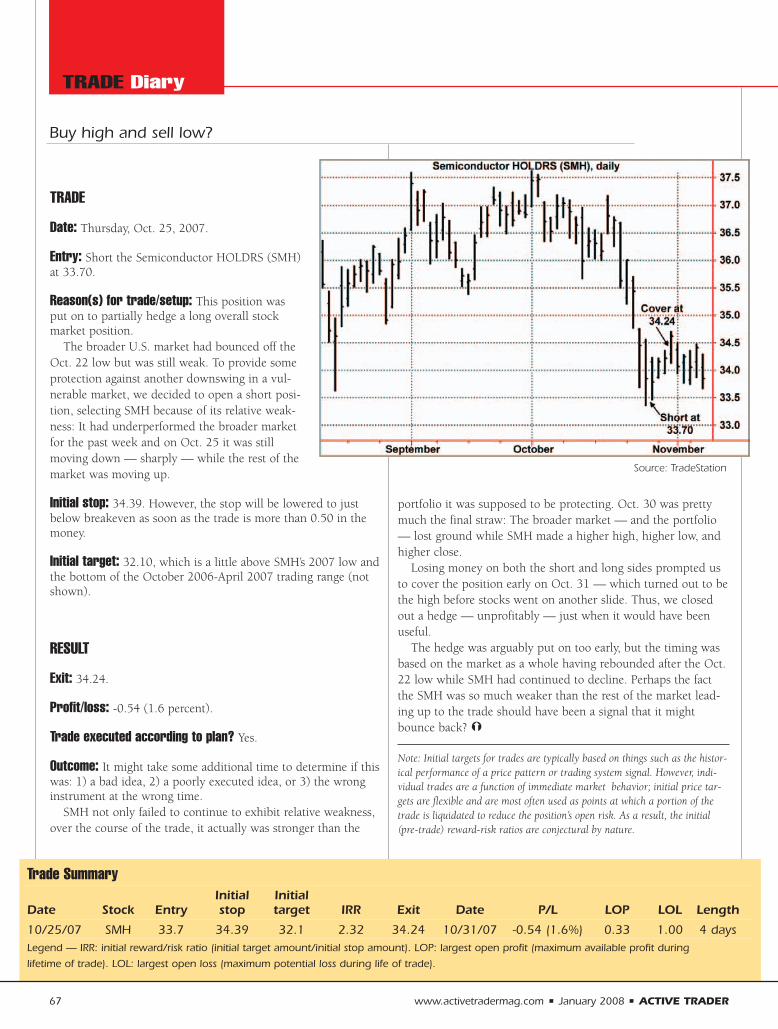
TRADE
Date: Thursday, Oct. 25, 2007.
Entry: Short the Semiconductor HOLDRS (SMH)at 33.70.
Reason(s) for trade/setup: This position wasput on to partially hedge a long overall stockmarket position.
The broader U.S. market had bounced off theOct. 22 low but was still weak. To provide someprotection against another downswing in a vul-nerable market, we decided to open a short posi-tion, selecting SMH because of its relative weak-ness: It had underperformed the broader marketfor the past week and on Oct. 25 it was stillmoving down — sharply — while the rest of themarket was moving up.
Initial stop: 34.39. However, the stop will be lowered to justbelow breakeven as soon as the trade is more than 0.50 in themoney.
Initial target: 32.10, which is a little above SMH’s 2007 low andthe bottom of the October 2006-April 2007 trading range (notshown).
RESULT
Exit: 34.24.
Profit/loss: -0.54 (1.6 percent).
Trade executed according to plan? Yes.
Outcome: It might take some additional time to determine if thiswas: 1) a bad idea, 2) a poorly executed idea, or 3) the wronginstrument at the wrong time.
SMH not only failed to continue to exhibit relative weakness,over the course of the trade, it actually was stronger than the
portfolio it was supposed to be protecting. Oct. 30 was prettymuch the final straw: The broader market — and the portfolio— lost ground while SMH made a higher high, higher low, andhigher close.
Losing money on both the short and long sides prompted usto cover the position early on Oct. 31 — which turned out to bethe high before stocks went on another slide. Thus, we closedout a hedge — unprofitably — just when it would have beenuseful.
The hedge was arguably put on too early, but the timing wasbased on the market as a whole having rebounded after the Oct.22 low while SMH had continued to decline. Perhaps the factthe SMH was so much weaker than the rest of the market lead-ing up to the trade should have been a signal that it mightbounce back? !
Note: Initial targets for trades are typically based on things such as the histor-ical performance of a price pattern or trading system signal. However, indi-vidual trades are a function of immediate market behavior; initial price tar-gets are flexible and are most often used as points at which a portion of thetrade is liquidated to reduce the position’s open risk. As a result, the initial(pre-trade) reward-risk ratios are conjectural by nature.
67 www.activetradermag.com • January 2008 • ACTIVE TRADER
TRADE Diary
Trade SummaryInitial Initial
Date Stock Entry stop target IRR Exit Date P/L LOP LOL Length
10/25/07 SMH 33.7 34.39 32.1 2.32 34.24 10/31/07 -0.54 (1.6%) 0.33 1.00 4 daysLegend — IRR: initial reward/risk ratio (initial target amount/initial stop amount). LOP: largest open profit (maximum available profit during lifetime of trade). LOL: largest open loss (maximum potential loss during life of trade).
Source: TradeStation
Buy high and sell low?