at a crossroads - our financial services around the globe ... · pdf fileeric clapton,...
TRANSCRIPT

16 July 2014
At a crossroads
Municipal Market GuideCIO Wealth Management Research
Volatility persistsSpotlight on IllinoisMore scrutiny for Guam and the US Virgin Islands

02 at a glanCe
03 MaRket VIeW
06 pORtfOlIO theMes
08 ClOsed end funds
09 exChange-tRaded funds
10 spOtlIght
14 In the neWs
19 CRedIt bRIefs
24 ChaRtbOOk
27 state RatIngs
29 endnOtes
32 dIsClaIMeR
COntents
authORs
thomas [email protected]
kathleen Mcnamara, Cfa, [email protected]
kristin [email protected]
sangeeta [email protected]
david [email protected]
desktOp publIshIngGeorge StilabowerCognizant Group – Basavaraj Gudihal, Srinivas Addugula, Pavan Mekala, and Virender Negi
This report has been prepared by UBS Financial Services Inc. Please see important disclaimer and disclosures at the end of the document.
At a glance
Total return by sector
Source: BofAML, Bloomberg, UBS CIO WMR, as of 11 July 2014
In %
Treasuries
Taxable FI Agg
Munis
Build America Bonds
Emerging Markets
Preferreds
High Yield
Investment Grade
Agencies
TIPs
S&P 500
2013 TR2014 YTD TR
0 5 10–10 –5 2520 3015
“And I’m standing at the crossroads, believe I’m sinking down.” Eric Clapton, Crossroads, 1988
At a Crossroads seemed an appropriate title for this month’s report. Credit condi-tions for many borrowers are improving at precisely the same time that fiscal dis-tress is increasing for an unlucky few. Spreads are widening for Illinois and New Jersey state obligations while California bonds are becoming richer by the day. For investors, it’s a mixed message. Following a lengthy period of solid performance, we expect muni market returns to be more subdued in the second half of 2014.
Negative credit developments in Puerto Rico are likely to diminish the appetite of tra-ditional investors for risk. For more than a year now, municipal bond investors have been transfixed by the island’s escalating fiscal crisis. Recent events suggest that this anxiety is unlikely to subside anytime soon. Citing a fiscal emergency, Governor Alejandro García Padilla signed the Public Corporations Debt Enforcement and Recovery Act into law in the closing days of the legislative session. The ensuing rating revisions triggered significant price volatility. See this month’s Market View for details.
Puerto Rico’s financial challenges have led some market observers to question whether other US territories are likely to follow a similar path. Bonds issued by Guam and the US Virgin Islands, which, like Puerto Rico, provide double tax exempt income to residents of all states, have come under greater scrutiny as a result. We review the credit profile of both territories this month. We expect the Virgin Islands to face more hurdles going forward as the credit quality of borrowers on Guam improves incrementally. Our Spotlight article focuses on Illinois, where the state Supreme Court ruled that subsidized healthcare should be regarded as a benefit of membership in the Illinois public pension system. We reiterate our view that spreads on Prairie State bonds should widen in the months ahead.
2 MunICIpal MaRket guIde july 2014

3 MunICIpal MaRket guIde july 2014
Market View
Volatility persistsPuerto Rico is having an impact on the broad-based municipal market. Following a lengthy period of solid return perfor-mance and consistently positive net cash inflows to municipal bond mutual funds, performance has now stalled and a rever-sal in fund flows appears underway.
For the first five months of 2014, munis were up +6.6% on a total return basis before posting a flat return in June and a negative return thus far in July (down -0.4% on a month-to-date basis). The muni market’s strong performance earlier in the year translates into a +6.1% return for the calendar year-to-date despite the recent weakness.
According to Lipper, muni mutual funds reported net cash outflows of USD 790mn for the week ending 9 July 2014, a sharp contrast to the trend earlier this year. This outflow is the first that has occurred in nine weeks and in terms of dollar amount it is the most seen since January. The majority of the outflows occurred in the high yield and long-term fund segments.
Examining data from ICI reveals that estimated net cash flows to muni funds declined last month to USD 2.2bn from USD 3.5bn in May. (See Fig. 1). When looking at weekly data, the pace of inflows has softened to USD 277mn for the week ending 2 July from USD 562mn one week earlier. As we go to press, ICI reported a net cash outflow from muni funds of USD 482mn for the most recent week.
This reduction in investor demand for tax exempt mutual funds has occurred in an environment in which seasonal bond redemptions have increased the amount of cash in investor’s hands. We believe that media scrutiny regarding the financial challenges facing Puerto Rico has unnerved some traditional municipal buyers leading many to take money off the table. In contrast with Detroit, Puerto Rico bonds are widely held by investors across the country, thereby having more of a nega-tive impact across the broad-based muni market. While Puerto Rico credits make up about 2% to 3% of the total muni market, they constitute almost 30% of the muni high yield market as well as a meaningful portion of the long-dated segment (~15%).
Ratios rise On the relative value front, the muni market’s recent under-performance caused AAA muni-to-Treasury (M/T) yield ratios to move higher making munis more attractive than taxable alternatives. The AAA M/T ratio at the 10-year spot has moved above 90% versus its 12-month average of 83.5%. In the meantime, at the 30-year maturity point, the M/T ratio climbed above 100% for the first time in over two months. (See Fig. 2).
puerto Rico pricing captures attentionSince our last monthly Municipal Market Guide (18 June 2014), the negative news flow out of Puerto Rico has acceler-ated. As a result, virtually any discussion on the state of the muni market now includes the Commonwealth’s latest fiscal
Source: Investment Company Institute, UBS CIO WMR, as of 14 July 2014
Monthly net new cash flowAAA GO 30yr monthly yields
0
5,000
–15,000
–20,000
–5,000
–10,000
0
10,000
4
3
2
1
5
6
Apr-10 Sep-10 May-12Dec-11Jul-11Feb-11 Jan-14Aug-13Mar-13Oct-12 Jun-14
Fig. 1: Municipal mutual fund flows and long term yields
Le hand side in millions, right hand side yields in %
Historically low yields
Rate volatility
“60 minutes”
Source: MMD, UBS CIO WMR, as of 11 July 2014
30 Yr10 Yr
105
100
95
90
85
80
110
Jul-14Jun-14May-14Apr-14Mar-14Feb-14Jan-14
Fig. 2: AAA muni-to-Treasury yield ratios
In %
4 MunICIpal MaRket guIde july 2014
woes. (See Municipal Brief: Puerto Rico Credit and Market Update, 2 July 2014.) Puerto Rico’s bond prices have declined sharply in the wake of the introduction and enactment of a restructuring statute aimed at public corporations. Despite some retracement based on support from hedge fund buyers in the last few trading days, yields on some of the island’s credits now stand at levels exceeding those in some taxable emerging markets. For example, yields on a basket of long-dated high yield Puerto Rico bonds stand at 9.75% versus 9.00% on Argentine debt of comparable duration.
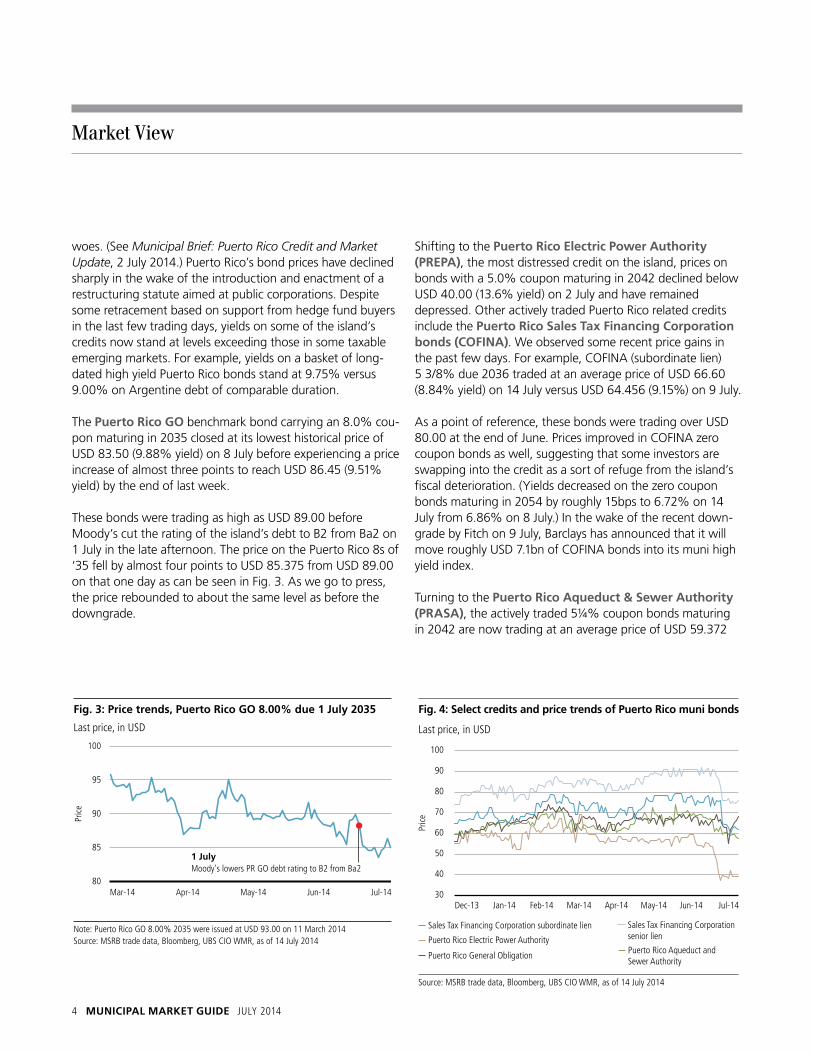
The puerto Rico gO benchmark bond carrying an 8.0% cou-pon maturing in 2035 closed at its lowest historical price of USD 83.50 (9.88% yield) on 8 July before experiencing a price increase of almost three points to reach USD 86.45 (9.51% yield) by the end of last week.
These bonds were trading as high as USD 89.00 before Moody’s cut the rating of the island’s debt to B2 from Ba2 on 1 July in the late afternoon. The price on the Puerto Rico 8s of ‘35 fell by almost four points to USD 85.375 from USD 89.00 on that one day as can be seen in Fig. 3. As we go to press, the price rebounded to about the same level as before the downgrade.
Shifting to the puerto Rico electric power authority (pRepa), the most distressed credit on the island, prices on bonds with a 5.0% coupon maturing in 2042 declined below USD 40.00 (13.6% yield) on 2 July and have remained depressed. Other actively traded Puerto Rico related credits include the puerto Rico sales tax financing Corporation bonds (COfIna). We observed some recent price gains in the past few days. For example, COFINA (subordinate lien) 5 3/8% due 2036 traded at an average price of USD 66.60 (8.84% yield) on 14 July versus USD 64.456 (9.15%) on 9 July.
As a point of reference, these bonds were trading over USD 80.00 at the end of June. Prices improved in COFINA zero coupon bonds as well, suggesting that some investors are swapping into the credit as a sort of refuge from the island’s fiscal deterioration. (Yields decreased on the zero coupon bonds maturing in 2054 by roughly 15bps to 6.72% on 14 July from 6.86% on 8 July.) In the wake of the recent down-grade by Fitch on 9 July, Barclays has announced that it will move roughly USD 7.1bn of COFINA bonds into its muni high yield index.
Turning to the puerto Rico aqueduct & sewer authority (pRasa), the actively traded 5¼% coupon bonds maturing in 2042 are now trading at an average price of USD 59.372
Market View
Source: MSRB trade data, Bloomberg, UBS CIO WMR, as of 14 July 2014
Puerto Rico Electric Power Authority
Sales Tax Financing Corporation subordinate lien Sales Tax Financing Corporation senior lien
Puerto Rico General Obligation Puerto Rico Aqueduct and Sewer Authority
90
80
70
60
50
40
30
100
Jun-14May-14Apr-14Mar-14Feb-14Jan-14 Jul-14Dec-13
Fig. 4: Select credits and price trends of Puerto Rico muni bonds
Last price, in USD
Price
Note: Puerto Rico GO 8.00% 2035 were issued at USD 93.00 on 11 March 2014Source: MSRB trade data, Bloomberg, UBS CIO WMR, as of 14 July 2014
1 July Moody's lowers PR GO debt rating to B2 from Ba2
80
95
90
100
Price
Puerto Rico CMWLTH SER A
Apr-14Mar-14 Jun-14May-14 Jul-14
Fig. 3: Price trends, Puerto Rico GO 8.00% due 1 July 2035
Last price, in USD
85

5 MunICIpal MaRket guIde july 2014
(9.38% yield) versus USD 60.748 (9.16%) on 10 July. We expect prices on the island’s credits to remain volatile as inves-tors await the Government Development Bank’s investor webcast scheduled for 17 July. (See Fig. 4).
OutlookAs we suggested in the April edition of the Municipal Market Guide, we believe muni market returns for the second half of 2014 will be more subdued. While the technical picture remains supportive, negative credit developments in Puerto Rico are likely to diminish investor appetite for risk and cause traditional muni buyers to pause.
We have arrived at a crossroads, where credit conditions for many borrowers are improving at precisely the same time that fiscal distress is increasing for an unlucky few. Spreads (at the 10-year maturity, as an example) are widening for Illinois (+145bps) and New Jersey state obligations (+36bps), while
California’s bonds (+29bps) are becoming richer by the day. Among the US territories and commonwealths, Puerto Rico and the Virgin Islands are likely to face more hurdles even as the credit quality of borrowers on Guam improves incremen-tally. For investors, it’s a mixed message. Choose wisely.
Fig. 5: Municipal sector spreads (2010 - present)
The vertical line represents the range of spread from 2010-present while the square marker shows the average spread over the same time period. The diamond marker shows the current spreadand the circle marker shows the average spread in 2006.Source: BofAML, UBS CIO WMR, as of 14 July 2014
Option adjusted spreads, in bps
130
80
30
–20
180
230
280
Average OAS Pre-Crisis (2006 avg)Current OAS
Mun
icipa
lsSt
ate
Mun
icipa
lsLo
cal
Mun
icipa
lsAi
rpor
t
Mun
icipa
lsEd
ucat
ion
Mun
icipa
lsHe
alth
Mun
icipa
lsHo
spita
ls
Mun
icipa
lsM
ulti-
Fam
ilyHs
ng
Mun
icipa
lsSi
ngle
Fam
ilyHs
ng
Mun
i Ind
ustri
alDe
velo
pem
ent
Reve
nue
Mun
icipa
lsLe
asin
g/Re
ntal
Mun
icipa
lsPo
wer
Mun
icipa
lsID
R-PC
R
Mun
icipa
lsUt
ilitie
s - O
ther
Mun
icipa
lsW
ater
Mun
icipa
lsTr
ansp
orta
tion
Mun
icipa
ls To
ll &
Turn
pike
Mun
icipa
lsTo
bacc
o
Mun
icipa
lsTa
x Re
venu
es
Market View
6 MunICIpal MaRket guIde july 2014
Consider kicker bonds for yieldOver the past decade, new issues that include 5% coupon bonds and that are callable after 10 years have become more common in the municipal bond market. There is now an abundance of 5% coupon bonds with shorter call dates avail-able for purchase in the secondary market. These bonds, often referred to as “kicker bonds”, are sold at a premium but priced to a specific call date. (For more information on pre-mium bonds, see our Education Note entitled An introduction to premium bonds published 27 November 2012.) All else being equal, they are more likely to be called away by the issuer prior to maturity compared to securities that have a lower coupon. As a consequence, these bonds are priced based on the assumption that they will in fact be called away. However, the actual yield realized by the investor will increase, or “kick up”, if the call is not exercised by the borrower in a timely manner. That said, if rates do rise, the call option becomes less valuable to the issuer and the bond is less likely to be called. This has the negative effect of increasing the bond’s duration as the effective maturity is extended beyond what the investor may have anticipated.
Consider a hypothetical municipal bond carrying a 5% cou-pon, callable in four years at par, and scheduled to mature in 23 years. If we assume the market yield to call is 2.35% as of 14 July, this bond would be priced at USD 109.845. If how-ever, the bond does not get called and remains outstanding to its maturity date, the annual yield increases to 4.32%, pro-ducing a yield kick-up of almost 2.0%.
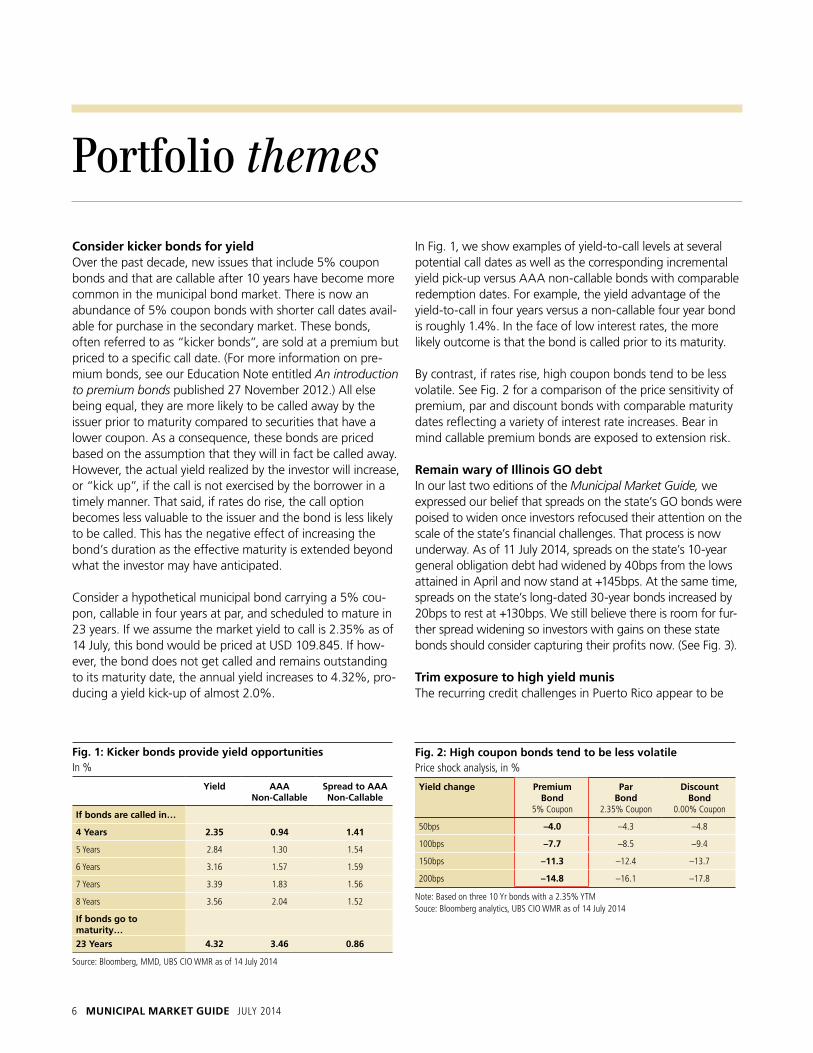
In Fig. 1, we show examples of yield-to-call levels at several potential call dates as well as the corresponding incremental yield pick-up versus AAA non-callable bonds with comparable redemption dates. For example, the yield advantage of the yield-to-call in four years versus a non-callable four year bond is roughly 1.4%. In the face of low interest rates, the more likely outcome is that the bond is called prior to its maturity.
By contrast, if rates rise, high coupon bonds tend to be less volatile. See Fig. 2 for a comparison of the price sensitivity of premium, par and discount bonds with comparable maturity dates reflecting a variety of interest rate increases. Bear in mind callable premium bonds are exposed to extension risk.
Remain wary of Illinois gO debt In our last two editions of the Municipal Market Guide, we expressed our belief that spreads on the state’s GO bonds were poised to widen once investors refocused their attention on the scale of the state’s financial challenges. That process is now underway. As of 11 July 2014, spreads on the state’s 10-year general obligation debt had widened by 40bps from the lows attained in April and now stand at +145bps. At the same time, spreads on the state’s long-dated 30-year bonds increased by 20bps to rest at +130bps. We still believe there is room for fur-ther spread widening so investors with gains on these state bonds should consider capturing their profits now. (See Fig. 3).
trim exposure to high yield munisThe recurring credit challenges in Puerto Rico appear to be
Portfolio themes
fig. 1: kicker bonds provide yield opportunitiesIn %
Yield aaa non-Callable
spread to aaa non-Callable
If bonds are called in…
4 Years 2.35 0.94 1.41
5 years 2.84 1.30 1.54
6 years 3.16 1.57 1.59
7 years 3.39 1.83 1.56
8 years 3.56 2.04 1.52
If bonds go to maturity…
23 Years 4.32 3.46 0.86
Source: Bloomberg, MMD, uBS CIO WMR as of 14 july 2014
fig. 2: high coupon bonds tend to be less volatilePrice shock analysis, in %
Yield change premium bond
5% Coupon
par bond
2.35% Coupon
discount bond
0.00% Coupon
50bps –4.0 –4.3 –4.8
100bps –7.7 –8.5 –9.4
150bps –11.3 –12.4 –13.7
200bps –14.8 –16.1 –17.8
Note: Based on three 10 yr bonds with a 2.35% yTM Souce: Bloomberg analytics, uBS CIO WMR as of 14 july 2014

7 MunICIpal MaRket guIde july 2014
driving some municipal investors out of tax exempt mutual funds. After months of consistent inflows, mutual fund flows have reversed direction. As a result, we are less confident that the municipal high yield market will outperform investment grade munis in the months ahead. Regular readers may recall that in our Municipal Market Guide (13 March 2014) we included a recommendation to buy shares in muni high yield funds selectively as a way to pick up extra yield. We based that recommendation on elevated income opportunities that were present at the time. The credit risk associated with Puerto Rico appeared lower in the wake of the Common-wealth’s successful sale of USD 3.5 billion of general obliga-tion bonds.
The tide may now have turned. The enactment of the Public Corporations Debt Enforcement and Recovery Act has altered the calculus for many tax exempt investors. The Act allows certain public corporations to restructure their outstanding debt and triggered a withering array of rating downgrades. While the muni high yield market performed well through mid-June (~+ 9.5%), performance has weakened on the reversal of fund flows. The municipal high yield index return is now closely aligned (+5.9%) with an index of investment grade credits (+5.6%) when using the Barclays family indices to gauge performance year-to-date. Bear in mind that Barclays Municipal High Yield Index is heavily influenced by the performance of Puerto Rico debt. When using Barclays Municipal Custom High Yield Index (capped at 8% for US ter-ritories including Puerto Rico as of 1 April 2014) to measure
performance, muni high yield (-1.1%) has underperformed investment grade munis (-0.5%) on a month-to-date basis. We believe that the inherent risk associated with municipal high yield is no longer justified given the likelihood that mutual fund outflows will continue. The high yield call worked well earlier this year but the bloom is off the rose and we recommend a shift back into higher grade credits. Should prices rise on muni high yield securities in the near term, we would view that as an opportunity to capture gains. As we go to press, price improvements occurring on select Puerto Rico credits presents such an example.
Maintain preference for 6- to 9-year maturity area;add 12- to 15-year bonds selectivelyFor new money investments, we continue to favor the 6- to 9-year portion of the tax-exempt municipal yield curve. We refrain from including the 5-year spot where the muni-to-Trea-sury yield ratio remains below 80%. Within our preferred range, we note the 9-year bond exhibits the best value. The projected total return for this intermediate term maturity area ranges from 2.72 to 3.55%, assuming the yield curve remains unchanged and roll effects are considered. Also, we recom-mend that investors who rebalance portfolios more frequently allocate a small portion to longer intermediate term maturities in the 12- to 15-year maturity range (previously 12- to 19- year segment). See Fig. A7 in the Chartbook section of this report.
Source: MMD, UBS CIO WMR, as of 14 July 2014
IL GO 30 yr - AAA GO 30 yrIL GO 10 yr - AAA GO 10 yr
200
180
160
140
120
100
80
220
Jul-14Mar-14Nov-13Jul-13Mar-13Nov-12Jul-12Mar-12Nov-11Jul-11Mar-11
Fig. 3: Spreads for Illinois GO bonds
Spreads, in bps
Portfolio themes
fig. 4: Municipal returns by maturity bucketReturns in %, duration in years
Maturity 2013 total return
2014 Ytd total return
Effective duration
Municipals 1–3 yrs 0.99 0.58 1.69
Municipals 3–7 yrs 0.81 2.11 3.97
Municipals 7–12 yrs –1.41 4.87 6.18
Municipals 12–22 yrs –3.73 7.66 8.17
Municipals 22+ yrs –5.73 9.57 10.69
Source: BofAMl, uBS CIO WMR, as of 14 july 2014

8 MunICIpal MaRket guIde july 2014
performance and valuationsSince our last update in June, municipal funds have given up some of their gains in the last four weeks (down 1-2%). However as shown in Figure 1, municipal closed-end funds are still up year-to-date through 9 July 2014, in line with the underlying net asset value (NAV). National leveraged funds were up 12% on a market basis and on a NAV basis, as an example. This group is trading at an average discount of 5.8%, cheaper than the 52-week average of 5.1% as of 9 July 2014.
Non-leveraged funds’ market returns are ahead of NAV per-formance (up 10% market return vs 8% NAV return). Investors of closed-end funds appear to be positioning them-selves ahead of an eventual rate increase by moving into non-leveraged names. Non-leveraged funds are trading at a 4.1% discount, richer than the 52 week average discount of 5.4%. Similarly, we have seen intermediate duration funds move up in price ahead of net asset value (as a strategy to get some protection in a rising rate environment).
Funds of high income tax states like California and New York both traded in line with the 52-week average discount and pay above 6% tax free distributions. In states like New York, the distributions are triple tax free (Federal, state and city taxes) and hence attractive to the residents.
distribution changesFunds continue to provide a stable flow of income to inves-tors. Earlier this month, as expected, we saw a couple of dis-tribution cuts in our universe of hold-rated names. With bor-rowing costs expected to remain fairly low, we anticipate stable distributions for the rest of 2014. Overall, market price direction will be guided by the moves in 10-year and treasury yields as well the underlying municipal bond market.
Please refer to the most recent edition of the Closed-End Fund Coverage Universe report for a list of funds we cover, leverage, durations, ratings, valuations and distribution rates.
Closed-end fund update
fig 2: distribution rate and discount (9 july 2014 vs. 2 january 2014)
distribution rate as of 9 July 2014
distribution rate as of 3 January 2014
average discountas of 9 July 2014
52 wk average discount as of 9 July 2014
Municipal National leveraged 6.4% 7.0% -5.8% -5.1%
Municipal Non leveraged 4.5% 4.8% -4.1% -5.4%
California leveraged 6.3% 7.0% -2.7% -2.3%
New jersey leveraged 6.0% 6.4% -9.4% -9.2%
New york leveraged 6.2% 6.7% -2.2% -2.4%
Source: Bloomberg, uBS CIO WMR, as of 9 july 2014
Source: Bloomberg, UBS CIO WMR, as of 9 July 2014
10
5
0
15
Non leveragedNational New Jersey New YorkCalifornia
Fig. 1: YTD Market returns vs net asset value returns
Funds under coverage, in %
12% 12%
10%
8%
13%12%
10%
13%
11%10%
MarketNAV

9 MunICIpal MaRket guIde july 2014
Although high yield municipal ETFs have posted the second highest return of any segment this year, their performance has suffered over the past month with a return of -1.7%. (See Fig. 1). Contributing to the weakness in these ETFs is the per-formance of Puerto Rico bonds which, on average, account for roughly 5.3% of the three high yield municipal ETF port-folios. Over the past month, the S&P Municipal Bond Puerto Rico Index, which is a market value weighted index of Puerto Rico bonds, has declined by 9.6%. For the year, longer-term municipal ETFs remain the strongest performing segment.
Estimated net flows Municipal ETFs have exhibited net inflows for eight consecu-tive months as declining yields, low supply, and higher tax rates increase investor demand for tax exempt income. For June, inflows totaled USD 86 million, which represented a sharp drop off from the prior three months in which flows averaged USD 283 million. So far in July, inflows have been roughly USD 45 million. There have been no notable changes over the past month and, year-to-date, high yield municipals continue to have the highest net inflows at USD 341 million. (See Fig. 2).
Recent changesEffective 8 July 2014, PowerShares changed the names, underlying indices, investment objectives, and certain invest-ment policies and strategies for its three municipal bond ETFs. One major change is that the new indices include both insured and uninsured bonds, whereas the old indices
Exchange-traded fund update
included just insured bonds. Before 2008, insured municipal bonds accounted for more than half of the municipal bond new issue market. However, since the recession, the percent-age of new issues that are insured has dropped to less than 5% as insurers were downgraded and investor demand for insured bonds declined. Municipal bond ETFs rely on the new issue market as a source of bonds given the fact that the trad-ing volume in any individual bond declines over time. The per-sistent limited supply of insured municipal bonds in the new issue market increases the difficulty in managing a municipal bond ETF that can only invest in insured bonds and these changes help to address the issue.
Investment themesMunicipal bond ETFs can be used to implement recom-mended portfolio strategies and themes. They provide low-cost, diversified exposure and are easily traded on the exchange. We have maintained a preference for intermediate municipal bonds for new money investments. There are three municipal bond ETFs focusing on the intermediate part of the municipal curve, two that are actively managed and one that is passively managed, for investors interested in pursuing this strategy through ETFs. In addition, municipal ETFs can be a tool to equitize cash and put reinvestment proceeds to work. In low-supply environments, municipal ETFs can be used to gain market exposure while seeking individual bond opportu-nities. They can also serve as either a core holding or be used for tactical positioning. For a list of municipal bond ETFs, refer to the Exchange-Traded Fund Universe report.
Fig. 2: Muni bond ETF estimated net flows by market segment
In millions of dollars
Current number of etfs
assets 1-month Ytd 1-year
Broad municipal 3 4,350 -18 245 -290
Short term 6 3,614 86 224 483
Intermediate term 3 880 21 93 -9
long term 2 719 0 76 -191
High yield 3 1,368 -14 341 241
Target date 6 512 13 95 237
Other 9 696 13 41 -72
Total 32 12,140 101 1,114 400
Source: Morningstar Direct, UBS CIO WMR, net flows and assets as of 9 June 2014Note: ETFs in the Other category includes those focused on the following municipal bond areas: New york, California, pre-refunded, revenue, and closed-end funds.
fig. 1: Municipal bond etf average market price total returns by market segment
1-month Ytd 1-year
Broad municipal -0.3% 5.6% 7.1%
Short term 0.1% 0.4% 1.3%
Intermediate term -0.1% 4.4% 7.3%
long term 0.1% 10.1% 9.4%
High yield -1.7% 8.8% 7.9%
Target date 0.0% 0.4% 1.7%
Other 0.0% 7.6% 8.8%
Total -0.2% 4.6% 5.7%
Source: Morningstar Direct, uBS CIO WMR, as of 9 june 2014Note: ETFs in the Other category includes those focused on the following municipal bond areas: New york, California, pre-refunded, revenue, and closed-end funds.

10 MunICIpal MaRket guIde july 2014
By thy rivers gently flowing, Illinois, Illinois, O’er thy prairies verdant growing, Illinois, Illinois,Comes an echo on the breeze. – Lyrics from “Illinois,” official state song, by C.H. Chamberlain
Pension related challenges and budgetary concerns have con-strained Illinois’ credit profile for some time now. With recent developments on both fronts, this month’s Spotlight article provides a fresh look at the Land of Lincoln.
Court ruling makes wavesIllinois is recognized as having one of the strongest pension protection clauses of any state. Article XIII, section 5 of the Illinois Constitution of 1970 states that “membership in any pension or retirement system of the state…shall be an enforceable contractual relationship, the benefits of which shall not be diminished or impaired.” A 6-1 judgment ren-dered by the Illinois Supreme Court on 3 July 2014 finds that this clause “protects more than just pensions,” in the words of Justice Burke, the one dissenting member of the court.1
The state’s highest court ruled that Illinois’ provision of health insurance premium subsidies for retirees is a benefit of mem-bership in the state retirement system under its constitutional pension protection clause. As such, the court found that the state General Assembly was precluded from diminishing or impairing that benefit in effect prior to the enactment of Public Act 97-695 into law in 2012.2 The majority referenced recent state Supreme Court rulings reached in Hawaii and Alaska on the matter of healthcare benefits, and dismissed a contrary finding by the New York Court of Appeals, the high-est court of review in New York State, in support of its decision.3
While the majority conceded that the pension protection clause in the Illinois Constitution was modelled after the “nearly identical” provision of the New York Constitution4, it asserted that since state subsidized healthcare benefits were in existence when Illinois’ pension protection provision was proposed, subsidized healthcare should be regarded as a ben-efit of membership in the Illinois public pension systems and protected accordingly.
Justice Burke disagreed. She felt that the finding of the New York Court of Appeals was “on point and persuasive” and that the Alaska and Hawaii rulings could not be so
characterized. The dissenting justice reasoned that in Alaska, retiree health benefits are granted by the same statute that governs public pensions. In Illinois and New York, by contrast, they are separately established. Hawaii’s retiree health bene-fits also are administered outside of the pension system but the Supreme Court in Hawaii determined that membership in the public retirement system conveyed additional benefits based on comments of its constitutional delegates. Similar language was absent in the record of Illinois’ constitutional debate. Justice Burke contends that the majority opinion pro-vides constitutional protection to any statutory benefit – how-ever unrelated to pensions – so long as the beneficiary is a member of a pension system.
State funding for retiree healthcare in Illinois has increased dramatically in recent years. According to the Institute for Illinois’ Fiscal Sustainability at the Civic Federation, general fund appropriations for group insurance increased by USD 590mn, or roughly 67%, to USD 1.475bn in the FY15 recom-mended budget from USD 885mn in FY11.5 Yet, citing prior case law, the majority emphasized that “to the extent there is any question as to legislative intent and the clarity of the lan-guage of a pension statute, it must be liberally construed in favor of the rights of the pensioner.” The ruling reverses the decision of the Sangamon County Circuit Court, which had dismissed the plaintiffs’ claims that Public Act 97-695 was void and unenforceable. The high court remanded the case
Spotlight
Illinois
Note: Based on actual data for FYs 10–14, revised data for FY14 and forecast for FYs 15–19.Source: State of Illinois, Governor’s Office of Management and Budget, UBS CIO WMR,as of 14 July 2014.
15,000
12,000
9,000
6,000
3,000
0
18,000
FY10
FY11
FY12
FY13
FY14
FY15
FY16
FY17
FY18
FY19
Fig. 1: Illinois unpaid bill backlog
In USD mns, FYs 10–19
Unpaid bill backlog at year-end
Projected unpaid bill backlog at 1 January 2014 (assumes no tax extension)Unpaid bill backlog at year-end (as per recommended FY15 budget)

11 MunICIpal MaRket guIde july 2014
their view of the state’s credit quality at this time. Prudently, the state did not incorporate any expense reduction from the pension reform legislation in its budgeting until FY16. However, given Illinois’ ignominious distinction as the state with the most poorly funded pension system in the nation, any invalidation of the pension reform would be a material negative for its financial condition. As of 30 June 2013, the state’s aggregate pension assets covered liabilities by only 41% based on market value; its total unfunded pension liabil-ity stood at USD 97.5bn at the same time.
In a statement following the recent ruling, Governor Quinn’s office responded: “We’re confident the courts will uphold this critical law that stabilizes the state’s pension funds while squarely addressing the most pressing fiscal crisis of our time by eliminating the state’s unfunded pension debt.”6 A spokes-person for State Attorney General Lisa Madigan echoed this sentiment, on the premise that the pension reform case is based on arguments that are distinct from the health care case.7 State Senate President John Cullerton was less optimis-tic. In a statement to the press, he warned that “if the court’s decision is predictive, the challenge of reforming our pension systems will remain.”
budget updatePension-related challenges are not the only issue clouding the outlook for the Prairie State these days. The second key issue facing Illinois is its budget plan. The regular legislative session concluded at the end of May without an agreement to extend temporary tax increases that are scheduled to partially expire midway through the fiscal year.8 The legislature failed to agree upon any meaningful spending reductions in antici-pation of lower revenue. As a result, the state finds itself in a position where recurring revenues are insufficient to accom-modate current spending needs. The failure to extend the tax increase is expected to cause revenues to decline by USD 1.8bn in FY15 and a greater amount in FY16, the first full year of implementation.9
Illinois has been successful in reducing its backlog of unpaid invoices in recent years but the trend is unlikely to continue unless structural solutions are adopted to address the budget-ary imbalance. The Governor’s recommended budget, which assumed the tax increase was extended, anticipated a reduc-tion in the gross bill backlog to roughly USD 2.2bn by FY19. (See Fig. 1). The state estimated that its unpaid bills amounted to USD 3.9bn as of 30 June 2014.10 This represents a
back to the circuit court for further proceedings consistent with its findings. The circuit court will decide if the Act impairs retiree pension benefits.
pension reform at risk?This development clouds the outlook for a separate – and more significant - lawsuit underway in the Sangamon County Circuit Court in relation to the state’s broader pension reform law enacted in December 2013 [Public Act (PA) 98-0599]. The reforms under this seminal legislation were anticipated to save the state USD 144.9bn over 30 years according to a review by pension fund actuaries. A court order, announced on 14 May 2014, halted the state from implementing the leg-islation while corresponding litigation proceeds.
Legal challenges to the reform legislation were widely antici-pated. In light of the state’s strong constitutional protections for pension benefits, the court’s decision to stay implemen-tation of the law was not altogether surprising. All three rat-ing agencies were quick to announce that it did not alter
Spotlight Illinois
fig. 2: Illinois gO bond ratings at calendar year end
Year S&P Moody’s Fitch
1998 AA Aa2 AA
1999 AA Aa2 AA
2000 AA Aa2 AA+
2001 AA Aa2 AA+
2002 AA Aa2 AA+
2003 AA Aa3 AA
2004 AA Aa3 AA
2005 AA Aa3 AA
2006 AA Aa3 AA–
2007 AA Aa3 AA
2008 AA Aa3 AA–
2009 A+ A2 A
2010 A+ A1 A
2011 A+ A1 A
2012 A A2 A
2013 A A3 A
2014 A– A3 A–
Note: Red indicates downgrade, blue indicates upgrade Source: Moody's, S&P, Fitch, uBS CIO WMR as of 11 july 2014

12 MunICIpal MaRket guIde july 2014
one, states: “Affirmation or rejection of PA 98-0599’s key lia-bility-reducing elements (such as limits on cost-of-living adjustments) by the state’s highest court…will ultimately have a significant impact on the state’s credit standing.”12 On the budget plan, the rating agency notes that “Growth in the backlog of unpaid bills, even to a lesser extent than forecast, could trigger additional downgrades of the state.”13
Along the same lines, S&P explained its rationale behind the ‘developing’ outlook as follows: “If the pension reform is declared unconstitutional or invalid, or implementation is delayed and there is a lack of consensus and action among policy makers on the structural budget gaps and outstanding payables, we believe there could be a profound and negative effect on the state’s budgetary performance and liquidity over the two-year outlook horizon and could lead to a lower rat-ing. While a developing outlook is unusual for a state, it reflects the magnitude and scope of pension and budgetary issues facing Illinois.”14 To round out the group, Fitch links maintenance of its rating to “timely action in advance of the expiration of temporary tax increases in fiscal 2015.”15
Outlook and conclusionsIllinois’ GO bond credit spreads have remained narrower than one would have expected given the corresponding level of credit risk. In our last comprehensive discussion of this issue (Municipal Market Guide, 8 January 2014), we expected spreads to narrow a little further before widening again when reality set in. That process is now underway. (See Fig. 3). We have regularly commented on the remarkable performance of Illinois bonds this year despite its troubled credit profile and urged investors to capture profits on Illinois GO debt as recently as last month. We revisit the issue again this month as a portfolio theme.
The state’s 10-year and 30-year GO bond credit spreads were 138bps and 116bps, respectively, on 8 January 2014, accord-ing to MMD. They reached corresponding lows of 105bps
Spotlight Illinois
reduction of USD 6bn from a USD 9.9bn peak reached in November 2010.
While an updated forecast of the state’s backlog of unpaid bills in the absence of the tax extension was not available as we went to press, a prior estimate based on this assumption provided by the Governor’s Office of Management and Budget in January projected that unpaid bills would exceed USD 16bn by FY17. The income tax issue and possible spend-ing adjustments could be revisited by the legislature following the November election.
Rating updateIllinois is the lowest rated of any state, having experienced numerous downgrades over the past five years. (See Fig. 2). The state is currently rated A3 by Moody’s and A- by both S&P and Fitch. Moody’s and Fitch assign a negative outlook to their credit ratings while S&P’s outlook is developing. In response to the recent Supreme Court ruling, Moody’s described the decision as credit negative, indicating that it now perceives increased risk that the court will also find the broader pension reform legislation unconstitutional.11 As we went to press, S&P and Fitch had yet to comment on the same matter. We would expect it to be characterized as a negative credit development by those rating agencies as well.
A failure by the state to address its pension funding concerns and budgetary imbalance will place additional pressure on the rating. On the pending pension reform measure, Moody’s, for
Source: MMD, UBS CIO WMR, as of 10 July 2014
IL GO 30 yr – AAA GO 30 yrIL GO 10 yr – AAA GO 10 yr
220
200
80
160
140
120
100
180
240
Apr-1
0
Sep-
10
Feb-
11
Jul-1
1
Dec-
11
May
-12
Oct
-12
Mar
-13
Aug-
13
Jan-
14
Jun-
14
Fig. 3: Spreads for Illinois GO bonds
Spreads, in bps
“Given Illinois’ ignominious distinction as the state with the most poorly funded pen-sion system in the nation, any invalidation of the pension reform would be a material negative for its financial condition.”

13 MunICIpal MaRket guIde july 2014
and 110bps in April, a contraction of 33bps and 6bps, respec-tively. As of 10 July, the 10-year maturity had widened to 145bps, while the 30-year stood at 130bps. This represents an increase of 40bps from April lows at the 10-year point and 20bps at the 30-year maturity. We expect that spreads on the state’s GO bonds will widen further as investors increasingly focus their attention on the scale of the state’s financial challenges.
Our outlook for the state’s credit profile has not changed since January. Illinois deserves the lowest credit ratings of any state in the nation, in our view, but we continue to believe it will pay its general obligation bonds in full and on time. (See textbox). That said, we consider the credit risk posed by legal challenges to the pension reform law and the expiring tax rates to be higher now than in January. We expect the next few months to be critical for the state’s credit ratings. The rat-ing agencies will be looking for some progress on the budget front in the next legislative session. In its absence, we expect further downgrades.
We are obliged to conclude our discussion of Illinois with an observation that credit risk is even more pronounced at the local government level, in our view. Reductions or deferrals in state aid, a higher backlog of overdue bills, or an adverse rul-ing on the state’s pension reform measure will have meaning-ful consequences for the fiscal health of local governments in Illinois. For many local governments within the state, the abil-ity to raise revenues and reduce expenditures is more limited and politically challenging than at the state level. The protec-tions afforded to bondholders also are typically less well-defined.
Spotlight Illinois
• The state government retains broad authority to raise revenue, and debt service payments on general obliga-tion bonds enjoy a high priority over other state spending.
• Illinois funds GO debt service one year ahead on a roll-ing 12 month basis.
• The state’s GO bond pledge includes an irrevocable and continuing appropriation for all GO debt service, and continuing authority and direction to the State Treasurer and Comptroller to make all necessary trans-fers from any and all revenues and funds of the state.
Provisions for the repayment of Illinois GO debt are strong

14 MunICIpal MaRket guIde july 2014
IN THE NEWSAs of 14 july 2014
alabaMa
alabama state university was downgraded to Ba1 from Baa1 by Moody’s on 3 July 2014. The negative rating outlook was maintained. Alabama State University is a medium-sized public historically black university located in Montgomery. The downgrade to the non-investment grade category reflects weakened liquidity, with the university drawing on reserves to fund debt service in FY13. Debt service coverage was 0.55x in this period, according to Moody’s, and the need to draw on reserves is expected to continue in FY14 with a fourth consec-utive deficit anticipated in that year. The rating action is also in response to the decision by the Southern Association of Colleges and Schools Commission on Colleges (SACSCOC) to place the University’s accreditation status on warning on 19 June 2014. A loss of accreditation would threaten the enroll-ment outlook for any university, as students would no longer be eligible for federal financial aid programs. SACSCOC plans to review Alabama State’s accreditation status at its December 2014 meeting. The rating outlook hinges on favor-able resolution of the accreditation review, improved gover-nance, and stronger liquidity.
CalIfORnIa
Moody’s Investors Service upgraded California’s general obligation bond rating to Aa3 from A1 on 25 June 2014. The rating agency cited the state’s improved financial perfor-mance, robust employment growth, and strong liquidity posi-tion. Governor Brown signed California’s USD 108bn FY 2015 budget into law on 20 June, marking the fourth consecutive on-time budget for the Golden State.
California State Controller John Chiang announced last week that the state General Fund ended fiscal year 2014 with USD 1.9 billion in cash. This is the first time in seven years that California has ended its fiscal year with a positive cash bal-ance. The state reported USD 101.6 billion in annual revenue, 2.1% more than was projected in the budget released in January.
sutter health has long been recognized as a leading health-care provider in the northern California market with revenue bond ratings of Aa3 by Moody’s and AA- by both S&P and Fitch. While S&P and Fitch maintain a stable view of the credit, Moody’s recently revised its rating outlook to negative on 1 July 2014. The outlook revision reflects operating results in FY13 that lagged budgeted expectations by a wide margin.
The agency also cited a significant USD 5bn capital plan over the next five years which could weaken the balance sheet.
COlORadO
Moody’s revised its outlook on denver International airport to stable from negative on 19 June 2014. The rating agency had previously cited construction risk involved in the airport’s USD 1.38bn capital plan and concern regarding the impact on enplanement trends as Frontier Airlines positions itself for sale as factors for the negative outlook. Moody’s now expects future debt funded capital improvements to be lower than the principal payments on outstanding debt, resulting in no material increase in the current level of debt per origination & destination passenger. The agency also observed that enplanements have rebounded in 2014 with an increase of 1.43% through April following a 1.1% decline in 2013. It notes, however, that material service reductions by Frontier – which captures about 19% of the market - remain a risk. The airline completed its sale to Indigo Partners last year and is reported to be transitioning to an ultra-low cost carrier operating strategy.
dIstRICt Of COluMbIa
Moody’s downgraded howard university to Baa3 from Baa1 on 3 July 2014 and maintained its negative rating out-look. Howard is a private university and is recognized as among the leading historically black colleges in the nation. The rating agency cited a host of challenges currently confronting the university. Foremost among these is stressed operations at the university hospital, which management plans to address through workforce reductions and a possible joint venture. The university’s liquidity position has narrowed given the oper-ating deficits at the hospital and the timing uncertainties asso-ciated with federal payments (which represent approximately 25% of revenues). While the university recently extended its line of credit agreement with a group of banks, the terms were less favorable than previous lines, with a committed amount USD 94.5mn versus USD 135mn. According to the rat-ing agency, Howard had drawn USD 65mn on the line as of 30 June 2014. The new agreement expires on 24 June 2015 and the entire balance is due at expiration in the event it is not extended.
Compounding these issues, Moody’s believes that the univer-sity’s potential need to support two new privatized student

15 MunICIpal MaRket guIde july 2014
housing facilities has increased. The rating agency notes that if this were to occur, it would reconsider adding the USD 108mn of associated debt to the university’s balance sheet. Moody’s currently rates USD 290mn of debt issued by the university, so incorporating the housing bonds into the debt profile would represent an increase of nearly 40%. This would be in addition to indirect debt obligations, such as pensions and operating leases, which the rating agency characterizes as significant. Finally, Moody’s expressed concern about Howard’s ability to navigate the challenges at hand given notable absences in senior leadership. While a new president is expected to be named before the onset of the fall 2014 semester, this position – as well as provost and CFO – are currently filled by interim appointments.
flORIda
We discussed the increased rating pressure facing the city of Jacksonville due to its high pension and debt burden in the February edition of the Municipal Market Guide (12 February 2014). Moody’s downgraded the city’s issuer rating to Aa2 from Aa1 on this basis on 17 June 2014 and revised its rating outlook to stable. Moody’s reports that pension costs for the city’s three pension plans are slated to grow by over 20% in FY14 on a year-over-year basis and are estimated to equal roughly 19% of the city’s budget. Unlike Cincinnati and Chicago, two cities which also were downgraded in recent months as a result of rising pension liabilities, the rating agency notes that Jacksonville has historically fully funded its actuarially required pension contribution. Moody’s credits a new pension reform plan (which was in the final stages of rat-ification at the time of its report), along with a strong econ-omy and growing reserves, with mitigating the pension-related stress. The outlook on Fitch’s AA rating of the city remains negative.
IllInOIs
Fitch downgraded Cook County’s rating to A+ from AA- on 11 July and retained its negative rating outlook. The rating agency cited the county’s lack of progress in addressing its pension-related challenges and the anticipated difficulty the county will face in coming years if it moves toward full fund-ing of actuarially required pension contributions. Fitch also expressed longer-term concern over the potential level of sup-port for the county’s health system. Moody’s also assigns a negative outlook to its A1 GO bond rating of the county, while S&P has yet to take action on its ‘AA’ opinion of the
county’s credit quality. We discuss the likelihood of further spread widening in the GO bonds of Illinois and its local gov-ernments in the Spotlight section of this report.
Two Chicago suburbs located in Cook County also suffered recent downgrades on pension concerns. Illinois Public Act 96-1495 requires cities and villages to make sufficient annual contributions to bring public safety pension plans to a 90% funded ratio by 2040. Under the Act, state shared revenues may be diverted from local governments not in compliance by FY16. Moody’s downgraded the issuer rating of the village of north Riverside to Baa2 from A2 on 20 June 2014 and assigned a negative rating outlook. The rating agency warned that the village’s reserves could suffer material declines as it either comes into compliance with the Act or risks the loss of state shared revenues. Moody’s followed on 24 June by downgrading the village of Oak Lawn to A2 from A1, while maintaining its negative rating outlook. Like North Riverside, Oak lawn also faces substantially higher pension contribu-tions in coming years and the possibility of future budgetary imbalances.
MIChIgan
Michigan’s rating outlook was revised to stable from positive by S&P on 17 June 2014 on weaker revenue trends. The rat-ing remains AA-. The state’s decision to draw on its budget stabilization reserve fund on behalf of the Detroit bankruptcy settlement was cited as a factor for the outlook revision. S&P said it “raises questions as to potential future state contribu-tions to other distressed localities and school districts.”
Speaking of Detroit, on 1 July 2014, the US Bankruptcy Court for the Eastern District of Michigan Southern Division found bond insurers Assured Guaranty and National Public Finance Guarantee Corporation to have exclusive voting rights on Detroit’s outstanding insured water and sewer revenue bonds and unlimited tax general obligation bonds in bankruptcy. Votes submitted on these claims by any other party will be disregarded. Detroit’s attorneys informed US Bankruptcy Judge Steven Rhodes to expect the results from the creditor vote on the city’s proposed Plan of Adjustment of Debts on 21 July 2014.
Governor Snyder signed a number of bills related to the Detroit bankruptcy case into law on 20 June 2014, including one authorizing the state’s USD 195mn contribution towards the “Grand Bargain” settlement. The Grand Bargain – com-posed of the state’s donation and the contributions of various nonprofit foundations and donors – is expected to provide
IN THE NEWS

16 MunICIpal MaRket guIde july 2014
approximately USD 816mn over 20 years to reduce pension cuts and protect the collection of the Detroit Institute of Arts.
Finally, according to a recently announced settlement, Detroit has agreed to a 34% recovery rate for holders of its limited-tax general obligation debt. The city had most recently offered 10-13% recovery on these obligations. Ambac Assurance Corporation is the bond insurer for most of the affected debt. A previously announced settlement related to the city’s outstanding unlimited-tax general obligation bonds provided for recovery of 74%.
The Michigan healthcare landscape continues to evolve. beaumont health system, Oakwood healthcare and botsford health Care had joined the wave of mergers, acquisitions and affiliation agreements in the non-profit healthcare sector when they announced plans to affiliate earlier this year (please refer to the April edition of the Municipal Market Guide, 16 April 2014, for more informa-tion). According to a press release, the group finalized a definitive agreement last month, subject to state and federal approval. The new system, which will be called Beaumont Health, will be the largest acute care provider in southeast Michigan with eight hospitals, 153 outpatient sites, and USD 3.8bn in revenues.
Some of our readers may recall that Beaumont previously had called off merger talks with the competing henry ford health system in 2013. Moody’s downgraded Henry Ford to A3 from A2 on 24 June 2014 and assigned a negative rating outlook. The rating agency cites deteriorating operating results in FY13 and through the first quarter of FY14, as well as the near-term challenges presented by the highly competi-tive market and sluggish economy. Moody’s acknowledges that the Beaumont merger could increase competitive pres-sures. The merger activity only reinforces our view that the US health care sector is rapidly consolidating as a means of increasing operating efficiency. Single site hospitals and smaller systems will face greater challenges in the years ahead.
MInnesOta
In a comment published on 26 June 2014, Moody’s high-lighted some encouraging trends benefitting the state and its local governments. New data from the state Department of Revenue shows that residential property values increased in 2013 for the first time since 2007 and, across all property cat-egories, values were up for the second year in a row. In addi-tion, the rating agency looked to US Census Bureau data
which found an 80% increase in statewide building permit activity in 2012, following declines in each year from 2007 to 2011. Two consecutive years of growth in statewide residen-tial property sales in 2011 and 2012, along with the lowest unemployment rate among the nation’s 25 largest states (as of March 2014), are further signs of economic improvement cited by Moody’s.
neW JeRseY
Governor Christie signed into law a USD 32.5bn budget for the State of New Jersey on 30 June, after cutting approxi-mately USD 1.5bn from the spending plan approved by the legislature. The state will pay USD 681mn towards pension contributions in FY 2015, down from an initially estimated USD 2.25bn. A deep shortfall in revenue collections for FY 2014 necessitated the revision. Please refer to the May edition of the Municipal Market Guide (14 May 2014) for more information.
Trump Entertainment Resorts Inc. announced plans to close the Trump Plaza Hotel & Casino in atlantic City as soon as September. The casino is Atlantic City’s tenth largest taxpayer. The Showboat Casino Hotel, the city’s ninth largest taxpayer, is scheduled to be shuttered at the end of August. Both clo-sures follow the Atlantic Club casino’s in January. That casino previously had been the city’s thirteenth largest taxpayer. Meanwhile, Revel Casino & Hotel, the third largest taxpayer for Atlantic City, is in bankruptcy.
As we noted in the January 2014 edition of the Municipal Market Guide (16 January 2014), the city’s financial condition has exhibited significant erosion due to continued declines in casino revenues along with large casino property tax appeals. Increased competition from casinos in neighboring states has presented an ongoing challenge for the Atlantic City gaming industry. Moody’s assigns a rating of Baa2 to Atlantic City’s GO debt. The rating is accompanied by a negative outlook. S&P maintains a rating of A-, accompanied by a stable out-look, on the same obligations. We anticipate further rating pressure ahead.
neW YORk
Moody’s downgraded its assessment of Winthrop university hospital association’s (Winthrop) revenue bonds to Baa2 from Baa1 on 23 June. According to the rating agency, the downgrade was triggered by the organization’s weaker financial performance in fiscal year 2013. The
IN THE NEWS

17 MunICIpal MaRket guIde july 2014
downgrade comes less than two years after Moody’s assigned a stable outlook on its initial rating of Baa1 to Winthrop’s Series 2012 Revenue Bonds. The new Baa2 rating also comes with a stable outlook. In fairness to the rating agency, the last rating report suggested a downgrade was possible if there was future debt issuance without offsetting cash flow generation. Winthrop now plans to sell an addi-tional USD 60 million via a private placement. Although Winthrop serves as a teaching hospital for SUNY-Stony Brook School of Medicine, and is generally well regarded, the Long Island market within which it operates is very competitive. As a single site provider of health care, this borrower is likely to face perennial financial challenges in the years to come.
Tax appeals have presented a longstanding challenge for nassau County, and one that has been compounded by the county’s legal obligation to cover the successful appeals of its local governments. As of 31 December 2013, the county reported a long-term liability of roughly USD 300mn for this purpose. Indeed, Moody’s finds that over 30% of the coun-ty’s outstanding debt was issued to finance these tax chal-lenges over time, a practice which is not fiscally prudent, in our view. In welcome news for the county, the state legisla-ture approved legislation on 20 June 2014 that will change the approach going forward with an eye toward eliminating the additional accrual of liabilities. Under the new model, if a commercial property owner appeals its tax assessment, the county will continue to levy taxes upon the full amount in dis-pute. The disputed amount will be held in a disputed assess-ment fund, which will be established under the legislation. If the tax challenge is successful, the property owner will be remitted the disputed amount. If not, the amount in dispute will be distributed to affected local governments within the county. The new program is slated to take effect in FY15, pending final approval by Governor Cuomo. Moody’s described the legislation as a credit positive for the county.
pennsYlVanIa
The state legislative session concluded without an agreement on pension reform for inclusion in the FY15 budget. In a press release dated 14 July 2014, Governor Corbett responded: “I am urging the citizens of Pennsylvania to join in this fight and demand that the legislature address the most important fiscal challenge facing the commonwealth: pension reform.” The General Assembly is expected to reconvene in September. Meanwhile, the Commonwealth’s credit ratings hang in the balance. Pennsylvania’s general obligation debt is rated Aa2 by Moody’s and AA by both S&P and Fitch. The latter two
agencies currently assign a negative outlook to their credit ratings. Increased pension funding challenges are cited as a rating pressure by each. In its review dated 28 April 2014, S&P noted that it would monitor the FY15 budget process and could lower its rating in the next few months in the absence of a structurally balanced budget and meaningful pension reform. Fitch attached a similar caveat in a review published the same month in order for the Commonwealth to maintain its AA rating.
pueRtO RICO
We discussed rating actions taken by Moody’s on 1 July 2014 on various Puerto Rico credits in our report published 2 July 2014 (Puerto Rico Credit & Market Update). There are several new developments to report since that time.
In chronological order, Fitch downgraded Puerto Rico general obligation, sales tax, retirement system, and water revenue bonds on 9 July 2014. The rating actions included a down-grade of the Commonwealth’s general obligation bond rat-ing to BB- from BB. More staggering, however, was the 9 notch downgrade of the senior lien sales tax revenue bonds issued by the Puerto Rico Sales Tax Financing Corporation (COFINA) to BB- from AA- (subordinate lien bonds were downgraded from A+ to BB- at the same time). The ratings remain on negative outlook.
On 11 July 2014, S&P took a variety of rating actions on Commonwealth credits, including a reduction of the GO bond rating to BB from BB+, lowering the Government Development Bank’s issuer credit rating to BB- from BB, and a downgrade of senior lien COFINA bonds to BBB from AA- (subordinate lien bonds fell to BBB- from A+). Ratings were removed from CreditWatch with negative implications and assigned a negative outlook. The rating agency then lowered its rating of the Puerto Rico Aqueduct and Sewer Authority’s revenue bonds to BB- from BB+ on 14 July. The rating is also accompanied by a negative rating outlook.
The Commonwealth also filed a disclosure notice on 10 July 2014, 10 days after the corresponding due date, informing bondholders that the puerto Rico electric power authority (PREPA) failed to provide sufficient funds to cover its debt service payment due on 1 July. The bond trustee was required to draw on the debt service reserve fund established for this purpose to cover the shortfall. According to the filing, the bond trustee withdrew approximately USD 41.6mn from the reserve account, which included USD 10.6mn in excess of the amount of interest that PREPA had determined to be due on the bonds in the next twelve months.
IN THE NEWS

18 MunICIpal MaRket guIde july 2014
For its part, the government development bank has posted three statements to its website since 1 July reaffirm-ing its commitment to strengthen the Commonwealth’s credit quality. Additionally, Secretary of the Treasury Melba Acosta Febo announced that total preliminary net revenue for FY14 was USD 9.037bn, which represents an increase of 5.5% from FY13, but lags budgeted estimates for the year by more than 5%. The Government Development Bank also announced that an investor webcast will be held on 17 July 2014. We have provided an updated list of ratings in Table 1 in the Appendix of this report but advise our readers to mon-itor the ratings closely as they are changing rather frequently.
RhOde Island
S&P removed the state’s rating from CreditWatch with nega-tive implications on 18 June after the state legislature included an appropriation for debt service in the FY15 bud-get in support of its moral obligation pledge for the repay-ment of bonds issued for an economic development project associated with a failed video game company (38 Studios).
tennessee
With the enactment of House Bill 1398 into law, Tennessee is prohibited from spending its own resources to repay the debt of distressed governments. Moody’s characterized the law as credit positive for the state in a 10 July 2014 report. According to the rating agency, it has always been the state’s policy not to pay debt service for stressed municipalities, but the recent action codifies this policy into law. Moody’s recog-nizes this as a development which insulates the state finan-cially in the event of default by one of its local governments.
VIRgInIa
The application of new general obligation bond criteria has led Standard & Poor’s to publish numerous rating changes in the last nine months. Few have been as dramatic as the recent revision to the GO bond rating of petersburg, Virginia. The city’s GO bond rating was revised to BBB from A+ on 19 June. S&P cited the application of its new criteria as the driving force behind the downgrade but the absence of cash reserves and a persistent structural budget deficit undoubtedly also played a role. According to S&P, Petersburg had no available cash in its General Fund, which was owed USD 8.5 million from the golf course and mass transit enter-prise funds. We were therefore perplexed when the rating agency suggested that the city’s reliance on cash flow notes posed a “manageable” risk because of its history of capital markets access. Market access has a tendency to evaporate at inopportune moments. We also are obliged to note that S&P had not reviewed the credit since March 2011 when it raised the rating to A+ from A. The current S&P rating out-look is stable. For our part, we remain skeptical of such stability.
IN THE NEWS

19 MunICIpal MaRket guIde july 2014
CrEdIt brIEfs
Guam: where America’s day begins
Investor interest in the financial condition of Guam and its government agencies has increased markedly in the past three months following the media coverage of financial dis-tress in Puerto Rico. Guam’s debt obligations historically have been assigned weaker bond ratings, which also may help to explain the increased anxiety among investors. Most of the island’s ratings have been clustered in the BBB range, as seen in Fig. 1. Like other US territories, including Puerto Rico and the US Virgin Islands, Guam is permitted to issue municipal bonds whose interest is free from federal taxation. Interest payments also are generally exempt from state taxation, mak-ing them attractive to single-state mutual fund managers seeking diversification.
In the wake of Puerto Rico’s decision to enact its own debt restructuring statute, some market observers have suggested that all US territorial debt now poses a risk to investor portfo-lios. While we readily acknowledge the ambiguity inherent in Puerto Rico’s decision to allow public corporations to restruc-ture debt outside of federal bankruptcy law, we are reluctant to suggest that investors abandon a position in Guam munici-pal bonds. The credit quality of Guam has gradually improved in recent years and there is no evidence that the administra-tion of Governor Eddie Baza Calvo is contemplating similar steps. The governor inherited a substantial structural deficit in 2011 but focused his efforts on rolling back salary increases and imposing a variety of austerity measures. Unlike Puerto
Rico, whose governor also made some unpopular decisions, Guam has a substantial military presence. The military bases on the island cushioned the recessionary impact of the reduc-tion in territorial spending and facilitated a gradual improve-ment in credit quality.
Guam is a much smaller island than Puerto Rico, with a popu-lation of less than 200,000 and a land area only three times larger than the District of Columbia. The economy is highly dependent on US military expenditures and tourism from other parts of Asia. The island’s reliance on military expenditures is a two-edged sword, of course, as any reduction in federal trans-fer payments can have a disproportionate impact on govern-ment revenue. Fortunately, we believe the US foreign policy
Puerto Rico’s financial challenges have led some market observers to question whether other US territories are likely to follow a similar path. Bonds issued by Guam and the US Virgin Islands have come under greater scrutiny as a result. This month’s credit briefs provide a comprehensive survey of the largest borrowers in both territories. We find that the credit quality of borrowers on Guam has improved incrementally, but expect the Virgin Islands to face more hurdles going forward. While we are reluctant to make a direct link to the likeli-hood of Puerto Rico’s debt restructuring law being transferrable to other US territories, we recognize Guam as the stronger of the two credits and would not anticipate it having a need for such legislation in the forseeable future. Should Puerto Rico-related concerns trigger price pressure on Guam and Virgin Islands debt obligations, the securities on offer by Guam may become more attractive on a relative value basis for those investors with a higher level of tolerance for credit risk. Meanwhile, diversifying portfolios away from concentrated exposure to Virgin Islands credits is advisable at this time, in our view.
fig. 1: guam selected unenhanced senior lien ratings
name of issuer Moody’s s&p fitch
General Obligation BB- (stable)
Business Privilege (Sales) Tax A (stable) A- (stable)
Power Authority Revenue Baa3 (stable) BBB (stable) BBB- (stable)
Waterworks Authority Revenue Ba1 (pos) A- (stable) BB (pos)
Airport Authority Revenue Baa2 (stable) BBB (stable)
limited Obligation Section 30 Caa1 BBB+ (stable)
Hotel Occupancy Tax Revenue Caa1 BBB+ (stable)
Source: Moody’s Investors Service, S&P, Fitch, uBS CIO WMR, as of 14 july 2014

20 MunICIpal MaRket guIde july 2014
pivot towards Asia is likely to bring more military investment to the island, stimulating the economy and gradually improving the credit quality of Guam’s bonds (see sidebar). In addition to an existing air force wing and submarine squadron, the even-tual redeployment of some US Marines from Okinawa to Guam appears to us as inevitable.1 Visitors generally originate from Japan and South Korea, where Guam serves as a surro-gate for vacationers unable to afford the trip to Hawaii.
guam International airport authorityThe Guam International Airport Authority (GIAA) is a public corporation which was created in 1975 to manage the com-mercial passenger terminal on property owned by the United States Navy. The Navy subsequently conveyed 1,417 acres to the Authority for commercial aviation purposes. The current airport property encompasses approximately 1,800 acres of land near Hagatna, Guam’s central business district. As the only commercial airport servicing the island’s residents and visitors, the GIAA is an essential public facility. Passenger enplanements have fluctuated over the years for a variety of reasons, includ-ing storm damage from typhoons in Guam to earthquakes and economic recession in Japan. Enplanements in fiscal year 2012 were 9.4% higher than the previous year at 1.6 million but still below the long term peak of 1.9 million in 1997.
The current airline use agreement, which incorporates a resid-ual rate setting process, was renewed in September 2011 and is scheduled to expire in 2016. Revenues derived from sources other than fees paid by participating airlines are used to offset operating costs. The airlines serving Guam are periodically charged or credited with any difference, essentially requiring them to make up any differences between the non-airline
revenue generated by the Authority and the amount necessary to keep the operation running. There are currently ten signato-ries to the airline use agreement. Airport authority revenue grew steadily from fiscal year 2009 through fiscal year 2012, which resulted in debt service coverage increasing from 1.33x to 1.66x over that time frame.2 Forecasted coverage is expected to decline to approximately 1.51x through 2019.
There are three principal risks associated with this credit. First, Guam is subject to periodic natural calamities, from earth-quakes to typhoons. These recurring events depress passen-ger enplanements until service is restored. Second, the island’s location far from the US mainland makes tourism from the US immaterial to the financial operations of the air-port. Tourists from Japan and South Korea comprise the over-whelming majority of visitors. Economic conditions in both countries have affected passenger traffic at the airport and will continue do so. Finally, and most importantly, the US mili-tary’s commitment to Guam as a forward deployment instal-lation in the western Pacific is crucial to the Airport’s ability to service its debt over time. We believe each of these risks is manageable and view the credit quality for the airport as rea-sonably stable going forward.
the guam power authorityThe Guam Power Authority (GPA) was established in 1968 by the territory’s legislature and currently is overseen by the Consolidated Commission on Utilities. The Authority owns or otherwise operates electricity generating facilities with approximately 540 megawatts of net capacity.3 The GPA is a semi-autonomous unit of the government and any cash trans-fer to the government of Guam must be approved in advance by the Commission.4
The Authority serves 47,000 customers but the United States Navy is the largest customer. According to a recent analysis by S&P, the Navy constituted 18% of total utility revenue. The military contract was renewed for another 10 years in 2012.5 Peak loads and energy sales were relatively flat from 2007 through 2011 but declined modestly from 1.617mWh to 1.565mWh in fiscal year 2013. Oil is the predominant source of fuel for generation. Not surprisingly, the biggest driver of the GPA’s capital improvement program is the planned diver-sification into liquefied natural gas.6 While the Authority con-tends that the cost of the capital program will be offset by savings in terms of lower fuel costs, we are not in a position to verify the claim. Moody’s has independently calculated
CrEdIt brIEfs
Guam is an unincorporated territory of the United States in the western Pacific Ocean. At 212 square miles, it is the largest and southernmost island in the Marianas Islands archipelago but is independent of that island chain. Guam’s strategic location, closer to the Philippines than it is to Hawaii, has taken on added importance as the United States pursues a more engaged foreign policy in Asia. Andersen Air Force Base and Naval Base Guam are critical forward deploy-ment installations for the US military as it seeks to off-set a rising Chinese military presence.

21 MunICIpal MaRket guIde july 2014
consolidated debt service coverage of senior and subordinate lien bonds at 1.38x.
The GPA’s senior lien revenue bonds have exhibited some rat-ing volatility over the years, hovering around the minimum investment grade rating category. While all three major rating agencies now consider the senior lien bonds investment grade, only S&P rates the junior lien bonds at the BBB- level or its equivalent. While we are convinced that the US military is committed to the island because of its geopolitical strategic importance and foresee little chance that the Navy would
summarily cancel its contract with the GPA, we prefer the ter-ritory’s airport authority bonds as the safer credit. Federal rules governing airport improvement grants make it more dif-ficult to siphon cash away from airport enterprises for general government purposes. The airport also faces fewer challenges than those currently confronting the GPA, which range from the planned conversion to alternate sources of fuel to compli-ance with environmental mandates.
guam Waterworks authorityThe credit ratings assigned to the Guam Waterworks Authority (GWA) offer investors an opportunity to examine opposing rating agency views. Even today, when rating agen-cies diverge more often in their assessments than in the past, it is not all that common to see two agencies (Fitch and Moody’s, in this case) rate a new transaction below invest-ment grade while another (S&P) rates the bonds at the A- level. We are inclined to believe that S&P, while a bit too posi-tive in its assessment, is closer to the mark than its competitors in this instance.
The GWA is a public corporation authorized to manage and maintain the island’s water supply and sewer collection and treatment systems. The Authority services 41,000 separate accounts for water delivery. Resort hotels represent approxi-mately 12% of total water consumption, making them the
CrEdIt brIEfs
“ In the wake of Puerto Rico’s decision to enact its own debt restructuring statute, some market observers have suggested that all US territorial debt now poses a risk to investor portfolios.”
largest customer. The US military provides for its own potable water needs. The Authority also provides sewer collection and treatment service for another 25,000 accounts. The US Air Force is the biggest customer of sewer services, followed by resort hotels. (The Navy provides its own wastewater infrastructure.)
Like the Power Authority, the Guam Water Authority is gov-erned by the Consolidated Commission on Utilities. Rates are effectively set by the Commission and subject to review by a public utilities commission (PUC). Fortunately, the regulatory environment appears supportive of higher rates to comply with environmental mandates. According to Fitch, the PUC has approved cumulative rates increases of over 95% since 2007.7
For many years, the GWA struggled to comply with Environmental Protection Agency (EPA) mandates. The Authority has made substantial progress and appears poised to comply with all current regulatory requirements for the first time in history. The two largest treatment plants are fully compliant with EPA rules for the first time since the enactment of the Clean Water Act in 1972.8 The principal challenge facing the GWA is the size and scope of its capital improvement program (CIP). The federal government will require further upgrades to the system’s treatment systems, resulting in a CIP in excess of USD 400 million. While Moody’s and Fitch rate the GWA bonds below investment grade based on the system’s debt burden and substantial CIP, both agencies maintain a positive outlook. We expect the ratings to rise over time.
Us Virgin IslandsThe United States Virgin Islands (USVI) is an unincorporated territory of the US, located approximately 60 miles east of Puerto Rico. Approximately 105,000 people reside on the three primary islands in the US archipelago. An array of 70 smaller islands and cays surround the three islands of St. Thomas, St. John, and St. Croix. With a combined land area twice the size of the District of Columbia, the USVI is smaller and less populous than Guam. Like Guam, the USVI is subject to the provisions of the Insular Areas Act of 1982. The US Department of Interior performs the function of government controller under the Act and issues periodic audit reports on the territory’s financial condition.1
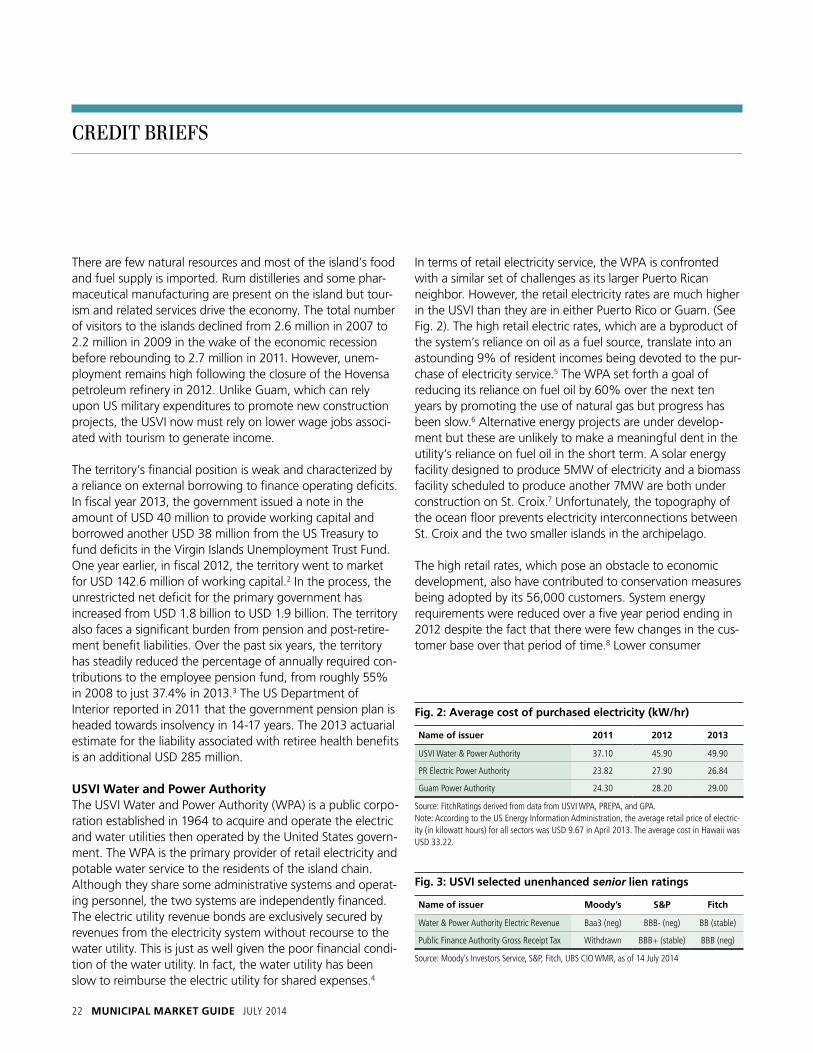
22 MunICIpal MaRket guIde july 2014
There are few natural resources and most of the island’s food and fuel supply is imported. Rum distilleries and some phar-maceutical manufacturing are present on the island but tour-ism and related services drive the economy. The total number of visitors to the islands declined from 2.6 million in 2007 to 2.2 million in 2009 in the wake of the economic recession before rebounding to 2.7 million in 2011. However, unem-ployment remains high following the closure of the Hovensa petroleum refinery in 2012. Unlike Guam, which can rely upon US military expenditures to promote new construction projects, the USVI now must rely on lower wage jobs associ-ated with tourism to generate income.
The territory’s financial position is weak and characterized by a reliance on external borrowing to finance operating deficits. In fiscal year 2013, the government issued a note in the amount of USD 40 million to provide working capital and borrowed another USD 38 million from the US Treasury to fund deficits in the Virgin Islands Unemployment Trust Fund. One year earlier, in fiscal 2012, the territory went to market for USD 142.6 million of working capital.2 In the process, the unrestricted net deficit for the primary government has increased from USD 1.8 billion to USD 1.9 billion. The territory also faces a significant burden from pension and post-retire-ment benefit liabilities. Over the past six years, the territory has steadily reduced the percentage of annually required con-tributions to the employee pension fund, from roughly 55% in 2008 to just 37.4% in 2013.3 The US Department of Interior reported in 2011 that the government pension plan is headed towards insolvency in 14-17 years. The 2013 actuarial estimate for the liability associated with retiree health benefits is an additional USD 285 million.
usVI Water and power authorityThe USVI Water and Power Authority (WPA) is a public corpo-ration established in 1964 to acquire and operate the electric and water utilities then operated by the United States govern-ment. The WPA is the primary provider of retail electricity and potable water service to the residents of the island chain. Although they share some administrative systems and operat-ing personnel, the two systems are independently financed. The electric utility revenue bonds are exclusively secured by revenues from the electricity system without recourse to the water utility. This is just as well given the poor financial condi-tion of the water utility. In fact, the water utility has been slow to reimburse the electric utility for shared expenses.4
In terms of retail electricity service, the WPA is confronted with a similar set of challenges as its larger Puerto Rican neighbor. However, the retail electricity rates are much higher in the USVI than they are in either Puerto Rico or Guam. (See Fig. 2). The high retail electric rates, which are a byproduct of the system’s reliance on oil as a fuel source, translate into an astounding 9% of resident incomes being devoted to the pur-chase of electricity service.5 The WPA set forth a goal of reducing its reliance on fuel oil by 60% over the next ten years by promoting the use of natural gas but progress has been slow.6 Alternative energy projects are under develop-ment but these are unlikely to make a meaningful dent in the utility’s reliance on fuel oil in the short term. A solar energy facility designed to produce 5MW of electricity and a biomass facility scheduled to produce another 7MW are both under construction on St. Croix.7 Unfortunately, the topography of the ocean floor prevents electricity interconnections between St. Croix and the two smaller islands in the archipelago.
The high retail rates, which pose an obstacle to economic development, also have contributed to conservation measures being adopted by its 56,000 customers. System energy requirements were reduced over a five year period ending in 2012 despite the fact that there were few changes in the cus-tomer base over that period of time.8 Lower consumer
CrEdIt brIEfs
fig. 3: usVI selected unenhanced senior lien ratings
name of issuer Moody’s s&p fitch
Water & Power Authority Electric Revenue Baa3 (neg) BBB- (neg) BB (stable)
Public Finance Authority Gross Receipt Tax Withdrawn BBB+ (stable) BBB (neg)
Source: Moody’s Investors Service, S&P, Fitch, uBS CIO WMR, as of 14 july 2014
fig. 2: average cost of purchased electricity (kW/hr)
name of issuer 2011 2012 2013
uSVI Water & Power Authority 37.10 45.90 49.90
PR Electric Power Authority 23.82 27.90 26.84
Guam Power Authority 24.30 28.20 29.00
Source: FitchRatings derived from data from uSVI WPA, PREPA, and GPA.Note: According to the uS Energy Information Administration, the average retail price of electric-ity (in kilowatt hours) for all sectors was uSD 9.67 in April 2013. The average cost in Hawaii was uSD 33.22.
23 MunICIpal MaRket guIde july 2014
demand for electricity has reduced cash flow to the system at precisely the moment when the utility must finance a conver-sion from fuel oil to natural gas as a fuel source.
The net effect of high electricity rates, consumer conserva-tion, and a slow transition to alternative energy sources is the gradual decline in the electric utility’s financial condition. Liquidity is weak at just 11 days of cash on hand and debt ser-vice coverage barely sum sufficient.9 We are inclined to believe that the credit will deteriorate over time and recom-mend that investors steer clear of the Authority’s electric util-ity bonds as a speculative investment destined for further downgrades.
public finance authority gross Receipts tax RevenueThe territory’s Public Finance Authority (PFA) is a public corpo-ration created in 1988 to borrow money and lend the pro-ceeds to other government agencies. Among other obliga-tions, the PFA has issued bonds secured by the collection of a 5% gross receipts tax (GRT) on all individuals and corporate entities doing business on the islands. A general obligation pledge is also provided but investors generally rely upon the specific tax pledge as the stronger security. The bonds are insulated, to at least some degree, by the allocation of pledged revenue to a separate escrow account.10 Senior lien debt service coverage during fiscal year 2013 was 3.57x, according to Fitch. Maximum annual debt service coverage is estimated at approximately 2.67x.
CrEdIt brIEfs
While coverage has been ample thus far, the GRT has been a volatile revenue source. Collections declined by 15% in 2009 in the wake of the US economic recession. And while they have since rebounded, S&P reports discrepancies between the amounts reported in quarterly statements and the totals shown in audited financial statements.11 Moody’s Investors Service cited a lack of current information when it elected to withdraw its ratings on the territory’s gross receipts tax bonds in 12 February 2013. Official Statements are not readily avail-able for recent transactions and the territory has posted dis-closure notices on 27 June with the MSRB affirming that it had not filed audited financial statements in a timely manner. Please refer to Fig. 3 for a summary of credit ratings assigned to these two borrowers.
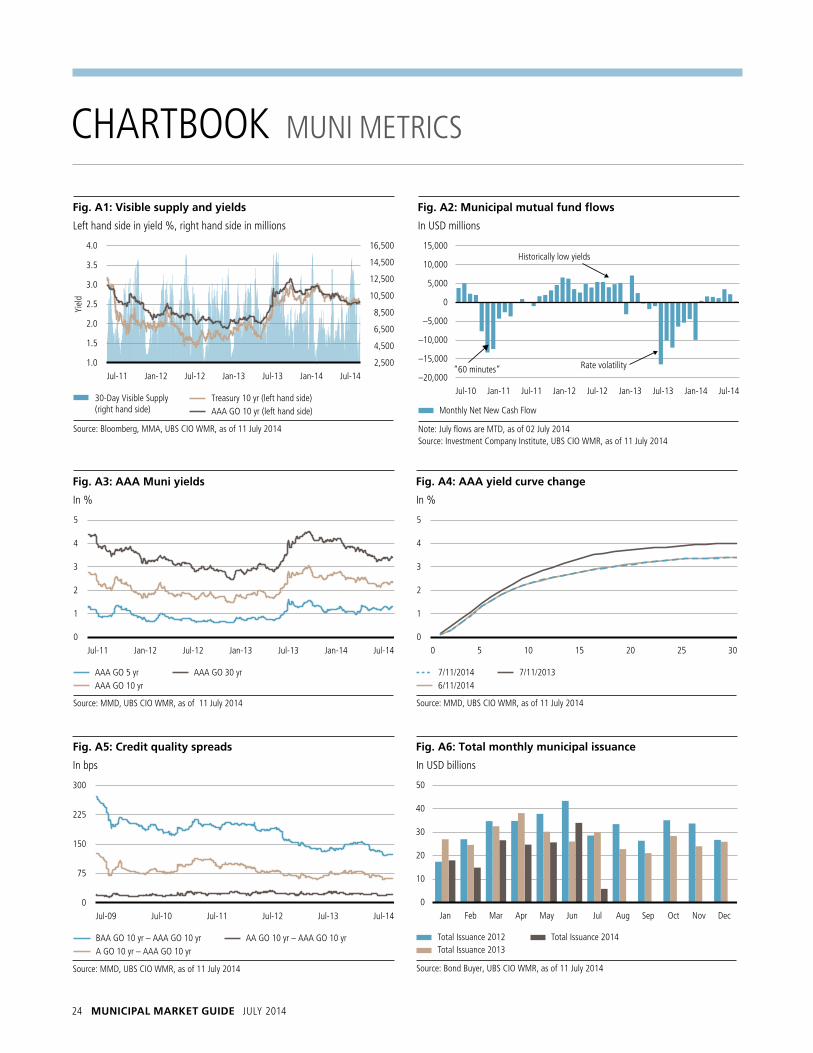
24 MunICIpal MaRket guIde july 2014
CHARTBOOk MuNI METRICS
Source: Bloomberg, MMA, UBS CIO WMR, as of 11 July 2014
30-Day Visible Supply(right hand side)
Treasury 10 yr (le hand side)AAA GO 10 yr (le hand side)
Yiel
d
8,500
6,500
4,500
2,500
3.5
3.0
1.0
2.0
1.5
2.5
4.0
14,500
12,500
10,500
16,500
Jul-11 Jan-12 Jul-12 Jan-13 Jan-14Jul-13 Jul-14
Fig. A1: Visible supply and yields
Le hand side in yield %, right hand side in millions
Source: MMD, UBS CIO WMR, as of 11 July 2014
AAA GO 10 yrAAA GO 5 yr AAA GO 30 yr
4
3
0
1
2
5
Jan-14Jul-13Jan-13Jul-12Jan-12Jul-11 Jul-14
Fig. A3: AAA Muni yields
In %
Fig. A5: Credit quality spreads
Source: MMD, UBS CIO WMR, as of 11 July 2014
In bps
225
150
75
0
300
BAA GO 10 yr – AAA GO 10 yr AA GO 10 yr – AAA GO 10 yrA GO 10 yr – AAA GO 10 yr
Jul-13Jul-12Jul-11Jul-10Jul-09 Jul-14
Note: July flows are MTD, as of 02 July 2014Source: Investment Company Institute, UBS CIO WMR, as of 11 July 2014
10,000
5,000
0
–5,000
–10,000
–15,000
–20,000
15,000
Jan-11Jul-10 Jan-12Jul-11 Jan-14Jul-13Jan-13Jul-12 Jul-14
Fig. A2: Municipal mutual fund flows
In USD millions
Monthly Net New Cash Flow
Historically low yields
“60 minutes” Rate volatility
Source: MMD, UBS CIO WMR, as of 11 July 2014
6/11/20147/11/2014 7/11/2013
3
0
1
2
4
5
0 5 10 15 20 25 30
Fig. A4: AAA yield curve change
In %
Source: Bond Buyer, UBS CIO WMR, as of 11 July 2014
40
30
20
10
0
50
FebJan Apr NovOctSepAugJulJunMay DecMar
Fig. A6: Total monthly municipal issuance
In USD billions
Total Issuance 2012 Total Issuance 2014Total Issuance 2013

25 MunICIpal MaRket guIde july 2014
CHARTBOOk MuNI METRICS
Fig. A7: One-year horizon total return assuming unchanged AAA yield curve
Source: MMD, UBS CIO WMR, as of 11 July 2014
Total return (TR), in %
4.0
3.0
2.0
1.0
0.0
5.0
Favored maturity range AAA GO1 year horizon TR w/ roll down
0 5 10 15 20 25 30
Source: MMD, UBS CIO WMR, as of 11 July 2014
80
60
120
100
160
140
2006200420011998 2009 2011 2014
180
200
AAA GO 30 yr – Treasury 30 yr
19961993199119881986
Fig. A8: Historical events’ impact on muni-to-Treasury (m/T) yield ratio (1986 through present)
m/T ratio, in %
Tax Reform Act
stock market crashOctober 1987
stocks sell-off 1989
Orange County CAbankruptcy
1995–1996 flat tax proposal
Asian crisis
tech bubble
Global recessionSeptember
2001
WorldCom bankruptcy Monoline insurer
Global financial crisis of 2008/2009
Euro debtcrisis
Jefferson County, AL
files for bankruptcy
Threat to tax exemption
Rate Volatility
Current:101.50

26 MunICIpal MaRket guIde july 2014
CHARTBOOk RElATIVE VAluE
Fig. A9: AAA muni-to-Treasury yield ratios
Source: MMD, UBS CIO WMR, as of 11 July 2014
In %
100105110115
9095
8580
125120
10 yr 30 yr
Jul-13 Sep-13 Nov-13 Jan-14 Mar-14 May-14 Jul-14
Fig. A11: 10-year GO spreads for top five state issuers
Source: MMD, UBS CIO WMR, as of 11 July 2014
State spreads, in bps
200
150
100
50
0
250
CA TX ILNY FL
Jul-13Jul-12Jul-11Jul-10Jul-09 Jul-14
Fig. A10: A muni GO versus A Industrial Corp. yield ratio
Source: MMD, Bloomberg, UBS CIO WMR, as of 11 July 2014
In %
105
100
95
90
85
80
110
115
10 year 30 year
Jul-13 Sep-13 Nov-13 Jan-14 Mar-14 May-14 Jul-14
Fig. A12: Industrial Corporate and BABs spreads
Source: BofAML, UBS CIO WMR, as of 11 July 2014
Option adjusted spreads, in bps
200
180
160
140
120
220
U.S Industrial Corp 10+yr OASBABS Build America Bond Index OAS
Apr-14Jan-13Oct-13Jul-13 Jul-14
Source: BofA/ML, UBS CIO WMR, as of 11 July 2014
5
4
3
2
1
0
7
6
8
9
StateTobaccoGOPowerTaxrevenue
Multi-Family
Single-Family
PCRTransportLeasing/rental
RevenueLocal EducationWaterAirportHospital
6.0
Pre-refunded
Fig. 13: Municipal total return by sector YTD 2014
Total return, in %
7.1
5.6 5.5
4.74.4
1.0
5.4 5.3 5.2 5.2 5.1
7.9
6.6 6.6 6.56.4

27 MunICIpal MaRket guIde july 2014
state Moody’sRating
Outlook last Rating/Outlook change³
s&pRating
Outlook last Rating/
Outlook change³
fitchRating
Outlook last Rating/Outlook change³
alabama Aa1 Stable 4/16/2010 AA Stable 8/3/2007 AA+ Stable 5/3/2010
alaska Aaa Stable 11/22/2010 AAA Stable 1/5/2012 AAA Stable 1/7/2013
arizona Aa32 Positive 11/26/2013 AA-2 Stable 12/21/2011
arkansas Aa1 Stable 4/16/2010 AA Stable 1/10/2003
California Aa3 Stable 6/25/2014 A Positive 1/14/2014 A Stable 8/5/2013
Colorado Aa12 Stable 4/16/2010 AA2 Stable 7/10/2007
Connecticut Aa3 Stable 1/20/2012 AA Stable 9/26/2003 AA Negative 7/2/2013
delaware Aaa Stable 4/30/2010 AAA Stable 2/22/2000 AAA Stable 4/13/2006
dist. of Columbia Aa2 Stable 7/31/2013 AA- Stable 3/21/2013 AA- Stable 4/5/2010
florida Aa1 Stable 4/16/2010 AAA Stable 7/12/2011 AAA Stable 8/23/2013
georgia Aaa Stable 4/16/2010 AAA Stable 7/29/1997 AAA Stable 4/13/2006
hawaii Aa2 Stable 5/17/2011 AA Positive 10/9/2013 AA Stable 6/15/2011
Idaho Aa12 Stable 4/16/2010 AA+2 Stable 3/29/2011 AA1 Stable 4/5/2010
Illinois A3 Negative 6/6/2013 A- Developing 12/10/2013 A- Negative 6/3/2013
Indiana Aaa2 Stable 4/16/2010 AAA2 Stable 7/18/2008 AA+1 Stable 4/5/2010
Iowa Aaa2 Stable 4/16/2010 AAA2 Stable 9/11/2008 AAA Stable 4/5/2010
kansas Aa22 Stable 4/30/2014 AA+2 Stable 5/20/2005
kentucky Aa22 Stable 6/2/2014 AA-2 Negative 1/31/2013 A+1 Stable 11/8/2012
louisiana Aa2 Stable 4/16/2010 AA Stable 5/4/2011 AA Stable 4/5/2010
Maine Aa2 Stable 6/4/2014 AA Stable 5/24/2012 AA Stable 1/22/2013
Maryland Aaa Stable 7/19/2013 AAA Stable 5/7/1992 AAA Stable 4/13/2006
Massachusetts Aa1 Stable 4/16/2010 AA+ Stable 9/16/2011 AA+ Stable 4/5/2010
Michigan Aa2 Positive 3/28/2013 AA- Stable 6/17/2014 AA Stable 4/2/2013
Minnesota Aa1 Stable 7/30/2013 AA+ Stable 9/29/2011 AA+ Stable 7/7/2011
Mississippi Aa2 Stable 4/16/2010 AA Stable 11/30/2005 AA+ Stable 4/5/2010
Missouri Aaa Stable 7/19/2013 AAA Stable 2/16/1994 AAA Stable 4/13/2006
Montana Aa1 Stable 4/16/2010 AA Stable 5/5/2008 AA+ Stable 4/5/2010
nebraska Aa21 Stable 4/16/2010 AAA2 Stable 5/5/2011
Current state ratings and rating outlooks4
STATE RATINGS
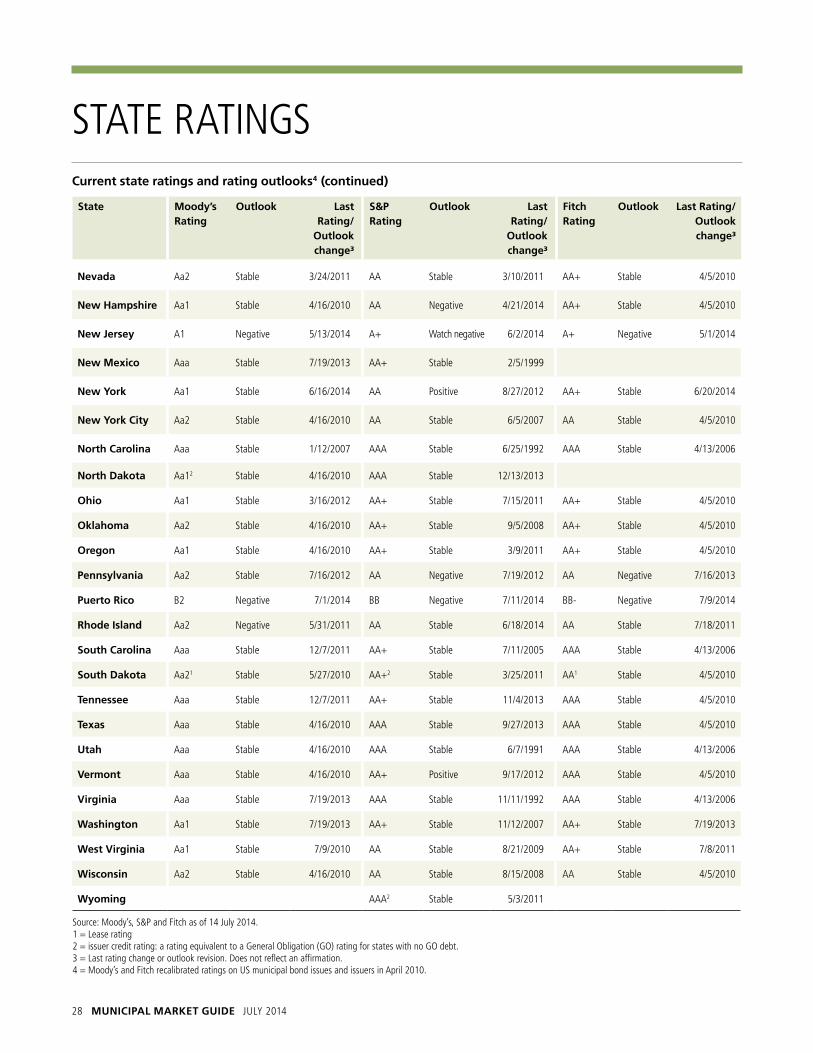
28 MunICIpal MaRket guIde july 2014
nevada Aa2 Stable 3/24/2011 AA Stable 3/10/2011 AA+ Stable 4/5/2010
new hampshire Aa1 Stable 4/16/2010 AA Negative 4/21/2014 AA+ Stable 4/5/2010
new Jersey A1 Negative 5/13/2014 A+ Watch negative 6/2/2014 A+ Negative 5/1/2014
new Mexico Aaa Stable 7/19/2013 AA+ Stable 2/5/1999
new York Aa1 Stable 6/16/2014 AA Positive 8/27/2012 AA+ Stable 6/20/2014
new York City Aa2 Stable 4/16/2010 AA Stable 6/5/2007 AA Stable 4/5/2010
north Carolina Aaa Stable 1/12/2007 AAA Stable 6/25/1992 AAA Stable 4/13/2006
north dakota Aa12 Stable 4/16/2010 AAA Stable 12/13/2013
Ohio Aa1 Stable 3/16/2012 AA+ Stable 7/15/2011 AA+ Stable 4/5/2010
Oklahoma Aa2 Stable 4/16/2010 AA+ Stable 9/5/2008 AA+ Stable 4/5/2010
Oregon Aa1 Stable 4/16/2010 AA+ Stable 3/9/2011 AA+ Stable 4/5/2010
pennsylvania Aa2 Stable 7/16/2012 AA Negative 7/19/2012 AA Negative 7/16/2013
puerto Rico B2 Negative 7/1/2014 BB Negative 7/11/2014 BB- Negative 7/9/2014
Rhode Island Aa2 Negative 5/31/2011 AA Stable 6/18/2014 AA Stable 7/18/2011
south Carolina Aaa Stable 12/7/2011 AA+ Stable 7/11/2005 AAA Stable 4/13/2006
south dakota Aa21 Stable 5/27/2010 AA+2 Stable 3/25/2011 AA1 Stable 4/5/2010
tennessee Aaa Stable 12/7/2011 AA+ Stable 11/4/2013 AAA Stable 4/5/2010
texas Aaa Stable 4/16/2010 AAA Stable 9/27/2013 AAA Stable 4/5/2010
utah Aaa Stable 4/16/2010 AAA Stable 6/7/1991 AAA Stable 4/13/2006
Vermont Aaa Stable 4/16/2010 AA+ Positive 9/17/2012 AAA Stable 4/5/2010
Virginia Aaa Stable 7/19/2013 AAA Stable 11/11/1992 AAA Stable 4/13/2006
Washington Aa1 Stable 7/19/2013 AA+ Stable 11/12/2007 AA+ Stable 7/19/2013
West Virginia Aa1 Stable 7/9/2010 AA Stable 8/21/2009 AA+ Stable 7/8/2011
Wisconsin Aa2 Stable 4/16/2010 AA Stable 8/15/2008 AA Stable 4/5/2010
Wyoming AAA2 Stable 5/3/2011
Source: Moody’s, S&P and Fitch as of 14 july 2014. 1 = lease rating 2 = issuer credit rating: a rating equivalent to a General Obligation (GO) rating for states with no GO debt. 3 = Last rating change or outlook revision. Does not reflect an affirmation.4 = Moody’s and Fitch recalibrated ratings on uS municipal bond issues and issuers in April 2010.
Current state ratings and rating outlooks4 (continued)
state Moody’sRating
Outlook last Rating/
Outlook change³
s&pRating
Outlook last Rating/
Outlook change³
fitchRating
Outlook last Rating/Outlook change³
STATE RATINGS

29 MunICIpal MaRket guIde july 2014
spotlight
1 Docket No. 115811, Roger Kanerva et al., Appellants, v. Malcolm Weems et al., Appellees.
2 Ibid. 3 See Duncan v. Retired Public Employees of Alaska and Everson v. State
of Hawai’i, along with In re Lippman 4 Article V, section 7 5 The Institute for Illinois’ Fiscal Sustainability at the Civic Federation,
“State of Illinois FY2015 Recommended Operating Budget: Analysis and Recommendations,” 13 May 2014.
6 The Chicago Tribune, “Supreme Court ruling signals trouble for state, Chicago,” 3 July 2014.
7 Ibid. 8 Individual income tax rates are slated to decline from 5% to 3.75%
and corporate income tax rates from 7% to 5.25% on 1 January 2015.
9 The Institute for Illinois’ Fiscal Sustainability at the Civic Federation, “State of Illinois FY2015 Recommended Operating Budget: Analysis and Recommendations,” 13 May 2014
10 State of Illinois, Press Release, “Governor Quinn announces state’s backlog of bills falls to $3.9 billion,” 14 July 2014.
11 Moody’s, “Illinois Supreme Court casts doubt on recent state and local pension reform efforts, a credit negative,” included in US Public Finance Weekly Credit Outlook, 10 July 2014.
12 Moody’s, “Illinois Court’s Decision on pension Reforms is No Surprise,” 16 May 2014.
13 Moody’s, “Illinois Tax-Rate Extension, Pension Reforms Would Reduce Fiscal Stress,” 18 April 2014.
14 S&P, “Illinois: General Obligation,” 22 April 2014. 15 FitchRatings, “Fitch rates $750MM Illinois GO bonds ‘A-’, Outlook
remains negative,” 17 April 2014.
Credit briefs
Guam: where America’s day begins
1 President Obama was quoted as saying that “we’re working to close the Futenma facility and relocate to a new facility, consolidate our presence in Okinawa into fewer locations and move many of our forces to Guam and Hawaii.” In a joint statement President Obama and Japanese Prime Minister Abe reaffirmed their interest in a “politically sustainable force posture in the Asia Pacific, including the development of Guam as a strategic hub.” See Shirley Kan, Guam: US Defense Deployments, Congressional Research Service, 9 June 2014, page 7. The original estimate of Marines scheduled to be relocated was approximately 9,000. According to a recent report by S&P, that number has since been reduced to approximately 4,700 active duty personnel plus family members and support staff.
2 Final Official Statement, A.B. Won Pat International Airport Authority, General Revenue Bonds, Series A, B, and C, dated 28 August 2013.
3 Final Official Statement, Guam Power Authority Revenue Bonds, Series 2012A, 4 October 2012.
4 Standard & Poor’s, Guam Power Authority, 8 August 2013. 5 Ibid. 6 Moody’s Investors Service, “Moody’s maintains Baa3 on Guam Power
Authority’s senior lien bonds,” 7 November 2013. 7 FitchRatings,”Fitch rates Guam Waterworks Authority Revs BB Outlook
Positive,” 11 July 2014. 8 Ibid.
Endnotes
US Virgin Islands
1 Final Official Statement, Virgin Islands Water and Power Authority, 25 April 2012.
2 Basic Financial Statements and OMB Circular A-133 Report on Federal Financial Assistance, Year Ended 30 September 2013, dated 30 June 2014.
3 Ibid, p 153. 4 Final Official Statement, Virgin Islands Water and Power Authority, 25
April 2012. According to disclosure in the Official Statement, the water utility owed approximately USD 16 million to the electric utility. The balance is expected to be repaid over the next three years.
5 According to Fitch Ratings, approximately 2% of US resident income is typically devoted to the purchase of electricity service. The US Department of Energy estimates that consumers spent 2.7% of their household income on home energy bills last year. See US Bureau of Labor Statistics, Consumer Expenditure Survey, 2012.
6 Fitch Ratings, “US Virgin Islands Water and Power Authority,” 6 May 2014. According to Fitch, there are conversions underway to allow existing facilities to burn liquefied petroleum gas (i.e. propane). The use of LNG is likely to take significantly longer.
7 Ibid. 8 Ibid. 9 Fitch Ratings, “US Virgin Islands Water and Power Authority,” 6 May
201410 Official statements for recent transactions have not been transmit-
ted to the MSRB. Both Fitch and S&P independently confirm that the deposits are made after a nominal USD 250,000 deposit to a fund for the development of moderate income housing development. See also Fitch Ratings, US Virgin Islands Gross Receipts Tax Bonds, 13 June 2014.
11 Standard & Poor’s Rating Services, Virgin Islands Public Finance Authority 10 June 2014.
Municipal bonds: Although historical default rates are very low, all munici-pal bonds carry credit risk, with the degree of risk largely following the particular bond’s sector. Additionally, all municipal bonds feature valu-ation, return, and liquidity risk. Valuation tends to follow internal and external factors, including the level of interest rates, bond ratings, supply factors, and media reporting. These can be difficult or impossible to proj-ect accurately. Also, most municipal bonds are callable and/or subject to earlier than expected redemption, which can reduce an investor’s total return. Because of the large number of municipal issuers and credit struc-tures, not all bonds can be easily or quickly sold on the open market.
statement of risk
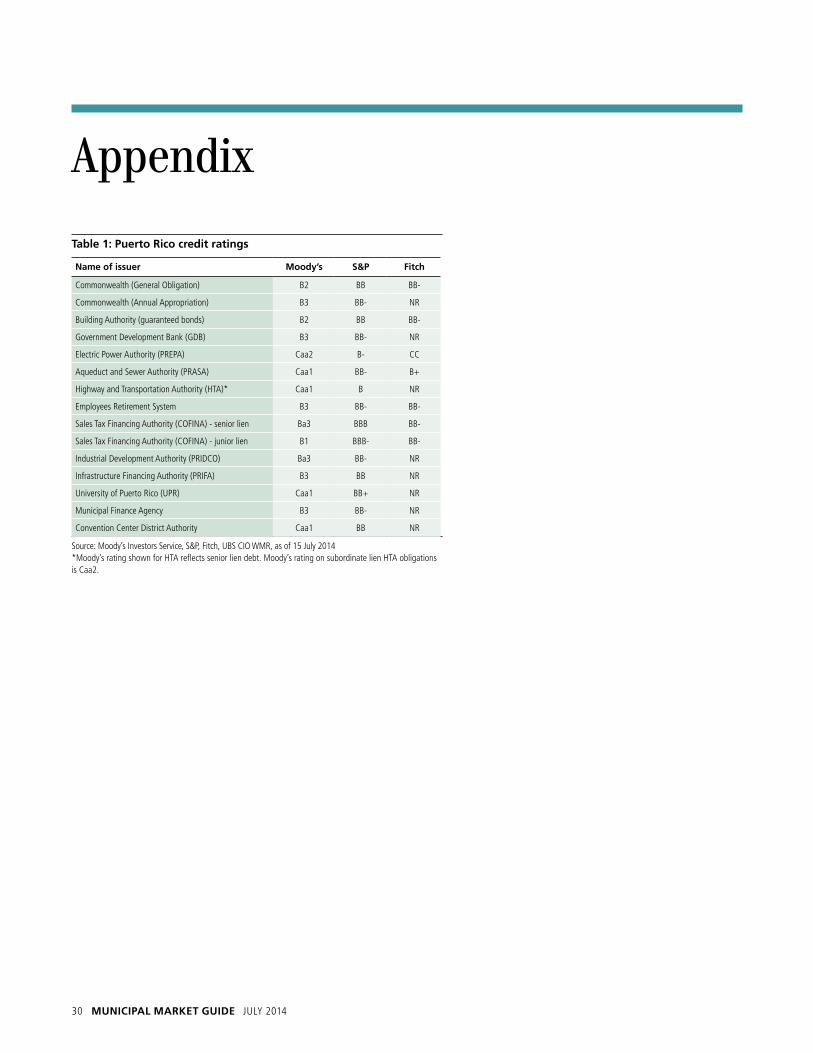
30 MunICIpal MaRket guIde july 2014
Appendix
table 1: puerto Rico credit ratings
name of issuer Moody’s s&p fitch
Commonwealth (General Obligation) B2 BB BB-
Commonwealth (Annual Appropriation) B3 BB- NR
Building Authority (guaranteed bonds) B2 BB BB-
Government Development Bank (GDB) B3 BB- NR
Electric Power Authority (PREPA) Caa2 B- CC
Aqueduct and Sewer Authority (PRASA) Caa1 BB- B+
Highway and Transportation Authority (HTA)* Caa1 B NR
Employees Retirement System B3 BB- BB-
Sales Tax Financing Authority (COFINA) - senior lien Ba3 BBB BB-
Sales Tax Financing Authority (COFINA) - junior lien B1 BBB- BB-
Industrial Development Authority (PRIDCO) Ba3 BB- NR
Infrastructure Financing Authority (PRIFA) B3 BB NR
university of Puerto Rico (uPR) Caa1 BB+ NR
Municipal Finance Agency B3 BB- NR
Convention Center District Authority Caa1 BB NR
Source: Moody’s Investors Service, S&P, Fitch, uBS CIO WMR, as of 15 july 2014*Moody’s rating shown for HTA reflects senior lien debt. Moody’s rating on subordinate lien HTA obligations is Caa2.
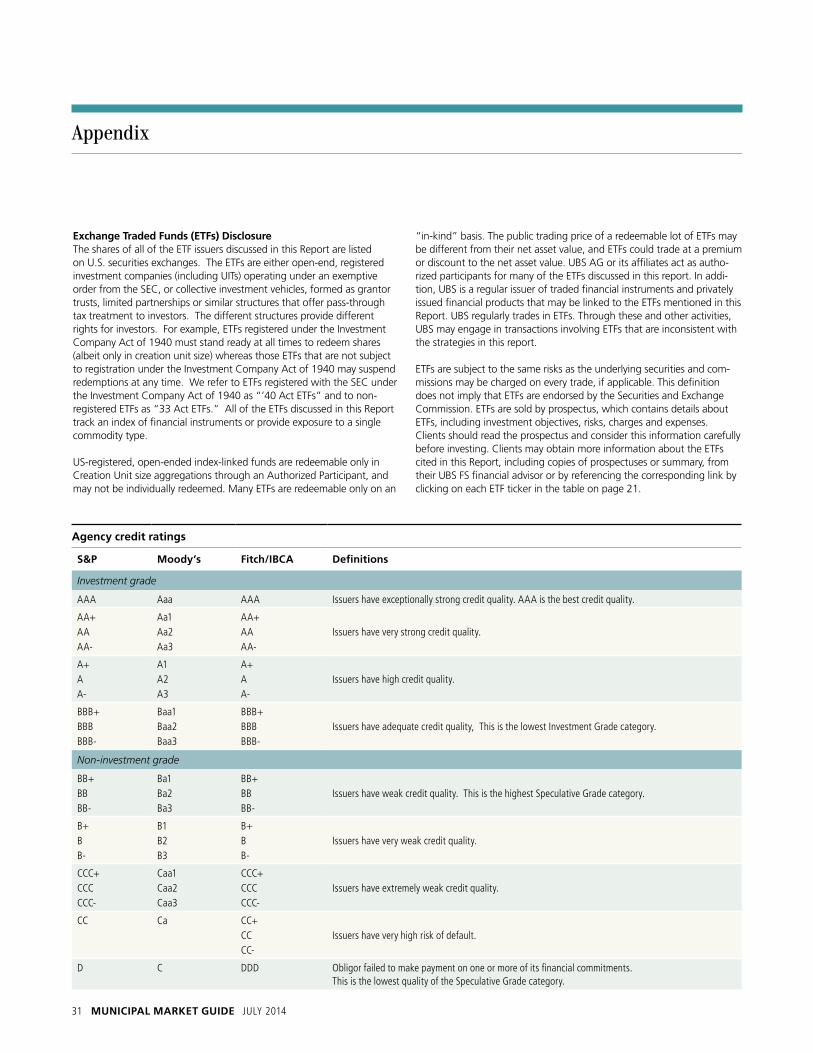
31 MunICIpal MaRket guIde july 2014
agency credit ratings
s&p Moody’s fitch/IbCa Definitions
Investment grade
AAA Aaa AAA Issuers have exceptionally strong credit quality. AAA is the best credit quality.
AA+ Aa1 AA+AA Aa2 AA Issuers have very strong credit quality.AA- Aa3 AA-
A+ A1 A+A A2 A Issuers have high credit quality.A- A3 A-
BBB+ Baa1 BBB+BBB Baa2 BBB Issuers have adequate credit quality, This is the lowest Investment Grade category.BBB- Baa3 BBB-
Non-investment grade
BB+ Ba1 BB+BB Ba2 BB Issuers have weak credit quality. This is the highest Speculative Grade category.BB- Ba3 BB-
B+ B1 B+B B2 B Issuers have very weak credit quality.B- B3 B-
CCC+ Caa1 CCC+CCC Caa2 CCC Issuers have extremely weak credit quality.CCC- Caa3 CCC-
CC Ca CC+CC Issuers have very high risk of default.CC-
D C DDD Obligor failed to make payment on one or more of its financial commitments. This is the lowest quality of the Speculative Grade category.
Appendix
exchange traded funds (etfs) disclosureThe shares of all of the ETF issuers discussed in this Report are listed on U.S. securities exchanges. The ETFs are either open-end, registered investment companies (including UITs) operating under an exemptive order from the SEC, or collective investment vehicles, formed as grantor trusts, limited partnerships or similar structures that offer pass-through tax treatment to investors. The different structures provide different rights for investors. For example, ETFs registered under the Investment Company Act of 1940 must stand ready at all times to redeem shares (albeit only in creation unit size) whereas those ETFs that are not subject to registration under the Investment Company Act of 1940 may suspend redemptions at any time. We refer to ETFs registered with the SEC under the Investment Company Act of 1940 as “’40 Act ETFs” and to non-registered ETFs as “33 Act ETFs.” All of the ETFs discussed in this Report track an index of financial instruments or provide exposure to a single commodity type.
US-registered, open-ended index-linked funds are redeemable only in Creation Unit size aggregations through an Authorized Participant, and may not be individually redeemed. Many ETFs are redeemable only on an
“in-kind” basis. The public trading price of a redeemable lot of ETFs may be different from their net asset value, and ETFs could trade at a premium or discount to the net asset value. UBS AG or its affiliates act as autho-rized participants for many of the ETFs discussed in this report. In addi-tion, UBS is a regular issuer of traded financial instruments and privately issued financial products that may be linked to the ETFs mentioned in this Report. UBS regularly trades in ETFs. Through these and other activities, UBS may engage in transactions involving ETFs that are inconsistent with the strategies in this report.
ETFs are subject to the same risks as the underlying securities and com-missions may be charged on every trade, if applicable. This definition does not imply that ETFs are endorsed by the Securities and Exchange Commission. ETFs are sold by prospectus, which contains details about ETFs, including investment objectives, risks, charges and expenses. Clients should read the prospectus and consider this information carefully before investing. Clients may obtain more information about the ETFs cited in this Report, including copies of prospectuses or summary, from their UBS FS financial advisor or by referencing the corresponding link by clicking on each ETF ticker in the table on page 21.

32 MunICIpal MaRket guIde july 2014
Chief Investment Office (CIO) Wealth Management (WM) Research is published by UBS Wealth Management and UBS Wealth Management Americas, Business Divisions of UBS AG (UBS) or an affiliate thereof. CIO WM Research reports published outside the US are branded as Chief Investment Office WM. In certain countries UBS AG is referred to as UBS SA. This publication is for your information only and is not intended as an offer, or a solicitation of an offer, to buy or sell any investment or other specific product. The analysis contained herein does not constitute a personal recommendation or take into account the particular investment objectives, investment strategies, financial situation and needs of any specific recipient. It is based on numerous assumptions. Different assump-tions could result in materially different results. We recommend that you obtain financial and/or tax advice as to the implications (including tax) of investing in the manner described or in any of the products mentioned herein. Certain services and products are subject to legal restrictions and cannot be offered worldwide on an unrestricted basis and/or may not be eligible for sale to all investors. All information and opinions expressed in this document were obtained from sources believed to be reliable and in good faith, but no representation or warranty, express or implied, is made as to its accuracy or completeness (other than disclosures relating to UBS and its affiliates). All information and opinions as well as any prices indi-cated are current only as of the date of this report, and are subject to change without notice. Opinions expressed herein may differ or be con-trary to those expressed by other business areas or divisions of UBS as a result of using different assumptions and/or criteria. At any time, invest-ment decisions (including whether to buy, sell or hold securities) made by UBS AG, its affiliates, subsidiaries and employees may differ from or be contrary to the opinions expressed in UBS research publications. Some investments may not be readily realizable since the market in the securi-ties is illiquid and therefore valuing the investment and identifying the risk to which you are exposed may be difficult to quantify. UBS relies on
information barriers to control the flow of information contained in one or more areas within UBS, into other areas, units, divisions or affiliates of UBS. Futures and options trading is considered risky. Past performance of an investment is no guarantee for its future performance. Some invest-ments may be subject to sudden and large falls in value and on realiza-tion you may receive back less than you invested or may be required to pay more. Changes in FX rates may have an adverse effect on the price, value or income of an investment. This report is for distribution only under such circumstances as may be permitted by applicable law.
Distributed to US persons by UBS Financial Services Inc., a subsidiary of UBS AG. UBS Securities LLC is a subsidiary of UBS AG and an affiliate of UBS Financial Services Inc. UBS Financial Services Inc. accepts respon-sibility for the content of a report prepared by a non-US affiliate when it distributes reports to US persons. All transactions by a US person in the securities mentioned in this report should be effected through a US-registered broker dealer affiliated with UBS, and not through a non-US affiliate. The contents of this report have not been and will not be approved by any securities or investment authority in the United States or elsewhere.
UBS specifically prohibits the redistribution or reproduction of this mate-rial in whole or in part without the prior written permission of UBS and UBS accepts no liability whatsoever for the actions of third parties in this respect.
Version as per May 2014.
© UBS 2014. The key symbol and UBS are among the registered and unregistered trademarks of UBS. All rights reserved.
disclaimer