asymmetric cancer cell division regulated by akt - pnas.org · asymmetric cancer cell division...
TRANSCRIPT
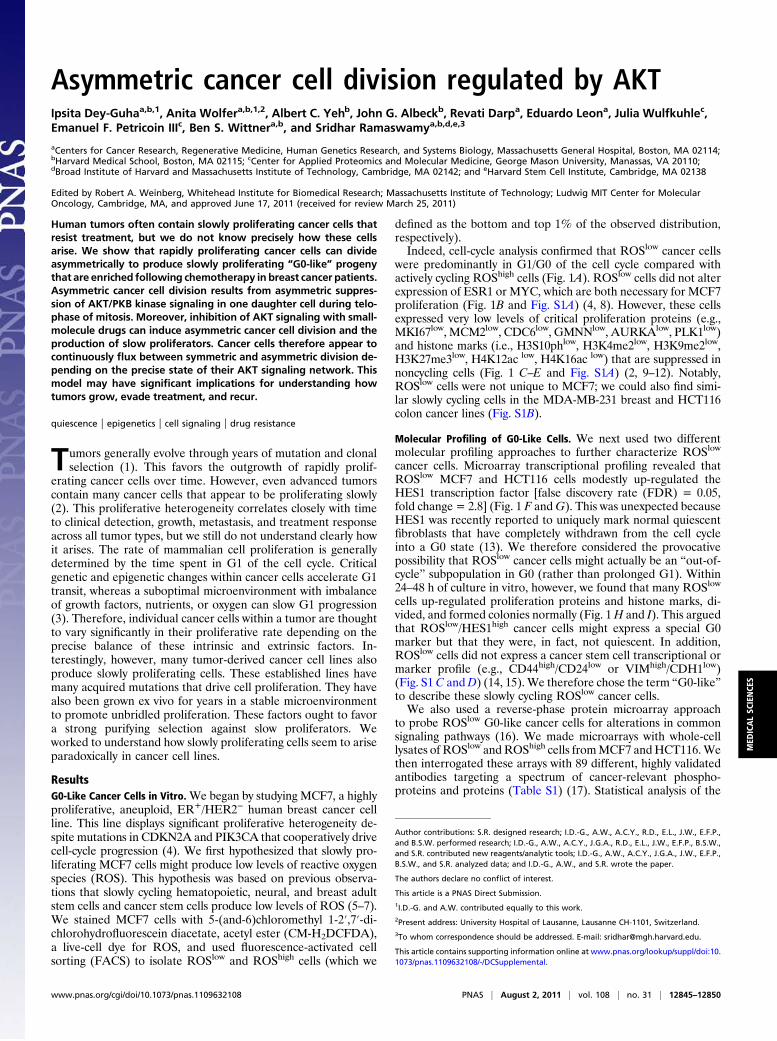
Asymmetric cancer cell division regulated by AKTIpsita Dey-Guhaa,b,1, Anita Wolfera,b,1,2, Albert C. Yehb, John G. Albeckb, Revati Darpa, Eduardo Leona, Julia Wulfkuhlec,Emanuel F. Petricoin IIIc, Ben S. Wittnera,b, and Sridhar Ramaswamya,b,d,e,3
aCenters for Cancer Research, Regenerative Medicine, Human Genetics Research, and Systems Biology, Massachusetts General Hospital, Boston, MA 02114;bHarvard Medical School, Boston, MA 02115; cCenter for Applied Proteomics and Molecular Medicine, George Mason University, Manassas, VA 20110;dBroad Institute of Harvard and Massachusetts Institute of Technology, Cambridge, MA 02142; and eHarvard Stem Cell Institute, Cambridge, MA 02138
Edited by Robert A. Weinberg, Whitehead Institute for Biomedical Research; Massachusetts Institute of Technology; Ludwig MIT Center for MolecularOncology, Cambridge, MA, and approved June 17, 2011 (received for review March 25, 2011)
Human tumors often contain slowly proliferating cancer cells thatresist treatment, but we do not know precisely how these cellsarise. We show that rapidly proliferating cancer cells can divideasymmetrically to produce slowly proliferating “G0-like” progenythat are enriched following chemotherapy in breast cancer patients.Asymmetric cancer cell division results from asymmetric suppres-sion of AKT/PKB kinase signaling in one daughter cell during telo-phase of mitosis. Moreover, inhibition of AKT signaling with small-molecule drugs can induce asymmetric cancer cell division and theproduction of slow proliferators. Cancer cells therefore appear tocontinuously flux between symmetric and asymmetric division de-pending on the precise state of their AKT signaling network. Thismodel may have significant implications for understanding howtumors grow, evade treatment, and recur.
quiescence | epigenetics | cell signaling | drug resistance
Tumors generally evolve through years of mutation and clonalselection (1). This favors the outgrowth of rapidly prolif-
erating cancer cells over time. However, even advanced tumorscontain many cancer cells that appear to be proliferating slowly(2). This proliferative heterogeneity correlates closely with timeto clinical detection, growth, metastasis, and treatment responseacross all tumor types, but we still do not understand clearly howit arises. The rate of mammalian cell proliferation is generallydetermined by the time spent in G1 of the cell cycle. Criticalgenetic and epigenetic changes within cancer cells accelerate G1transit, whereas a suboptimal microenvironment with imbalanceof growth factors, nutrients, or oxygen can slow G1 progression(3). Therefore, individual cancer cells within a tumor are thoughtto vary significantly in their proliferative rate depending on theprecise balance of these intrinsic and extrinsic factors. In-terestingly, however, many tumor-derived cancer cell lines alsoproduce slowly proliferating cells. These established lines havemany acquired mutations that drive cell proliferation. They havealso been grown ex vivo for years in a stable microenvironmentto promote unbridled proliferation. These factors ought to favora strong purifying selection against slow proliferators. Weworked to understand how slowly proliferating cells seem to ariseparadoxically in cancer cell lines.
ResultsG0-Like Cancer Cells in Vitro. We began by studying MCF7, a highlyproliferative, aneuploid, ER+/HER2− human breast cancer cellline. This line displays significant proliferative heterogeneity de-spite mutations in CDKN2A and PIK3CA that cooperatively drivecell-cycle progression (4). We first hypothesized that slowly pro-liferating MCF7 cells might produce low levels of reactive oxygenspecies (ROS). This hypothesis was based on previous observa-tions that slowly cycling hematopoietic, neural, and breast adultstem cells and cancer stem cells produce low levels of ROS (5–7).We stained MCF7 cells with 5-(and-6)chloromethyl 1-2′,7′-di-chlorohydrofluorescein diacetate, acetyl ester (CM-H2DCFDA),a live-cell dye for ROS, and used fluorescence-activated cellsorting (FACS) to isolate ROSlow and ROShigh cells (which we
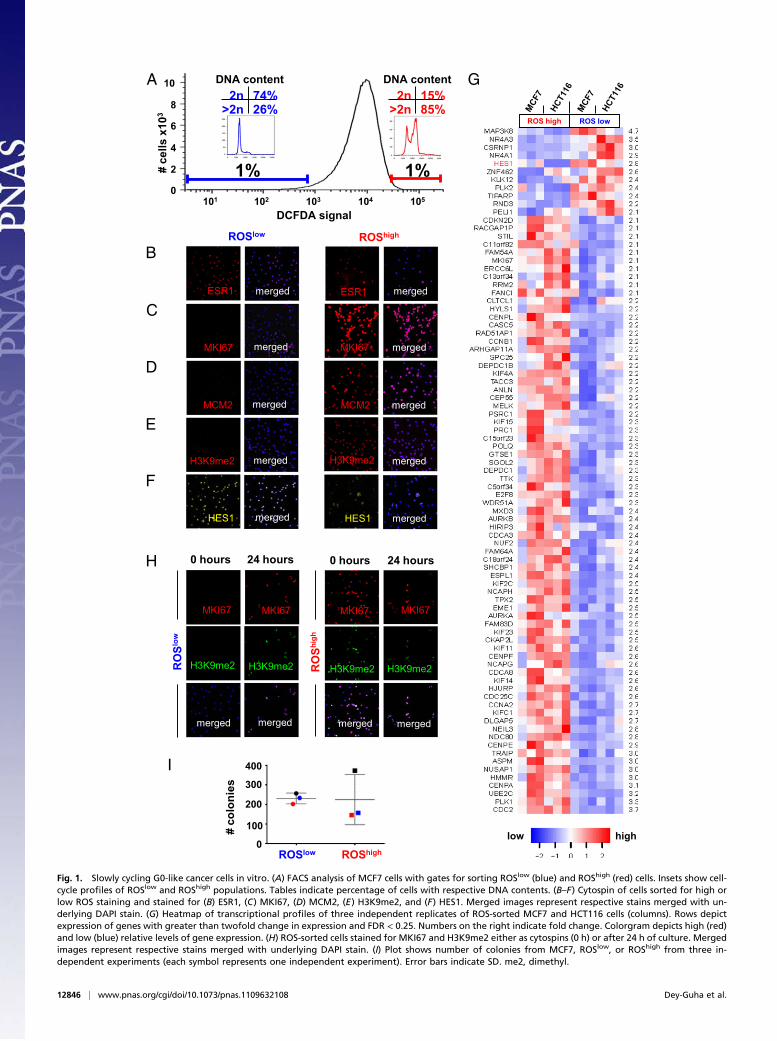
defined as the bottom and top 1% of the observed distribution,respectively).Indeed, cell-cycle analysis confirmed that ROSlow cancer cells
were predominantly in G1/G0 of the cell cycle compared withactively cycling ROShigh cells (Fig. 1A). ROSlow cells did not alterexpression of ESR1 or MYC, which are both necessary for MCF7proliferation (Fig. 1B and Fig. S1A) (4, 8). However, these cellsexpressed very low levels of critical proliferation proteins (e.g.,MKI67low, MCM2low, CDC6low, GMNNlow, AURKAlow, PLK1low)and histone marks (i.e., H3S10phlow, H3K4me2low, H3K9me2low,H3K27me3low, H4K12ac low, H4K16ac low) that are suppressed innoncycling cells (Fig. 1 C–E and Fig. S1A) (2, 9–12). Notably,ROSlow cells were not unique to MCF7; we could also find simi-lar slowly cycling cells in the MDA-MB-231 breast and HCT116colon cancer lines (Fig. S1B).
Molecular Profiling of G0-Like Cells. We next used two differentmolecular profiling approaches to further characterize ROSlow
cancer cells. Microarray transcriptional profiling revealed thatROSlow MCF7 and HCT116 cells modestly up-regulated theHES1 transcription factor [false discovery rate (FDR) = 0.05,fold change = 2.8] (Fig. 1 F andG). This was unexpected becauseHES1 was recently reported to uniquely mark normal quiescentfibroblasts that have completely withdrawn from the cell cycleinto a G0 state (13). We therefore considered the provocativepossibility that ROSlow cancer cells might actually be an “out-of-cycle” subpopulation in G0 (rather than prolonged G1). Within24–48 h of culture in vitro, however, we found that many ROSlow
cells up-regulated proliferation proteins and histone marks, di-vided, and formed colonies normally (Fig. 1H and I). This arguedthat ROSlow/HES1high cancer cells might express a special G0marker but that they were, in fact, not quiescent. In addition,ROSlow cells did not express a cancer stem cell transcriptional ormarker profile (e.g., CD44high/CD24low or VIMhigh/CDH1low)(Fig. S1C andD) (14, 15).We therefore chose the term “G0-like”to describe these slowly cycling ROSlow cancer cells.We also used a reverse-phase protein microarray approach
to probe ROSlow G0-like cancer cells for alterations in commonsignaling pathways (16). We made microarrays with whole-celllysates of ROSlow andROShigh cells fromMCF7 andHCT116.Wethen interrogated these arrays with 89 different, highly validatedantibodies targeting a spectrum of cancer-relevant phospho-proteins and proteins (Table S1) (17). Statistical analysis of the
Author contributions: S.R. designed research; I.D.-G., A.W., A.C.Y., R.D., E.L., J.W., E.F.P.,and B.S.W. performed research; I.D.-G., A.W., A.C.Y., J.G.A., R.D., E.L., J.W., E.F.P., B.S.W.,and S.R. contributed new reagents/analytic tools; I.D.-G., A.W., A.C.Y., J.G.A., J.W., E.F.P.,B.S.W., and S.R. analyzed data; and I.D.-G., A.W., and S.R. wrote the paper.
The authors declare no conflict of interest.
This article is a PNAS Direct Submission.1I.D.-G. and A.W. contributed equally to this work.2Present address: University Hospital of Lausanne, Lausanne CH-1101, Switzerland.3To whom correspondence should be addressed. E-mail: [email protected].
This article contains supporting information online at www.pnas.org/lookup/suppl/doi:10.1073/pnas.1109632108/-/DCSupplemental.
www.pnas.org/cgi/doi/10.1073/pnas.1109632108 PNAS | August 2, 2011 | vol. 108 | no. 31 | 12845–12850
MED
ICALSC
IENCE
S
101 102 103 104 105
2
4
6
8
10
0
2n>2n
74%26%
# ce
lls x
103
DCFDA signal
2n>2n
15%85%
1% 1%
DNA content DNA contentA
MCM2 merged
B
merged mergedMKI67MKI67
ROShighROSlow
H3K9me2 mergedmergedH3K9me2
D
MCM2 merged
C
ROS high ROS low
G
24 hours0 hours
MKI67
merged
H3K9me2
MKI67
merged
H3K9me2
MKI67
merged
H3K9me2
MKI67
merged
H3K9me2
24 hours0 hours
I
H
merged mergedESR1ESR1
E
F
0
200
300
400
ROSlow
# co
loni
es
ROShigh
100low high
HES1HES1 merged merged
RO
Shigh
RO
Slow
Fig. 1. Slowly cycling G0-like cancer cells in vitro. (A) FACS analysis of MCF7 cells with gates for sorting ROSlow (blue) and ROShigh (red) cells. Insets show cell-cycle profiles of ROSlow and ROShigh populations. Tables indicate percentage of cells with respective DNA contents. (B–F) Cytospin of cells sorted for high orlow ROS staining and stained for (B) ESR1, (C) MKI67, (D) MCM2, (E) H3K9me2, and (F) HES1. Merged images represent respective stains merged with un-derlying DAPI stain. (G) Heatmap of transcriptional profiles of three independent replicates of ROS-sorted MCF7 and HCT116 cells (columns). Rows depictexpression of genes with greater than twofold change in expression and FDR < 0.25. Numbers on the right indicate fold change. Colorgram depicts high (red)and low (blue) relative levels of gene expression. (H) ROS-sorted cells stained for MKI67 and H3K9me2 either as cytospins (0 h) or after 24 h of culture. Mergedimages represent respective stains merged with underlying DAPI stain. (I) Plot shows number of colonies from MCF7, ROSlow, or ROShigh from three in-dependent experiments (each symbol represents one independent experiment). Error bars indicate SD. me2, dimethyl.
12846 | www.pnas.org/cgi/doi/10.1073/pnas.1109632108 Dey-Guha et al.

resulting dataset identified 9 up- and 14 down-regulated proteinmarkers in ROSlow compared with ROShigh cells (FDR < 0.25)(Fig. 2A). Interestingly, these differentially expressed proteinsincluded important members of the AKT/PKB signaling pathwaythat suggested a down-regulation of AKT signaling in slowly cy-cling ROSlow cells (i.e., pS6RP, p70S6K, pFOXO1, pGSK3αβ,PRAS40) (18). Consistent with this inference, we found thatROSlow cells had low levels of both phospho-AKT (pAKT-T308and pAKT-S473) and its downstream target phospho-S6RP(pS6RP-S235/236 and pS6RP-S240/244) (Fig. 2B and Fig. S1E).Furthermore, ROSlow cells also expressed low levels of total AKTprotein itself (Fig. 2 C and D).
G0-Like Cancer Cells Arise Through Asymmetric Division. AKT sig-naling plays a major role in promoting cell-cycle progression (18).We therefore wondered whether slowly cycling AKTlow G0-likecancer cells arise by suppressing AKT protein levels. To test thishypothesis, we overexpressed a cDNA for an AKT1-mCherryfusion protein in MCF7 cells to ask whether this would inhibit theformation of G0-like cancer cells. However, forced AKT over-expression did not appreciably change the frequency of thesecells. Instead, G0-like cancer cells with low endogenous AKTlevels also suppressed expression of exogenous AKT1-mCherryprotein in both MCF7 and HCT116 cells (Fig. S2 A and B).In addition, we noted that actively dividing MCF7 cells occa-
sionally showed striking asymmetric expression of both the exog-enous AKT1-mCherry and endogenous AKT protein, in contrastto most dividing cells, which appeared symmetric (Fig. 3 A–C).This asymmetric expression occurred exclusively in telophase(after formation of the nuclear membrane but before cytokinesis)in the thousands of dividing cancer cells that we examined. Inasymmetric mitosis, one daughter was in a proliferative stance(e.g., H3K9me2high/HES1low) with diffuse AKT expression in boththe nucleus and cytoplasm (Fig. 3 B andD). Its sibling was in a G0-like posture (e.g., H3K9me2low/HES1high) with perinuclear HES1expression andmore intense nuclear localization of AKT (Fig. 3 Band D). Importantly, G0-like cells in telophase that were AKT-nuclearhigh appeared to suppress AKT protein expression to be-come AKTlow after cell division (Fig. 3E). G0-like daughters ininterphase also had higher levels of nuclear-localized FOXO1, adirect target of AKT signaling that localizes to the nucleus withloss of AKT signaling and can strongly suppress cell-cycle pro-gression (Fig. 3F) (18). We did not observe any consistent dif-ferences in the size or general appearance of G0-like daughters.G0-like cancer cells therefore appeared to arise through occa-sional, asymmetric loss of AKT signaling (with nuclear localiza-tion and then suppression of AKT protein), resulting in the birthof a slowly cycling cancer cell.
ROS high ROS low
A
B
mergedmergedpAKT
(Ser473)pAKT
(Ser473)
mergedmergedpAKT
(Thr308)pAKT
(Thr308)
C
pS6RP(235/236) merged
pS6RP(235/236) merged
pS6RP(240/244) merged
pS6RP(240/244) merged
ROShigh
ROSlow
D
GAPDH
pan-AKT
low high
mergedpanAKTmergedpanAKT
Fig. 2. Molecular profiling of G0-like cells. (A) Heatmap of proteomic pro-files of two independent replicates of ROS-sorted MCF7 and HCT116 cells(columns). Rows represent proteins with significant change in expression(FDR < 0.25). Numbers on the right indicate FDR. Colorgram depicts high(yellow) and low (blue) relative levels of proteins. (B and C) Cytospins of ROS-sorted cells stained for (B) pAKT (Ser473), pAKT (Thr308), pS6RP (235/236),and pS6RP (240/244) and (C) pan-AKT. (D) Western blot for pan-AKT on bulkand ROS-sorted MCF7 cells. p, phosphorylated.
A
BmergedDAPI AKTchTUBB H3K9me2
DAPI H3K9me2 pan-AKT mergedTUBB
F
DAPI H3K9me2TUBB HES1 merged
DAPI H3K9me2 pan-AKT mergedTUBB
D
E
C
DAPI H3K9me2 pan-AKT mergedTUBB
DAPI H3K9me2 FOXO1 mergedHES1
Fig. 3. G0-like cancer cells arise through asymmetric division. (A–D) MCF7cells in telophase stained for DAPI, β-tubulin (TUBB), (A) AKT1-mCherry cells,asymmetric, (B) pan-AKT, asymmetric, (C) pan-AKT, symmetric, and (D) HES1,asymmetric. (E and F) MCF7 cells in interphase stained for (E) DAPI, β-tubulin,H3K9me2, and pan-AKT and (F) DAPI, HES1, H3K9me2, and FOXO1.
Dey-Guha et al. PNAS | August 2, 2011 | vol. 108 | no. 31 | 12847
MED
ICALSC
IENCE
S
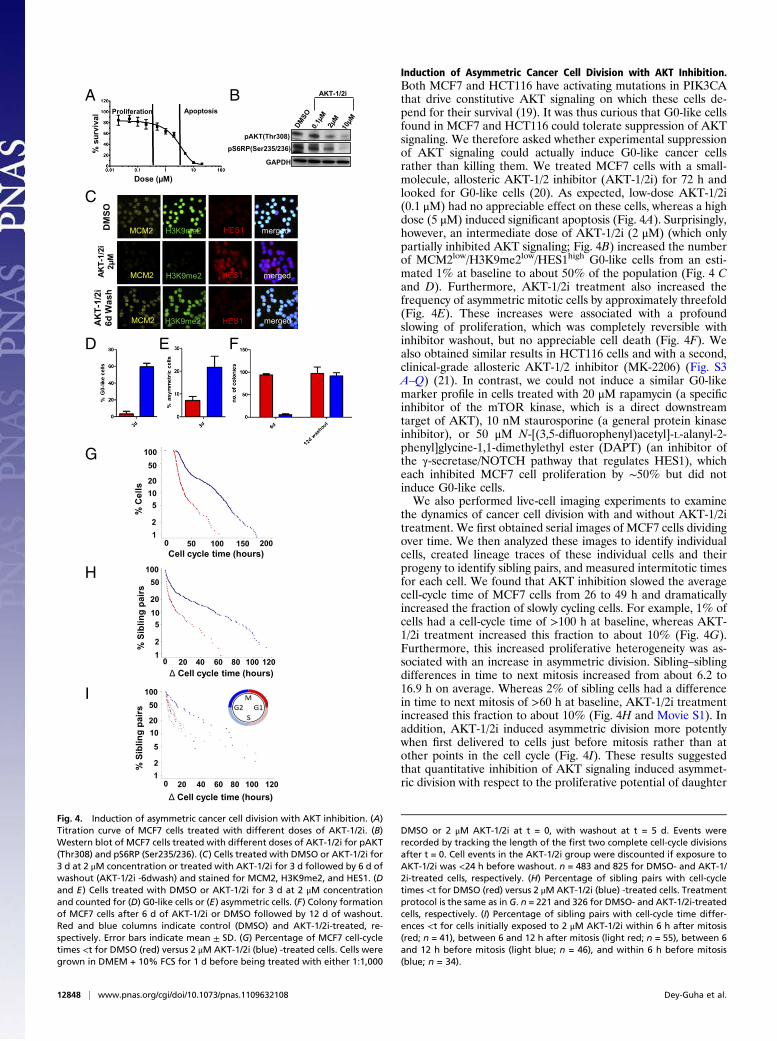
Induction of Asymmetric Cancer Cell Division with AKT Inhibition.Both MCF7 and HCT116 have activating mutations in PIK3CAthat drive constitutive AKT signaling on which these cells de-pend for their survival (19). It was thus curious that G0-like cellsfound in MCF7 and HCT116 could tolerate suppression of AKTsignaling. We therefore asked whether experimental suppressionof AKT signaling could actually induce G0-like cancer cellsrather than killing them. We treated MCF7 cells with a small-molecule, allosteric AKT-1/2 inhibitor (AKT-1/2i) for 72 h andlooked for G0-like cells (20). As expected, low-dose AKT-1/2i(0.1 μM) had no appreciable effect on these cells, whereas a highdose (5 μM) induced significant apoptosis (Fig. 4A). Surprisingly,however, an intermediate dose of AKT-1/2i (2 μM) (which onlypartially inhibited AKT signaling; Fig. 4B) increased the numberof MCM2low/H3K9me2low/HES1high G0-like cells from an esti-mated 1% at baseline to about 50% of the population (Fig. 4 Cand D). Furthermore, AKT-1/2i treatment also increased thefrequency of asymmetric mitotic cells by approximately threefold(Fig. 4E). These increases were associated with a profoundslowing of proliferation, which was completely reversible withinhibitor washout, but no appreciable cell death (Fig. 4F). Wealso obtained similar results in HCT116 cells and with a second,clinical-grade allosteric AKT-1/2 inhibitor (MK-2206) (Fig. S3A–Q) (21). In contrast, we could not induce a similar G0-likemarker profile in cells treated with 20 μM rapamycin (a specificinhibitor of the mTOR kinase, which is a direct downstreamtarget of AKT), 10 nM staurosporine (a general protein kinaseinhibitor), or 50 μM N-[(3,5-difluorophenyl)acetyl]-L-alanyl-2-phenyl]glycine-1,1-dimethylethyl ester (DAPT) (an inhibitor ofthe γ-secretase/NOTCH pathway that regulates HES1), whicheach inhibited MCF7 cell proliferation by ∼50% but did notinduce G0-like cells.We also performed live-cell imaging experiments to examine
the dynamics of cancer cell division with and without AKT-1/2itreatment. We first obtained serial images of MCF7 cells dividingover time. We then analyzed these images to identify individualcells, created lineage traces of these individual cells and theirprogeny to identify sibling pairs, and measured intermitotic timesfor each cell. We found that AKT inhibition slowed the averagecell-cycle time of MCF7 cells from 26 to 49 h and dramaticallyincreased the fraction of slowly cycling cells. For example, 1% ofcells had a cell-cycle time of >100 h at baseline, whereas AKT-1/2i treatment increased this fraction to about 10% (Fig. 4G).Furthermore, this increased proliferative heterogeneity was as-sociated with an increase in asymmetric division. Sibling–siblingdifferences in time to next mitosis increased from about 6.2 to16.9 h on average. Whereas 2% of sibling cells had a differencein time to next mitosis of >60 h at baseline, AKT-1/2i treatmentincreased this fraction to about 10% (Fig. 4H and Movie S1). Inaddition, AKT-1/2i induced asymmetric division more potentlywhen first delivered to cells just before mitosis rather than atother points in the cell cycle (Fig. 4I). These results suggestedthat quantitative inhibition of AKT signaling induced asymmet-ric division with respect to the proliferative potential of daughter
A B
GAPDH
pAKT(Thr308)
pS6RP(Ser235/236)
AKT-1/2i
DM
SO
AK
T-1
/2i
2µ
M
AK
T-1
/2i
6d
Wa
sh
mergedHES1H3K9me2MCM2
mergedHES1H3K9me2MCM2
mergedHES1H3K9me2MCM2
0 50 100 150
2
5
10
20
50
1
% C
ell
s
100
Cell cycle time (hours)
� Cell cycle time (hours)
� Cell cycle time (hours)
0 20 40 60
% S
ibli
ng
pa
irs
2
5
10
20
50
1
100
C
D F
G
E
H
% s
urv
ival
Dose (µM)
ApoptosisProliferation
80 100
I
200
120
0 20 40 60
% S
ibli
ng
pa
irs
2
5
10
20
50
1
100
80 100 120
Fig. 4. Induction of asymmetric cancer cell division with AKT inhibition. (A)Titration curve of MCF7 cells treated with different doses of AKT-1/2i. (B)Western blot of MCF7 cells treated with different doses of AKT-1/2i for pAKT(Thr308) and pS6RP (Ser235/236). (C) Cells treated with DMSO or AKT-1/2i for3 d at 2 μM concentration or treated with AKT-1/2i for 3 d followed by 6 d ofwashout (AKT-1/2i -6dwash) and stained for MCM2, H3K9me2, and HES1. (Dand E) Cells treated with DMSO or AKT-1/2i for 3 d at 2 μM concentrationand counted for (D) G0-like cells or (E) asymmetric cells. (F) Colony formationof MCF7 cells after 6 d of AKT-1/2i or DMSO followed by 12 d of washout.Red and blue columns indicate control (DMSO) and AKT-1/2i-treated, re-spectively. Error bars indicate mean ± SD. (G) Percentage of MCF7 cell-cycletimes <t for DMSO (red) versus 2 μM AKT-1/2i (blue) -treated cells. Cells weregrown in DMEM + 10% FCS for 1 d before being treated with either 1:1,000
DMSO or 2 μM AKT-1/2i at t = 0, with washout at t = 5 d. Events wererecorded by tracking the length of the first two complete cell-cycle divisionsafter t = 0. Cell events in the AKT-1/2i group were discounted if exposure toAKT-1/2i was <24 h before washout. n = 483 and 825 for DMSO- and AKT-1/2i-treated cells, respectively. (H) Percentage of sibling pairs with cell-cycletimes <t for DMSO (red) versus 2 μMAKT-1/2i (blue) -treated cells. Treatmentprotocol is the same as in G. n = 221 and 326 for DMSO- and AKT-1/2i-treatedcells, respectively. (I) Percentage of sibling pairs with cell-cycle time differ-ences <t for cells initially exposed to 2 μM AKT-1/2i within 6 h after mitosis(red; n = 41), between 6 and 12 h after mitosis (light red; n = 55), between 6and 12 h before mitosis (light blue; n = 46), and within 6 h before mitosis(blue; n = 34).
12848 | www.pnas.org/cgi/doi/10.1073/pnas.1109632108 Dey-Guha et al.
cells, and that the precise timing of AKT signaling loss in mitosiswas important for this effect.
G0-Like Cells Are Enriched After Cytotoxic Treatment in Vivo. Ourfindings demonstrated that rare, slowly cycling G0-like cells werepresent in established human cancer cell lines. Moreover, theseG0-like cells appeared to down-regulate AKT protein and sig-naling. We therefore asked whether we could find similar AKTlow
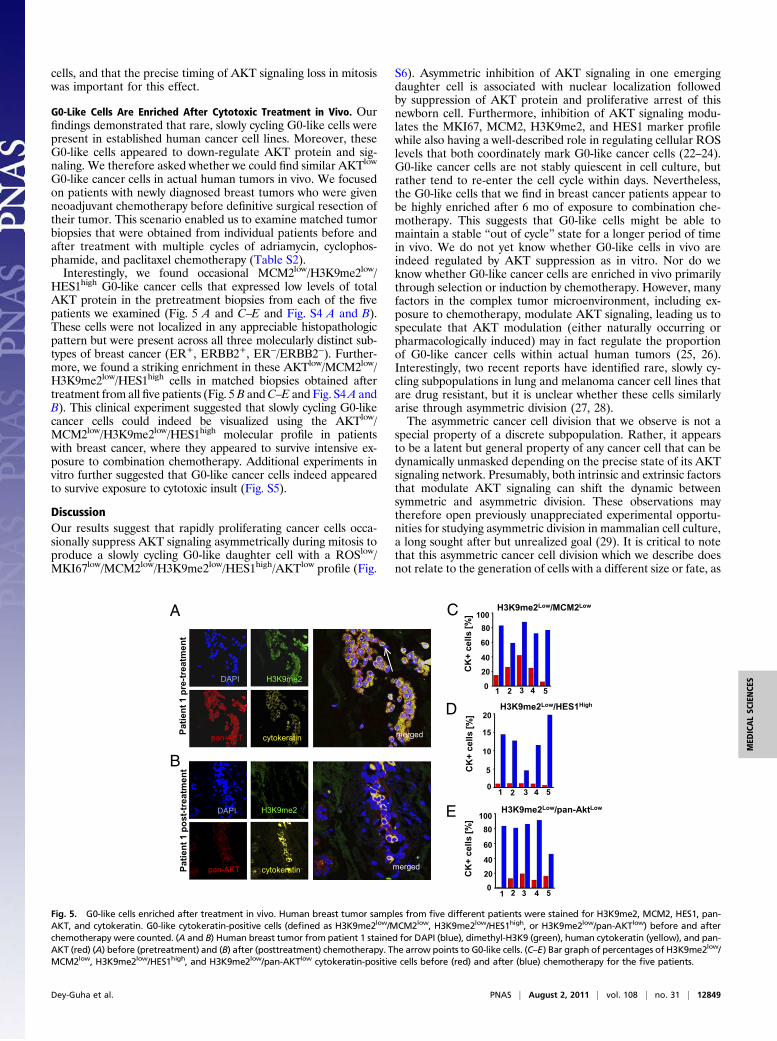
G0-like cancer cells in actual human tumors in vivo. We focusedon patients with newly diagnosed breast tumors who were givenneoadjuvant chemotherapy before definitive surgical resection oftheir tumor. This scenario enabled us to examine matched tumorbiopsies that were obtained from individual patients before andafter treatment with multiple cycles of adriamycin, cyclophos-phamide, and paclitaxel chemotherapy (Table S2).Interestingly, we found occasional MCM2low/H3K9me2low/
HES1high G0-like cancer cells that expressed low levels of totalAKT protein in the pretreatment biopsies from each of the fivepatients we examined (Fig. 5 A and C–E and Fig. S4 A and B).These cells were not localized in any appreciable histopathologicpattern but were present across all three molecularly distinct sub-types of breast cancer (ER+, ERBB2+, ER−/ERBB2−). Further-more, we found a striking enrichment in these AKTlow/MCM2low/H3K9me2low/HES1high cells in matched biopsies obtained aftertreatment from all five patients (Fig. 5B andC–E and Fig. S4A andB). This clinical experiment suggested that slowly cycling G0-likecancer cells could indeed be visualized using the AKTlow/MCM2low/H3K9me2low/HES1high molecular profile in patientswith breast cancer, where they appeared to survive intensive ex-posure to combination chemotherapy. Additional experiments invitro further suggested that G0-like cancer cells indeed appearedto survive exposure to cytotoxic insult (Fig. S5).
DiscussionOur results suggest that rapidly proliferating cancer cells occa-sionally suppress AKT signaling asymmetrically during mitosis toproduce a slowly cycling G0-like daughter cell with a ROSlow/MKI67low/MCM2low/H3K9me2low/HES1high/AKTlow profile (Fig.
S6). Asymmetric inhibition of AKT signaling in one emergingdaughter cell is associated with nuclear localization followedby suppression of AKT protein and proliferative arrest of thisnewborn cell. Furthermore, inhibition of AKT signaling modu-lates the MKI67, MCM2, H3K9me2, and HES1 marker profilewhile also having a well-described role in regulating cellular ROSlevels that both coordinately mark G0-like cancer cells (22–24).G0-like cancer cells are not stably quiescent in cell culture, butrather tend to re-enter the cell cycle within days. Nevertheless,the G0-like cells that we find in breast cancer patients appear tobe highly enriched after 6 mo of exposure to combination che-motherapy. This suggests that G0-like cells might be able tomaintain a stable “out of cycle” state for a longer period of timein vivo. We do not yet know whether G0-like cells in vivo areindeed regulated by AKT suppression as in vitro. Nor do weknow whether G0-like cancer cells are enriched in vivo primarilythrough selection or induction by chemotherapy. However, manyfactors in the complex tumor microenvironment, including ex-posure to chemotherapy, modulate AKT signaling, leading us tospeculate that AKT modulation (either naturally occurring orpharmacologically induced) may in fact regulate the proportionof G0-like cancer cells within actual human tumors (25, 26).Interestingly, two recent reports have identified rare, slowly cy-cling subpopulations in lung and melanoma cancer cell lines thatare drug resistant, but it is unclear whether these cells similarlyarise through asymmetric division (27, 28).The asymmetric cancer cell division that we observe is not a
special property of a discrete subpopulation. Rather, it appearsto be a latent but general property of any cancer cell that can bedynamically unmasked depending on the precise state of its AKTsignaling network. Presumably, both intrinsic and extrinsic factorsthat modulate AKT signaling can shift the dynamic betweensymmetric and asymmetric division. These observations maytherefore open previously unappreciated experimental opportu-nities for studying asymmetric division in mammalian cell culture,a long sought after but unrealized goal (29). It is critical to notethat this asymmetric cancer cell division which we describe doesnot relate to the generation of cells with a different size or fate, as
CK
+ c
ell
s [
%]
0
20
40
60
80
100CA
0
Pa
tie
nt
1 p
re-t
rea
tme
nt
Pa
tie
nt
1 p
os
t-tr
ea
tme
nt
DAPI
pan-AKT
H3K9me2
cytokeratin merged
H3K9me2DAPI
pan-AKT cytokeratin merged
B
D
E
5
10
15
20H3K9me2Low/HES1High
51 2 3 4
51 2 3 4
H3K9me2Low/MCM2Low
051 2 3 4
20
40
60
80
100H3K9me2Low/pan-AktLow
CK
+ c
ell
s [
%]
CK
+ c
ell
s [
%]
Fig. 5. G0-like cells enriched after treatment in vivo. Human breast tumor samples from five different patients were stained for H3K9me2, MCM2, HES1, pan-AKT, and cytokeratin. G0-like cytokeratin-positive cells (defined as H3K9me2low/MCM2low, H3K9me2low/HES1high, or H3K9me2low/pan-AKTlow) before and afterchemotherapy were counted. (A and B) Human breast tumor from patient 1 stained for DAPI (blue), dimethyl-H3K9 (green), human cytokeratin (yellow), and pan-AKT (red) (A) before (pretreatment) and (B) after (posttreatment) chemotherapy. The arrow points to G0-like cells. (C–E) Bar graph of percentages of H3K9me2low/MCM2low, H3K9me2low/HES1high, and H3K9me2low/pan-AKTlow cytokeratin-positive cells before (red) and after (blue) chemotherapy for the five patients.
Dey-Guha et al. PNAS | August 2, 2011 | vol. 108 | no. 31 | 12849
MED
ICALSC
IENCE
S
classically found in normal stem cells (30, 31). Rather, it relates todifferences in proliferative potential between siblings arising fromthe same cell division event. It is intriguing to speculate, however,that we might be observing a modified “stem-like” behavior ofmolecularly deranged cancer cells. In this view, cancer cells divideasymmetrically like normal stem cells, but the G0-like progenythat this type of cell division produces are unable to differentiate,do not die, and therefore eventually reenter the cell cycle. Recentfindings suggest that adult epithelial stem cells appear to suppressAKT signaling as they switch from actively cycling to quiescentmodes, which may be consistent with this model (32, 33).Finally, these findings may have important clinical implica-
tions. Many cancer drugs target AKT signaling either directly orindirectly (34, 35). Suboptimal dose, schedule, or delivery of thesedrugs in patients may therefore result in partial suppression ofAKT signaling, thus promoting asymmetric division, proliferativeheterogeneity, and drug resistance rather than apoptosis asintended. In addition, this model of cancer cell behavior has thepower to explain many clinical phenomena that relate to asyn-chronous tumor growth, disease recurrence, and treatment re-sponse and are not easily understood with current paradigms.
Materials and MethodsMCF7-BOS breast cancer cells were a gift from Dr. Toshi Shioda (MGH CancerCenter, Boston,MA). MDA-MB-231 breast and HCT116 colon cancer cells were
purchased from the American Type Culture Collection (ATCC). Cell culture,clonogenic assays, and drug treatment were performed using establishedprotocols. All experiments were performed using standard cell culture con-ditions. Fluorescence activated cell sorting (FACS) (on BD FACSCalibur, LSRII,FACSAria, and FACSAria II cell sorters), immunofluorescence imaging (ona Nikon Eclipse Ti A1R-A1 confocal microscope), and live cell imaging (on theNikon Biostation CT platform) were performed using established methodsand standard protocols. Transcriptional profiling was performed using theAffymetrix IVT express kit and Human Genome U133 Plus 2.0 microarrays(Affymetrix). Reverse-phase protein microarray profiling and Western blot-ting were performed using antibodies listed in Table 1. Full details can befound in SI Materials and Methods.
ACKNOWLEDGMENTS. We thank Nick Dyson, Daniel Haber, Raul Mostoslavsky,Shobha Vasudevan, and key anonymous reviewers for valuable advice,criticism, and discussion. We thank Dennis Sgroi for expert pathology advice.We thank Kat Folz-Donahue, Supriya Gupta, Laura Prickett-Rice, andElizabeth Richardson for expert technical advice and assistance. The humanstudies described were performed under a Partners Human ResearchCommittee Institutional Review Board-approved protocol (2009-P-002302).This work was supported by the Massachusetts General Hospital CancerCenter, the National Cancer Institute (K08 CA100339, P50 CA89393, P50CA127003), Department of Defense (W81XH-06-2-0033), Howard HughesMedical Institute (Physician-Scientist Early Career Award), Sidney KimmelFoundation (Translational Science Award), Smith Family Foundation (NewInvestigator Award), Swiss National Science Foundation (postdoctoral award;to A.W.), the Emma Muschamp Foundation (postdoctoral award; to A.W.),and a Howard Hughes Medical Institute Medical Student Research TrainingFellowship (to A.C.Y.).
1. Nowell PC (1976) The clonal evolution of tumor cell populations. Science 194:23–28.2. Loddo M, et al. (2009) Cell-cycle-phase progression analysis identifies unique phe-
notypes of major prognostic and predictive significance in breast cancer. Br J Cancer100:959–970.
3. Massagué J (2004) G1 cell-cycle control and cancer. Nature 432:298–306.4. Coser KR, et al. (2009) Antiestrogen-resistant subclones of MCF-7 human breast cancer
cells are derived from a common monoclonal drug-resistant progenitor. Proc NatlAcad Sci USA 106:14536–14541.
5. Diehn M, et al. (2009) Association of reactive oxygen species levels and radioresistancein cancer stem cells. Nature 458:780–783.
6. Ito K, et al. (2004) Regulation of oxidative stress by ATM is required for self-renewalof haematopoietic stem cells. Nature 431:997–1002.
7. Smith J, Ladi E, Mayer-Proschel M, Noble M (2000) Redox state is a central modulatorof the balance between self-renewal and differentiation in a dividing glial precursorcell. Proc Natl Acad Sci USA 97:10032–10037.
8. Wolfer A, et al. (2010) MYC regulation of a “poor-prognosis” metastatic cancer cellstate. Proc Natl Acad Sci USA 107:3698–3703.
9. Baxter J, et al. (2004) Histone hypomethylation is an indicator of epigenetic plasticityin quiescent lymphocytes. EMBO J 23:4462–4472.
10. Kouzarides T (2007) Chromatin modifications and their function. Cell 128:693–705.11. Smith AE, et al. (2009) Epigenetics of human T cells during the G0→G1 transition.
Genome Res 19:1325–1337.12. Barski A, et al. (2009) Chromatin poises miRNA- and protein-coding genes for ex-
pression. Genome Res 19:1742–1751.13. Coller HA, Sang L, Roberts JM (2006) A new description of cellular quiescence. PLoS
Biol 4:e83.14. Al-Hajj M, Wicha MS, Benito-Hernandez A, Morrison SJ, Clarke MF (2003) Prospective
identification of tumorigenic breast cancer cells. Proc Natl Acad Sci USA 100:3983–3988.
15. Mani SA, et al. (2008) The epithelial-mesenchymal transition generates cells withproperties of stem cells. Cell 133:704–715.
16. Paweletz CP, et al. (2001) Reverse phase protein microarrays which capture diseaseprogression show activation of pro-survival pathways at the cancer invasion front.Oncogene 20:1981–1989.
17. Zhou J, et al. (2007) Activation of the PTEN/mTOR/STAT3 pathway in breast cancerstem-like cells is required for viability and maintenance. Proc Natl Acad Sci USA 104:16158–16163.
18. Manning BD, Cantley LC (2007) AKT/PKB signaling: Navigating downstream. Cell 129:1261–1274.
19. She QB, et al. (2008) Breast tumor cells with PI3K mutation or HER2 amplification are
selectively addicted to Akt signaling. PLoS One 3:e3065.20. Bilodeau MT, et al. (2008) Allosteric inhibitors of Akt1 and Akt2: A naphthyridinone
with efficacy in an A2780 tumor xenograft model. Bioorg Med Chem Lett 18:
3178–3182.21. Hirai H, et al. (2010) MK-2206, an allosteric Akt inhibitor, enhances antitumor efficacy
by standard chemotherapeutic agents or molecular targeted drugs in vitro and
in vivo. Mol Cancer Ther 9:1956–1967.22. Winograd-Katz SE, Levitzki A (2006) Cisplatin induces PKB/Akt activation and p38
(MAPK) phosphorylation of the EGF receptor. Oncogene 25:7381–7390.23. Tothova Z, et al. (2007) FoxOs are critical mediators of hematopoietic stem cell re-
sistance to physiologic oxidative stress. Cell 128:325–339.24. Nogueira V, et al. (2008) Akt determines replicative senescence and oxidative or
oncogenic premature senescence and sensitizes cells to oxidative apoptosis. Cancer
Cell 14:458–470.25. Choi J, et al. (2009) Mst1-FoxO signaling protects naïve T lymphocytes from cellular
oxidative stress in mice. PLoS One 4:e8011.26. Mabuchi S, et al. (2002) Inhibition of phosphorylation of BAD and Raf-1 by Akt sen-
sitizes human ovarian cancer cells to paclitaxel. J Biol Chem 277:33490–33500.27. Roesch A, et al. (2010) A temporarily distinct subpopulation of slow-cycling melanoma
cells is required for continuous tumor growth. Cell 141:583–594.28. Sharma SV, et al. (2010) A chromatin-mediated reversible drug-tolerant state in
cancer cell subpopulations. Cell 141:69–80.29. Knoblich JA (2010) Asymmetric cell division: Recent developments and their im-
plications for tumour biology. Nat Rev Mol Cell Biol 11:849–860.30. Morrison SJ, Kimble J (2006) Asymmetric and symmetric stem-cell divisions in de-
velopment and cancer. Nature 441:1068–1074.31. Neumüller RA, Knoblich JA (2009) Dividing cellular asymmetry: Asymmetric cell di-
vision and its implications for stem cells and cancer. Genes Dev 23:2675–2699.32. Li L, Clevers H (2010) Coexistence of quiescent and active adult stem cells in mammals.
Science 327:542–545.33. Zhang J, et al. (2006) Bone morphogenetic protein signaling inhibits hair follicle
anagen induction by restricting epithelial stem/progenitor cell activation and ex-
pansion. Stem Cells 24:2826–2839.34. Sawyers CL (2006) Will kinase inhibitors have a dark side? N Engl J Med 355:313–315.35. Sebolt-Leopold JS, English JM (2006) Mechanisms of drug inhibition of signalling
molecules. Nature 441:457–462.
12850 | www.pnas.org/cgi/doi/10.1073/pnas.1109632108 Dey-Guha et al.