asylum mfp-3d afm sop january 2017 - louisville.edu · asylum mfp-3d afm sop january 2017 ... find...
TRANSCRIPT

Asylum MFP-3D AFM SOP
January 2017
Purpose of this Instrument To obtain 3D surface topography at sub-nanometer scale resolution measure contact and friction forces between surfaces in contact measure sample conductivity and magnetic property in nano-scale region and image samples in liquid environment
WARNING Directly looking into the laser beam can cause permanent eye damage or blindness Always use a piece of paper if you want to view the beam image
NOTE The purpose of this manual is for general measurements with the AFM For more advanced measurements or measurements with accessories please contact MFCF staff members or refer to the Asylum MPF-3D operation manual which is located on the computer workbench
START UP
1 Log in your session on the FOM Sign in on the logbook located on the corner bench
2 Check the AFM controller box at the bottom of the computer cart to ensure that it is powered up (the green LED above the Power switch is ON)
3 Open the MFP-3D software by clicking on the Stable Asylum Research MFP3D icon on the computer desktop Wait until ldquoMFP-3D Readyrdquo is shown at the bottom of the MFP-3D software tray (Figure 1)
Figure 1 MFP-3D software tray
4 In the Master Panel click on the Main tab and check the ldquoImaging Moderdquo at lower section of the tab Select ldquoAC Moderdquo (tapping mode) if it is not already shown
PROBE MOUNTING
1 Find the tip holder assembly on the loading pedestal (Figure 2a b) and go to step 4 Otherwise go to next step
Figure 2 (a) AFM tip holder assembly (b) holder assembly in the loading pedestal (c) Removing tip holder assembly from AFM head
2 If you could not find holder assembly on the loading pedestal it should be attached to the AFM head Remove the AFM head from the sample stage and lay it upside down next to the sample stage (Do not stretch the cable attached to the AFM head)
3 Remove the tip holder assembly from the AFM head by pressing the round button on the side (Figure 2c) and mount it into the loading pedestal apparatus (Figure 3a)
4 Loosen the clamp screw (the middle one Figure 3b) with a screwdriver
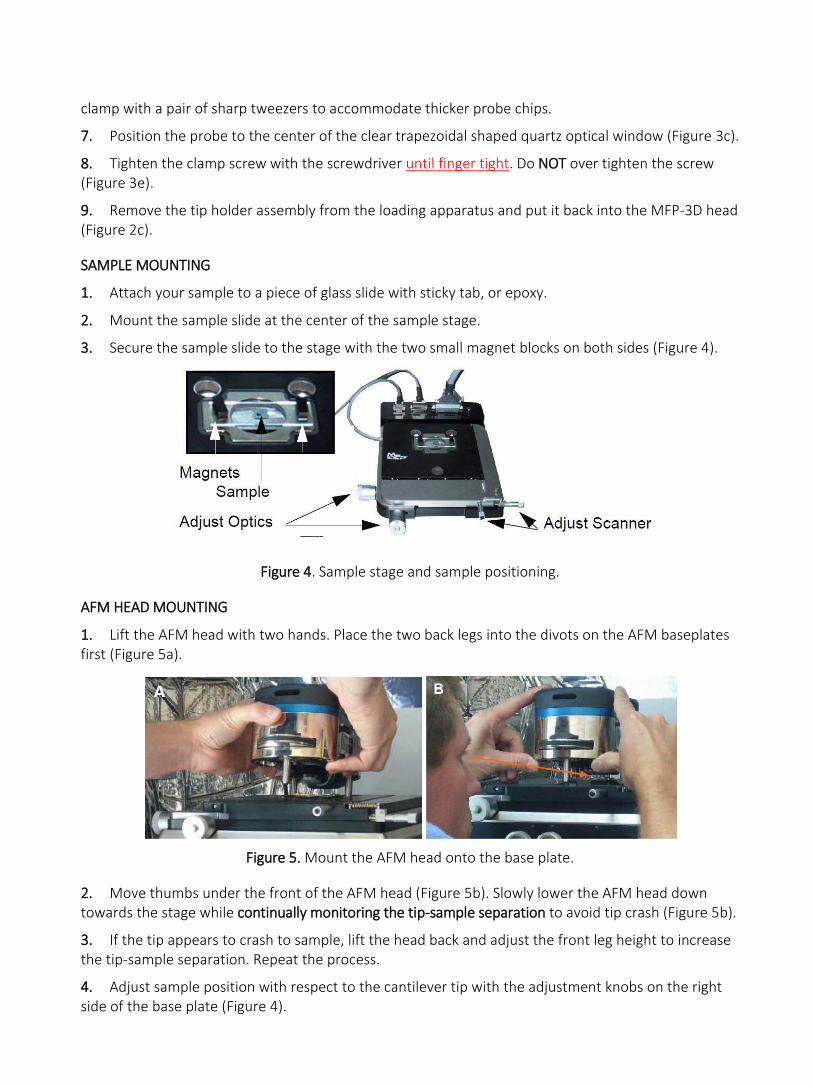
Figure 3 Proper probe loading procedure
5 Check the AFM probe against the light to ensure that the cantilever is not damaged
6 Slide the AFM probe under the tongue clamp (Figure 3b) You may need to gently lift the tongue
clamp with a pair of sharp tweezers to accommodate thicker probe chips
7 Position the probe to the center of the clear trapezoidal shaped quartz optical window (Figure 3c)
8 Tighten the clamp screw with the screwdriver until finger tight Do NOT over tighten the screw (Figure 3e)
9 Remove the tip holder assembly from the loading apparatus and put it back into the MFP-3D head (Figure 2c)
SAMPLE MOUNTING
1 Attach your sample to a piece of glass slide with sticky tab or epoxy
2 Mount the sample slide at the center of the sample stage
3 Secure the sample slide to the stage with the two small magnet blocks on both sides (Figure 4)
Figure 4 Sample stage and sample positioning
AFM HEAD MOUNTING
1 Lift the AFM head with two hands Place the two back legs into the divots on the AFM baseplates first (Figure 5a)
Figure 5 Mount the AFM head onto the base plate
2 Move thumbs under the front of the AFM head (Figure 5b) Slowly lower the AFM head down towards the stage while continually monitoring the tip-sample separation to avoid tip crash (Figure 5b)
3 If the tip appears to crash to sample lift the head back and adjust the front leg height to increase the tip-sample separation Repeat the process
4 Adjust sample position with respect to the cantilever tip with the adjustment knobs on the right side of the base plate (Figure 4)
ALIGNMENT CHECK WITH VIDEO CAMERA
1 Turn on the light source for the video camera The black switch knob is located on the right corner of the AFM computer cart
2 Load the video camera window by clicking the camera icon at the bottom of the AFM software window Select the S-video input in the Source pull-down menu in the video window
3 Adjust the image brightness with the light source switch knob
4 Adjust the two camera translation knobs at the back of the AFM head (Figure 6) to position the AFM cantilever probe in the middle of the video screen
5 Focus the camera on the cantilever probe with the camera focus ring (Figure 6) at the back of the AFM head Turn the ring clockwise to focus down and counter-clockwise to focus up
6 Check and ensure that the laser spot is positioned on the cantilever beam If not adjust the LDX LDY laser positioning thumbwheels to position the laser spot onto the cantilever beam and maximize the SUM reading
7 Adjust the focus ring clockwise to focus on the sample surface
8 Find the area of interest on sample surface by adjusting the scanner adjustment knobs on the right side of the sample stage (Figure 4)
9 Position the area of interest under the AFM probe
Figure 6 AFM head with various alignment thumbwheels labeled
LASER ALIGNMENT
1 Flip the AFM head to its normal position and settle it on the table surface
NOTE do not stretch or twist the cable
2 Turn on the laser by turning the key on the front of the AFM controller 90degclockwise to ON position
3 Optional Place the Newport infrared sensor card under the tip holder You should see a laser spot
on the card if the laser is not being blocked by anything
4 If you canrsquot see the laser spot turn the thumbwheel on the right side of the AF head (labeled LDX Figure 4) counter clockwise to move the laser spot outward along the cantilever length until the spot appears If no spot can be seen on the IR card charge the IR card for a few seconds under the fluorescent light
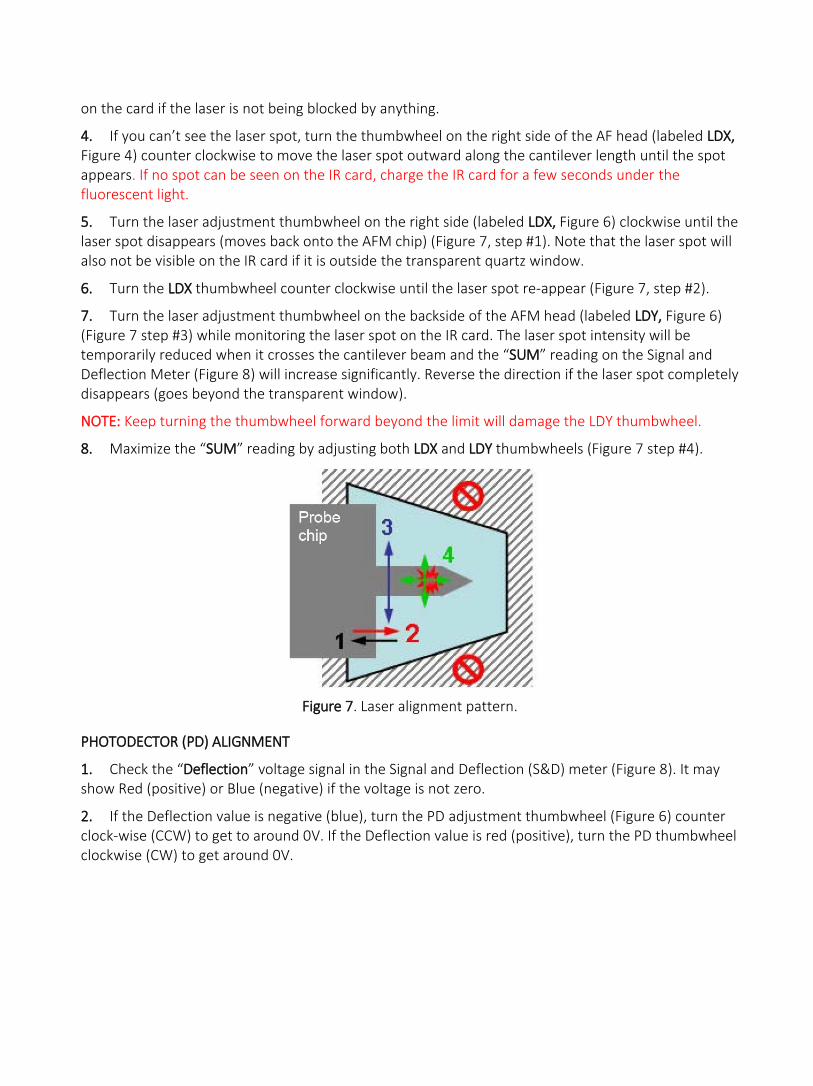
5 Turn the laser adjustment thumbwheel on the right side (labeled LDX Figure 6) clockwise until the laser spot disappears (moves back onto the AFM chip) (Figure 7 step 1) Note that the laser spot will also not be visible on the IR card if it is outside the transparent quartz window
6 Turn the LDX thumbwheel counter clockwise until the laser spot re-appear (Figure 7 step 2)
7 Turn the laser adjustment thumbwheel on the backside of the AFM head (labeled LDY Figure 6) (Figure 7 step 3) while monitoring the laser spot on the IR card The laser spot intensity will be temporarily reduced when it crosses the cantilever beam and the ldquoSUMrdquo reading on the Signal and Deflection Meter (Figure 8) will increase significantly Reverse the direction if the laser spot completely disappears (goes beyond the transparent window)
NOTE Keep turning the thumbwheel forward beyond the limit will damage the LDY thumbwheel
8 Maximize the ldquoSUMrdquo reading by adjusting both LDX and LDY thumbwheels (Figure 7 step 4)
Figure 7 Laser alignment pattern
PHOTODECTOR (PD) ALIGNMENT
1 Check the ldquoDeflectionrdquo voltage signal in the Signal and Deflection (SampD) meter (Figure 8) It may show Red (positive) or Blue (negative) if the voltage is not zero
2 If the Deflection value is negative (blue) turn the PD adjustment thumbwheel (Figure 6) counter clock-wise (CCW) to get to around 0V If the Deflection value is red (positive) turn the PD thumbwheel clockwise (CW) to get around 0V
Figure 8 Signal and Deflection meter
FRQUENCY TUNING IN AC (TAPPING) MODE
1 In software program Master Panel select the Tune tab (Figure 9)
2 Set Target Amplitude to 10V
3 Set Target Percent to ndash 50
4 The default auto tune frequency range (50 kHz to 400 kHz) covers most drive frequencies of common cantilevers Adjust the frequency range if the expected cantilever resonance frequency is out of the range
5 Click on ldquoAuto Tunerdquo button to start the frequency sweep
6 A frequencyphase response curve will show up if auto tune finishes successfully (Figure 10) The Drive Frequency will be automatically updated in the Master Panel
Figure 9 Auto tune tab
Figure 10 Cantilever frequency auto tune result
7 Check the SampD meter reading (Figure 8) The Amplitude value should be close to the set Target Amplitude of 10V
8 If you encounter Auto Tune failure the laser may not be properly aligned Repeat the laser alignment process
PROBE ENGAGEMENT
There are two ways to engage the tip to sample surface Hard Engage and Soft Engage The hard engage is quick but may result in minor tip wear In soft engage the tip engages at the lowest force possible
and is suite able for expensive super sharp tip or functionalized tip
Figure 11 A qualitative conceptual amplitude voltage vs distance for AC mode imaging
Figure 12 Main tab in Master Control for scan parameters
HARD ENGAGEMENT
1 Click the lsquoMainrsquo tab in Master Panel (Figure 12)
2 Select a Set Point voltage that is around 20 off the free air amplitude voltage (Eg if the free air amplitude is 10 V the Set Point voltage should be 08 V)
3 Choose an Integral Gain of 8 to10
4 Choose a Scan Rate of 1 Hz
5 Click the ldquoEngagerdquo button on the SampD meter (Figure 8) Monitor the Z Voltage reading which should be 150 V
6 Slowly turn the thumbwheel on the front of the AFM head counterclockwise to lower the tip towards sample surface When the Amplitude Voltage decrease to the selected Set Point voltage there is a concomitant chime sound (if the speaker is on)
7 Further turn the thumbwheel and monitor the Z Voltage which should decrease Stop when the Z Voltage drops to 70V
8 The AFM tip is now stationary on the surface (not scanning)
SOFT ENGAGEMENT
1 Select a Set Point voltage that is around 5 off the free air amplitude voltage (Eg if the free air amplitude is 10V the Set Point voltage should be 095 V)
2 Click ldquoEngagerdquo button on the SampD meter (Figure 10b)
3 Slowly turn the thumbwheel on the front of the AFM counterclockwise to lower the tip towards sample surface while monitoring the amplitude voltage on SampD meter Stop when the amplitude voltage equals the Set Point voltage
4 Further turn the thumbwheel to set the Z Voltage to 30-50V (halfway blue)
5 Activate the radio label for the Set Point voltage on the Main tab (See Figure 12)
6 Slowly turn the big lsquoHamsterrsquo wheel on the front of the controller (Figure 1) to increase the force (ie decrease the Set Point value) The Z voltage will move to more positive voltage value (more red) Continue turning the wheel until you notice that Z voltage will no longer move to more positive value At this point the tip is engaged on the surface at the lowest possible Set Point force
7 The AFM tip is now stationary on the surface (not scanning)
SCANNING
1 Click the lsquoDo Scanrsquo button or lsquoFrame uprsquo or lsquoFrame Downrsquo button on the Main tab of the Mater Panel to start scanning (Figure 12)
2 Set proper channel for image observation Ht (Height) Am (Amplitude) Ph (Phase) ZS (Z sensor)
3 Check the Trace and Retrace fast scan lines below each image channel to see if they follow each other well
4 If you use the Soft Engage decrease the Set Point voltage value to increase the force applied to the sample
NOTE Do not set the Set Point voltage lower than 50 of the free air amplitude voltage
5 Slightly increase the Drive Amplitude in the Main tab and monitor the improvement
6 Adjust the Integral Gain in the Main tab to better track the surface Increase the Integral Gain until high frequency noise shows up in the traceretrace lines Decrease the Integral Gain until the noise disappears
7 Select a proper Scan Rate for image acquisition After adjusting the Scan Rate click lsquoFrame Uprsquo or lsquoFrame Downrsquo buttons to initiate the newly entered scan rate
SAVING IMAGES
1 Select proper Scan Points and Scan Lines in the Main tab of the Master Panel Use 128x128 or 256x256 for rough scan 512x512 for data acquisition
2 Adjust Image Z scale Click Auto check box in top left corner of the image channel tabs Click the lsquoFixrsquo button on the left of the Data Scale section
3 Select Real Time Flattening by choose the lsquoLinersquo or lsquoMasked Linersquo in the Live Flatten pull-down menu
4 Give a proper filename for you image in the lsquoBase Namersquo section at the bottom of the Master Panel
5 Click the Save Imagesrsquo checkbox Use Browse to choose an image folder
6 Check the Save Status section to see if it will save current scan
7 If you want to save a screen shot of one of the windows you can make it the front window and go to menu File -gt save Graphicshellip Select the desirable format and size
IMAGE ANALYSIS
1 In top menu select AFM Analysis gt Browse Saved Data to locate the saved images
2 Open the chosen image file by placing the cursor over the image thumbnail and double clicking the mouse button The image will open in the Display Window
FlatteningPlanefit
1 Click the lsquoMrsquo button on the upper right corner of the image display window to open the Modify Panel
2 Select the lsquoFlattenrsquo Tab (Figure 13) Set a Flatten Order to 0 in the pull-down menu and select the lsquoAllrsquo radio button underneath
3 Click the lsquoFlattenrsquo button and the image will be flattened
4 Select the lsquoPlanefitrsquo Tab (Figure 13)
5 Set the lsquoPlanefit Orderrsquo to 1 in the pull-down menu Select the lsquoAllrsquo radio button
6 Click the lsquoXYrsquo button to planefit the image in the X-Y plane with respect to Z
Figure 13 (left) Flatten tab and (right) Planefit tab
Roughness
1 Click the lsquoArsquo button on the top right corner of the Display window to open the Analyze Panel
2 Open the Roughness tab on the Analyze Panel (Figure 14)
3 The data present in the Roughness tab is the most recent image
4 Click the lsquoExport Roughnessrsquo button at the bottom to create a text file of the data
5 Refer to Section 1251 in Operation manual for roughness measurement on masked image
Section Analysis
1 Click the lsquoArsquo button in upper right corner of the Display window to open the Analyze Panel
2 Open the Section tab in Analyze Panel
3 Click lsquoLinersquo from the Mode pull-down menu
4 Click the rsquoDrawrsquo button
5 Move cursor over to image and draw a line on the feature of interest A section plot will appear
6 If needed place cursors on the curve to measure points on the line
7 If the curve is not leveled perform a 1st
order XY plane fit Refer to Section 1252B in operation manual for leveling the line sections
8 Click the lsquoExport Roughnessrsquo button at the bottom to create a text file of the data
For other image analysis procedures please refer to the Chapter 7 in the Procedural Operation lsquoManualettersquo located on the corner workbench
SHUT DOWN
1 Click the Stop button in the Master Panel to withdraw the tip The SampD meter Z Voltage will read 00 V
2 Turn the front thumbwheel clockwise to retract the tip from sample surface Turning the thumbwheel in the wrong direction will cause tip and sample damage
3 Turn off the laser by switching the key on the AFM controller counter clockwise to OFF position
4 Remove the AFM head from sample stage Set it upside down on the table NOTE Do NOT stretch the cable
5 Remove the tip holder assembly from the AFM head and place it into the loading apparatus
6 Loosen the middle screw and remove AFM tip from the holder Tighten the middle screw until finger tight Leave the holder assembly on the loading apparatus
7 Remove sample from the sample stage
8 Sign out on the FOM and sign out on the log book
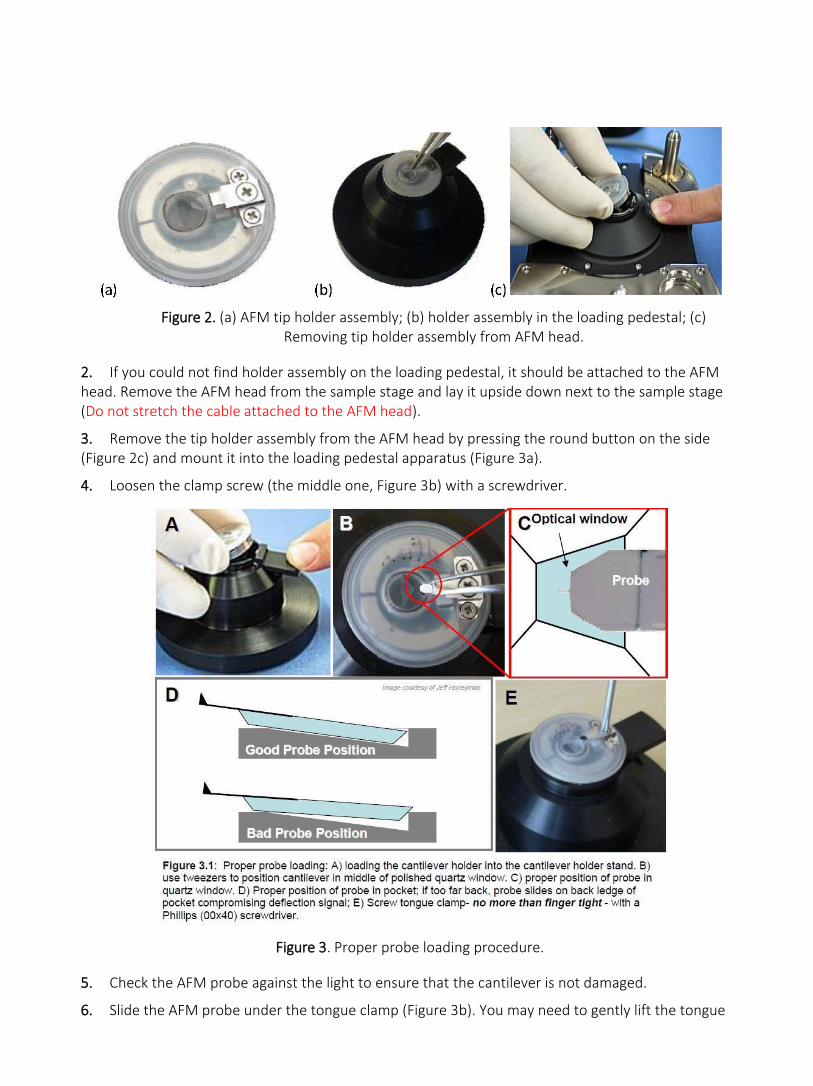
Figure 2 (a) AFM tip holder assembly (b) holder assembly in the loading pedestal (c) Removing tip holder assembly from AFM head
2 If you could not find holder assembly on the loading pedestal it should be attached to the AFM head Remove the AFM head from the sample stage and lay it upside down next to the sample stage (Do not stretch the cable attached to the AFM head)
3 Remove the tip holder assembly from the AFM head by pressing the round button on the side (Figure 2c) and mount it into the loading pedestal apparatus (Figure 3a)
4 Loosen the clamp screw (the middle one Figure 3b) with a screwdriver
Figure 3 Proper probe loading procedure
5 Check the AFM probe against the light to ensure that the cantilever is not damaged
6 Slide the AFM probe under the tongue clamp (Figure 3b) You may need to gently lift the tongue
clamp with a pair of sharp tweezers to accommodate thicker probe chips
7 Position the probe to the center of the clear trapezoidal shaped quartz optical window (Figure 3c)
8 Tighten the clamp screw with the screwdriver until finger tight Do NOT over tighten the screw (Figure 3e)
9 Remove the tip holder assembly from the loading apparatus and put it back into the MFP-3D head (Figure 2c)
SAMPLE MOUNTING
1 Attach your sample to a piece of glass slide with sticky tab or epoxy
2 Mount the sample slide at the center of the sample stage
3 Secure the sample slide to the stage with the two small magnet blocks on both sides (Figure 4)
Figure 4 Sample stage and sample positioning
AFM HEAD MOUNTING
1 Lift the AFM head with two hands Place the two back legs into the divots on the AFM baseplates first (Figure 5a)
Figure 5 Mount the AFM head onto the base plate
2 Move thumbs under the front of the AFM head (Figure 5b) Slowly lower the AFM head down towards the stage while continually monitoring the tip-sample separation to avoid tip crash (Figure 5b)
3 If the tip appears to crash to sample lift the head back and adjust the front leg height to increase the tip-sample separation Repeat the process
4 Adjust sample position with respect to the cantilever tip with the adjustment knobs on the right side of the base plate (Figure 4)
ALIGNMENT CHECK WITH VIDEO CAMERA
1 Turn on the light source for the video camera The black switch knob is located on the right corner of the AFM computer cart
2 Load the video camera window by clicking the camera icon at the bottom of the AFM software window Select the S-video input in the Source pull-down menu in the video window
3 Adjust the image brightness with the light source switch knob
4 Adjust the two camera translation knobs at the back of the AFM head (Figure 6) to position the AFM cantilever probe in the middle of the video screen
5 Focus the camera on the cantilever probe with the camera focus ring (Figure 6) at the back of the AFM head Turn the ring clockwise to focus down and counter-clockwise to focus up
6 Check and ensure that the laser spot is positioned on the cantilever beam If not adjust the LDX LDY laser positioning thumbwheels to position the laser spot onto the cantilever beam and maximize the SUM reading
7 Adjust the focus ring clockwise to focus on the sample surface
8 Find the area of interest on sample surface by adjusting the scanner adjustment knobs on the right side of the sample stage (Figure 4)
9 Position the area of interest under the AFM probe
Figure 6 AFM head with various alignment thumbwheels labeled
LASER ALIGNMENT
1 Flip the AFM head to its normal position and settle it on the table surface
NOTE do not stretch or twist the cable
2 Turn on the laser by turning the key on the front of the AFM controller 90degclockwise to ON position
3 Optional Place the Newport infrared sensor card under the tip holder You should see a laser spot
on the card if the laser is not being blocked by anything
4 If you canrsquot see the laser spot turn the thumbwheel on the right side of the AF head (labeled LDX Figure 4) counter clockwise to move the laser spot outward along the cantilever length until the spot appears If no spot can be seen on the IR card charge the IR card for a few seconds under the fluorescent light
5 Turn the laser adjustment thumbwheel on the right side (labeled LDX Figure 6) clockwise until the laser spot disappears (moves back onto the AFM chip) (Figure 7 step 1) Note that the laser spot will also not be visible on the IR card if it is outside the transparent quartz window
6 Turn the LDX thumbwheel counter clockwise until the laser spot re-appear (Figure 7 step 2)
7 Turn the laser adjustment thumbwheel on the backside of the AFM head (labeled LDY Figure 6) (Figure 7 step 3) while monitoring the laser spot on the IR card The laser spot intensity will be temporarily reduced when it crosses the cantilever beam and the ldquoSUMrdquo reading on the Signal and Deflection Meter (Figure 8) will increase significantly Reverse the direction if the laser spot completely disappears (goes beyond the transparent window)
NOTE Keep turning the thumbwheel forward beyond the limit will damage the LDY thumbwheel
8 Maximize the ldquoSUMrdquo reading by adjusting both LDX and LDY thumbwheels (Figure 7 step 4)
Figure 7 Laser alignment pattern
PHOTODECTOR (PD) ALIGNMENT
1 Check the ldquoDeflectionrdquo voltage signal in the Signal and Deflection (SampD) meter (Figure 8) It may show Red (positive) or Blue (negative) if the voltage is not zero
2 If the Deflection value is negative (blue) turn the PD adjustment thumbwheel (Figure 6) counter clock-wise (CCW) to get to around 0V If the Deflection value is red (positive) turn the PD thumbwheel clockwise (CW) to get around 0V
Figure 8 Signal and Deflection meter
FRQUENCY TUNING IN AC (TAPPING) MODE
1 In software program Master Panel select the Tune tab (Figure 9)
2 Set Target Amplitude to 10V
3 Set Target Percent to ndash 50
4 The default auto tune frequency range (50 kHz to 400 kHz) covers most drive frequencies of common cantilevers Adjust the frequency range if the expected cantilever resonance frequency is out of the range
5 Click on ldquoAuto Tunerdquo button to start the frequency sweep
6 A frequencyphase response curve will show up if auto tune finishes successfully (Figure 10) The Drive Frequency will be automatically updated in the Master Panel
Figure 9 Auto tune tab
Figure 10 Cantilever frequency auto tune result
7 Check the SampD meter reading (Figure 8) The Amplitude value should be close to the set Target Amplitude of 10V
8 If you encounter Auto Tune failure the laser may not be properly aligned Repeat the laser alignment process
PROBE ENGAGEMENT
There are two ways to engage the tip to sample surface Hard Engage and Soft Engage The hard engage is quick but may result in minor tip wear In soft engage the tip engages at the lowest force possible
and is suite able for expensive super sharp tip or functionalized tip
Figure 11 A qualitative conceptual amplitude voltage vs distance for AC mode imaging
Figure 12 Main tab in Master Control for scan parameters
HARD ENGAGEMENT
1 Click the lsquoMainrsquo tab in Master Panel (Figure 12)
2 Select a Set Point voltage that is around 20 off the free air amplitude voltage (Eg if the free air amplitude is 10 V the Set Point voltage should be 08 V)
3 Choose an Integral Gain of 8 to10
4 Choose a Scan Rate of 1 Hz
5 Click the ldquoEngagerdquo button on the SampD meter (Figure 8) Monitor the Z Voltage reading which should be 150 V
6 Slowly turn the thumbwheel on the front of the AFM head counterclockwise to lower the tip towards sample surface When the Amplitude Voltage decrease to the selected Set Point voltage there is a concomitant chime sound (if the speaker is on)
7 Further turn the thumbwheel and monitor the Z Voltage which should decrease Stop when the Z Voltage drops to 70V
8 The AFM tip is now stationary on the surface (not scanning)
SOFT ENGAGEMENT
1 Select a Set Point voltage that is around 5 off the free air amplitude voltage (Eg if the free air amplitude is 10V the Set Point voltage should be 095 V)
2 Click ldquoEngagerdquo button on the SampD meter (Figure 10b)
3 Slowly turn the thumbwheel on the front of the AFM counterclockwise to lower the tip towards sample surface while monitoring the amplitude voltage on SampD meter Stop when the amplitude voltage equals the Set Point voltage
4 Further turn the thumbwheel to set the Z Voltage to 30-50V (halfway blue)
5 Activate the radio label for the Set Point voltage on the Main tab (See Figure 12)
6 Slowly turn the big lsquoHamsterrsquo wheel on the front of the controller (Figure 1) to increase the force (ie decrease the Set Point value) The Z voltage will move to more positive voltage value (more red) Continue turning the wheel until you notice that Z voltage will no longer move to more positive value At this point the tip is engaged on the surface at the lowest possible Set Point force
7 The AFM tip is now stationary on the surface (not scanning)
SCANNING
1 Click the lsquoDo Scanrsquo button or lsquoFrame uprsquo or lsquoFrame Downrsquo button on the Main tab of the Mater Panel to start scanning (Figure 12)
2 Set proper channel for image observation Ht (Height) Am (Amplitude) Ph (Phase) ZS (Z sensor)
3 Check the Trace and Retrace fast scan lines below each image channel to see if they follow each other well
4 If you use the Soft Engage decrease the Set Point voltage value to increase the force applied to the sample
NOTE Do not set the Set Point voltage lower than 50 of the free air amplitude voltage
5 Slightly increase the Drive Amplitude in the Main tab and monitor the improvement
6 Adjust the Integral Gain in the Main tab to better track the surface Increase the Integral Gain until high frequency noise shows up in the traceretrace lines Decrease the Integral Gain until the noise disappears
7 Select a proper Scan Rate for image acquisition After adjusting the Scan Rate click lsquoFrame Uprsquo or lsquoFrame Downrsquo buttons to initiate the newly entered scan rate
SAVING IMAGES
1 Select proper Scan Points and Scan Lines in the Main tab of the Master Panel Use 128x128 or 256x256 for rough scan 512x512 for data acquisition
2 Adjust Image Z scale Click Auto check box in top left corner of the image channel tabs Click the lsquoFixrsquo button on the left of the Data Scale section
3 Select Real Time Flattening by choose the lsquoLinersquo or lsquoMasked Linersquo in the Live Flatten pull-down menu
4 Give a proper filename for you image in the lsquoBase Namersquo section at the bottom of the Master Panel
5 Click the Save Imagesrsquo checkbox Use Browse to choose an image folder
6 Check the Save Status section to see if it will save current scan
7 If you want to save a screen shot of one of the windows you can make it the front window and go to menu File -gt save Graphicshellip Select the desirable format and size
IMAGE ANALYSIS
1 In top menu select AFM Analysis gt Browse Saved Data to locate the saved images
2 Open the chosen image file by placing the cursor over the image thumbnail and double clicking the mouse button The image will open in the Display Window
FlatteningPlanefit
1 Click the lsquoMrsquo button on the upper right corner of the image display window to open the Modify Panel
2 Select the lsquoFlattenrsquo Tab (Figure 13) Set a Flatten Order to 0 in the pull-down menu and select the lsquoAllrsquo radio button underneath
3 Click the lsquoFlattenrsquo button and the image will be flattened
4 Select the lsquoPlanefitrsquo Tab (Figure 13)
5 Set the lsquoPlanefit Orderrsquo to 1 in the pull-down menu Select the lsquoAllrsquo radio button
6 Click the lsquoXYrsquo button to planefit the image in the X-Y plane with respect to Z
Figure 13 (left) Flatten tab and (right) Planefit tab
Roughness
1 Click the lsquoArsquo button on the top right corner of the Display window to open the Analyze Panel
2 Open the Roughness tab on the Analyze Panel (Figure 14)
3 The data present in the Roughness tab is the most recent image
4 Click the lsquoExport Roughnessrsquo button at the bottom to create a text file of the data
5 Refer to Section 1251 in Operation manual for roughness measurement on masked image
Section Analysis
1 Click the lsquoArsquo button in upper right corner of the Display window to open the Analyze Panel
2 Open the Section tab in Analyze Panel
3 Click lsquoLinersquo from the Mode pull-down menu
4 Click the rsquoDrawrsquo button
5 Move cursor over to image and draw a line on the feature of interest A section plot will appear
6 If needed place cursors on the curve to measure points on the line
7 If the curve is not leveled perform a 1st
order XY plane fit Refer to Section 1252B in operation manual for leveling the line sections
8 Click the lsquoExport Roughnessrsquo button at the bottom to create a text file of the data
For other image analysis procedures please refer to the Chapter 7 in the Procedural Operation lsquoManualettersquo located on the corner workbench
SHUT DOWN
1 Click the Stop button in the Master Panel to withdraw the tip The SampD meter Z Voltage will read 00 V
2 Turn the front thumbwheel clockwise to retract the tip from sample surface Turning the thumbwheel in the wrong direction will cause tip and sample damage
3 Turn off the laser by switching the key on the AFM controller counter clockwise to OFF position
4 Remove the AFM head from sample stage Set it upside down on the table NOTE Do NOT stretch the cable
5 Remove the tip holder assembly from the AFM head and place it into the loading apparatus
6 Loosen the middle screw and remove AFM tip from the holder Tighten the middle screw until finger tight Leave the holder assembly on the loading apparatus
7 Remove sample from the sample stage
8 Sign out on the FOM and sign out on the log book
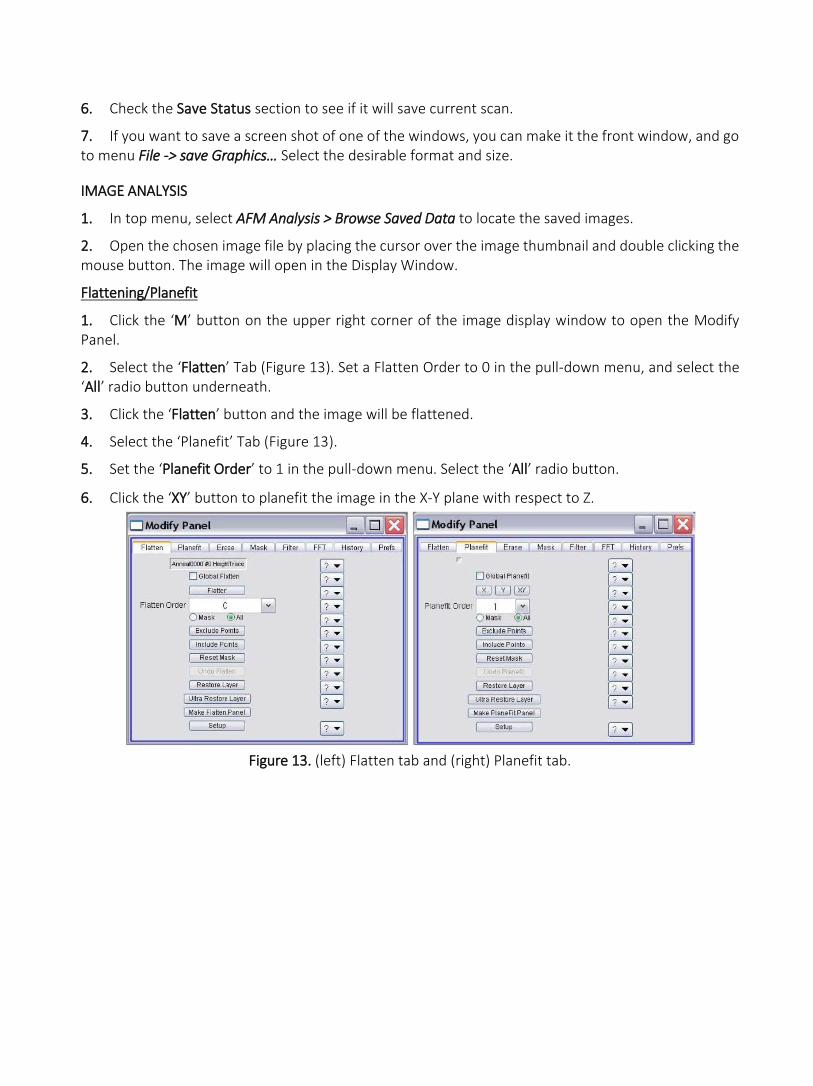
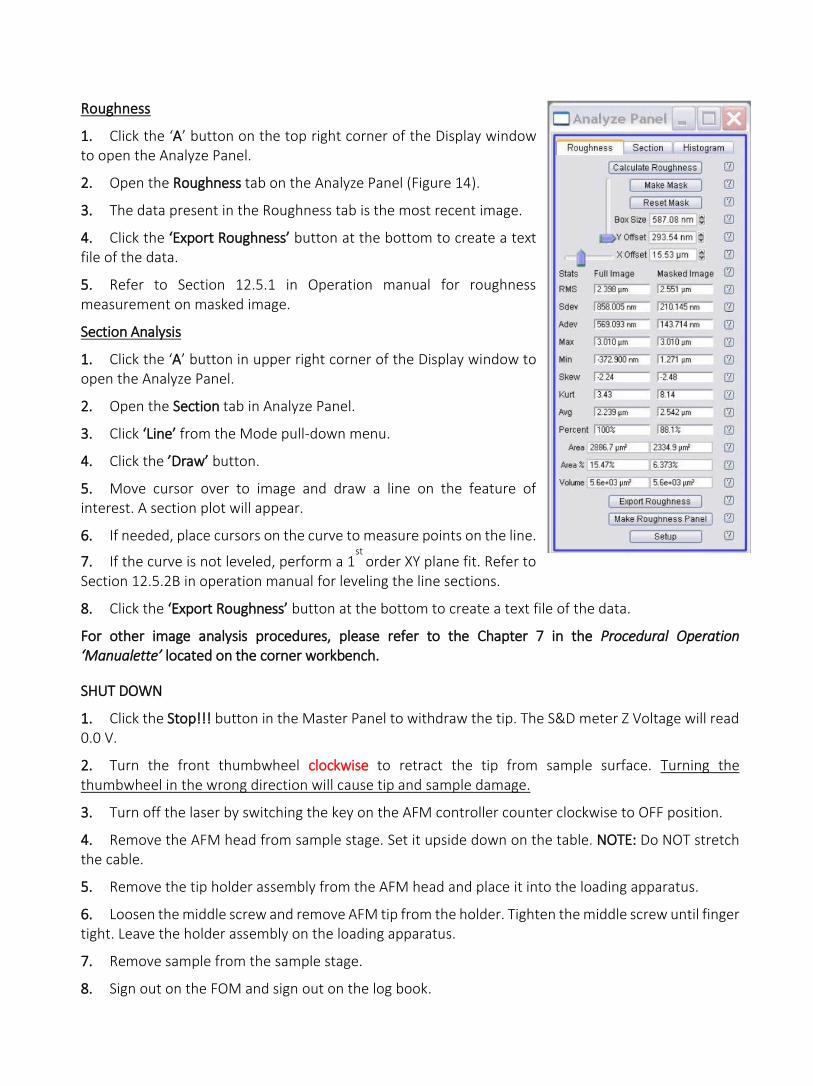