asylum applicants and first instance decisions on asylum ...aei.pitt.edu/85623/1/2011.5.pdf · 1...
TRANSCRIPT

Data in focus Population and social conditions Author: Anthony ALBERTINELLI
5/2011
Asylum applicants and first instance decisions on asylum applications in 2010
Despite a high number of asylum applicants registered in Q4 2010, around 6 000 fewer asylum applicants in the EU-27 in 2010 overall compared to 2009
Figure 1: Asylum applicants, EU-27, January 2009 – December 2010
5 000
10 000
15 000
20 000
25 000
30 000
Jan. Feb. Mar. Apr. May Jun. Jul. Aug. Sep. Oct. Nov. Dec.
2009 2010
Source: Eurostat (online data code: migr_asyappctzm)
Nearly 16 000 more asylum applicants registered in Germany in 2010 compared to 2009 Figure 2: Asylum applicants, absolute and relative change between 2009 and 2010
-16 000
-12 000
-8 000
-4 000
0
4 000
8 000
12 000
16 000
UK IT NOEU27
EL AT PL HU MT FI NL IE CH CZ CY SK ES LI RO EE LV PT SI LT BG LU DK FR BE SE DE-100 %
-75 %
-50 %
-25 %
0 %
25 %
50 %
75 %
100 %Absolute change Relative change
Source: Eurostat (online data code: migr_asyappctza)

2 5/2011 — Data in focus
Although Germany became the main receiving country in the 2nd half of the year, France remained the top destination in the EU-27 in 2010
Tabl
e 1a
: Asy
lum
app
lican
ts b
y M
embe
r S
tate
s (in
clud
ing
new
asy
lum
app
lican
ts),
Q4/
09-Q
4/10
(rou
nded
figu
res)
Oct
.N
ov.
Dec
.Ja
n.Fe
b.M
ar.
Apr
.M
ay.
Jun.
Jul.
Aug
.S
ep.
Oct
.N
ov.
Dec
.O
ct.-
Dec
.20
10
Q3
to Q
4 20
10
chan
ge in
%
App
lican
ts p
er
mill
ion
inha
bita
nts1)
EU
-27
24
060
23
045
21
110
18
585
20
375
22
555
18
250
18
045
19
400
19
480
21
955
25
050
27
315
24
760
22
040
74
115
11
150
257
815
Bel
gium
2 42
52
445
2 66
51
660
2 83
51
840
1 51
01
595
1 80
01
955
2 33
02
300
2 85
52
710
2 74
58
305
26 7
65 2
6 13
0
Bul
gari
a75
100
8510
085
100
7555
8595
9575
6595
105
265
0 3
5 1
025
Cze
ch R
epub
lic95
8085
6575
105
7580
6545
7050
5545
5015
0-1
0 1
5 7
80
Den
mar
k36
041
038
540
542
039
037
039
032
037
053
545
554
042
544
01
410
3 2
55 5
070
Ger
man
y3
105
2 94
52
510
3 09
02
885
3 34
52
945
2 75
53
385
3 83
54
655
5 60
06
085
5 63
04
280
15 9
9514
195
48
490
Est
onia
55
55
05
55
*5
50
**
55
-38
5 3
5
Irel
and
205
175
160
190
175
165
160
180
155
160
175
155
145
155
125
420
-14
95
1 9
40
Gre
ece
1 13
596
089
065
074
580
066
084
01
010
990
885
1 31
01
080
910
395
2 38
5-2
5 2
10 1
0 27
5
Spa
in29
021
517
517
523
022
520
018
020
025
026
028
524
029
021
074
0-7
15
2 7
40
Fran
ce4
640
4 12
54
240
3 53
04
560
4 83
54
125
3 98
54
075
4 09
03
850
4 12
05
010
4 28
05
140
14 4
3020
225
51
595
Italy
1 30
51
865
655
1 01
067
51
035
730
945
975
815
515
815
870
1 04
063
52
545
19 4
0 1
0 05
0
Cyp
rus
315
335
245
215
210
190
175
210
235
215
170
190
215
355
490
1 06
085
1 3
20 2
875
Latv
ia20
5*
*5
*10
55
55
55
510
206
10
65
Lith
uani
a55
2535
3530
3515
5030
3040
3565
8060
205
95 6
0 4
95
Luxe
mbo
urg
3055
6050
5555
4545
4545
5090
9510
510
030
063
600
780
Hun
gary
520
250
240
275
250
230
240
220
185
120
110
115
115
130
100
350
1 3
5 2
095
Mal
ta2)
160
280
250
255
510
15*
4015
1010
1520
45-2
7 1
15 1
75
Net
herl
ands
1 65
51
565
1 34
01
430
1 26
01
495
1 12
089
01
085
870
1 18
51
450
1 53
51
590
1 20
04
320
23 2
60 1
5 10
0
Aus
tria
1 46
51
315
1 45
080
579
587
576
091
591
090
51
240
960
975
1 00
090
52
875
-7 3
45 1
1 05
0
Pol
and
890
695
905
390
410
605
500
485
530
450
700
675
630
550
610
1 79
0-2
45
6 5
40
Por
tuga
l15
510
1020
1010
1515
1520
1510
515
35-2
8 5
160
Rom
ania
5070
4550
5512
570
115
6045
100
7080
5555
195
-10
10
885
Slo
veni
a*
1530
1510
155
2520
1015
2025
4545
110
143
55
245
Slo
vaki
a80
6570
5520
4550
7055
5555
4535
2530
90-4
1 1
5 5
40
Finl
and
485
395
345
275
270
335
225
200
205
235
270
295
255
245
275
775
-3 1
45 3
090
Sw
eden
2 32
52
400
2 47
02
230
2 33
03
570
2 15
51
875
1 91
01
910
2 74
53
880
4 20
02
835
2 23
09
260
8 9
90 3
1 87
5
Uni
ted
Kin
gdom
2 35
52
235
1 75
51
840
1 97
52
120
2 00
51
890
2 03
51
925
1 86
02
035
2 12
52
145
1 76
56
035
4 9
5 2
3 71
5
Icel
and
55
0:
::
::
::
::
::
::
::
:
Liec
hten
stei
n10
065
55
2035
55
5*
*5
510
1525
178
695
105
Nor
way
1 52
01
210
1 09
584
574
092
059
068
573
588
51
030
980
960
885
775
2 61
5-1
0 5
40 1
0 02
5
Sw
itzer
land
1 30
51
345
1 20
01
190
1 16
51
300
1 17
51
080
1 26
01
145
1 37
01
380
1 38
51
575
1 41
54
375
12 5
60 1
5 43
5
1) R
elat
ive
to p
opul
atio
n as
of 1
st o
f Jan
uary
201
0 (p
rovi
sion
al d
ata)
.2)
Mal
ta s
ee c
ount
ry in
form
atio
n no
tes.
'*' -
repr
esen
ts 2
or f
ewer
asy
lum
app
lican
ts re
cord
ed in
the
refe
renc
e pe
riod.
Q2
2010
Q3
2010
Q4
2009
Q1
2010
2010
Q4
2010
Sou
rce:
Eur
osta
t (on
line
data
cod
e: m
igr_
asya
ppct
zm)

Data in focus — 5/2011 3
Afghanistan, Russia and Serbia were the three main countries of origin of asylum applicants in the EU-27 last year and accounted for more than 20% of all applicants in 2010
Tab
le 1
b:
Asy
lum
ap
plic
ants
in t
he
EU
-27
by
citi
zen
ship
(in
clu
din
g n
ew a
sylu
m a
pp
lican
ts),
Q4/
09-Q
4/10
(ro
un
ded
fig
ure
s)
Oct
.N
ov.
Dec
.Ja
n.
Feb
.M
ar.
Ap
r.M
ay.
Jun
.Ju
l.A
ug
.S
ep.
Oct
.N
ov.
Dec
.O
ct.-
Dec
.20
10
Q3
to
Q4
2010
ch
ang
e in
%
No
n-E
U 2
4 06
0 2
3 04
5 2
1 11
0 1
8 58
5 2
0 37
5 2
2 55
5 1
8 25
0 1
8 04
5 1
9 40
0 1
9 48
0 2
1 95
5 2
5 05
0 2
7 31
5 2
4 76
0 2
2 04
0 7
4 11
5 1
1 2
57 8
15
Ser
bia
- (
RS
) 4
60 5
15 3
85 3
15 1
230
1 7
35 7
60 5
40 5
50 5
65 1
150
2 9
45 3
695
2 5
60 1
660
7 9
1570
17
715
Afg
han
ista
n -
(A
F)
2 0
70 2
025
1 8
90 2
045
1 7
55 1
650
1 4
35 1
340
1 4
90 1
615
1 7
90 1
805
1 7
80 1
815
2 0
55 5
655
8 2
0 58
0
Ru
ssia
- (
RU
) 2
115
1 9
20 2
285
1 3
50 1
420
1 6
30 1
280
1 4
15 1
485
1 4
35 1
820
1 7
30 1
700
1 5
90 1
650
4 9
40-1
18
500
Ko
sovo
- (
XK
) 1
570
1 3
75 1
210
885
1 0
65 1
270
1 1
10 9
45 9
85 9
60 1
190
1 3
70 1
545
1 6
10 1
355
4 5
0528
14
285
Iraq
- (
IQ)
1 7
10 1
655
1 1
55 1
470
1 3
35 1
270
1 0
75 1
170
1 2
55 1
285
1 4
75 1
360
1 3
10 1
465
1 3
30 4
110
0 1
5 80
0
MK
8
0 6
5 1
10 6
5 7
60 4
20 2
35 1
55 2
35 3
10 6
25 1
310
1 8
45 1
125
465
3 4
3553
7 5
50
So
mal
ia -
(S
O)
1 7
60 1
690
1 4
50 1
155
1 0
65 1
415
1 1
40 9
70 1
195
1 3
05 1
795
1 2
20 1
220
1 0
60 8
25 3
100
-28
14
350
Iran
- (
IR)
905
835
775
800
750
770
675
665
725
800
935
1 1
50 1
050
1 0
15 9
75 3
040
5 1
0 31
0
Pak
ista
n -
(P
K)
730
735
650
500
535
695
605
605
870
785
750
1 1
10 1
030
985
715
2 7
303
9 1
80
Sri
Lan
ka -
(L
K)
620
565
580
475
530
535
490
435
470
505
415
505
670
590
685
1 9
4537
6 3
00
Ban
gla
des
h -
(B
D)
355
345
380
315
445
460
475
505
585
580
495
480
615
605
610
1 8
3018
6 1
75
Tu
rkey
- (
TR
) 7
20 6
30 5
10 4
50 4
65 5
90 5
15 4
50 5
05 5
30 4
30 6
30 5
90 6
25 5
60 1
775
12 6
335
Nig
eria
- (
NG
) 6
65 6
90 6
45 5
40 6
05 6
60 5
75 5
75 5
20 5
25 4
75 5
50 6
05 6
00 5
15 1
720
11 6
745
Arm
enia
- (
AM
) 6
95 7
55 9
60 5
10 4
80 4
20 3
25 3
15 3
50 4
20 4
55 5
25 6
25 5
30 5
55 1
710
22 5
515
Ch
ina
- (C
N)
525
560
430
375
410
485
425
435
455
450
455
590
620
535
415
1 5
755
5 6
55
Geo
rgia
- (
GE
) 9
35 7
05 7
25 5
70 5
80 7
65 6
25 5
40 5
55 5
55 5
45 5
65 6
40 5
20 4
10 1
565
-6 6
860
CD
475
345
425
360
440
475
425
400
495
445
505
410
475
450
475
1 4
003
5 3
60
Gu
inea
- (
GN
) 3
95 5
20 5
40 3
80 4
50 4
50 3
25 3
35 3
60 3
50 3
90 4
30 4
25 4
80 4
50 1
360
16 4
830
Syr
ia -
(S
Y)
465
415
285
390
480
445
385
370
395
365
475
415
465
380
440
1 2
802
5 0
10
Eri
trea
- (
ER
) 5
55 7
05 4
95 3
10 2
90 3
65 3
30 3
10 3
40 4
45 4
25 4
30 4
30 4
00 4
50 1
280
-1 4
520
Alg
eria
- (
DZ
) 3
25 2
85 2
65 3
40 2
65 3
20 2
95 2
65 2
70 3
25 2
65 2
40 3
65 3
05 3
10 9
8018
3 5
75
Ind
ia -
(IN
) 2
70 2
50 2
20 1
90 2
20 2
45 1
95 2
60 3
00 2
50 2
95 2
70 3
25 3
25 2
95 9
4516
3 1
75
Sta
tele
ss 1
75 2
05 1
55 1
65 1
85 1
90 1
65 1
45 1
60 1
65 1
85 1
95 2
15 2
25 2
15 6
6021
2 2
15
BA
130
220
185
280
130
200
95
200
220
110
75
155
200
295
130
625
84 2
095
Su
dan
- (
SD
) 1
80 2
05 1
65 1
65 2
10 1
95 1
75 1
75 1
65 2
15 1
80 2
25 1
90 1
75 2
20 5
85-5
2 2
90
Aze
rbai
jan
- (
AZ
) 2
80 2
45 3
00 2
90 1
50 2
00 1
45 1
35 1
55 1
35 1
60 1
65 2
00 1
40 2
05 5
5020
2 0
75
Vie
tnam
- (
VN
) 1
90 1
65 1
70 2
10 1
70 1
90 1
95 1
95 2
40 2
00 2
30 1
70 1
70 1
70 1
80 5
15-1
4 2
320
Kyr
gyz
stan
- (
KG
) 3
0 3
0 3
0 3
0 2
5 2
5 5
0 4
0 7
5 9
0 1
20 1
10 1
45 1
70 1
60 4
7550
1 0
40
Mo
ng
olia
- (
MN
) 1
75 1
30 1
35 1
35 1
35 1
35 1
30 1
35 1
35 7
5 1
80 1
50 1
65 1
65 1
30 4
6014
1 6
65
Hai
ti -
(H
T)
160
170
90
140
160
165
155
250
300
185
155
170
120
150
180
450
-12
2 1
30
Oth
er 4
325
4 0
95 3
520
3 3
70 3
630
4 1
95 3
435
3 7
60 3
555
3 5
10 3
525
3 6
70 3
885
3 7
00 3
425
11
005
3 4
3 66
5
Not
es:
Cou
ntrie
s se
lect
ed h
ere
are
thos
e w
ith th
e hi
ghes
t num
ber o
f asy
lum
app
lican
ts re
gist
ered
dur
ing
Q4
2010
Kos
ovo
- Kos
ovo
/ UN
SC
R 1
244;
BA
- B
osni
a an
d H
erze
govi
na; M
K -
the
form
er Y
ugos
lav
repu
blic
of M
aced
onia
; CD
- C
ongo
, the
Dem
ocra
tic R
epub
lic o
f the
; Syr
ia -
Syr
ian
Ara
b R
epub
lic
Q4
2010
2010
Q4
2009
Q1
2010
Q2
2010
Q32
010
Sou
rce:
Eur
osta
t (on
line
data
cod
e: m
igr_
asya
ppct
zm)

4 5/2011 — Data in focus
One out of five asylum applicants in the EU-27 was a minor aged below 13 in 2010 Table 2a: Age distribution of asylum applicants across EU Members, 2010 (in %)
0-13 14-17 18-34 35-64 65 and over
Unknown
EU-27 257 815 20.1 7.1 51.7 20.0 0.7 0.3Belgium 26 130 23.7 7.4 48.5 19.8 0.6 0.0Bulgaria 1 025 6.6 4.5 60.5 26.4 2.0 0.0Czech Republic 780 18.3 2.2 44.2 34.5 0.8 0.0Denmark 5 070 14.6 14.9 53.1 16.6 0.8 *Germany 48 490 25.3 9.1 46.9 17.8 0.9 *Estonia 35 18.2 * 60.6 18.2 0.0 0.0Ireland 1 940 25.5 4.1 53.2 17.1 * 0.0Greece 10 275 1.7 2.8 77.4 17.8 0.0 0.2Spain 2 740 11.6 2.4 60.8 24.0 1.2 0.0France 51 595 16.9 3.3 55.2 23.8 0.8 *Italy 10 050 15.9 5.0 64.3 14.5 0.2 *Cyprus 2 875 6.3 2.8 66.3 23.9 0.3 0.3Latvia 65 7.9 12.7 52.4 25.4 * 0.0Lithuania 495 12.9 5.1 54.3 27.1 0.6 0.0Luxembourg 780 20.1 6.3 52.0 21.4 * 0.0Hungary 2 095 13.4 8.9 64.0 13.6 * 0.0Malta 175 11.4 6.3 63.6 15.3 0.0 3.4Netherlands 15 100 26.1 9.8 44.5 18.6 1.0 0.1Austria 11 050 27.1 10.1 46.3 16.2 0.4 0.0Poland 6 540 35.8 4.5 37.4 21.6 0.7 0.0Portugal 160 9.5 5.1 58.9 26.6 0.0 0.0Romania 885 6.7 5.3 68.4 19.2 0.5 0.0Slovenia 245 9.3 16.7 51.6 21.5 * 0.0Slovakia 540 6.3 3.9 68.8 20.4 0.6 0.0Finland 3 090 14.6 9.6 57.2 17.5 0.3 0.8Sweden 31 875 23.3 10.0 46.3 19.3 1.1 0.0United Kingdom 23 715 13.2 7.2 53.2 22.7 0.8 2.9Iceland : : : : : : :Liechtenstein 105 25.5 2.8 47.2 24.5 0.0 0.0Norway 10 025 19.5 9.2 53.7 17.0 0.5 0.0Switzerland 15 435 22.3 4.5 58.5 14.2 0.3 0.1
Total (absolute
value)
Distribution of age groups as a share of total (in %)
Source: Eurostat (online data code: migr_asyappctza) '*' – represents 2 or fewer applicants recorded in the reference period
Figure 3a: Gender distribution of asylum applicants across EU Members, 2010 (in %)
0%
25%
50%
75%
100%
PL NL SE LI DE FR CY BE UKEU27
IE NO LU CZ AT ES LT CH PT FI IT DK SI MT EE BG LV EL HU RO SK
Women Men Unknown
Source: Eurostat (online data code: migr_asyappctza)
Data in focus — 5/2011 5
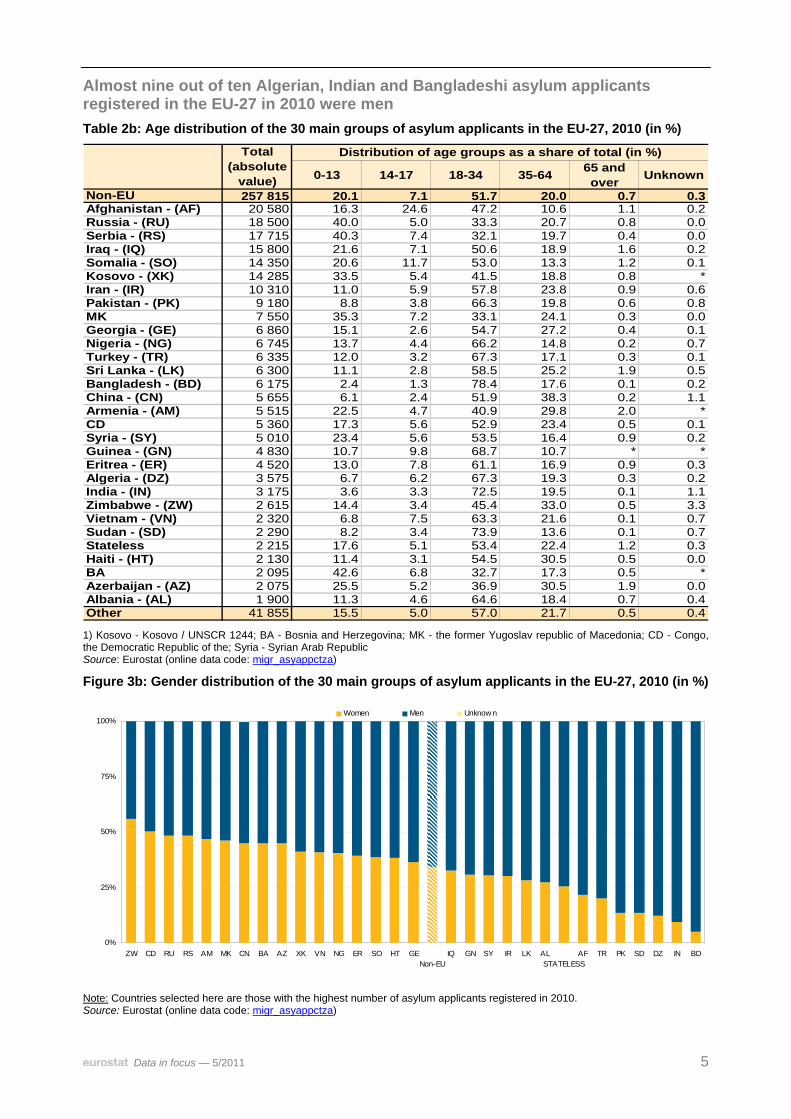
Almost nine out of ten Algerian, Indian and Bangladeshi asylum applicants registered in the EU-27 in 2010 were men Table 2b: Age distribution of the 30 main groups of asylum applicants in the EU-27, 2010 (in %)
0-13 14-17 18-34 35-64 65 and over
Unknown
Non-EU 257 815 20.1 7.1 51.7 20.0 0.7 0.3Afghanistan - (AF) 20 580 16.3 24.6 47.2 10.6 1.1 0.2Russia - (RU) 18 500 40.0 5.0 33.3 20.7 0.8 0.0Serbia - (RS) 17 715 40.3 7.4 32.1 19.7 0.4 0.0Iraq - (IQ) 15 800 21.6 7.1 50.6 18.9 1.6 0.2Somalia - (SO) 14 350 20.6 11.7 53.0 13.3 1.2 0.1Kosovo - (XK) 14 285 33.5 5.4 41.5 18.8 0.8 *Iran - (IR) 10 310 11.0 5.9 57.8 23.8 0.9 0.6Pakistan - (PK) 9 180 8.8 3.8 66.3 19.8 0.6 0.8MK 7 550 35.3 7.2 33.1 24.1 0.3 0.0Georgia - (GE) 6 860 15.1 2.6 54.7 27.2 0.4 0.1Nigeria - (NG) 6 745 13.7 4.4 66.2 14.8 0.2 0.7Turkey - (TR) 6 335 12.0 3.2 67.3 17.1 0.3 0.1Sri Lanka - (LK) 6 300 11.1 2.8 58.5 25.2 1.9 0.5Bangladesh - (BD) 6 175 2.4 1.3 78.4 17.6 0.1 0.2China - (CN) 5 655 6.1 2.4 51.9 38.3 0.2 1.1Armenia - (AM) 5 515 22.5 4.7 40.9 29.8 2.0 *CD 5 360 17.3 5.6 52.9 23.4 0.5 0.1Syria - (SY) 5 010 23.4 5.6 53.5 16.4 0.9 0.2Guinea - (GN) 4 830 10.7 9.8 68.7 10.7 * *Eritrea - (ER) 4 520 13.0 7.8 61.1 16.9 0.9 0.3Algeria - (DZ) 3 575 6.7 6.2 67.3 19.3 0.3 0.2India - (IN) 3 175 3.6 3.3 72.5 19.5 0.1 1.1Zimbabwe - (ZW) 2 615 14.4 3.4 45.4 33.0 0.5 3.3Vietnam - (VN) 2 320 6.8 7.5 63.3 21.6 0.1 0.7Sudan - (SD) 2 290 8.2 3.4 73.9 13.6 0.1 0.7Stateless 2 215 17.6 5.1 53.4 22.4 1.2 0.3Haiti - (HT) 2 130 11.4 3.1 54.5 30.5 0.5 0.0BA 2 095 42.6 6.8 32.7 17.3 0.5 *Azerbaijan - (AZ) 2 075 25.5 5.2 36.9 30.5 1.9 0.0Albania - (AL) 1 900 11.3 4.6 64.6 18.4 0.7 0.4Other 41 855 15.5 5.0 57.0 21.7 0.5 0.4
Total (absolute
value)
Distribution of age groups as a share of total (in %)
1) Kosovo - Kosovo / UNSCR 1244; BA - Bosnia and Herzegovina; MK - the former Yugoslav republic of Macedonia; CD - Congo, the Democratic Republic of the; Syria - Syrian Arab Republic Source: Eurostat (online data code: migr_asyappctza)
Figure 3b: Gender distribution of the 30 main groups of asylum applicants in the EU-27, 2010 (in %)
0%
25%
50%
75%
100%
ZW CD RU RS AM MK CN BA AZ XK VN NG ER SO HT GENon-EU
IQ GN SY IR LK ALSTATELESS
AF TR PK SD DZ IN BD
Women Men Unknow n
Note: Countries selected here are those with the highest number of asylum applicants registered in 2010. Source: Eurostat (online data code: migr_asyappctza)

6 5/2011 — Data in focus
Table 3a: Five main groups of asylum applicants in the EU-27+EFTA countries, 2010 (rounded figures)
(%)Afghanistan 20 580 8Russia 18 500 7Serbia 17 715 7Iraq 15 800 6Somalia 14 350 6Other 170 865 66
(%) (%) (%)Kosovo 3 230 12 Iraq 450 44 Ukraine 115 15Russia 2 725 10 Stateless 100 10 Mongolia 95 12Serbia 2 220 8 Armenia 60 6 Belarus 55 7Iraq 1 990 8 Iran 60 6 Russia 50 7Afghanistan 1 830 7 Afghanistan 60 6 Stateless 50 6Other 14 135 54 Other 290 28 Other 415 53
(%) (%) (%)Afghanistan 1 465 29 Serbia 6 795 14 Afghanistan 10 27Syria 815 16 Afghanistan 6 065 13 Russia 5 21Iran 655 13 Iraq 5 945 12 Nigeria 5 9Russia 400 8 MK 3 545 7 Sri Lanka 5 9Serbia 265 5 Iran 2 970 6 Belarus * *Other 1 470 29 Other 23 170 48 Other 10 0
(%) (%) (%)Nigeria 385 20 Pakistan 2 750 27 Cuba 405 15China 230 12 Georgia 1 160 11 Nigeria 240 9Pakistan 200 10 Bangladesh 985 10 Algeria 175 6Afghanistan 70 4 Albania 695 7 Guinea 165 6CD 70 4 China 545 5 Cameroon 155 6Other 985 51 Other 4 140 40 Other 1 600 58
(%) (%) (%)Kosovo 5 260 10 Nigeria 1 385 14 Iraq 340 12Russia 4 610 9 Pakistan 930 9 India 320 11Bangladesh 3 680 7 Afghanistan 875 9 Vietnam 225 8CD 3 560 7 Turkey 855 8 Egypt 210 7Sri Lanka 3 240 6 BA 815 8 Sri Lanka 185 6Other 31 250 61 Other 5 195 52 Other 1 590 55
(%) (%) (%)Afghanistan 25 38 Georgia 250 50 Kosovo 160 21Russia 5 11 Russia 110 22 Serbia 150 19Kyrgyzstan 5 11 Afghanistan 40 8 Iraq 95 12CD 5 6 Armenia 20 4 Algeria 45 6Ghana 5 5 Belarus 15 3 Iran 30 4Other 20 3 Other 65 13 Other 300 38
(%) (%) (%)Afghanistan 700 33 Somalia 35 20 Somalia 3 670 24Kosovo 380 18 Pakistan 15 9 Iraq 1 905 13PS 225 11 Eritrea 15 9 Afghanistan 1 585 10Georgia 70 3 India 15 8 Iran 865 6Serbia 65 3 Ethiopia 10 6 Armenia 650 4Other 655 31 Other 85 48 Other 6 425 43
(%) (%) (%)Russia 2 330 21 Russia 4 795 73 Guinea 45 27Afghanistan 1 590 14 Georgia 1 085 17 Colombia 15 10Kosovo 610 6 Armenia 105 2 Angola 10 8Nigeria 555 5 Vietnam 45 1 GW 10 6India 435 4 Belarus 45 1 CD 10 6Other 5 530 50 Other 460 7 Other 70 43
(%) (%) (%)Afghanistan 115 13 Turkey 30 13 Afghanistan 75 14Moldova 110 13 Afghanistan 30 13 Russia 65 12Turkey 70 8 BA 30 11 Georgia 65 12China 65 8 Kosovo 20 8 India 45 8Iraq 65 8 Serbia 15 6 Moldova 40 8Other 455 52 Other 120 49 Other 245 46
(%) (%) (%)Somalia 520 17 Serbia 6 255 20 Zimbabwe 2 435 10Iraq 515 17 Somalia 5 630 18 Iran 2 350 10Russia 395 13 Afghanistan 2 400 8 Pakistan 2 185 9Afghanistan 240 8 Iraq 1 995 6 Afghanistan 1 975 8Serbia 155 5 Kosovo 1 715 5 Sri Lanka 1 660 7Other 1 265 41 Other 13 880 44 Other 13 115 55
(%) (%) (%)MK 40 36 Eritrea 1 710 17 Nigeria 1 970 13Russia 30 30 Somalia 1 395 14 Eritrea 1 800 12Nigeria 10 10 Afghanistan 980 10 Sri Lanka 940 6Belarus 5 4 Russia 630 6 Serbia 910 6Serbia 5 3 Ethiopia 505 5 Afghanistan 670 4Other 20 17 Other 4 805 48 Other 9 145 59
LIECHTENSTEIN NORWAY SWITZERLAND
ROMANIA SLOVENIA SLOVAK REPUBLIC
FINLAND SWEDEN UNITED KINGDOM
HUNGARY MALTA NETHERLANDS
AUSTRIA POLAND PORTUGAL
FRANCE ITALY CYPRUS
LATVIA LITHUANIA LUXEMBOURG
DENMARK GERMANY ESTONIA
IRELAND GREECE SPAIN
EU-27
BELGIUM BULGARIA CZECH REPUBLIC
Source: Eurostat (online data code: migr_asyappctza)

Data in focus — 5/2011 7
Table 3b: Distribution of the main groups of asylum applicants in the EU-27, 2010 (rounded figures)
(%)France 51 595 20Germany 48 490 19Sweden 31 875 12Belgium 26 130 10UK 23 715 9Other 76 010 29
(%) (%) (%)Germany 6 065 29 Poland 4 795 26 Germany 6 795 38Sweden 2 400 12 France 4 610 25 Sweden 6 255 35UK 1 975 10 Belgium 2 725 15 Belgium 2 220 13Belgium 1 830 9 Austria 2 330 13 France 765 4Austria 1 590 8 Germany 1 410 8 Italy 495 3Other 6 725 33 Other 2 630 14 Other 1 185 7
(%) (%) (%)Germany 5 945 38 Sweden 5 630 39 France 5 260 37Sweden 1 995 13 Netherlands 3 670 26 Belgium 3 230 23Belgium 1 990 13 Germany 2 260 16 Germany 2 205 15Netherlands 1 905 12 UK 720 5 Sweden 1 715 12UK 580 4 Finland 520 4 Austria 610 4Other 3 380 21 Other 1 555 11 Other 1 270 9
(%) (%) (%)Germany 2 970 29 Greece 2 750 30 Germany 3 545 47UK 2 350 23 UK 2 185 24 Belgium 1 740 23Sweden 1 185 11 Germany 930 10 Sweden 900 12Netherlands 865 8 Italy 930 10 France 595 8Denmark 655 6 France 915 10 Netherlands 390 5Other 2 290 22 Other 1 475 16 Other 380 5
(%) (%) (%)France 1 435 21 Italy 1 385 21 France 1 960 31Greece 1 160 17 UK 1 145 17 Germany 1 710 27Poland 1 085 16 France 805 12 Italy 855 13Germany 750 11 Germany 775 11 Austria 370 6Netherlands 610 9 Austria 555 8 Belgium 305 5Other 1 820 27 Other 2 075 31 Other 1 140 18
(%) (%) (%)France 3 240 51 France 3 680 60 France 1 970 35UK 1 660 26 Greece 985 16 UK 1 305 23Germany 470 7 UK 515 8 Greece 545 10Netherlands 235 4 Italy 220 4 Germany 425 8Belgium 185 3 Belgium 185 3 Netherlands 315 6Other 515 8 Other 585 9 Other 1 095 19
(%) (%) (%)France 2 145 39 France 3 560 66 Germany 2 035 41Belgium 1 305 24 Belgium 890 17 Denmark 815 16Netherlands 650 12 UK 235 4 Belgium 460 9Germany 390 7 Germany 180 3 Sweden 450 9Sweden 275 5 Spain 90 2 Austria 205 4Other 750 14 Other 410 8 Other 1 050 21
(%) (%) (%)France 2 145 44 Sweden 1 465 32 France 1 215 34Belgium 1 535 32 UK 800 18 Germany 550 15Germany 255 5 France 725 16 Belgium 320 9Netherlands 250 5 Germany 660 15 UK 315 9Italy 165 3 Netherlands 410 9 Austria 310 9Other 475 10 Other 465 10 Other 865 24
(%) (%) (%)Germany 895 28 UK 2 435 93 Germany 1 170 50UK 635 20 Ireland 50 2 UK 465 20Austria 435 14 Germany 35 1 Cyprus 225 10Greece 380 12 Austria 25 1 Sweden 190 8Cyprus 320 10 Netherlands 15 1 Poland 45 2Other 510 16 Other 50 2 Other 220 9
(%) (%) (%)France 835 37 Sweden 1 045 47 France 2 085 98UK 690 30 UK 250 11 Belgium 10 0Netherlands 190 8 Germany 210 10 Sweden 10 0Sweden 110 5 France 180 8 Denmark 5 0Belgium 95 4 Austria 170 8 Spain 5 0Other 365 16 Other 355 16 Other 10 1
(%) (%) (%)Italy 815 39 France 895 43 Greece 695 36France 490 23 Germany 535 26 France 515 27Germany 355 17 Sweden 275 13 Belgium 245 13Belgium 145 7 Netherlands 105 5 UK 215 11Sweden 120 6 Austria 90 4 Sweden 65 3Other 170 8 Other 175 8 Other 175 9
SUDAN - (SD) STATELESS HAITI - (HT)
BA AZERBAIJAN - (AZ) ALBANIA - (AL)
GUINEA - (GN) ERITREA - (ER) ALGERIA - (DZ)
INDIA - (IN) ZIMBABWE - (ZW) VIETNAM - (VN)
SRI LANKA - (LK) BANGLADESH - (BD) CHINA - (CN)
ARMENIA - (AM) CD SYRIAN ARAB REPUBLIC - (SY)
IRAN - (IR) PAKISTAN - (PK) MK
GEORGIA - (GE) NIGERIA - (NG) TURKEY - (TR)
AFGHANISTAN - (AF) RUSSIA - (RU) SERBIA - (RS)
IRAQ - (IQ) SOMALIA - (SO) KOSOVO / UNSCR 1244 - (XK)
NON-EU
Note: CD – Congo, the Democratic Republic of the; BA- Bosnia and Herzegovina; MK – the former Yugoslav Republic of Macedonia Source: Eurostat (online data code: migr_asyappctza)

8 5/2011 — Data in focus
Nearly three quarters of the Serbian asylum applicants in the EU-27 lodged their application in Germany or Sweden in 2010 Figure 4a: Main groups of asylum applicants in the top 6 receiving countries1), 2010
Germany (48490 applicants)
Other48%
IR6%
MK7%
IQ12%
AF13%
RS14%
France (51595 applicants)
XK10% RU
9%BD7%
CD7%LK6%
Other61%
Sweden (31875 applicants)
Other43%
XK5%
IQ6%
AF8%
SO18%
RS20%
Belgium (26130 applicants)
XK12% RU
10%
RS8%
IQ8%
AF7%
Other55%
UK (23715 applicants)
Other56%
LK7%
AF8%
PK9%
IR10%
ZW10%
Netherlands (15100 applicants)
SO24%
IQ13%
AF10%
IR6%
AM4%
Other43%
1) Member States selected here are those with the highest number of asylum applicants registered during 2010. Source: Eurostat (online data code: migr_asyappctza)
Figure 4b: Distribution of the 6 main groups of asylum applicants in the EU-27 by receiving country, 2010
Afghanistan (20580 applications)
DE29%
SE12%UK
10%BE9%
AT8%
Other32%
Russia (18500 applications)
PL25%
FR25%BE
15%
AT13%
DE8%
Other14%
Serbia (17715 applications)
DE39%
SE35%
BE13%
FR4%
Other9%
Iraq (15800 applications)
DE37%
SE13%
BE13%
NL12%
Other25%
Somalia (14350 applications)
SE39%
NL26%
DE16%
UK5%
Other14%
Kosovo / UNSCR 1244 (14285 applications)
FR37%
BE23%
DE15%
SE12%
Other13%
1) Countries selected here are those with the highest number of asylum applicants registered during 2010. Note: AF – Afghanistan; RS – Serbia; IQ – Iraq; SO – Somalia; MK – the former Yugoslav Republic of Macedonia; XK – Kosovo / UNSCR 1244; RU – Russia; CD – Congo, the democratic republic of; BD – Bangladesh; LK – Sri Lanka; AM – Armenia; IR - Iran; PK – Pakistan; ZW – Zimbabwe Source: Eurostat (online data code: migr_asyappctza)

Data in focus — 5/2011 9
Tabl
e 4:
New
asy
lum
app
lican
ts b
y M
embe
r Sta
tes,
Q4/
09-Q
4/10
(rou
nded
figu
res)
Oct
.N
ov.
Dec
.Ja
n.Fe
b.M
ar.
Apr.
May
.Ju
n.Ju
l.A
ug.
Sep.
Oct
.N
ov.
Dec
.O
ct.-
Dec
.20
10
Q3
to Q
4 20
10
chan
ge in
%
App
lican
ts p
er
mill
ion
inha
bita
nts1)
EU-2
7:
::
::
::
::
::
::
::
::
::
Bel
gium
1 91
52
060
2 35
51
240
2 48
01
520
1 15
51
260
1 32
51
550
1 96
52
250
2 46
02
240
2 16
56
860
19 6
35 2
1 60
0B
ulga
ria:
::
::
::
::
::
::
::
::
::
Cze
ch R
epub
lic50
4555
3035
5540
3535
2035
2520
2040
801
10
385
Den
mar
k:
::
::
::
::
::
::
::
::
::
Ger
man
y2
685
2 51
52
170
2 71
52
435
2 70
52
455
2 41
52
890
3 37
54
085
4 76
54
975
4 74
03
695
13 4
1510
165
41
255
Esto
nia
55
55
05
55
*5
50
**
*5
-50
5 3
0Ire
land
205
175
160
190
175
165
160
180
155
160
170
150
140
155
120
415
-13
95
1 9
20G
reec
e:
::
::
::
::
::
::
::
::
::
Spai
n:
::
165
200
205
185
170
190
245
245
265
220
270
185
675
-10
15
2 5
50Fr
ance
4 13
53
720
3 90
53
220
4 19
54
435
3 72
03
595
3 64
03
635
3 54
03
770
4 59
53
910
4 62
513
125
20 2
05 4
6 88
5Ita
ly1
305
1 86
565
51
010
675
1 03
573
094
597
581
551
581
587
01
040
635
2 54
519
40
10
050
Cyp
rus
315
335
245
::
::
::
::
::
::
::
::
Latv
ia20
5*
*5
*10
55
55
55
55
15-6
5 6
0Li
thua
nia
2515
2010
2515
535
2020
3530
5575
5018
011
4 5
5 3
70Lu
xem
bour
g:
::
::
5045
4540
4050
9090
105
9529
065
580
:H
unga
ry:
::
::
::
::
::
::
::
::
::
Mal
ta2)
160
280
250
255
010
10*
4010
1010
1015
35-4
2 8
5 1
45N
ethe
rland
s1
570
1 46
51
230
1 30
01
155
1 34
595
075
089
083
01
060
1 24
01
310
1 41
51
050
3 77
020
230
13
290
Aus
tria
::
::
::
::
::
::
::
::
::
:Po
land
805
620
745
310
330
315
285
285
290
280
460
505
415
375
485
1 27
53
35
4 3
30Po
rtug
al15
510
1020
1010
1515
1520
1510
515
35-2
8 5
160
Rom
ania
::
::
::
::
::
::
::
::
::
:Sl
oven
ia*
1030
105
10*
2015
100
2025
4040
100
237
50
195
Slov
akia
::
:25
1025
4035
4020
3035
2515
1555
-35
10
315
Finl
and
::
::
::
::
::
::
::
::
::
:Sw
eden
2 28
02
360
2 46
52
225
2 33
03
565
2 15
01
870
1 91
01
895
2 73
53
880
4 19
02
830
2 22
09
240
9 9
90 3
1 81
0U
nite
d K
ingd
om2
255
2 13
51
655
1 72
51
800
1 87
51
855
1 74
01
865
1 78
01
755
1 92
52
020
2 04
01
685
5 75
05
95
22
060
Icel
and
::
::
::
::
::
::
::
::
::
:Li
echt
enst
ein
::
::
::
::
::
::
::
::
::
:N
orw
ay:
::
::
::
::
::
::
::
::
::
Switz
erla
nd1
155
1 23
51
040
1 07
01
020
1 15
51
045
940
1 09
596
51
175
1 20
51
225
1 34
51
190
3 76
013
485
13
430
1) R
elat
ive
to p
opul
atio
n as
of 1
st o
f Jan
uary
201
0 (p
rovi
sion
al d
ata)
.2)
Mal
ta s
ee c
ount
ry in
form
atio
n no
tes.
'*' -
repr
esen
ts 2
or f
ewer
asy
lum
app
lican
ts re
cord
ed in
the
refe
renc
e pe
riod.
Q2
2010
Q3
2010
Q4
2009
Q1
2010
2010
Q4
2010
Sou
rce:
Eur
osta
t (on
line
data
cod
e: m
igr_
asya
ppct
zm)

10 5/2011 — Data in focus
One out of four decisions issued at the first instance in the EU-27 in 2010 was positive Table 5a: First instance decisions by citizenship in selected Member States1), 2010 (rounded figures
Afghanistan 375 Iraq 425 Kosovo 1 680 Iraq 3 315 Afghanistan 245 Afghanistan 1 380 Serbia 4 800Guinea 365 Afghanistan 290 Armenia 1 620 Iran 1 395 Somalia 75 Iraq 105 Iraq 3 015Iraq 300 Somalia 40 Russia 1 420 Afghanistan 570 Eritrea 55 Russia 80 Afghanistan 2 775Other 1 660 Other 50 Other 8 020 Other 2 480 Other 170 Other 580 Other 24 275
Sri Lanka 580 Mali 415 Kosovo 3 370 Iran 180 Somalia 1 730 Somalia 1 515 Somalia 1 840Russia 370 Guinea 140 Bangladesh 2 385 Iraq 130 Iraq 740 Iraq 320 Afghanistan 1 240Eritrea 280 Somalia 85 Armenia 2 330 Somalia 95 Afghanistan 420 Afghanistan 140 Iraq 1 030Other 2 860 Other 380 Other 24 420 Other 405 Other 1 120 Other 770 Other 5 465
Iraq 535 Somalia 4 000 Afghanistan 145 Serbia 4 735 Iran 700 Afghanistan 610 Somalia 30 Pakistan 2 105Somalia 465 Afghanistan 735 Stateless 80 Somalia 1 830 Eritrea 565 Zimbabwe 240 Iran 25 Iran 1 930Iran 205 Eritrea 730 Somalia 50 Iraq 1 000 Zimbabwe 525 Iran 125 Gambia 15 Sri Lanka 1 760Other 730 Other 495 Other 330 Other 11 575 Other 2 655 Other 880 Other 75 Other 14 455
Russia 955 Afghanistan 1 730 Afghanistan 195 Russia 5 205 Iraq 4 930 Somalia 6 965 Afghanistan 1 865 Serbia 12 370Afghanistan 650 Iraq 1 185 Nigeria 180 Nigeria 3 335 Iran 3 315 Afghanistan 4 040 Somalia 1 640 Russia 11 200Iran 595 Somalia 965 Turkey 125 Afghanistan 2 670 Afghanistan 2 150 Iraq 2 660 Iraq 575 Afghanistan 10 240Other 3 100 Other 2 330 Other 1 515 Other 26 725 Other 16 655 Other 6 730 Other 3 570 Other 133 200
BELGIUM GERMANY
Refugee status Subsidiary protection
Humanitarian reasons
Rejections Refugee status Subsidiary protection
Humanitarian reasons
Rejections
Not applicable
FRANCE NETHERLANDS
Refugee status Subsidiary protection
Humanitarian reasons Rejections Refugee status Subsidiary
protectionHumanitarian
reasons Rejections
Not applicable
SWEDEN UNITED KINGDOM
Refugee status Subsidiary protection
Humanitarian reasons Rejections Refugee status Subsidiary
protectionHumanitarian
reasons Rejections
OTHER EU-27
Refugee status Subsidiary protection
Humanitarian reasons
Rejections Refugee status Subsidiary protection
Humanitarian reasons
Rejections
1) Member States selected here are those with the highest number of first instance decisions issued in 2010. Notes: XK – Kosovo / UNSCR 1244 Source: Eurostat (online data code: migr_asydcfsta)
Table 6a: First instance decisions by outcome across EU Members, 2010 (rounded figures) Total
decisionsTotal positive
decisionsRefugee status
Subsidiary protection
Humanitarian reasons Rejected
EU-27 222 105 55 095 27 045 20 400 7 645 167 010Belgium 16 245 3 510 2 700 805 - 12 740Bulgaria 515 140 20 120 - 375Czech Republic 500 175 75 75 20 330Denmark 3 280 1 345 660 520 170 1 935Germany 45 310 10 445 7 755 545 2 145 34 865Estonia 40 15 10 5 - 25Ireland 1 600 25 25 5 - 1 575Greece 3 455 105 60 20 30 3 350Spain 2 785 610 245 350 15 2 175France 37 620 5 115 4 095 1 020 - 32 505Italy1) 11 325 4 305 1 615 1 465 1 225 7 015Cyprus 2 440 425 30 370 25 2 015Latvia 50 25 5 20 - 25Lithuania 190 15 * 15 - 175Luxembourg 475 70 55 15 - 405Hungary 1 040 260 75 115 70 785Malta 350 210 45 165 15 125Netherlands 17 145 7 565 810 4 010 2 745 9 575Austria 13 770 3 445 2 055 1 390 - 10 325Poland 4 420 510 80 195 230 3 910Portugal 130 55 5 50 - 75Romania 425 70 40 30 0 355Slovenia 115 25 20 * - 95Slovakia 295 90 5 55 30 205Finland 4 260 1 595 165 1 240 190 2 665Sweden 27 630 8 495 1 935 5 955 605 19 140United Kingdom 26 690 6 440 4 445 1 850 140 20 250Iceland : : : : : :Liechtenstein 85 * * - 0 85Norway 15 255 5 300 2 975 1 565 760 9 955Switzerland 18 475 7 815 3 380 1 155 3 280 10 660 1) See country information notes. '-' – not applicable '*' – represents 2 or fewer first instance decisions recorded in the reference period Source: Eurostat (online data code: migr_asydcfsta)

Data in focus — 5/2011 11
Positive decisions at first instance granted to Somalis in 2010 accounts for almost 19% of all positive decisions issued at first instance in the EU-27 during the year Table 5b: First instance decisions by Member States in selected groups of asylum applicants1), 2010 (rounded figures)
Germany 570 Sweden 735 Germany 1 380 Germany 2 775 Germany 3 315 Netherlands 740 Netherlands 320 Germany 3 015Austria 380 UK 610 Sweden 145 UK 1 735 Sweden 535 Finland 490 Germany 105 Netherlands 1 030Belgium 375 Austria 595 Netherlands 140 Netherlands 1 240 Belgium 300 Belgium 425 Sweden 45 Sweden 1 000Other 825 Other 2 100 Other 200 Other 4 485 Other 780 Other 1 010 Other 105 Other 2 410
Sweden 465 Sweden 4 000 Netherlands 1 515 Netherlands 1 840 Austria 765 Austria 230 Poland 100 Poland 2 545UK 435 Netherlands 1 730 Sweden 50 Sweden 1 830 France 370 Poland 170 Germany 80 France 2 280Germany 380 Finland 595 UK 30 UK 485 Germany 255 Sweden 40 CZ 5 Austria 2 045Other 505 Other 640 Other 45 Other 1 020 Other 495 Other 90 Other 15 Other 4 330
Belgium 115 Italy 10 Italy 35 Germany 4 800 Belgium 140 Austria 40 Germany 75 France 3 370France 45 Austria 10 Germany 25 Sweden 4 735 France 95 Italy 10 Italy 60 Germany 2 170Austria 20 Germany 5 Sweden 25 Belgium 840 Austria 30 France 10 Sweden 35 Belgium 1 680Other * Other * Other 20 Other 1 995 Other 25 Other * Other 45 Other 2 425
UK 3 680 Netherlands 1 115 Italy 1 065 France 25 800 Germany 7 755 Sweden 5 955 Netherlands 2 745 Germany 34 865Germany 3 230 UK 1 095 Netherlands 765 Germany 20 670 UK 4 445 Netherlands 4 010 Germany 2 145 France 32 505France 3 095 Sweden 970 Germany 465 UK 17 130 France 4 095 UK 1 850 Italy 1 225 UK 20 250Other 5 825 Other 2 925 Other 750 Other 47 320 Other 10 750 Other 8 585 Other 1 535 Other 79 390
OTHER NON-EU
Refugee status Subsidiary protection
Humanitarian reasons Rejections Refugee status Subsidiary
protectionHumanitarian
reasons Rejections
SERBIA - RS KOSOVO / UNSCR 1244 - XK
Refugee status Subsidiary protection
Humanitarian reasons Rejections Refugee status Subsidiary
protectionHumanitarian
reasons Rejections
SOMALIA - SO RUSSIA - RU
Refugee status Subsidiary protection
Humanitarian reasons Rejections Refugee status Subsidiary
protectionHumanitarian
reasons Rejections
AFGHANISTAN - AF IRAQ - IQ
Refugee status Subsidiary protection
Humanitarian reasons
Rejections Refugee status Subsidiary protection
Humanitarian reasons
Rejections
1) Countries selected here are those with the highest number of first instance decisions issued in 2010. '*' – represents 2 or fewer first instance decisions recorded in the reference period. Note: UK – the United Kingdom ; CZ – Czech Republic Source: Eurostat (online data code: migr_asydcfsta)
Table 6b: First instance decisions by outcome across the 30 main groups of asylum applicants1) countries of citizenship in the EU-27, 2010 (rounded figures)
Total decisions
Total positive decisions
Refugee status
Subsidiary protection
Humanitarian reasons Rejected
Non-EU 222 105 55 095 27 045 20 400 7 645 167 010Afghanistan - (AF) 18 290 8 050 2 150 4 040 1 865 10 240Iraq - (IQ) 15 620 8 165 4 930 2 660 575 7 455Somalia - (SO) 15 570 10 390 1 785 6 965 1 640 5 180Russia - (RU) 13 815 2 615 1 885 530 200 11 200Serbia - (RS) 12 690 320 190 25 105 12 370Kosovo - (XK) 10 220 575 290 70 215 9 645Iran - (IR) 9 660 3 920 3 315 405 200 5 740Nigeria - (NG) 6 935 450 100 110 235 6 490Sri Lanka - (LK) 6 365 1 465 1 195 155 110 4 905Pakistan - (PK) 6 350 680 365 255 65 5 675Turkey - (TR) 6 300 985 715 105 165 5 315Armenia - (AM) 6 150 400 175 105 120 5 750Georgia - (GE) 5 365 135 60 35 40 5 230China - (CN) 5 090 805 570 165 70 4 285Eritrea - (ER) 4 625 3 070 1 700 1 300 70 1 555MK 4 535 60 35 5 20 4 470Syria - (SY) 4 510 1 160 975 80 105 3 350Bangladesh - (BD) 3 915 170 65 60 45 3 745CD 3 765 695 530 90 70 3 070Guinea - (GN) 3 760 920 580 270 70 2 840Algeria - (DZ) 2 940 90 50 35 5 2 845India - (IN) 2 720 50 15 15 15 2 675Zimbabwe - (ZW) 2 660 795 545 240 10 1 865Azerbaijan - (AZ) 2 220 330 200 75 55 1 890Sudan - (SD) 2 170 730 610 90 30 1 440Vietnam - (VN) 1 980 95 20 45 30 1 890Stateless 1 800 580 340 135 105 1 220Haiti - (HT) 1 645 220 110 40 65 1 430BA 1 590 115 60 5 50 1 475Mongolia - (MN) 1 560 45 15 10 15 1 520Other 37 275 7 025 3 465 2 270 1 290 30 250 1) Countries selected here are those with the highest number of first instance decisions issued in 2010. Notes: Kosovo – Kosovo / UNSCR 1244; BA – Bosnia and Herzegovina; CD – Congo, the Democratic Republic of the; MK – the former Yugoslav Republic of Macedonia; Syria – Syrian Arab Republic. Source: Eurostat (online data code: migr_asydcfsta)

12 5/2011 — Data in focus
Two thirds of first instance decisions issued in 2010 to Somalis were positive, Figure 5a: First instance decisions by outcome, selected Member States and the EU-271), 2010
Germany (45310 decisions)
17%
5%
77%
1%
France (37620 decisions)
11%
86%
3%
Sweden (27630 decisions)
7%
22%
2%
69%
UK (26690 decisions)
17%
7%
75%
1%
Netherlands (17145 decisions)
5%
23%
16%
56%
Belgium (16245 decisions)
17%
5%
78%
1) Member States selected here are those reporting the highest number of first instance decisions issued in 2010. Note: UK – the United Kingdom Source: Eurostat (online data code: migr_asydcfsta)
Figure 5b: First instance decisions in the EU-27 by outcome, selected citizenships1), 2010
Afghanistan (18290 decisions)
56%
12%
22%
10%
Iraq (15620 decisions)
47%
4%17%
32%
Somalia (15570 decisions)
33%
11%45%
11%
Russia (13815 decisions)
81%
1%4%
14%
Serbia (12690 decisions)
98%
1%0%
1%
XK (10220 decisions)
94%
2%1%3%
1) Citizenships selected here are those for which the highest number of first instance decisions was issued in 2010. * Note: XK – Kosovo / UNSCR 1244. Source: Eurostat (online data code: migr_asydcfsta)
Refugee status Subsidiary protection Humanitarian reasons Rejections
Refugee status Subsidiary protection Humanitarian reasons Rejections

Data in focus — 5/2011 13
ANNEX
Asylum applicants and decisions on asylum applicants in fourth quarter 2010
Figure 6a: Asylum applicants, absolute and relative change between Q4/2009 and Q4/2010 in the EU-27+EFTA
-8 000
-6 000
-4 000
-2 000
0
2 000
4 000
6 000
8 000
AT IT NO PL HU MT EL FI UK NL LI SK IE CZ LV EE BG PT RO ES SI LT LU CY DK CH BE FR SEEU27
DE-100 %
-75 %
-50 %
-25 %
0 %
25 %
50 %
75 %
100 %Absolute change Relative change
Source: Eurostat (online data code: migr_asyappctzm)
The increase of asylum applicant registered in Q4 2010 compared to Q4 2009 was primarily due to the particularly high influx of asylum applicants from Serbia and the former Yugoslav Republic of Macedonia Figure 6b: Asylum applicants, absolute and relative change between Q4/2009 and Q4/2010 in the EU-27 by citizenship of applicants
Source: Eurostat (online data code: migr_asyappctzm)
-8 000
-6 000
-4 000
-2 000
0
2 000
4 000
6 000
8 000
SORU GEAM ER IQ AF NGAZ GN TR VNMN HT SD CN BA DZ SYSTATELESS
CD LK IN XK KG IR PK BD MKNon-EU
RS-100 %
-75 %
-50 %
-25 %
0 %
25 %
50 %
75 %
100 %Absolute change Relative change
14 5/2011 — Data in focus
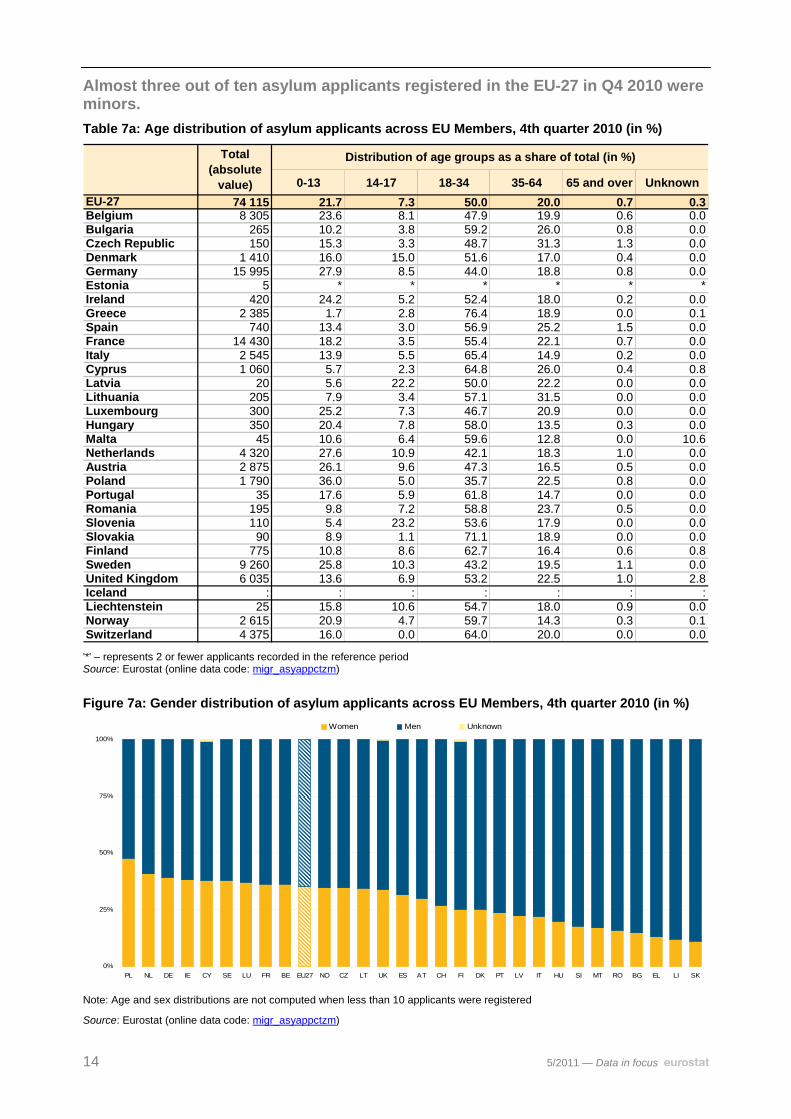
Almost three out of ten asylum applicants registered in the EU-27 in Q4 2010 were minors. Table 7a: Age distribution of asylum applicants across EU Members, 4th quarter 2010 (in %)
0-13 14-17 18-34 35-64 65 and over UnknownEU-27 74 115 21.7 7.3 50.0 20.0 0.7 0.3Belgium 8 305 23.6 8.1 47.9 19.9 0.6 0.0Bulgaria 265 10.2 3.8 59.2 26.0 0.8 0.0Czech Republic 150 15.3 3.3 48.7 31.3 1.3 0.0Denmark 1 410 16.0 15.0 51.6 17.0 0.4 0.0Germany 15 995 27.9 8.5 44.0 18.8 0.8 0.0Estonia 5 * * * * * *Ireland 420 24.2 5.2 52.4 18.0 0.2 0.0Greece 2 385 1.7 2.8 76.4 18.9 0.0 0.1Spain 740 13.4 3.0 56.9 25.2 1.5 0.0France 14 430 18.2 3.5 55.4 22.1 0.7 0.0Italy 2 545 13.9 5.5 65.4 14.9 0.2 0.0Cyprus 1 060 5.7 2.3 64.8 26.0 0.4 0.8Latvia 20 5.6 22.2 50.0 22.2 0.0 0.0Lithuania 205 7.9 3.4 57.1 31.5 0.0 0.0Luxembourg 300 25.2 7.3 46.7 20.9 0.0 0.0Hungary 350 20.4 7.8 58.0 13.5 0.3 0.0Malta 45 10.6 6.4 59.6 12.8 0.0 10.6Netherlands 4 320 27.6 10.9 42.1 18.3 1.0 0.0Austria 2 875 26.1 9.6 47.3 16.5 0.5 0.0Poland 1 790 36.0 5.0 35.7 22.5 0.8 0.0Portugal 35 17.6 5.9 61.8 14.7 0.0 0.0Romania 195 9.8 7.2 58.8 23.7 0.5 0.0Slovenia 110 5.4 23.2 53.6 17.9 0.0 0.0Slovakia 90 8.9 1.1 71.1 18.9 0.0 0.0Finland 775 10.8 8.6 62.7 16.4 0.6 0.8Sweden 9 260 25.8 10.3 43.2 19.5 1.1 0.0United Kingdom 6 035 13.6 6.9 53.2 22.5 1.0 2.8Iceland : : : : : : :Liechtenstein 25 15.8 10.6 54.7 18.0 0.9 0.0Norway 2 615 20.9 4.7 59.7 14.3 0.3 0.1Switzerland 4 375 16.0 0.0 64.0 20.0 0.0 0.0
Total (absolute
value)
Distribution of age groups as a share of total (in %)
'*' – represents 2 or fewer applicants recorded in the reference period Source: Eurostat (online data code: migr_asyappctzm)
Figure 7a: Gender distribution of asylum applicants across EU Members, 4th quarter 2010 (in %)
0%
25%
50%
75%
100%
PL NL DE IE CY SE LU FR BE EU27 NO CZ LT UK ES AT CH FI DK PT LV IT HU SI MT RO BG EL LI SK
Women Men Unknown
Note: Age and sex distributions are not computed when less than 10 applicants were registered
Source: Eurostat (online data code: migr_asyappctzm)

Data in focus — 5/2011 15
One third of asylum applicants registered in the EU-27 in Q4 2010 were women
Table 7b: Age distribution of the 30 main groups of asylum applicants in the EU-27, 4th quarter 2010 (in %)
0-13 14-17 18-34 35-64 65 and over UnknownNon-EU 74 115 21.7 7.3 50.0 20.0 0.7 0.3Serbia - (RS) 7 915 40.8 7.3 32.0 19.5 0.4 0.0Afghanistan - (AF) 5 655 16.3 25.8 45.6 10.8 1.3 0.2Russia - (RU) 4 940 38.3 4.7 34.0 22.2 0.8 0.0Kosovo - (XK) 4 505 35.2 5.7 39.1 19.4 0.6 0.0Iraq - (IQ) 4 110 18.8 7.1 51.8 20.3 1.7 0.3MK 3 435 36.7 7.4 32.6 23.1 0.3 0.0Somalia - (SO) 3 100 29.0 12.6 44.0 12.6 1.5 0.2Iran - (IR) 3 040 11.9 7.3 55.5 24.0 0.9 0.5Pakistan - (PK) 2 730 9.0 3.3 66.7 20.0 0.7 0.3Sri Lanka - (LK) 1 945 10.0 2.6 63.1 21.9 1.7 0.7Bangladesh - (BD) 1 830 2.4 1.0 79.0 17.4 0.1 0.2Turkey - (TR) 1 775 13.6 4.1 66.5 15.6 0.2 0.0Nigeria - (NG) 1 720 15.3 4.0 64.7 15.1 0.2 0.8Armenia - (AM) 1 710 23.4 4.8 41.6 28.4 1.9 0.0China - (CN) 1 575 6.4 2.8 50.0 39.4 0.1 1.3Georgia - (GE) 1 565 15.2 2.9 54.0 27.3 0.4 0.3CD 1 400 18.5 6.9 51.7 22.1 0.6 0.1Guinea - (GN) 1 360 11.0 11.3 67.6 9.9 0.0 0.1Syria - (SY) 1 280 20.4 6.8 54.4 17.1 1.1 0.3Eritrea - (ER) 1 280 13.4 7.0 62.1 16.7 0.6 0.2Algeria - (DZ) 980 5.6 6.6 67.4 19.8 0.4 0.1India - (IN) 945 3.7 2.2 69.8 22.6 0.1 1.5Stateless 660 15.9 3.5 55.5 23.7 1.1 0.3BA 625 41.8 8.3 29.3 20.3 0.3 0.0Sudan - (SD) 585 8.4 3.3 74.3 13.5 0.0 0.5Azerbaijan - (AZ) 550 26.1 5.3 38.1 28.6 1.8 0.0Vietnam - (VN) 515 7.5 5.6 59.2 27.1 0.0 0.6Kyrgyzstan - (KG) 475 28.6 5.7 47.9 17.6 0.2 0.0Mongolia - (MN) 460 14.6 4.6 53.7 26.3 0.4 0.4Haiti - (HT) 450 11.4 4.0 58.6 26.1 0.0 0.0Other 11 005 14.9 4.9 58.1 21.0 0.7 0.5
Total (absolute
value)
Distribution of age groups as a share of total (in %)
1) Kosovo - Kosovo / UNSCR 1244; BA - Bosnia and Herzegovina; MK - the former Yugoslav republic of Macedonia; CD - Congo, the Democratic Republic of the; Syria - Syrian Arab Republic Source: Eurostat (online data code: migr_asyappctzm)
Figure 7b: Gender distribution of the 30 main groups of asylum applicants in the EU-27, 4th quarter 2010 (in %)
0%
25%
50%
75%
100%
CD RS RU VN AM MK CN MN BA XK AZ SO KG ER NG HTNon-EU
GE GN SY IR IQ LK AFSTATELESS
TR SD PK DZ IN BD
Women Men Unknow n
Note: Countries selected here are those with the highest number of asylum applicants registered during Q4 2010. Source: Eurostat (online data code: migr_asyappctzm)

16 5/2011 — Data in focus
Table 8a: Five main groups of asylum applicants in the EU-27+EFTA countries, 4th quarter 2010 (rounded figures)
(%)Serbia 7 915 11Afghanistan 5 655 8Russia 4 940 7Kosovo / UNSCR 1244 4 505 6Iraq 4 110 6Other 46 995 63
(%) (%) (%)Kosovo / UNSCR 1244 1 095 13 Iraq 160 61 Belarus 20 12Serbia 850 10 Armenia 20 7 Ukraine 20 12Russia 800 10 Iran 15 5 Mongolia 15 10Afghanistan 700 8 Afghanistan 10 4 Vietnam 10 7Iraq 580 7 Ukraine 5 2 Kazakhstan 10 5Other 4 275 51 Other 55 22 Other 80 54
(%) (%) (%)Afghanistan 330 23 Serbia 4 100 26 Belarus * *Iran 225 16 MK 1 975 12 Russia * *Syrian Arab Republic 155 11 Afghanistan 1 700 11 Turkey * *Serbia 125 9 Iraq 1 425 9 Pakistan * *Russia 120 9 Iran 875 5 Stateless * *Other 450 32 Other 5 925 37 Other 0 0
(%) (%) (%)Nigeria 80 19 Pakistan 740 31 Nigeria 65 9China 65 15 Georgia 235 10 Algeria 35 5Pakistan 45 11 Bangladesh 195 8 Morocco 30 4CD 15 4 China 165 7 Ivory Coast 30 4South Africa 15 4 India 135 6 Cameroon 25 4Other 200 47 Other 915 38 Other 550 75
(%) (%) (%)Kosovo / UNSCR 1244 1 600 11 Pakistan 355 14 India 140 13Bangladesh 1 245 9 Turkey 290 11 Iraq 115 11Russia 1 110 8 Nigeria 285 11 Vietnam 115 11Sri Lanka 995 7 Afghanistan 285 11 Sri Lanka 90 9CD 965 7 Bosnia and Herzegovina 280 11 Nigeria 70 6Other 8 515 59 Other 1 045 41 Other 530 50
(%) (%) (%)Kyrgyzstan 5 28 Georgia 150 75 Serbia 120 40Afghanistan 5 22 Russia 30 14 Kosovo / UNSCR 1244 65 22Ghana * * Belarus 5 2 Iraq 25 8Belarus * * Sri Lanka 5 2 Iran 15 5Russia * * Afghanistan 5 2 MK 10 4Other 5 6 Other 10 4 Other 65 21
(%) (%) (%)Kosovo / UNSCR 1244 105 30 Ethiopia 5 9 Somalia 1 190 28Afghanistan 90 25 Morocco 5 9 Iraq 495 11Iran 20 6 Ivory Coast * * Afghanistan 485 11Georgia 15 4 Libyan Arab Jamahiriya * * Iran 270 6Iraq 10 3 Nigeria * * Armenia 215 5Other 110 32 Other 35 70 Other 1 670 39
(%) (%) (%)Russia 630 22 Russia 1 380 77 Guinea 5 21Afghanistan 425 15 Georgia 260 15 CD 5 15Kosovo / UNSCR 1244 125 4 Armenia 30 2 Angola * *Nigeria 125 4 Kyrgyzstan 20 1 Guinea-Bissau * *Serbia 120 4 Ukraine 10 1 Belarus * *Other 1 450 50 Other 90 5 Other 15 50
(%) (%) (%)Moldova 30 15 Afghanistan 20 18 Afghanistan 25 26Iran 25 12 Turkey 15 13 Moldova 10 12Iraq 15 9 PS 10 8 China 10 10China 15 7 Bosnia and Herzegovina 5 6 Georgia 5 7Cameroon 10 6 Somalia 5 6 India 5 7Other 100 52 Other 55 48 Other 35 39
(%) (%) (%)Iraq 180 23 Serbia 2 240 24 Iran 710 12Somalia 120 15 Somalia 920 10 Pakistan 630 10Afghanistan 70 9 Afghanistan 720 8 Sri Lanka 500 8Russia 60 8 Kosovo / UNSCR 1244 635 7 Afghanistan 475 8Kosovo / UNSCR 1244 45 6 Iraq 520 6 Zimbabwe 380 6Other 305 39 Other 4 225 46 Other 3 335 55
(%) (%) (%)Nigeria 10 44 Somalia 450 17 Nigeria 625 14Russia 10 36 Eritrea 390 15 Eritrea 535 12Syrian Arab Republic * * Russia 165 6 Serbia 285 6Kosovo / UNSCR 1244 * * Iran 130 5 Sri Lanka 245 6Gambia * * Afghanistan 235 9 Kosovo / UNSCR 1244 215 5Other * * Other 1 240 47 Other 2 470 56
FINLAND SWEDEN UNITED KINGDOM
LIECHTENSTEIN NORWAY SWITZERLAND
PORTUGAL
ROMANIA SLOVENIA SLOVAK REPUBLIC
LUXEMBOURG
HUNGARY MALTA NETHERLANDS
SPAIN
FRANCE ITALY CYPRUS
CZECH REPUBLIC
DENMARK GERMANY ESTONIA
BELGIUM
EU-27
BULGARIA
IRELAND GREECE
LATVIA LITHUANIA
AUSTRIA POLAND
Notes: '*' – represents 2 or fewer applicants recorded in the reference period CD – Congo, the Democratic Republic of the; MK – the former Yugoslav Republic of Macedonia Source: Eurostat (online data code: migr_asyappctzm)

Data in focus — 5/2011 17
Table 8b: Distribution of the main groups of asylum applicants in the EU-27, 4th quarter 2010 (rounded figures)
(%)Germany 15 995 22France 14 430 19Sweden 9 260 12Belgium 8 305 11United Kingdom 6 035 8Other 20 090 27
(%) (%) (%)Germany 4 100 52 Germany 1 700 30 Poland 1 380 28Sweden 2 240 28 Sweden 720 13 France 1 110 22Belgium 850 11 Belgium 700 12 Belgium 800 16France 230 3 Netherlands 485 9 Austria 630 13Denmark 125 2 United Kingdom 475 8 Germany 385 8Other 365 5 Other 1 575 28 Other 630 13
(%) (%) (%)France 1 600 36 Germany 1 425 35 Germany 1 975 57Belgium 1 095 24 Belgium 580 14 Belgium 550 16Germany 665 15 Sweden 520 13 Sweden 490 14Sweden 635 14 Netherlands 495 12 France 260 8Austria 125 3 Finland 180 4 Netherlands 100 3Other 380 8 Other 915 22 Other 65 2
(%) (%) (%)Netherlands 1 190 38 Germany 875 29 Greece 740 27Sweden 920 30 United Kingdom 710 23 United Kingdom 630 23Germany 330 11 Sweden 320 11 Italy 355 13United Kingdom 165 5 Netherlands 270 9 France 295 11Belgium 125 4 Denmark 225 7 Germany 280 10Other 365 12 Other 635 21 Other 435 16
(%) (%) (%)France 995 51 France 1 245 68 France 630 35United Kingdom 500 26 Greece 195 11 Germany 415 23Germany 160 8 United Kingdom 110 6 Italy 290 16Cyprus 90 5 Italy 80 4 Austria 100 6Netherlands 85 4 Belgium 70 4 Belgium 80 5Other 115 6 Other 135 7 Other 255 14
(%) (%) (%)United Kingdom 300 17 France 785 46 France 575 36Italy 285 17 Belgium 330 19 United Kingdom 325 21France 265 15 Netherlands 215 12 Greece 165 10Germany 185 11 Germany 100 6 Germany 100 6Austria 125 7 Austria 75 4 Belgium 90 6Other 560 33 Other 205 12 Other 325 21
(%) (%) (%)France 340 22 France 965 69 Belgium 535 39Poland 260 17 Belgium 215 15 France 515 38Greece 235 15 United Kingdom 60 4 Germany 75 6Germany 180 11 Germany 45 3 Netherlands 70 5Lithuania 150 10 Spain 20 2 Italy 50 4Other 400 25 Other 95 7 Other 115 9
(%) (%) (%)Germany 515 40 Sweden 395 31 France 315 32Denmark 155 12 Germany 245 19 Germany 125 13Sweden 140 11 France 230 18 Austria 115 12Belgium 140 11 United Kingdom 210 17 United Kingdom 95 9Netherlands 60 5 Netherlands 135 10 Belgium 85 9Other 270 21 Other 65 5 Other 250 25
(%) (%) (%)Germany 230 25 Sweden 310 47 Italy 280 45United Kingdom 180 19 United Kingdom 135 20 Germany 130 21Cyprus 140 15 France 55 8 France 70 11Greece 135 14 Germany 50 7 Belgium 50 8Austria 105 11 Austria 40 6 Sweden 45 7Other 150 16 Other 75 11 Other 45 7
(%) (%) (%)United Kingdom 180 31 France 215 40 Germany 235 45France 180 30 Germany 170 31 Cyprus 115 22Netherlands 75 13 Sweden 75 14 United Kingdom 80 15Germany 40 7 Netherlands 25 5 Sweden 45 9Belgium 30 5 Belgium 25 4 Czech Republic 10 2Other 80 14 Other 35 7 Other 35 7
(%) (%) (%)Sweden 215 45 Sweden 260 56 France 440 98Belgium 95 20 Netherlands 55 12 Sweden 5 1Austria 45 10 France 50 10 Belgium 5 1France 35 7 Austria 20 5 Denmark * *Poland 20 4 Belgium 20 4 Germany * *Other 65 13 Other 60 13 Other * *
NON-EU
SERBIA - (RS) AFGHANISTAN - (AF) RUSSIA - (RU)
KOSOVO / UNSCR 1244 - (XK) IRAQ - (IQ) MK
SOMALIA - (SO) IRAN - (IR) PAKISTAN - (PK)
SRI LANKA - (LK) BANGLADESH - (BD) TURKEY - (TR)
NIGERIA - (NG) ARMENIA - (AM) CHINA - (CN)
GEORGIA - (GE) CD GUINEA - (GN)
SYRIAN ARAB REPUBLIC - (SY) ERITREA - (ER) ALGERIA - (DZ)
KYRGYZSTAN - (KG) MONGOLIA - (MN) HAITI - (HT)
INDIA - (IN) STATELESS BA
SUDAN - (SD) AZERBAIJAN - (AZ) VIETNAM - (VN)
Notes: '*' – represents 2 or fewer applicants recorded in the reference period CD – Congo, the Democratic Republic of the; BA- Bosnia and Herzegovina; MK – the former Yugoslav Republic of Macedonia Source: Eurostat (online data code: migr_asyappctzm)

18 5/2011 — Data in focus
Half of the Serbian asylum applicants in the EU-27 had lodged their application in Germany in Q4 2010 Figure 8a: Main groups of asylum applicants in the top 6 receiving countries1), 4th quarter 2010
Germany (15995 applicants)
Other37%
IR5%
IQ9%
AF11%
MK12%
RS26%
Belgium (8305 applicants)
XK13%
RS10%
RU10%
AF8%IQ
7%
Other52%
France (14430 applicants)
Other58%
CD7%
LK7%
RU8%
BD9%
XK11%
Sweden (9260 applicants)
RS24%
SO10%
AF8%
XK7%
IQ6%
Other45%
United Kingdom (6035 applicants)
IR12% PK
10%
LK8%
AF8%
ZW6%
Other56%
Netherlands (4320 applicants)
Other39%
AM5%
IR6% AF
11%
IQ11%
SO28%
1) Member States selected here are those with the highest number of asylum applicants registered during Q4 2010. Source: Eurostat (online data code: migr_asyappctzm)
Figure 8b: Distribution of the 6 main groups of asylum applicants in the EU-27 by receiving country, 4th quarter 2010
Serbia (7915 applications)
DE52%
Other9%BE
11%
SE28%
Afghanistan (5655 applications)
DE30%
SE13%BE
12%
NL9%
Other28%
UK8%
Russia (4940 applications)
PL28%
FR22%
BE16%
AT13%
DE8%
Other13%
XK (4505 applications)
FR36%
BE24%
DE15%
SE14%
Other11%
Iraq (4110 applications)
DE35%
BE14%
SE13%
NL12%
FI4%
Other22%
MK (3435 applications)
DE57%BE
16%
SE14%
FR8%
Other5%
1) Countries selected here are those with the highest number of asylum applicants registered during Q4 2010. Note: AF – Afghanistan; RS – Serbia; IQ – Iraq; SO – Somalia; MK – the former Yugoslav Republic of Macedonia; XK – Kosovo / UNSCR 1244; RU – Russia; CD – Congo, the democratic republic of; BD – Bangladesh; LK – Sri Lanka; AM – Armenia; IR - Iran; PK – Pakistan; ZW - Zimbabwe Source: Eurostat (online data code: migr_asyappctzm)

Data in focus — 5/2011 19
Nearly one out of four decisions issued at the first instance during Q4 2010 in the EU-27 was positive Table 9a: First instance decisions by citizenship in selected Member States1), 4th quarter 2010 (rounded figures)
Afghanistan 150 Iraq 105 XK 780 Iraq 685 Somalia 35 Afghanistan 230 Serbia 3 065Guinea 130 Afghanistan 95 Armenia 770 Iran 300 Eritrea 20 Russia 35 MK 1 965Iraq 90 Somalia 10 Russia 255 Afghanistan 155 Afghanistan 20 Nigeria 15 Afghanistan 705Other 450 Other 15 Other 2 120 Other 520 Other 30 Other 120 Other 5 645
Sri Lanka 130 Mali 80 XK 970 Iran 40 Somalia 450 Somalia 520 Afghanistan 280Russia 115 Guinea 35 Russia 760 Iraq 35 Afghanistan 130 Afghanistan 40 Iraq 260Eritrea 90 Somalia 20 Bangladesh 730 Somalia 20 Iraq 125 Iraq 30 Somalia 190Other 725 Other 70 Other 6 025 Other 130 Other 320 Other 180 Other 1 430
Iraq 140 Somalia 750 Afghanistan 40 Serbia 2 700 Iran 240 Afghanistan 85 Somalia 20 Iran 495Somalia 110 Eritrea 260 Stateless 25 Somalia 450 Eritrea 160 Zimbabwe 45 Iran 10 Pakistan 485Iran 50 Afghanistan 205 Somalia 20 MK 440 Sudan 140 Iran 40 Iraq 5 Sri Lanka 450Other 220 Other 145 Other 95 Other 3 535 Other 710 Other 205 Other 15 Other 3 165
Russia 240 Afghanistan 465 Afghanistan 60 Russia 1 130 Iraq 1 095 Somalia 1 450 Somalia 570 Serbia 6 650Iran 195 Iraq 175 Turkey 40 Nigeria 690 Iran 885 Afghanistan 1 000 Afghanistan 375 MK 2 910Afghanistan 150 Somalia 170 Nigeria 30 Afghanistan 555 Afghanistan 590 Iraq 485 Iraq 85 XK 2 825Other 625 Other 575 Other 380 Other 6 505 Other 4 190 Other 1 755 Other 885 Other 34 170
Not applicable
Not applicable
OTHER EU-27
SWEDEN UNITED KINGDOM
Refugee status Subsidiary protection
Humanitarian reasons Rejections
Refugee status Subsidiary protection
Humanitarian reasons Rejections Refugee status Subsidiary
protectionHumanitarian
reasons Rejections
Refugee status Subsidiary protection
Humanitarian reasons Rejections
FRANCE NETHERLANDS
Refugee status Subsidiary protection
Humanitarian reasons Rejections Refugee status Subsidiary
protectionHumanitarian
reasons Rejections
BELGIUM GERMANY
Refugee status Subsidiary protection
Humanitarian reasons Rejections Refugee status Subsidiary
protectionHumanitarian
reasons Rejections
1) Member States selected here are those with the highest number of first instance decisions issued during Q4 2010. Notes: XK – Kosovo / UNSCR 1244; MK – the former Yugoslav Republic of Macedonia Source: Eurostat (online data code: migr_asydcfstq)
Table 9a: First instance decisions by outcome across EU Members, 4th quarter 2010 (rounded figures)
Total decisions
Total positive decisions
Refugee status
Subsidiary protection
Humanitarian reasons Rejected
EU-27 59 910 13 360 6 760 4 685 1 915 46 550Belgium 4 975 1 050 825 225 - 3 925Bulgaria 135 25 * 25 - 105Czech Republic 145 60 20 35 5 85Denmark 900 325 180 95 50 580Germany 13 550 2 170 1 660 110 400 11 380Estonia 5 5 5 * - *Ireland 290 5 5 * - 285Greece 600 30 30 * 0 570Spain 780 205 60 140 5 575France 9 750 1 270 1 060 205 - 8 485Italy1) 3 020 980 310 365 310 2 035Cyprus 610 20 10 0 15 585Latvia 15 5 0 5 - 10Lithuania 110 5 0 5 - 110Luxembourg 135 15 15 * - 120Hungary 175 50 10 30 10 125Malta 40 15 5 10 5 25Netherlands 4 185 2 025 225 1 030 775 2 160Austria 3 155 870 485 385 - 2 285Poland 895 115 15 20 75 780Portugal 35 25 0 25 - 10Romania 175 40 15 30 0 135Slovenia 45 10 10 * - 35Slovakia 75 30 5 15 10 45Finland 635 265 45 195 25 365Sweden 9 185 2 060 525 1 355 180 7 125United Kingdom 6 285 1 685 1 255 375 50 4 600Iceland : : : : : :Liechtenstein 0 0 0 - 0 0Norway 3 615 1 310 950 225 135 2 305Switzerland 3 095 1 150 575 205 370 1 945 1) See country information notes. '-' – not applicable '*' – represents 2 or fewer first instance decisions recorded in the reference period Source: Eurostat (online data code: migr_asydcfstq)

20 5/2011 — Data in focus
Seven out of ten Somalis were granted a positive decision at first instance during Q4 2010
Table 9b: First instance decisions by Member States in selected groups of asylum applicants1), 4th quarter 2010 (rounded figures)
Belgium 40 Austria 5 Italy 20 Germany 3 065 Germany 155 Sweden 205 Germany 230 Germany 705France 15 Germany 10 Sweden 2 700 Belgium 150 Austria 160 Netherlands 40 UK 395Austria 5 Sweden 5 Belgium 225 Austria 80 Italy 155 Sweden 40 Netherlands 280Other 0 Other 0 Other 0 Other 655 Other 200 Other 480 Other 65 Other 970
Sweden 110 Sweden 750 Netherlands 520 Sweden 450 Austria 170 Austria 55 Germany 35 France 760UK 90 Netherlands 450 UK 20 Netherlands 190 France 115 Poland 20 Poland 20 Poland 505Germany 85 Finland 100 Sweden 20 Germany 135 Belgium 60 Finland 10 CZ * Austria 505Other 125 Other 150 Other * Other 220 Other 145 Other 25 Other 0 Other 920
Germany 685 Netherlands 125 Netherlands 30 Germany 660 Belgium 60 Austria 15 Sweden 15 France 970Sweden 140 Belgium 105 Italy 15 Netherlands 260 France 25 France 5 Germany 10 Belgium 780Belgium 90 Sweden 65 Sweden 15 Sweden 235 Austria 10 Italy * Italy 10 Germany 470Other 180 Other 190 Other 25 Other 480 Other * Other * Other * Other 610
UK 1 085 Sweden 325 Italy 255 France 6 515 Germany 1 660 Sweden 1 355 Netherlands 775 Germany 11 380France 800 Netherlands 320 Netherlands 180 Germany 6 085 UK 1 255 Netherlands 1 030 Germany 400 France 8 485Germany 685 UK 265 Germany 100 UK 3 950 France 1 060 Austria 385 Italy 310 Sweden 7 125Other 1 450 Other 700 Other 215 Other 12 855 Other 2 780 Other 1 915 Other 435 Other 19 560
OTHER NON-EU
Refugee status Subsidiary protection
Humanitarian reasons Rejections Refugee status Subsidiary
protectionHumanitarian
reasons Rejections
IRAQ - (IQ) KOSOVO / UNSCR 1244 - (XK)
Refugee status Subsidiary protection
Humanitarian reasons Rejections Refugee status Subsidiary
protectionHumanitarian
reasons Rejections
SOMALIA - (SO) RUSSIA - (RU)
Refugee status Subsidiary protection
Humanitarian reasons Rejections Refugee status Subsidiary
protectionHumanitarian
reasons Rejections
SERBIA - (RS) AFGHANISTAN - (AF)
Refugee status Subsidiary protection
Humanitarian reasons
Rejections Refugee status Subsidiary protection
Humanitarian reasons
Rejections
1) Countries selected here are those with the highest number of first instance decisions issued during Q4 2010. '*' – represents 2 or fewer first instance decisions recorded in the reference period. Note: UK – the United Kingdom Source: Eurostat (online data code: migr_asydcfstq)
Table 9b: First instance decisions by outcome across the 30 main groups of asylum applicants1) countries of citizenship in the EU-27, 4th quarter 2010 (rounded figures)
Total decisions
Total positive decisions
Refugee status
Subsidiary protection
Humanitarian reasons Rejected
Non-EU 59 910 13 360 6 760 4 685 1 915 46 550Serbia - (RS) 6 740 90 60 5 30 6 650Afghanistan - (AF) 4 310 1 965 590 1 000 375 2 350Somalia - (SO) 3 425 2 425 410 1 450 570 995Russia - (RU) 3 350 660 490 115 60 2 690Iraq - (IQ) 3 300 1 665 1 095 485 85 1 635Kosovo 2 990 165 100 20 45 2 825MK 2 925 15 5 * 10 2 910Iran - (IR) 2 560 1 045 885 125 35 1 515Armenia - (AM) 1 775 115 40 30 45 1 660Sri Lanka - (LK) 1 675 320 275 20 25 1 360Nigeria - (NG) 1 605 120 35 35 50 1 485Pakistan - (PK) 1 480 220 100 100 15 1 260China - (CN) 1 320 230 150 55 20 1 090Turkey - (TR) 1 320 215 140 25 50 1 105Eritrea - (ER) 1 285 835 425 385 30 450Syria 1 170 285 235 15 35 885Georgia - (GE) 1 095 45 25 10 15 1 050Guinea - (GN) 1 055 295 190 75 30 760Bangladesh - (BD) 1 025 25 10 5 10 1 000CD 970 200 155 30 20 765Algeria - (DZ) 760 25 15 5 5 735India - (IN) 705 10 * 5 5 695Stateless 575 195 135 30 30 380Sudan - (SD) 570 230 200 25 10 340Bangladesh - (BD) 505 25 5 * 15 480Azerbaijan - (AZ) 480 70 35 20 15 410Vietnam - (VN) 470 35 5 15 10 435Zimbabwe - (ZW) 430 135 90 45 0 295Mongolia - (MN) 425 15 5 5 5 410Haiti - (HT) 415 80 60 15 * 340Other 9 200 1 615 805 535 275 7 585 1) Countries selected here are those with the highest number of first instance decisions issued during Q4 2010. Notes: Kosovo – Kosovo / UNSCR 1244; CD – Congo, the Democratic Republic of the; MK – the former Yugoslav Republic of Macedonia; Syria – Syrian Arab Republic. '*' – represents 2 or fewer first instance decisions recorded in the reference period.: Source: Eurostat (online data code: migr_asydcfstq)

Data in focus — 5/2011 21
Nearly all first instance decisions issued to Serbians in the EU-27 in Q4 2010 were negative Figure 10a: First instance decisions by outcome, selected Member States and the EU-271), 4th
quarter 2010
Sweden (9185 decisions)
6%
15%
2%
77%
France (9750 decisions)
11%
2%
87%
Germany (13550 decisions)
12%
1%3%
84%
Belgium (4975 decisions)
17%
5%
78%
UK (6285 decisions)
20%
6%1%
73%
Netherlands (4185 decisions)
5%
25%
18%
52%
1) Member States selected here are those reporting the highest number of first instance decisions issued during Q4 2010. Note: UK – United Kingdom Source: Eurostat (online data code: migr_asydcfstq)
Figure 10b: First instance decisions in the EU-27 by outcome, selected citizenships1), 4th quarter 2010
Serbia (6740 decisions)
99%
1% 0%0%
Afghanistan (4310 decisions)
14%
23%
9%
54%
Somalia (3425 decisions)
12%
42%17%
29%
Russia (3350 decisions)
15%
3%2%
80%
Iraq (3300 decisions)
33%
15%3%
49%
XK (2990 decisions)
94%
1%2%
3%
1) Citizenships selected here are those for which the highest number of first instance decisions was issued during Q4 2010. Note: XK – Kosovo / UNSCR 1244. Source: Eurostat (online data code: migr_asydcfstq)
Refugee status Subsidiary protection Humanitarian reasons Rejections
Refugee status Subsidiary protection Humanitarian reasons Rejections

22 5/2011 — Data in focus
Methodology
DATA SOURCES
The data used for this publication are provided to Eurostat by the Ministries of Interior, Justice or immigration agencies of the Member States. Data are based entirely on relevant administrative sources. Apart from statistics on new asylum applicants, these data are supplied by Member States according to the provisions of Article 4 of the Regulation (EC) 862/2007 of 11 July 2007 on Community statistics on migration and international protection.
All data presented in this publication are rounded to the nearest 5. All data presented in this publication are provisional (except as otherwise stated) and may be a subject to change.
DEFINITIONS AND COVERAGE
'Asylum applicant' means a person having submitted an application for international protection or having been included in such application as a family member during the reference period. 'Application for international protection' means an application for international protection as defined in Art.2(g) of Council Directive 2004/83/EC, i.e. including requests for refugee status or for subsidiary protection status, irrespective of whether the application was lodged on arrival at border, or from inside the country, and irrespective of whether the person entered the territory legally (e.g. as a tourist) or illegally. In deciding when to regard an asylum application as having been lodged, the principles expressed in Article 4(1) of Council Regulation 2003/343/EC should be applied, i.e. 'An application for asylum shall be deemed to have been lodged once a form submitted by the applicant for asylum or a report prepared by the authorities has reached the competent authorities of the Member State concerned. Where an application is not made in writing, the time elapsing between the statement of intention and the preparation of a report should be as short as possible'. Applications submitted by persons who are subsequently found to be a subject of a Dublin procedure (Council Regulation (EC) No 343/2003) are included in the number of asylum applications. Within the same reference period every person being a subject of asylum application is counted only once, therefore repeat applications are not recorded if the first application has been lodged in the same reference period. However, such a repeat application will be recorded if lodged in a different reference month. It means that the aggregation of the monthly figures may overestimate the number of persons applying for international protection within the aggregated period (quarter or year). In some Member States (e.g. IT, MT) due to restrictions of the asylum procedure (e.g. time limits for lodging repeat application) repeat applications may be very rare. Therefore the number of new asylum applicants may equal or almost equal the number of asylum applicants. The number of asylum applicants and the number of first instance decisions during the same reference period differs. This is due to the time lag between the date of asylum application and the date of the decision on asylum application. The duration of this time lag may vary considerably depending on the national asylum procedure and the administrative workload. Asylum application lodged in one reference period may therefore result in a decision in a later period, while some asylum decisions reported for that period may relate to the applications lodged in previous reference periods.
'New asylum applicant' means a person having submitted an application for international protection for the first time. Applications submitted by persons who are subsequently found to be a subject of a Dublin procedure are included in the statistics on new asylum applicants if such persons are also a subject of first asylum application. All Member States are requested to supply these data but their provision is voluntary. As persons are counted once only, statistics on new asylum applicants may be used for preparation of annual aggregates.
Person being a subject of 'a pending application' means a person who is the subject of application for international protection under consideration by the responsible national authority at the end of the reference period. It includes the number of persons with pending applications at all instances of the administrative and/or judicial procedure.
'Rejected applicant' means a person covered by a first instance decision rejecting an application for international protection, including decisions considering applications as inadmissible or as unfounded and decisions under priority and accelerated procedures, taken by administrative or judicial bodies during the reference period.
'Person granted refugee status at first instance' means a person covered by a first instance decision granting refugee status, taken by administrative or judicial bodies during the reference period. Refugee status means status as defined in Art.2(d) of Directive 2004/83/EC within the meaning of Art.1 of the Geneva Convention relating to the Status of Refugees of 28 July 1951, as amended by the New York Protocol of 31 January 1967. According to the Art.2(c) of that Directive refugee means a third country national who, owing to a well-founded fear of being persecuted for reasons of race, religion, nationality, political opinion or membership of a particular social group, is outside the country of nationality and is unable or, owing to such fear, is unwilling to avail himself or herself of the protection of that country, or a stateless person, who, being outside of the country of former habitual residence for the same reasons as mentioned above, is unable or, owing to such fear, unwilling to return to it.
'Person granted subsidiary protection status at first instance' means a person covered by a first instance decision granting subsidiary protection status, taken by administrative or judicial bodies during the reference period. Subsidiary protection status means status as defined in Art.2(f) of Directive 2004/83/EC. According to the Art.2(e) of that Directive a person eligible for subsidiary protection means a third country national or a stateless person who does not qualify as a refugee but in respect of whom substantial grounds have been shown for believing that the person concerned, if returned to his or her country of origin, or in the case of a stateless person, to his or her country of

Data in focus — 5/2011 23
former habitual residence, would face a real risk of suffering serious harm and is unable, or, owing to such risk, unwilling to avail himself or herself of the protection of that country.
'Person granted authorisation to stay for humanitarian reasons at first instance' means a person covered by another first instance decision granting authorisation to stay for humanitarian reasons under national law concerning international protection, taken by administrative or judicial bodies during the reference period. It includes persons who are not eligible for international protection as currently defined law but are nonetheless protected against removal under the obligations that are imposed on all Member States by international refugee or human rights instruments or on the basis of principles flowing from such instruments. Examples of such categories include persons who are not removable on ill health grounds and unaccompanied minors.
'Dublin procedure' means a procedure according to the Council Regulation (EC) No 343/2003, establishing the criteria and mechanisms for determining the Member State responsible for examining an asylum application lodged in one of the Member States by a third-country national.
COUNTRY INFORMATION Until December 2009, statistics on asylum applications in Cyprus related to the number of administrative cases instead of individuals. This may result in underestimation of the actual number of applications, as one administrative case may cover several family members being a subject of this application.
Due to a technical error, the registered age of accompanied minors for application and decision statistics in Italy was the age of the principal applicant (e.g. father or mother) until February 2010 (included). This leads to an underestimation of the share of minor asylum applicants.
The number of rejections at first instance in Italy includes a number of recommendations to issue an authorization to stay for humanitarian reasons. These recommendations are issued by the National Asylum Commission to the Police. Such recommendation does not guarantee the grant of an authorization to stay for humanitarian reason, and therefore the number of first instance rejections is overestimated. Indeed, some individuals might be counted twice under the same reference period: first as a person rejected and recommended for an authorisation to stay for humanitarian reasons and subsequently as a person granted an authorisation to stay for humanitarian reasons.
According to the Maltese authorities, the drop in the number of asylum applicants registered at the beginning of 2010 resulted from a sudden decrease in the number of boats arriving from Libya.
ABBREVIATIONS Belgium (BE), Bulgaria (BG), Czech Republic (CZ), Denmark (DK), Germany (DE), Estonia (EE), Ireland (IE), Greece (EL), Spain (ES), France (FR), Italy (IT), Cyprus (CY), Latvia (LV), Lithuania (LT), Luxembourg (LU), Hungary (HU), Malta (MT), the Netherlands (NL), Austria (AT), Poland (PL), Portugal (PT), Romania (RO), Slovenia (SI), Slovakia (SK), Finland (FI), Sweden (SE), the United Kingdom (UK), Iceland (IS), Lichtenstein (LI), Norway (NO) and Switzerland (CH).
EU ASYLUM POLICY The Directorate-General for Home Affairs (DG HOME) is responsible for developing EU policies on asylum. For more information please see: http://ec.europa.eu/dgs/home-affairs/index_en.htm

Further information Eurostat Website: http://ec.europa.eu/eurostat Data on "Population and Social conditions, Asylum": http://epp.eurostat.ec.europa.eu/portal/page/portal/population/data/database (Select "International Migration and asylum" and "Asylum") Further information about "Population and social conditions": http://epp.eurostat.ec.europa.eu/portal/page/portal/population/introduction European Statistical Data Support: Contact details for this support network can be found on our Internet site: http://ec.europa.eu/eurostat/
Manuscript completed on: 21.03.2011 Data extracted on: 18.03.2011 ISSN 1977-0340 Catalogue number: KS-QA-11-005-EN-N © European Union, 2011