asx:wrm “a diversified exploration company now on the pathway …€¦ · the presentation (in...
TRANSCRIPT

ldquoA diversified exploration company now on the pathway to productionrdquo
March 2017
ASXWRM
White Rock Minerals Ltd ASXWRM March 2017 2
Disclaimer The presentation (in this projected form and as verbally presented) (ldquoPresentationrdquo) has been prepared by White Rock Minerals Limited and is provided on the basis that none of the Company nor its respective officers shareholders related bodies corporate partners affiliates employees representatives and advisers make any representation or warranty (express or implied) as to the accuracy reliability relevance or completeness of the material contained in the Presentation and nothing contained in the Presentation is or may be relied upon as a promise representation or warranty whether as to the past or the future The Company hereby excludes all warranties that can be excluded by law
The Presentation contains prospective financial material which is predictive in nature and may be affected by inaccurate assumptions or by known or unknown risks and uncertainties and may differ materially from results ultimately achieved
The Presentation contains ldquoforward-looking statementsrdquo All statements other than those of historical facts included in the Presentation are forward-looking statements Where the Company expresses or implies an expectation or belief as to future events or results such expectation or belief is expressed in good faith and believed to have a reasonable basis However forward-looking statements are subject to risks uncertainties and other factors which could cause actual results to differ materially from future results expressed projected or implied by such forward-looking statements Such risks include but are not limited to gold and other metals price volatility currency fluctuations increased production costs and variances in ore grade or recovery rates from those assumed in mining plans as well as political and operational risks and governmental regulation and judicial outcomes The Company does not undertake any obligation to release publicly any revisions to any ldquoforward-looking statementrdquo
The Presentation contains general background information about the Company and its activities current as at the date of this presentation The information in this Presentation is in summary form only and does not contain all the information necessary to fully evaluate any transaction or investment It should be read in conjunction with the Companyrsquos other periodic and continuous disclosure announcements lodged with the ASX which are available at wwwasxcomau and other publicly available information on the Companyrsquos website at wwwwhiterockmineralscomau
The information in this presentation that relates to Exploration Results is based on information compiled by Mr Rohan Worland who is a Member of the Australian Institute of Geoscientists Mr Worland is engaged by White Rock Minerals Ltd as a technical consultant Mr Worland has sufficient experience which is relevant to the style of mineralisation and type of deposit under consideration and to the activity which he is undertaking to qualify as a Competent Person as defined in the 2012 Edition of the lsquoAustralasian Code for Reporting of Exploration Results Mineral Resources and Ore Reservesrsquo The Exploration Potential described in this Presentation is conceptual in nature and there is insufficient information to establish whether further exploration will result in the determination of a Mineral Resource Mr Worland consents to the inclusion in this Presentation of the matters based on his information in the form and context in which it appears
The gold and silver Resource figures for Strauss Kylo Lady Hampden Silver King White Rock White Rock North and Red Rock have been taken from resource estimates prepared by Ravensgate Minerals Industry Consultants on behalf of White Rock Minerals Ltd and authored by Mr Don Maclean who is a professional geologist with more than 10 yearsrsquo experience in resource estimation Mr Maclean is a Competent Person as defined by the JORC Code and consents to the inclusion in this Presentation of references to this resource estimate in the form and context in which they appear
The gold and silver Resource figures for Guy Bell have been taken from the resource estimate report dated 1 October 2008 prepared by Mining One Pty Ltd on behalf of Rex Minerals Ltd and authored by Dr Chris Gee who is a professional geologist with more than 10 yearsrsquo experience in resource estimation Dr Gee is a Competent Person as defined by the JORC Code and consents to the inclusion in this Presentation of references to this resource estimate in the form and context in which they appear
The Resources figures have not been updated since to comply with the JORC Code 2012 on the basis that the information has not materially changed since it was last reported
The pit optimisation study used a Mineral Resource made up of a combination of Indicated and Inferred Resource blocks There is a low level of geological confidence associated with Inferred Mineral Resources and there is no certainty that further exploration work will result in the determination of Indicated Mineral Resources or that the production target itself will be realised
We have estimated the resources reported in this Presentation in accordance with the Australasian Code for Reporting of Identified Mineral Resources and Ore Reserves 2004 Edition (JORC Code) which governs such disclosure by companies listed on the Australian Securities Exchange
White Rock Minerals Ltd ASXWRM March 2017
1Overview of White Rock Minerals
2The Opportunity
3The Right Commodities
4The Investment Motivation
5White Rock Assets
Mount Carrington New South Wales
Red Mountain Alaska
Appendices
3
Why invest in White Rock
White Rock Minerals Ltd ASXWRM March 2017
Capital Structure ASX Code WRM Fully paid shares on issue 8707M
- Options unlisted 1774M Share price range (12 months) 1c ndash 3c Market Cap ( ~15cshare) $130M Cash on hand (Dec 2016) $38M Debt $Nil
Top 20 Shareholders (as at end February 2017) bull Avalon Ventures 91 bull CRH 88 bull Citicorp Noms 79 bull Suetone PL 50 Top 20 552
PROJECTS Mt Carrington Gold and Silver
JORC Resource on an ML and with an advanced Scoping Study
Red Mountain Zinc and Silver Advanced exploration
White Rock Minerals ndash who we are
4
White Rock Minerals Ltd ASXWRM March 2017
Brian Phillips Non Executive Chairman AWASM (Mining) FAusIMM C Eng
Mining Engineer 45 years operational and corporate experience Founding Director Chairman ndash Panoramic Resources Ltd (Ni-Au-PGM)
Peter Lester Non-Executive Director BE (Mining) MAusIMM MAICD
Mining Engineer 40 years operational and corporate experience Director since April 2013 Non-Exec Director of Nord Gold NV (Au) Non-Exec Director of Millennium Minerals Ltd (Au) Chairman Kidman Resources (Au amp Li)
Ian Smith Non-Executive Director BE (Hons Mining) BF in Admin FIEAust FAusIMM
Mining Engineer 40 years technical operational financial and strategic expertise Joined the Board in 2017
Matt Gill MD amp CEO BEng (Hons Mining) MEngSc FAusIMM GAICD
Mining Engineer 35 years operational technical project development and corporate experience as a GM COO CEO and MD in Australia and overseas (PNG India Bolivia Ghana and Myanmar) Non-Exec Director of Mantle Mining Corp (Au)
5
White Rock Board
White Rock Minerals Ltd ASXWRM March 2017
Great Project Locations
6
Mount Carrington New South Wales Gold and Silver development asset JORC resources 338000 ounces of gold and 234 million ounces silver Definitive Feasibility Study step commenced Projected free cash flow expected to be gt$100M 230km south of Brisbane Extensive mining infrastructure in place Drill-ready exploration targets identified to expand and or extend mine life
Red Mountain Alaska (Atlas Resources) Polymetallic VMS deposit (Zinc-Silver-Lead-Gold-Copper) 100km south of Fairbanks close to extensive mining infrastructure Mining friendly jurisdiction Significant potential exploration upside in a highly prospective yet under-
explored district Outstanding grades from near surface Significant potential to expand the zinc-silver VMS camp size
The Mt Carrington project hosts JORC estimates of Inferred and Indicated resources ndash refer cautionary statement on slide 2
Refer to WRM release to the ASX of 20 October 2016 - Initial Mining review demonstrates significant upside potential at Mt Carrington The material assumptions relating to the scoping study at Mt Carrington provided in Annexure A of the ASX Announcement dated 20 October 2016 continue to apply and have not materially changed
White Rock Minerals Ltd ASXWRM March 2017 7
Whi
te R
ock
Note- White Rock JORC Resource is 338000 ozs gold and 234m ozs silver Gold Equivalent calculated using a SilverGold ratio of 70
Source- March 2017 With White Rock superimposed
Under-valued Relative to our Peers
White Rock Minerals Ltd ASXWRM March 2017 8
ldquoIt Might Be Time to Grab the Commodities Bull by the Hornsrdquo
January 25 2017 Frank Holmes US Global Investors
White Rock Minerals Ltd ASXWRM March 2017 9
Gold Silver and Zinc ndash Leverage to rising markets
January 25 2017 Frank Holmes US Global Investors
White Rock has exposure to a suite of well performing commodities- Gold Silver Zinc
White Rock Minerals Ltd ASXWRM March 2017
Great exposure to Gold and Silver
10
GOLD The 2016 Scoping Study1 used A$1600oz Every A$100oz movement = another A$10M in free cash flow over the initial 7-Year Life of Mine
SILVER The 2016 Scoping Study1 used A$22oz Every A$1oz movement = another A$6M in free cash flow over the initial 7-year Life of Mine
1 Refer to WRM release to the ASX of 20 October 2016 - Initial Mining review demonstrates significant upside potential at Mt Carrington The material assumptions relating to the scoping study at Mt Carrington provided in Annexure A of the ASX Announcement dated 20 October 2016 continue to apply and have not materially changed
White Rock Minerals Ltd ASXWRM March 2017
Investment Motivation
Opportunity to be a part of a growing gold amp silver company
Significant value uplift potential ndash excellent exposure to the strong Australian gold price with upside to silver and zinc
Geological geographical and commodity diversification for investors
Near term cash flow from Mt Carrington is expected to fund mine expansion and mine life extensional drilling at Mt Carrington and high impact exploration at Red Mountain
Well credentialed and highly regarded management team and board
First 3 years of gold production from two pits at Mt Carrington already pre-stripped
Red Mountain has the potential to yield discoveries with high grade zinc and silver VMS intersections with unrealised gold discovery potential
Exploration campaigns and advancing the DFS should generate high levels of news flow
11
White Rock Minerals Ltd ASXWRM March 2017
Gold and Silver development asset with a definitive feasibility study (DFS) commenced
12
Mount Carrington New South Wales
Low capex (~A$35M inc DFS amp EIS) Initial 7-year Mine Life 10 month payback ~A$100M free cash flow expected to be generated
Refer to WRM release to the ASX of 20 October 2016 - Initial Mining review demonstrates significant upside potential at Mt Carrington The material assumptions relating to the scoping study at Mt Carrington provided in Annexure A of the ASX Announcement dated 20 October 2016 continue to apply and have not materially changed
White Rock Minerals Ltd ASXWRM March 2017
White Rock today White Rock Minerals cornerstone asset ndash Mt Carrington
100 owned gold and silver DFS-ready project Located in northern NSW Australia
JORC Resources of 338000 ounces of gold and 234M ounces of silver All deposits commence at surface Multiple shallow targets on Mining Leases Potential for high grade gold-silver at depth
and copper porphyry mineralisation
The Mt Carrington project hosts JORC estimates of Inferred and Indicated resources ndash refer cautionary statement on slide 2
13
White Rock Minerals Ltd ASXWRM March 2017
Mt Carrington Site Layout
14
Lismore 100km gt lt Tenterfield 50km
Key Infrastructure in place to support future mining Valued at ~A$20M Reduces development risk timeframe and capital cost Granted Mining Leases
15Mt Tailings Dam
750ML Freshwater Dam
Site Office
RO Water treatment plant
Access to State grid power
White Rock Minerals Ltd ASXWRM March 2017 15
Mt Carrington Mine Plan
Strategy based on a 2-stage open pit mining scenario ndash gold first then silver bull The 2016 Updated Scoping Study Mine Plan-
bull Stage 1- Mining the higher confidence gold resources - Strauss and Kylo deposits (in-pit Resources 67 Indicated 33 Inferred)
bull These first two production sources already pre-stripped
bull Stage 2- Mining the silver-rich resources - Lady Hampden White Rock and Silver King deposits (in-pit Resources 69 Indicated 31 Inferred)
Stage 1 (first 35 years) gold-only development has a number of low risk advantages including
bull Lower Capex bull Simple flowsheet and salable product (gold dore) bull Faster timeline to production
Strauss ndash Global Resource 25Mt 14gt Au (113k oz Au)
Refer to Mineral Resources table on page 30 of this presentation for full Resource figures Refer to WRM release to the ASX of 16 September 2014 ndash 2014 Scoping Study
White Rock Minerals Ltd ASXWRM March 2017 16
Mt Carrington Mine Plan
A review of mining1 has advanced the initial design of the mine pits site layout waste dumps and mine scheduling
A key element of the current Feasibility Study is to investigate a range of parameters to maximise the economic returns from the Project-
Plant throughputs between 800000 to 1200000 tonnes per annum Reduced mining and processing costs as a result of this increased
throughput An increased gold equivalent2 production profile up to and
exceeding 40000oz per annum initially Whilst still retaining an initial 6 to 7 year mine life
1 Refer to WRM release to the ASX of 20 October 2016 - Initial Mining review demonstrates significant upside potential at Mt Carrington
2 Gold equivalent production target calculations use the assumptions (gold price silver price and metal recoveries) provided in Annexure A of the 20 October 2016 ASX Release The price assumptions are A$1600oz for gold and A$22oz for silver The formula for gold equivalent calculations is gold produced plus silver produced times 22 divided by 1600 (the A$ price assumptions for silver and gold respectively) White Rock considers that both gold and silver have reasonable potential to be recovered and sold
300 metres
White Rock Minerals Ltd ASXWRM March 2017 17
Mt Carrington Processing Plant
Refer to WRM release to the ASX of 29 March 2016 - White Rockrsquos Mt Carrington Updated Scoping Study Delivers Justification For Feasibility Study
ROM Pad Primary Crusher
Coarse Ore Stockpile
CIL Circuit
Grinding Circuit
Flotation
Gold Room
Workshop
bull Preliminary flow sheet considers a standard crushing amp grinding circuit a flotation step and then CIL
bull The 3-D Plant model considers using the existing cleared old plant site and existing foundations also
bull One simple flotation ndash CIL plant suitable for gold silver and potentially copper
This provides for significant design and construction capital cost savings
White Rock Minerals Ltd ASXWRM March 2017
Project Overview- Mt Carrington
18
Advanced scoping study updated March 2016- JORC Inferred and Indicated Resources An 18 to 24 month DFS and Permitting period
followed by a one year construction period Approved Mining Licence Compelling Financial metrics-
Low CAPEX entry cost (A$242M) A$100M in free cash expected to be
generated to fund possible mine expansions and broader exploration
Simple open pit and processing operation focused initially on gold production to provide a low risk quick route to positive cash flow
Parameter 2016 Study Update Summary
Proposed development Two gold dominant pits and three silver dominant pits
Production ndash Gold Ounces 111000 Production ndash Silver Ounces 6700000 Life of Mine (years) 70 A$ Gold price A$ Silver price
A$1600 oz A$22 oz
Pre-tax Net Present Value (NPV10) A$606M
Free cash flow (undiscounted) A$1002M
Internal Rate of Return (IRR) 103
C1 Cash Cost (A$Oz Gold Eq) A$754oz C1 Cash Cost (A$Oz Silver Eq) A$1040oz Initial Capital payback 10 months Capital Cost A$242M
Refer to WRM release to the ASX of 20 October 2016 - Initial Mining review demonstrates significant upside potential at Mt Carrington The material assumptions relating to the scoping study at Mt Carrington provided in Annexure A of the ASX Announcement dated 20 October 2016 continue to apply and have not materially changed
White Rock Minerals Ltd ASXWRM March 2017
Significant Potential for upside
19
1 Mine Plan amp Pit Geotech optimisation
2 Second hand plant ndash time and cost savings potential
3 Concentration ratio improvements
4 Flow sheet recovery optimisation
5 Resource drilling to expand and or extend mine life
White Rock Minerals Ltd ASXWRM March 2017
Proposed Funding for Construction
20
Long-term Strategic Partner New-York based Cartesian Royalty Holdings (ldquoCRHrdquo)
Gold streaming financing Term Sheet contemplated to move the Mt Carrington project directly into construction commissioning and commercial production subject to a successful Definitive Feasibility Study (DFS) and the necessary approvals
Phase 1- Equity investment of A$1000000 in two equal tranches to fund working capital and to contribute funding to progress its DFS and Environmental Impact Statement (EIS) activities) and
Phase 2- a future streaming financing of US$19 million over a 12 month period in return for a share of gold and silver production to fund working capital and construction and commissioning of the Mt Carrington Project
Supporting White Rock to achieve its strategic goal of becoming a successful gold and silver producer
Binding and Conditional The Transactions contemplated by the Term Sheet are subject to various conditions including the completion of due diligence to the satisfaction of CRH certain White Rock shareholder approvals and the entry into definitive documentation for Phase 2 (streaming financing) as set out in more detail in the ASX announcement of 27 June 2016 Tranches One and Two completed
White Rock Minerals Ltd ASXWRM March 2017
Project Metrics including the CRH Financing
21
CRH Streaming Financing Cost- a minimum of 40000 ounces of gold equivalent over a 7-year period (at a minimum of 20 of its annual production) The Financial Metrics in the Scoping Study as a result of this financing are- Mt Carrington expected to still generate A$54M in free cash flow over its initial 7-year mine life
with a project NPV10 of A$374M At previous 2016 spot prices (A$1750oz Au and A$25oz Ag)-
free cash flow is ~A$81M (up 50) with a project NPV10 of A$539M (up 44) White Rock maintains 100 ownership of the asset White Rock can advance its exciting zinc-silver VMS Project in Alaska The proposed gold streaming financing arrangement is non-dilutive to shareholders White Rock gains a cornerstone strategic partner for the 9+ year journey WRM joins a stable of other gold investments made by CRH ndash ASX listed Orinoco TSX-V listed K92 Mining TSX-V listed Equitas Resources and TSX-V Sage Gold Inc
White Rock Minerals Ltd ASXWRM March 2017 22
Red Mountain Alaska
Advanced Zinc-Silver-Lead-Gold VMS Exploration Project
White Rock Minerals Ltd ASXWRM March 2017
Red Mountain Project
Red Mountain Alaska polymetallic VMS deposit ndash advanced exploration asset with
significant potential exploration upside Located in central Alaska 100km south of Fairbanks in the
Bonnifield Mining District Acquired from Atlas Resources - White Rock has expanded the
tenement package to comprise 224 mining claims over a total area of 143kmsup2
Contains polymetallic VMS mineralisation rich in zinc silver and lead with previous exploration defining mineralisation at the two main prospects (Dry Creek and West Tundra Flats)
No exploration since 1999 Project held privately for the last decade
Red Mountain
Red Mountain Location
Alaska
Refer to WRM release to the ASX of 15 February 2016 - White Rock Minerals Propose to Acquire VMS Project in Alaska
23
White Rock Minerals Ltd ASXWRM March 2017
Polymetallic VMS project ndash zinc and silver rich Discovered in 1975 ndash sulphide outcrop Historic exploration from 1975-1999 Two deposits discovered
Discovery Fosters (Red Mountain) West Tundra Flats (WTF)
Mineralisation from surface Good preliminary metallurgical test work results with
recoveries gt90 zinc gt70 lead gt80 gold gt70 Ag 143kmsup2 land position established ndash highly prospective
Historic Work ndash Resource Potential
24
Dry Creek 46m 235 Zn 531gt Ag 85 Pb 15gt Au amp 10 Cu from 61m
55m 259 Zn 346gt Ag 117 Pb 25gt Au amp 09 Cu from 695m
71m 151 Zn 334gt Ag 68 Pb 09gt Au amp 03 Cu from 391m
West Tundra Flats
13m 210 Zn 796gt Ag 92 Pb 102gt Au amp 06 Cu from 586m
30m 73 Zn 796gt Ag 43 Pb 11gt Au amp 02 Cu from 1609m
17m 114 Zn 372gt Ag 60 Pb 17gt Au amp 02 Cu from 1043m
1st JORC 2012 Resource Estimate currently being done
White Rock Minerals Ltd ASXWRM March 2017
Priority Conductivity Targets
25
Conductivity targets prioritised by geochemistry bull Geochemical alteration proximal to VMS mineralisation bull Direct base metal and precious metal anomalies
Existing deposits
Identified 30 targets
White Rock Minerals Ltd ASXWRM March 2017
Indicative Activity Timeline
26
2017 2018 2019 2020
Stage 2 ndash Silver
Stage 1 - Gold Feasibility Study 12 months Production
Construction amp Commissioning
12 months
Gold amp Silver LoM Extension
Red Mountain Exploration
Life-of-Mine Extensional and
Exploration Drilling
Phase 2 Field Studies ndash geochem geophysics
3 years after Gold Production
Phase 3 Target identification amp Drilling
Phase 1 Data collation and
JORC Resource
EIS Studies amp Permitting 18 to 24 months
White Rock Minerals Ltd ASXWRM March 2017
Low cost gold silver start-up opportunity DFS commenced for its cornerstone Mt Carrington Project-
Robust initial 7-year operation Low capital cost (ltA$30M) with ~A$20M in infrastructure already in place Less than one year payback Shallow low strip ratio mineralisation C1 cash costltA$800oz AuEq NPV10 of ~A$60M an IRR of 103 and free cash of ~A$100M expected (pre financing)
Key terms for a conditional fully funded construction financing package agreed Experienced Board and Management Geological geographical and commodity diversification for investors Significant potential for resource expansions and new discoveries Exciting high-grade zinc and silver VMS potential in Alaska
LOOKING AHEAD
27
Refer to WRM release to the ASX of 20 October 2016 - Initial Mining review demonstrates significant upside potential at Mt Carrington The material assumptions relating to the scoping study at Mt Carrington provided in Annexure A of the ASX Announcement dated 20 October 2016 continue to apply and have not materially changed
White Rock Minerals Ltd ASXWRM March 2017 28
Appendices bull Mt Carrington Exploration Upside bull Mt Carrington Resource Statement bull Red Mountain Back-up Information
White Rock Minerals Ltd ASXWRM March 2017
Mt Carrington ndash Exploration upside
29
Over 180km2 of tenements highly prospective for epithermal and intrusion-related gold silver and copper mineralisation Priority Near-Mine Targets 1 Mining Leases Potential Resource Additions
Multiple shallow targets Historic drill intercepts for follow-up High grade underground potential poorly tested
2 Exploration Licences Silver-Gold-Copper Targets
Pipeline of prospects Drill ready targets based on
bull Mapping bull Geochemcial anomalies bull Geophysical IPresistivity anomalies
3 Porphyry Potential Zoned Copper-Gold-Silver Robust intrusion related copper model at Mt Carrington Strong secondary copper in shallow drilling Large open geophysical IP anomalies with confirmed alteration
source Under-drilled Similar zoned Copper-Gold-Silver systems recognised at White
Rock and Red Rock
White Rock Minerals Ltd ASXWRM March 2017 30
Resources reported in accordance with the JORC (2004) code
MT CARRINGTON JORC (2004) MINERAL RESOURCES ndash JANUARY 2015 Silver Dominant Resources
Resource Category Deposit Tonnes Gold grade (gt) Gold ounces Silver grade
(gt) Silver
ounces
Indicated Lady Hampden 1840000 06 37000 69 4056000
White Rock 1710000 - - 77 4214000 Sub-Total 3550000 03 37000 72 8270000
Inferred
Lady Hampden 2470000 03 27000 51 4023000 White Rock 2660000 - - 47 3978000
White Rock North 3180000 - - 52 5314000 Silver King 640000 - - 59 1218000 Sub-Total 8950000 01 27000 51 14533000
Total
Lady Hampden 4310000 05 64000 58 8079000 White Rock 4370000 - - 58 8192000
White Rock North 3180000 - - 52 5314000 Silver King 640000 - - 59 1218000
Total 12500000 02 64000 57 22803000 Gold Dominant Resources
Resource Category Deposit Tonnes Gold grade (gt) Gold ounces Silver grade
(gt) Silver ounces
Indicated Strauss 1240000 14 57000 38 153000
Kylo 1590000 12 59000 26 133000 Sub-Total 2830000 13 116000 31 286000
Inferred
Strauss 1260000 14 56000 26 104000 Kylo 760000 15 35000 18 43000
Red Rock 1630000 10 54000 35 182000 Guy Bell 160000 25 13000 49 24000
Sub-Total 3810000 13 158000 29 353000
Total
Strauss 2500000 14 113000 32 257000 Kylo 2350000 13 95000 23 176000
Red Rock 1630000 10 54000 35 182000 Guy Bell 160000 25 13000 49 24000
Total 6640000 13 275000 30 639000 Total Resources
Category Tonnes Gold ounces Silver ounces Indicated 6380000 153000 8556000 Inferred 12760000 185000 14886000
Total 19140000 338000 23442000
Mount Carrington Resource Statement
The Resources figures are currently being updated to comply with the JORC Code 2012 as a part of the Definitive Feasibility Study currently underway
White Rock Minerals Ltd ASXWRM March 2017
Alaska is an exploration and mining friendly state bull Well developed history of gold and base metal mining bull Stable and attractive tax regime bull Efficient permitting
Central Alaska location ~100km to the south of Fairbanks
Good location with respect to infrastructure and logistics
bull Major road and rail access located 80km to the west bull Connection to port of Anchorage (400km south) bull Access from Fairbanks via helicopter or fixed wing aircraft bull Access to fresh water bull No community or environmental legacy issues bull Established mining hub at Fairbanks services mines
including Pogo Fort Knox and Usibelli
Project Overview- Red Mountain Alaska
32km State Claims
Alaska
Pogo Gold Mine
Red Mountain ndash Project Location
31
White Rock Minerals Ltd ASXWRM March 2017
Red Mountain Geology and Mineralisation Red Mountain ndash Regional Geology
World class deposits with similar siliciclastic felsic associations to the Bonnifield district include- Rio Tinto (Cu-Zn-Pb-Au-Ag Spain) Brunswick 12 (Zn-Pb-Ag Canada) and Eskay Creek (Au-Ag-Zn-Pb Canada)
Analysis of worldwide VMS deposits of this type indicate
promising exploration potential for Red Mountain- The deposits nearly always occur in clusters The presence and spatial relationships of the two
separate deposits at Red Mountain may prove to be a significant exploration vector for discovery of further deposits
32
White Rock Minerals has engaged world-renowned VMS expert Dr Jim Franklin to assist with assessing the prospectivity of the district and targeting additional mineralisation
White Rock Minerals Ltd ASXWRM March 2017
HOLE ID From (m)
To (m)
Interval (m) Zn Pb Cu Ag gt Au gt
DC76-02 386 503 116 529 216 022 112 NA DC97-01 411 524 113 760 318 026 115 099 including 411 428 17 2001 852 062 266 147 DC97-04 625 750 125 1251 552 071 160 114 including 695 750 55 2589 1172 088 346 246 DC97-14 570 753 183 139 023 208 15 024 including 591 634 43 006 004 675 15 004 DC97-30 177 209 32 919 472 041 226 116 DC97-31 290 314 24 1272 645 035 1061 382 DC97-32 279 339 61 1443 683 036 137 061 including 303 334 31 2008 952 052 169 078 DC97-33 391 462 71 1512 681 030 334 086 DC98-38 590 680 90 540 243 015 269 100 including 615 638 23 1324 582 030 581 307 DC98-39 776 988 212 699 320 019 57 038 including 776 890 114 1038 478 028 56 051 with 776 826 50 1774 780 045 64 045 DC98-40 61 422 361 624 256 022 183 103 Including 61 107 46 2354 845 102 531 153 including 213 245 31 1465 665 025 211 053 DC98-60 176 865 689 402 188 010 58 036 including 538 588 49 1017 496 028 86 039 WTF82-05 1043 1061 17 1140 597 015 374 171 WTF82-08 1609 1640 30 728 427 017 796 112 WTF83-17 586 599 13 2092 917 056 796 1022
Gold and silver intercepts indicate
significant by-product potential
Multiple shallow intercepts indicate
potential for stacked high-grade lodes
Drilling at Discovery and Fosters Zones
ceased in 1999
Historic Drilling
33
Drilling at West Tundra Flats ceased
in 1983

White Rock Minerals Ltd ASXWRM March 2017
Great Project Locations
6
Mount Carrington New South Wales Gold and Silver development asset JORC resources 338000 ounces of gold and 234 million ounces silver Definitive Feasibility Study step commenced Projected free cash flow expected to be gt$100M 230km south of Brisbane Extensive mining infrastructure in place Drill-ready exploration targets identified to expand and or extend mine life
Red Mountain Alaska (Atlas Resources) Polymetallic VMS deposit (Zinc-Silver-Lead-Gold-Copper) 100km south of Fairbanks close to extensive mining infrastructure Mining friendly jurisdiction Significant potential exploration upside in a highly prospective yet under-
explored district Outstanding grades from near surface Significant potential to expand the zinc-silver VMS camp size
The Mt Carrington project hosts JORC estimates of Inferred and Indicated resources ndash refer cautionary statement on slide 2
Refer to WRM release to the ASX of 20 October 2016 - Initial Mining review demonstrates significant upside potential at Mt Carrington The material assumptions relating to the scoping study at Mt Carrington provided in Annexure A of the ASX Announcement dated 20 October 2016 continue to apply and have not materially changed
White Rock Minerals Ltd ASXWRM March 2017 7
Whi
te R
ock
Note- White Rock JORC Resource is 338000 ozs gold and 234m ozs silver Gold Equivalent calculated using a SilverGold ratio of 70
Source- March 2017 With White Rock superimposed
Under-valued Relative to our Peers
White Rock Minerals Ltd ASXWRM March 2017 8
ldquoIt Might Be Time to Grab the Commodities Bull by the Hornsrdquo
January 25 2017 Frank Holmes US Global Investors
White Rock Minerals Ltd ASXWRM March 2017 9
Gold Silver and Zinc ndash Leverage to rising markets
January 25 2017 Frank Holmes US Global Investors
White Rock has exposure to a suite of well performing commodities- Gold Silver Zinc
White Rock Minerals Ltd ASXWRM March 2017
Great exposure to Gold and Silver
10
GOLD The 2016 Scoping Study1 used A$1600oz Every A$100oz movement = another A$10M in free cash flow over the initial 7-Year Life of Mine
SILVER The 2016 Scoping Study1 used A$22oz Every A$1oz movement = another A$6M in free cash flow over the initial 7-year Life of Mine
1 Refer to WRM release to the ASX of 20 October 2016 - Initial Mining review demonstrates significant upside potential at Mt Carrington The material assumptions relating to the scoping study at Mt Carrington provided in Annexure A of the ASX Announcement dated 20 October 2016 continue to apply and have not materially changed
White Rock Minerals Ltd ASXWRM March 2017
Investment Motivation
Opportunity to be a part of a growing gold amp silver company
Significant value uplift potential ndash excellent exposure to the strong Australian gold price with upside to silver and zinc
Geological geographical and commodity diversification for investors
Near term cash flow from Mt Carrington is expected to fund mine expansion and mine life extensional drilling at Mt Carrington and high impact exploration at Red Mountain
Well credentialed and highly regarded management team and board
First 3 years of gold production from two pits at Mt Carrington already pre-stripped
Red Mountain has the potential to yield discoveries with high grade zinc and silver VMS intersections with unrealised gold discovery potential
Exploration campaigns and advancing the DFS should generate high levels of news flow
11
White Rock Minerals Ltd ASXWRM March 2017
Gold and Silver development asset with a definitive feasibility study (DFS) commenced
12
Mount Carrington New South Wales
Low capex (~A$35M inc DFS amp EIS) Initial 7-year Mine Life 10 month payback ~A$100M free cash flow expected to be generated
Refer to WRM release to the ASX of 20 October 2016 - Initial Mining review demonstrates significant upside potential at Mt Carrington The material assumptions relating to the scoping study at Mt Carrington provided in Annexure A of the ASX Announcement dated 20 October 2016 continue to apply and have not materially changed
White Rock Minerals Ltd ASXWRM March 2017
White Rock today White Rock Minerals cornerstone asset ndash Mt Carrington
100 owned gold and silver DFS-ready project Located in northern NSW Australia
JORC Resources of 338000 ounces of gold and 234M ounces of silver All deposits commence at surface Multiple shallow targets on Mining Leases Potential for high grade gold-silver at depth
and copper porphyry mineralisation
The Mt Carrington project hosts JORC estimates of Inferred and Indicated resources ndash refer cautionary statement on slide 2
13
White Rock Minerals Ltd ASXWRM March 2017
Mt Carrington Site Layout
14
Lismore 100km gt lt Tenterfield 50km
Key Infrastructure in place to support future mining Valued at ~A$20M Reduces development risk timeframe and capital cost Granted Mining Leases
15Mt Tailings Dam
750ML Freshwater Dam
Site Office
RO Water treatment plant
Access to State grid power
White Rock Minerals Ltd ASXWRM March 2017 15
Mt Carrington Mine Plan
Strategy based on a 2-stage open pit mining scenario ndash gold first then silver bull The 2016 Updated Scoping Study Mine Plan-
bull Stage 1- Mining the higher confidence gold resources - Strauss and Kylo deposits (in-pit Resources 67 Indicated 33 Inferred)
bull These first two production sources already pre-stripped
bull Stage 2- Mining the silver-rich resources - Lady Hampden White Rock and Silver King deposits (in-pit Resources 69 Indicated 31 Inferred)
Stage 1 (first 35 years) gold-only development has a number of low risk advantages including
bull Lower Capex bull Simple flowsheet and salable product (gold dore) bull Faster timeline to production
Strauss ndash Global Resource 25Mt 14gt Au (113k oz Au)
Refer to Mineral Resources table on page 30 of this presentation for full Resource figures Refer to WRM release to the ASX of 16 September 2014 ndash 2014 Scoping Study
White Rock Minerals Ltd ASXWRM March 2017 16
Mt Carrington Mine Plan
A review of mining1 has advanced the initial design of the mine pits site layout waste dumps and mine scheduling
A key element of the current Feasibility Study is to investigate a range of parameters to maximise the economic returns from the Project-
Plant throughputs between 800000 to 1200000 tonnes per annum Reduced mining and processing costs as a result of this increased
throughput An increased gold equivalent2 production profile up to and
exceeding 40000oz per annum initially Whilst still retaining an initial 6 to 7 year mine life
1 Refer to WRM release to the ASX of 20 October 2016 - Initial Mining review demonstrates significant upside potential at Mt Carrington
2 Gold equivalent production target calculations use the assumptions (gold price silver price and metal recoveries) provided in Annexure A of the 20 October 2016 ASX Release The price assumptions are A$1600oz for gold and A$22oz for silver The formula for gold equivalent calculations is gold produced plus silver produced times 22 divided by 1600 (the A$ price assumptions for silver and gold respectively) White Rock considers that both gold and silver have reasonable potential to be recovered and sold
300 metres
White Rock Minerals Ltd ASXWRM March 2017 17
Mt Carrington Processing Plant
Refer to WRM release to the ASX of 29 March 2016 - White Rockrsquos Mt Carrington Updated Scoping Study Delivers Justification For Feasibility Study
ROM Pad Primary Crusher
Coarse Ore Stockpile
CIL Circuit
Grinding Circuit
Flotation
Gold Room
Workshop
bull Preliminary flow sheet considers a standard crushing amp grinding circuit a flotation step and then CIL
bull The 3-D Plant model considers using the existing cleared old plant site and existing foundations also
bull One simple flotation ndash CIL plant suitable for gold silver and potentially copper
This provides for significant design and construction capital cost savings
White Rock Minerals Ltd ASXWRM March 2017
Project Overview- Mt Carrington
18
Advanced scoping study updated March 2016- JORC Inferred and Indicated Resources An 18 to 24 month DFS and Permitting period
followed by a one year construction period Approved Mining Licence Compelling Financial metrics-
Low CAPEX entry cost (A$242M) A$100M in free cash expected to be
generated to fund possible mine expansions and broader exploration
Simple open pit and processing operation focused initially on gold production to provide a low risk quick route to positive cash flow
Parameter 2016 Study Update Summary
Proposed development Two gold dominant pits and three silver dominant pits
Production ndash Gold Ounces 111000 Production ndash Silver Ounces 6700000 Life of Mine (years) 70 A$ Gold price A$ Silver price
A$1600 oz A$22 oz
Pre-tax Net Present Value (NPV10) A$606M
Free cash flow (undiscounted) A$1002M
Internal Rate of Return (IRR) 103
C1 Cash Cost (A$Oz Gold Eq) A$754oz C1 Cash Cost (A$Oz Silver Eq) A$1040oz Initial Capital payback 10 months Capital Cost A$242M
Refer to WRM release to the ASX of 20 October 2016 - Initial Mining review demonstrates significant upside potential at Mt Carrington The material assumptions relating to the scoping study at Mt Carrington provided in Annexure A of the ASX Announcement dated 20 October 2016 continue to apply and have not materially changed
White Rock Minerals Ltd ASXWRM March 2017
Significant Potential for upside
19
1 Mine Plan amp Pit Geotech optimisation
2 Second hand plant ndash time and cost savings potential
3 Concentration ratio improvements
4 Flow sheet recovery optimisation
5 Resource drilling to expand and or extend mine life
White Rock Minerals Ltd ASXWRM March 2017
Proposed Funding for Construction
20
Long-term Strategic Partner New-York based Cartesian Royalty Holdings (ldquoCRHrdquo)
Gold streaming financing Term Sheet contemplated to move the Mt Carrington project directly into construction commissioning and commercial production subject to a successful Definitive Feasibility Study (DFS) and the necessary approvals
Phase 1- Equity investment of A$1000000 in two equal tranches to fund working capital and to contribute funding to progress its DFS and Environmental Impact Statement (EIS) activities) and
Phase 2- a future streaming financing of US$19 million over a 12 month period in return for a share of gold and silver production to fund working capital and construction and commissioning of the Mt Carrington Project
Supporting White Rock to achieve its strategic goal of becoming a successful gold and silver producer
Binding and Conditional The Transactions contemplated by the Term Sheet are subject to various conditions including the completion of due diligence to the satisfaction of CRH certain White Rock shareholder approvals and the entry into definitive documentation for Phase 2 (streaming financing) as set out in more detail in the ASX announcement of 27 June 2016 Tranches One and Two completed
White Rock Minerals Ltd ASXWRM March 2017
Project Metrics including the CRH Financing
21
CRH Streaming Financing Cost- a minimum of 40000 ounces of gold equivalent over a 7-year period (at a minimum of 20 of its annual production) The Financial Metrics in the Scoping Study as a result of this financing are- Mt Carrington expected to still generate A$54M in free cash flow over its initial 7-year mine life
with a project NPV10 of A$374M At previous 2016 spot prices (A$1750oz Au and A$25oz Ag)-
free cash flow is ~A$81M (up 50) with a project NPV10 of A$539M (up 44) White Rock maintains 100 ownership of the asset White Rock can advance its exciting zinc-silver VMS Project in Alaska The proposed gold streaming financing arrangement is non-dilutive to shareholders White Rock gains a cornerstone strategic partner for the 9+ year journey WRM joins a stable of other gold investments made by CRH ndash ASX listed Orinoco TSX-V listed K92 Mining TSX-V listed Equitas Resources and TSX-V Sage Gold Inc
White Rock Minerals Ltd ASXWRM March 2017 22
Red Mountain Alaska
Advanced Zinc-Silver-Lead-Gold VMS Exploration Project
White Rock Minerals Ltd ASXWRM March 2017
Red Mountain Project
Red Mountain Alaska polymetallic VMS deposit ndash advanced exploration asset with
significant potential exploration upside Located in central Alaska 100km south of Fairbanks in the
Bonnifield Mining District Acquired from Atlas Resources - White Rock has expanded the
tenement package to comprise 224 mining claims over a total area of 143kmsup2
Contains polymetallic VMS mineralisation rich in zinc silver and lead with previous exploration defining mineralisation at the two main prospects (Dry Creek and West Tundra Flats)
No exploration since 1999 Project held privately for the last decade
Red Mountain
Red Mountain Location
Alaska
Refer to WRM release to the ASX of 15 February 2016 - White Rock Minerals Propose to Acquire VMS Project in Alaska
23
White Rock Minerals Ltd ASXWRM March 2017
Polymetallic VMS project ndash zinc and silver rich Discovered in 1975 ndash sulphide outcrop Historic exploration from 1975-1999 Two deposits discovered
Discovery Fosters (Red Mountain) West Tundra Flats (WTF)
Mineralisation from surface Good preliminary metallurgical test work results with
recoveries gt90 zinc gt70 lead gt80 gold gt70 Ag 143kmsup2 land position established ndash highly prospective
Historic Work ndash Resource Potential
24
Dry Creek 46m 235 Zn 531gt Ag 85 Pb 15gt Au amp 10 Cu from 61m
55m 259 Zn 346gt Ag 117 Pb 25gt Au amp 09 Cu from 695m
71m 151 Zn 334gt Ag 68 Pb 09gt Au amp 03 Cu from 391m
West Tundra Flats
13m 210 Zn 796gt Ag 92 Pb 102gt Au amp 06 Cu from 586m
30m 73 Zn 796gt Ag 43 Pb 11gt Au amp 02 Cu from 1609m
17m 114 Zn 372gt Ag 60 Pb 17gt Au amp 02 Cu from 1043m
1st JORC 2012 Resource Estimate currently being done
White Rock Minerals Ltd ASXWRM March 2017
Priority Conductivity Targets
25
Conductivity targets prioritised by geochemistry bull Geochemical alteration proximal to VMS mineralisation bull Direct base metal and precious metal anomalies
Existing deposits
Identified 30 targets
White Rock Minerals Ltd ASXWRM March 2017
Indicative Activity Timeline
26
2017 2018 2019 2020
Stage 2 ndash Silver
Stage 1 - Gold Feasibility Study 12 months Production
Construction amp Commissioning
12 months
Gold amp Silver LoM Extension
Red Mountain Exploration
Life-of-Mine Extensional and
Exploration Drilling
Phase 2 Field Studies ndash geochem geophysics
3 years after Gold Production
Phase 3 Target identification amp Drilling
Phase 1 Data collation and
JORC Resource
EIS Studies amp Permitting 18 to 24 months
White Rock Minerals Ltd ASXWRM March 2017
Low cost gold silver start-up opportunity DFS commenced for its cornerstone Mt Carrington Project-
Robust initial 7-year operation Low capital cost (ltA$30M) with ~A$20M in infrastructure already in place Less than one year payback Shallow low strip ratio mineralisation C1 cash costltA$800oz AuEq NPV10 of ~A$60M an IRR of 103 and free cash of ~A$100M expected (pre financing)
Key terms for a conditional fully funded construction financing package agreed Experienced Board and Management Geological geographical and commodity diversification for investors Significant potential for resource expansions and new discoveries Exciting high-grade zinc and silver VMS potential in Alaska
LOOKING AHEAD
27
Refer to WRM release to the ASX of 20 October 2016 - Initial Mining review demonstrates significant upside potential at Mt Carrington The material assumptions relating to the scoping study at Mt Carrington provided in Annexure A of the ASX Announcement dated 20 October 2016 continue to apply and have not materially changed
White Rock Minerals Ltd ASXWRM March 2017 28
Appendices bull Mt Carrington Exploration Upside bull Mt Carrington Resource Statement bull Red Mountain Back-up Information
White Rock Minerals Ltd ASXWRM March 2017
Mt Carrington ndash Exploration upside
29
Over 180km2 of tenements highly prospective for epithermal and intrusion-related gold silver and copper mineralisation Priority Near-Mine Targets 1 Mining Leases Potential Resource Additions
Multiple shallow targets Historic drill intercepts for follow-up High grade underground potential poorly tested
2 Exploration Licences Silver-Gold-Copper Targets
Pipeline of prospects Drill ready targets based on
bull Mapping bull Geochemcial anomalies bull Geophysical IPresistivity anomalies
3 Porphyry Potential Zoned Copper-Gold-Silver Robust intrusion related copper model at Mt Carrington Strong secondary copper in shallow drilling Large open geophysical IP anomalies with confirmed alteration
source Under-drilled Similar zoned Copper-Gold-Silver systems recognised at White
Rock and Red Rock
White Rock Minerals Ltd ASXWRM March 2017 30
Resources reported in accordance with the JORC (2004) code
MT CARRINGTON JORC (2004) MINERAL RESOURCES ndash JANUARY 2015 Silver Dominant Resources
Resource Category Deposit Tonnes Gold grade (gt) Gold ounces Silver grade
(gt) Silver
ounces
Indicated Lady Hampden 1840000 06 37000 69 4056000
White Rock 1710000 - - 77 4214000 Sub-Total 3550000 03 37000 72 8270000
Inferred
Lady Hampden 2470000 03 27000 51 4023000 White Rock 2660000 - - 47 3978000
White Rock North 3180000 - - 52 5314000 Silver King 640000 - - 59 1218000 Sub-Total 8950000 01 27000 51 14533000
Total
Lady Hampden 4310000 05 64000 58 8079000 White Rock 4370000 - - 58 8192000
White Rock North 3180000 - - 52 5314000 Silver King 640000 - - 59 1218000
Total 12500000 02 64000 57 22803000 Gold Dominant Resources
Resource Category Deposit Tonnes Gold grade (gt) Gold ounces Silver grade
(gt) Silver ounces
Indicated Strauss 1240000 14 57000 38 153000
Kylo 1590000 12 59000 26 133000 Sub-Total 2830000 13 116000 31 286000
Inferred
Strauss 1260000 14 56000 26 104000 Kylo 760000 15 35000 18 43000
Red Rock 1630000 10 54000 35 182000 Guy Bell 160000 25 13000 49 24000
Sub-Total 3810000 13 158000 29 353000
Total
Strauss 2500000 14 113000 32 257000 Kylo 2350000 13 95000 23 176000
Red Rock 1630000 10 54000 35 182000 Guy Bell 160000 25 13000 49 24000
Total 6640000 13 275000 30 639000 Total Resources
Category Tonnes Gold ounces Silver ounces Indicated 6380000 153000 8556000 Inferred 12760000 185000 14886000
Total 19140000 338000 23442000
Mount Carrington Resource Statement
The Resources figures are currently being updated to comply with the JORC Code 2012 as a part of the Definitive Feasibility Study currently underway
White Rock Minerals Ltd ASXWRM March 2017
Alaska is an exploration and mining friendly state bull Well developed history of gold and base metal mining bull Stable and attractive tax regime bull Efficient permitting
Central Alaska location ~100km to the south of Fairbanks
Good location with respect to infrastructure and logistics
bull Major road and rail access located 80km to the west bull Connection to port of Anchorage (400km south) bull Access from Fairbanks via helicopter or fixed wing aircraft bull Access to fresh water bull No community or environmental legacy issues bull Established mining hub at Fairbanks services mines
including Pogo Fort Knox and Usibelli
Project Overview- Red Mountain Alaska
32km State Claims
Alaska
Pogo Gold Mine
Red Mountain ndash Project Location
31
White Rock Minerals Ltd ASXWRM March 2017
Red Mountain Geology and Mineralisation Red Mountain ndash Regional Geology
World class deposits with similar siliciclastic felsic associations to the Bonnifield district include- Rio Tinto (Cu-Zn-Pb-Au-Ag Spain) Brunswick 12 (Zn-Pb-Ag Canada) and Eskay Creek (Au-Ag-Zn-Pb Canada)
Analysis of worldwide VMS deposits of this type indicate
promising exploration potential for Red Mountain- The deposits nearly always occur in clusters The presence and spatial relationships of the two
separate deposits at Red Mountain may prove to be a significant exploration vector for discovery of further deposits
32
White Rock Minerals has engaged world-renowned VMS expert Dr Jim Franklin to assist with assessing the prospectivity of the district and targeting additional mineralisation
White Rock Minerals Ltd ASXWRM March 2017
HOLE ID From (m)
To (m)
Interval (m) Zn Pb Cu Ag gt Au gt
DC76-02 386 503 116 529 216 022 112 NA DC97-01 411 524 113 760 318 026 115 099 including 411 428 17 2001 852 062 266 147 DC97-04 625 750 125 1251 552 071 160 114 including 695 750 55 2589 1172 088 346 246 DC97-14 570 753 183 139 023 208 15 024 including 591 634 43 006 004 675 15 004 DC97-30 177 209 32 919 472 041 226 116 DC97-31 290 314 24 1272 645 035 1061 382 DC97-32 279 339 61 1443 683 036 137 061 including 303 334 31 2008 952 052 169 078 DC97-33 391 462 71 1512 681 030 334 086 DC98-38 590 680 90 540 243 015 269 100 including 615 638 23 1324 582 030 581 307 DC98-39 776 988 212 699 320 019 57 038 including 776 890 114 1038 478 028 56 051 with 776 826 50 1774 780 045 64 045 DC98-40 61 422 361 624 256 022 183 103 Including 61 107 46 2354 845 102 531 153 including 213 245 31 1465 665 025 211 053 DC98-60 176 865 689 402 188 010 58 036 including 538 588 49 1017 496 028 86 039 WTF82-05 1043 1061 17 1140 597 015 374 171 WTF82-08 1609 1640 30 728 427 017 796 112 WTF83-17 586 599 13 2092 917 056 796 1022
Gold and silver intercepts indicate
significant by-product potential
Multiple shallow intercepts indicate
potential for stacked high-grade lodes
Drilling at Discovery and Fosters Zones
ceased in 1999
Historic Drilling
33
Drilling at West Tundra Flats ceased
in 1983
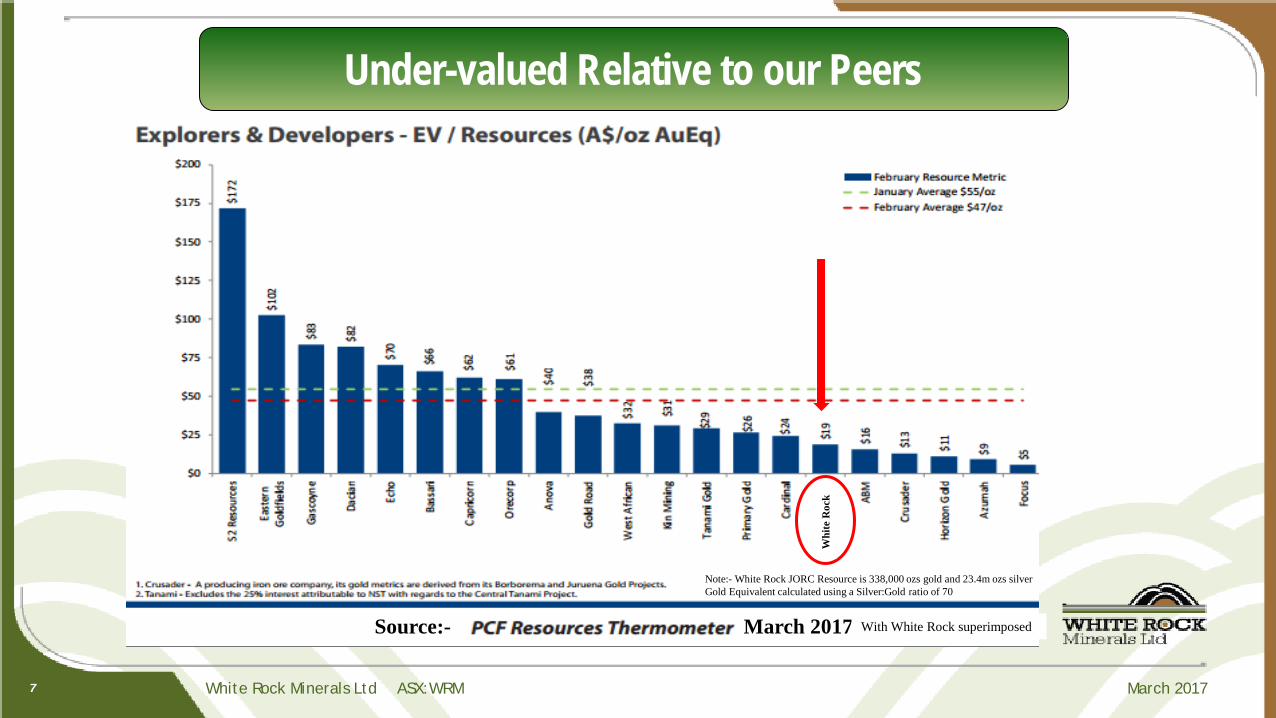
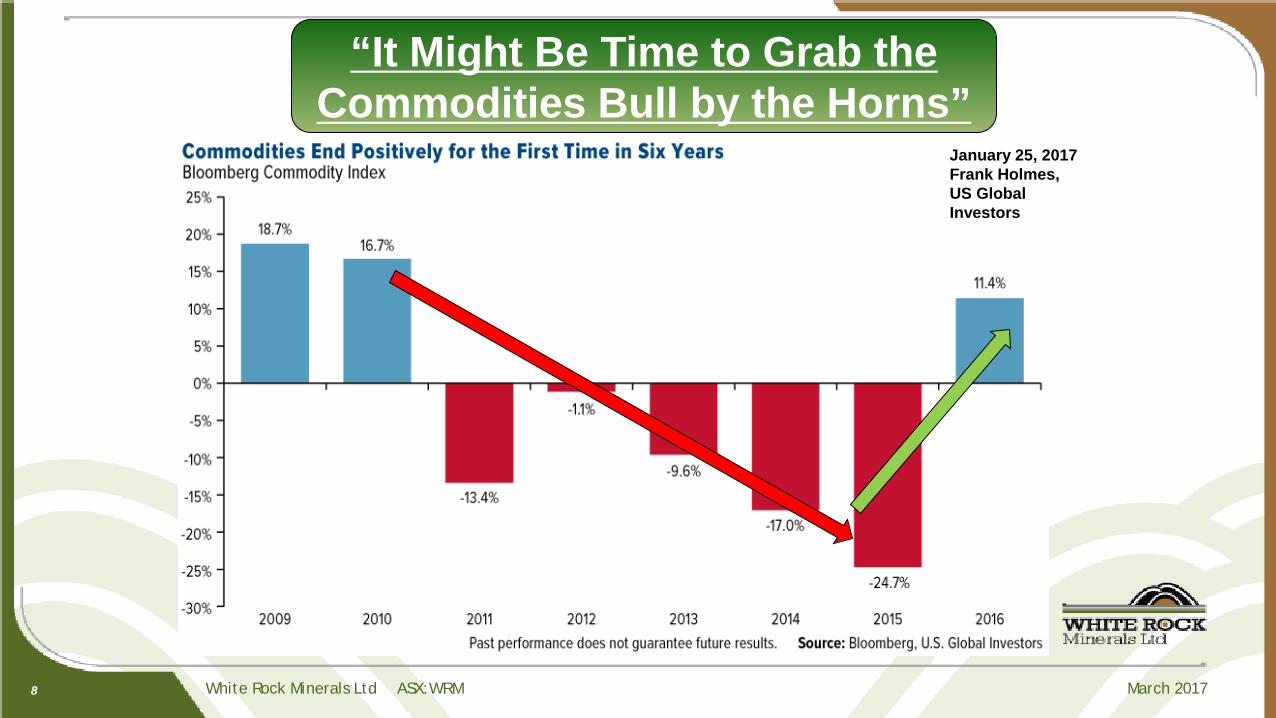
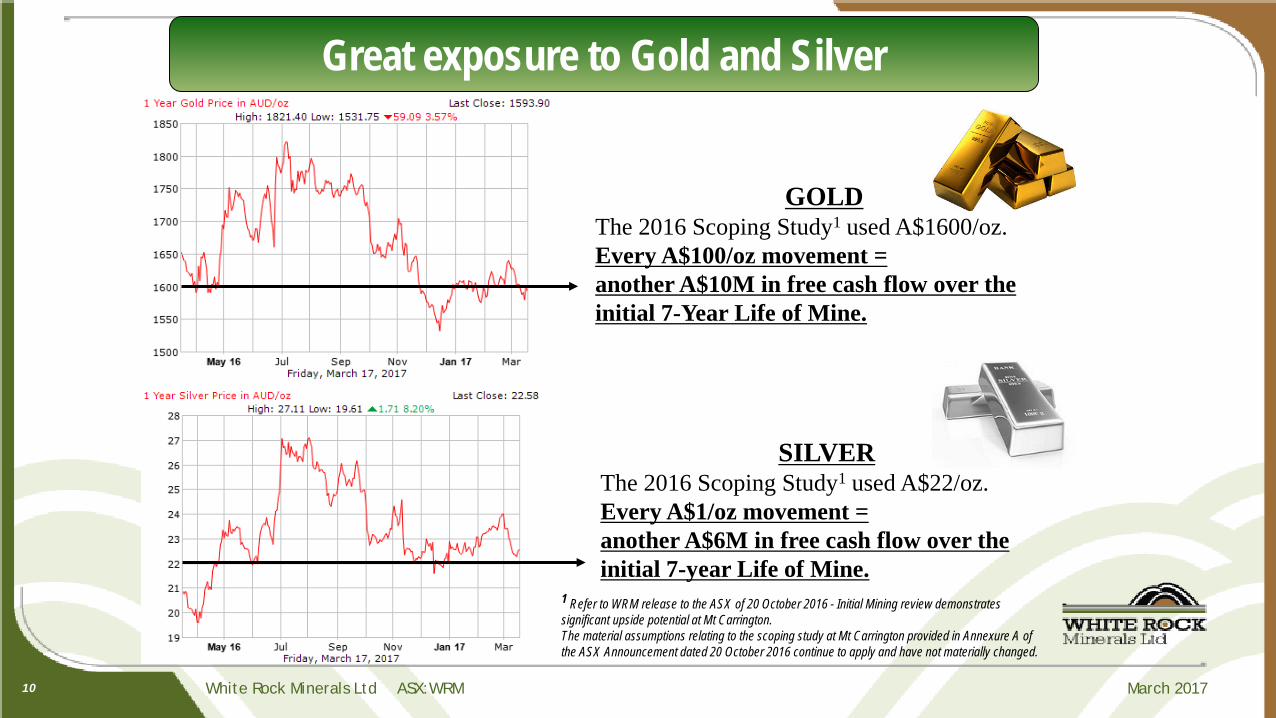
White Rock Minerals Ltd ASXWRM March 2017
Mt Carrington Site Layout
14
Lismore 100km gt lt Tenterfield 50km
Key Infrastructure in place to support future mining Valued at ~A$20M Reduces development risk timeframe and capital cost Granted Mining Leases
15Mt Tailings Dam
750ML Freshwater Dam
Site Office
RO Water treatment plant
Access to State grid power
White Rock Minerals Ltd ASXWRM March 2017 15
Mt Carrington Mine Plan
Strategy based on a 2-stage open pit mining scenario ndash gold first then silver bull The 2016 Updated Scoping Study Mine Plan-
bull Stage 1- Mining the higher confidence gold resources - Strauss and Kylo deposits (in-pit Resources 67 Indicated 33 Inferred)
bull These first two production sources already pre-stripped
bull Stage 2- Mining the silver-rich resources - Lady Hampden White Rock and Silver King deposits (in-pit Resources 69 Indicated 31 Inferred)
Stage 1 (first 35 years) gold-only development has a number of low risk advantages including
bull Lower Capex bull Simple flowsheet and salable product (gold dore) bull Faster timeline to production
Strauss ndash Global Resource 25Mt 14gt Au (113k oz Au)
Refer to Mineral Resources table on page 30 of this presentation for full Resource figures Refer to WRM release to the ASX of 16 September 2014 ndash 2014 Scoping Study
White Rock Minerals Ltd ASXWRM March 2017 16
Mt Carrington Mine Plan
A review of mining1 has advanced the initial design of the mine pits site layout waste dumps and mine scheduling
A key element of the current Feasibility Study is to investigate a range of parameters to maximise the economic returns from the Project-
Plant throughputs between 800000 to 1200000 tonnes per annum Reduced mining and processing costs as a result of this increased
throughput An increased gold equivalent2 production profile up to and
exceeding 40000oz per annum initially Whilst still retaining an initial 6 to 7 year mine life
1 Refer to WRM release to the ASX of 20 October 2016 - Initial Mining review demonstrates significant upside potential at Mt Carrington
2 Gold equivalent production target calculations use the assumptions (gold price silver price and metal recoveries) provided in Annexure A of the 20 October 2016 ASX Release The price assumptions are A$1600oz for gold and A$22oz for silver The formula for gold equivalent calculations is gold produced plus silver produced times 22 divided by 1600 (the A$ price assumptions for silver and gold respectively) White Rock considers that both gold and silver have reasonable potential to be recovered and sold
300 metres
White Rock Minerals Ltd ASXWRM March 2017 17
Mt Carrington Processing Plant
Refer to WRM release to the ASX of 29 March 2016 - White Rockrsquos Mt Carrington Updated Scoping Study Delivers Justification For Feasibility Study
ROM Pad Primary Crusher
Coarse Ore Stockpile
CIL Circuit
Grinding Circuit
Flotation
Gold Room
Workshop
bull Preliminary flow sheet considers a standard crushing amp grinding circuit a flotation step and then CIL
bull The 3-D Plant model considers using the existing cleared old plant site and existing foundations also
bull One simple flotation ndash CIL plant suitable for gold silver and potentially copper
This provides for significant design and construction capital cost savings
White Rock Minerals Ltd ASXWRM March 2017
Project Overview- Mt Carrington
18
Advanced scoping study updated March 2016- JORC Inferred and Indicated Resources An 18 to 24 month DFS and Permitting period
followed by a one year construction period Approved Mining Licence Compelling Financial metrics-
Low CAPEX entry cost (A$242M) A$100M in free cash expected to be
generated to fund possible mine expansions and broader exploration
Simple open pit and processing operation focused initially on gold production to provide a low risk quick route to positive cash flow
Parameter 2016 Study Update Summary
Proposed development Two gold dominant pits and three silver dominant pits
Production ndash Gold Ounces 111000 Production ndash Silver Ounces 6700000 Life of Mine (years) 70 A$ Gold price A$ Silver price
A$1600 oz A$22 oz
Pre-tax Net Present Value (NPV10) A$606M
Free cash flow (undiscounted) A$1002M
Internal Rate of Return (IRR) 103
C1 Cash Cost (A$Oz Gold Eq) A$754oz C1 Cash Cost (A$Oz Silver Eq) A$1040oz Initial Capital payback 10 months Capital Cost A$242M
Refer to WRM release to the ASX of 20 October 2016 - Initial Mining review demonstrates significant upside potential at Mt Carrington The material assumptions relating to the scoping study at Mt Carrington provided in Annexure A of the ASX Announcement dated 20 October 2016 continue to apply and have not materially changed
White Rock Minerals Ltd ASXWRM March 2017
Significant Potential for upside
19
1 Mine Plan amp Pit Geotech optimisation
2 Second hand plant ndash time and cost savings potential
3 Concentration ratio improvements
4 Flow sheet recovery optimisation
5 Resource drilling to expand and or extend mine life
White Rock Minerals Ltd ASXWRM March 2017
Proposed Funding for Construction
20
Long-term Strategic Partner New-York based Cartesian Royalty Holdings (ldquoCRHrdquo)
Gold streaming financing Term Sheet contemplated to move the Mt Carrington project directly into construction commissioning and commercial production subject to a successful Definitive Feasibility Study (DFS) and the necessary approvals
Phase 1- Equity investment of A$1000000 in two equal tranches to fund working capital and to contribute funding to progress its DFS and Environmental Impact Statement (EIS) activities) and
Phase 2- a future streaming financing of US$19 million over a 12 month period in return for a share of gold and silver production to fund working capital and construction and commissioning of the Mt Carrington Project
Supporting White Rock to achieve its strategic goal of becoming a successful gold and silver producer
Binding and Conditional The Transactions contemplated by the Term Sheet are subject to various conditions including the completion of due diligence to the satisfaction of CRH certain White Rock shareholder approvals and the entry into definitive documentation for Phase 2 (streaming financing) as set out in more detail in the ASX announcement of 27 June 2016 Tranches One and Two completed
White Rock Minerals Ltd ASXWRM March 2017
Project Metrics including the CRH Financing
21
CRH Streaming Financing Cost- a minimum of 40000 ounces of gold equivalent over a 7-year period (at a minimum of 20 of its annual production) The Financial Metrics in the Scoping Study as a result of this financing are- Mt Carrington expected to still generate A$54M in free cash flow over its initial 7-year mine life
with a project NPV10 of A$374M At previous 2016 spot prices (A$1750oz Au and A$25oz Ag)-
free cash flow is ~A$81M (up 50) with a project NPV10 of A$539M (up 44) White Rock maintains 100 ownership of the asset White Rock can advance its exciting zinc-silver VMS Project in Alaska The proposed gold streaming financing arrangement is non-dilutive to shareholders White Rock gains a cornerstone strategic partner for the 9+ year journey WRM joins a stable of other gold investments made by CRH ndash ASX listed Orinoco TSX-V listed K92 Mining TSX-V listed Equitas Resources and TSX-V Sage Gold Inc
White Rock Minerals Ltd ASXWRM March 2017 22
Red Mountain Alaska
Advanced Zinc-Silver-Lead-Gold VMS Exploration Project
White Rock Minerals Ltd ASXWRM March 2017
Red Mountain Project
Red Mountain Alaska polymetallic VMS deposit ndash advanced exploration asset with
significant potential exploration upside Located in central Alaska 100km south of Fairbanks in the
Bonnifield Mining District Acquired from Atlas Resources - White Rock has expanded the
tenement package to comprise 224 mining claims over a total area of 143kmsup2
Contains polymetallic VMS mineralisation rich in zinc silver and lead with previous exploration defining mineralisation at the two main prospects (Dry Creek and West Tundra Flats)
No exploration since 1999 Project held privately for the last decade
Red Mountain
Red Mountain Location
Alaska
Refer to WRM release to the ASX of 15 February 2016 - White Rock Minerals Propose to Acquire VMS Project in Alaska
23
White Rock Minerals Ltd ASXWRM March 2017
Polymetallic VMS project ndash zinc and silver rich Discovered in 1975 ndash sulphide outcrop Historic exploration from 1975-1999 Two deposits discovered
Discovery Fosters (Red Mountain) West Tundra Flats (WTF)
Mineralisation from surface Good preliminary metallurgical test work results with
recoveries gt90 zinc gt70 lead gt80 gold gt70 Ag 143kmsup2 land position established ndash highly prospective
Historic Work ndash Resource Potential
24
Dry Creek 46m 235 Zn 531gt Ag 85 Pb 15gt Au amp 10 Cu from 61m
55m 259 Zn 346gt Ag 117 Pb 25gt Au amp 09 Cu from 695m
71m 151 Zn 334gt Ag 68 Pb 09gt Au amp 03 Cu from 391m
West Tundra Flats
13m 210 Zn 796gt Ag 92 Pb 102gt Au amp 06 Cu from 586m
30m 73 Zn 796gt Ag 43 Pb 11gt Au amp 02 Cu from 1609m
17m 114 Zn 372gt Ag 60 Pb 17gt Au amp 02 Cu from 1043m
1st JORC 2012 Resource Estimate currently being done
White Rock Minerals Ltd ASXWRM March 2017
Priority Conductivity Targets
25
Conductivity targets prioritised by geochemistry bull Geochemical alteration proximal to VMS mineralisation bull Direct base metal and precious metal anomalies
Existing deposits
Identified 30 targets
White Rock Minerals Ltd ASXWRM March 2017
Indicative Activity Timeline
26
2017 2018 2019 2020
Stage 2 ndash Silver
Stage 1 - Gold Feasibility Study 12 months Production
Construction amp Commissioning
12 months
Gold amp Silver LoM Extension
Red Mountain Exploration
Life-of-Mine Extensional and
Exploration Drilling
Phase 2 Field Studies ndash geochem geophysics
3 years after Gold Production
Phase 3 Target identification amp Drilling
Phase 1 Data collation and
JORC Resource
EIS Studies amp Permitting 18 to 24 months
White Rock Minerals Ltd ASXWRM March 2017
Low cost gold silver start-up opportunity DFS commenced for its cornerstone Mt Carrington Project-
Robust initial 7-year operation Low capital cost (ltA$30M) with ~A$20M in infrastructure already in place Less than one year payback Shallow low strip ratio mineralisation C1 cash costltA$800oz AuEq NPV10 of ~A$60M an IRR of 103 and free cash of ~A$100M expected (pre financing)
Key terms for a conditional fully funded construction financing package agreed Experienced Board and Management Geological geographical and commodity diversification for investors Significant potential for resource expansions and new discoveries Exciting high-grade zinc and silver VMS potential in Alaska
LOOKING AHEAD
27
Refer to WRM release to the ASX of 20 October 2016 - Initial Mining review demonstrates significant upside potential at Mt Carrington The material assumptions relating to the scoping study at Mt Carrington provided in Annexure A of the ASX Announcement dated 20 October 2016 continue to apply and have not materially changed
White Rock Minerals Ltd ASXWRM March 2017 28
Appendices bull Mt Carrington Exploration Upside bull Mt Carrington Resource Statement bull Red Mountain Back-up Information
White Rock Minerals Ltd ASXWRM March 2017
Mt Carrington ndash Exploration upside
29
Over 180km2 of tenements highly prospective for epithermal and intrusion-related gold silver and copper mineralisation Priority Near-Mine Targets 1 Mining Leases Potential Resource Additions
Multiple shallow targets Historic drill intercepts for follow-up High grade underground potential poorly tested
2 Exploration Licences Silver-Gold-Copper Targets
Pipeline of prospects Drill ready targets based on
bull Mapping bull Geochemcial anomalies bull Geophysical IPresistivity anomalies
3 Porphyry Potential Zoned Copper-Gold-Silver Robust intrusion related copper model at Mt Carrington Strong secondary copper in shallow drilling Large open geophysical IP anomalies with confirmed alteration
source Under-drilled Similar zoned Copper-Gold-Silver systems recognised at White
Rock and Red Rock
White Rock Minerals Ltd ASXWRM March 2017 30
Resources reported in accordance with the JORC (2004) code
MT CARRINGTON JORC (2004) MINERAL RESOURCES ndash JANUARY 2015 Silver Dominant Resources
Resource Category Deposit Tonnes Gold grade (gt) Gold ounces Silver grade
(gt) Silver
ounces
Indicated Lady Hampden 1840000 06 37000 69 4056000
White Rock 1710000 - - 77 4214000 Sub-Total 3550000 03 37000 72 8270000
Inferred
Lady Hampden 2470000 03 27000 51 4023000 White Rock 2660000 - - 47 3978000
White Rock North 3180000 - - 52 5314000 Silver King 640000 - - 59 1218000 Sub-Total 8950000 01 27000 51 14533000
Total
Lady Hampden 4310000 05 64000 58 8079000 White Rock 4370000 - - 58 8192000
White Rock North 3180000 - - 52 5314000 Silver King 640000 - - 59 1218000
Total 12500000 02 64000 57 22803000 Gold Dominant Resources
Resource Category Deposit Tonnes Gold grade (gt) Gold ounces Silver grade
(gt) Silver ounces
Indicated Strauss 1240000 14 57000 38 153000
Kylo 1590000 12 59000 26 133000 Sub-Total 2830000 13 116000 31 286000
Inferred
Strauss 1260000 14 56000 26 104000 Kylo 760000 15 35000 18 43000
Red Rock 1630000 10 54000 35 182000 Guy Bell 160000 25 13000 49 24000
Sub-Total 3810000 13 158000 29 353000
Total
Strauss 2500000 14 113000 32 257000 Kylo 2350000 13 95000 23 176000
Red Rock 1630000 10 54000 35 182000 Guy Bell 160000 25 13000 49 24000
Total 6640000 13 275000 30 639000 Total Resources
Category Tonnes Gold ounces Silver ounces Indicated 6380000 153000 8556000 Inferred 12760000 185000 14886000
Total 19140000 338000 23442000
Mount Carrington Resource Statement
The Resources figures are currently being updated to comply with the JORC Code 2012 as a part of the Definitive Feasibility Study currently underway
White Rock Minerals Ltd ASXWRM March 2017
Alaska is an exploration and mining friendly state bull Well developed history of gold and base metal mining bull Stable and attractive tax regime bull Efficient permitting
Central Alaska location ~100km to the south of Fairbanks
Good location with respect to infrastructure and logistics
bull Major road and rail access located 80km to the west bull Connection to port of Anchorage (400km south) bull Access from Fairbanks via helicopter or fixed wing aircraft bull Access to fresh water bull No community or environmental legacy issues bull Established mining hub at Fairbanks services mines
including Pogo Fort Knox and Usibelli
Project Overview- Red Mountain Alaska
32km State Claims
Alaska
Pogo Gold Mine
Red Mountain ndash Project Location
31
White Rock Minerals Ltd ASXWRM March 2017
Red Mountain Geology and Mineralisation Red Mountain ndash Regional Geology
World class deposits with similar siliciclastic felsic associations to the Bonnifield district include- Rio Tinto (Cu-Zn-Pb-Au-Ag Spain) Brunswick 12 (Zn-Pb-Ag Canada) and Eskay Creek (Au-Ag-Zn-Pb Canada)
Analysis of worldwide VMS deposits of this type indicate
promising exploration potential for Red Mountain- The deposits nearly always occur in clusters The presence and spatial relationships of the two
separate deposits at Red Mountain may prove to be a significant exploration vector for discovery of further deposits
32
White Rock Minerals has engaged world-renowned VMS expert Dr Jim Franklin to assist with assessing the prospectivity of the district and targeting additional mineralisation
White Rock Minerals Ltd ASXWRM March 2017
HOLE ID From (m)
To (m)
Interval (m) Zn Pb Cu Ag gt Au gt
DC76-02 386 503 116 529 216 022 112 NA DC97-01 411 524 113 760 318 026 115 099 including 411 428 17 2001 852 062 266 147 DC97-04 625 750 125 1251 552 071 160 114 including 695 750 55 2589 1172 088 346 246 DC97-14 570 753 183 139 023 208 15 024 including 591 634 43 006 004 675 15 004 DC97-30 177 209 32 919 472 041 226 116 DC97-31 290 314 24 1272 645 035 1061 382 DC97-32 279 339 61 1443 683 036 137 061 including 303 334 31 2008 952 052 169 078 DC97-33 391 462 71 1512 681 030 334 086 DC98-38 590 680 90 540 243 015 269 100 including 615 638 23 1324 582 030 581 307 DC98-39 776 988 212 699 320 019 57 038 including 776 890 114 1038 478 028 56 051 with 776 826 50 1774 780 045 64 045 DC98-40 61 422 361 624 256 022 183 103 Including 61 107 46 2354 845 102 531 153 including 213 245 31 1465 665 025 211 053 DC98-60 176 865 689 402 188 010 58 036 including 538 588 49 1017 496 028 86 039 WTF82-05 1043 1061 17 1140 597 015 374 171 WTF82-08 1609 1640 30 728 427 017 796 112 WTF83-17 586 599 13 2092 917 056 796 1022
Gold and silver intercepts indicate
significant by-product potential
Multiple shallow intercepts indicate
potential for stacked high-grade lodes
Drilling at Discovery and Fosters Zones
ceased in 1999
Historic Drilling
33
Drilling at West Tundra Flats ceased
in 1983
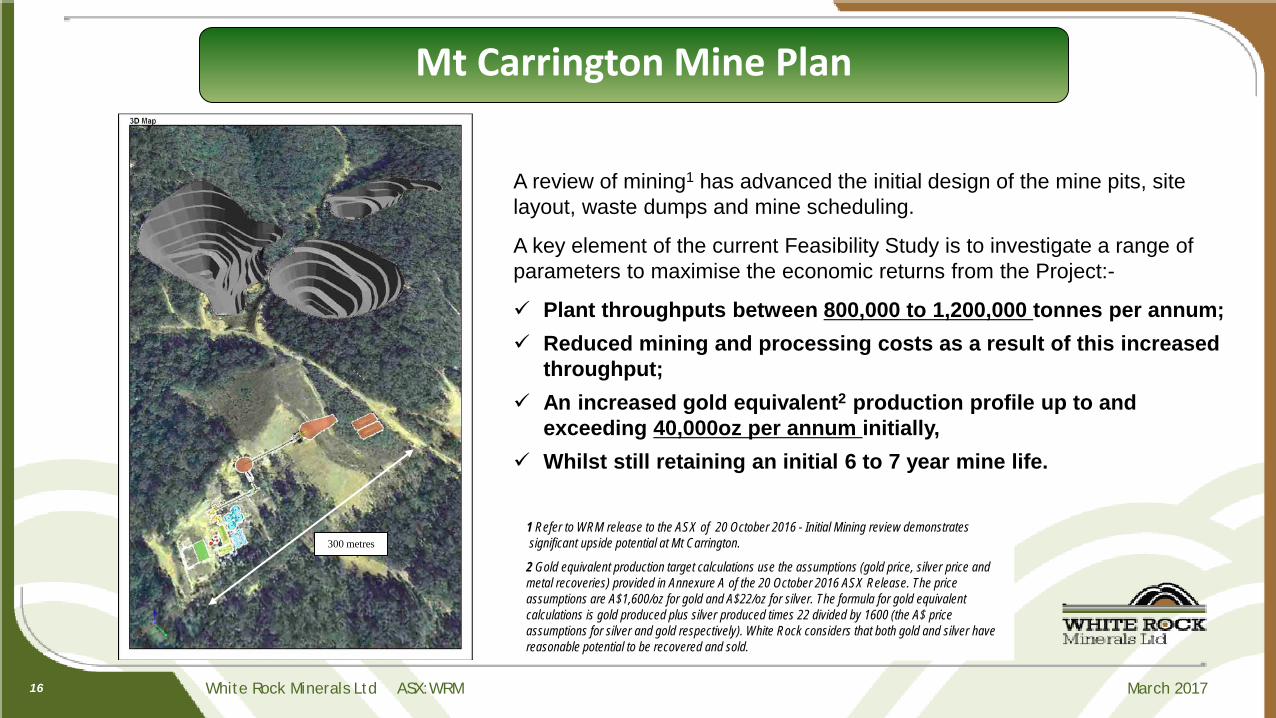

White Rock Minerals Ltd ASXWRM March 2017
Proposed Funding for Construction
20
Long-term Strategic Partner New-York based Cartesian Royalty Holdings (ldquoCRHrdquo)
Gold streaming financing Term Sheet contemplated to move the Mt Carrington project directly into construction commissioning and commercial production subject to a successful Definitive Feasibility Study (DFS) and the necessary approvals
Phase 1- Equity investment of A$1000000 in two equal tranches to fund working capital and to contribute funding to progress its DFS and Environmental Impact Statement (EIS) activities) and
Phase 2- a future streaming financing of US$19 million over a 12 month period in return for a share of gold and silver production to fund working capital and construction and commissioning of the Mt Carrington Project
Supporting White Rock to achieve its strategic goal of becoming a successful gold and silver producer
Binding and Conditional The Transactions contemplated by the Term Sheet are subject to various conditions including the completion of due diligence to the satisfaction of CRH certain White Rock shareholder approvals and the entry into definitive documentation for Phase 2 (streaming financing) as set out in more detail in the ASX announcement of 27 June 2016 Tranches One and Two completed
White Rock Minerals Ltd ASXWRM March 2017
Project Metrics including the CRH Financing
21
CRH Streaming Financing Cost- a minimum of 40000 ounces of gold equivalent over a 7-year period (at a minimum of 20 of its annual production) The Financial Metrics in the Scoping Study as a result of this financing are- Mt Carrington expected to still generate A$54M in free cash flow over its initial 7-year mine life
with a project NPV10 of A$374M At previous 2016 spot prices (A$1750oz Au and A$25oz Ag)-
free cash flow is ~A$81M (up 50) with a project NPV10 of A$539M (up 44) White Rock maintains 100 ownership of the asset White Rock can advance its exciting zinc-silver VMS Project in Alaska The proposed gold streaming financing arrangement is non-dilutive to shareholders White Rock gains a cornerstone strategic partner for the 9+ year journey WRM joins a stable of other gold investments made by CRH ndash ASX listed Orinoco TSX-V listed K92 Mining TSX-V listed Equitas Resources and TSX-V Sage Gold Inc
White Rock Minerals Ltd ASXWRM March 2017 22
Red Mountain Alaska
Advanced Zinc-Silver-Lead-Gold VMS Exploration Project
White Rock Minerals Ltd ASXWRM March 2017
Red Mountain Project
Red Mountain Alaska polymetallic VMS deposit ndash advanced exploration asset with
significant potential exploration upside Located in central Alaska 100km south of Fairbanks in the
Bonnifield Mining District Acquired from Atlas Resources - White Rock has expanded the
tenement package to comprise 224 mining claims over a total area of 143kmsup2
Contains polymetallic VMS mineralisation rich in zinc silver and lead with previous exploration defining mineralisation at the two main prospects (Dry Creek and West Tundra Flats)
No exploration since 1999 Project held privately for the last decade
Red Mountain
Red Mountain Location
Alaska
Refer to WRM release to the ASX of 15 February 2016 - White Rock Minerals Propose to Acquire VMS Project in Alaska
23
White Rock Minerals Ltd ASXWRM March 2017
Polymetallic VMS project ndash zinc and silver rich Discovered in 1975 ndash sulphide outcrop Historic exploration from 1975-1999 Two deposits discovered
Discovery Fosters (Red Mountain) West Tundra Flats (WTF)
Mineralisation from surface Good preliminary metallurgical test work results with
recoveries gt90 zinc gt70 lead gt80 gold gt70 Ag 143kmsup2 land position established ndash highly prospective
Historic Work ndash Resource Potential
24
Dry Creek 46m 235 Zn 531gt Ag 85 Pb 15gt Au amp 10 Cu from 61m
55m 259 Zn 346gt Ag 117 Pb 25gt Au amp 09 Cu from 695m
71m 151 Zn 334gt Ag 68 Pb 09gt Au amp 03 Cu from 391m
West Tundra Flats
13m 210 Zn 796gt Ag 92 Pb 102gt Au amp 06 Cu from 586m
30m 73 Zn 796gt Ag 43 Pb 11gt Au amp 02 Cu from 1609m
17m 114 Zn 372gt Ag 60 Pb 17gt Au amp 02 Cu from 1043m
1st JORC 2012 Resource Estimate currently being done
White Rock Minerals Ltd ASXWRM March 2017
Priority Conductivity Targets
25
Conductivity targets prioritised by geochemistry bull Geochemical alteration proximal to VMS mineralisation bull Direct base metal and precious metal anomalies
Existing deposits
Identified 30 targets
White Rock Minerals Ltd ASXWRM March 2017
Indicative Activity Timeline
26
2017 2018 2019 2020
Stage 2 ndash Silver
Stage 1 - Gold Feasibility Study 12 months Production
Construction amp Commissioning
12 months
Gold amp Silver LoM Extension
Red Mountain Exploration
Life-of-Mine Extensional and
Exploration Drilling
Phase 2 Field Studies ndash geochem geophysics
3 years after Gold Production
Phase 3 Target identification amp Drilling
Phase 1 Data collation and
JORC Resource
EIS Studies amp Permitting 18 to 24 months
White Rock Minerals Ltd ASXWRM March 2017
Low cost gold silver start-up opportunity DFS commenced for its cornerstone Mt Carrington Project-
Robust initial 7-year operation Low capital cost (ltA$30M) with ~A$20M in infrastructure already in place Less than one year payback Shallow low strip ratio mineralisation C1 cash costltA$800oz AuEq NPV10 of ~A$60M an IRR of 103 and free cash of ~A$100M expected (pre financing)
Key terms for a conditional fully funded construction financing package agreed Experienced Board and Management Geological geographical and commodity diversification for investors Significant potential for resource expansions and new discoveries Exciting high-grade zinc and silver VMS potential in Alaska
LOOKING AHEAD
27
Refer to WRM release to the ASX of 20 October 2016 - Initial Mining review demonstrates significant upside potential at Mt Carrington The material assumptions relating to the scoping study at Mt Carrington provided in Annexure A of the ASX Announcement dated 20 October 2016 continue to apply and have not materially changed
White Rock Minerals Ltd ASXWRM March 2017 28
Appendices bull Mt Carrington Exploration Upside bull Mt Carrington Resource Statement bull Red Mountain Back-up Information
White Rock Minerals Ltd ASXWRM March 2017
Mt Carrington ndash Exploration upside
29
Over 180km2 of tenements highly prospective for epithermal and intrusion-related gold silver and copper mineralisation Priority Near-Mine Targets 1 Mining Leases Potential Resource Additions
Multiple shallow targets Historic drill intercepts for follow-up High grade underground potential poorly tested
2 Exploration Licences Silver-Gold-Copper Targets
Pipeline of prospects Drill ready targets based on
bull Mapping bull Geochemcial anomalies bull Geophysical IPresistivity anomalies
3 Porphyry Potential Zoned Copper-Gold-Silver Robust intrusion related copper model at Mt Carrington Strong secondary copper in shallow drilling Large open geophysical IP anomalies with confirmed alteration
source Under-drilled Similar zoned Copper-Gold-Silver systems recognised at White
Rock and Red Rock
White Rock Minerals Ltd ASXWRM March 2017 30
Resources reported in accordance with the JORC (2004) code
MT CARRINGTON JORC (2004) MINERAL RESOURCES ndash JANUARY 2015 Silver Dominant Resources
Resource Category Deposit Tonnes Gold grade (gt) Gold ounces Silver grade
(gt) Silver
ounces
Indicated Lady Hampden 1840000 06 37000 69 4056000
White Rock 1710000 - - 77 4214000 Sub-Total 3550000 03 37000 72 8270000
Inferred
Lady Hampden 2470000 03 27000 51 4023000 White Rock 2660000 - - 47 3978000
White Rock North 3180000 - - 52 5314000 Silver King 640000 - - 59 1218000 Sub-Total 8950000 01 27000 51 14533000
Total
Lady Hampden 4310000 05 64000 58 8079000 White Rock 4370000 - - 58 8192000
White Rock North 3180000 - - 52 5314000 Silver King 640000 - - 59 1218000
Total 12500000 02 64000 57 22803000 Gold Dominant Resources
Resource Category Deposit Tonnes Gold grade (gt) Gold ounces Silver grade
(gt) Silver ounces
Indicated Strauss 1240000 14 57000 38 153000
Kylo 1590000 12 59000 26 133000 Sub-Total 2830000 13 116000 31 286000
Inferred
Strauss 1260000 14 56000 26 104000 Kylo 760000 15 35000 18 43000
Red Rock 1630000 10 54000 35 182000 Guy Bell 160000 25 13000 49 24000
Sub-Total 3810000 13 158000 29 353000
Total
Strauss 2500000 14 113000 32 257000 Kylo 2350000 13 95000 23 176000
Red Rock 1630000 10 54000 35 182000 Guy Bell 160000 25 13000 49 24000
Total 6640000 13 275000 30 639000 Total Resources
Category Tonnes Gold ounces Silver ounces Indicated 6380000 153000 8556000 Inferred 12760000 185000 14886000
Total 19140000 338000 23442000
Mount Carrington Resource Statement
The Resources figures are currently being updated to comply with the JORC Code 2012 as a part of the Definitive Feasibility Study currently underway
White Rock Minerals Ltd ASXWRM March 2017
Alaska is an exploration and mining friendly state bull Well developed history of gold and base metal mining bull Stable and attractive tax regime bull Efficient permitting
Central Alaska location ~100km to the south of Fairbanks
Good location with respect to infrastructure and logistics
bull Major road and rail access located 80km to the west bull Connection to port of Anchorage (400km south) bull Access from Fairbanks via helicopter or fixed wing aircraft bull Access to fresh water bull No community or environmental legacy issues bull Established mining hub at Fairbanks services mines
including Pogo Fort Knox and Usibelli
Project Overview- Red Mountain Alaska
32km State Claims
Alaska
Pogo Gold Mine
Red Mountain ndash Project Location
31
White Rock Minerals Ltd ASXWRM March 2017
Red Mountain Geology and Mineralisation Red Mountain ndash Regional Geology
World class deposits with similar siliciclastic felsic associations to the Bonnifield district include- Rio Tinto (Cu-Zn-Pb-Au-Ag Spain) Brunswick 12 (Zn-Pb-Ag Canada) and Eskay Creek (Au-Ag-Zn-Pb Canada)
Analysis of worldwide VMS deposits of this type indicate
promising exploration potential for Red Mountain- The deposits nearly always occur in clusters The presence and spatial relationships of the two
separate deposits at Red Mountain may prove to be a significant exploration vector for discovery of further deposits
32
White Rock Minerals has engaged world-renowned VMS expert Dr Jim Franklin to assist with assessing the prospectivity of the district and targeting additional mineralisation
White Rock Minerals Ltd ASXWRM March 2017
HOLE ID From (m)
To (m)
Interval (m) Zn Pb Cu Ag gt Au gt
DC76-02 386 503 116 529 216 022 112 NA DC97-01 411 524 113 760 318 026 115 099 including 411 428 17 2001 852 062 266 147 DC97-04 625 750 125 1251 552 071 160 114 including 695 750 55 2589 1172 088 346 246 DC97-14 570 753 183 139 023 208 15 024 including 591 634 43 006 004 675 15 004 DC97-30 177 209 32 919 472 041 226 116 DC97-31 290 314 24 1272 645 035 1061 382 DC97-32 279 339 61 1443 683 036 137 061 including 303 334 31 2008 952 052 169 078 DC97-33 391 462 71 1512 681 030 334 086 DC98-38 590 680 90 540 243 015 269 100 including 615 638 23 1324 582 030 581 307 DC98-39 776 988 212 699 320 019 57 038 including 776 890 114 1038 478 028 56 051 with 776 826 50 1774 780 045 64 045 DC98-40 61 422 361 624 256 022 183 103 Including 61 107 46 2354 845 102 531 153 including 213 245 31 1465 665 025 211 053 DC98-60 176 865 689 402 188 010 58 036 including 538 588 49 1017 496 028 86 039 WTF82-05 1043 1061 17 1140 597 015 374 171 WTF82-08 1609 1640 30 728 427 017 796 112 WTF83-17 586 599 13 2092 917 056 796 1022
Gold and silver intercepts indicate
significant by-product potential
Multiple shallow intercepts indicate
potential for stacked high-grade lodes
Drilling at Discovery and Fosters Zones
ceased in 1999
Historic Drilling
33
Drilling at West Tundra Flats ceased
in 1983
White Rock Minerals Ltd ASXWRM March 2017
Project Metrics including the CRH Financing
21
CRH Streaming Financing Cost- a minimum of 40000 ounces of gold equivalent over a 7-year period (at a minimum of 20 of its annual production) The Financial Metrics in the Scoping Study as a result of this financing are- Mt Carrington expected to still generate A$54M in free cash flow over its initial 7-year mine life
with a project NPV10 of A$374M At previous 2016 spot prices (A$1750oz Au and A$25oz Ag)-
free cash flow is ~A$81M (up 50) with a project NPV10 of A$539M (up 44) White Rock maintains 100 ownership of the asset White Rock can advance its exciting zinc-silver VMS Project in Alaska The proposed gold streaming financing arrangement is non-dilutive to shareholders White Rock gains a cornerstone strategic partner for the 9+ year journey WRM joins a stable of other gold investments made by CRH ndash ASX listed Orinoco TSX-V listed K92 Mining TSX-V listed Equitas Resources and TSX-V Sage Gold Inc
White Rock Minerals Ltd ASXWRM March 2017 22
Red Mountain Alaska
Advanced Zinc-Silver-Lead-Gold VMS Exploration Project
White Rock Minerals Ltd ASXWRM March 2017
Red Mountain Project
Red Mountain Alaska polymetallic VMS deposit ndash advanced exploration asset with
significant potential exploration upside Located in central Alaska 100km south of Fairbanks in the
Bonnifield Mining District Acquired from Atlas Resources - White Rock has expanded the
tenement package to comprise 224 mining claims over a total area of 143kmsup2
Contains polymetallic VMS mineralisation rich in zinc silver and lead with previous exploration defining mineralisation at the two main prospects (Dry Creek and West Tundra Flats)
No exploration since 1999 Project held privately for the last decade
Red Mountain
Red Mountain Location
Alaska
Refer to WRM release to the ASX of 15 February 2016 - White Rock Minerals Propose to Acquire VMS Project in Alaska
23
White Rock Minerals Ltd ASXWRM March 2017
Polymetallic VMS project ndash zinc and silver rich Discovered in 1975 ndash sulphide outcrop Historic exploration from 1975-1999 Two deposits discovered
Discovery Fosters (Red Mountain) West Tundra Flats (WTF)
Mineralisation from surface Good preliminary metallurgical test work results with
recoveries gt90 zinc gt70 lead gt80 gold gt70 Ag 143kmsup2 land position established ndash highly prospective
Historic Work ndash Resource Potential
24
Dry Creek 46m 235 Zn 531gt Ag 85 Pb 15gt Au amp 10 Cu from 61m
55m 259 Zn 346gt Ag 117 Pb 25gt Au amp 09 Cu from 695m
71m 151 Zn 334gt Ag 68 Pb 09gt Au amp 03 Cu from 391m
West Tundra Flats
13m 210 Zn 796gt Ag 92 Pb 102gt Au amp 06 Cu from 586m
30m 73 Zn 796gt Ag 43 Pb 11gt Au amp 02 Cu from 1609m
17m 114 Zn 372gt Ag 60 Pb 17gt Au amp 02 Cu from 1043m
1st JORC 2012 Resource Estimate currently being done
White Rock Minerals Ltd ASXWRM March 2017
Priority Conductivity Targets
25
Conductivity targets prioritised by geochemistry bull Geochemical alteration proximal to VMS mineralisation bull Direct base metal and precious metal anomalies
Existing deposits
Identified 30 targets
White Rock Minerals Ltd ASXWRM March 2017
Indicative Activity Timeline
26
2017 2018 2019 2020
Stage 2 ndash Silver
Stage 1 - Gold Feasibility Study 12 months Production
Construction amp Commissioning
12 months
Gold amp Silver LoM Extension
Red Mountain Exploration
Life-of-Mine Extensional and
Exploration Drilling
Phase 2 Field Studies ndash geochem geophysics
3 years after Gold Production
Phase 3 Target identification amp Drilling
Phase 1 Data collation and
JORC Resource
EIS Studies amp Permitting 18 to 24 months
White Rock Minerals Ltd ASXWRM March 2017
Low cost gold silver start-up opportunity DFS commenced for its cornerstone Mt Carrington Project-
Robust initial 7-year operation Low capital cost (ltA$30M) with ~A$20M in infrastructure already in place Less than one year payback Shallow low strip ratio mineralisation C1 cash costltA$800oz AuEq NPV10 of ~A$60M an IRR of 103 and free cash of ~A$100M expected (pre financing)
Key terms for a conditional fully funded construction financing package agreed Experienced Board and Management Geological geographical and commodity diversification for investors Significant potential for resource expansions and new discoveries Exciting high-grade zinc and silver VMS potential in Alaska
LOOKING AHEAD
27
Refer to WRM release to the ASX of 20 October 2016 - Initial Mining review demonstrates significant upside potential at Mt Carrington The material assumptions relating to the scoping study at Mt Carrington provided in Annexure A of the ASX Announcement dated 20 October 2016 continue to apply and have not materially changed
White Rock Minerals Ltd ASXWRM March 2017 28
Appendices bull Mt Carrington Exploration Upside bull Mt Carrington Resource Statement bull Red Mountain Back-up Information
White Rock Minerals Ltd ASXWRM March 2017
Mt Carrington ndash Exploration upside
29
Over 180km2 of tenements highly prospective for epithermal and intrusion-related gold silver and copper mineralisation Priority Near-Mine Targets 1 Mining Leases Potential Resource Additions
Multiple shallow targets Historic drill intercepts for follow-up High grade underground potential poorly tested
2 Exploration Licences Silver-Gold-Copper Targets
Pipeline of prospects Drill ready targets based on
bull Mapping bull Geochemcial anomalies bull Geophysical IPresistivity anomalies
3 Porphyry Potential Zoned Copper-Gold-Silver Robust intrusion related copper model at Mt Carrington Strong secondary copper in shallow drilling Large open geophysical IP anomalies with confirmed alteration
source Under-drilled Similar zoned Copper-Gold-Silver systems recognised at White
Rock and Red Rock
White Rock Minerals Ltd ASXWRM March 2017 30
Resources reported in accordance with the JORC (2004) code
MT CARRINGTON JORC (2004) MINERAL RESOURCES ndash JANUARY 2015 Silver Dominant Resources
Resource Category Deposit Tonnes Gold grade (gt) Gold ounces Silver grade
(gt) Silver
ounces
Indicated Lady Hampden 1840000 06 37000 69 4056000
White Rock 1710000 - - 77 4214000 Sub-Total 3550000 03 37000 72 8270000
Inferred
Lady Hampden 2470000 03 27000 51 4023000 White Rock 2660000 - - 47 3978000
White Rock North 3180000 - - 52 5314000 Silver King 640000 - - 59 1218000 Sub-Total 8950000 01 27000 51 14533000
Total
Lady Hampden 4310000 05 64000 58 8079000 White Rock 4370000 - - 58 8192000
White Rock North 3180000 - - 52 5314000 Silver King 640000 - - 59 1218000
Total 12500000 02 64000 57 22803000 Gold Dominant Resources
Resource Category Deposit Tonnes Gold grade (gt) Gold ounces Silver grade
(gt) Silver ounces
Indicated Strauss 1240000 14 57000 38 153000
Kylo 1590000 12 59000 26 133000 Sub-Total 2830000 13 116000 31 286000
Inferred
Strauss 1260000 14 56000 26 104000 Kylo 760000 15 35000 18 43000
Red Rock 1630000 10 54000 35 182000 Guy Bell 160000 25 13000 49 24000
Sub-Total 3810000 13 158000 29 353000
Total
Strauss 2500000 14 113000 32 257000 Kylo 2350000 13 95000 23 176000
Red Rock 1630000 10 54000 35 182000 Guy Bell 160000 25 13000 49 24000
Total 6640000 13 275000 30 639000 Total Resources
Category Tonnes Gold ounces Silver ounces Indicated 6380000 153000 8556000 Inferred 12760000 185000 14886000
Total 19140000 338000 23442000
Mount Carrington Resource Statement
The Resources figures are currently being updated to comply with the JORC Code 2012 as a part of the Definitive Feasibility Study currently underway
White Rock Minerals Ltd ASXWRM March 2017
Alaska is an exploration and mining friendly state bull Well developed history of gold and base metal mining bull Stable and attractive tax regime bull Efficient permitting
Central Alaska location ~100km to the south of Fairbanks
Good location with respect to infrastructure and logistics
bull Major road and rail access located 80km to the west bull Connection to port of Anchorage (400km south) bull Access from Fairbanks via helicopter or fixed wing aircraft bull Access to fresh water bull No community or environmental legacy issues bull Established mining hub at Fairbanks services mines
including Pogo Fort Knox and Usibelli
Project Overview- Red Mountain Alaska
32km State Claims
Alaska
Pogo Gold Mine
Red Mountain ndash Project Location
31
White Rock Minerals Ltd ASXWRM March 2017
Red Mountain Geology and Mineralisation Red Mountain ndash Regional Geology
World class deposits with similar siliciclastic felsic associations to the Bonnifield district include- Rio Tinto (Cu-Zn-Pb-Au-Ag Spain) Brunswick 12 (Zn-Pb-Ag Canada) and Eskay Creek (Au-Ag-Zn-Pb Canada)
Analysis of worldwide VMS deposits of this type indicate
promising exploration potential for Red Mountain- The deposits nearly always occur in clusters The presence and spatial relationships of the two
separate deposits at Red Mountain may prove to be a significant exploration vector for discovery of further deposits
32
White Rock Minerals has engaged world-renowned VMS expert Dr Jim Franklin to assist with assessing the prospectivity of the district and targeting additional mineralisation
White Rock Minerals Ltd ASXWRM March 2017
HOLE ID From (m)
To (m)
Interval (m) Zn Pb Cu Ag gt Au gt
DC76-02 386 503 116 529 216 022 112 NA DC97-01 411 524 113 760 318 026 115 099 including 411 428 17 2001 852 062 266 147 DC97-04 625 750 125 1251 552 071 160 114 including 695 750 55 2589 1172 088 346 246 DC97-14 570 753 183 139 023 208 15 024 including 591 634 43 006 004 675 15 004 DC97-30 177 209 32 919 472 041 226 116 DC97-31 290 314 24 1272 645 035 1061 382 DC97-32 279 339 61 1443 683 036 137 061 including 303 334 31 2008 952 052 169 078 DC97-33 391 462 71 1512 681 030 334 086 DC98-38 590 680 90 540 243 015 269 100 including 615 638 23 1324 582 030 581 307 DC98-39 776 988 212 699 320 019 57 038 including 776 890 114 1038 478 028 56 051 with 776 826 50 1774 780 045 64 045 DC98-40 61 422 361 624 256 022 183 103 Including 61 107 46 2354 845 102 531 153 including 213 245 31 1465 665 025 211 053 DC98-60 176 865 689 402 188 010 58 036 including 538 588 49 1017 496 028 86 039 WTF82-05 1043 1061 17 1140 597 015 374 171 WTF82-08 1609 1640 30 728 427 017 796 112 WTF83-17 586 599 13 2092 917 056 796 1022
Gold and silver intercepts indicate
significant by-product potential
Multiple shallow intercepts indicate
potential for stacked high-grade lodes
Drilling at Discovery and Fosters Zones
ceased in 1999
Historic Drilling
33
Drilling at West Tundra Flats ceased
in 1983
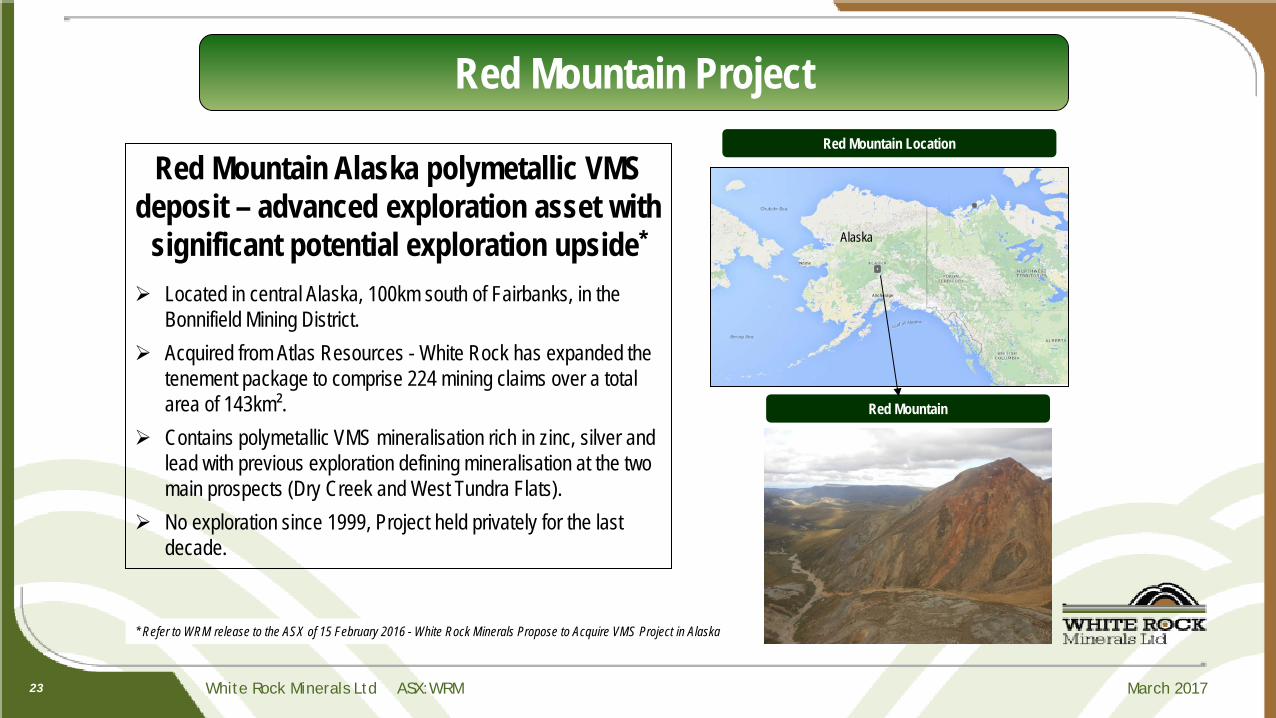
White Rock Minerals Ltd ASXWRM March 2017
Low cost gold silver start-up opportunity DFS commenced for its cornerstone Mt Carrington Project-
Robust initial 7-year operation Low capital cost (ltA$30M) with ~A$20M in infrastructure already in place Less than one year payback Shallow low strip ratio mineralisation C1 cash costltA$800oz AuEq NPV10 of ~A$60M an IRR of 103 and free cash of ~A$100M expected (pre financing)
Key terms for a conditional fully funded construction financing package agreed Experienced Board and Management Geological geographical and commodity diversification for investors Significant potential for resource expansions and new discoveries Exciting high-grade zinc and silver VMS potential in Alaska
LOOKING AHEAD
27
Refer to WRM release to the ASX of 20 October 2016 - Initial Mining review demonstrates significant upside potential at Mt Carrington The material assumptions relating to the scoping study at Mt Carrington provided in Annexure A of the ASX Announcement dated 20 October 2016 continue to apply and have not materially changed
White Rock Minerals Ltd ASXWRM March 2017 28
Appendices bull Mt Carrington Exploration Upside bull Mt Carrington Resource Statement bull Red Mountain Back-up Information
White Rock Minerals Ltd ASXWRM March 2017
Mt Carrington ndash Exploration upside
29
Over 180km2 of tenements highly prospective for epithermal and intrusion-related gold silver and copper mineralisation Priority Near-Mine Targets 1 Mining Leases Potential Resource Additions
Multiple shallow targets Historic drill intercepts for follow-up High grade underground potential poorly tested
2 Exploration Licences Silver-Gold-Copper Targets
Pipeline of prospects Drill ready targets based on
bull Mapping bull Geochemcial anomalies bull Geophysical IPresistivity anomalies
3 Porphyry Potential Zoned Copper-Gold-Silver Robust intrusion related copper model at Mt Carrington Strong secondary copper in shallow drilling Large open geophysical IP anomalies with confirmed alteration
source Under-drilled Similar zoned Copper-Gold-Silver systems recognised at White
Rock and Red Rock
White Rock Minerals Ltd ASXWRM March 2017 30
Resources reported in accordance with the JORC (2004) code
MT CARRINGTON JORC (2004) MINERAL RESOURCES ndash JANUARY 2015 Silver Dominant Resources
Resource Category Deposit Tonnes Gold grade (gt) Gold ounces Silver grade
(gt) Silver
ounces
Indicated Lady Hampden 1840000 06 37000 69 4056000
White Rock 1710000 - - 77 4214000 Sub-Total 3550000 03 37000 72 8270000
Inferred
Lady Hampden 2470000 03 27000 51 4023000 White Rock 2660000 - - 47 3978000
White Rock North 3180000 - - 52 5314000 Silver King 640000 - - 59 1218000 Sub-Total 8950000 01 27000 51 14533000
Total
Lady Hampden 4310000 05 64000 58 8079000 White Rock 4370000 - - 58 8192000
White Rock North 3180000 - - 52 5314000 Silver King 640000 - - 59 1218000
Total 12500000 02 64000 57 22803000 Gold Dominant Resources
Resource Category Deposit Tonnes Gold grade (gt) Gold ounces Silver grade
(gt) Silver ounces
Indicated Strauss 1240000 14 57000 38 153000
Kylo 1590000 12 59000 26 133000 Sub-Total 2830000 13 116000 31 286000
Inferred
Strauss 1260000 14 56000 26 104000 Kylo 760000 15 35000 18 43000
Red Rock 1630000 10 54000 35 182000 Guy Bell 160000 25 13000 49 24000
Sub-Total 3810000 13 158000 29 353000
Total
Strauss 2500000 14 113000 32 257000 Kylo 2350000 13 95000 23 176000
Red Rock 1630000 10 54000 35 182000 Guy Bell 160000 25 13000 49 24000
Total 6640000 13 275000 30 639000 Total Resources
Category Tonnes Gold ounces Silver ounces Indicated 6380000 153000 8556000 Inferred 12760000 185000 14886000
Total 19140000 338000 23442000
Mount Carrington Resource Statement
The Resources figures are currently being updated to comply with the JORC Code 2012 as a part of the Definitive Feasibility Study currently underway
White Rock Minerals Ltd ASXWRM March 2017
Alaska is an exploration and mining friendly state bull Well developed history of gold and base metal mining bull Stable and attractive tax regime bull Efficient permitting
Central Alaska location ~100km to the south of Fairbanks
Good location with respect to infrastructure and logistics
bull Major road and rail access located 80km to the west bull Connection to port of Anchorage (400km south) bull Access from Fairbanks via helicopter or fixed wing aircraft bull Access to fresh water bull No community or environmental legacy issues bull Established mining hub at Fairbanks services mines
including Pogo Fort Knox and Usibelli
Project Overview- Red Mountain Alaska
32km State Claims
Alaska
Pogo Gold Mine
Red Mountain ndash Project Location
31
White Rock Minerals Ltd ASXWRM March 2017
Red Mountain Geology and Mineralisation Red Mountain ndash Regional Geology
World class deposits with similar siliciclastic felsic associations to the Bonnifield district include- Rio Tinto (Cu-Zn-Pb-Au-Ag Spain) Brunswick 12 (Zn-Pb-Ag Canada) and Eskay Creek (Au-Ag-Zn-Pb Canada)
Analysis of worldwide VMS deposits of this type indicate
promising exploration potential for Red Mountain- The deposits nearly always occur in clusters The presence and spatial relationships of the two
separate deposits at Red Mountain may prove to be a significant exploration vector for discovery of further deposits
32
White Rock Minerals has engaged world-renowned VMS expert Dr Jim Franklin to assist with assessing the prospectivity of the district and targeting additional mineralisation
White Rock Minerals Ltd ASXWRM March 2017
HOLE ID From (m)
To (m)
Interval (m) Zn Pb Cu Ag gt Au gt
DC76-02 386 503 116 529 216 022 112 NA DC97-01 411 524 113 760 318 026 115 099 including 411 428 17 2001 852 062 266 147 DC97-04 625 750 125 1251 552 071 160 114 including 695 750 55 2589 1172 088 346 246 DC97-14 570 753 183 139 023 208 15 024 including 591 634 43 006 004 675 15 004 DC97-30 177 209 32 919 472 041 226 116 DC97-31 290 314 24 1272 645 035 1061 382 DC97-32 279 339 61 1443 683 036 137 061 including 303 334 31 2008 952 052 169 078 DC97-33 391 462 71 1512 681 030 334 086 DC98-38 590 680 90 540 243 015 269 100 including 615 638 23 1324 582 030 581 307 DC98-39 776 988 212 699 320 019 57 038 including 776 890 114 1038 478 028 56 051 with 776 826 50 1774 780 045 64 045 DC98-40 61 422 361 624 256 022 183 103 Including 61 107 46 2354 845 102 531 153 including 213 245 31 1465 665 025 211 053 DC98-60 176 865 689 402 188 010 58 036 including 538 588 49 1017 496 028 86 039 WTF82-05 1043 1061 17 1140 597 015 374 171 WTF82-08 1609 1640 30 728 427 017 796 112 WTF83-17 586 599 13 2092 917 056 796 1022
Gold and silver intercepts indicate
significant by-product potential
Multiple shallow intercepts indicate
potential for stacked high-grade lodes
Drilling at Discovery and Fosters Zones
ceased in 1999
Historic Drilling
33
Drilling at West Tundra Flats ceased
in 1983

White Rock Minerals Ltd ASXWRM March 2017
Mt Carrington ndash Exploration upside
29
Over 180km2 of tenements highly prospective for epithermal and intrusion-related gold silver and copper mineralisation Priority Near-Mine Targets 1 Mining Leases Potential Resource Additions
Multiple shallow targets Historic drill intercepts for follow-up High grade underground potential poorly tested
2 Exploration Licences Silver-Gold-Copper Targets
Pipeline of prospects Drill ready targets based on
bull Mapping bull Geochemcial anomalies bull Geophysical IPresistivity anomalies
3 Porphyry Potential Zoned Copper-Gold-Silver Robust intrusion related copper model at Mt Carrington Strong secondary copper in shallow drilling Large open geophysical IP anomalies with confirmed alteration
source Under-drilled Similar zoned Copper-Gold-Silver systems recognised at White
Rock and Red Rock
White Rock Minerals Ltd ASXWRM March 2017 30
Resources reported in accordance with the JORC (2004) code
MT CARRINGTON JORC (2004) MINERAL RESOURCES ndash JANUARY 2015 Silver Dominant Resources
Resource Category Deposit Tonnes Gold grade (gt) Gold ounces Silver grade
(gt) Silver
ounces
Indicated Lady Hampden 1840000 06 37000 69 4056000
White Rock 1710000 - - 77 4214000 Sub-Total 3550000 03 37000 72 8270000
Inferred
Lady Hampden 2470000 03 27000 51 4023000 White Rock 2660000 - - 47 3978000
White Rock North 3180000 - - 52 5314000 Silver King 640000 - - 59 1218000 Sub-Total 8950000 01 27000 51 14533000
Total
Lady Hampden 4310000 05 64000 58 8079000 White Rock 4370000 - - 58 8192000
White Rock North 3180000 - - 52 5314000 Silver King 640000 - - 59 1218000
Total 12500000 02 64000 57 22803000 Gold Dominant Resources
Resource Category Deposit Tonnes Gold grade (gt) Gold ounces Silver grade
(gt) Silver ounces
Indicated Strauss 1240000 14 57000 38 153000
Kylo 1590000 12 59000 26 133000 Sub-Total 2830000 13 116000 31 286000
Inferred
Strauss 1260000 14 56000 26 104000 Kylo 760000 15 35000 18 43000
Red Rock 1630000 10 54000 35 182000 Guy Bell 160000 25 13000 49 24000
Sub-Total 3810000 13 158000 29 353000
Total
Strauss 2500000 14 113000 32 257000 Kylo 2350000 13 95000 23 176000
Red Rock 1630000 10 54000 35 182000 Guy Bell 160000 25 13000 49 24000
Total 6640000 13 275000 30 639000 Total Resources
Category Tonnes Gold ounces Silver ounces Indicated 6380000 153000 8556000 Inferred 12760000 185000 14886000
Total 19140000 338000 23442000
Mount Carrington Resource Statement
The Resources figures are currently being updated to comply with the JORC Code 2012 as a part of the Definitive Feasibility Study currently underway
White Rock Minerals Ltd ASXWRM March 2017
Alaska is an exploration and mining friendly state bull Well developed history of gold and base metal mining bull Stable and attractive tax regime bull Efficient permitting
Central Alaska location ~100km to the south of Fairbanks
Good location with respect to infrastructure and logistics
bull Major road and rail access located 80km to the west bull Connection to port of Anchorage (400km south) bull Access from Fairbanks via helicopter or fixed wing aircraft bull Access to fresh water bull No community or environmental legacy issues bull Established mining hub at Fairbanks services mines
including Pogo Fort Knox and Usibelli
Project Overview- Red Mountain Alaska
32km State Claims
Alaska
Pogo Gold Mine
Red Mountain ndash Project Location
31
White Rock Minerals Ltd ASXWRM March 2017
Red Mountain Geology and Mineralisation Red Mountain ndash Regional Geology
World class deposits with similar siliciclastic felsic associations to the Bonnifield district include- Rio Tinto (Cu-Zn-Pb-Au-Ag Spain) Brunswick 12 (Zn-Pb-Ag Canada) and Eskay Creek (Au-Ag-Zn-Pb Canada)
Analysis of worldwide VMS deposits of this type indicate
promising exploration potential for Red Mountain- The deposits nearly always occur in clusters The presence and spatial relationships of the two
separate deposits at Red Mountain may prove to be a significant exploration vector for discovery of further deposits
32
White Rock Minerals has engaged world-renowned VMS expert Dr Jim Franklin to assist with assessing the prospectivity of the district and targeting additional mineralisation
White Rock Minerals Ltd ASXWRM March 2017
HOLE ID From (m)
To (m)
Interval (m) Zn Pb Cu Ag gt Au gt
DC76-02 386 503 116 529 216 022 112 NA DC97-01 411 524 113 760 318 026 115 099 including 411 428 17 2001 852 062 266 147 DC97-04 625 750 125 1251 552 071 160 114 including 695 750 55 2589 1172 088 346 246 DC97-14 570 753 183 139 023 208 15 024 including 591 634 43 006 004 675 15 004 DC97-30 177 209 32 919 472 041 226 116 DC97-31 290 314 24 1272 645 035 1061 382 DC97-32 279 339 61 1443 683 036 137 061 including 303 334 31 2008 952 052 169 078 DC97-33 391 462 71 1512 681 030 334 086 DC98-38 590 680 90 540 243 015 269 100 including 615 638 23 1324 582 030 581 307 DC98-39 776 988 212 699 320 019 57 038 including 776 890 114 1038 478 028 56 051 with 776 826 50 1774 780 045 64 045 DC98-40 61 422 361 624 256 022 183 103 Including 61 107 46 2354 845 102 531 153 including 213 245 31 1465 665 025 211 053 DC98-60 176 865 689 402 188 010 58 036 including 538 588 49 1017 496 028 86 039 WTF82-05 1043 1061 17 1140 597 015 374 171 WTF82-08 1609 1640 30 728 427 017 796 112 WTF83-17 586 599 13 2092 917 056 796 1022
Gold and silver intercepts indicate
significant by-product potential
Multiple shallow intercepts indicate
potential for stacked high-grade lodes
Drilling at Discovery and Fosters Zones
ceased in 1999
Historic Drilling
33
Drilling at West Tundra Flats ceased
in 1983
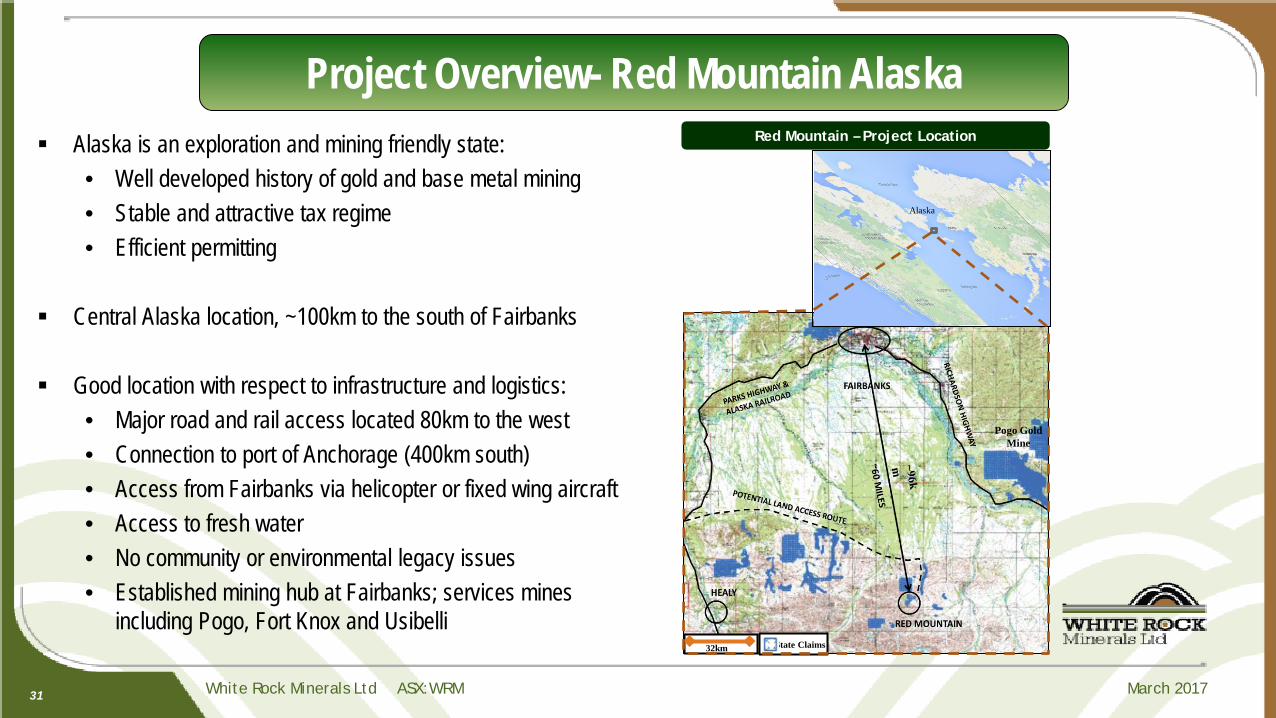
White Rock Minerals Ltd ASXWRM March 2017
Red Mountain Geology and Mineralisation Red Mountain ndash Regional Geology
World class deposits with similar siliciclastic felsic associations to the Bonnifield district include- Rio Tinto (Cu-Zn-Pb-Au-Ag Spain) Brunswick 12 (Zn-Pb-Ag Canada) and Eskay Creek (Au-Ag-Zn-Pb Canada)
Analysis of worldwide VMS deposits of this type indicate
promising exploration potential for Red Mountain- The deposits nearly always occur in clusters The presence and spatial relationships of the two
separate deposits at Red Mountain may prove to be a significant exploration vector for discovery of further deposits
32
White Rock Minerals has engaged world-renowned VMS expert Dr Jim Franklin to assist with assessing the prospectivity of the district and targeting additional mineralisation
White Rock Minerals Ltd ASXWRM March 2017
HOLE ID From (m)
To (m)
Interval (m) Zn Pb Cu Ag gt Au gt
DC76-02 386 503 116 529 216 022 112 NA DC97-01 411 524 113 760 318 026 115 099 including 411 428 17 2001 852 062 266 147 DC97-04 625 750 125 1251 552 071 160 114 including 695 750 55 2589 1172 088 346 246 DC97-14 570 753 183 139 023 208 15 024 including 591 634 43 006 004 675 15 004 DC97-30 177 209 32 919 472 041 226 116 DC97-31 290 314 24 1272 645 035 1061 382 DC97-32 279 339 61 1443 683 036 137 061 including 303 334 31 2008 952 052 169 078 DC97-33 391 462 71 1512 681 030 334 086 DC98-38 590 680 90 540 243 015 269 100 including 615 638 23 1324 582 030 581 307 DC98-39 776 988 212 699 320 019 57 038 including 776 890 114 1038 478 028 56 051 with 776 826 50 1774 780 045 64 045 DC98-40 61 422 361 624 256 022 183 103 Including 61 107 46 2354 845 102 531 153 including 213 245 31 1465 665 025 211 053 DC98-60 176 865 689 402 188 010 58 036 including 538 588 49 1017 496 028 86 039 WTF82-05 1043 1061 17 1140 597 015 374 171 WTF82-08 1609 1640 30 728 427 017 796 112 WTF83-17 586 599 13 2092 917 056 796 1022
Gold and silver intercepts indicate
significant by-product potential
Multiple shallow intercepts indicate
potential for stacked high-grade lodes
Drilling at Discovery and Fosters Zones
ceased in 1999
Historic Drilling
33
Drilling at West Tundra Flats ceased
in 1983
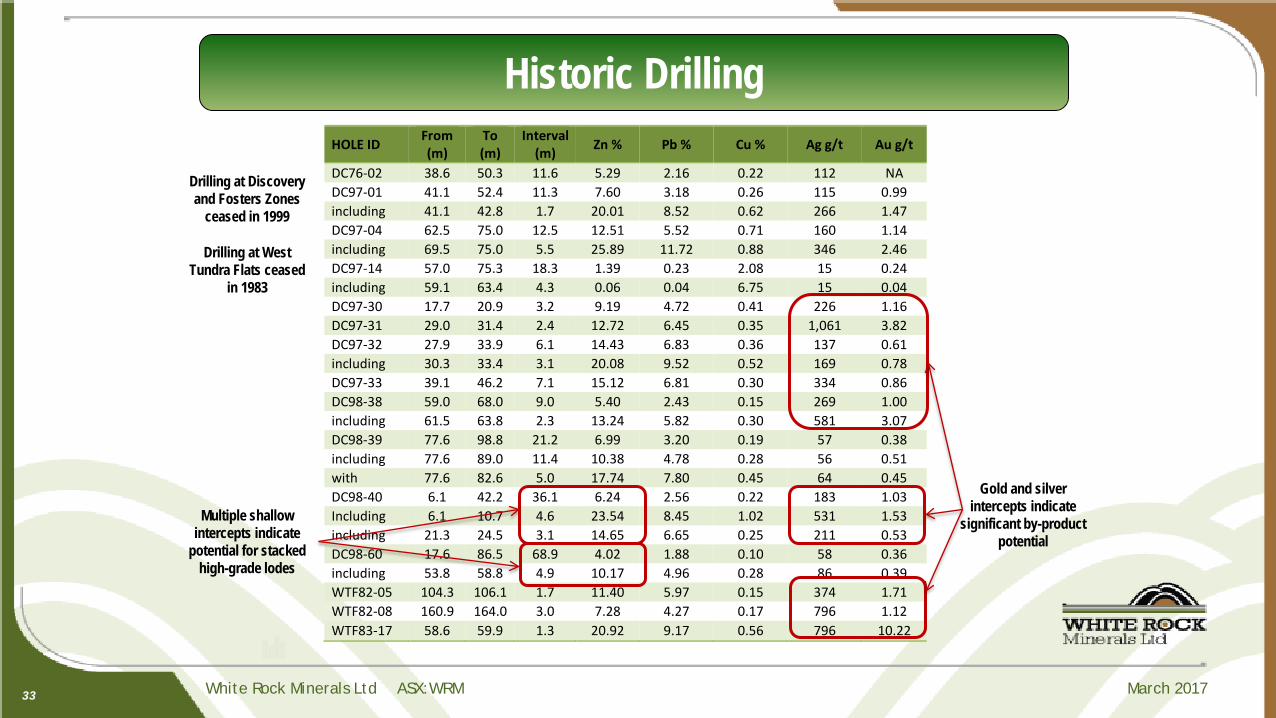
White Rock Minerals Ltd ASXWRM March 2017
Regional Geochemical Targets
Geochemical target areas defined by modern vector analysis completed by Dr Jim Franklin Each target area shows alteration that indicates proximal VMS mineralisation
34
White Rock Minerals Ltd ASXWRM March 2017
Regional Conductors
Conductivity anomalies analogous to the Dry Creek and WTF deposits have been defined by Condor Geophysics using the State of Alaska DIGHEM survey from 2007
35
White Rock Minerals Ltd ASXWRM March 2017
Exploration Upside
Red Mountain ndash WTF Schematic Cross Section
Red Mountain Claim Coverage Historic data has been compiled in 3D and integrated with more recent airborne
EM amp magnetics flown by the Alaskan Geological Survey in 2007 to define a suite of high priority targets
Blue sky upside for significant new discoveries exist Immediately along strike east and west Down dip as additional high grade lenses The syncline between Red Mountain and WTF presents the obvious large
tonnage target with potential for structural upgrade in the hinge Analysis of the Red Mountain and WTF deposits in the context of similar VMS
districts worldwide indicate VMS deposits typically occur in clusters (ldquoVMS campsrdquo) at regular spacing
Deposit sizes within camps follow a log normal distribution Modern exploration has not been applied
The massive sulphides occur as stacked lenses with additional potential in the hangingwall and footwall that remains untested
There is potential for a significantly enriched gold zone in the hangingwall of the deposit which may have been missed by previous explorers
Historic drilling shows increasing grade with depth that remains untested
36
White Rock Minerals Ltd ASXWRM March 2017
Agreement with Metallogeny
The key terms of the Red Mountain Project at
acquisition in 2016 were as follows US$1225m expenditure commitment
over 4 years US$10m in cash payments over 5 years Share payments 1 million shares Metallogeny retain a right to 10 of the
proceeds on any sale of the claims prior to commercial production 2 NSR with the option to acquire 1
(ie 50 of NSR) for US$2m
Original Claims
37
CORPORATE PRESENTATION March 2017
Forward Looking Statement
This presentation has been prepared by Aurelia Metals Limited (ldquoAMIrdquo or the ldquoCompanyrdquo) It should not be considered as an offer or invitation to subscribe for or purchase any securities in the Company or as an inducement to make an offer or invitation with respect to those securities No agreement to subscribe for securities in the Company will be entered into on the basis of this presentation It is not to be distributed to third parties without the consent of AMI This presentation contains forward-looking statements and projected drilling schedules that are not based on historical fact including those identified by the use of forward-looking terminology containing such words as ldquobelievesrdquo ldquomayrdquo ldquowillrdquo ldquoestimatesrdquo ldquocontinuerdquo ldquoanticipatesrdquo ldquointendsrdquo ldquoexpectsrdquo ldquoshouldrdquo ldquoschedulerdquo ldquoprogramrdquo ldquopotentialrdquo or the negatives thereof and words of similar import Management of AMI cautions that these forward-looking statements are subject to risks and uncertainties that could cause actual events or results to differ materially from those expressed or implied by the statements Management believes that the estimates are reasonable but should not unduly be relied upon AMI makes no representation warranty (express or implied) or assurance as to the completeness or accuracy of these projections and accordingly expresses no opinion or any other form of assurance regarding them Management does not intend to publish updates or revisions of any forward-looking statements included in this document to reflect Aureliarsquos circumstances after the date hereof or to reflect subsequent market analysis By its very nature exploration for gold and copper is a high risk business and is not suitable for certain investors AMI securities are speculative Potential investors should consult their stockbroker or financial advisor There are a number of risks both specific to AMI and of a general nature which may affect the future operating and financial performance of AMI and the value of an investment in AMI including and not limited to economic conditions stock market fluctuations gold copper and silver price movements regional infrastructure constrains securing drilling rigs timing of approvals from relevant authorities regulatory risks operational risks reliance on key personnel and foreign currency fluctuations You should not act or refrain from acting in reliance on this presentation material This overview of AMI does not purport to be all inclusive or to contain all information which its recipients may require in order to make an informed assessment of the Companyrsquos prospects You should conduct your own investigation and perform your own analysis in order to satisfy yourself as to the accuracy and completeness of the information statements and opinions contained in this presentation before making any investment decision 2
Corporate Information
3
ASX Code AMI Market Cap $99M (at 23cshare)
Issued Capital 431M Shares 10M options at 125c with Pacific Road 65M Perf Rghts
Net debt $94M 31 Dec 16 ($107M 30 June 16) Cash $21M (Dec 16) Debt $115M (Dec 16)
Key shareholders PacRoad 336 Glencore 67 Yunnan Tin TDK 71 YTC Holdings 28
BoardManagement Board amp Senior Management Renewal
Non-Exec Chairman Colin Johnstone (appointed Nov 16) MD amp CEO James Simpson (appointed Aug 16)
Non-Exec Directors Gary Comb Paul Espie Michael Menzies Rune Symann
CFO amp CoSec Hera GM
Timothy Churcher Scott Ramsay (appointed May 16)
Key Assets ndash Gold lead zinc silver amp copper
4
Hera Mine (100) Gold lead zinc silver production Central NSW
Commercial Production Started April 15 (2 years into mine life)
Gold 47000 oz production in FY16
Lead 7600 t production in FY16
Zinc 7200 t production in FY16
Nymagee Project (95) Copper lead zinc opportunity Central NSW ndash 5 km north of Hera
Inferred amp Indicated Resource (as disclosed in 2016 Annual Report)
Large and low grade 81Mt at 12 Cu1 Pb+Zn 9 gt Ag
Potential for smaller discrete higher grade copper and leadzinc zones
Scoping study underway to assess
Key Assets ndash History
5
Hera Mine (100) Gold lead zinc production Central NSW
Commissioning Started Aug 2014 (8 month duration)
Production Commerical production declared 1 April 2015
Key Lessons Project start-up and finance issues
Capital Structure - Inappropriate capital structure (single asset 100 debt funded)
- Insufficient working capital (to cope with timing of commissioning and receivables)
People - Skill set required to move from junior explorer to producer
- Skill set required to operate a complex multi-metal processing facility
6
Key Assets ndash Located in the productive Cobar Region
Bourke
Cobar Nyngan
Parkes ORANGE
Bathurst
Lithgow
Newcastle
SYDNEY 100kms
Nymagee Cu Project
Hera AuPbZn Mine
Cobar Basin
A u s t r a l i a
NSW
Endeavour ZnPbAg (Toho)
CSA Cu (Glencore)
Peak AuCu (New Gold)
Mallee bull CuPbZn project (PeelCBH)
Wonawinta Ag
First half FY17 ndash Highlights
7
bull Strong H1 FY17 Result
bull Profit cash flow amp debt reduction
bull Improved operations bull Ore processed up 22 on pcp bull Gold recovery to 866 bull Gold production up 22 on pcp
bull Strong cash build bull Cash build to $21M after
voluntary $10M debt repayment bull 21 reduction in net debt
relative to pcp - $119M to $94M ldquopcprdquo Prior Corresponding Period
Key Focus ndash Deliver strong operating performance
8 Gravity gold recovery increased from 42 to 62 over the same period
Key Focus ndash Deliver lower operating costs
9
Key Focus ndash Deliver low all-in cost
10
A$oz
Source Curran amp Co
bull Competitive Cost profile
Dec 16 Qtr Gold production of 13427 oz at an AISC of A$821oz (US$592oz)
AMIrsquos AISC vs ASX Peers ndash Dec Qrsquo16 Actuals
Key Focus ndash Deliver strong cash margin
11
bull Strong cash flow generation from high-margin operation
Key Focus ndash Deliver consistent production
12 2016 Calendar year gold production of 50899 oz
13
bull Debt reduction to provide optionality leading up to 31 Mar 18
bull Option to convert up to $755M of $115M debt just prior to 31 March 18 bull Options to repayrefinance or allow existing debt (covenant light) to run its course
Key Focus ndash Deliver reduced net debt
Gearing at 31 Dec 16 was 64 (share price 135c) Using current market cap (share price 23c) Gearing has reduced to 49 (Gearing defined as net debt(net debt+mkt value of equity)
Key Focus ndash Deliver growth in mine life
14
N
North Pod
S N
Stoped areas
(purple)
Planned Stopes
As built mine development
Planned mine development
Target Zone
500 m below surface
HRUD410
23m at 108 Pb+Zn 26gt Au 63gt Ag
400L
450L
500L
550L
600L
50 metres High Grade Open at Depth
High Grade Open Up-dip
NORTH POD LONG SECTION
New Drilling Results
Existing Drill Hole Mineralised Trend
NovDec16 results
High Grade PbZnAg High Grade Gold
Mine Long Section
North Pod
450L
500L
550L
NORTH
HRUD374 7m at 527 Pb+Zn
47gt Au 203gt Ag
HRUD370
7m at 881gt Au 43 Pb+Zn 47gt Ag
HRUD409 21m at 117gt Au
52 Pb+Zn 32gt Ag
Key Focus ndash Deliver growth in mine life (North Pod)
HRUD407 25m at 112gt Au
25 Pb+Zn 14gt Ag
Hera Mine Plan Showing Drill Traces and Main Mineralised Lodes
N 200m North Pod
1530 Hays South
Main South
Main North
Far West Hays North
Target Zone
16
Key Focus ndash Deliver growth in mine life
Structural Repetition
bull Potential for northern extensions of Hera lode system
bull Utilise downhole geochem and geophysics as tools to vector to mineralisation
17
Key Focus ndash Deliver growth in mine life (Nymagee)
Nymagee Copper Project
Hera Mine
Nymagee CuPbZn
bull Historic mine and current resource located 5km north of Hera Mine
bull Ability to leverage off Hera mine infrastructure
N 5 km
Lease boundary
18
Key Focus ndash Deliver growth in mine life (Nymagee)
Nymagee CuPbZn
bull Current large (8Mt) relative low grade resource down to 500 m below surface
bull Cu grade 12 bull Pb+Zn grade 1
bull Scoping Study underway to understand potential to selectively mine higher grade copper and leadzinc zones
bull Multiple exploration targets exist
Nymagee Long Section
300 m below surface
500 m below surface
700 m below surface
Current Resource Shell
Detail on the Nymagee Resource can be found in the Companyrsquos 2016 Annual Report
Key Focus ndash Deliver growth in mine life (Mine Trend)
Mine Corridor
bull Hera-Nymagee corridor remains highly prospective
bull The Hera amp Nymagee deposits are both marked by prominent gravity highs
bull Several gravity targets have been defined along 20km of strike
bull Potential for Hera-Nymagee corridor to evolve into Cobar field equivalent
20
Key Focus ndash Deliver Shareholder Returns
Conclusion
21
Strategy to Deliver Generate cash Continuously improve operational performance
- Continuous improvement in recovery and throughput - Minimise unit costs - Optimise mine plan (north pod high grade)
Reduce net debt Reduce gearing reduce financial risk
- build optionality leading up to first scheduled debt repayments (Mar-18)
Deliver growth Expansion of base metals capacity North Pod exploration amp strike extensions Scoping Study on copper development opportunity at Nymagee
2
The information in this presentation
bull Is not an offer or recommendation to purchase or subscribe for shares in Cooper Energy Limited or to retain or sell any shares that are
currently held
bull Does not take into account the individual investment objectives or the financial situation of investors
bull Was prepared with due care and attention and is current at the date of the presentation
Actual results may materially vary from any forecasts (where applicable) in this presentation
Before making or varying any investment in shares of Cooper Energy Limited all investors should consider the appropriateness of that
investment in light of their individual investment objectives and financial situation and should seek their own independent professional advice
Qualified petroleum reserves and resources evaluator
This report contains information on petroleum reserves and resources which is based on and fairly represents information and supporting
documentation reviewed by Mr Andrew Thomas who is a full time employee of Cooper Energy Limited holding the position of Exploration
Manager holds a Bachelor of Science (Hons) is a member of the American Association of Petroleum Geologists and the Society of Petroleum
Engineers and is qualified in accordance with ASX listing rule 541 and has consented to the inclusion of this information in the form and context
in which it appears
Rounding
All numbers in this presentation have been rounded As a result some total figures may differ insignificantly from totals obtained from arithmetic
addition of the rounded numbers presented
Reserves and resources calculation
Information on the companyrsquos reserves and resources and their calculation are provided in the appendices to this presentation
Currency
All financial information is expressed in Australian dollars unless otherwise specified
3
Cooper Energy develops and supplies gas to south-east Australia and produces oil from the
western flank of the Cooper Basin
The companyrsquos portfolio features existing gas production 227 PJ of uncontracted gas
and two new gas projects to supply south-east Australia from 2019 onwards backed by long term
contracts with blue chip utility and industrial customers
Existing assets and plans have the company on a 6 year growth trajectory with capacity for
production growth over 20 times FY16 levels
4
Cooper Basin oil
PEL 495
bull Oil production from western flank of Cooper Basin
bull Single gas exploration permit in Otway Basin
bull Poland
bull Romania
bull Indonesia
bull Tunisia
2011 portfolio
5
Otway Basin
bull Builds acreage and technical capability
through merger with Somerton Energy
bull Sub-surface studies reinforce view of
prospectivity
Market
bull Demand and supply-side gas market analysis
bull Commenced engagement with gas buyers
Gippsland Basin
bull Invested in Bass Strait Oil Company which
holds Gippsland permits
bull Technical studies of prospectivity and gas
plays
6
Otway Basin
bull Drilling identifies gas bearing
reservoirs in deep sands Gippsland Basin
bull Acquires 65 interest in Basker Manta Gummy
permits
bull Commenced Manta business case analysis for
supply to south-east Australia
7
Otway Basin
bull Builds understanding of Otway
sub-surface
bull Confirms attraction of offshore
Otway
Gippsland Basin
bull Acquires 50 of Sole gas field
bull Acquires 50 of Orbost Gas Plant
bull Manta business case affirms economic
development opportunity
8
Gippsland Basinbull Sole gas field interest 100
bull Sole gas project FEED completed
bull Orbost Gas Plant 100
bull Manta gas field 100
Otway Basin
bull Acquires Casino Henry Vic P44
Minerva and Minerva Gas Plant
Market
bull O-I Australia gas contract
bull AGL gas contract
bull EnergyAustralia gas
contract
bull Alinta Energy gas
contract
9
Gas contracts
bull 188 PJ contracted from 2017 on
bull EnergyAustralia (Otway amp Sole)
bull AGL Energy (Sole)
bull Alinta Energy (Sole)
bull O-I Australia (Sole)
New gas projects
bull Phase 1 Sole from 2019
ndash Sanction Marchrsquo 17 for March lsquo19 first gas into plant
bull Phase 2 Manta
ndash appraisal well and resource upside
ndash from FY22
bull VIC P44 exploration prospects
Production
bull ~ 7 PJ pa from Casino Henry amp
Minerva1
bull Sold to EnergyAustralia
bull Uncontracted gas to market for
supply from March 18
bull Field life to 2026 (Casino Henry)Plant amp infrastructure
bull Orbost Gas Plant connected to
EGP (subject to APA HoA)
bull Minerva1 Gas Plant (10)
connected to SEA Gas pipeline
bull Patricia Baleen connected to
Orbost and Longtom
1Acquisition of 10 interest in Minerva and Minerva gas plant to be completed
Uncontracted gas
Total of 227 PJ uncontracted in
bull Otway
ndash 52 PJ 2P Casino Henry reserves from March 2018
bull Gippsland
ndash Sole 69 PJ 2C contingent resource uncontracted
ndash Manta 106 PJ 2C contingent resource plus
exploration potential
10
03
Jun-16 Jan-17
FY17 production1
MMboe expected
Gas
Oil
1
49 76
367
668
Jun-16 Jan-17
Contingent resources (2C)12
MMboe
Gas
Oil13
11
104
Jun-16 Jan-17
2P reserves12
MMboe
bull Addition of Otway gas production Jan to Jun 17
bull Gas accounts for 75 of anticipated FY17 production
bull Addition of 60 PJ of Otway Basin gas reserves
bull Gas accounts for 90 of 116 MMboe 2P reserves
bull Australian contingent resources 2C up 79
bull 128 PJ gas contingent resources (2C) added in Gippsland
116
416
744
1Australia only 2 Reserves and Contingent Resources at 1 January 2017 were announced to the ASX on 27 February 2017 and should be read in conjunction with the information provided on the calculation
of Reserves and Contingent Resources provided on page 29 Cooper Energy is not aware of any new information or data that materially affects the information provided in those releases and
all material assumptions and technical parameters underpinning the assessment provided in the announcement continues to apply
11
Forecast 1 south-east Australian gas demand and production
PJ pa
South-east Australia comprises NSW VIC SA and Tasmania
SE Australia demandsup1
1 EnergyQuest Energy Quarterly March 2017
0
10
20
30
40
50
60
70
80
90
100
2017 2018 2019 2020 2021 2022 2023 2024
Cooper Energy gas production profilePJ pa
Manta(100)
Sole (100)
Casino
bull Casino Henry gas contracted to February 2018
bull Casino Henry gas available to contract from March 2018
bull COE may sell down some of Sole Gas Project and Manta post
Sole FID
0
100
200
300
400
500
600
2016 2018 2020 2022 2024 2026 2028 2030 2032 2034 2036
Most certain supply tranche Less certain supply tranche
Least certain supply tranche Southern demand
12Source AEMO
13
1 Assumes
bull Sole sanction by March quarter 2017 for March quarter 2019 first Sole gas
to plant
bull Manta 3 appraisal well
bull Development well required for Casino Henry ~2020
bull Details on slide 26
3 5 1
1520 20 20 20 20 20 20
16102
13
17 11
37 36 36
28
1913
15
10
FY17 FY18 FY19 FY20 FY21 FY22 FY23 FY24 FY25 FY26 FY27 FY28 FY29
Gas production1 from current assets contracted amp uncontractedPJ pa
Uncontracted
Contracted
227 PJ comprises 52 PJ 2P Casino Henry gas and 175 PJ 2C Contingent uncontracted gas from Sole and Manta Profile illustrated includes additional 10 PJ anticipated from Manta Cooper Energy announced Sole Contingent Resources on 27 February 2017 and Manta Contingent Resource 16 July 2015 Cooper Energy is not aware of any new information or data that materially affects the information provided in those releases and all material assumptions and technical parameters underpinning the assessment provided in the announcement continues to apply See notes on page 29 for information on reserves and resources calculation
14
Resource economics
Health amp safety
Environment
CommunityFiscaldividend
SuccessfulSustainable
Value-generating resource
development
Balance not achieved people hurt project collapse uneconomic no community
benefit no fiscal dividend excessive energy
costs
Balance achieved safe environmentally
sound development
cost effective sustainable energy
community benefits
fiscal dividend
15
Casino Henry
bull Sustained growth profile over 6 years
bull Gas accounts for overwhelming majority of production
bull New assets and production profile generates
ndash FY17 production gt2x FY16 production
ndash FY19 production gt5x FY16 production
ndash FY22 production gt20x FY16 production
0
2
4
6
8
10
12
FY15 FY16 FY17 FY18 FY19 FY20 FY21 FY22 FY23 FY24
Production1
MMboe
Sole Gas Project
Manta Gas Project
Casino-Henry
Cooper Basin oil
Assumes1
bull Current equities COE may divest some Gippsland post Sole sanction
bull Sole sanction by March quarter 2017 for March quarter 2019 Sole gas to plant
bull Manta 3 appraisal well
bull Development well required for Casino Henry ~2020
bull No new exploration success
16
Sole FID
bull Financial commitment to project
bull Triggers 43 MMboe uplift in gas reserves
bull Translation of HoA with APA to formal agreement
bull Expected shortly after project sanction
Uncontracted Otway gas
bull Contracting gas to supply from March 2018
bull Expect to secure new agreements in winter 2017 with market reflective price
Operator status
bull Working to appointment as Operator in Gippsland and Otway
bull Enables cost efficiencies and competitive advantage as asset owner and JV participant
Beyond June 2017
bull Cooper Basin assets
bull Divest slice of Gippsland Basin portfolio
bull Manta exploration
13116
~53
Jun-16 Jan-17 June -17Proforma
Uplift in 2P reservesMMboe
Australia only Assumes commitment of Sole gas project provides uplift of
~43 MMboe
1
2
3
4
17
1 Execution of our gas strategy has deliveredCooper Energy has become a supplier and developer of gas for south east Australia at a time of great market need
2 FY17 growth is the first step of larger and sustainable growthReserves and production upgrades in the current year are the initial instalment of a 6 year growth trajectory offering gt 20 times growth in
production from existing assets and equities
3 Integration proceeding management capabilities have been reinforced consistent with growthUpgraded people resources with the addition of proven performance orientated executives integration is proceeding to schedule
4 Sole project stronger and proceeding to final phase financingProject now offering lower risk lower capital cost increased gas and increased returns and value upside for Cooper Energy shareholders
5 Milestones aheadSix months to June 17 is expected to see a number of milestones for further uplift and value transformation
Appendices
20
Key figures
Shares on issue1 6601 mill
Shareholders1 5923
Market capitalisation1 $260 mill
Debt Nil
Current employees 23
Cooper Energy is an independent Australian exploration and
production company
bull Listed in 2002 history of profitable operations and successful
exploration and development
bull Strong balance sheet zero debt
bull Raised new equity capital of c$85 million during 2016
bull Management team and board experienced in growing resource
companies
bull Growth profile extending over 6 years from existing assets and
agreements
59
10
2
29
Share register
Institutional
Corporate
Employees amp Directors
Private
1 As at 20 March 2017
21
Oil exploration amp production
Cooper Basin Western Flank
240000 ndash 280000 1 bbl pa
Operating cost ltA$30bbl
High margin + exploration upside
Gas production amp sales Gas projects amp contracting
Otway Basin Casino Henry amp Minerva
Sales of ~7- 8 PJ pa to EnergyAustralia
Minerva1 gas plant
Production of 15 MMboe pa
Gippsland and Otway Basins
Sole Manta projects Otway uncontracted gas
gt400 PJ gas to be developed or uncontracted
Production uplift of up to 95 MMboe2 pa as
projects come online on top of existing output
1 Subject to completion of transaction2 Based on current equity participation levels
22
Phase 1 Sole
bull 2C Resource1 249 PJ
bull Sanction March 2017
bull Sole gas into plant March 2019
bull Output ~25 PJ pa
bull COE equity 100
Phase 2 Manta
bull 2C Resource1 106 PJ gas3 2 MMbbl liquids
bull Appraisal 2018-19
bull Sanction 2021
bull First gas ~2023
bull Output pa 25 PJ gas 039 MMbbl pa
bull Exploration Manta Deep amp Chimaera
bull COE equity 100
Orbost Gas Plant
bull Existing gas plant
bull Connected to Eastern Gas Pipeline
bull Plant owned amp operated by APA Group (proposed in HoA announced 27217
Longtom(Seven Group 100)
Patricia Baleen (COE 100)
Enabling customersUpstream and Midstream HoA
1 Cooper Energy announced Sole Contingent Resources on 27 February 2017 and Manta Contingent Resource 16 July 2015 Cooper Energy is not aware of any new information or data that materially affects the information provided in those releases and all material
assumptions and technical parameters underpinning the assessment provided in the announcement continues to apply See notes on page 29 for information on reserves and resources calculation
33 km
58 km
65 km
23
Sole Gas Project (VIC L32 COE100 Operator )
bull 249 PJ 2C Contingent Resource1
bull 20 PJ pa contracted gas contracts with O-I Australia AGL Energy Alinta Energy
EnergyAustralia
bull Sanction expected by March 2017 for Sole gas into plant by March 2019
Manta (VIC RL131415 COE 100)
bull 106 PJ 2C Contingent Resource plus 3 million barrels liquids1
bull economic business case identified subject to appraisal
bull prospective resource upside to be tested amp appraisal well expected 2018
Patricia-Baleen (VICL21 COE 100)
bull Non-operating field shut in
bull Strategic significance as access point for Orbost Gas Plant for other fields
1 Reserves and Contingent Resources at 1 January 2017 were announced to the ASX on 27 February 2017 and an announcement on Manta Contingent Resource was announced on 16 July 2015 The resources information displayed should be read in conjunction with the information provided on the calculation of Reserves and Contingent Resources provided on page 29 Cooper Energy is not aware of any new information or data that materially affects the information provided in those releases and all material assumptions and technical parameters underpinning the assessment provided in the announcement continues to apply
24
Key Assets
bull Casino Henry gas project (50)
bull Minerva gas field and plant (10 interest)1
bull VICP44 exploration permit
Production (COE share effective from 1 January 2017)
bull Casino Henry (VICRL11 amp 12) 7 PJ pa supplied to EnergyAustralia
under contract expiring March 2018
bull Minerva (VICL22)~ 1 PJ pa (expected to deplete by mid 2017)
Plans
bull Preparation for operatorship transfer likely June 2017
bull Marketing of uncontracted gas available for sale from March 2018
bull Casino Henry development well
1Acquisition of 10 interest in Minerva agreed with Santos Ltd is subject to completion
25
bull First half production of 013 MMbbl vs 017 in H1 FY16
bull Production impacted by suspension of drilling in low oil price FY16
bull Operating costs reduced from A$2992bbl to A$2928bbl
bull Drilling resumed in FY17 with 4 wells drilled 2 successful 2 P amp A
bull No further drilling planned for FY17
bull Producing interests
ndash PEL 92 25 interest (Beach Energy 75 amp Operator)
ndash PEL 93 30 interest (Senex Energy 70 amp Operator)
11 10
16 15
7 4
3530
FY16 H1 FY17
Production costs amp netback Direct cost A$ per barrel
NetbackRoyaltyTransportOperatingCosts per
bbl down 2
26
bull Take or pay gas
processing agreement
1 Cooper Energy to sell Orbost Gas Plant to APA Group
Heads of Agreement (non-binding) provides for APA to take ownership subject to Sole FID
2 APA to be responsible for funding and performance of ~$250 million plant upgrade and processing of gas from Sole amp Manta
Plant to be developed according to existing Sole Development Plan Sole gas to be processed under take or pay tariff agreement
3 Cooper Energy to retain 100 of upstream retains ownership of gas processed through Orbost Gas Plant
Estimated project cost for Cooper Energy reduced to ~$355 million and opportunity to realise further value accretion in sell-down post FID
Orbost Gas Plant APA Group 100
APA
bull funds and completes plant upgrade
for Sole
bull operates plant for agreed tariff amp
provides processed sales gas to
EGP
Sole gas
field
COE 100
COE
bull manages upstream
development
bull supplies gas to Orbost
for processing
bull markets the gas
Upstream Midstream
Downstream COE retains ownership of gas
through to point of sale to customers
in EGP
Transaction elements
1refer joint APA Group Cooper Energy announcement 27 February 2017
27
28
3 5
2 7 7 6 7 7 6 5 4
1
1520 20 20 20
2020
20
16
10
6
10 5 5 5 55
55 9
9
25 25 25
18
10
75
1
FY17 FY18 FY19 FY20 FY21 FY22 FY23 FY24 FY25 FY26 FY27 FY28 FY29
Gas production profile by projectcontracted amp uncontracted PJ pa
Manta uncontracted
Sole uncontracted
Sole contracted
Otway uncontracted
Otway contracted
Otway 2P reserves
Casino Henry
Gippsland Gas Project Phase 1
Sole
Gippsland Gas Project Phase 2
Manta
Assumes
bull Sole sanction by March quarter 2017 for March quarter 2019 first Sole gas to plant
bull All contract options in respect of Sole field are exercised
bull Manta subject to Manta 3 appraisal well Manta profile illustrates all Manta gas as uncontracted (including 4 PJ pa option held by
AGL) Manta profile includes 106 PJ 2C resource and additional 10 PJ anticipated
bull Development well required for Casino Henry ~2020
bull No exploration success
29
Reserves
Proved
(1P)
Proved amp Probable
(2P)
Proved Probable amp Possible
(3P)
Cooper1 Otway2 Total Cooper1 Otway2 Total Cooper1 Otway2 Total
Developed
Sales Gas PJ 00 48 48 00 152 152 00 293 293
Oil + Condensate MMbbl 05 00 05 09 00 09 16 00 16
Total developed MMboe2 05 08 13 09 26 35 16 51 67
Undeveloped
Sales Gas PJ 00 344 344 00 451 451 00 627 627
Oil + Condensate PJ 01 00 02 03 11 03 05 01 05
Total undeveloped MMboe2 01 60 61 03 78 81 05 109 113
Total1 MMboe2 07 68 74 11 104 116 21 159 180
Contingent
Resources
1C 2C 3C
Gas Oil Total1 Gas Oil Total Gas Oil Total
PJ MMbbl MMboe2 PJ MMbbl MMboe2 PJ MMbbl MMboe2
Gippsland 2917 40 541 3885 76 744 5336 121 1039
Cooper 02 00 003 03 00 01 06 00 01
Total 1 2919 40 542 3888 76 744 5342 121 1040
Additional information on reserve and resource calculation is provided in the appendices to this document
1 Totals may not reflect arithmetic addition due to rounding The method of aggregation is by arithmetic sum by category As a result the 1P estimate may be conservative and the 3P estimate may be optimistic due to the effects
of arithmetic summation The conversion factor of 1 PJ = 0172 MMboe has been used to convert from Sales Gas (PJ) to Oil Equivalent (MMboe) 2 The reserves revisions include Cooper Energyrsquos share of future crude fuel
usage in the Cooper Basin The estimated fuel usage for PEL 92 is 1P 002 MMbbl 2P 003 MMbbl and 3P 006 MMbbl The estimated fuel usage for the Worrior Field (PPL 207) is 1P 001 MMbbl 2P 002 MMbbl and 3P 003
MMbbl 3 The Otway gas reserves for Casino Henry and Netherby fields are net of fuel gas
1 Totals may not reflect arithmetic addition due to rounding The method of aggregation is by arithmetic sum by category As a result the 1C estimate may be conservative and the 3C estimate may be optimistic due to the
effects of arithmetic summation 2 The conversion factor of 1 PJ = 0172 MMboe has been used to convert from Sales Gas (PJ) to Oil Equivalent (MMboe)
30
General Manager Operations
Iain MacDougallIain MacDougall has more than 25
yearsrsquo experience in the upstream
petroleum exploration and production
sector including senior management
roles within independent operators
and international experience with
Schlumberger In Australia previous
employment includes Stuart
Petroleum as Production and
Engineering Manager and then as
acting CEO prior to the takeover of
Stuart Petroleum by Senex Energy
Managing Director
David MaxwellDavid Maxwell has over 30 yearsrsquo
experience as a senior executive with
companies such as BG Group Woodside
and Santos As Senior Vice President at
QGC a BG Group business he led BGrsquos
entry into Australia its alliance with and
subsequent takeover of QGC Roles at
Woodside included director of gas and
marketing and membership of Woodsidersquos
executive committee
General Manager Exploration
amp Subsurface
Andrew ThomasAndrew Thomas is a successful
geoscientist with over 28 yearsrsquo
experience in oil and gas exploration
and development in companies
including Geoscience Australia
Santos Gulf Canada and Newfield
Exploration At Newfield he was SE
Asia New Ventures Manager and
Exploration Manager for offshore
Sarawak
Executive Director
Hector GordonHector Gordon is a highly
experienced geologist with over 35
yearsrsquo experience in the petroleum
industry Previous roles include
Managing Director Somerton
Energy and a number of senior
management and technical roles at
Beach Energy including Exploration
Manager Chief Operating Officer
and ultimately Chief Executive
Officer
Alison Evans is an experienced
company secretary and corporate legal
counsel with extensive knowledge of
corporate and commercial law in the
resources and energy sectors
Alison has held Company Secretary
and Legal Counsel roles at a number of
minerals and energy companies
including Centrex Metals GTL Energy
and AGL Ms Evans public company
experience is supported by her work at
leading corporate law firms
Company Secretary and
General Counsel
Alison Evans
General Manager Development
Duncan CleggDuncan Clegg has over 35 yearsrsquo
experience in upstream and midstream oil
and gas development including
management positions at Shell and
Woodside leading oil and gas
developments including FPSO subsea
and fixed platforms developments At
Woodside Duncan held several senior
executive positions including Director of
the Australian Business Unit Director of
the African Business Unit and CEO of the
North West Shelf Venture
Eddy Glavas has more than 18 years
experience in business development
finance commercial portfolio
management and strategy including 14
years in the oil and gas sector Prior to
joining Cooper Energy he was
employed by Santos as Manager
Corporate Development with
responsibility for managing multi-
disciplinary teams tasked with mergers
acquisitions partnerships and
divestitures
General Manager Commercial amp
Business Development
Eddy Glavas
Virginia Suttell is a chartered accountant
with more than 20 years experience
including 16 years in publicly listed entities
principally in group finance and secretarial
roles in the resources and media sectors
This has included the role of Chief Financial
Officer and Company Secretary for Monax
Mining Limited and Marmota Energy Limited
from 2007 to 2016 and 2007 to 2015
respectively Other previous appointments
include Group Financial Controller at
Austereo Group Limited
Chief Financial Officer
(Acting)
Virginia Suttell
31
The approach for all reserve and resource calculations is consistent with the definitions and guidelines in the Society of Petroleum Engineers (SPE) 2007 Petroleum Resources Management System (PRMS) The resource estimate methodologies incorporate a range of uncertainty relating to each of the key reservoir input parameters to predict the likely range of outcomes Cooper Energy has completed its own estimation of reserves and contingent resources based on information provided by the permit Operators Beach Energy Ltd Senex Ltd and Santos Ltd and in accordance with the definitions and guidelines in the Society of Petroleum Engineers (SPE) 2007 Petroleum Resources Management System (PRMS) Petroleum Reserves and Contingent Resources are prepared using deterministic and probabilistic methods The method of aggregation for all reserves and contingent resources tables is by arithmetic summation by category Aggregated 1P and 1C estimates may be conservative and aggregated 3P and 3C estimates may be optimistic due to the effects of arithmetic summation Totals may not exactly reflect arithmetic addition due to rounding
The information contained in this report regarding the Cooper Energy reserves and contingent resources is based on and fairly represents information and supporting documentation reviewed by Mr Andrew Thomas who is a full-time employee of Cooper Energy Limited holding the position of General Manager Exploration amp Subsurface holds a Bachelor of Science (Hons) is a member of the American Association of Petroleum Geologists and the Society of Petroleum Engineers is qualified in accordance with ASX listing rule 541 and has consented to the inclusion of this information in the form and context in which it appears
The Cooper Basin totals comprise the probabilistically aggregated PEL 92 project fields and the arithmetic summation of the Worrior project reserves Total includes 005 MMbbl oil reserves used for field fuel The Indonesia totals include removal of non-shareable oil (NSO) and comprise the probabilistically aggregated Tangai-Sukananti KSO project fields Totals are derived by arithmetic summation In the Otway Basin reserves for the Casino Henry and Netherby fields have been assessed by Cooper Energy The Reserves have been assessed using deterministic and probabilistic methodologies for the Waarre Formation at the Casino Henry and Netherby fields This methodology incorporates a range of uncertainty relating to each of the key reservoir input parameters to predict the likely range of outcomes Cooper Energy undertook the following analytical procedures to estimate the Reserves independent interpretation of 3D seismic data analysis of historical production data to assess accessed gas volumes and future production forecasts review of the Operatorrsquos reservoir and production simulation models to define raw gas recovery consistent with existing processing facilities and independent probabilistic Monte Carlo statistical calculations to establish the range of recoverable gas The Otway gas reserves for Casino Henry and Netherby fields are net of fuel gas The date of the Casino Henry and Netherby Reserve Assessment is 27 February 2017
Sole gas field The contingent resource for the Sole field has been re-estimated assuming a two well subsea development plan Advantages of a two well plan compared to the previous single well development includeincreased 2C estimate attributable to accessing previously undeveloped gas and reduced technical risk and enhanced field redundancy providing increased security of supply to the gas processing and gas sales agreements Contingent resources for the Sole field were released to the ASX on 26 November 2015 Post-acquisition of the remaining 50 equity in the Sole gas field the following methodologies were used by Cooper Energy to re-calculate the Sole contingent resource estimate probabilistic simulation modelling for the Kingfish Formation incorporation of a range of uncertainty relating to each of the key reservoir input parameters to predict the likely range of outcomes and review of the reservoir and simulation modelling assuming a two well subsea development The date of the Sole contingent resource assessment is 27 February 2017
Manta gas and oil field Contingent and Prospective Resources have been assessed using deterministic simulation modelling and probabilistic resource estimation for the Intra-Latrobe and Golden Beach Sub-Group in the Manta field This methodology incorporates a range of uncertainty relating to each of the key reservoir input parameters to predict the likely range of outcomes The conversion factor of 1PJ = 0172MMboe has been used to convert from Sales Gas (PJ) to Oil Equivalent (MMboe) Contingent Resources for the Manta Field have been aggregated by arithmetic summation The date of the Manta Contingent Resource assessment is 16 July 2015 and the assessment was announced to the ASX on 16 July 2015 Cooper Energy is not aware of any new information or data that materially affects the information provided in that release and all material assumptions and technical parameters underpinning the assessment provided in the announcement continues to apply
Basker gas and oil field Contingent and Resources have been assessed using deterministic simulation modelling and probabilistic resource estimation for the Intra-Latrobe Sub-Group in the Basker field This methodology incorporates a range of uncertainty relating to each of the key reservoir input parameters to predict the likely range of outcomes The conversion factor of 1PJ = 0172MMboe has been used to convert from Sales Gas (PJ) to Oil Equivalent (MMboe) Contingent Resources for the Basker Field have been aggregated by arithmetic summation The date of the Basker Contingent Resource assessment is 15 August 2014 and the assessment was announced to the ASX on 18 August 2014 Cooper Energy is not aware of any new information or data that materially affects the information provided in that release and all material assumptions and technical parameters underpinning the assessment provided in the announcement continues to apply
32
$ A$ Australian dollars unless specified otherwise
Bbl barrels of oil
boe barrel of oil equivalent
bopd barrel of oil per day
EBITDA earnings before interest tax depreciation and amortisation
FEED Front end engineering and design
kbbls thousand barrels
LTIFR Lost Time Injury Frequency Rate Lost Time Incidents per million man hours worked
MMbbl million barrels of oil
MMboe million barrels of oil equivalent
NOPSEMA National Offshore Petroleum Safety amp Environmental Management Authority
NOPTA National Offshore Petroleum Titles Administrator
NPAT net profit after tax
PEL 92 Joint Venture conducting operations in Western Flank Cooper Basin Petroleum Retention Licences 85 ndash 104 previously encompassed by
the PEL 92 exploration licence
TRCFR Total Recordable Case Frequency Rate Recordable cases per million hours worked
TSR total shareholder return
1P reserves Proved reserves
2P reserves Proved and Probable reserves
3P Proved Probable and Possible reserves
1C 2C 3C high medium and low estimates of contingent resources
- 1WRM Investor presentation March 2017
-
- Slide Number 1
- Disclaimer
- Slide Number 3
- Slide Number 4
- Slide Number 5
- Slide Number 6
- Slide Number 7
- Slide Number 8
- Slide Number 9
- Slide Number 10
- Slide Number 11
- Gold and Silver development asset with a definitive feasibility study (DFS) commenced
- Slide Number 13
- Slide Number 14
- Slide Number 15
- Slide Number 16
- Slide Number 17
- Slide Number 18
- Slide Number 19
- Slide Number 20
- Slide Number 21
- Slide Number 22
- Slide Number 23
- Slide Number 24
- Slide Number 25
- Slide Number 26
- Slide Number 27
- Slide Number 28
- Slide Number 29
- Mount Carrington Resource Statement
- Slide Number 31
- Slide Number 32
- Slide Number 33
- Slide Number 34
- Slide Number 35
- Slide Number 36
- Slide Number 37
-
- 2Aurelia Metals Presentation-Mar 2017-widescreen format
-
- Slide Number 1
- Slide Number 2
- Slide Number 3
- Slide Number 4
- Slide Number 5
- Slide Number 6
- Slide Number 7
- Slide Number 8
- Slide Number 9
- Slide Number 10
- Slide Number 11
- Slide Number 12
- Slide Number 13
- Slide Number 14
- Slide Number 15
- Slide Number 16
- Slide Number 17
- Slide Number 18
- Slide Number 19
- Slide Number 20
- Slide Number 21
-
- 320170321 Presentations Melbourne Mining Club Speaker
-

White Rock Minerals Ltd ASXWRM March 2017
Agreement with Metallogeny
The key terms of the Red Mountain Project at
acquisition in 2016 were as follows US$1225m expenditure commitment
over 4 years US$10m in cash payments over 5 years Share payments 1 million shares Metallogeny retain a right to 10 of the
proceeds on any sale of the claims prior to commercial production 2 NSR with the option to acquire 1
(ie 50 of NSR) for US$2m
Original Claims
37
CORPORATE PRESENTATION March 2017
Forward Looking Statement
This presentation has been prepared by Aurelia Metals Limited (ldquoAMIrdquo or the ldquoCompanyrdquo) It should not be considered as an offer or invitation to subscribe for or purchase any securities in the Company or as an inducement to make an offer or invitation with respect to those securities No agreement to subscribe for securities in the Company will be entered into on the basis of this presentation It is not to be distributed to third parties without the consent of AMI This presentation contains forward-looking statements and projected drilling schedules that are not based on historical fact including those identified by the use of forward-looking terminology containing such words as ldquobelievesrdquo ldquomayrdquo ldquowillrdquo ldquoestimatesrdquo ldquocontinuerdquo ldquoanticipatesrdquo ldquointendsrdquo ldquoexpectsrdquo ldquoshouldrdquo ldquoschedulerdquo ldquoprogramrdquo ldquopotentialrdquo or the negatives thereof and words of similar import Management of AMI cautions that these forward-looking statements are subject to risks and uncertainties that could cause actual events or results to differ materially from those expressed or implied by the statements Management believes that the estimates are reasonable but should not unduly be relied upon AMI makes no representation warranty (express or implied) or assurance as to the completeness or accuracy of these projections and accordingly expresses no opinion or any other form of assurance regarding them Management does not intend to publish updates or revisions of any forward-looking statements included in this document to reflect Aureliarsquos circumstances after the date hereof or to reflect subsequent market analysis By its very nature exploration for gold and copper is a high risk business and is not suitable for certain investors AMI securities are speculative Potential investors should consult their stockbroker or financial advisor There are a number of risks both specific to AMI and of a general nature which may affect the future operating and financial performance of AMI and the value of an investment in AMI including and not limited to economic conditions stock market fluctuations gold copper and silver price movements regional infrastructure constrains securing drilling rigs timing of approvals from relevant authorities regulatory risks operational risks reliance on key personnel and foreign currency fluctuations You should not act or refrain from acting in reliance on this presentation material This overview of AMI does not purport to be all inclusive or to contain all information which its recipients may require in order to make an informed assessment of the Companyrsquos prospects You should conduct your own investigation and perform your own analysis in order to satisfy yourself as to the accuracy and completeness of the information statements and opinions contained in this presentation before making any investment decision 2
Corporate Information
3
ASX Code AMI Market Cap $99M (at 23cshare)
Issued Capital 431M Shares 10M options at 125c with Pacific Road 65M Perf Rghts
Net debt $94M 31 Dec 16 ($107M 30 June 16) Cash $21M (Dec 16) Debt $115M (Dec 16)
Key shareholders PacRoad 336 Glencore 67 Yunnan Tin TDK 71 YTC Holdings 28
BoardManagement Board amp Senior Management Renewal
Non-Exec Chairman Colin Johnstone (appointed Nov 16) MD amp CEO James Simpson (appointed Aug 16)
Non-Exec Directors Gary Comb Paul Espie Michael Menzies Rune Symann
CFO amp CoSec Hera GM
Timothy Churcher Scott Ramsay (appointed May 16)
Key Assets ndash Gold lead zinc silver amp copper
4
Hera Mine (100) Gold lead zinc silver production Central NSW
Commercial Production Started April 15 (2 years into mine life)
Gold 47000 oz production in FY16
Lead 7600 t production in FY16
Zinc 7200 t production in FY16
Nymagee Project (95) Copper lead zinc opportunity Central NSW ndash 5 km north of Hera
Inferred amp Indicated Resource (as disclosed in 2016 Annual Report)
Large and low grade 81Mt at 12 Cu1 Pb+Zn 9 gt Ag
Potential for smaller discrete higher grade copper and leadzinc zones
Scoping study underway to assess
Key Assets ndash History
5
Hera Mine (100) Gold lead zinc production Central NSW
Commissioning Started Aug 2014 (8 month duration)
Production Commerical production declared 1 April 2015
Key Lessons Project start-up and finance issues
Capital Structure - Inappropriate capital structure (single asset 100 debt funded)
- Insufficient working capital (to cope with timing of commissioning and receivables)
People - Skill set required to move from junior explorer to producer
- Skill set required to operate a complex multi-metal processing facility
6
Key Assets ndash Located in the productive Cobar Region
Bourke
Cobar Nyngan
Parkes ORANGE
Bathurst
Lithgow
Newcastle
SYDNEY 100kms
Nymagee Cu Project
Hera AuPbZn Mine
Cobar Basin
A u s t r a l i a
NSW
Endeavour ZnPbAg (Toho)
CSA Cu (Glencore)
Peak AuCu (New Gold)
Mallee bull CuPbZn project (PeelCBH)
Wonawinta Ag
First half FY17 ndash Highlights
7
bull Strong H1 FY17 Result
bull Profit cash flow amp debt reduction
bull Improved operations bull Ore processed up 22 on pcp bull Gold recovery to 866 bull Gold production up 22 on pcp
bull Strong cash build bull Cash build to $21M after
voluntary $10M debt repayment bull 21 reduction in net debt
relative to pcp - $119M to $94M ldquopcprdquo Prior Corresponding Period
Key Focus ndash Deliver strong operating performance
8 Gravity gold recovery increased from 42 to 62 over the same period
Key Focus ndash Deliver lower operating costs
9
Key Focus ndash Deliver low all-in cost
10
A$oz
Source Curran amp Co
bull Competitive Cost profile
Dec 16 Qtr Gold production of 13427 oz at an AISC of A$821oz (US$592oz)
AMIrsquos AISC vs ASX Peers ndash Dec Qrsquo16 Actuals
Key Focus ndash Deliver strong cash margin
11
bull Strong cash flow generation from high-margin operation
Key Focus ndash Deliver consistent production
12 2016 Calendar year gold production of 50899 oz
13
bull Debt reduction to provide optionality leading up to 31 Mar 18
bull Option to convert up to $755M of $115M debt just prior to 31 March 18 bull Options to repayrefinance or allow existing debt (covenant light) to run its course
Key Focus ndash Deliver reduced net debt
Gearing at 31 Dec 16 was 64 (share price 135c) Using current market cap (share price 23c) Gearing has reduced to 49 (Gearing defined as net debt(net debt+mkt value of equity)
Key Focus ndash Deliver growth in mine life
14
N
North Pod
S N
Stoped areas
(purple)
Planned Stopes
As built mine development
Planned mine development
Target Zone
500 m below surface
HRUD410
23m at 108 Pb+Zn 26gt Au 63gt Ag
400L
450L
500L
550L
600L
50 metres High Grade Open at Depth
High Grade Open Up-dip
NORTH POD LONG SECTION
New Drilling Results
Existing Drill Hole Mineralised Trend
NovDec16 results
High Grade PbZnAg High Grade Gold
Mine Long Section
North Pod
450L
500L
550L
NORTH
HRUD374 7m at 527 Pb+Zn
47gt Au 203gt Ag
HRUD370
7m at 881gt Au 43 Pb+Zn 47gt Ag
HRUD409 21m at 117gt Au
52 Pb+Zn 32gt Ag
Key Focus ndash Deliver growth in mine life (North Pod)
HRUD407 25m at 112gt Au
25 Pb+Zn 14gt Ag
Hera Mine Plan Showing Drill Traces and Main Mineralised Lodes
N 200m North Pod
1530 Hays South
Main South
Main North
Far West Hays North
Target Zone
16
Key Focus ndash Deliver growth in mine life
Structural Repetition
bull Potential for northern extensions of Hera lode system
bull Utilise downhole geochem and geophysics as tools to vector to mineralisation
17
Key Focus ndash Deliver growth in mine life (Nymagee)
Nymagee Copper Project
Hera Mine
Nymagee CuPbZn
bull Historic mine and current resource located 5km north of Hera Mine
bull Ability to leverage off Hera mine infrastructure
N 5 km
Lease boundary
18
Key Focus ndash Deliver growth in mine life (Nymagee)
Nymagee CuPbZn
bull Current large (8Mt) relative low grade resource down to 500 m below surface
bull Cu grade 12 bull Pb+Zn grade 1
bull Scoping Study underway to understand potential to selectively mine higher grade copper and leadzinc zones
bull Multiple exploration targets exist
Nymagee Long Section
300 m below surface
500 m below surface
700 m below surface
Current Resource Shell
Detail on the Nymagee Resource can be found in the Companyrsquos 2016 Annual Report
Key Focus ndash Deliver growth in mine life (Mine Trend)
Mine Corridor
bull Hera-Nymagee corridor remains highly prospective
bull The Hera amp Nymagee deposits are both marked by prominent gravity highs
bull Several gravity targets have been defined along 20km of strike
bull Potential for Hera-Nymagee corridor to evolve into Cobar field equivalent
20
Key Focus ndash Deliver Shareholder Returns
Conclusion
21
Strategy to Deliver Generate cash Continuously improve operational performance
- Continuous improvement in recovery and throughput - Minimise unit costs - Optimise mine plan (north pod high grade)
Reduce net debt Reduce gearing reduce financial risk
- build optionality leading up to first scheduled debt repayments (Mar-18)
Deliver growth Expansion of base metals capacity North Pod exploration amp strike extensions Scoping Study on copper development opportunity at Nymagee
2
The information in this presentation
bull Is not an offer or recommendation to purchase or subscribe for shares in Cooper Energy Limited or to retain or sell any shares that are
currently held
bull Does not take into account the individual investment objectives or the financial situation of investors
bull Was prepared with due care and attention and is current at the date of the presentation
Actual results may materially vary from any forecasts (where applicable) in this presentation
Before making or varying any investment in shares of Cooper Energy Limited all investors should consider the appropriateness of that
investment in light of their individual investment objectives and financial situation and should seek their own independent professional advice
Qualified petroleum reserves and resources evaluator
This report contains information on petroleum reserves and resources which is based on and fairly represents information and supporting
documentation reviewed by Mr Andrew Thomas who is a full time employee of Cooper Energy Limited holding the position of Exploration
Manager holds a Bachelor of Science (Hons) is a member of the American Association of Petroleum Geologists and the Society of Petroleum
Engineers and is qualified in accordance with ASX listing rule 541 and has consented to the inclusion of this information in the form and context
in which it appears
Rounding
All numbers in this presentation have been rounded As a result some total figures may differ insignificantly from totals obtained from arithmetic
addition of the rounded numbers presented
Reserves and resources calculation
Information on the companyrsquos reserves and resources and their calculation are provided in the appendices to this presentation
Currency
All financial information is expressed in Australian dollars unless otherwise specified
3
Cooper Energy develops and supplies gas to south-east Australia and produces oil from the
western flank of the Cooper Basin
The companyrsquos portfolio features existing gas production 227 PJ of uncontracted gas
and two new gas projects to supply south-east Australia from 2019 onwards backed by long term
contracts with blue chip utility and industrial customers
Existing assets and plans have the company on a 6 year growth trajectory with capacity for
production growth over 20 times FY16 levels
4
Cooper Basin oil
PEL 495
bull Oil production from western flank of Cooper Basin
bull Single gas exploration permit in Otway Basin
bull Poland
bull Romania
bull Indonesia
bull Tunisia
2011 portfolio
5
Otway Basin
bull Builds acreage and technical capability
through merger with Somerton Energy
bull Sub-surface studies reinforce view of
prospectivity
Market
bull Demand and supply-side gas market analysis
bull Commenced engagement with gas buyers
Gippsland Basin
bull Invested in Bass Strait Oil Company which
holds Gippsland permits
bull Technical studies of prospectivity and gas
plays
6
Otway Basin
bull Drilling identifies gas bearing
reservoirs in deep sands Gippsland Basin
bull Acquires 65 interest in Basker Manta Gummy
permits
bull Commenced Manta business case analysis for
supply to south-east Australia
7
Otway Basin
bull Builds understanding of Otway
sub-surface
bull Confirms attraction of offshore
Otway
Gippsland Basin
bull Acquires 50 of Sole gas field
bull Acquires 50 of Orbost Gas Plant
bull Manta business case affirms economic
development opportunity
8
Gippsland Basinbull Sole gas field interest 100
bull Sole gas project FEED completed
bull Orbost Gas Plant 100
bull Manta gas field 100
Otway Basin
bull Acquires Casino Henry Vic P44
Minerva and Minerva Gas Plant
Market
bull O-I Australia gas contract
bull AGL gas contract
bull EnergyAustralia gas
contract
bull Alinta Energy gas
contract
9
Gas contracts
bull 188 PJ contracted from 2017 on
bull EnergyAustralia (Otway amp Sole)
bull AGL Energy (Sole)
bull Alinta Energy (Sole)
bull O-I Australia (Sole)
New gas projects
bull Phase 1 Sole from 2019
ndash Sanction Marchrsquo 17 for March lsquo19 first gas into plant
bull Phase 2 Manta
ndash appraisal well and resource upside
ndash from FY22
bull VIC P44 exploration prospects
Production
bull ~ 7 PJ pa from Casino Henry amp
Minerva1
bull Sold to EnergyAustralia
bull Uncontracted gas to market for
supply from March 18
bull Field life to 2026 (Casino Henry)Plant amp infrastructure
bull Orbost Gas Plant connected to
EGP (subject to APA HoA)
bull Minerva1 Gas Plant (10)
connected to SEA Gas pipeline
bull Patricia Baleen connected to
Orbost and Longtom
1Acquisition of 10 interest in Minerva and Minerva gas plant to be completed
Uncontracted gas
Total of 227 PJ uncontracted in
bull Otway
ndash 52 PJ 2P Casino Henry reserves from March 2018
bull Gippsland
ndash Sole 69 PJ 2C contingent resource uncontracted
ndash Manta 106 PJ 2C contingent resource plus
exploration potential
10
03
Jun-16 Jan-17
FY17 production1
MMboe expected
Gas
Oil
1
49 76
367
668
Jun-16 Jan-17
Contingent resources (2C)12
MMboe
Gas
Oil13
11
104
Jun-16 Jan-17
2P reserves12
MMboe
bull Addition of Otway gas production Jan to Jun 17
bull Gas accounts for 75 of anticipated FY17 production
bull Addition of 60 PJ of Otway Basin gas reserves
bull Gas accounts for 90 of 116 MMboe 2P reserves
bull Australian contingent resources 2C up 79
bull 128 PJ gas contingent resources (2C) added in Gippsland
116
416
744
1Australia only 2 Reserves and Contingent Resources at 1 January 2017 were announced to the ASX on 27 February 2017 and should be read in conjunction with the information provided on the calculation
of Reserves and Contingent Resources provided on page 29 Cooper Energy is not aware of any new information or data that materially affects the information provided in those releases and
all material assumptions and technical parameters underpinning the assessment provided in the announcement continues to apply
11
Forecast 1 south-east Australian gas demand and production
PJ pa
South-east Australia comprises NSW VIC SA and Tasmania
SE Australia demandsup1
1 EnergyQuest Energy Quarterly March 2017
0
10
20
30
40
50
60
70
80
90
100
2017 2018 2019 2020 2021 2022 2023 2024
Cooper Energy gas production profilePJ pa
Manta(100)
Sole (100)
Casino
bull Casino Henry gas contracted to February 2018
bull Casino Henry gas available to contract from March 2018
bull COE may sell down some of Sole Gas Project and Manta post
Sole FID
0
100
200
300
400
500
600
2016 2018 2020 2022 2024 2026 2028 2030 2032 2034 2036
Most certain supply tranche Less certain supply tranche
Least certain supply tranche Southern demand
12Source AEMO
13
1 Assumes
bull Sole sanction by March quarter 2017 for March quarter 2019 first Sole gas
to plant
bull Manta 3 appraisal well
bull Development well required for Casino Henry ~2020
bull Details on slide 26
3 5 1
1520 20 20 20 20 20 20
16102
13
17 11
37 36 36
28
1913
15
10
FY17 FY18 FY19 FY20 FY21 FY22 FY23 FY24 FY25 FY26 FY27 FY28 FY29
Gas production1 from current assets contracted amp uncontractedPJ pa
Uncontracted
Contracted
227 PJ comprises 52 PJ 2P Casino Henry gas and 175 PJ 2C Contingent uncontracted gas from Sole and Manta Profile illustrated includes additional 10 PJ anticipated from Manta Cooper Energy announced Sole Contingent Resources on 27 February 2017 and Manta Contingent Resource 16 July 2015 Cooper Energy is not aware of any new information or data that materially affects the information provided in those releases and all material assumptions and technical parameters underpinning the assessment provided in the announcement continues to apply See notes on page 29 for information on reserves and resources calculation
14
Resource economics
Health amp safety
Environment
CommunityFiscaldividend
SuccessfulSustainable
Value-generating resource
development
Balance not achieved people hurt project collapse uneconomic no community
benefit no fiscal dividend excessive energy
costs
Balance achieved safe environmentally
sound development
cost effective sustainable energy
community benefits
fiscal dividend
15
Casino Henry
bull Sustained growth profile over 6 years
bull Gas accounts for overwhelming majority of production
bull New assets and production profile generates
ndash FY17 production gt2x FY16 production
ndash FY19 production gt5x FY16 production
ndash FY22 production gt20x FY16 production
0
2
4
6
8
10
12
FY15 FY16 FY17 FY18 FY19 FY20 FY21 FY22 FY23 FY24
Production1
MMboe
Sole Gas Project
Manta Gas Project
Casino-Henry
Cooper Basin oil
Assumes1
bull Current equities COE may divest some Gippsland post Sole sanction
bull Sole sanction by March quarter 2017 for March quarter 2019 Sole gas to plant
bull Manta 3 appraisal well
bull Development well required for Casino Henry ~2020
bull No new exploration success
16
Sole FID
bull Financial commitment to project
bull Triggers 43 MMboe uplift in gas reserves
bull Translation of HoA with APA to formal agreement
bull Expected shortly after project sanction
Uncontracted Otway gas
bull Contracting gas to supply from March 2018
bull Expect to secure new agreements in winter 2017 with market reflective price
Operator status
bull Working to appointment as Operator in Gippsland and Otway
bull Enables cost efficiencies and competitive advantage as asset owner and JV participant
Beyond June 2017
bull Cooper Basin assets
bull Divest slice of Gippsland Basin portfolio
bull Manta exploration
13116
~53
Jun-16 Jan-17 June -17Proforma
Uplift in 2P reservesMMboe
Australia only Assumes commitment of Sole gas project provides uplift of
~43 MMboe
1
2
3
4
17
1 Execution of our gas strategy has deliveredCooper Energy has become a supplier and developer of gas for south east Australia at a time of great market need
2 FY17 growth is the first step of larger and sustainable growthReserves and production upgrades in the current year are the initial instalment of a 6 year growth trajectory offering gt 20 times growth in
production from existing assets and equities
3 Integration proceeding management capabilities have been reinforced consistent with growthUpgraded people resources with the addition of proven performance orientated executives integration is proceeding to schedule
4 Sole project stronger and proceeding to final phase financingProject now offering lower risk lower capital cost increased gas and increased returns and value upside for Cooper Energy shareholders
5 Milestones aheadSix months to June 17 is expected to see a number of milestones for further uplift and value transformation
Appendices
20
Key figures
Shares on issue1 6601 mill
Shareholders1 5923
Market capitalisation1 $260 mill
Debt Nil
Current employees 23
Cooper Energy is an independent Australian exploration and
production company
bull Listed in 2002 history of profitable operations and successful
exploration and development
bull Strong balance sheet zero debt
bull Raised new equity capital of c$85 million during 2016
bull Management team and board experienced in growing resource
companies
bull Growth profile extending over 6 years from existing assets and
agreements
59
10
2
29
Share register
Institutional
Corporate
Employees amp Directors
Private
1 As at 20 March 2017
21
Oil exploration amp production
Cooper Basin Western Flank
240000 ndash 280000 1 bbl pa
Operating cost ltA$30bbl
High margin + exploration upside
Gas production amp sales Gas projects amp contracting
Otway Basin Casino Henry amp Minerva
Sales of ~7- 8 PJ pa to EnergyAustralia
Minerva1 gas plant
Production of 15 MMboe pa
Gippsland and Otway Basins
Sole Manta projects Otway uncontracted gas
gt400 PJ gas to be developed or uncontracted
Production uplift of up to 95 MMboe2 pa as
projects come online on top of existing output
1 Subject to completion of transaction2 Based on current equity participation levels
22
Phase 1 Sole
bull 2C Resource1 249 PJ
bull Sanction March 2017
bull Sole gas into plant March 2019
bull Output ~25 PJ pa
bull COE equity 100
Phase 2 Manta
bull 2C Resource1 106 PJ gas3 2 MMbbl liquids
bull Appraisal 2018-19
bull Sanction 2021
bull First gas ~2023
bull Output pa 25 PJ gas 039 MMbbl pa
bull Exploration Manta Deep amp Chimaera
bull COE equity 100
Orbost Gas Plant
bull Existing gas plant
bull Connected to Eastern Gas Pipeline
bull Plant owned amp operated by APA Group (proposed in HoA announced 27217
Longtom(Seven Group 100)
Patricia Baleen (COE 100)
Enabling customersUpstream and Midstream HoA
1 Cooper Energy announced Sole Contingent Resources on 27 February 2017 and Manta Contingent Resource 16 July 2015 Cooper Energy is not aware of any new information or data that materially affects the information provided in those releases and all material
assumptions and technical parameters underpinning the assessment provided in the announcement continues to apply See notes on page 29 for information on reserves and resources calculation
33 km
58 km
65 km
23
Sole Gas Project (VIC L32 COE100 Operator )
bull 249 PJ 2C Contingent Resource1
bull 20 PJ pa contracted gas contracts with O-I Australia AGL Energy Alinta Energy
EnergyAustralia
bull Sanction expected by March 2017 for Sole gas into plant by March 2019
Manta (VIC RL131415 COE 100)
bull 106 PJ 2C Contingent Resource plus 3 million barrels liquids1
bull economic business case identified subject to appraisal
bull prospective resource upside to be tested amp appraisal well expected 2018
Patricia-Baleen (VICL21 COE 100)
bull Non-operating field shut in
bull Strategic significance as access point for Orbost Gas Plant for other fields
1 Reserves and Contingent Resources at 1 January 2017 were announced to the ASX on 27 February 2017 and an announcement on Manta Contingent Resource was announced on 16 July 2015 The resources information displayed should be read in conjunction with the information provided on the calculation of Reserves and Contingent Resources provided on page 29 Cooper Energy is not aware of any new information or data that materially affects the information provided in those releases and all material assumptions and technical parameters underpinning the assessment provided in the announcement continues to apply
24
Key Assets
bull Casino Henry gas project (50)
bull Minerva gas field and plant (10 interest)1
bull VICP44 exploration permit
Production (COE share effective from 1 January 2017)
bull Casino Henry (VICRL11 amp 12) 7 PJ pa supplied to EnergyAustralia
under contract expiring March 2018
bull Minerva (VICL22)~ 1 PJ pa (expected to deplete by mid 2017)
Plans
bull Preparation for operatorship transfer likely June 2017
bull Marketing of uncontracted gas available for sale from March 2018
bull Casino Henry development well
1Acquisition of 10 interest in Minerva agreed with Santos Ltd is subject to completion
25
bull First half production of 013 MMbbl vs 017 in H1 FY16
bull Production impacted by suspension of drilling in low oil price FY16
bull Operating costs reduced from A$2992bbl to A$2928bbl
bull Drilling resumed in FY17 with 4 wells drilled 2 successful 2 P amp A
bull No further drilling planned for FY17
bull Producing interests
ndash PEL 92 25 interest (Beach Energy 75 amp Operator)
ndash PEL 93 30 interest (Senex Energy 70 amp Operator)
11 10
16 15
7 4
3530
FY16 H1 FY17
Production costs amp netback Direct cost A$ per barrel
NetbackRoyaltyTransportOperatingCosts per
bbl down 2
26
bull Take or pay gas
processing agreement
1 Cooper Energy to sell Orbost Gas Plant to APA Group
Heads of Agreement (non-binding) provides for APA to take ownership subject to Sole FID
2 APA to be responsible for funding and performance of ~$250 million plant upgrade and processing of gas from Sole amp Manta
Plant to be developed according to existing Sole Development Plan Sole gas to be processed under take or pay tariff agreement
3 Cooper Energy to retain 100 of upstream retains ownership of gas processed through Orbost Gas Plant
Estimated project cost for Cooper Energy reduced to ~$355 million and opportunity to realise further value accretion in sell-down post FID
Orbost Gas Plant APA Group 100
APA
bull funds and completes plant upgrade
for Sole
bull operates plant for agreed tariff amp
provides processed sales gas to
EGP
Sole gas
field
COE 100
COE
bull manages upstream
development
bull supplies gas to Orbost
for processing
bull markets the gas
Upstream Midstream
Downstream COE retains ownership of gas
through to point of sale to customers
in EGP
Transaction elements
1refer joint APA Group Cooper Energy announcement 27 February 2017
27
28
3 5
2 7 7 6 7 7 6 5 4
1
1520 20 20 20
2020
20
16
10
6
10 5 5 5 55
55 9
9
25 25 25
18
10
75
1
FY17 FY18 FY19 FY20 FY21 FY22 FY23 FY24 FY25 FY26 FY27 FY28 FY29
Gas production profile by projectcontracted amp uncontracted PJ pa
Manta uncontracted
Sole uncontracted
Sole contracted
Otway uncontracted
Otway contracted
Otway 2P reserves
Casino Henry
Gippsland Gas Project Phase 1
Sole
Gippsland Gas Project Phase 2
Manta
Assumes
bull Sole sanction by March quarter 2017 for March quarter 2019 first Sole gas to plant
bull All contract options in respect of Sole field are exercised
bull Manta subject to Manta 3 appraisal well Manta profile illustrates all Manta gas as uncontracted (including 4 PJ pa option held by
AGL) Manta profile includes 106 PJ 2C resource and additional 10 PJ anticipated
bull Development well required for Casino Henry ~2020
bull No exploration success
29
Reserves
Proved
(1P)
Proved amp Probable
(2P)
Proved Probable amp Possible
(3P)
Cooper1 Otway2 Total Cooper1 Otway2 Total Cooper1 Otway2 Total
Developed
Sales Gas PJ 00 48 48 00 152 152 00 293 293
Oil + Condensate MMbbl 05 00 05 09 00 09 16 00 16
Total developed MMboe2 05 08 13 09 26 35 16 51 67
Undeveloped
Sales Gas PJ 00 344 344 00 451 451 00 627 627
Oil + Condensate PJ 01 00 02 03 11 03 05 01 05
Total undeveloped MMboe2 01 60 61 03 78 81 05 109 113
Total1 MMboe2 07 68 74 11 104 116 21 159 180
Contingent
Resources
1C 2C 3C
Gas Oil Total1 Gas Oil Total Gas Oil Total
PJ MMbbl MMboe2 PJ MMbbl MMboe2 PJ MMbbl MMboe2
Gippsland 2917 40 541 3885 76 744 5336 121 1039
Cooper 02 00 003 03 00 01 06 00 01
Total 1 2919 40 542 3888 76 744 5342 121 1040
Additional information on reserve and resource calculation is provided in the appendices to this document
1 Totals may not reflect arithmetic addition due to rounding The method of aggregation is by arithmetic sum by category As a result the 1P estimate may be conservative and the 3P estimate may be optimistic due to the effects
of arithmetic summation The conversion factor of 1 PJ = 0172 MMboe has been used to convert from Sales Gas (PJ) to Oil Equivalent (MMboe) 2 The reserves revisions include Cooper Energyrsquos share of future crude fuel
usage in the Cooper Basin The estimated fuel usage for PEL 92 is 1P 002 MMbbl 2P 003 MMbbl and 3P 006 MMbbl The estimated fuel usage for the Worrior Field (PPL 207) is 1P 001 MMbbl 2P 002 MMbbl and 3P 003
MMbbl 3 The Otway gas reserves for Casino Henry and Netherby fields are net of fuel gas
1 Totals may not reflect arithmetic addition due to rounding The method of aggregation is by arithmetic sum by category As a result the 1C estimate may be conservative and the 3C estimate may be optimistic due to the
effects of arithmetic summation 2 The conversion factor of 1 PJ = 0172 MMboe has been used to convert from Sales Gas (PJ) to Oil Equivalent (MMboe)
30
General Manager Operations
Iain MacDougallIain MacDougall has more than 25
yearsrsquo experience in the upstream
petroleum exploration and production
sector including senior management
roles within independent operators
and international experience with
Schlumberger In Australia previous
employment includes Stuart
Petroleum as Production and
Engineering Manager and then as
acting CEO prior to the takeover of
Stuart Petroleum by Senex Energy
Managing Director
David MaxwellDavid Maxwell has over 30 yearsrsquo
experience as a senior executive with
companies such as BG Group Woodside
and Santos As Senior Vice President at
QGC a BG Group business he led BGrsquos
entry into Australia its alliance with and
subsequent takeover of QGC Roles at
Woodside included director of gas and
marketing and membership of Woodsidersquos
executive committee
General Manager Exploration
amp Subsurface
Andrew ThomasAndrew Thomas is a successful
geoscientist with over 28 yearsrsquo
experience in oil and gas exploration
and development in companies
including Geoscience Australia
Santos Gulf Canada and Newfield
Exploration At Newfield he was SE
Asia New Ventures Manager and
Exploration Manager for offshore
Sarawak
Executive Director
Hector GordonHector Gordon is a highly
experienced geologist with over 35
yearsrsquo experience in the petroleum
industry Previous roles include
Managing Director Somerton
Energy and a number of senior
management and technical roles at
Beach Energy including Exploration
Manager Chief Operating Officer
and ultimately Chief Executive
Officer
Alison Evans is an experienced
company secretary and corporate legal
counsel with extensive knowledge of
corporate and commercial law in the
resources and energy sectors
Alison has held Company Secretary
and Legal Counsel roles at a number of
minerals and energy companies
including Centrex Metals GTL Energy
and AGL Ms Evans public company
experience is supported by her work at
leading corporate law firms
Company Secretary and
General Counsel
Alison Evans
General Manager Development
Duncan CleggDuncan Clegg has over 35 yearsrsquo
experience in upstream and midstream oil
and gas development including
management positions at Shell and
Woodside leading oil and gas
developments including FPSO subsea
and fixed platforms developments At
Woodside Duncan held several senior
executive positions including Director of
the Australian Business Unit Director of
the African Business Unit and CEO of the
North West Shelf Venture
Eddy Glavas has more than 18 years
experience in business development
finance commercial portfolio
management and strategy including 14
years in the oil and gas sector Prior to
joining Cooper Energy he was
employed by Santos as Manager
Corporate Development with
responsibility for managing multi-
disciplinary teams tasked with mergers
acquisitions partnerships and
divestitures
General Manager Commercial amp
Business Development
Eddy Glavas
Virginia Suttell is a chartered accountant
with more than 20 years experience
including 16 years in publicly listed entities
principally in group finance and secretarial
roles in the resources and media sectors
This has included the role of Chief Financial
Officer and Company Secretary for Monax
Mining Limited and Marmota Energy Limited
from 2007 to 2016 and 2007 to 2015
respectively Other previous appointments
include Group Financial Controller at
Austereo Group Limited
Chief Financial Officer
(Acting)
Virginia Suttell
31
The approach for all reserve and resource calculations is consistent with the definitions and guidelines in the Society of Petroleum Engineers (SPE) 2007 Petroleum Resources Management System (PRMS) The resource estimate methodologies incorporate a range of uncertainty relating to each of the key reservoir input parameters to predict the likely range of outcomes Cooper Energy has completed its own estimation of reserves and contingent resources based on information provided by the permit Operators Beach Energy Ltd Senex Ltd and Santos Ltd and in accordance with the definitions and guidelines in the Society of Petroleum Engineers (SPE) 2007 Petroleum Resources Management System (PRMS) Petroleum Reserves and Contingent Resources are prepared using deterministic and probabilistic methods The method of aggregation for all reserves and contingent resources tables is by arithmetic summation by category Aggregated 1P and 1C estimates may be conservative and aggregated 3P and 3C estimates may be optimistic due to the effects of arithmetic summation Totals may not exactly reflect arithmetic addition due to rounding
The information contained in this report regarding the Cooper Energy reserves and contingent resources is based on and fairly represents information and supporting documentation reviewed by Mr Andrew Thomas who is a full-time employee of Cooper Energy Limited holding the position of General Manager Exploration amp Subsurface holds a Bachelor of Science (Hons) is a member of the American Association of Petroleum Geologists and the Society of Petroleum Engineers is qualified in accordance with ASX listing rule 541 and has consented to the inclusion of this information in the form and context in which it appears
The Cooper Basin totals comprise the probabilistically aggregated PEL 92 project fields and the arithmetic summation of the Worrior project reserves Total includes 005 MMbbl oil reserves used for field fuel The Indonesia totals include removal of non-shareable oil (NSO) and comprise the probabilistically aggregated Tangai-Sukananti KSO project fields Totals are derived by arithmetic summation In the Otway Basin reserves for the Casino Henry and Netherby fields have been assessed by Cooper Energy The Reserves have been assessed using deterministic and probabilistic methodologies for the Waarre Formation at the Casino Henry and Netherby fields This methodology incorporates a range of uncertainty relating to each of the key reservoir input parameters to predict the likely range of outcomes Cooper Energy undertook the following analytical procedures to estimate the Reserves independent interpretation of 3D seismic data analysis of historical production data to assess accessed gas volumes and future production forecasts review of the Operatorrsquos reservoir and production simulation models to define raw gas recovery consistent with existing processing facilities and independent probabilistic Monte Carlo statistical calculations to establish the range of recoverable gas The Otway gas reserves for Casino Henry and Netherby fields are net of fuel gas The date of the Casino Henry and Netherby Reserve Assessment is 27 February 2017
Sole gas field The contingent resource for the Sole field has been re-estimated assuming a two well subsea development plan Advantages of a two well plan compared to the previous single well development includeincreased 2C estimate attributable to accessing previously undeveloped gas and reduced technical risk and enhanced field redundancy providing increased security of supply to the gas processing and gas sales agreements Contingent resources for the Sole field were released to the ASX on 26 November 2015 Post-acquisition of the remaining 50 equity in the Sole gas field the following methodologies were used by Cooper Energy to re-calculate the Sole contingent resource estimate probabilistic simulation modelling for the Kingfish Formation incorporation of a range of uncertainty relating to each of the key reservoir input parameters to predict the likely range of outcomes and review of the reservoir and simulation modelling assuming a two well subsea development The date of the Sole contingent resource assessment is 27 February 2017
Manta gas and oil field Contingent and Prospective Resources have been assessed using deterministic simulation modelling and probabilistic resource estimation for the Intra-Latrobe and Golden Beach Sub-Group in the Manta field This methodology incorporates a range of uncertainty relating to each of the key reservoir input parameters to predict the likely range of outcomes The conversion factor of 1PJ = 0172MMboe has been used to convert from Sales Gas (PJ) to Oil Equivalent (MMboe) Contingent Resources for the Manta Field have been aggregated by arithmetic summation The date of the Manta Contingent Resource assessment is 16 July 2015 and the assessment was announced to the ASX on 16 July 2015 Cooper Energy is not aware of any new information or data that materially affects the information provided in that release and all material assumptions and technical parameters underpinning the assessment provided in the announcement continues to apply
Basker gas and oil field Contingent and Resources have been assessed using deterministic simulation modelling and probabilistic resource estimation for the Intra-Latrobe Sub-Group in the Basker field This methodology incorporates a range of uncertainty relating to each of the key reservoir input parameters to predict the likely range of outcomes The conversion factor of 1PJ = 0172MMboe has been used to convert from Sales Gas (PJ) to Oil Equivalent (MMboe) Contingent Resources for the Basker Field have been aggregated by arithmetic summation The date of the Basker Contingent Resource assessment is 15 August 2014 and the assessment was announced to the ASX on 18 August 2014 Cooper Energy is not aware of any new information or data that materially affects the information provided in that release and all material assumptions and technical parameters underpinning the assessment provided in the announcement continues to apply
32
$ A$ Australian dollars unless specified otherwise
Bbl barrels of oil
boe barrel of oil equivalent
bopd barrel of oil per day
EBITDA earnings before interest tax depreciation and amortisation
FEED Front end engineering and design
kbbls thousand barrels
LTIFR Lost Time Injury Frequency Rate Lost Time Incidents per million man hours worked
MMbbl million barrels of oil
MMboe million barrels of oil equivalent
NOPSEMA National Offshore Petroleum Safety amp Environmental Management Authority
NOPTA National Offshore Petroleum Titles Administrator
NPAT net profit after tax
PEL 92 Joint Venture conducting operations in Western Flank Cooper Basin Petroleum Retention Licences 85 ndash 104 previously encompassed by
the PEL 92 exploration licence
TRCFR Total Recordable Case Frequency Rate Recordable cases per million hours worked
TSR total shareholder return
1P reserves Proved reserves
2P reserves Proved and Probable reserves
3P Proved Probable and Possible reserves
1C 2C 3C high medium and low estimates of contingent resources
- 1WRM Investor presentation March 2017
-
- Slide Number 1
- Disclaimer
- Slide Number 3
- Slide Number 4
- Slide Number 5
- Slide Number 6
- Slide Number 7
- Slide Number 8
- Slide Number 9
- Slide Number 10
- Slide Number 11
- Gold and Silver development asset with a definitive feasibility study (DFS) commenced
- Slide Number 13
- Slide Number 14
- Slide Number 15
- Slide Number 16
- Slide Number 17
- Slide Number 18
- Slide Number 19
- Slide Number 20
- Slide Number 21
- Slide Number 22
- Slide Number 23
- Slide Number 24
- Slide Number 25
- Slide Number 26
- Slide Number 27
- Slide Number 28
- Slide Number 29
- Mount Carrington Resource Statement
- Slide Number 31
- Slide Number 32
- Slide Number 33
- Slide Number 34
- Slide Number 35
- Slide Number 36
- Slide Number 37
-
- 2Aurelia Metals Presentation-Mar 2017-widescreen format
-
- Slide Number 1
- Slide Number 2
- Slide Number 3
- Slide Number 4
- Slide Number 5
- Slide Number 6
- Slide Number 7
- Slide Number 8
- Slide Number 9
- Slide Number 10
- Slide Number 11
- Slide Number 12
- Slide Number 13
- Slide Number 14
- Slide Number 15
- Slide Number 16
- Slide Number 17
- Slide Number 18
- Slide Number 19
- Slide Number 20
- Slide Number 21
-
- 320170321 Presentations Melbourne Mining Club Speaker
-

6
Key Assets ndash Located in the productive Cobar Region
Bourke
Cobar Nyngan
Parkes ORANGE
Bathurst
Lithgow
Newcastle
SYDNEY 100kms
Nymagee Cu Project
Hera AuPbZn Mine
Cobar Basin
A u s t r a l i a
NSW
Endeavour ZnPbAg (Toho)
CSA Cu (Glencore)
Peak AuCu (New Gold)
Mallee bull CuPbZn project (PeelCBH)
Wonawinta Ag
First half FY17 ndash Highlights
7
bull Strong H1 FY17 Result
bull Profit cash flow amp debt reduction
bull Improved operations bull Ore processed up 22 on pcp bull Gold recovery to 866 bull Gold production up 22 on pcp
bull Strong cash build bull Cash build to $21M after
voluntary $10M debt repayment bull 21 reduction in net debt
relative to pcp - $119M to $94M ldquopcprdquo Prior Corresponding Period
Key Focus ndash Deliver strong operating performance
8 Gravity gold recovery increased from 42 to 62 over the same period
Key Focus ndash Deliver lower operating costs
9
Key Focus ndash Deliver low all-in cost
10
A$oz
Source Curran amp Co
bull Competitive Cost profile
Dec 16 Qtr Gold production of 13427 oz at an AISC of A$821oz (US$592oz)
AMIrsquos AISC vs ASX Peers ndash Dec Qrsquo16 Actuals
Key Focus ndash Deliver strong cash margin
11
bull Strong cash flow generation from high-margin operation
Key Focus ndash Deliver consistent production
12 2016 Calendar year gold production of 50899 oz
13
bull Debt reduction to provide optionality leading up to 31 Mar 18
bull Option to convert up to $755M of $115M debt just prior to 31 March 18 bull Options to repayrefinance or allow existing debt (covenant light) to run its course
Key Focus ndash Deliver reduced net debt
Gearing at 31 Dec 16 was 64 (share price 135c) Using current market cap (share price 23c) Gearing has reduced to 49 (Gearing defined as net debt(net debt+mkt value of equity)
Key Focus ndash Deliver growth in mine life
14
N
North Pod
S N
Stoped areas
(purple)
Planned Stopes
As built mine development
Planned mine development
Target Zone
500 m below surface
HRUD410
23m at 108 Pb+Zn 26gt Au 63gt Ag
400L
450L
500L
550L
600L
50 metres High Grade Open at Depth
High Grade Open Up-dip
NORTH POD LONG SECTION
New Drilling Results
Existing Drill Hole Mineralised Trend
NovDec16 results
High Grade PbZnAg High Grade Gold
Mine Long Section
North Pod
450L
500L
550L
NORTH
HRUD374 7m at 527 Pb+Zn
47gt Au 203gt Ag
HRUD370
7m at 881gt Au 43 Pb+Zn 47gt Ag
HRUD409 21m at 117gt Au
52 Pb+Zn 32gt Ag
Key Focus ndash Deliver growth in mine life (North Pod)
HRUD407 25m at 112gt Au
25 Pb+Zn 14gt Ag
Hera Mine Plan Showing Drill Traces and Main Mineralised Lodes
N 200m North Pod
1530 Hays South
Main South
Main North
Far West Hays North
Target Zone
16
Key Focus ndash Deliver growth in mine life
Structural Repetition
bull Potential for northern extensions of Hera lode system
bull Utilise downhole geochem and geophysics as tools to vector to mineralisation
17
Key Focus ndash Deliver growth in mine life (Nymagee)
Nymagee Copper Project
Hera Mine
Nymagee CuPbZn
bull Historic mine and current resource located 5km north of Hera Mine
bull Ability to leverage off Hera mine infrastructure
N 5 km
Lease boundary
18
Key Focus ndash Deliver growth in mine life (Nymagee)
Nymagee CuPbZn
bull Current large (8Mt) relative low grade resource down to 500 m below surface
bull Cu grade 12 bull Pb+Zn grade 1
bull Scoping Study underway to understand potential to selectively mine higher grade copper and leadzinc zones
bull Multiple exploration targets exist
Nymagee Long Section
300 m below surface
500 m below surface
700 m below surface
Current Resource Shell
Detail on the Nymagee Resource can be found in the Companyrsquos 2016 Annual Report
Key Focus ndash Deliver growth in mine life (Mine Trend)
Mine Corridor
bull Hera-Nymagee corridor remains highly prospective
bull The Hera amp Nymagee deposits are both marked by prominent gravity highs
bull Several gravity targets have been defined along 20km of strike
bull Potential for Hera-Nymagee corridor to evolve into Cobar field equivalent
20
Key Focus ndash Deliver Shareholder Returns
Conclusion
21
Strategy to Deliver Generate cash Continuously improve operational performance
- Continuous improvement in recovery and throughput - Minimise unit costs - Optimise mine plan (north pod high grade)
Reduce net debt Reduce gearing reduce financial risk
- build optionality leading up to first scheduled debt repayments (Mar-18)
Deliver growth Expansion of base metals capacity North Pod exploration amp strike extensions Scoping Study on copper development opportunity at Nymagee
2
The information in this presentation
bull Is not an offer or recommendation to purchase or subscribe for shares in Cooper Energy Limited or to retain or sell any shares that are
currently held
bull Does not take into account the individual investment objectives or the financial situation of investors
bull Was prepared with due care and attention and is current at the date of the presentation
Actual results may materially vary from any forecasts (where applicable) in this presentation
Before making or varying any investment in shares of Cooper Energy Limited all investors should consider the appropriateness of that
investment in light of their individual investment objectives and financial situation and should seek their own independent professional advice
Qualified petroleum reserves and resources evaluator
This report contains information on petroleum reserves and resources which is based on and fairly represents information and supporting
documentation reviewed by Mr Andrew Thomas who is a full time employee of Cooper Energy Limited holding the position of Exploration
Manager holds a Bachelor of Science (Hons) is a member of the American Association of Petroleum Geologists and the Society of Petroleum
Engineers and is qualified in accordance with ASX listing rule 541 and has consented to the inclusion of this information in the form and context
in which it appears
Rounding
All numbers in this presentation have been rounded As a result some total figures may differ insignificantly from totals obtained from arithmetic
addition of the rounded numbers presented
Reserves and resources calculation
Information on the companyrsquos reserves and resources and their calculation are provided in the appendices to this presentation
Currency
All financial information is expressed in Australian dollars unless otherwise specified
3
Cooper Energy develops and supplies gas to south-east Australia and produces oil from the
western flank of the Cooper Basin
The companyrsquos portfolio features existing gas production 227 PJ of uncontracted gas
and two new gas projects to supply south-east Australia from 2019 onwards backed by long term
contracts with blue chip utility and industrial customers
Existing assets and plans have the company on a 6 year growth trajectory with capacity for
production growth over 20 times FY16 levels
4
Cooper Basin oil
PEL 495
bull Oil production from western flank of Cooper Basin
bull Single gas exploration permit in Otway Basin
bull Poland
bull Romania
bull Indonesia
bull Tunisia
2011 portfolio
5
Otway Basin
bull Builds acreage and technical capability
through merger with Somerton Energy
bull Sub-surface studies reinforce view of
prospectivity
Market
bull Demand and supply-side gas market analysis
bull Commenced engagement with gas buyers
Gippsland Basin
bull Invested in Bass Strait Oil Company which
holds Gippsland permits
bull Technical studies of prospectivity and gas
plays
6
Otway Basin
bull Drilling identifies gas bearing
reservoirs in deep sands Gippsland Basin
bull Acquires 65 interest in Basker Manta Gummy
permits
bull Commenced Manta business case analysis for
supply to south-east Australia
7
Otway Basin
bull Builds understanding of Otway
sub-surface
bull Confirms attraction of offshore
Otway
Gippsland Basin
bull Acquires 50 of Sole gas field
bull Acquires 50 of Orbost Gas Plant
bull Manta business case affirms economic
development opportunity
8
Gippsland Basinbull Sole gas field interest 100
bull Sole gas project FEED completed
bull Orbost Gas Plant 100
bull Manta gas field 100
Otway Basin
bull Acquires Casino Henry Vic P44
Minerva and Minerva Gas Plant
Market
bull O-I Australia gas contract
bull AGL gas contract
bull EnergyAustralia gas
contract
bull Alinta Energy gas
contract
9
Gas contracts
bull 188 PJ contracted from 2017 on
bull EnergyAustralia (Otway amp Sole)
bull AGL Energy (Sole)
bull Alinta Energy (Sole)
bull O-I Australia (Sole)
New gas projects
bull Phase 1 Sole from 2019
ndash Sanction Marchrsquo 17 for March lsquo19 first gas into plant
bull Phase 2 Manta
ndash appraisal well and resource upside
ndash from FY22
bull VIC P44 exploration prospects
Production
bull ~ 7 PJ pa from Casino Henry amp
Minerva1
bull Sold to EnergyAustralia
bull Uncontracted gas to market for
supply from March 18
bull Field life to 2026 (Casino Henry)Plant amp infrastructure
bull Orbost Gas Plant connected to
EGP (subject to APA HoA)
bull Minerva1 Gas Plant (10)
connected to SEA Gas pipeline
bull Patricia Baleen connected to
Orbost and Longtom
1Acquisition of 10 interest in Minerva and Minerva gas plant to be completed
Uncontracted gas
Total of 227 PJ uncontracted in
bull Otway
ndash 52 PJ 2P Casino Henry reserves from March 2018
bull Gippsland
ndash Sole 69 PJ 2C contingent resource uncontracted
ndash Manta 106 PJ 2C contingent resource plus
exploration potential
10
03
Jun-16 Jan-17
FY17 production1
MMboe expected
Gas
Oil
1
49 76
367
668
Jun-16 Jan-17
Contingent resources (2C)12
MMboe
Gas
Oil13
11
104
Jun-16 Jan-17
2P reserves12
MMboe
bull Addition of Otway gas production Jan to Jun 17
bull Gas accounts for 75 of anticipated FY17 production
bull Addition of 60 PJ of Otway Basin gas reserves
bull Gas accounts for 90 of 116 MMboe 2P reserves
bull Australian contingent resources 2C up 79
bull 128 PJ gas contingent resources (2C) added in Gippsland
116
416
744
1Australia only 2 Reserves and Contingent Resources at 1 January 2017 were announced to the ASX on 27 February 2017 and should be read in conjunction with the information provided on the calculation
of Reserves and Contingent Resources provided on page 29 Cooper Energy is not aware of any new information or data that materially affects the information provided in those releases and
all material assumptions and technical parameters underpinning the assessment provided in the announcement continues to apply
11
Forecast 1 south-east Australian gas demand and production
PJ pa
South-east Australia comprises NSW VIC SA and Tasmania
SE Australia demandsup1
1 EnergyQuest Energy Quarterly March 2017
0
10
20
30
40
50
60
70
80
90
100
2017 2018 2019 2020 2021 2022 2023 2024
Cooper Energy gas production profilePJ pa
Manta(100)
Sole (100)
Casino
bull Casino Henry gas contracted to February 2018
bull Casino Henry gas available to contract from March 2018
bull COE may sell down some of Sole Gas Project and Manta post
Sole FID
0
100
200
300
400
500
600
2016 2018 2020 2022 2024 2026 2028 2030 2032 2034 2036
Most certain supply tranche Less certain supply tranche
Least certain supply tranche Southern demand
12Source AEMO
13
1 Assumes
bull Sole sanction by March quarter 2017 for March quarter 2019 first Sole gas
to plant
bull Manta 3 appraisal well
bull Development well required for Casino Henry ~2020
bull Details on slide 26
3 5 1
1520 20 20 20 20 20 20
16102
13
17 11
37 36 36
28
1913
15
10
FY17 FY18 FY19 FY20 FY21 FY22 FY23 FY24 FY25 FY26 FY27 FY28 FY29
Gas production1 from current assets contracted amp uncontractedPJ pa
Uncontracted
Contracted
227 PJ comprises 52 PJ 2P Casino Henry gas and 175 PJ 2C Contingent uncontracted gas from Sole and Manta Profile illustrated includes additional 10 PJ anticipated from Manta Cooper Energy announced Sole Contingent Resources on 27 February 2017 and Manta Contingent Resource 16 July 2015 Cooper Energy is not aware of any new information or data that materially affects the information provided in those releases and all material assumptions and technical parameters underpinning the assessment provided in the announcement continues to apply See notes on page 29 for information on reserves and resources calculation
14
Resource economics
Health amp safety
Environment
CommunityFiscaldividend
SuccessfulSustainable
Value-generating resource
development
Balance not achieved people hurt project collapse uneconomic no community
benefit no fiscal dividend excessive energy
costs
Balance achieved safe environmentally
sound development
cost effective sustainable energy
community benefits
fiscal dividend
15
Casino Henry
bull Sustained growth profile over 6 years
bull Gas accounts for overwhelming majority of production
bull New assets and production profile generates
ndash FY17 production gt2x FY16 production
ndash FY19 production gt5x FY16 production
ndash FY22 production gt20x FY16 production
0
2
4
6
8
10
12
FY15 FY16 FY17 FY18 FY19 FY20 FY21 FY22 FY23 FY24
Production1
MMboe
Sole Gas Project
Manta Gas Project
Casino-Henry
Cooper Basin oil
Assumes1
bull Current equities COE may divest some Gippsland post Sole sanction
bull Sole sanction by March quarter 2017 for March quarter 2019 Sole gas to plant
bull Manta 3 appraisal well
bull Development well required for Casino Henry ~2020
bull No new exploration success
16
Sole FID
bull Financial commitment to project
bull Triggers 43 MMboe uplift in gas reserves
bull Translation of HoA with APA to formal agreement
bull Expected shortly after project sanction
Uncontracted Otway gas
bull Contracting gas to supply from March 2018
bull Expect to secure new agreements in winter 2017 with market reflective price
Operator status
bull Working to appointment as Operator in Gippsland and Otway
bull Enables cost efficiencies and competitive advantage as asset owner and JV participant
Beyond June 2017
bull Cooper Basin assets
bull Divest slice of Gippsland Basin portfolio
bull Manta exploration
13116
~53
Jun-16 Jan-17 June -17Proforma
Uplift in 2P reservesMMboe
Australia only Assumes commitment of Sole gas project provides uplift of
~43 MMboe
1
2
3
4
17
1 Execution of our gas strategy has deliveredCooper Energy has become a supplier and developer of gas for south east Australia at a time of great market need
2 FY17 growth is the first step of larger and sustainable growthReserves and production upgrades in the current year are the initial instalment of a 6 year growth trajectory offering gt 20 times growth in
production from existing assets and equities
3 Integration proceeding management capabilities have been reinforced consistent with growthUpgraded people resources with the addition of proven performance orientated executives integration is proceeding to schedule
4 Sole project stronger and proceeding to final phase financingProject now offering lower risk lower capital cost increased gas and increased returns and value upside for Cooper Energy shareholders
5 Milestones aheadSix months to June 17 is expected to see a number of milestones for further uplift and value transformation
Appendices
20
Key figures
Shares on issue1 6601 mill
Shareholders1 5923
Market capitalisation1 $260 mill
Debt Nil
Current employees 23
Cooper Energy is an independent Australian exploration and
production company
bull Listed in 2002 history of profitable operations and successful
exploration and development
bull Strong balance sheet zero debt
bull Raised new equity capital of c$85 million during 2016
bull Management team and board experienced in growing resource
companies
bull Growth profile extending over 6 years from existing assets and
agreements
59
10
2
29
Share register
Institutional
Corporate
Employees amp Directors
Private
1 As at 20 March 2017
21
Oil exploration amp production
Cooper Basin Western Flank
240000 ndash 280000 1 bbl pa
Operating cost ltA$30bbl
High margin + exploration upside
Gas production amp sales Gas projects amp contracting
Otway Basin Casino Henry amp Minerva
Sales of ~7- 8 PJ pa to EnergyAustralia
Minerva1 gas plant
Production of 15 MMboe pa
Gippsland and Otway Basins
Sole Manta projects Otway uncontracted gas
gt400 PJ gas to be developed or uncontracted
Production uplift of up to 95 MMboe2 pa as
projects come online on top of existing output
1 Subject to completion of transaction2 Based on current equity participation levels
22
Phase 1 Sole
bull 2C Resource1 249 PJ
bull Sanction March 2017
bull Sole gas into plant March 2019
bull Output ~25 PJ pa
bull COE equity 100
Phase 2 Manta
bull 2C Resource1 106 PJ gas3 2 MMbbl liquids
bull Appraisal 2018-19
bull Sanction 2021
bull First gas ~2023
bull Output pa 25 PJ gas 039 MMbbl pa
bull Exploration Manta Deep amp Chimaera
bull COE equity 100
Orbost Gas Plant
bull Existing gas plant
bull Connected to Eastern Gas Pipeline
bull Plant owned amp operated by APA Group (proposed in HoA announced 27217
Longtom(Seven Group 100)
Patricia Baleen (COE 100)
Enabling customersUpstream and Midstream HoA
1 Cooper Energy announced Sole Contingent Resources on 27 February 2017 and Manta Contingent Resource 16 July 2015 Cooper Energy is not aware of any new information or data that materially affects the information provided in those releases and all material
assumptions and technical parameters underpinning the assessment provided in the announcement continues to apply See notes on page 29 for information on reserves and resources calculation
33 km
58 km
65 km
23
Sole Gas Project (VIC L32 COE100 Operator )
bull 249 PJ 2C Contingent Resource1
bull 20 PJ pa contracted gas contracts with O-I Australia AGL Energy Alinta Energy
EnergyAustralia
bull Sanction expected by March 2017 for Sole gas into plant by March 2019
Manta (VIC RL131415 COE 100)
bull 106 PJ 2C Contingent Resource plus 3 million barrels liquids1
bull economic business case identified subject to appraisal
bull prospective resource upside to be tested amp appraisal well expected 2018
Patricia-Baleen (VICL21 COE 100)
bull Non-operating field shut in
bull Strategic significance as access point for Orbost Gas Plant for other fields
1 Reserves and Contingent Resources at 1 January 2017 were announced to the ASX on 27 February 2017 and an announcement on Manta Contingent Resource was announced on 16 July 2015 The resources information displayed should be read in conjunction with the information provided on the calculation of Reserves and Contingent Resources provided on page 29 Cooper Energy is not aware of any new information or data that materially affects the information provided in those releases and all material assumptions and technical parameters underpinning the assessment provided in the announcement continues to apply
24
Key Assets
bull Casino Henry gas project (50)
bull Minerva gas field and plant (10 interest)1
bull VICP44 exploration permit
Production (COE share effective from 1 January 2017)
bull Casino Henry (VICRL11 amp 12) 7 PJ pa supplied to EnergyAustralia
under contract expiring March 2018
bull Minerva (VICL22)~ 1 PJ pa (expected to deplete by mid 2017)
Plans
bull Preparation for operatorship transfer likely June 2017
bull Marketing of uncontracted gas available for sale from March 2018
bull Casino Henry development well
1Acquisition of 10 interest in Minerva agreed with Santos Ltd is subject to completion
25
bull First half production of 013 MMbbl vs 017 in H1 FY16
bull Production impacted by suspension of drilling in low oil price FY16
bull Operating costs reduced from A$2992bbl to A$2928bbl
bull Drilling resumed in FY17 with 4 wells drilled 2 successful 2 P amp A
bull No further drilling planned for FY17
bull Producing interests
ndash PEL 92 25 interest (Beach Energy 75 amp Operator)
ndash PEL 93 30 interest (Senex Energy 70 amp Operator)
11 10
16 15
7 4
3530
FY16 H1 FY17
Production costs amp netback Direct cost A$ per barrel
NetbackRoyaltyTransportOperatingCosts per
bbl down 2
26
bull Take or pay gas
processing agreement
1 Cooper Energy to sell Orbost Gas Plant to APA Group
Heads of Agreement (non-binding) provides for APA to take ownership subject to Sole FID
2 APA to be responsible for funding and performance of ~$250 million plant upgrade and processing of gas from Sole amp Manta
Plant to be developed according to existing Sole Development Plan Sole gas to be processed under take or pay tariff agreement
3 Cooper Energy to retain 100 of upstream retains ownership of gas processed through Orbost Gas Plant
Estimated project cost for Cooper Energy reduced to ~$355 million and opportunity to realise further value accretion in sell-down post FID
Orbost Gas Plant APA Group 100
APA
bull funds and completes plant upgrade
for Sole
bull operates plant for agreed tariff amp
provides processed sales gas to
EGP
Sole gas
field
COE 100
COE
bull manages upstream
development
bull supplies gas to Orbost
for processing
bull markets the gas
Upstream Midstream
Downstream COE retains ownership of gas
through to point of sale to customers
in EGP
Transaction elements
1refer joint APA Group Cooper Energy announcement 27 February 2017
27
28
3 5
2 7 7 6 7 7 6 5 4
1
1520 20 20 20
2020
20
16
10
6
10 5 5 5 55
55 9
9
25 25 25
18
10
75
1
FY17 FY18 FY19 FY20 FY21 FY22 FY23 FY24 FY25 FY26 FY27 FY28 FY29
Gas production profile by projectcontracted amp uncontracted PJ pa
Manta uncontracted
Sole uncontracted
Sole contracted
Otway uncontracted
Otway contracted
Otway 2P reserves
Casino Henry
Gippsland Gas Project Phase 1
Sole
Gippsland Gas Project Phase 2
Manta
Assumes
bull Sole sanction by March quarter 2017 for March quarter 2019 first Sole gas to plant
bull All contract options in respect of Sole field are exercised
bull Manta subject to Manta 3 appraisal well Manta profile illustrates all Manta gas as uncontracted (including 4 PJ pa option held by
AGL) Manta profile includes 106 PJ 2C resource and additional 10 PJ anticipated
bull Development well required for Casino Henry ~2020
bull No exploration success
29
Reserves
Proved
(1P)
Proved amp Probable
(2P)
Proved Probable amp Possible
(3P)
Cooper1 Otway2 Total Cooper1 Otway2 Total Cooper1 Otway2 Total
Developed
Sales Gas PJ 00 48 48 00 152 152 00 293 293
Oil + Condensate MMbbl 05 00 05 09 00 09 16 00 16
Total developed MMboe2 05 08 13 09 26 35 16 51 67
Undeveloped
Sales Gas PJ 00 344 344 00 451 451 00 627 627
Oil + Condensate PJ 01 00 02 03 11 03 05 01 05
Total undeveloped MMboe2 01 60 61 03 78 81 05 109 113
Total1 MMboe2 07 68 74 11 104 116 21 159 180
Contingent
Resources
1C 2C 3C
Gas Oil Total1 Gas Oil Total Gas Oil Total
PJ MMbbl MMboe2 PJ MMbbl MMboe2 PJ MMbbl MMboe2
Gippsland 2917 40 541 3885 76 744 5336 121 1039
Cooper 02 00 003 03 00 01 06 00 01
Total 1 2919 40 542 3888 76 744 5342 121 1040
Additional information on reserve and resource calculation is provided in the appendices to this document
1 Totals may not reflect arithmetic addition due to rounding The method of aggregation is by arithmetic sum by category As a result the 1P estimate may be conservative and the 3P estimate may be optimistic due to the effects
of arithmetic summation The conversion factor of 1 PJ = 0172 MMboe has been used to convert from Sales Gas (PJ) to Oil Equivalent (MMboe) 2 The reserves revisions include Cooper Energyrsquos share of future crude fuel
usage in the Cooper Basin The estimated fuel usage for PEL 92 is 1P 002 MMbbl 2P 003 MMbbl and 3P 006 MMbbl The estimated fuel usage for the Worrior Field (PPL 207) is 1P 001 MMbbl 2P 002 MMbbl and 3P 003
MMbbl 3 The Otway gas reserves for Casino Henry and Netherby fields are net of fuel gas
1 Totals may not reflect arithmetic addition due to rounding The method of aggregation is by arithmetic sum by category As a result the 1C estimate may be conservative and the 3C estimate may be optimistic due to the
effects of arithmetic summation 2 The conversion factor of 1 PJ = 0172 MMboe has been used to convert from Sales Gas (PJ) to Oil Equivalent (MMboe)
30
General Manager Operations
Iain MacDougallIain MacDougall has more than 25
yearsrsquo experience in the upstream
petroleum exploration and production
sector including senior management
roles within independent operators
and international experience with
Schlumberger In Australia previous
employment includes Stuart
Petroleum as Production and
Engineering Manager and then as
acting CEO prior to the takeover of
Stuart Petroleum by Senex Energy
Managing Director
David MaxwellDavid Maxwell has over 30 yearsrsquo
experience as a senior executive with
companies such as BG Group Woodside
and Santos As Senior Vice President at
QGC a BG Group business he led BGrsquos
entry into Australia its alliance with and
subsequent takeover of QGC Roles at
Woodside included director of gas and
marketing and membership of Woodsidersquos
executive committee
General Manager Exploration
amp Subsurface
Andrew ThomasAndrew Thomas is a successful
geoscientist with over 28 yearsrsquo
experience in oil and gas exploration
and development in companies
including Geoscience Australia
Santos Gulf Canada and Newfield
Exploration At Newfield he was SE
Asia New Ventures Manager and
Exploration Manager for offshore
Sarawak
Executive Director
Hector GordonHector Gordon is a highly
experienced geologist with over 35
yearsrsquo experience in the petroleum
industry Previous roles include
Managing Director Somerton
Energy and a number of senior
management and technical roles at
Beach Energy including Exploration
Manager Chief Operating Officer
and ultimately Chief Executive
Officer
Alison Evans is an experienced
company secretary and corporate legal
counsel with extensive knowledge of
corporate and commercial law in the
resources and energy sectors
Alison has held Company Secretary
and Legal Counsel roles at a number of
minerals and energy companies
including Centrex Metals GTL Energy
and AGL Ms Evans public company
experience is supported by her work at
leading corporate law firms
Company Secretary and
General Counsel
Alison Evans
General Manager Development
Duncan CleggDuncan Clegg has over 35 yearsrsquo
experience in upstream and midstream oil
and gas development including
management positions at Shell and
Woodside leading oil and gas
developments including FPSO subsea
and fixed platforms developments At
Woodside Duncan held several senior
executive positions including Director of
the Australian Business Unit Director of
the African Business Unit and CEO of the
North West Shelf Venture
Eddy Glavas has more than 18 years
experience in business development
finance commercial portfolio
management and strategy including 14
years in the oil and gas sector Prior to
joining Cooper Energy he was
employed by Santos as Manager
Corporate Development with
responsibility for managing multi-
disciplinary teams tasked with mergers
acquisitions partnerships and
divestitures
General Manager Commercial amp
Business Development
Eddy Glavas
Virginia Suttell is a chartered accountant
with more than 20 years experience
including 16 years in publicly listed entities
principally in group finance and secretarial
roles in the resources and media sectors
This has included the role of Chief Financial
Officer and Company Secretary for Monax
Mining Limited and Marmota Energy Limited
from 2007 to 2016 and 2007 to 2015
respectively Other previous appointments
include Group Financial Controller at
Austereo Group Limited
Chief Financial Officer
(Acting)
Virginia Suttell
31
The approach for all reserve and resource calculations is consistent with the definitions and guidelines in the Society of Petroleum Engineers (SPE) 2007 Petroleum Resources Management System (PRMS) The resource estimate methodologies incorporate a range of uncertainty relating to each of the key reservoir input parameters to predict the likely range of outcomes Cooper Energy has completed its own estimation of reserves and contingent resources based on information provided by the permit Operators Beach Energy Ltd Senex Ltd and Santos Ltd and in accordance with the definitions and guidelines in the Society of Petroleum Engineers (SPE) 2007 Petroleum Resources Management System (PRMS) Petroleum Reserves and Contingent Resources are prepared using deterministic and probabilistic methods The method of aggregation for all reserves and contingent resources tables is by arithmetic summation by category Aggregated 1P and 1C estimates may be conservative and aggregated 3P and 3C estimates may be optimistic due to the effects of arithmetic summation Totals may not exactly reflect arithmetic addition due to rounding
The information contained in this report regarding the Cooper Energy reserves and contingent resources is based on and fairly represents information and supporting documentation reviewed by Mr Andrew Thomas who is a full-time employee of Cooper Energy Limited holding the position of General Manager Exploration amp Subsurface holds a Bachelor of Science (Hons) is a member of the American Association of Petroleum Geologists and the Society of Petroleum Engineers is qualified in accordance with ASX listing rule 541 and has consented to the inclusion of this information in the form and context in which it appears
The Cooper Basin totals comprise the probabilistically aggregated PEL 92 project fields and the arithmetic summation of the Worrior project reserves Total includes 005 MMbbl oil reserves used for field fuel The Indonesia totals include removal of non-shareable oil (NSO) and comprise the probabilistically aggregated Tangai-Sukananti KSO project fields Totals are derived by arithmetic summation In the Otway Basin reserves for the Casino Henry and Netherby fields have been assessed by Cooper Energy The Reserves have been assessed using deterministic and probabilistic methodologies for the Waarre Formation at the Casino Henry and Netherby fields This methodology incorporates a range of uncertainty relating to each of the key reservoir input parameters to predict the likely range of outcomes Cooper Energy undertook the following analytical procedures to estimate the Reserves independent interpretation of 3D seismic data analysis of historical production data to assess accessed gas volumes and future production forecasts review of the Operatorrsquos reservoir and production simulation models to define raw gas recovery consistent with existing processing facilities and independent probabilistic Monte Carlo statistical calculations to establish the range of recoverable gas The Otway gas reserves for Casino Henry and Netherby fields are net of fuel gas The date of the Casino Henry and Netherby Reserve Assessment is 27 February 2017
Sole gas field The contingent resource for the Sole field has been re-estimated assuming a two well subsea development plan Advantages of a two well plan compared to the previous single well development includeincreased 2C estimate attributable to accessing previously undeveloped gas and reduced technical risk and enhanced field redundancy providing increased security of supply to the gas processing and gas sales agreements Contingent resources for the Sole field were released to the ASX on 26 November 2015 Post-acquisition of the remaining 50 equity in the Sole gas field the following methodologies were used by Cooper Energy to re-calculate the Sole contingent resource estimate probabilistic simulation modelling for the Kingfish Formation incorporation of a range of uncertainty relating to each of the key reservoir input parameters to predict the likely range of outcomes and review of the reservoir and simulation modelling assuming a two well subsea development The date of the Sole contingent resource assessment is 27 February 2017
Manta gas and oil field Contingent and Prospective Resources have been assessed using deterministic simulation modelling and probabilistic resource estimation for the Intra-Latrobe and Golden Beach Sub-Group in the Manta field This methodology incorporates a range of uncertainty relating to each of the key reservoir input parameters to predict the likely range of outcomes The conversion factor of 1PJ = 0172MMboe has been used to convert from Sales Gas (PJ) to Oil Equivalent (MMboe) Contingent Resources for the Manta Field have been aggregated by arithmetic summation The date of the Manta Contingent Resource assessment is 16 July 2015 and the assessment was announced to the ASX on 16 July 2015 Cooper Energy is not aware of any new information or data that materially affects the information provided in that release and all material assumptions and technical parameters underpinning the assessment provided in the announcement continues to apply
Basker gas and oil field Contingent and Resources have been assessed using deterministic simulation modelling and probabilistic resource estimation for the Intra-Latrobe Sub-Group in the Basker field This methodology incorporates a range of uncertainty relating to each of the key reservoir input parameters to predict the likely range of outcomes The conversion factor of 1PJ = 0172MMboe has been used to convert from Sales Gas (PJ) to Oil Equivalent (MMboe) Contingent Resources for the Basker Field have been aggregated by arithmetic summation The date of the Basker Contingent Resource assessment is 15 August 2014 and the assessment was announced to the ASX on 18 August 2014 Cooper Energy is not aware of any new information or data that materially affects the information provided in that release and all material assumptions and technical parameters underpinning the assessment provided in the announcement continues to apply
32
$ A$ Australian dollars unless specified otherwise
Bbl barrels of oil
boe barrel of oil equivalent
bopd barrel of oil per day
EBITDA earnings before interest tax depreciation and amortisation
FEED Front end engineering and design
kbbls thousand barrels
LTIFR Lost Time Injury Frequency Rate Lost Time Incidents per million man hours worked
MMbbl million barrels of oil
MMboe million barrels of oil equivalent
NOPSEMA National Offshore Petroleum Safety amp Environmental Management Authority
NOPTA National Offshore Petroleum Titles Administrator
NPAT net profit after tax
PEL 92 Joint Venture conducting operations in Western Flank Cooper Basin Petroleum Retention Licences 85 ndash 104 previously encompassed by
the PEL 92 exploration licence
TRCFR Total Recordable Case Frequency Rate Recordable cases per million hours worked
TSR total shareholder return
1P reserves Proved reserves
2P reserves Proved and Probable reserves
3P Proved Probable and Possible reserves
1C 2C 3C high medium and low estimates of contingent resources
- 1WRM Investor presentation March 2017
-
- Slide Number 1
- Disclaimer
- Slide Number 3
- Slide Number 4
- Slide Number 5
- Slide Number 6
- Slide Number 7
- Slide Number 8
- Slide Number 9
- Slide Number 10
- Slide Number 11
- Gold and Silver development asset with a definitive feasibility study (DFS) commenced
- Slide Number 13
- Slide Number 14
- Slide Number 15
- Slide Number 16
- Slide Number 17
- Slide Number 18
- Slide Number 19
- Slide Number 20
- Slide Number 21
- Slide Number 22
- Slide Number 23
- Slide Number 24
- Slide Number 25
- Slide Number 26
- Slide Number 27
- Slide Number 28
- Slide Number 29
- Mount Carrington Resource Statement
- Slide Number 31
- Slide Number 32
- Slide Number 33
- Slide Number 34
- Slide Number 35
- Slide Number 36
- Slide Number 37
-
- 2Aurelia Metals Presentation-Mar 2017-widescreen format
-
- Slide Number 1
- Slide Number 2
- Slide Number 3
- Slide Number 4
- Slide Number 5
- Slide Number 6
- Slide Number 7
- Slide Number 8
- Slide Number 9
- Slide Number 10
- Slide Number 11
- Slide Number 12
- Slide Number 13
- Slide Number 14
- Slide Number 15
- Slide Number 16
- Slide Number 17
- Slide Number 18
- Slide Number 19
- Slide Number 20
- Slide Number 21
-
- 320170321 Presentations Melbourne Mining Club Speaker
-
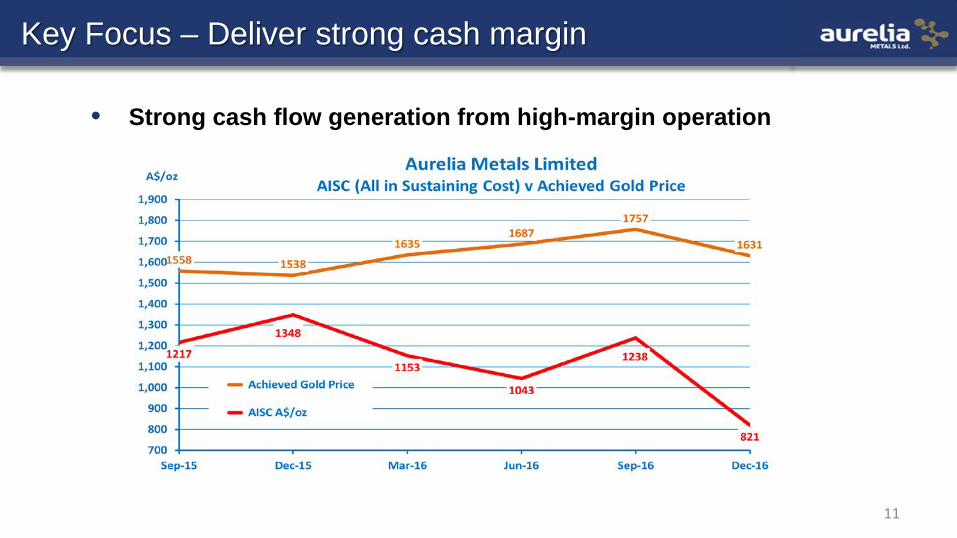
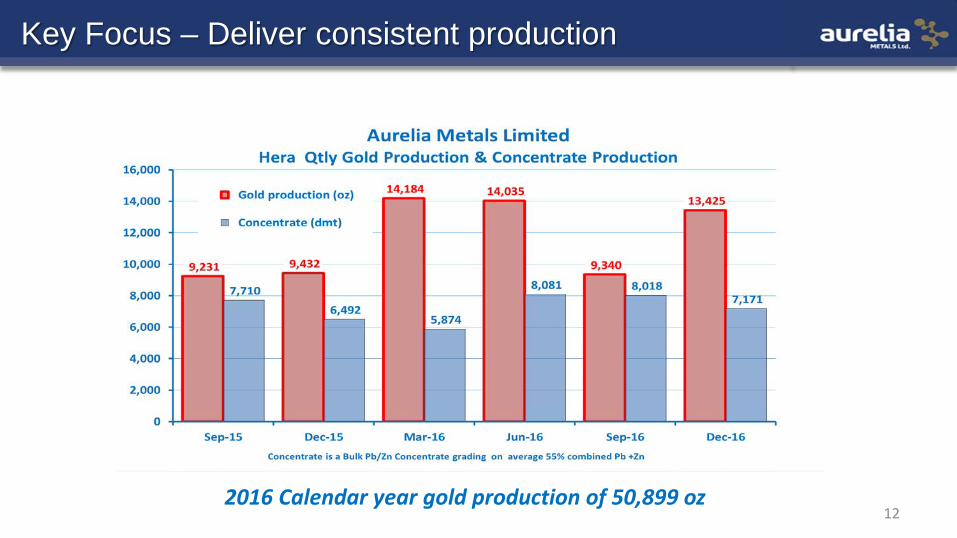

13
bull Debt reduction to provide optionality leading up to 31 Mar 18
bull Option to convert up to $755M of $115M debt just prior to 31 March 18 bull Options to repayrefinance or allow existing debt (covenant light) to run its course
Key Focus ndash Deliver reduced net debt
Gearing at 31 Dec 16 was 64 (share price 135c) Using current market cap (share price 23c) Gearing has reduced to 49 (Gearing defined as net debt(net debt+mkt value of equity)
Key Focus ndash Deliver growth in mine life
14
N
North Pod
S N
Stoped areas
(purple)
Planned Stopes
As built mine development
Planned mine development
Target Zone
500 m below surface
HRUD410
23m at 108 Pb+Zn 26gt Au 63gt Ag
400L
450L
500L
550L
600L
50 metres High Grade Open at Depth
High Grade Open Up-dip
NORTH POD LONG SECTION
New Drilling Results
Existing Drill Hole Mineralised Trend
NovDec16 results
High Grade PbZnAg High Grade Gold
Mine Long Section
North Pod
450L
500L
550L
NORTH
HRUD374 7m at 527 Pb+Zn
47gt Au 203gt Ag
HRUD370
7m at 881gt Au 43 Pb+Zn 47gt Ag
HRUD409 21m at 117gt Au
52 Pb+Zn 32gt Ag
Key Focus ndash Deliver growth in mine life (North Pod)
HRUD407 25m at 112gt Au
25 Pb+Zn 14gt Ag
Hera Mine Plan Showing Drill Traces and Main Mineralised Lodes
N 200m North Pod
1530 Hays South
Main South
Main North
Far West Hays North
Target Zone
16
Key Focus ndash Deliver growth in mine life
Structural Repetition
bull Potential for northern extensions of Hera lode system
bull Utilise downhole geochem and geophysics as tools to vector to mineralisation
17
Key Focus ndash Deliver growth in mine life (Nymagee)
Nymagee Copper Project
Hera Mine
Nymagee CuPbZn
bull Historic mine and current resource located 5km north of Hera Mine
bull Ability to leverage off Hera mine infrastructure
N 5 km
Lease boundary
18
Key Focus ndash Deliver growth in mine life (Nymagee)
Nymagee CuPbZn
bull Current large (8Mt) relative low grade resource down to 500 m below surface
bull Cu grade 12 bull Pb+Zn grade 1
bull Scoping Study underway to understand potential to selectively mine higher grade copper and leadzinc zones
bull Multiple exploration targets exist
Nymagee Long Section
300 m below surface
500 m below surface
700 m below surface
Current Resource Shell
Detail on the Nymagee Resource can be found in the Companyrsquos 2016 Annual Report
Key Focus ndash Deliver growth in mine life (Mine Trend)
Mine Corridor
bull Hera-Nymagee corridor remains highly prospective
bull The Hera amp Nymagee deposits are both marked by prominent gravity highs
bull Several gravity targets have been defined along 20km of strike
bull Potential for Hera-Nymagee corridor to evolve into Cobar field equivalent
20
Key Focus ndash Deliver Shareholder Returns
Conclusion
21
Strategy to Deliver Generate cash Continuously improve operational performance
- Continuous improvement in recovery and throughput - Minimise unit costs - Optimise mine plan (north pod high grade)
Reduce net debt Reduce gearing reduce financial risk
- build optionality leading up to first scheduled debt repayments (Mar-18)
Deliver growth Expansion of base metals capacity North Pod exploration amp strike extensions Scoping Study on copper development opportunity at Nymagee
2
The information in this presentation
bull Is not an offer or recommendation to purchase or subscribe for shares in Cooper Energy Limited or to retain or sell any shares that are
currently held
bull Does not take into account the individual investment objectives or the financial situation of investors
bull Was prepared with due care and attention and is current at the date of the presentation
Actual results may materially vary from any forecasts (where applicable) in this presentation
Before making or varying any investment in shares of Cooper Energy Limited all investors should consider the appropriateness of that
investment in light of their individual investment objectives and financial situation and should seek their own independent professional advice
Qualified petroleum reserves and resources evaluator
This report contains information on petroleum reserves and resources which is based on and fairly represents information and supporting
documentation reviewed by Mr Andrew Thomas who is a full time employee of Cooper Energy Limited holding the position of Exploration
Manager holds a Bachelor of Science (Hons) is a member of the American Association of Petroleum Geologists and the Society of Petroleum
Engineers and is qualified in accordance with ASX listing rule 541 and has consented to the inclusion of this information in the form and context
in which it appears
Rounding
All numbers in this presentation have been rounded As a result some total figures may differ insignificantly from totals obtained from arithmetic
addition of the rounded numbers presented
Reserves and resources calculation
Information on the companyrsquos reserves and resources and their calculation are provided in the appendices to this presentation
Currency
All financial information is expressed in Australian dollars unless otherwise specified
3
Cooper Energy develops and supplies gas to south-east Australia and produces oil from the
western flank of the Cooper Basin
The companyrsquos portfolio features existing gas production 227 PJ of uncontracted gas
and two new gas projects to supply south-east Australia from 2019 onwards backed by long term
contracts with blue chip utility and industrial customers
Existing assets and plans have the company on a 6 year growth trajectory with capacity for
production growth over 20 times FY16 levels
4
Cooper Basin oil
PEL 495
bull Oil production from western flank of Cooper Basin
bull Single gas exploration permit in Otway Basin
bull Poland
bull Romania
bull Indonesia
bull Tunisia
2011 portfolio
5
Otway Basin
bull Builds acreage and technical capability
through merger with Somerton Energy
bull Sub-surface studies reinforce view of
prospectivity
Market
bull Demand and supply-side gas market analysis
bull Commenced engagement with gas buyers
Gippsland Basin
bull Invested in Bass Strait Oil Company which
holds Gippsland permits
bull Technical studies of prospectivity and gas
plays
6
Otway Basin
bull Drilling identifies gas bearing
reservoirs in deep sands Gippsland Basin
bull Acquires 65 interest in Basker Manta Gummy
permits
bull Commenced Manta business case analysis for
supply to south-east Australia
7
Otway Basin
bull Builds understanding of Otway
sub-surface
bull Confirms attraction of offshore
Otway
Gippsland Basin
bull Acquires 50 of Sole gas field
bull Acquires 50 of Orbost Gas Plant
bull Manta business case affirms economic
development opportunity
8
Gippsland Basinbull Sole gas field interest 100
bull Sole gas project FEED completed
bull Orbost Gas Plant 100
bull Manta gas field 100
Otway Basin
bull Acquires Casino Henry Vic P44
Minerva and Minerva Gas Plant
Market
bull O-I Australia gas contract
bull AGL gas contract
bull EnergyAustralia gas
contract
bull Alinta Energy gas
contract
9
Gas contracts
bull 188 PJ contracted from 2017 on
bull EnergyAustralia (Otway amp Sole)
bull AGL Energy (Sole)
bull Alinta Energy (Sole)
bull O-I Australia (Sole)
New gas projects
bull Phase 1 Sole from 2019
ndash Sanction Marchrsquo 17 for March lsquo19 first gas into plant
bull Phase 2 Manta
ndash appraisal well and resource upside
ndash from FY22
bull VIC P44 exploration prospects
Production
bull ~ 7 PJ pa from Casino Henry amp
Minerva1
bull Sold to EnergyAustralia
bull Uncontracted gas to market for
supply from March 18
bull Field life to 2026 (Casino Henry)Plant amp infrastructure
bull Orbost Gas Plant connected to
EGP (subject to APA HoA)
bull Minerva1 Gas Plant (10)
connected to SEA Gas pipeline
bull Patricia Baleen connected to
Orbost and Longtom
1Acquisition of 10 interest in Minerva and Minerva gas plant to be completed
Uncontracted gas
Total of 227 PJ uncontracted in
bull Otway
ndash 52 PJ 2P Casino Henry reserves from March 2018
bull Gippsland
ndash Sole 69 PJ 2C contingent resource uncontracted
ndash Manta 106 PJ 2C contingent resource plus
exploration potential
10
03
Jun-16 Jan-17
FY17 production1
MMboe expected
Gas
Oil
1
49 76
367
668
Jun-16 Jan-17
Contingent resources (2C)12
MMboe
Gas
Oil13
11
104
Jun-16 Jan-17
2P reserves12
MMboe
bull Addition of Otway gas production Jan to Jun 17
bull Gas accounts for 75 of anticipated FY17 production
bull Addition of 60 PJ of Otway Basin gas reserves
bull Gas accounts for 90 of 116 MMboe 2P reserves
bull Australian contingent resources 2C up 79
bull 128 PJ gas contingent resources (2C) added in Gippsland
116
416
744
1Australia only 2 Reserves and Contingent Resources at 1 January 2017 were announced to the ASX on 27 February 2017 and should be read in conjunction with the information provided on the calculation
of Reserves and Contingent Resources provided on page 29 Cooper Energy is not aware of any new information or data that materially affects the information provided in those releases and
all material assumptions and technical parameters underpinning the assessment provided in the announcement continues to apply
11
Forecast 1 south-east Australian gas demand and production
PJ pa
South-east Australia comprises NSW VIC SA and Tasmania
SE Australia demandsup1
1 EnergyQuest Energy Quarterly March 2017
0
10
20
30
40
50
60
70
80
90
100
2017 2018 2019 2020 2021 2022 2023 2024
Cooper Energy gas production profilePJ pa
Manta(100)
Sole (100)
Casino
bull Casino Henry gas contracted to February 2018
bull Casino Henry gas available to contract from March 2018
bull COE may sell down some of Sole Gas Project and Manta post
Sole FID
0
100
200
300
400
500
600
2016 2018 2020 2022 2024 2026 2028 2030 2032 2034 2036
Most certain supply tranche Less certain supply tranche
Least certain supply tranche Southern demand
12Source AEMO
13
1 Assumes
bull Sole sanction by March quarter 2017 for March quarter 2019 first Sole gas
to plant
bull Manta 3 appraisal well
bull Development well required for Casino Henry ~2020
bull Details on slide 26
3 5 1
1520 20 20 20 20 20 20
16102
13
17 11
37 36 36
28
1913
15
10
FY17 FY18 FY19 FY20 FY21 FY22 FY23 FY24 FY25 FY26 FY27 FY28 FY29
Gas production1 from current assets contracted amp uncontractedPJ pa
Uncontracted
Contracted
227 PJ comprises 52 PJ 2P Casino Henry gas and 175 PJ 2C Contingent uncontracted gas from Sole and Manta Profile illustrated includes additional 10 PJ anticipated from Manta Cooper Energy announced Sole Contingent Resources on 27 February 2017 and Manta Contingent Resource 16 July 2015 Cooper Energy is not aware of any new information or data that materially affects the information provided in those releases and all material assumptions and technical parameters underpinning the assessment provided in the announcement continues to apply See notes on page 29 for information on reserves and resources calculation
14
Resource economics
Health amp safety
Environment
CommunityFiscaldividend
SuccessfulSustainable
Value-generating resource
development
Balance not achieved people hurt project collapse uneconomic no community
benefit no fiscal dividend excessive energy
costs
Balance achieved safe environmentally
sound development
cost effective sustainable energy
community benefits
fiscal dividend
15
Casino Henry
bull Sustained growth profile over 6 years
bull Gas accounts for overwhelming majority of production
bull New assets and production profile generates
ndash FY17 production gt2x FY16 production
ndash FY19 production gt5x FY16 production
ndash FY22 production gt20x FY16 production
0
2
4
6
8
10
12
FY15 FY16 FY17 FY18 FY19 FY20 FY21 FY22 FY23 FY24
Production1
MMboe
Sole Gas Project
Manta Gas Project
Casino-Henry
Cooper Basin oil
Assumes1
bull Current equities COE may divest some Gippsland post Sole sanction
bull Sole sanction by March quarter 2017 for March quarter 2019 Sole gas to plant
bull Manta 3 appraisal well
bull Development well required for Casino Henry ~2020
bull No new exploration success
16
Sole FID
bull Financial commitment to project
bull Triggers 43 MMboe uplift in gas reserves
bull Translation of HoA with APA to formal agreement
bull Expected shortly after project sanction
Uncontracted Otway gas
bull Contracting gas to supply from March 2018
bull Expect to secure new agreements in winter 2017 with market reflective price
Operator status
bull Working to appointment as Operator in Gippsland and Otway
bull Enables cost efficiencies and competitive advantage as asset owner and JV participant
Beyond June 2017
bull Cooper Basin assets
bull Divest slice of Gippsland Basin portfolio
bull Manta exploration
13116
~53
Jun-16 Jan-17 June -17Proforma
Uplift in 2P reservesMMboe
Australia only Assumes commitment of Sole gas project provides uplift of
~43 MMboe
1
2
3
4
17
1 Execution of our gas strategy has deliveredCooper Energy has become a supplier and developer of gas for south east Australia at a time of great market need
2 FY17 growth is the first step of larger and sustainable growthReserves and production upgrades in the current year are the initial instalment of a 6 year growth trajectory offering gt 20 times growth in
production from existing assets and equities
3 Integration proceeding management capabilities have been reinforced consistent with growthUpgraded people resources with the addition of proven performance orientated executives integration is proceeding to schedule
4 Sole project stronger and proceeding to final phase financingProject now offering lower risk lower capital cost increased gas and increased returns and value upside for Cooper Energy shareholders
5 Milestones aheadSix months to June 17 is expected to see a number of milestones for further uplift and value transformation
Appendices
20
Key figures
Shares on issue1 6601 mill
Shareholders1 5923
Market capitalisation1 $260 mill
Debt Nil
Current employees 23
Cooper Energy is an independent Australian exploration and
production company
bull Listed in 2002 history of profitable operations and successful
exploration and development
bull Strong balance sheet zero debt
bull Raised new equity capital of c$85 million during 2016
bull Management team and board experienced in growing resource
companies
bull Growth profile extending over 6 years from existing assets and
agreements
59
10
2
29
Share register
Institutional
Corporate
Employees amp Directors
Private
1 As at 20 March 2017
21
Oil exploration amp production
Cooper Basin Western Flank
240000 ndash 280000 1 bbl pa
Operating cost ltA$30bbl
High margin + exploration upside
Gas production amp sales Gas projects amp contracting
Otway Basin Casino Henry amp Minerva
Sales of ~7- 8 PJ pa to EnergyAustralia
Minerva1 gas plant
Production of 15 MMboe pa
Gippsland and Otway Basins
Sole Manta projects Otway uncontracted gas
gt400 PJ gas to be developed or uncontracted
Production uplift of up to 95 MMboe2 pa as
projects come online on top of existing output
1 Subject to completion of transaction2 Based on current equity participation levels
22
Phase 1 Sole
bull 2C Resource1 249 PJ
bull Sanction March 2017
bull Sole gas into plant March 2019
bull Output ~25 PJ pa
bull COE equity 100
Phase 2 Manta
bull 2C Resource1 106 PJ gas3 2 MMbbl liquids
bull Appraisal 2018-19
bull Sanction 2021
bull First gas ~2023
bull Output pa 25 PJ gas 039 MMbbl pa
bull Exploration Manta Deep amp Chimaera
bull COE equity 100
Orbost Gas Plant
bull Existing gas plant
bull Connected to Eastern Gas Pipeline
bull Plant owned amp operated by APA Group (proposed in HoA announced 27217
Longtom(Seven Group 100)
Patricia Baleen (COE 100)
Enabling customersUpstream and Midstream HoA
1 Cooper Energy announced Sole Contingent Resources on 27 February 2017 and Manta Contingent Resource 16 July 2015 Cooper Energy is not aware of any new information or data that materially affects the information provided in those releases and all material
assumptions and technical parameters underpinning the assessment provided in the announcement continues to apply See notes on page 29 for information on reserves and resources calculation
33 km
58 km
65 km
23
Sole Gas Project (VIC L32 COE100 Operator )
bull 249 PJ 2C Contingent Resource1
bull 20 PJ pa contracted gas contracts with O-I Australia AGL Energy Alinta Energy
EnergyAustralia
bull Sanction expected by March 2017 for Sole gas into plant by March 2019
Manta (VIC RL131415 COE 100)
bull 106 PJ 2C Contingent Resource plus 3 million barrels liquids1
bull economic business case identified subject to appraisal
bull prospective resource upside to be tested amp appraisal well expected 2018
Patricia-Baleen (VICL21 COE 100)
bull Non-operating field shut in
bull Strategic significance as access point for Orbost Gas Plant for other fields
1 Reserves and Contingent Resources at 1 January 2017 were announced to the ASX on 27 February 2017 and an announcement on Manta Contingent Resource was announced on 16 July 2015 The resources information displayed should be read in conjunction with the information provided on the calculation of Reserves and Contingent Resources provided on page 29 Cooper Energy is not aware of any new information or data that materially affects the information provided in those releases and all material assumptions and technical parameters underpinning the assessment provided in the announcement continues to apply
24
Key Assets
bull Casino Henry gas project (50)
bull Minerva gas field and plant (10 interest)1
bull VICP44 exploration permit
Production (COE share effective from 1 January 2017)
bull Casino Henry (VICRL11 amp 12) 7 PJ pa supplied to EnergyAustralia
under contract expiring March 2018
bull Minerva (VICL22)~ 1 PJ pa (expected to deplete by mid 2017)
Plans
bull Preparation for operatorship transfer likely June 2017
bull Marketing of uncontracted gas available for sale from March 2018
bull Casino Henry development well
1Acquisition of 10 interest in Minerva agreed with Santos Ltd is subject to completion
25
bull First half production of 013 MMbbl vs 017 in H1 FY16
bull Production impacted by suspension of drilling in low oil price FY16
bull Operating costs reduced from A$2992bbl to A$2928bbl
bull Drilling resumed in FY17 with 4 wells drilled 2 successful 2 P amp A
bull No further drilling planned for FY17
bull Producing interests
ndash PEL 92 25 interest (Beach Energy 75 amp Operator)
ndash PEL 93 30 interest (Senex Energy 70 amp Operator)
11 10
16 15
7 4
3530
FY16 H1 FY17
Production costs amp netback Direct cost A$ per barrel
NetbackRoyaltyTransportOperatingCosts per
bbl down 2
26
bull Take or pay gas
processing agreement
1 Cooper Energy to sell Orbost Gas Plant to APA Group
Heads of Agreement (non-binding) provides for APA to take ownership subject to Sole FID
2 APA to be responsible for funding and performance of ~$250 million plant upgrade and processing of gas from Sole amp Manta
Plant to be developed according to existing Sole Development Plan Sole gas to be processed under take or pay tariff agreement
3 Cooper Energy to retain 100 of upstream retains ownership of gas processed through Orbost Gas Plant
Estimated project cost for Cooper Energy reduced to ~$355 million and opportunity to realise further value accretion in sell-down post FID
Orbost Gas Plant APA Group 100
APA
bull funds and completes plant upgrade
for Sole
bull operates plant for agreed tariff amp
provides processed sales gas to
EGP
Sole gas
field
COE 100
COE
bull manages upstream
development
bull supplies gas to Orbost
for processing
bull markets the gas
Upstream Midstream
Downstream COE retains ownership of gas
through to point of sale to customers
in EGP
Transaction elements
1refer joint APA Group Cooper Energy announcement 27 February 2017
27
28
3 5
2 7 7 6 7 7 6 5 4
1
1520 20 20 20
2020
20
16
10
6
10 5 5 5 55
55 9
9
25 25 25
18
10
75
1
FY17 FY18 FY19 FY20 FY21 FY22 FY23 FY24 FY25 FY26 FY27 FY28 FY29
Gas production profile by projectcontracted amp uncontracted PJ pa
Manta uncontracted
Sole uncontracted
Sole contracted
Otway uncontracted
Otway contracted
Otway 2P reserves
Casino Henry
Gippsland Gas Project Phase 1
Sole
Gippsland Gas Project Phase 2
Manta
Assumes
bull Sole sanction by March quarter 2017 for March quarter 2019 first Sole gas to plant
bull All contract options in respect of Sole field are exercised
bull Manta subject to Manta 3 appraisal well Manta profile illustrates all Manta gas as uncontracted (including 4 PJ pa option held by
AGL) Manta profile includes 106 PJ 2C resource and additional 10 PJ anticipated
bull Development well required for Casino Henry ~2020
bull No exploration success
29
Reserves
Proved
(1P)
Proved amp Probable
(2P)
Proved Probable amp Possible
(3P)
Cooper1 Otway2 Total Cooper1 Otway2 Total Cooper1 Otway2 Total
Developed
Sales Gas PJ 00 48 48 00 152 152 00 293 293
Oil + Condensate MMbbl 05 00 05 09 00 09 16 00 16
Total developed MMboe2 05 08 13 09 26 35 16 51 67
Undeveloped
Sales Gas PJ 00 344 344 00 451 451 00 627 627
Oil + Condensate PJ 01 00 02 03 11 03 05 01 05
Total undeveloped MMboe2 01 60 61 03 78 81 05 109 113
Total1 MMboe2 07 68 74 11 104 116 21 159 180
Contingent
Resources
1C 2C 3C
Gas Oil Total1 Gas Oil Total Gas Oil Total
PJ MMbbl MMboe2 PJ MMbbl MMboe2 PJ MMbbl MMboe2
Gippsland 2917 40 541 3885 76 744 5336 121 1039
Cooper 02 00 003 03 00 01 06 00 01
Total 1 2919 40 542 3888 76 744 5342 121 1040
Additional information on reserve and resource calculation is provided in the appendices to this document
1 Totals may not reflect arithmetic addition due to rounding The method of aggregation is by arithmetic sum by category As a result the 1P estimate may be conservative and the 3P estimate may be optimistic due to the effects
of arithmetic summation The conversion factor of 1 PJ = 0172 MMboe has been used to convert from Sales Gas (PJ) to Oil Equivalent (MMboe) 2 The reserves revisions include Cooper Energyrsquos share of future crude fuel
usage in the Cooper Basin The estimated fuel usage for PEL 92 is 1P 002 MMbbl 2P 003 MMbbl and 3P 006 MMbbl The estimated fuel usage for the Worrior Field (PPL 207) is 1P 001 MMbbl 2P 002 MMbbl and 3P 003
MMbbl 3 The Otway gas reserves for Casino Henry and Netherby fields are net of fuel gas
1 Totals may not reflect arithmetic addition due to rounding The method of aggregation is by arithmetic sum by category As a result the 1C estimate may be conservative and the 3C estimate may be optimistic due to the
effects of arithmetic summation 2 The conversion factor of 1 PJ = 0172 MMboe has been used to convert from Sales Gas (PJ) to Oil Equivalent (MMboe)
30
General Manager Operations
Iain MacDougallIain MacDougall has more than 25
yearsrsquo experience in the upstream
petroleum exploration and production
sector including senior management
roles within independent operators
and international experience with
Schlumberger In Australia previous
employment includes Stuart
Petroleum as Production and
Engineering Manager and then as
acting CEO prior to the takeover of
Stuart Petroleum by Senex Energy
Managing Director
David MaxwellDavid Maxwell has over 30 yearsrsquo
experience as a senior executive with
companies such as BG Group Woodside
and Santos As Senior Vice President at
QGC a BG Group business he led BGrsquos
entry into Australia its alliance with and
subsequent takeover of QGC Roles at
Woodside included director of gas and
marketing and membership of Woodsidersquos
executive committee
General Manager Exploration
amp Subsurface
Andrew ThomasAndrew Thomas is a successful
geoscientist with over 28 yearsrsquo
experience in oil and gas exploration
and development in companies
including Geoscience Australia
Santos Gulf Canada and Newfield
Exploration At Newfield he was SE
Asia New Ventures Manager and
Exploration Manager for offshore
Sarawak
Executive Director
Hector GordonHector Gordon is a highly
experienced geologist with over 35
yearsrsquo experience in the petroleum
industry Previous roles include
Managing Director Somerton
Energy and a number of senior
management and technical roles at
Beach Energy including Exploration
Manager Chief Operating Officer
and ultimately Chief Executive
Officer
Alison Evans is an experienced
company secretary and corporate legal
counsel with extensive knowledge of
corporate and commercial law in the
resources and energy sectors
Alison has held Company Secretary
and Legal Counsel roles at a number of
minerals and energy companies
including Centrex Metals GTL Energy
and AGL Ms Evans public company
experience is supported by her work at
leading corporate law firms
Company Secretary and
General Counsel
Alison Evans
General Manager Development
Duncan CleggDuncan Clegg has over 35 yearsrsquo
experience in upstream and midstream oil
and gas development including
management positions at Shell and
Woodside leading oil and gas
developments including FPSO subsea
and fixed platforms developments At
Woodside Duncan held several senior
executive positions including Director of
the Australian Business Unit Director of
the African Business Unit and CEO of the
North West Shelf Venture
Eddy Glavas has more than 18 years
experience in business development
finance commercial portfolio
management and strategy including 14
years in the oil and gas sector Prior to
joining Cooper Energy he was
employed by Santos as Manager
Corporate Development with
responsibility for managing multi-
disciplinary teams tasked with mergers
acquisitions partnerships and
divestitures
General Manager Commercial amp
Business Development
Eddy Glavas
Virginia Suttell is a chartered accountant
with more than 20 years experience
including 16 years in publicly listed entities
principally in group finance and secretarial
roles in the resources and media sectors
This has included the role of Chief Financial
Officer and Company Secretary for Monax
Mining Limited and Marmota Energy Limited
from 2007 to 2016 and 2007 to 2015
respectively Other previous appointments
include Group Financial Controller at
Austereo Group Limited
Chief Financial Officer
(Acting)
Virginia Suttell
31
The approach for all reserve and resource calculations is consistent with the definitions and guidelines in the Society of Petroleum Engineers (SPE) 2007 Petroleum Resources Management System (PRMS) The resource estimate methodologies incorporate a range of uncertainty relating to each of the key reservoir input parameters to predict the likely range of outcomes Cooper Energy has completed its own estimation of reserves and contingent resources based on information provided by the permit Operators Beach Energy Ltd Senex Ltd and Santos Ltd and in accordance with the definitions and guidelines in the Society of Petroleum Engineers (SPE) 2007 Petroleum Resources Management System (PRMS) Petroleum Reserves and Contingent Resources are prepared using deterministic and probabilistic methods The method of aggregation for all reserves and contingent resources tables is by arithmetic summation by category Aggregated 1P and 1C estimates may be conservative and aggregated 3P and 3C estimates may be optimistic due to the effects of arithmetic summation Totals may not exactly reflect arithmetic addition due to rounding
The information contained in this report regarding the Cooper Energy reserves and contingent resources is based on and fairly represents information and supporting documentation reviewed by Mr Andrew Thomas who is a full-time employee of Cooper Energy Limited holding the position of General Manager Exploration amp Subsurface holds a Bachelor of Science (Hons) is a member of the American Association of Petroleum Geologists and the Society of Petroleum Engineers is qualified in accordance with ASX listing rule 541 and has consented to the inclusion of this information in the form and context in which it appears
The Cooper Basin totals comprise the probabilistically aggregated PEL 92 project fields and the arithmetic summation of the Worrior project reserves Total includes 005 MMbbl oil reserves used for field fuel The Indonesia totals include removal of non-shareable oil (NSO) and comprise the probabilistically aggregated Tangai-Sukananti KSO project fields Totals are derived by arithmetic summation In the Otway Basin reserves for the Casino Henry and Netherby fields have been assessed by Cooper Energy The Reserves have been assessed using deterministic and probabilistic methodologies for the Waarre Formation at the Casino Henry and Netherby fields This methodology incorporates a range of uncertainty relating to each of the key reservoir input parameters to predict the likely range of outcomes Cooper Energy undertook the following analytical procedures to estimate the Reserves independent interpretation of 3D seismic data analysis of historical production data to assess accessed gas volumes and future production forecasts review of the Operatorrsquos reservoir and production simulation models to define raw gas recovery consistent with existing processing facilities and independent probabilistic Monte Carlo statistical calculations to establish the range of recoverable gas The Otway gas reserves for Casino Henry and Netherby fields are net of fuel gas The date of the Casino Henry and Netherby Reserve Assessment is 27 February 2017
Sole gas field The contingent resource for the Sole field has been re-estimated assuming a two well subsea development plan Advantages of a two well plan compared to the previous single well development includeincreased 2C estimate attributable to accessing previously undeveloped gas and reduced technical risk and enhanced field redundancy providing increased security of supply to the gas processing and gas sales agreements Contingent resources for the Sole field were released to the ASX on 26 November 2015 Post-acquisition of the remaining 50 equity in the Sole gas field the following methodologies were used by Cooper Energy to re-calculate the Sole contingent resource estimate probabilistic simulation modelling for the Kingfish Formation incorporation of a range of uncertainty relating to each of the key reservoir input parameters to predict the likely range of outcomes and review of the reservoir and simulation modelling assuming a two well subsea development The date of the Sole contingent resource assessment is 27 February 2017
Manta gas and oil field Contingent and Prospective Resources have been assessed using deterministic simulation modelling and probabilistic resource estimation for the Intra-Latrobe and Golden Beach Sub-Group in the Manta field This methodology incorporates a range of uncertainty relating to each of the key reservoir input parameters to predict the likely range of outcomes The conversion factor of 1PJ = 0172MMboe has been used to convert from Sales Gas (PJ) to Oil Equivalent (MMboe) Contingent Resources for the Manta Field have been aggregated by arithmetic summation The date of the Manta Contingent Resource assessment is 16 July 2015 and the assessment was announced to the ASX on 16 July 2015 Cooper Energy is not aware of any new information or data that materially affects the information provided in that release and all material assumptions and technical parameters underpinning the assessment provided in the announcement continues to apply
Basker gas and oil field Contingent and Resources have been assessed using deterministic simulation modelling and probabilistic resource estimation for the Intra-Latrobe Sub-Group in the Basker field This methodology incorporates a range of uncertainty relating to each of the key reservoir input parameters to predict the likely range of outcomes The conversion factor of 1PJ = 0172MMboe has been used to convert from Sales Gas (PJ) to Oil Equivalent (MMboe) Contingent Resources for the Basker Field have been aggregated by arithmetic summation The date of the Basker Contingent Resource assessment is 15 August 2014 and the assessment was announced to the ASX on 18 August 2014 Cooper Energy is not aware of any new information or data that materially affects the information provided in that release and all material assumptions and technical parameters underpinning the assessment provided in the announcement continues to apply
32
$ A$ Australian dollars unless specified otherwise
Bbl barrels of oil
boe barrel of oil equivalent
bopd barrel of oil per day
EBITDA earnings before interest tax depreciation and amortisation
FEED Front end engineering and design
kbbls thousand barrels
LTIFR Lost Time Injury Frequency Rate Lost Time Incidents per million man hours worked
MMbbl million barrels of oil
MMboe million barrels of oil equivalent
NOPSEMA National Offshore Petroleum Safety amp Environmental Management Authority
NOPTA National Offshore Petroleum Titles Administrator
NPAT net profit after tax
PEL 92 Joint Venture conducting operations in Western Flank Cooper Basin Petroleum Retention Licences 85 ndash 104 previously encompassed by
the PEL 92 exploration licence
TRCFR Total Recordable Case Frequency Rate Recordable cases per million hours worked
TSR total shareholder return
1P reserves Proved reserves
2P reserves Proved and Probable reserves
3P Proved Probable and Possible reserves
1C 2C 3C high medium and low estimates of contingent resources
- 1WRM Investor presentation March 2017
-
- Slide Number 1
- Disclaimer
- Slide Number 3
- Slide Number 4
- Slide Number 5
- Slide Number 6
- Slide Number 7
- Slide Number 8
- Slide Number 9
- Slide Number 10
- Slide Number 11
- Gold and Silver development asset with a definitive feasibility study (DFS) commenced
- Slide Number 13
- Slide Number 14
- Slide Number 15
- Slide Number 16
- Slide Number 17
- Slide Number 18
- Slide Number 19
- Slide Number 20
- Slide Number 21
- Slide Number 22
- Slide Number 23
- Slide Number 24
- Slide Number 25
- Slide Number 26
- Slide Number 27
- Slide Number 28
- Slide Number 29
- Mount Carrington Resource Statement
- Slide Number 31
- Slide Number 32
- Slide Number 33
- Slide Number 34
- Slide Number 35
- Slide Number 36
- Slide Number 37
-
- 2Aurelia Metals Presentation-Mar 2017-widescreen format
-
- Slide Number 1
- Slide Number 2
- Slide Number 3
- Slide Number 4
- Slide Number 5
- Slide Number 6
- Slide Number 7
- Slide Number 8
- Slide Number 9
- Slide Number 10
- Slide Number 11
- Slide Number 12
- Slide Number 13
- Slide Number 14
- Slide Number 15
- Slide Number 16
- Slide Number 17
- Slide Number 18
- Slide Number 19
- Slide Number 20
- Slide Number 21
-
- 320170321 Presentations Melbourne Mining Club Speaker
-

Key Focus ndash Deliver growth in mine life
14
N
North Pod
S N
Stoped areas
(purple)
Planned Stopes
As built mine development
Planned mine development
Target Zone
500 m below surface
HRUD410
23m at 108 Pb+Zn 26gt Au 63gt Ag
400L
450L
500L
550L
600L
50 metres High Grade Open at Depth
High Grade Open Up-dip
NORTH POD LONG SECTION
New Drilling Results
Existing Drill Hole Mineralised Trend
NovDec16 results
High Grade PbZnAg High Grade Gold
Mine Long Section
North Pod
450L
500L
550L
NORTH
HRUD374 7m at 527 Pb+Zn
47gt Au 203gt Ag
HRUD370
7m at 881gt Au 43 Pb+Zn 47gt Ag
HRUD409 21m at 117gt Au
52 Pb+Zn 32gt Ag
Key Focus ndash Deliver growth in mine life (North Pod)
HRUD407 25m at 112gt Au
25 Pb+Zn 14gt Ag
Hera Mine Plan Showing Drill Traces and Main Mineralised Lodes
N 200m North Pod
1530 Hays South
Main South
Main North
Far West Hays North
Target Zone
16
Key Focus ndash Deliver growth in mine life
Structural Repetition
bull Potential for northern extensions of Hera lode system
bull Utilise downhole geochem and geophysics as tools to vector to mineralisation
17
Key Focus ndash Deliver growth in mine life (Nymagee)
Nymagee Copper Project
Hera Mine
Nymagee CuPbZn
bull Historic mine and current resource located 5km north of Hera Mine
bull Ability to leverage off Hera mine infrastructure
N 5 km
Lease boundary
18
Key Focus ndash Deliver growth in mine life (Nymagee)
Nymagee CuPbZn
bull Current large (8Mt) relative low grade resource down to 500 m below surface
bull Cu grade 12 bull Pb+Zn grade 1
bull Scoping Study underway to understand potential to selectively mine higher grade copper and leadzinc zones
bull Multiple exploration targets exist
Nymagee Long Section
300 m below surface
500 m below surface
700 m below surface
Current Resource Shell
Detail on the Nymagee Resource can be found in the Companyrsquos 2016 Annual Report
Key Focus ndash Deliver growth in mine life (Mine Trend)
Mine Corridor
bull Hera-Nymagee corridor remains highly prospective
bull The Hera amp Nymagee deposits are both marked by prominent gravity highs
bull Several gravity targets have been defined along 20km of strike
bull Potential for Hera-Nymagee corridor to evolve into Cobar field equivalent
20
Key Focus ndash Deliver Shareholder Returns
Conclusion
21
Strategy to Deliver Generate cash Continuously improve operational performance
- Continuous improvement in recovery and throughput - Minimise unit costs - Optimise mine plan (north pod high grade)
Reduce net debt Reduce gearing reduce financial risk
- build optionality leading up to first scheduled debt repayments (Mar-18)
Deliver growth Expansion of base metals capacity North Pod exploration amp strike extensions Scoping Study on copper development opportunity at Nymagee
2
The information in this presentation
bull Is not an offer or recommendation to purchase or subscribe for shares in Cooper Energy Limited or to retain or sell any shares that are
currently held
bull Does not take into account the individual investment objectives or the financial situation of investors
bull Was prepared with due care and attention and is current at the date of the presentation
Actual results may materially vary from any forecasts (where applicable) in this presentation
Before making or varying any investment in shares of Cooper Energy Limited all investors should consider the appropriateness of that
investment in light of their individual investment objectives and financial situation and should seek their own independent professional advice
Qualified petroleum reserves and resources evaluator
This report contains information on petroleum reserves and resources which is based on and fairly represents information and supporting
documentation reviewed by Mr Andrew Thomas who is a full time employee of Cooper Energy Limited holding the position of Exploration
Manager holds a Bachelor of Science (Hons) is a member of the American Association of Petroleum Geologists and the Society of Petroleum
Engineers and is qualified in accordance with ASX listing rule 541 and has consented to the inclusion of this information in the form and context
in which it appears
Rounding
All numbers in this presentation have been rounded As a result some total figures may differ insignificantly from totals obtained from arithmetic
addition of the rounded numbers presented
Reserves and resources calculation
Information on the companyrsquos reserves and resources and their calculation are provided in the appendices to this presentation
Currency
All financial information is expressed in Australian dollars unless otherwise specified
3
Cooper Energy develops and supplies gas to south-east Australia and produces oil from the
western flank of the Cooper Basin
The companyrsquos portfolio features existing gas production 227 PJ of uncontracted gas
and two new gas projects to supply south-east Australia from 2019 onwards backed by long term
contracts with blue chip utility and industrial customers
Existing assets and plans have the company on a 6 year growth trajectory with capacity for
production growth over 20 times FY16 levels
4
Cooper Basin oil
PEL 495
bull Oil production from western flank of Cooper Basin
bull Single gas exploration permit in Otway Basin
bull Poland
bull Romania
bull Indonesia
bull Tunisia
2011 portfolio
5
Otway Basin
bull Builds acreage and technical capability
through merger with Somerton Energy
bull Sub-surface studies reinforce view of
prospectivity
Market
bull Demand and supply-side gas market analysis
bull Commenced engagement with gas buyers
Gippsland Basin
bull Invested in Bass Strait Oil Company which
holds Gippsland permits
bull Technical studies of prospectivity and gas
plays
6
Otway Basin
bull Drilling identifies gas bearing
reservoirs in deep sands Gippsland Basin
bull Acquires 65 interest in Basker Manta Gummy
permits
bull Commenced Manta business case analysis for
supply to south-east Australia
7
Otway Basin
bull Builds understanding of Otway
sub-surface
bull Confirms attraction of offshore
Otway
Gippsland Basin
bull Acquires 50 of Sole gas field
bull Acquires 50 of Orbost Gas Plant
bull Manta business case affirms economic
development opportunity
8
Gippsland Basinbull Sole gas field interest 100
bull Sole gas project FEED completed
bull Orbost Gas Plant 100
bull Manta gas field 100
Otway Basin
bull Acquires Casino Henry Vic P44
Minerva and Minerva Gas Plant
Market
bull O-I Australia gas contract
bull AGL gas contract
bull EnergyAustralia gas
contract
bull Alinta Energy gas
contract
9
Gas contracts
bull 188 PJ contracted from 2017 on
bull EnergyAustralia (Otway amp Sole)
bull AGL Energy (Sole)
bull Alinta Energy (Sole)
bull O-I Australia (Sole)
New gas projects
bull Phase 1 Sole from 2019
ndash Sanction Marchrsquo 17 for March lsquo19 first gas into plant
bull Phase 2 Manta
ndash appraisal well and resource upside
ndash from FY22
bull VIC P44 exploration prospects
Production
bull ~ 7 PJ pa from Casino Henry amp
Minerva1
bull Sold to EnergyAustralia
bull Uncontracted gas to market for
supply from March 18
bull Field life to 2026 (Casino Henry)Plant amp infrastructure
bull Orbost Gas Plant connected to
EGP (subject to APA HoA)
bull Minerva1 Gas Plant (10)
connected to SEA Gas pipeline
bull Patricia Baleen connected to
Orbost and Longtom
1Acquisition of 10 interest in Minerva and Minerva gas plant to be completed
Uncontracted gas
Total of 227 PJ uncontracted in
bull Otway
ndash 52 PJ 2P Casino Henry reserves from March 2018
bull Gippsland
ndash Sole 69 PJ 2C contingent resource uncontracted
ndash Manta 106 PJ 2C contingent resource plus
exploration potential
10
03
Jun-16 Jan-17
FY17 production1
MMboe expected
Gas
Oil
1
49 76
367
668
Jun-16 Jan-17
Contingent resources (2C)12
MMboe
Gas
Oil13
11
104
Jun-16 Jan-17
2P reserves12
MMboe
bull Addition of Otway gas production Jan to Jun 17
bull Gas accounts for 75 of anticipated FY17 production
bull Addition of 60 PJ of Otway Basin gas reserves
bull Gas accounts for 90 of 116 MMboe 2P reserves
bull Australian contingent resources 2C up 79
bull 128 PJ gas contingent resources (2C) added in Gippsland
116
416
744
1Australia only 2 Reserves and Contingent Resources at 1 January 2017 were announced to the ASX on 27 February 2017 and should be read in conjunction with the information provided on the calculation
of Reserves and Contingent Resources provided on page 29 Cooper Energy is not aware of any new information or data that materially affects the information provided in those releases and
all material assumptions and technical parameters underpinning the assessment provided in the announcement continues to apply
11
Forecast 1 south-east Australian gas demand and production
PJ pa
South-east Australia comprises NSW VIC SA and Tasmania
SE Australia demandsup1
1 EnergyQuest Energy Quarterly March 2017
0
10
20
30
40
50
60
70
80
90
100
2017 2018 2019 2020 2021 2022 2023 2024
Cooper Energy gas production profilePJ pa
Manta(100)
Sole (100)
Casino
bull Casino Henry gas contracted to February 2018
bull Casino Henry gas available to contract from March 2018
bull COE may sell down some of Sole Gas Project and Manta post
Sole FID
0
100
200
300
400
500
600
2016 2018 2020 2022 2024 2026 2028 2030 2032 2034 2036
Most certain supply tranche Less certain supply tranche
Least certain supply tranche Southern demand
12Source AEMO
13
1 Assumes
bull Sole sanction by March quarter 2017 for March quarter 2019 first Sole gas
to plant
bull Manta 3 appraisal well
bull Development well required for Casino Henry ~2020
bull Details on slide 26
3 5 1
1520 20 20 20 20 20 20
16102
13
17 11
37 36 36
28
1913
15
10
FY17 FY18 FY19 FY20 FY21 FY22 FY23 FY24 FY25 FY26 FY27 FY28 FY29
Gas production1 from current assets contracted amp uncontractedPJ pa
Uncontracted
Contracted
227 PJ comprises 52 PJ 2P Casino Henry gas and 175 PJ 2C Contingent uncontracted gas from Sole and Manta Profile illustrated includes additional 10 PJ anticipated from Manta Cooper Energy announced Sole Contingent Resources on 27 February 2017 and Manta Contingent Resource 16 July 2015 Cooper Energy is not aware of any new information or data that materially affects the information provided in those releases and all material assumptions and technical parameters underpinning the assessment provided in the announcement continues to apply See notes on page 29 for information on reserves and resources calculation
14
Resource economics
Health amp safety
Environment
CommunityFiscaldividend
SuccessfulSustainable
Value-generating resource
development
Balance not achieved people hurt project collapse uneconomic no community
benefit no fiscal dividend excessive energy
costs
Balance achieved safe environmentally
sound development
cost effective sustainable energy
community benefits
fiscal dividend
15
Casino Henry
bull Sustained growth profile over 6 years
bull Gas accounts for overwhelming majority of production
bull New assets and production profile generates
ndash FY17 production gt2x FY16 production
ndash FY19 production gt5x FY16 production
ndash FY22 production gt20x FY16 production
0
2
4
6
8
10
12
FY15 FY16 FY17 FY18 FY19 FY20 FY21 FY22 FY23 FY24
Production1
MMboe
Sole Gas Project
Manta Gas Project
Casino-Henry
Cooper Basin oil
Assumes1
bull Current equities COE may divest some Gippsland post Sole sanction
bull Sole sanction by March quarter 2017 for March quarter 2019 Sole gas to plant
bull Manta 3 appraisal well
bull Development well required for Casino Henry ~2020
bull No new exploration success
16
Sole FID
bull Financial commitment to project
bull Triggers 43 MMboe uplift in gas reserves
bull Translation of HoA with APA to formal agreement
bull Expected shortly after project sanction
Uncontracted Otway gas
bull Contracting gas to supply from March 2018
bull Expect to secure new agreements in winter 2017 with market reflective price
Operator status
bull Working to appointment as Operator in Gippsland and Otway
bull Enables cost efficiencies and competitive advantage as asset owner and JV participant
Beyond June 2017
bull Cooper Basin assets
bull Divest slice of Gippsland Basin portfolio
bull Manta exploration
13116
~53
Jun-16 Jan-17 June -17Proforma
Uplift in 2P reservesMMboe
Australia only Assumes commitment of Sole gas project provides uplift of
~43 MMboe
1
2
3
4
17
1 Execution of our gas strategy has deliveredCooper Energy has become a supplier and developer of gas for south east Australia at a time of great market need
2 FY17 growth is the first step of larger and sustainable growthReserves and production upgrades in the current year are the initial instalment of a 6 year growth trajectory offering gt 20 times growth in
production from existing assets and equities
3 Integration proceeding management capabilities have been reinforced consistent with growthUpgraded people resources with the addition of proven performance orientated executives integration is proceeding to schedule
4 Sole project stronger and proceeding to final phase financingProject now offering lower risk lower capital cost increased gas and increased returns and value upside for Cooper Energy shareholders
5 Milestones aheadSix months to June 17 is expected to see a number of milestones for further uplift and value transformation
Appendices
20
Key figures
Shares on issue1 6601 mill
Shareholders1 5923
Market capitalisation1 $260 mill
Debt Nil
Current employees 23
Cooper Energy is an independent Australian exploration and
production company
bull Listed in 2002 history of profitable operations and successful
exploration and development
bull Strong balance sheet zero debt
bull Raised new equity capital of c$85 million during 2016
bull Management team and board experienced in growing resource
companies
bull Growth profile extending over 6 years from existing assets and
agreements
59
10
2
29
Share register
Institutional
Corporate
Employees amp Directors
Private
1 As at 20 March 2017
21
Oil exploration amp production
Cooper Basin Western Flank
240000 ndash 280000 1 bbl pa
Operating cost ltA$30bbl
High margin + exploration upside
Gas production amp sales Gas projects amp contracting
Otway Basin Casino Henry amp Minerva
Sales of ~7- 8 PJ pa to EnergyAustralia
Minerva1 gas plant
Production of 15 MMboe pa
Gippsland and Otway Basins
Sole Manta projects Otway uncontracted gas
gt400 PJ gas to be developed or uncontracted
Production uplift of up to 95 MMboe2 pa as
projects come online on top of existing output
1 Subject to completion of transaction2 Based on current equity participation levels
22
Phase 1 Sole
bull 2C Resource1 249 PJ
bull Sanction March 2017
bull Sole gas into plant March 2019
bull Output ~25 PJ pa
bull COE equity 100
Phase 2 Manta
bull 2C Resource1 106 PJ gas3 2 MMbbl liquids
bull Appraisal 2018-19
bull Sanction 2021
bull First gas ~2023
bull Output pa 25 PJ gas 039 MMbbl pa
bull Exploration Manta Deep amp Chimaera
bull COE equity 100
Orbost Gas Plant
bull Existing gas plant
bull Connected to Eastern Gas Pipeline
bull Plant owned amp operated by APA Group (proposed in HoA announced 27217
Longtom(Seven Group 100)
Patricia Baleen (COE 100)
Enabling customersUpstream and Midstream HoA
1 Cooper Energy announced Sole Contingent Resources on 27 February 2017 and Manta Contingent Resource 16 July 2015 Cooper Energy is not aware of any new information or data that materially affects the information provided in those releases and all material
assumptions and technical parameters underpinning the assessment provided in the announcement continues to apply See notes on page 29 for information on reserves and resources calculation
33 km
58 km
65 km
23
Sole Gas Project (VIC L32 COE100 Operator )
bull 249 PJ 2C Contingent Resource1
bull 20 PJ pa contracted gas contracts with O-I Australia AGL Energy Alinta Energy
EnergyAustralia
bull Sanction expected by March 2017 for Sole gas into plant by March 2019
Manta (VIC RL131415 COE 100)
bull 106 PJ 2C Contingent Resource plus 3 million barrels liquids1
bull economic business case identified subject to appraisal
bull prospective resource upside to be tested amp appraisal well expected 2018
Patricia-Baleen (VICL21 COE 100)
bull Non-operating field shut in
bull Strategic significance as access point for Orbost Gas Plant for other fields
1 Reserves and Contingent Resources at 1 January 2017 were announced to the ASX on 27 February 2017 and an announcement on Manta Contingent Resource was announced on 16 July 2015 The resources information displayed should be read in conjunction with the information provided on the calculation of Reserves and Contingent Resources provided on page 29 Cooper Energy is not aware of any new information or data that materially affects the information provided in those releases and all material assumptions and technical parameters underpinning the assessment provided in the announcement continues to apply
24
Key Assets
bull Casino Henry gas project (50)
bull Minerva gas field and plant (10 interest)1
bull VICP44 exploration permit
Production (COE share effective from 1 January 2017)
bull Casino Henry (VICRL11 amp 12) 7 PJ pa supplied to EnergyAustralia
under contract expiring March 2018
bull Minerva (VICL22)~ 1 PJ pa (expected to deplete by mid 2017)
Plans
bull Preparation for operatorship transfer likely June 2017
bull Marketing of uncontracted gas available for sale from March 2018
bull Casino Henry development well
1Acquisition of 10 interest in Minerva agreed with Santos Ltd is subject to completion
25
bull First half production of 013 MMbbl vs 017 in H1 FY16
bull Production impacted by suspension of drilling in low oil price FY16
bull Operating costs reduced from A$2992bbl to A$2928bbl
bull Drilling resumed in FY17 with 4 wells drilled 2 successful 2 P amp A
bull No further drilling planned for FY17
bull Producing interests
ndash PEL 92 25 interest (Beach Energy 75 amp Operator)
ndash PEL 93 30 interest (Senex Energy 70 amp Operator)
11 10
16 15
7 4
3530
FY16 H1 FY17
Production costs amp netback Direct cost A$ per barrel
NetbackRoyaltyTransportOperatingCosts per
bbl down 2
26
bull Take or pay gas
processing agreement
1 Cooper Energy to sell Orbost Gas Plant to APA Group
Heads of Agreement (non-binding) provides for APA to take ownership subject to Sole FID
2 APA to be responsible for funding and performance of ~$250 million plant upgrade and processing of gas from Sole amp Manta
Plant to be developed according to existing Sole Development Plan Sole gas to be processed under take or pay tariff agreement
3 Cooper Energy to retain 100 of upstream retains ownership of gas processed through Orbost Gas Plant
Estimated project cost for Cooper Energy reduced to ~$355 million and opportunity to realise further value accretion in sell-down post FID
Orbost Gas Plant APA Group 100
APA
bull funds and completes plant upgrade
for Sole
bull operates plant for agreed tariff amp
provides processed sales gas to
EGP
Sole gas
field
COE 100
COE
bull manages upstream
development
bull supplies gas to Orbost
for processing
bull markets the gas
Upstream Midstream
Downstream COE retains ownership of gas
through to point of sale to customers
in EGP
Transaction elements
1refer joint APA Group Cooper Energy announcement 27 February 2017
27
28
3 5
2 7 7 6 7 7 6 5 4
1
1520 20 20 20
2020
20
16
10
6
10 5 5 5 55
55 9
9
25 25 25
18
10
75
1
FY17 FY18 FY19 FY20 FY21 FY22 FY23 FY24 FY25 FY26 FY27 FY28 FY29
Gas production profile by projectcontracted amp uncontracted PJ pa
Manta uncontracted
Sole uncontracted
Sole contracted
Otway uncontracted
Otway contracted
Otway 2P reserves
Casino Henry
Gippsland Gas Project Phase 1
Sole
Gippsland Gas Project Phase 2
Manta
Assumes
bull Sole sanction by March quarter 2017 for March quarter 2019 first Sole gas to plant
bull All contract options in respect of Sole field are exercised
bull Manta subject to Manta 3 appraisal well Manta profile illustrates all Manta gas as uncontracted (including 4 PJ pa option held by
AGL) Manta profile includes 106 PJ 2C resource and additional 10 PJ anticipated
bull Development well required for Casino Henry ~2020
bull No exploration success
29
Reserves
Proved
(1P)
Proved amp Probable
(2P)
Proved Probable amp Possible
(3P)
Cooper1 Otway2 Total Cooper1 Otway2 Total Cooper1 Otway2 Total
Developed
Sales Gas PJ 00 48 48 00 152 152 00 293 293
Oil + Condensate MMbbl 05 00 05 09 00 09 16 00 16
Total developed MMboe2 05 08 13 09 26 35 16 51 67
Undeveloped
Sales Gas PJ 00 344 344 00 451 451 00 627 627
Oil + Condensate PJ 01 00 02 03 11 03 05 01 05
Total undeveloped MMboe2 01 60 61 03 78 81 05 109 113
Total1 MMboe2 07 68 74 11 104 116 21 159 180
Contingent
Resources
1C 2C 3C
Gas Oil Total1 Gas Oil Total Gas Oil Total
PJ MMbbl MMboe2 PJ MMbbl MMboe2 PJ MMbbl MMboe2
Gippsland 2917 40 541 3885 76 744 5336 121 1039
Cooper 02 00 003 03 00 01 06 00 01
Total 1 2919 40 542 3888 76 744 5342 121 1040
Additional information on reserve and resource calculation is provided in the appendices to this document
1 Totals may not reflect arithmetic addition due to rounding The method of aggregation is by arithmetic sum by category As a result the 1P estimate may be conservative and the 3P estimate may be optimistic due to the effects
of arithmetic summation The conversion factor of 1 PJ = 0172 MMboe has been used to convert from Sales Gas (PJ) to Oil Equivalent (MMboe) 2 The reserves revisions include Cooper Energyrsquos share of future crude fuel
usage in the Cooper Basin The estimated fuel usage for PEL 92 is 1P 002 MMbbl 2P 003 MMbbl and 3P 006 MMbbl The estimated fuel usage for the Worrior Field (PPL 207) is 1P 001 MMbbl 2P 002 MMbbl and 3P 003
MMbbl 3 The Otway gas reserves for Casino Henry and Netherby fields are net of fuel gas
1 Totals may not reflect arithmetic addition due to rounding The method of aggregation is by arithmetic sum by category As a result the 1C estimate may be conservative and the 3C estimate may be optimistic due to the
effects of arithmetic summation 2 The conversion factor of 1 PJ = 0172 MMboe has been used to convert from Sales Gas (PJ) to Oil Equivalent (MMboe)
30
General Manager Operations
Iain MacDougallIain MacDougall has more than 25
yearsrsquo experience in the upstream
petroleum exploration and production
sector including senior management
roles within independent operators
and international experience with
Schlumberger In Australia previous
employment includes Stuart
Petroleum as Production and
Engineering Manager and then as
acting CEO prior to the takeover of
Stuart Petroleum by Senex Energy
Managing Director
David MaxwellDavid Maxwell has over 30 yearsrsquo
experience as a senior executive with
companies such as BG Group Woodside
and Santos As Senior Vice President at
QGC a BG Group business he led BGrsquos
entry into Australia its alliance with and
subsequent takeover of QGC Roles at
Woodside included director of gas and
marketing and membership of Woodsidersquos
executive committee
General Manager Exploration
amp Subsurface
Andrew ThomasAndrew Thomas is a successful
geoscientist with over 28 yearsrsquo
experience in oil and gas exploration
and development in companies
including Geoscience Australia
Santos Gulf Canada and Newfield
Exploration At Newfield he was SE
Asia New Ventures Manager and
Exploration Manager for offshore
Sarawak
Executive Director
Hector GordonHector Gordon is a highly
experienced geologist with over 35
yearsrsquo experience in the petroleum
industry Previous roles include
Managing Director Somerton
Energy and a number of senior
management and technical roles at
Beach Energy including Exploration
Manager Chief Operating Officer
and ultimately Chief Executive
Officer
Alison Evans is an experienced
company secretary and corporate legal
counsel with extensive knowledge of
corporate and commercial law in the
resources and energy sectors
Alison has held Company Secretary
and Legal Counsel roles at a number of
minerals and energy companies
including Centrex Metals GTL Energy
and AGL Ms Evans public company
experience is supported by her work at
leading corporate law firms
Company Secretary and
General Counsel
Alison Evans
General Manager Development
Duncan CleggDuncan Clegg has over 35 yearsrsquo
experience in upstream and midstream oil
and gas development including
management positions at Shell and
Woodside leading oil and gas
developments including FPSO subsea
and fixed platforms developments At
Woodside Duncan held several senior
executive positions including Director of
the Australian Business Unit Director of
the African Business Unit and CEO of the
North West Shelf Venture
Eddy Glavas has more than 18 years
experience in business development
finance commercial portfolio
management and strategy including 14
years in the oil and gas sector Prior to
joining Cooper Energy he was
employed by Santos as Manager
Corporate Development with
responsibility for managing multi-
disciplinary teams tasked with mergers
acquisitions partnerships and
divestitures
General Manager Commercial amp
Business Development
Eddy Glavas
Virginia Suttell is a chartered accountant
with more than 20 years experience
including 16 years in publicly listed entities
principally in group finance and secretarial
roles in the resources and media sectors
This has included the role of Chief Financial
Officer and Company Secretary for Monax
Mining Limited and Marmota Energy Limited
from 2007 to 2016 and 2007 to 2015
respectively Other previous appointments
include Group Financial Controller at
Austereo Group Limited
Chief Financial Officer
(Acting)
Virginia Suttell
31
The approach for all reserve and resource calculations is consistent with the definitions and guidelines in the Society of Petroleum Engineers (SPE) 2007 Petroleum Resources Management System (PRMS) The resource estimate methodologies incorporate a range of uncertainty relating to each of the key reservoir input parameters to predict the likely range of outcomes Cooper Energy has completed its own estimation of reserves and contingent resources based on information provided by the permit Operators Beach Energy Ltd Senex Ltd and Santos Ltd and in accordance with the definitions and guidelines in the Society of Petroleum Engineers (SPE) 2007 Petroleum Resources Management System (PRMS) Petroleum Reserves and Contingent Resources are prepared using deterministic and probabilistic methods The method of aggregation for all reserves and contingent resources tables is by arithmetic summation by category Aggregated 1P and 1C estimates may be conservative and aggregated 3P and 3C estimates may be optimistic due to the effects of arithmetic summation Totals may not exactly reflect arithmetic addition due to rounding
The information contained in this report regarding the Cooper Energy reserves and contingent resources is based on and fairly represents information and supporting documentation reviewed by Mr Andrew Thomas who is a full-time employee of Cooper Energy Limited holding the position of General Manager Exploration amp Subsurface holds a Bachelor of Science (Hons) is a member of the American Association of Petroleum Geologists and the Society of Petroleum Engineers is qualified in accordance with ASX listing rule 541 and has consented to the inclusion of this information in the form and context in which it appears
The Cooper Basin totals comprise the probabilistically aggregated PEL 92 project fields and the arithmetic summation of the Worrior project reserves Total includes 005 MMbbl oil reserves used for field fuel The Indonesia totals include removal of non-shareable oil (NSO) and comprise the probabilistically aggregated Tangai-Sukananti KSO project fields Totals are derived by arithmetic summation In the Otway Basin reserves for the Casino Henry and Netherby fields have been assessed by Cooper Energy The Reserves have been assessed using deterministic and probabilistic methodologies for the Waarre Formation at the Casino Henry and Netherby fields This methodology incorporates a range of uncertainty relating to each of the key reservoir input parameters to predict the likely range of outcomes Cooper Energy undertook the following analytical procedures to estimate the Reserves independent interpretation of 3D seismic data analysis of historical production data to assess accessed gas volumes and future production forecasts review of the Operatorrsquos reservoir and production simulation models to define raw gas recovery consistent with existing processing facilities and independent probabilistic Monte Carlo statistical calculations to establish the range of recoverable gas The Otway gas reserves for Casino Henry and Netherby fields are net of fuel gas The date of the Casino Henry and Netherby Reserve Assessment is 27 February 2017
Sole gas field The contingent resource for the Sole field has been re-estimated assuming a two well subsea development plan Advantages of a two well plan compared to the previous single well development includeincreased 2C estimate attributable to accessing previously undeveloped gas and reduced technical risk and enhanced field redundancy providing increased security of supply to the gas processing and gas sales agreements Contingent resources for the Sole field were released to the ASX on 26 November 2015 Post-acquisition of the remaining 50 equity in the Sole gas field the following methodologies were used by Cooper Energy to re-calculate the Sole contingent resource estimate probabilistic simulation modelling for the Kingfish Formation incorporation of a range of uncertainty relating to each of the key reservoir input parameters to predict the likely range of outcomes and review of the reservoir and simulation modelling assuming a two well subsea development The date of the Sole contingent resource assessment is 27 February 2017
Manta gas and oil field Contingent and Prospective Resources have been assessed using deterministic simulation modelling and probabilistic resource estimation for the Intra-Latrobe and Golden Beach Sub-Group in the Manta field This methodology incorporates a range of uncertainty relating to each of the key reservoir input parameters to predict the likely range of outcomes The conversion factor of 1PJ = 0172MMboe has been used to convert from Sales Gas (PJ) to Oil Equivalent (MMboe) Contingent Resources for the Manta Field have been aggregated by arithmetic summation The date of the Manta Contingent Resource assessment is 16 July 2015 and the assessment was announced to the ASX on 16 July 2015 Cooper Energy is not aware of any new information or data that materially affects the information provided in that release and all material assumptions and technical parameters underpinning the assessment provided in the announcement continues to apply
Basker gas and oil field Contingent and Resources have been assessed using deterministic simulation modelling and probabilistic resource estimation for the Intra-Latrobe Sub-Group in the Basker field This methodology incorporates a range of uncertainty relating to each of the key reservoir input parameters to predict the likely range of outcomes The conversion factor of 1PJ = 0172MMboe has been used to convert from Sales Gas (PJ) to Oil Equivalent (MMboe) Contingent Resources for the Basker Field have been aggregated by arithmetic summation The date of the Basker Contingent Resource assessment is 15 August 2014 and the assessment was announced to the ASX on 18 August 2014 Cooper Energy is not aware of any new information or data that materially affects the information provided in that release and all material assumptions and technical parameters underpinning the assessment provided in the announcement continues to apply
32
$ A$ Australian dollars unless specified otherwise
Bbl barrels of oil
boe barrel of oil equivalent
bopd barrel of oil per day
EBITDA earnings before interest tax depreciation and amortisation
FEED Front end engineering and design
kbbls thousand barrels
LTIFR Lost Time Injury Frequency Rate Lost Time Incidents per million man hours worked
MMbbl million barrels of oil
MMboe million barrels of oil equivalent
NOPSEMA National Offshore Petroleum Safety amp Environmental Management Authority
NOPTA National Offshore Petroleum Titles Administrator
NPAT net profit after tax
PEL 92 Joint Venture conducting operations in Western Flank Cooper Basin Petroleum Retention Licences 85 ndash 104 previously encompassed by
the PEL 92 exploration licence
TRCFR Total Recordable Case Frequency Rate Recordable cases per million hours worked
TSR total shareholder return
1P reserves Proved reserves
2P reserves Proved and Probable reserves
3P Proved Probable and Possible reserves
1C 2C 3C high medium and low estimates of contingent resources
- 1WRM Investor presentation March 2017
-
- Slide Number 1
- Disclaimer
- Slide Number 3
- Slide Number 4
- Slide Number 5
- Slide Number 6
- Slide Number 7
- Slide Number 8
- Slide Number 9
- Slide Number 10
- Slide Number 11
- Gold and Silver development asset with a definitive feasibility study (DFS) commenced
- Slide Number 13
- Slide Number 14
- Slide Number 15
- Slide Number 16
- Slide Number 17
- Slide Number 18
- Slide Number 19
- Slide Number 20
- Slide Number 21
- Slide Number 22
- Slide Number 23
- Slide Number 24
- Slide Number 25
- Slide Number 26
- Slide Number 27
- Slide Number 28
- Slide Number 29
- Mount Carrington Resource Statement
- Slide Number 31
- Slide Number 32
- Slide Number 33
- Slide Number 34
- Slide Number 35
- Slide Number 36
- Slide Number 37
-
- 2Aurelia Metals Presentation-Mar 2017-widescreen format
-
- Slide Number 1
- Slide Number 2
- Slide Number 3
- Slide Number 4
- Slide Number 5
- Slide Number 6
- Slide Number 7
- Slide Number 8
- Slide Number 9
- Slide Number 10
- Slide Number 11
- Slide Number 12
- Slide Number 13
- Slide Number 14
- Slide Number 15
- Slide Number 16
- Slide Number 17
- Slide Number 18
- Slide Number 19
- Slide Number 20
- Slide Number 21
-
- 320170321 Presentations Melbourne Mining Club Speaker
-
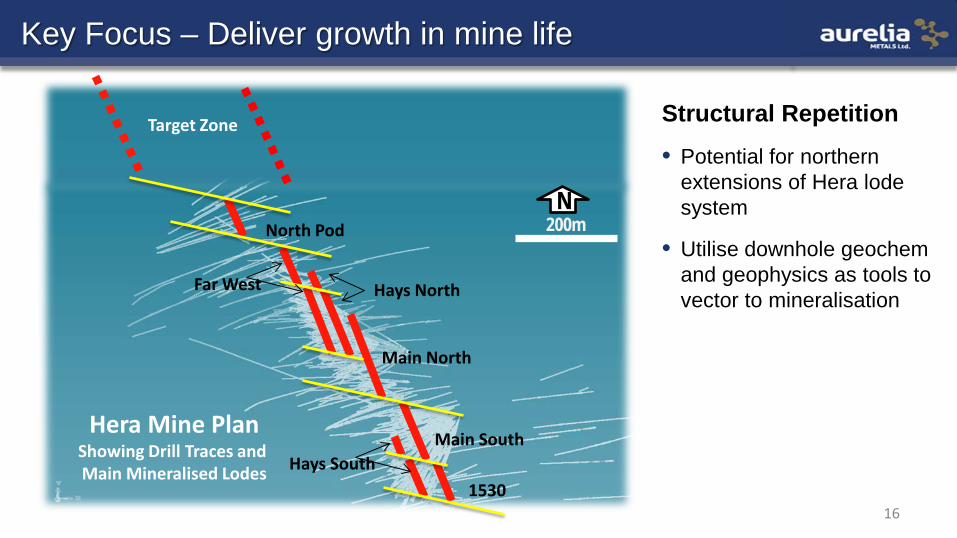
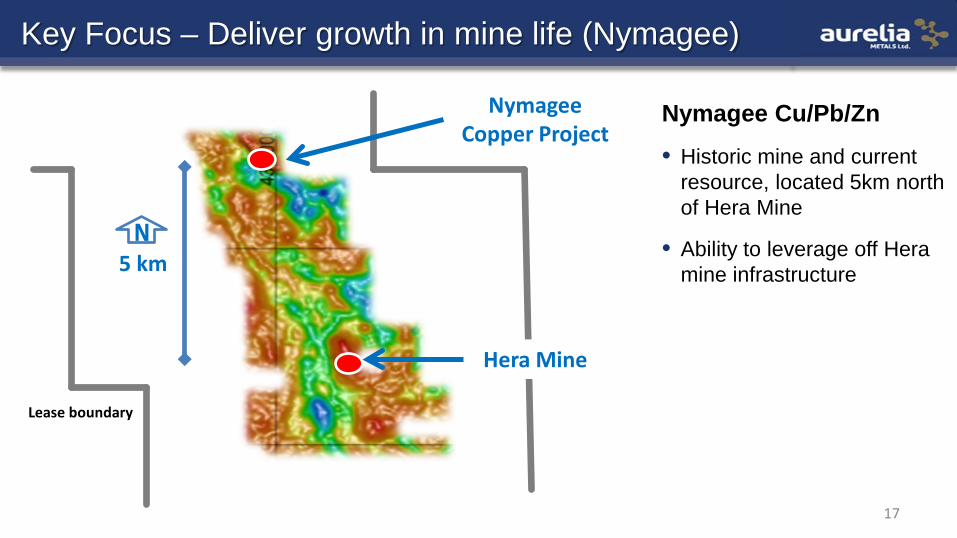
17
Key Focus ndash Deliver growth in mine life (Nymagee)
Nymagee Copper Project
Hera Mine
Nymagee CuPbZn
bull Historic mine and current resource located 5km north of Hera Mine
bull Ability to leverage off Hera mine infrastructure
N 5 km
Lease boundary
18
Key Focus ndash Deliver growth in mine life (Nymagee)
Nymagee CuPbZn
bull Current large (8Mt) relative low grade resource down to 500 m below surface
bull Cu grade 12 bull Pb+Zn grade 1
bull Scoping Study underway to understand potential to selectively mine higher grade copper and leadzinc zones
bull Multiple exploration targets exist
Nymagee Long Section
300 m below surface
500 m below surface
700 m below surface
Current Resource Shell
Detail on the Nymagee Resource can be found in the Companyrsquos 2016 Annual Report
Key Focus ndash Deliver growth in mine life (Mine Trend)
Mine Corridor
bull Hera-Nymagee corridor remains highly prospective
bull The Hera amp Nymagee deposits are both marked by prominent gravity highs
bull Several gravity targets have been defined along 20km of strike
bull Potential for Hera-Nymagee corridor to evolve into Cobar field equivalent
20
Key Focus ndash Deliver Shareholder Returns
Conclusion
21
Strategy to Deliver Generate cash Continuously improve operational performance
- Continuous improvement in recovery and throughput - Minimise unit costs - Optimise mine plan (north pod high grade)
Reduce net debt Reduce gearing reduce financial risk
- build optionality leading up to first scheduled debt repayments (Mar-18)
Deliver growth Expansion of base metals capacity North Pod exploration amp strike extensions Scoping Study on copper development opportunity at Nymagee
2
The information in this presentation
bull Is not an offer or recommendation to purchase or subscribe for shares in Cooper Energy Limited or to retain or sell any shares that are
currently held
bull Does not take into account the individual investment objectives or the financial situation of investors
bull Was prepared with due care and attention and is current at the date of the presentation
Actual results may materially vary from any forecasts (where applicable) in this presentation
Before making or varying any investment in shares of Cooper Energy Limited all investors should consider the appropriateness of that
investment in light of their individual investment objectives and financial situation and should seek their own independent professional advice
Qualified petroleum reserves and resources evaluator
This report contains information on petroleum reserves and resources which is based on and fairly represents information and supporting
documentation reviewed by Mr Andrew Thomas who is a full time employee of Cooper Energy Limited holding the position of Exploration
Manager holds a Bachelor of Science (Hons) is a member of the American Association of Petroleum Geologists and the Society of Petroleum
Engineers and is qualified in accordance with ASX listing rule 541 and has consented to the inclusion of this information in the form and context
in which it appears
Rounding
All numbers in this presentation have been rounded As a result some total figures may differ insignificantly from totals obtained from arithmetic
addition of the rounded numbers presented
Reserves and resources calculation
Information on the companyrsquos reserves and resources and their calculation are provided in the appendices to this presentation
Currency
All financial information is expressed in Australian dollars unless otherwise specified
3
Cooper Energy develops and supplies gas to south-east Australia and produces oil from the
western flank of the Cooper Basin
The companyrsquos portfolio features existing gas production 227 PJ of uncontracted gas
and two new gas projects to supply south-east Australia from 2019 onwards backed by long term
contracts with blue chip utility and industrial customers
Existing assets and plans have the company on a 6 year growth trajectory with capacity for
production growth over 20 times FY16 levels
4
Cooper Basin oil
PEL 495
bull Oil production from western flank of Cooper Basin
bull Single gas exploration permit in Otway Basin
bull Poland
bull Romania
bull Indonesia
bull Tunisia
2011 portfolio
5
Otway Basin
bull Builds acreage and technical capability
through merger with Somerton Energy
bull Sub-surface studies reinforce view of
prospectivity
Market
bull Demand and supply-side gas market analysis
bull Commenced engagement with gas buyers
Gippsland Basin
bull Invested in Bass Strait Oil Company which
holds Gippsland permits
bull Technical studies of prospectivity and gas
plays
6
Otway Basin
bull Drilling identifies gas bearing
reservoirs in deep sands Gippsland Basin
bull Acquires 65 interest in Basker Manta Gummy
permits
bull Commenced Manta business case analysis for
supply to south-east Australia
7
Otway Basin
bull Builds understanding of Otway
sub-surface
bull Confirms attraction of offshore
Otway
Gippsland Basin
bull Acquires 50 of Sole gas field
bull Acquires 50 of Orbost Gas Plant
bull Manta business case affirms economic
development opportunity
8
Gippsland Basinbull Sole gas field interest 100
bull Sole gas project FEED completed
bull Orbost Gas Plant 100
bull Manta gas field 100
Otway Basin
bull Acquires Casino Henry Vic P44
Minerva and Minerva Gas Plant
Market
bull O-I Australia gas contract
bull AGL gas contract
bull EnergyAustralia gas
contract
bull Alinta Energy gas
contract
9
Gas contracts
bull 188 PJ contracted from 2017 on
bull EnergyAustralia (Otway amp Sole)
bull AGL Energy (Sole)
bull Alinta Energy (Sole)
bull O-I Australia (Sole)
New gas projects
bull Phase 1 Sole from 2019
ndash Sanction Marchrsquo 17 for March lsquo19 first gas into plant
bull Phase 2 Manta
ndash appraisal well and resource upside
ndash from FY22
bull VIC P44 exploration prospects
Production
bull ~ 7 PJ pa from Casino Henry amp
Minerva1
bull Sold to EnergyAustralia
bull Uncontracted gas to market for
supply from March 18
bull Field life to 2026 (Casino Henry)Plant amp infrastructure
bull Orbost Gas Plant connected to
EGP (subject to APA HoA)
bull Minerva1 Gas Plant (10)
connected to SEA Gas pipeline
bull Patricia Baleen connected to
Orbost and Longtom
1Acquisition of 10 interest in Minerva and Minerva gas plant to be completed
Uncontracted gas
Total of 227 PJ uncontracted in
bull Otway
ndash 52 PJ 2P Casino Henry reserves from March 2018
bull Gippsland
ndash Sole 69 PJ 2C contingent resource uncontracted
ndash Manta 106 PJ 2C contingent resource plus
exploration potential
10
03
Jun-16 Jan-17
FY17 production1
MMboe expected
Gas
Oil
1
49 76
367
668
Jun-16 Jan-17
Contingent resources (2C)12
MMboe
Gas
Oil13
11
104
Jun-16 Jan-17
2P reserves12
MMboe
bull Addition of Otway gas production Jan to Jun 17
bull Gas accounts for 75 of anticipated FY17 production
bull Addition of 60 PJ of Otway Basin gas reserves
bull Gas accounts for 90 of 116 MMboe 2P reserves
bull Australian contingent resources 2C up 79
bull 128 PJ gas contingent resources (2C) added in Gippsland
116
416
744
1Australia only 2 Reserves and Contingent Resources at 1 January 2017 were announced to the ASX on 27 February 2017 and should be read in conjunction with the information provided on the calculation
of Reserves and Contingent Resources provided on page 29 Cooper Energy is not aware of any new information or data that materially affects the information provided in those releases and
all material assumptions and technical parameters underpinning the assessment provided in the announcement continues to apply
11
Forecast 1 south-east Australian gas demand and production
PJ pa
South-east Australia comprises NSW VIC SA and Tasmania
SE Australia demandsup1
1 EnergyQuest Energy Quarterly March 2017
0
10
20
30
40
50
60
70
80
90
100
2017 2018 2019 2020 2021 2022 2023 2024
Cooper Energy gas production profilePJ pa
Manta(100)
Sole (100)
Casino
bull Casino Henry gas contracted to February 2018
bull Casino Henry gas available to contract from March 2018
bull COE may sell down some of Sole Gas Project and Manta post
Sole FID
0
100
200
300
400
500
600
2016 2018 2020 2022 2024 2026 2028 2030 2032 2034 2036
Most certain supply tranche Less certain supply tranche
Least certain supply tranche Southern demand
12Source AEMO
13
1 Assumes
bull Sole sanction by March quarter 2017 for March quarter 2019 first Sole gas
to plant
bull Manta 3 appraisal well
bull Development well required for Casino Henry ~2020
bull Details on slide 26
3 5 1
1520 20 20 20 20 20 20
16102
13
17 11
37 36 36
28
1913
15
10
FY17 FY18 FY19 FY20 FY21 FY22 FY23 FY24 FY25 FY26 FY27 FY28 FY29
Gas production1 from current assets contracted amp uncontractedPJ pa
Uncontracted
Contracted
227 PJ comprises 52 PJ 2P Casino Henry gas and 175 PJ 2C Contingent uncontracted gas from Sole and Manta Profile illustrated includes additional 10 PJ anticipated from Manta Cooper Energy announced Sole Contingent Resources on 27 February 2017 and Manta Contingent Resource 16 July 2015 Cooper Energy is not aware of any new information or data that materially affects the information provided in those releases and all material assumptions and technical parameters underpinning the assessment provided in the announcement continues to apply See notes on page 29 for information on reserves and resources calculation
14
Resource economics
Health amp safety
Environment
CommunityFiscaldividend
SuccessfulSustainable
Value-generating resource
development
Balance not achieved people hurt project collapse uneconomic no community
benefit no fiscal dividend excessive energy
costs
Balance achieved safe environmentally
sound development
cost effective sustainable energy
community benefits
fiscal dividend
15
Casino Henry
bull Sustained growth profile over 6 years
bull Gas accounts for overwhelming majority of production
bull New assets and production profile generates
ndash FY17 production gt2x FY16 production
ndash FY19 production gt5x FY16 production
ndash FY22 production gt20x FY16 production
0
2
4
6
8
10
12
FY15 FY16 FY17 FY18 FY19 FY20 FY21 FY22 FY23 FY24
Production1
MMboe
Sole Gas Project
Manta Gas Project
Casino-Henry
Cooper Basin oil
Assumes1
bull Current equities COE may divest some Gippsland post Sole sanction
bull Sole sanction by March quarter 2017 for March quarter 2019 Sole gas to plant
bull Manta 3 appraisal well
bull Development well required for Casino Henry ~2020
bull No new exploration success
16
Sole FID
bull Financial commitment to project
bull Triggers 43 MMboe uplift in gas reserves
bull Translation of HoA with APA to formal agreement
bull Expected shortly after project sanction
Uncontracted Otway gas
bull Contracting gas to supply from March 2018
bull Expect to secure new agreements in winter 2017 with market reflective price
Operator status
bull Working to appointment as Operator in Gippsland and Otway
bull Enables cost efficiencies and competitive advantage as asset owner and JV participant
Beyond June 2017
bull Cooper Basin assets
bull Divest slice of Gippsland Basin portfolio
bull Manta exploration
13116
~53
Jun-16 Jan-17 June -17Proforma
Uplift in 2P reservesMMboe
Australia only Assumes commitment of Sole gas project provides uplift of
~43 MMboe
1
2
3
4
17
1 Execution of our gas strategy has deliveredCooper Energy has become a supplier and developer of gas for south east Australia at a time of great market need
2 FY17 growth is the first step of larger and sustainable growthReserves and production upgrades in the current year are the initial instalment of a 6 year growth trajectory offering gt 20 times growth in
production from existing assets and equities
3 Integration proceeding management capabilities have been reinforced consistent with growthUpgraded people resources with the addition of proven performance orientated executives integration is proceeding to schedule
4 Sole project stronger and proceeding to final phase financingProject now offering lower risk lower capital cost increased gas and increased returns and value upside for Cooper Energy shareholders
5 Milestones aheadSix months to June 17 is expected to see a number of milestones for further uplift and value transformation
Appendices
20
Key figures
Shares on issue1 6601 mill
Shareholders1 5923
Market capitalisation1 $260 mill
Debt Nil
Current employees 23
Cooper Energy is an independent Australian exploration and
production company
bull Listed in 2002 history of profitable operations and successful
exploration and development
bull Strong balance sheet zero debt
bull Raised new equity capital of c$85 million during 2016
bull Management team and board experienced in growing resource
companies
bull Growth profile extending over 6 years from existing assets and
agreements
59
10
2
29
Share register
Institutional
Corporate
Employees amp Directors
Private
1 As at 20 March 2017
21
Oil exploration amp production
Cooper Basin Western Flank
240000 ndash 280000 1 bbl pa
Operating cost ltA$30bbl
High margin + exploration upside
Gas production amp sales Gas projects amp contracting
Otway Basin Casino Henry amp Minerva
Sales of ~7- 8 PJ pa to EnergyAustralia
Minerva1 gas plant
Production of 15 MMboe pa
Gippsland and Otway Basins
Sole Manta projects Otway uncontracted gas
gt400 PJ gas to be developed or uncontracted
Production uplift of up to 95 MMboe2 pa as
projects come online on top of existing output
1 Subject to completion of transaction2 Based on current equity participation levels
22
Phase 1 Sole
bull 2C Resource1 249 PJ
bull Sanction March 2017
bull Sole gas into plant March 2019
bull Output ~25 PJ pa
bull COE equity 100
Phase 2 Manta
bull 2C Resource1 106 PJ gas3 2 MMbbl liquids
bull Appraisal 2018-19
bull Sanction 2021
bull First gas ~2023
bull Output pa 25 PJ gas 039 MMbbl pa
bull Exploration Manta Deep amp Chimaera
bull COE equity 100
Orbost Gas Plant
bull Existing gas plant
bull Connected to Eastern Gas Pipeline
bull Plant owned amp operated by APA Group (proposed in HoA announced 27217
Longtom(Seven Group 100)
Patricia Baleen (COE 100)
Enabling customersUpstream and Midstream HoA
1 Cooper Energy announced Sole Contingent Resources on 27 February 2017 and Manta Contingent Resource 16 July 2015 Cooper Energy is not aware of any new information or data that materially affects the information provided in those releases and all material
assumptions and technical parameters underpinning the assessment provided in the announcement continues to apply See notes on page 29 for information on reserves and resources calculation
33 km
58 km
65 km
23
Sole Gas Project (VIC L32 COE100 Operator )
bull 249 PJ 2C Contingent Resource1
bull 20 PJ pa contracted gas contracts with O-I Australia AGL Energy Alinta Energy
EnergyAustralia
bull Sanction expected by March 2017 for Sole gas into plant by March 2019
Manta (VIC RL131415 COE 100)
bull 106 PJ 2C Contingent Resource plus 3 million barrels liquids1
bull economic business case identified subject to appraisal
bull prospective resource upside to be tested amp appraisal well expected 2018
Patricia-Baleen (VICL21 COE 100)
bull Non-operating field shut in
bull Strategic significance as access point for Orbost Gas Plant for other fields
1 Reserves and Contingent Resources at 1 January 2017 were announced to the ASX on 27 February 2017 and an announcement on Manta Contingent Resource was announced on 16 July 2015 The resources information displayed should be read in conjunction with the information provided on the calculation of Reserves and Contingent Resources provided on page 29 Cooper Energy is not aware of any new information or data that materially affects the information provided in those releases and all material assumptions and technical parameters underpinning the assessment provided in the announcement continues to apply
24
Key Assets
bull Casino Henry gas project (50)
bull Minerva gas field and plant (10 interest)1
bull VICP44 exploration permit
Production (COE share effective from 1 January 2017)
bull Casino Henry (VICRL11 amp 12) 7 PJ pa supplied to EnergyAustralia
under contract expiring March 2018
bull Minerva (VICL22)~ 1 PJ pa (expected to deplete by mid 2017)
Plans
bull Preparation for operatorship transfer likely June 2017
bull Marketing of uncontracted gas available for sale from March 2018
bull Casino Henry development well
1Acquisition of 10 interest in Minerva agreed with Santos Ltd is subject to completion
25
bull First half production of 013 MMbbl vs 017 in H1 FY16
bull Production impacted by suspension of drilling in low oil price FY16
bull Operating costs reduced from A$2992bbl to A$2928bbl
bull Drilling resumed in FY17 with 4 wells drilled 2 successful 2 P amp A
bull No further drilling planned for FY17
bull Producing interests
ndash PEL 92 25 interest (Beach Energy 75 amp Operator)
ndash PEL 93 30 interest (Senex Energy 70 amp Operator)
11 10
16 15
7 4
3530
FY16 H1 FY17
Production costs amp netback Direct cost A$ per barrel
NetbackRoyaltyTransportOperatingCosts per
bbl down 2
26
bull Take or pay gas
processing agreement
1 Cooper Energy to sell Orbost Gas Plant to APA Group
Heads of Agreement (non-binding) provides for APA to take ownership subject to Sole FID
2 APA to be responsible for funding and performance of ~$250 million plant upgrade and processing of gas from Sole amp Manta
Plant to be developed according to existing Sole Development Plan Sole gas to be processed under take or pay tariff agreement
3 Cooper Energy to retain 100 of upstream retains ownership of gas processed through Orbost Gas Plant
Estimated project cost for Cooper Energy reduced to ~$355 million and opportunity to realise further value accretion in sell-down post FID
Orbost Gas Plant APA Group 100
APA
bull funds and completes plant upgrade
for Sole
bull operates plant for agreed tariff amp
provides processed sales gas to
EGP
Sole gas
field
COE 100
COE
bull manages upstream
development
bull supplies gas to Orbost
for processing
bull markets the gas
Upstream Midstream
Downstream COE retains ownership of gas
through to point of sale to customers
in EGP
Transaction elements
1refer joint APA Group Cooper Energy announcement 27 February 2017
27
28
3 5
2 7 7 6 7 7 6 5 4
1
1520 20 20 20
2020
20
16
10
6
10 5 5 5 55
55 9
9
25 25 25
18
10
75
1
FY17 FY18 FY19 FY20 FY21 FY22 FY23 FY24 FY25 FY26 FY27 FY28 FY29
Gas production profile by projectcontracted amp uncontracted PJ pa
Manta uncontracted
Sole uncontracted
Sole contracted
Otway uncontracted
Otway contracted
Otway 2P reserves
Casino Henry
Gippsland Gas Project Phase 1
Sole
Gippsland Gas Project Phase 2
Manta
Assumes
bull Sole sanction by March quarter 2017 for March quarter 2019 first Sole gas to plant
bull All contract options in respect of Sole field are exercised
bull Manta subject to Manta 3 appraisal well Manta profile illustrates all Manta gas as uncontracted (including 4 PJ pa option held by
AGL) Manta profile includes 106 PJ 2C resource and additional 10 PJ anticipated
bull Development well required for Casino Henry ~2020
bull No exploration success
29
Reserves
Proved
(1P)
Proved amp Probable
(2P)
Proved Probable amp Possible
(3P)
Cooper1 Otway2 Total Cooper1 Otway2 Total Cooper1 Otway2 Total
Developed
Sales Gas PJ 00 48 48 00 152 152 00 293 293
Oil + Condensate MMbbl 05 00 05 09 00 09 16 00 16
Total developed MMboe2 05 08 13 09 26 35 16 51 67
Undeveloped
Sales Gas PJ 00 344 344 00 451 451 00 627 627
Oil + Condensate PJ 01 00 02 03 11 03 05 01 05
Total undeveloped MMboe2 01 60 61 03 78 81 05 109 113
Total1 MMboe2 07 68 74 11 104 116 21 159 180
Contingent
Resources
1C 2C 3C
Gas Oil Total1 Gas Oil Total Gas Oil Total
PJ MMbbl MMboe2 PJ MMbbl MMboe2 PJ MMbbl MMboe2
Gippsland 2917 40 541 3885 76 744 5336 121 1039
Cooper 02 00 003 03 00 01 06 00 01
Total 1 2919 40 542 3888 76 744 5342 121 1040
Additional information on reserve and resource calculation is provided in the appendices to this document
1 Totals may not reflect arithmetic addition due to rounding The method of aggregation is by arithmetic sum by category As a result the 1P estimate may be conservative and the 3P estimate may be optimistic due to the effects
of arithmetic summation The conversion factor of 1 PJ = 0172 MMboe has been used to convert from Sales Gas (PJ) to Oil Equivalent (MMboe) 2 The reserves revisions include Cooper Energyrsquos share of future crude fuel
usage in the Cooper Basin The estimated fuel usage for PEL 92 is 1P 002 MMbbl 2P 003 MMbbl and 3P 006 MMbbl The estimated fuel usage for the Worrior Field (PPL 207) is 1P 001 MMbbl 2P 002 MMbbl and 3P 003
MMbbl 3 The Otway gas reserves for Casino Henry and Netherby fields are net of fuel gas
1 Totals may not reflect arithmetic addition due to rounding The method of aggregation is by arithmetic sum by category As a result the 1C estimate may be conservative and the 3C estimate may be optimistic due to the
effects of arithmetic summation 2 The conversion factor of 1 PJ = 0172 MMboe has been used to convert from Sales Gas (PJ) to Oil Equivalent (MMboe)
30
General Manager Operations
Iain MacDougallIain MacDougall has more than 25
yearsrsquo experience in the upstream
petroleum exploration and production
sector including senior management
roles within independent operators
and international experience with
Schlumberger In Australia previous
employment includes Stuart
Petroleum as Production and
Engineering Manager and then as
acting CEO prior to the takeover of
Stuart Petroleum by Senex Energy
Managing Director
David MaxwellDavid Maxwell has over 30 yearsrsquo
experience as a senior executive with
companies such as BG Group Woodside
and Santos As Senior Vice President at
QGC a BG Group business he led BGrsquos
entry into Australia its alliance with and
subsequent takeover of QGC Roles at
Woodside included director of gas and
marketing and membership of Woodsidersquos
executive committee
General Manager Exploration
amp Subsurface
Andrew ThomasAndrew Thomas is a successful
geoscientist with over 28 yearsrsquo
experience in oil and gas exploration
and development in companies
including Geoscience Australia
Santos Gulf Canada and Newfield
Exploration At Newfield he was SE
Asia New Ventures Manager and
Exploration Manager for offshore
Sarawak
Executive Director
Hector GordonHector Gordon is a highly
experienced geologist with over 35
yearsrsquo experience in the petroleum
industry Previous roles include
Managing Director Somerton
Energy and a number of senior
management and technical roles at
Beach Energy including Exploration
Manager Chief Operating Officer
and ultimately Chief Executive
Officer
Alison Evans is an experienced
company secretary and corporate legal
counsel with extensive knowledge of
corporate and commercial law in the
resources and energy sectors
Alison has held Company Secretary
and Legal Counsel roles at a number of
minerals and energy companies
including Centrex Metals GTL Energy
and AGL Ms Evans public company
experience is supported by her work at
leading corporate law firms
Company Secretary and
General Counsel
Alison Evans
General Manager Development
Duncan CleggDuncan Clegg has over 35 yearsrsquo
experience in upstream and midstream oil
and gas development including
management positions at Shell and
Woodside leading oil and gas
developments including FPSO subsea
and fixed platforms developments At
Woodside Duncan held several senior
executive positions including Director of
the Australian Business Unit Director of
the African Business Unit and CEO of the
North West Shelf Venture
Eddy Glavas has more than 18 years
experience in business development
finance commercial portfolio
management and strategy including 14
years in the oil and gas sector Prior to
joining Cooper Energy he was
employed by Santos as Manager
Corporate Development with
responsibility for managing multi-
disciplinary teams tasked with mergers
acquisitions partnerships and
divestitures
General Manager Commercial amp
Business Development
Eddy Glavas
Virginia Suttell is a chartered accountant
with more than 20 years experience
including 16 years in publicly listed entities
principally in group finance and secretarial
roles in the resources and media sectors
This has included the role of Chief Financial
Officer and Company Secretary for Monax
Mining Limited and Marmota Energy Limited
from 2007 to 2016 and 2007 to 2015
respectively Other previous appointments
include Group Financial Controller at
Austereo Group Limited
Chief Financial Officer
(Acting)
Virginia Suttell
31
The approach for all reserve and resource calculations is consistent with the definitions and guidelines in the Society of Petroleum Engineers (SPE) 2007 Petroleum Resources Management System (PRMS) The resource estimate methodologies incorporate a range of uncertainty relating to each of the key reservoir input parameters to predict the likely range of outcomes Cooper Energy has completed its own estimation of reserves and contingent resources based on information provided by the permit Operators Beach Energy Ltd Senex Ltd and Santos Ltd and in accordance with the definitions and guidelines in the Society of Petroleum Engineers (SPE) 2007 Petroleum Resources Management System (PRMS) Petroleum Reserves and Contingent Resources are prepared using deterministic and probabilistic methods The method of aggregation for all reserves and contingent resources tables is by arithmetic summation by category Aggregated 1P and 1C estimates may be conservative and aggregated 3P and 3C estimates may be optimistic due to the effects of arithmetic summation Totals may not exactly reflect arithmetic addition due to rounding
The information contained in this report regarding the Cooper Energy reserves and contingent resources is based on and fairly represents information and supporting documentation reviewed by Mr Andrew Thomas who is a full-time employee of Cooper Energy Limited holding the position of General Manager Exploration amp Subsurface holds a Bachelor of Science (Hons) is a member of the American Association of Petroleum Geologists and the Society of Petroleum Engineers is qualified in accordance with ASX listing rule 541 and has consented to the inclusion of this information in the form and context in which it appears
The Cooper Basin totals comprise the probabilistically aggregated PEL 92 project fields and the arithmetic summation of the Worrior project reserves Total includes 005 MMbbl oil reserves used for field fuel The Indonesia totals include removal of non-shareable oil (NSO) and comprise the probabilistically aggregated Tangai-Sukananti KSO project fields Totals are derived by arithmetic summation In the Otway Basin reserves for the Casino Henry and Netherby fields have been assessed by Cooper Energy The Reserves have been assessed using deterministic and probabilistic methodologies for the Waarre Formation at the Casino Henry and Netherby fields This methodology incorporates a range of uncertainty relating to each of the key reservoir input parameters to predict the likely range of outcomes Cooper Energy undertook the following analytical procedures to estimate the Reserves independent interpretation of 3D seismic data analysis of historical production data to assess accessed gas volumes and future production forecasts review of the Operatorrsquos reservoir and production simulation models to define raw gas recovery consistent with existing processing facilities and independent probabilistic Monte Carlo statistical calculations to establish the range of recoverable gas The Otway gas reserves for Casino Henry and Netherby fields are net of fuel gas The date of the Casino Henry and Netherby Reserve Assessment is 27 February 2017
Sole gas field The contingent resource for the Sole field has been re-estimated assuming a two well subsea development plan Advantages of a two well plan compared to the previous single well development includeincreased 2C estimate attributable to accessing previously undeveloped gas and reduced technical risk and enhanced field redundancy providing increased security of supply to the gas processing and gas sales agreements Contingent resources for the Sole field were released to the ASX on 26 November 2015 Post-acquisition of the remaining 50 equity in the Sole gas field the following methodologies were used by Cooper Energy to re-calculate the Sole contingent resource estimate probabilistic simulation modelling for the Kingfish Formation incorporation of a range of uncertainty relating to each of the key reservoir input parameters to predict the likely range of outcomes and review of the reservoir and simulation modelling assuming a two well subsea development The date of the Sole contingent resource assessment is 27 February 2017
Manta gas and oil field Contingent and Prospective Resources have been assessed using deterministic simulation modelling and probabilistic resource estimation for the Intra-Latrobe and Golden Beach Sub-Group in the Manta field This methodology incorporates a range of uncertainty relating to each of the key reservoir input parameters to predict the likely range of outcomes The conversion factor of 1PJ = 0172MMboe has been used to convert from Sales Gas (PJ) to Oil Equivalent (MMboe) Contingent Resources for the Manta Field have been aggregated by arithmetic summation The date of the Manta Contingent Resource assessment is 16 July 2015 and the assessment was announced to the ASX on 16 July 2015 Cooper Energy is not aware of any new information or data that materially affects the information provided in that release and all material assumptions and technical parameters underpinning the assessment provided in the announcement continues to apply
Basker gas and oil field Contingent and Resources have been assessed using deterministic simulation modelling and probabilistic resource estimation for the Intra-Latrobe Sub-Group in the Basker field This methodology incorporates a range of uncertainty relating to each of the key reservoir input parameters to predict the likely range of outcomes The conversion factor of 1PJ = 0172MMboe has been used to convert from Sales Gas (PJ) to Oil Equivalent (MMboe) Contingent Resources for the Basker Field have been aggregated by arithmetic summation The date of the Basker Contingent Resource assessment is 15 August 2014 and the assessment was announced to the ASX on 18 August 2014 Cooper Energy is not aware of any new information or data that materially affects the information provided in that release and all material assumptions and technical parameters underpinning the assessment provided in the announcement continues to apply
32
$ A$ Australian dollars unless specified otherwise
Bbl barrels of oil
boe barrel of oil equivalent
bopd barrel of oil per day
EBITDA earnings before interest tax depreciation and amortisation
FEED Front end engineering and design
kbbls thousand barrels
LTIFR Lost Time Injury Frequency Rate Lost Time Incidents per million man hours worked
MMbbl million barrels of oil
MMboe million barrels of oil equivalent
NOPSEMA National Offshore Petroleum Safety amp Environmental Management Authority
NOPTA National Offshore Petroleum Titles Administrator
NPAT net profit after tax
PEL 92 Joint Venture conducting operations in Western Flank Cooper Basin Petroleum Retention Licences 85 ndash 104 previously encompassed by
the PEL 92 exploration licence
TRCFR Total Recordable Case Frequency Rate Recordable cases per million hours worked
TSR total shareholder return
1P reserves Proved reserves
2P reserves Proved and Probable reserves
3P Proved Probable and Possible reserves
1C 2C 3C high medium and low estimates of contingent resources
- 1WRM Investor presentation March 2017
-
- Slide Number 1
- Disclaimer
- Slide Number 3
- Slide Number 4
- Slide Number 5
- Slide Number 6
- Slide Number 7
- Slide Number 8
- Slide Number 9
- Slide Number 10
- Slide Number 11
- Gold and Silver development asset with a definitive feasibility study (DFS) commenced
- Slide Number 13
- Slide Number 14
- Slide Number 15
- Slide Number 16
- Slide Number 17
- Slide Number 18
- Slide Number 19
- Slide Number 20
- Slide Number 21
- Slide Number 22
- Slide Number 23
- Slide Number 24
- Slide Number 25
- Slide Number 26
- Slide Number 27
- Slide Number 28
- Slide Number 29
- Mount Carrington Resource Statement
- Slide Number 31
- Slide Number 32
- Slide Number 33
- Slide Number 34
- Slide Number 35
- Slide Number 36
- Slide Number 37
-
- 2Aurelia Metals Presentation-Mar 2017-widescreen format
-
- Slide Number 1
- Slide Number 2
- Slide Number 3
- Slide Number 4
- Slide Number 5
- Slide Number 6
- Slide Number 7
- Slide Number 8
- Slide Number 9
- Slide Number 10
- Slide Number 11
- Slide Number 12
- Slide Number 13
- Slide Number 14
- Slide Number 15
- Slide Number 16
- Slide Number 17
- Slide Number 18
- Slide Number 19
- Slide Number 20
- Slide Number 21
-
- 320170321 Presentations Melbourne Mining Club Speaker
-

18
Key Focus ndash Deliver growth in mine life (Nymagee)
Nymagee CuPbZn
bull Current large (8Mt) relative low grade resource down to 500 m below surface
bull Cu grade 12 bull Pb+Zn grade 1
bull Scoping Study underway to understand potential to selectively mine higher grade copper and leadzinc zones
bull Multiple exploration targets exist
Nymagee Long Section
300 m below surface
500 m below surface
700 m below surface
Current Resource Shell
Detail on the Nymagee Resource can be found in the Companyrsquos 2016 Annual Report
Key Focus ndash Deliver growth in mine life (Mine Trend)
Mine Corridor
bull Hera-Nymagee corridor remains highly prospective
bull The Hera amp Nymagee deposits are both marked by prominent gravity highs
bull Several gravity targets have been defined along 20km of strike
bull Potential for Hera-Nymagee corridor to evolve into Cobar field equivalent
20
Key Focus ndash Deliver Shareholder Returns
Conclusion
21
Strategy to Deliver Generate cash Continuously improve operational performance
- Continuous improvement in recovery and throughput - Minimise unit costs - Optimise mine plan (north pod high grade)
Reduce net debt Reduce gearing reduce financial risk
- build optionality leading up to first scheduled debt repayments (Mar-18)
Deliver growth Expansion of base metals capacity North Pod exploration amp strike extensions Scoping Study on copper development opportunity at Nymagee
2
The information in this presentation
bull Is not an offer or recommendation to purchase or subscribe for shares in Cooper Energy Limited or to retain or sell any shares that are
currently held
bull Does not take into account the individual investment objectives or the financial situation of investors
bull Was prepared with due care and attention and is current at the date of the presentation
Actual results may materially vary from any forecasts (where applicable) in this presentation
Before making or varying any investment in shares of Cooper Energy Limited all investors should consider the appropriateness of that
investment in light of their individual investment objectives and financial situation and should seek their own independent professional advice
Qualified petroleum reserves and resources evaluator
This report contains information on petroleum reserves and resources which is based on and fairly represents information and supporting
documentation reviewed by Mr Andrew Thomas who is a full time employee of Cooper Energy Limited holding the position of Exploration
Manager holds a Bachelor of Science (Hons) is a member of the American Association of Petroleum Geologists and the Society of Petroleum
Engineers and is qualified in accordance with ASX listing rule 541 and has consented to the inclusion of this information in the form and context
in which it appears
Rounding
All numbers in this presentation have been rounded As a result some total figures may differ insignificantly from totals obtained from arithmetic
addition of the rounded numbers presented
Reserves and resources calculation
Information on the companyrsquos reserves and resources and their calculation are provided in the appendices to this presentation
Currency
All financial information is expressed in Australian dollars unless otherwise specified
3
Cooper Energy develops and supplies gas to south-east Australia and produces oil from the
western flank of the Cooper Basin
The companyrsquos portfolio features existing gas production 227 PJ of uncontracted gas
and two new gas projects to supply south-east Australia from 2019 onwards backed by long term
contracts with blue chip utility and industrial customers
Existing assets and plans have the company on a 6 year growth trajectory with capacity for
production growth over 20 times FY16 levels
4
Cooper Basin oil
PEL 495
bull Oil production from western flank of Cooper Basin
bull Single gas exploration permit in Otway Basin
bull Poland
bull Romania
bull Indonesia
bull Tunisia
2011 portfolio
5
Otway Basin
bull Builds acreage and technical capability
through merger with Somerton Energy
bull Sub-surface studies reinforce view of
prospectivity
Market
bull Demand and supply-side gas market analysis
bull Commenced engagement with gas buyers
Gippsland Basin
bull Invested in Bass Strait Oil Company which
holds Gippsland permits
bull Technical studies of prospectivity and gas
plays
6
Otway Basin
bull Drilling identifies gas bearing
reservoirs in deep sands Gippsland Basin
bull Acquires 65 interest in Basker Manta Gummy
permits
bull Commenced Manta business case analysis for
supply to south-east Australia
7
Otway Basin
bull Builds understanding of Otway
sub-surface
bull Confirms attraction of offshore
Otway
Gippsland Basin
bull Acquires 50 of Sole gas field
bull Acquires 50 of Orbost Gas Plant
bull Manta business case affirms economic
development opportunity
8
Gippsland Basinbull Sole gas field interest 100
bull Sole gas project FEED completed
bull Orbost Gas Plant 100
bull Manta gas field 100
Otway Basin
bull Acquires Casino Henry Vic P44
Minerva and Minerva Gas Plant
Market
bull O-I Australia gas contract
bull AGL gas contract
bull EnergyAustralia gas
contract
bull Alinta Energy gas
contract
9
Gas contracts
bull 188 PJ contracted from 2017 on
bull EnergyAustralia (Otway amp Sole)
bull AGL Energy (Sole)
bull Alinta Energy (Sole)
bull O-I Australia (Sole)
New gas projects
bull Phase 1 Sole from 2019
ndash Sanction Marchrsquo 17 for March lsquo19 first gas into plant
bull Phase 2 Manta
ndash appraisal well and resource upside
ndash from FY22
bull VIC P44 exploration prospects
Production
bull ~ 7 PJ pa from Casino Henry amp
Minerva1
bull Sold to EnergyAustralia
bull Uncontracted gas to market for
supply from March 18
bull Field life to 2026 (Casino Henry)Plant amp infrastructure
bull Orbost Gas Plant connected to
EGP (subject to APA HoA)
bull Minerva1 Gas Plant (10)
connected to SEA Gas pipeline
bull Patricia Baleen connected to
Orbost and Longtom
1Acquisition of 10 interest in Minerva and Minerva gas plant to be completed
Uncontracted gas
Total of 227 PJ uncontracted in
bull Otway
ndash 52 PJ 2P Casino Henry reserves from March 2018
bull Gippsland
ndash Sole 69 PJ 2C contingent resource uncontracted
ndash Manta 106 PJ 2C contingent resource plus
exploration potential
10
03
Jun-16 Jan-17
FY17 production1
MMboe expected
Gas
Oil
1
49 76
367
668
Jun-16 Jan-17
Contingent resources (2C)12
MMboe
Gas
Oil13
11
104
Jun-16 Jan-17
2P reserves12
MMboe
bull Addition of Otway gas production Jan to Jun 17
bull Gas accounts for 75 of anticipated FY17 production
bull Addition of 60 PJ of Otway Basin gas reserves
bull Gas accounts for 90 of 116 MMboe 2P reserves
bull Australian contingent resources 2C up 79
bull 128 PJ gas contingent resources (2C) added in Gippsland
116
416
744
1Australia only 2 Reserves and Contingent Resources at 1 January 2017 were announced to the ASX on 27 February 2017 and should be read in conjunction with the information provided on the calculation
of Reserves and Contingent Resources provided on page 29 Cooper Energy is not aware of any new information or data that materially affects the information provided in those releases and
all material assumptions and technical parameters underpinning the assessment provided in the announcement continues to apply
11
Forecast 1 south-east Australian gas demand and production
PJ pa
South-east Australia comprises NSW VIC SA and Tasmania
SE Australia demandsup1
1 EnergyQuest Energy Quarterly March 2017
0
10
20
30
40
50
60
70
80
90
100
2017 2018 2019 2020 2021 2022 2023 2024
Cooper Energy gas production profilePJ pa
Manta(100)
Sole (100)
Casino
bull Casino Henry gas contracted to February 2018
bull Casino Henry gas available to contract from March 2018
bull COE may sell down some of Sole Gas Project and Manta post
Sole FID
0
100
200
300
400
500
600
2016 2018 2020 2022 2024 2026 2028 2030 2032 2034 2036
Most certain supply tranche Less certain supply tranche
Least certain supply tranche Southern demand
12Source AEMO
13
1 Assumes
bull Sole sanction by March quarter 2017 for March quarter 2019 first Sole gas
to plant
bull Manta 3 appraisal well
bull Development well required for Casino Henry ~2020
bull Details on slide 26
3 5 1
1520 20 20 20 20 20 20
16102
13
17 11
37 36 36
28
1913
15
10
FY17 FY18 FY19 FY20 FY21 FY22 FY23 FY24 FY25 FY26 FY27 FY28 FY29
Gas production1 from current assets contracted amp uncontractedPJ pa
Uncontracted
Contracted
227 PJ comprises 52 PJ 2P Casino Henry gas and 175 PJ 2C Contingent uncontracted gas from Sole and Manta Profile illustrated includes additional 10 PJ anticipated from Manta Cooper Energy announced Sole Contingent Resources on 27 February 2017 and Manta Contingent Resource 16 July 2015 Cooper Energy is not aware of any new information or data that materially affects the information provided in those releases and all material assumptions and technical parameters underpinning the assessment provided in the announcement continues to apply See notes on page 29 for information on reserves and resources calculation
14
Resource economics
Health amp safety
Environment
CommunityFiscaldividend
SuccessfulSustainable
Value-generating resource
development
Balance not achieved people hurt project collapse uneconomic no community
benefit no fiscal dividend excessive energy
costs
Balance achieved safe environmentally
sound development
cost effective sustainable energy
community benefits
fiscal dividend
15
Casino Henry
bull Sustained growth profile over 6 years
bull Gas accounts for overwhelming majority of production
bull New assets and production profile generates
ndash FY17 production gt2x FY16 production
ndash FY19 production gt5x FY16 production
ndash FY22 production gt20x FY16 production
0
2
4
6
8
10
12
FY15 FY16 FY17 FY18 FY19 FY20 FY21 FY22 FY23 FY24
Production1
MMboe
Sole Gas Project
Manta Gas Project
Casino-Henry
Cooper Basin oil
Assumes1
bull Current equities COE may divest some Gippsland post Sole sanction
bull Sole sanction by March quarter 2017 for March quarter 2019 Sole gas to plant
bull Manta 3 appraisal well
bull Development well required for Casino Henry ~2020
bull No new exploration success
16
Sole FID
bull Financial commitment to project
bull Triggers 43 MMboe uplift in gas reserves
bull Translation of HoA with APA to formal agreement
bull Expected shortly after project sanction
Uncontracted Otway gas
bull Contracting gas to supply from March 2018
bull Expect to secure new agreements in winter 2017 with market reflective price
Operator status
bull Working to appointment as Operator in Gippsland and Otway
bull Enables cost efficiencies and competitive advantage as asset owner and JV participant
Beyond June 2017
bull Cooper Basin assets
bull Divest slice of Gippsland Basin portfolio
bull Manta exploration
13116
~53
Jun-16 Jan-17 June -17Proforma
Uplift in 2P reservesMMboe
Australia only Assumes commitment of Sole gas project provides uplift of
~43 MMboe
1
2
3
4
17
1 Execution of our gas strategy has deliveredCooper Energy has become a supplier and developer of gas for south east Australia at a time of great market need
2 FY17 growth is the first step of larger and sustainable growthReserves and production upgrades in the current year are the initial instalment of a 6 year growth trajectory offering gt 20 times growth in
production from existing assets and equities
3 Integration proceeding management capabilities have been reinforced consistent with growthUpgraded people resources with the addition of proven performance orientated executives integration is proceeding to schedule
4 Sole project stronger and proceeding to final phase financingProject now offering lower risk lower capital cost increased gas and increased returns and value upside for Cooper Energy shareholders
5 Milestones aheadSix months to June 17 is expected to see a number of milestones for further uplift and value transformation
Appendices
20
Key figures
Shares on issue1 6601 mill
Shareholders1 5923
Market capitalisation1 $260 mill
Debt Nil
Current employees 23
Cooper Energy is an independent Australian exploration and
production company
bull Listed in 2002 history of profitable operations and successful
exploration and development
bull Strong balance sheet zero debt
bull Raised new equity capital of c$85 million during 2016
bull Management team and board experienced in growing resource
companies
bull Growth profile extending over 6 years from existing assets and
agreements
59
10
2
29
Share register
Institutional
Corporate
Employees amp Directors
Private
1 As at 20 March 2017
21
Oil exploration amp production
Cooper Basin Western Flank
240000 ndash 280000 1 bbl pa
Operating cost ltA$30bbl
High margin + exploration upside
Gas production amp sales Gas projects amp contracting
Otway Basin Casino Henry amp Minerva
Sales of ~7- 8 PJ pa to EnergyAustralia
Minerva1 gas plant
Production of 15 MMboe pa
Gippsland and Otway Basins
Sole Manta projects Otway uncontracted gas
gt400 PJ gas to be developed or uncontracted
Production uplift of up to 95 MMboe2 pa as
projects come online on top of existing output
1 Subject to completion of transaction2 Based on current equity participation levels
22
Phase 1 Sole
bull 2C Resource1 249 PJ
bull Sanction March 2017
bull Sole gas into plant March 2019
bull Output ~25 PJ pa
bull COE equity 100
Phase 2 Manta
bull 2C Resource1 106 PJ gas3 2 MMbbl liquids
bull Appraisal 2018-19
bull Sanction 2021
bull First gas ~2023
bull Output pa 25 PJ gas 039 MMbbl pa
bull Exploration Manta Deep amp Chimaera
bull COE equity 100
Orbost Gas Plant
bull Existing gas plant
bull Connected to Eastern Gas Pipeline
bull Plant owned amp operated by APA Group (proposed in HoA announced 27217
Longtom(Seven Group 100)
Patricia Baleen (COE 100)
Enabling customersUpstream and Midstream HoA
1 Cooper Energy announced Sole Contingent Resources on 27 February 2017 and Manta Contingent Resource 16 July 2015 Cooper Energy is not aware of any new information or data that materially affects the information provided in those releases and all material
assumptions and technical parameters underpinning the assessment provided in the announcement continues to apply See notes on page 29 for information on reserves and resources calculation
33 km
58 km
65 km
23
Sole Gas Project (VIC L32 COE100 Operator )
bull 249 PJ 2C Contingent Resource1
bull 20 PJ pa contracted gas contracts with O-I Australia AGL Energy Alinta Energy
EnergyAustralia
bull Sanction expected by March 2017 for Sole gas into plant by March 2019
Manta (VIC RL131415 COE 100)
bull 106 PJ 2C Contingent Resource plus 3 million barrels liquids1
bull economic business case identified subject to appraisal
bull prospective resource upside to be tested amp appraisal well expected 2018
Patricia-Baleen (VICL21 COE 100)
bull Non-operating field shut in
bull Strategic significance as access point for Orbost Gas Plant for other fields
1 Reserves and Contingent Resources at 1 January 2017 were announced to the ASX on 27 February 2017 and an announcement on Manta Contingent Resource was announced on 16 July 2015 The resources information displayed should be read in conjunction with the information provided on the calculation of Reserves and Contingent Resources provided on page 29 Cooper Energy is not aware of any new information or data that materially affects the information provided in those releases and all material assumptions and technical parameters underpinning the assessment provided in the announcement continues to apply
24
Key Assets
bull Casino Henry gas project (50)
bull Minerva gas field and plant (10 interest)1
bull VICP44 exploration permit
Production (COE share effective from 1 January 2017)
bull Casino Henry (VICRL11 amp 12) 7 PJ pa supplied to EnergyAustralia
under contract expiring March 2018
bull Minerva (VICL22)~ 1 PJ pa (expected to deplete by mid 2017)
Plans
bull Preparation for operatorship transfer likely June 2017
bull Marketing of uncontracted gas available for sale from March 2018
bull Casino Henry development well
1Acquisition of 10 interest in Minerva agreed with Santos Ltd is subject to completion
25
bull First half production of 013 MMbbl vs 017 in H1 FY16
bull Production impacted by suspension of drilling in low oil price FY16
bull Operating costs reduced from A$2992bbl to A$2928bbl
bull Drilling resumed in FY17 with 4 wells drilled 2 successful 2 P amp A
bull No further drilling planned for FY17
bull Producing interests
ndash PEL 92 25 interest (Beach Energy 75 amp Operator)
ndash PEL 93 30 interest (Senex Energy 70 amp Operator)
11 10
16 15
7 4
3530
FY16 H1 FY17
Production costs amp netback Direct cost A$ per barrel
NetbackRoyaltyTransportOperatingCosts per
bbl down 2
26
bull Take or pay gas
processing agreement
1 Cooper Energy to sell Orbost Gas Plant to APA Group
Heads of Agreement (non-binding) provides for APA to take ownership subject to Sole FID
2 APA to be responsible for funding and performance of ~$250 million plant upgrade and processing of gas from Sole amp Manta
Plant to be developed according to existing Sole Development Plan Sole gas to be processed under take or pay tariff agreement
3 Cooper Energy to retain 100 of upstream retains ownership of gas processed through Orbost Gas Plant
Estimated project cost for Cooper Energy reduced to ~$355 million and opportunity to realise further value accretion in sell-down post FID
Orbost Gas Plant APA Group 100
APA
bull funds and completes plant upgrade
for Sole
bull operates plant for agreed tariff amp
provides processed sales gas to
EGP
Sole gas
field
COE 100
COE
bull manages upstream
development
bull supplies gas to Orbost
for processing
bull markets the gas
Upstream Midstream
Downstream COE retains ownership of gas
through to point of sale to customers
in EGP
Transaction elements
1refer joint APA Group Cooper Energy announcement 27 February 2017
27
28
3 5
2 7 7 6 7 7 6 5 4
1
1520 20 20 20
2020
20
16
10
6
10 5 5 5 55
55 9
9
25 25 25
18
10
75
1
FY17 FY18 FY19 FY20 FY21 FY22 FY23 FY24 FY25 FY26 FY27 FY28 FY29
Gas production profile by projectcontracted amp uncontracted PJ pa
Manta uncontracted
Sole uncontracted
Sole contracted
Otway uncontracted
Otway contracted
Otway 2P reserves
Casino Henry
Gippsland Gas Project Phase 1
Sole
Gippsland Gas Project Phase 2
Manta
Assumes
bull Sole sanction by March quarter 2017 for March quarter 2019 first Sole gas to plant
bull All contract options in respect of Sole field are exercised
bull Manta subject to Manta 3 appraisal well Manta profile illustrates all Manta gas as uncontracted (including 4 PJ pa option held by
AGL) Manta profile includes 106 PJ 2C resource and additional 10 PJ anticipated
bull Development well required for Casino Henry ~2020
bull No exploration success
29
Reserves
Proved
(1P)
Proved amp Probable
(2P)
Proved Probable amp Possible
(3P)
Cooper1 Otway2 Total Cooper1 Otway2 Total Cooper1 Otway2 Total
Developed
Sales Gas PJ 00 48 48 00 152 152 00 293 293
Oil + Condensate MMbbl 05 00 05 09 00 09 16 00 16
Total developed MMboe2 05 08 13 09 26 35 16 51 67
Undeveloped
Sales Gas PJ 00 344 344 00 451 451 00 627 627
Oil + Condensate PJ 01 00 02 03 11 03 05 01 05
Total undeveloped MMboe2 01 60 61 03 78 81 05 109 113
Total1 MMboe2 07 68 74 11 104 116 21 159 180
Contingent
Resources
1C 2C 3C
Gas Oil Total1 Gas Oil Total Gas Oil Total
PJ MMbbl MMboe2 PJ MMbbl MMboe2 PJ MMbbl MMboe2
Gippsland 2917 40 541 3885 76 744 5336 121 1039
Cooper 02 00 003 03 00 01 06 00 01
Total 1 2919 40 542 3888 76 744 5342 121 1040
Additional information on reserve and resource calculation is provided in the appendices to this document
1 Totals may not reflect arithmetic addition due to rounding The method of aggregation is by arithmetic sum by category As a result the 1P estimate may be conservative and the 3P estimate may be optimistic due to the effects
of arithmetic summation The conversion factor of 1 PJ = 0172 MMboe has been used to convert from Sales Gas (PJ) to Oil Equivalent (MMboe) 2 The reserves revisions include Cooper Energyrsquos share of future crude fuel
usage in the Cooper Basin The estimated fuel usage for PEL 92 is 1P 002 MMbbl 2P 003 MMbbl and 3P 006 MMbbl The estimated fuel usage for the Worrior Field (PPL 207) is 1P 001 MMbbl 2P 002 MMbbl and 3P 003
MMbbl 3 The Otway gas reserves for Casino Henry and Netherby fields are net of fuel gas
1 Totals may not reflect arithmetic addition due to rounding The method of aggregation is by arithmetic sum by category As a result the 1C estimate may be conservative and the 3C estimate may be optimistic due to the
effects of arithmetic summation 2 The conversion factor of 1 PJ = 0172 MMboe has been used to convert from Sales Gas (PJ) to Oil Equivalent (MMboe)
30
General Manager Operations
Iain MacDougallIain MacDougall has more than 25
yearsrsquo experience in the upstream
petroleum exploration and production
sector including senior management
roles within independent operators
and international experience with
Schlumberger In Australia previous
employment includes Stuart
Petroleum as Production and
Engineering Manager and then as
acting CEO prior to the takeover of
Stuart Petroleum by Senex Energy
Managing Director
David MaxwellDavid Maxwell has over 30 yearsrsquo
experience as a senior executive with
companies such as BG Group Woodside
and Santos As Senior Vice President at
QGC a BG Group business he led BGrsquos
entry into Australia its alliance with and
subsequent takeover of QGC Roles at
Woodside included director of gas and
marketing and membership of Woodsidersquos
executive committee
General Manager Exploration
amp Subsurface
Andrew ThomasAndrew Thomas is a successful
geoscientist with over 28 yearsrsquo
experience in oil and gas exploration
and development in companies
including Geoscience Australia
Santos Gulf Canada and Newfield
Exploration At Newfield he was SE
Asia New Ventures Manager and
Exploration Manager for offshore
Sarawak
Executive Director
Hector GordonHector Gordon is a highly
experienced geologist with over 35
yearsrsquo experience in the petroleum
industry Previous roles include
Managing Director Somerton
Energy and a number of senior
management and technical roles at
Beach Energy including Exploration
Manager Chief Operating Officer
and ultimately Chief Executive
Officer
Alison Evans is an experienced
company secretary and corporate legal
counsel with extensive knowledge of
corporate and commercial law in the
resources and energy sectors
Alison has held Company Secretary
and Legal Counsel roles at a number of
minerals and energy companies
including Centrex Metals GTL Energy
and AGL Ms Evans public company
experience is supported by her work at
leading corporate law firms
Company Secretary and
General Counsel
Alison Evans
General Manager Development
Duncan CleggDuncan Clegg has over 35 yearsrsquo
experience in upstream and midstream oil
and gas development including
management positions at Shell and
Woodside leading oil and gas
developments including FPSO subsea
and fixed platforms developments At
Woodside Duncan held several senior
executive positions including Director of
the Australian Business Unit Director of
the African Business Unit and CEO of the
North West Shelf Venture
Eddy Glavas has more than 18 years
experience in business development
finance commercial portfolio
management and strategy including 14
years in the oil and gas sector Prior to
joining Cooper Energy he was
employed by Santos as Manager
Corporate Development with
responsibility for managing multi-
disciplinary teams tasked with mergers
acquisitions partnerships and
divestitures
General Manager Commercial amp
Business Development
Eddy Glavas
Virginia Suttell is a chartered accountant
with more than 20 years experience
including 16 years in publicly listed entities
principally in group finance and secretarial
roles in the resources and media sectors
This has included the role of Chief Financial
Officer and Company Secretary for Monax
Mining Limited and Marmota Energy Limited
from 2007 to 2016 and 2007 to 2015
respectively Other previous appointments
include Group Financial Controller at
Austereo Group Limited
Chief Financial Officer
(Acting)
Virginia Suttell
31
The approach for all reserve and resource calculations is consistent with the definitions and guidelines in the Society of Petroleum Engineers (SPE) 2007 Petroleum Resources Management System (PRMS) The resource estimate methodologies incorporate a range of uncertainty relating to each of the key reservoir input parameters to predict the likely range of outcomes Cooper Energy has completed its own estimation of reserves and contingent resources based on information provided by the permit Operators Beach Energy Ltd Senex Ltd and Santos Ltd and in accordance with the definitions and guidelines in the Society of Petroleum Engineers (SPE) 2007 Petroleum Resources Management System (PRMS) Petroleum Reserves and Contingent Resources are prepared using deterministic and probabilistic methods The method of aggregation for all reserves and contingent resources tables is by arithmetic summation by category Aggregated 1P and 1C estimates may be conservative and aggregated 3P and 3C estimates may be optimistic due to the effects of arithmetic summation Totals may not exactly reflect arithmetic addition due to rounding
The information contained in this report regarding the Cooper Energy reserves and contingent resources is based on and fairly represents information and supporting documentation reviewed by Mr Andrew Thomas who is a full-time employee of Cooper Energy Limited holding the position of General Manager Exploration amp Subsurface holds a Bachelor of Science (Hons) is a member of the American Association of Petroleum Geologists and the Society of Petroleum Engineers is qualified in accordance with ASX listing rule 541 and has consented to the inclusion of this information in the form and context in which it appears
The Cooper Basin totals comprise the probabilistically aggregated PEL 92 project fields and the arithmetic summation of the Worrior project reserves Total includes 005 MMbbl oil reserves used for field fuel The Indonesia totals include removal of non-shareable oil (NSO) and comprise the probabilistically aggregated Tangai-Sukananti KSO project fields Totals are derived by arithmetic summation In the Otway Basin reserves for the Casino Henry and Netherby fields have been assessed by Cooper Energy The Reserves have been assessed using deterministic and probabilistic methodologies for the Waarre Formation at the Casino Henry and Netherby fields This methodology incorporates a range of uncertainty relating to each of the key reservoir input parameters to predict the likely range of outcomes Cooper Energy undertook the following analytical procedures to estimate the Reserves independent interpretation of 3D seismic data analysis of historical production data to assess accessed gas volumes and future production forecasts review of the Operatorrsquos reservoir and production simulation models to define raw gas recovery consistent with existing processing facilities and independent probabilistic Monte Carlo statistical calculations to establish the range of recoverable gas The Otway gas reserves for Casino Henry and Netherby fields are net of fuel gas The date of the Casino Henry and Netherby Reserve Assessment is 27 February 2017
Sole gas field The contingent resource for the Sole field has been re-estimated assuming a two well subsea development plan Advantages of a two well plan compared to the previous single well development includeincreased 2C estimate attributable to accessing previously undeveloped gas and reduced technical risk and enhanced field redundancy providing increased security of supply to the gas processing and gas sales agreements Contingent resources for the Sole field were released to the ASX on 26 November 2015 Post-acquisition of the remaining 50 equity in the Sole gas field the following methodologies were used by Cooper Energy to re-calculate the Sole contingent resource estimate probabilistic simulation modelling for the Kingfish Formation incorporation of a range of uncertainty relating to each of the key reservoir input parameters to predict the likely range of outcomes and review of the reservoir and simulation modelling assuming a two well subsea development The date of the Sole contingent resource assessment is 27 February 2017
Manta gas and oil field Contingent and Prospective Resources have been assessed using deterministic simulation modelling and probabilistic resource estimation for the Intra-Latrobe and Golden Beach Sub-Group in the Manta field This methodology incorporates a range of uncertainty relating to each of the key reservoir input parameters to predict the likely range of outcomes The conversion factor of 1PJ = 0172MMboe has been used to convert from Sales Gas (PJ) to Oil Equivalent (MMboe) Contingent Resources for the Manta Field have been aggregated by arithmetic summation The date of the Manta Contingent Resource assessment is 16 July 2015 and the assessment was announced to the ASX on 16 July 2015 Cooper Energy is not aware of any new information or data that materially affects the information provided in that release and all material assumptions and technical parameters underpinning the assessment provided in the announcement continues to apply
Basker gas and oil field Contingent and Resources have been assessed using deterministic simulation modelling and probabilistic resource estimation for the Intra-Latrobe Sub-Group in the Basker field This methodology incorporates a range of uncertainty relating to each of the key reservoir input parameters to predict the likely range of outcomes The conversion factor of 1PJ = 0172MMboe has been used to convert from Sales Gas (PJ) to Oil Equivalent (MMboe) Contingent Resources for the Basker Field have been aggregated by arithmetic summation The date of the Basker Contingent Resource assessment is 15 August 2014 and the assessment was announced to the ASX on 18 August 2014 Cooper Energy is not aware of any new information or data that materially affects the information provided in that release and all material assumptions and technical parameters underpinning the assessment provided in the announcement continues to apply
32
$ A$ Australian dollars unless specified otherwise
Bbl barrels of oil
boe barrel of oil equivalent
bopd barrel of oil per day
EBITDA earnings before interest tax depreciation and amortisation
FEED Front end engineering and design
kbbls thousand barrels
LTIFR Lost Time Injury Frequency Rate Lost Time Incidents per million man hours worked
MMbbl million barrels of oil
MMboe million barrels of oil equivalent
NOPSEMA National Offshore Petroleum Safety amp Environmental Management Authority
NOPTA National Offshore Petroleum Titles Administrator
NPAT net profit after tax
PEL 92 Joint Venture conducting operations in Western Flank Cooper Basin Petroleum Retention Licences 85 ndash 104 previously encompassed by
the PEL 92 exploration licence
TRCFR Total Recordable Case Frequency Rate Recordable cases per million hours worked
TSR total shareholder return
1P reserves Proved reserves
2P reserves Proved and Probable reserves
3P Proved Probable and Possible reserves
1C 2C 3C high medium and low estimates of contingent resources
- 1WRM Investor presentation March 2017
-
- Slide Number 1
- Disclaimer
- Slide Number 3
- Slide Number 4
- Slide Number 5
- Slide Number 6
- Slide Number 7
- Slide Number 8
- Slide Number 9
- Slide Number 10
- Slide Number 11
- Gold and Silver development asset with a definitive feasibility study (DFS) commenced
- Slide Number 13
- Slide Number 14
- Slide Number 15
- Slide Number 16
- Slide Number 17
- Slide Number 18
- Slide Number 19
- Slide Number 20
- Slide Number 21
- Slide Number 22
- Slide Number 23
- Slide Number 24
- Slide Number 25
- Slide Number 26
- Slide Number 27
- Slide Number 28
- Slide Number 29
- Mount Carrington Resource Statement
- Slide Number 31
- Slide Number 32
- Slide Number 33
- Slide Number 34
- Slide Number 35
- Slide Number 36
- Slide Number 37
-
- 2Aurelia Metals Presentation-Mar 2017-widescreen format
-
- Slide Number 1
- Slide Number 2
- Slide Number 3
- Slide Number 4
- Slide Number 5
- Slide Number 6
- Slide Number 7
- Slide Number 8
- Slide Number 9
- Slide Number 10
- Slide Number 11
- Slide Number 12
- Slide Number 13
- Slide Number 14
- Slide Number 15
- Slide Number 16
- Slide Number 17
- Slide Number 18
- Slide Number 19
- Slide Number 20
- Slide Number 21
-
- 320170321 Presentations Melbourne Mining Club Speaker
-
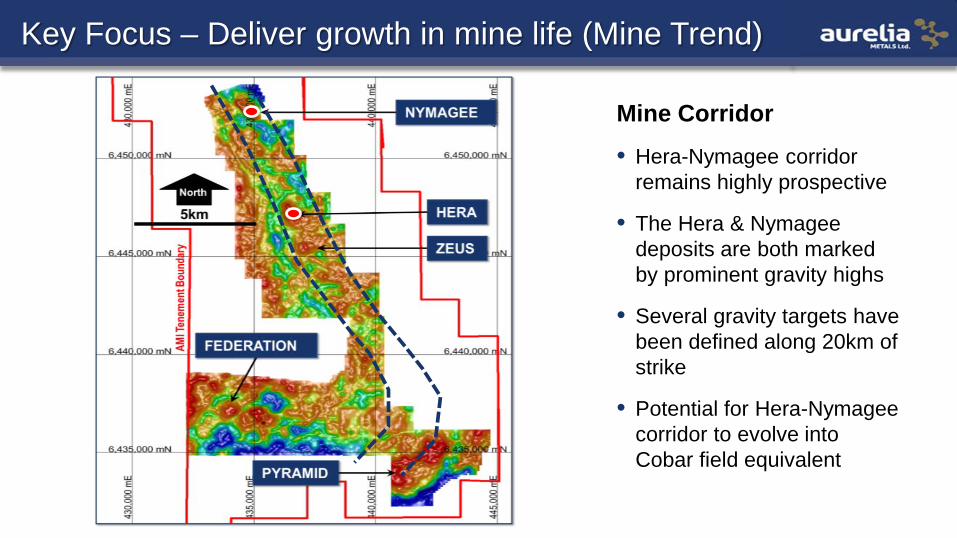

20
Key Focus ndash Deliver Shareholder Returns
Conclusion
21
Strategy to Deliver Generate cash Continuously improve operational performance
- Continuous improvement in recovery and throughput - Minimise unit costs - Optimise mine plan (north pod high grade)
Reduce net debt Reduce gearing reduce financial risk
- build optionality leading up to first scheduled debt repayments (Mar-18)
Deliver growth Expansion of base metals capacity North Pod exploration amp strike extensions Scoping Study on copper development opportunity at Nymagee
2
The information in this presentation
bull Is not an offer or recommendation to purchase or subscribe for shares in Cooper Energy Limited or to retain or sell any shares that are
currently held
bull Does not take into account the individual investment objectives or the financial situation of investors
bull Was prepared with due care and attention and is current at the date of the presentation
Actual results may materially vary from any forecasts (where applicable) in this presentation
Before making or varying any investment in shares of Cooper Energy Limited all investors should consider the appropriateness of that
investment in light of their individual investment objectives and financial situation and should seek their own independent professional advice
Qualified petroleum reserves and resources evaluator
This report contains information on petroleum reserves and resources which is based on and fairly represents information and supporting
documentation reviewed by Mr Andrew Thomas who is a full time employee of Cooper Energy Limited holding the position of Exploration
Manager holds a Bachelor of Science (Hons) is a member of the American Association of Petroleum Geologists and the Society of Petroleum
Engineers and is qualified in accordance with ASX listing rule 541 and has consented to the inclusion of this information in the form and context
in which it appears
Rounding
All numbers in this presentation have been rounded As a result some total figures may differ insignificantly from totals obtained from arithmetic
addition of the rounded numbers presented
Reserves and resources calculation
Information on the companyrsquos reserves and resources and their calculation are provided in the appendices to this presentation
Currency
All financial information is expressed in Australian dollars unless otherwise specified
3
Cooper Energy develops and supplies gas to south-east Australia and produces oil from the
western flank of the Cooper Basin
The companyrsquos portfolio features existing gas production 227 PJ of uncontracted gas
and two new gas projects to supply south-east Australia from 2019 onwards backed by long term
contracts with blue chip utility and industrial customers
Existing assets and plans have the company on a 6 year growth trajectory with capacity for
production growth over 20 times FY16 levels
4
Cooper Basin oil
PEL 495
bull Oil production from western flank of Cooper Basin
bull Single gas exploration permit in Otway Basin
bull Poland
bull Romania
bull Indonesia
bull Tunisia
2011 portfolio
5
Otway Basin
bull Builds acreage and technical capability
through merger with Somerton Energy
bull Sub-surface studies reinforce view of
prospectivity
Market
bull Demand and supply-side gas market analysis
bull Commenced engagement with gas buyers
Gippsland Basin
bull Invested in Bass Strait Oil Company which
holds Gippsland permits
bull Technical studies of prospectivity and gas
plays
6
Otway Basin
bull Drilling identifies gas bearing
reservoirs in deep sands Gippsland Basin
bull Acquires 65 interest in Basker Manta Gummy
permits
bull Commenced Manta business case analysis for
supply to south-east Australia
7
Otway Basin
bull Builds understanding of Otway
sub-surface
bull Confirms attraction of offshore
Otway
Gippsland Basin
bull Acquires 50 of Sole gas field
bull Acquires 50 of Orbost Gas Plant
bull Manta business case affirms economic
development opportunity
8
Gippsland Basinbull Sole gas field interest 100
bull Sole gas project FEED completed
bull Orbost Gas Plant 100
bull Manta gas field 100
Otway Basin
bull Acquires Casino Henry Vic P44
Minerva and Minerva Gas Plant
Market
bull O-I Australia gas contract
bull AGL gas contract
bull EnergyAustralia gas
contract
bull Alinta Energy gas
contract
9
Gas contracts
bull 188 PJ contracted from 2017 on
bull EnergyAustralia (Otway amp Sole)
bull AGL Energy (Sole)
bull Alinta Energy (Sole)
bull O-I Australia (Sole)
New gas projects
bull Phase 1 Sole from 2019
ndash Sanction Marchrsquo 17 for March lsquo19 first gas into plant
bull Phase 2 Manta
ndash appraisal well and resource upside
ndash from FY22
bull VIC P44 exploration prospects
Production
bull ~ 7 PJ pa from Casino Henry amp
Minerva1
bull Sold to EnergyAustralia
bull Uncontracted gas to market for
supply from March 18
bull Field life to 2026 (Casino Henry)Plant amp infrastructure
bull Orbost Gas Plant connected to
EGP (subject to APA HoA)
bull Minerva1 Gas Plant (10)
connected to SEA Gas pipeline
bull Patricia Baleen connected to
Orbost and Longtom
1Acquisition of 10 interest in Minerva and Minerva gas plant to be completed
Uncontracted gas
Total of 227 PJ uncontracted in
bull Otway
ndash 52 PJ 2P Casino Henry reserves from March 2018
bull Gippsland
ndash Sole 69 PJ 2C contingent resource uncontracted
ndash Manta 106 PJ 2C contingent resource plus
exploration potential
10
03
Jun-16 Jan-17
FY17 production1
MMboe expected
Gas
Oil
1
49 76
367
668
Jun-16 Jan-17
Contingent resources (2C)12
MMboe
Gas
Oil13
11
104
Jun-16 Jan-17
2P reserves12
MMboe
bull Addition of Otway gas production Jan to Jun 17
bull Gas accounts for 75 of anticipated FY17 production
bull Addition of 60 PJ of Otway Basin gas reserves
bull Gas accounts for 90 of 116 MMboe 2P reserves
bull Australian contingent resources 2C up 79
bull 128 PJ gas contingent resources (2C) added in Gippsland
116
416
744
1Australia only 2 Reserves and Contingent Resources at 1 January 2017 were announced to the ASX on 27 February 2017 and should be read in conjunction with the information provided on the calculation
of Reserves and Contingent Resources provided on page 29 Cooper Energy is not aware of any new information or data that materially affects the information provided in those releases and
all material assumptions and technical parameters underpinning the assessment provided in the announcement continues to apply
11
Forecast 1 south-east Australian gas demand and production
PJ pa
South-east Australia comprises NSW VIC SA and Tasmania
SE Australia demandsup1
1 EnergyQuest Energy Quarterly March 2017
0
10
20
30
40
50
60
70
80
90
100
2017 2018 2019 2020 2021 2022 2023 2024
Cooper Energy gas production profilePJ pa
Manta(100)
Sole (100)
Casino
bull Casino Henry gas contracted to February 2018
bull Casino Henry gas available to contract from March 2018
bull COE may sell down some of Sole Gas Project and Manta post
Sole FID
0
100
200
300
400
500
600
2016 2018 2020 2022 2024 2026 2028 2030 2032 2034 2036
Most certain supply tranche Less certain supply tranche
Least certain supply tranche Southern demand
12Source AEMO
13
1 Assumes
bull Sole sanction by March quarter 2017 for March quarter 2019 first Sole gas
to plant
bull Manta 3 appraisal well
bull Development well required for Casino Henry ~2020
bull Details on slide 26
3 5 1
1520 20 20 20 20 20 20
16102
13
17 11
37 36 36
28
1913
15
10
FY17 FY18 FY19 FY20 FY21 FY22 FY23 FY24 FY25 FY26 FY27 FY28 FY29
Gas production1 from current assets contracted amp uncontractedPJ pa
Uncontracted
Contracted
227 PJ comprises 52 PJ 2P Casino Henry gas and 175 PJ 2C Contingent uncontracted gas from Sole and Manta Profile illustrated includes additional 10 PJ anticipated from Manta Cooper Energy announced Sole Contingent Resources on 27 February 2017 and Manta Contingent Resource 16 July 2015 Cooper Energy is not aware of any new information or data that materially affects the information provided in those releases and all material assumptions and technical parameters underpinning the assessment provided in the announcement continues to apply See notes on page 29 for information on reserves and resources calculation
14
Resource economics
Health amp safety
Environment
CommunityFiscaldividend
SuccessfulSustainable
Value-generating resource
development
Balance not achieved people hurt project collapse uneconomic no community
benefit no fiscal dividend excessive energy
costs
Balance achieved safe environmentally
sound development
cost effective sustainable energy
community benefits
fiscal dividend
15
Casino Henry
bull Sustained growth profile over 6 years
bull Gas accounts for overwhelming majority of production
bull New assets and production profile generates
ndash FY17 production gt2x FY16 production
ndash FY19 production gt5x FY16 production
ndash FY22 production gt20x FY16 production
0
2
4
6
8
10
12
FY15 FY16 FY17 FY18 FY19 FY20 FY21 FY22 FY23 FY24
Production1
MMboe
Sole Gas Project
Manta Gas Project
Casino-Henry
Cooper Basin oil
Assumes1
bull Current equities COE may divest some Gippsland post Sole sanction
bull Sole sanction by March quarter 2017 for March quarter 2019 Sole gas to plant
bull Manta 3 appraisal well
bull Development well required for Casino Henry ~2020
bull No new exploration success
16
Sole FID
bull Financial commitment to project
bull Triggers 43 MMboe uplift in gas reserves
bull Translation of HoA with APA to formal agreement
bull Expected shortly after project sanction
Uncontracted Otway gas
bull Contracting gas to supply from March 2018
bull Expect to secure new agreements in winter 2017 with market reflective price
Operator status
bull Working to appointment as Operator in Gippsland and Otway
bull Enables cost efficiencies and competitive advantage as asset owner and JV participant
Beyond June 2017
bull Cooper Basin assets
bull Divest slice of Gippsland Basin portfolio
bull Manta exploration
13116
~53
Jun-16 Jan-17 June -17Proforma
Uplift in 2P reservesMMboe
Australia only Assumes commitment of Sole gas project provides uplift of
~43 MMboe
1
2
3
4
17
1 Execution of our gas strategy has deliveredCooper Energy has become a supplier and developer of gas for south east Australia at a time of great market need
2 FY17 growth is the first step of larger and sustainable growthReserves and production upgrades in the current year are the initial instalment of a 6 year growth trajectory offering gt 20 times growth in
production from existing assets and equities
3 Integration proceeding management capabilities have been reinforced consistent with growthUpgraded people resources with the addition of proven performance orientated executives integration is proceeding to schedule
4 Sole project stronger and proceeding to final phase financingProject now offering lower risk lower capital cost increased gas and increased returns and value upside for Cooper Energy shareholders
5 Milestones aheadSix months to June 17 is expected to see a number of milestones for further uplift and value transformation
Appendices
20
Key figures
Shares on issue1 6601 mill
Shareholders1 5923
Market capitalisation1 $260 mill
Debt Nil
Current employees 23
Cooper Energy is an independent Australian exploration and
production company
bull Listed in 2002 history of profitable operations and successful
exploration and development
bull Strong balance sheet zero debt
bull Raised new equity capital of c$85 million during 2016
bull Management team and board experienced in growing resource
companies
bull Growth profile extending over 6 years from existing assets and
agreements
59
10
2
29
Share register
Institutional
Corporate
Employees amp Directors
Private
1 As at 20 March 2017
21
Oil exploration amp production
Cooper Basin Western Flank
240000 ndash 280000 1 bbl pa
Operating cost ltA$30bbl
High margin + exploration upside
Gas production amp sales Gas projects amp contracting
Otway Basin Casino Henry amp Minerva
Sales of ~7- 8 PJ pa to EnergyAustralia
Minerva1 gas plant
Production of 15 MMboe pa
Gippsland and Otway Basins
Sole Manta projects Otway uncontracted gas
gt400 PJ gas to be developed or uncontracted
Production uplift of up to 95 MMboe2 pa as
projects come online on top of existing output
1 Subject to completion of transaction2 Based on current equity participation levels
22
Phase 1 Sole
bull 2C Resource1 249 PJ
bull Sanction March 2017
bull Sole gas into plant March 2019
bull Output ~25 PJ pa
bull COE equity 100
Phase 2 Manta
bull 2C Resource1 106 PJ gas3 2 MMbbl liquids
bull Appraisal 2018-19
bull Sanction 2021
bull First gas ~2023
bull Output pa 25 PJ gas 039 MMbbl pa
bull Exploration Manta Deep amp Chimaera
bull COE equity 100
Orbost Gas Plant
bull Existing gas plant
bull Connected to Eastern Gas Pipeline
bull Plant owned amp operated by APA Group (proposed in HoA announced 27217
Longtom(Seven Group 100)
Patricia Baleen (COE 100)
Enabling customersUpstream and Midstream HoA
1 Cooper Energy announced Sole Contingent Resources on 27 February 2017 and Manta Contingent Resource 16 July 2015 Cooper Energy is not aware of any new information or data that materially affects the information provided in those releases and all material
assumptions and technical parameters underpinning the assessment provided in the announcement continues to apply See notes on page 29 for information on reserves and resources calculation
33 km
58 km
65 km
23
Sole Gas Project (VIC L32 COE100 Operator )
bull 249 PJ 2C Contingent Resource1
bull 20 PJ pa contracted gas contracts with O-I Australia AGL Energy Alinta Energy
EnergyAustralia
bull Sanction expected by March 2017 for Sole gas into plant by March 2019
Manta (VIC RL131415 COE 100)
bull 106 PJ 2C Contingent Resource plus 3 million barrels liquids1
bull economic business case identified subject to appraisal
bull prospective resource upside to be tested amp appraisal well expected 2018
Patricia-Baleen (VICL21 COE 100)
bull Non-operating field shut in
bull Strategic significance as access point for Orbost Gas Plant for other fields
1 Reserves and Contingent Resources at 1 January 2017 were announced to the ASX on 27 February 2017 and an announcement on Manta Contingent Resource was announced on 16 July 2015 The resources information displayed should be read in conjunction with the information provided on the calculation of Reserves and Contingent Resources provided on page 29 Cooper Energy is not aware of any new information or data that materially affects the information provided in those releases and all material assumptions and technical parameters underpinning the assessment provided in the announcement continues to apply
24
Key Assets
bull Casino Henry gas project (50)
bull Minerva gas field and plant (10 interest)1
bull VICP44 exploration permit
Production (COE share effective from 1 January 2017)
bull Casino Henry (VICRL11 amp 12) 7 PJ pa supplied to EnergyAustralia
under contract expiring March 2018
bull Minerva (VICL22)~ 1 PJ pa (expected to deplete by mid 2017)
Plans
bull Preparation for operatorship transfer likely June 2017
bull Marketing of uncontracted gas available for sale from March 2018
bull Casino Henry development well
1Acquisition of 10 interest in Minerva agreed with Santos Ltd is subject to completion
25
bull First half production of 013 MMbbl vs 017 in H1 FY16
bull Production impacted by suspension of drilling in low oil price FY16
bull Operating costs reduced from A$2992bbl to A$2928bbl
bull Drilling resumed in FY17 with 4 wells drilled 2 successful 2 P amp A
bull No further drilling planned for FY17
bull Producing interests
ndash PEL 92 25 interest (Beach Energy 75 amp Operator)
ndash PEL 93 30 interest (Senex Energy 70 amp Operator)
11 10
16 15
7 4
3530
FY16 H1 FY17
Production costs amp netback Direct cost A$ per barrel
NetbackRoyaltyTransportOperatingCosts per
bbl down 2
26
bull Take or pay gas
processing agreement
1 Cooper Energy to sell Orbost Gas Plant to APA Group
Heads of Agreement (non-binding) provides for APA to take ownership subject to Sole FID
2 APA to be responsible for funding and performance of ~$250 million plant upgrade and processing of gas from Sole amp Manta
Plant to be developed according to existing Sole Development Plan Sole gas to be processed under take or pay tariff agreement
3 Cooper Energy to retain 100 of upstream retains ownership of gas processed through Orbost Gas Plant
Estimated project cost for Cooper Energy reduced to ~$355 million and opportunity to realise further value accretion in sell-down post FID
Orbost Gas Plant APA Group 100
APA
bull funds and completes plant upgrade
for Sole
bull operates plant for agreed tariff amp
provides processed sales gas to
EGP
Sole gas
field
COE 100
COE
bull manages upstream
development
bull supplies gas to Orbost
for processing
bull markets the gas
Upstream Midstream
Downstream COE retains ownership of gas
through to point of sale to customers
in EGP
Transaction elements
1refer joint APA Group Cooper Energy announcement 27 February 2017
27
28
3 5
2 7 7 6 7 7 6 5 4
1
1520 20 20 20
2020
20
16
10
6
10 5 5 5 55
55 9
9
25 25 25
18
10
75
1
FY17 FY18 FY19 FY20 FY21 FY22 FY23 FY24 FY25 FY26 FY27 FY28 FY29
Gas production profile by projectcontracted amp uncontracted PJ pa
Manta uncontracted
Sole uncontracted
Sole contracted
Otway uncontracted
Otway contracted
Otway 2P reserves
Casino Henry
Gippsland Gas Project Phase 1
Sole
Gippsland Gas Project Phase 2
Manta
Assumes
bull Sole sanction by March quarter 2017 for March quarter 2019 first Sole gas to plant
bull All contract options in respect of Sole field are exercised
bull Manta subject to Manta 3 appraisal well Manta profile illustrates all Manta gas as uncontracted (including 4 PJ pa option held by
AGL) Manta profile includes 106 PJ 2C resource and additional 10 PJ anticipated
bull Development well required for Casino Henry ~2020
bull No exploration success
29
Reserves
Proved
(1P)
Proved amp Probable
(2P)
Proved Probable amp Possible
(3P)
Cooper1 Otway2 Total Cooper1 Otway2 Total Cooper1 Otway2 Total
Developed
Sales Gas PJ 00 48 48 00 152 152 00 293 293
Oil + Condensate MMbbl 05 00 05 09 00 09 16 00 16
Total developed MMboe2 05 08 13 09 26 35 16 51 67
Undeveloped
Sales Gas PJ 00 344 344 00 451 451 00 627 627
Oil + Condensate PJ 01 00 02 03 11 03 05 01 05
Total undeveloped MMboe2 01 60 61 03 78 81 05 109 113
Total1 MMboe2 07 68 74 11 104 116 21 159 180
Contingent
Resources
1C 2C 3C
Gas Oil Total1 Gas Oil Total Gas Oil Total
PJ MMbbl MMboe2 PJ MMbbl MMboe2 PJ MMbbl MMboe2
Gippsland 2917 40 541 3885 76 744 5336 121 1039
Cooper 02 00 003 03 00 01 06 00 01
Total 1 2919 40 542 3888 76 744 5342 121 1040
Additional information on reserve and resource calculation is provided in the appendices to this document
1 Totals may not reflect arithmetic addition due to rounding The method of aggregation is by arithmetic sum by category As a result the 1P estimate may be conservative and the 3P estimate may be optimistic due to the effects
of arithmetic summation The conversion factor of 1 PJ = 0172 MMboe has been used to convert from Sales Gas (PJ) to Oil Equivalent (MMboe) 2 The reserves revisions include Cooper Energyrsquos share of future crude fuel
usage in the Cooper Basin The estimated fuel usage for PEL 92 is 1P 002 MMbbl 2P 003 MMbbl and 3P 006 MMbbl The estimated fuel usage for the Worrior Field (PPL 207) is 1P 001 MMbbl 2P 002 MMbbl and 3P 003
MMbbl 3 The Otway gas reserves for Casino Henry and Netherby fields are net of fuel gas
1 Totals may not reflect arithmetic addition due to rounding The method of aggregation is by arithmetic sum by category As a result the 1C estimate may be conservative and the 3C estimate may be optimistic due to the
effects of arithmetic summation 2 The conversion factor of 1 PJ = 0172 MMboe has been used to convert from Sales Gas (PJ) to Oil Equivalent (MMboe)
30
General Manager Operations
Iain MacDougallIain MacDougall has more than 25
yearsrsquo experience in the upstream
petroleum exploration and production
sector including senior management
roles within independent operators
and international experience with
Schlumberger In Australia previous
employment includes Stuart
Petroleum as Production and
Engineering Manager and then as
acting CEO prior to the takeover of
Stuart Petroleum by Senex Energy
Managing Director
David MaxwellDavid Maxwell has over 30 yearsrsquo
experience as a senior executive with
companies such as BG Group Woodside
and Santos As Senior Vice President at
QGC a BG Group business he led BGrsquos
entry into Australia its alliance with and
subsequent takeover of QGC Roles at
Woodside included director of gas and
marketing and membership of Woodsidersquos
executive committee
General Manager Exploration
amp Subsurface
Andrew ThomasAndrew Thomas is a successful
geoscientist with over 28 yearsrsquo
experience in oil and gas exploration
and development in companies
including Geoscience Australia
Santos Gulf Canada and Newfield
Exploration At Newfield he was SE
Asia New Ventures Manager and
Exploration Manager for offshore
Sarawak
Executive Director
Hector GordonHector Gordon is a highly
experienced geologist with over 35
yearsrsquo experience in the petroleum
industry Previous roles include
Managing Director Somerton
Energy and a number of senior
management and technical roles at
Beach Energy including Exploration
Manager Chief Operating Officer
and ultimately Chief Executive
Officer
Alison Evans is an experienced
company secretary and corporate legal
counsel with extensive knowledge of
corporate and commercial law in the
resources and energy sectors
Alison has held Company Secretary
and Legal Counsel roles at a number of
minerals and energy companies
including Centrex Metals GTL Energy
and AGL Ms Evans public company
experience is supported by her work at
leading corporate law firms
Company Secretary and
General Counsel
Alison Evans
General Manager Development
Duncan CleggDuncan Clegg has over 35 yearsrsquo
experience in upstream and midstream oil
and gas development including
management positions at Shell and
Woodside leading oil and gas
developments including FPSO subsea
and fixed platforms developments At
Woodside Duncan held several senior
executive positions including Director of
the Australian Business Unit Director of
the African Business Unit and CEO of the
North West Shelf Venture
Eddy Glavas has more than 18 years
experience in business development
finance commercial portfolio
management and strategy including 14
years in the oil and gas sector Prior to
joining Cooper Energy he was
employed by Santos as Manager
Corporate Development with
responsibility for managing multi-
disciplinary teams tasked with mergers
acquisitions partnerships and
divestitures
General Manager Commercial amp
Business Development
Eddy Glavas
Virginia Suttell is a chartered accountant
with more than 20 years experience
including 16 years in publicly listed entities
principally in group finance and secretarial
roles in the resources and media sectors
This has included the role of Chief Financial
Officer and Company Secretary for Monax
Mining Limited and Marmota Energy Limited
from 2007 to 2016 and 2007 to 2015
respectively Other previous appointments
include Group Financial Controller at
Austereo Group Limited
Chief Financial Officer
(Acting)
Virginia Suttell
31
The approach for all reserve and resource calculations is consistent with the definitions and guidelines in the Society of Petroleum Engineers (SPE) 2007 Petroleum Resources Management System (PRMS) The resource estimate methodologies incorporate a range of uncertainty relating to each of the key reservoir input parameters to predict the likely range of outcomes Cooper Energy has completed its own estimation of reserves and contingent resources based on information provided by the permit Operators Beach Energy Ltd Senex Ltd and Santos Ltd and in accordance with the definitions and guidelines in the Society of Petroleum Engineers (SPE) 2007 Petroleum Resources Management System (PRMS) Petroleum Reserves and Contingent Resources are prepared using deterministic and probabilistic methods The method of aggregation for all reserves and contingent resources tables is by arithmetic summation by category Aggregated 1P and 1C estimates may be conservative and aggregated 3P and 3C estimates may be optimistic due to the effects of arithmetic summation Totals may not exactly reflect arithmetic addition due to rounding
The information contained in this report regarding the Cooper Energy reserves and contingent resources is based on and fairly represents information and supporting documentation reviewed by Mr Andrew Thomas who is a full-time employee of Cooper Energy Limited holding the position of General Manager Exploration amp Subsurface holds a Bachelor of Science (Hons) is a member of the American Association of Petroleum Geologists and the Society of Petroleum Engineers is qualified in accordance with ASX listing rule 541 and has consented to the inclusion of this information in the form and context in which it appears
The Cooper Basin totals comprise the probabilistically aggregated PEL 92 project fields and the arithmetic summation of the Worrior project reserves Total includes 005 MMbbl oil reserves used for field fuel The Indonesia totals include removal of non-shareable oil (NSO) and comprise the probabilistically aggregated Tangai-Sukananti KSO project fields Totals are derived by arithmetic summation In the Otway Basin reserves for the Casino Henry and Netherby fields have been assessed by Cooper Energy The Reserves have been assessed using deterministic and probabilistic methodologies for the Waarre Formation at the Casino Henry and Netherby fields This methodology incorporates a range of uncertainty relating to each of the key reservoir input parameters to predict the likely range of outcomes Cooper Energy undertook the following analytical procedures to estimate the Reserves independent interpretation of 3D seismic data analysis of historical production data to assess accessed gas volumes and future production forecasts review of the Operatorrsquos reservoir and production simulation models to define raw gas recovery consistent with existing processing facilities and independent probabilistic Monte Carlo statistical calculations to establish the range of recoverable gas The Otway gas reserves for Casino Henry and Netherby fields are net of fuel gas The date of the Casino Henry and Netherby Reserve Assessment is 27 February 2017
Sole gas field The contingent resource for the Sole field has been re-estimated assuming a two well subsea development plan Advantages of a two well plan compared to the previous single well development includeincreased 2C estimate attributable to accessing previously undeveloped gas and reduced technical risk and enhanced field redundancy providing increased security of supply to the gas processing and gas sales agreements Contingent resources for the Sole field were released to the ASX on 26 November 2015 Post-acquisition of the remaining 50 equity in the Sole gas field the following methodologies were used by Cooper Energy to re-calculate the Sole contingent resource estimate probabilistic simulation modelling for the Kingfish Formation incorporation of a range of uncertainty relating to each of the key reservoir input parameters to predict the likely range of outcomes and review of the reservoir and simulation modelling assuming a two well subsea development The date of the Sole contingent resource assessment is 27 February 2017
Manta gas and oil field Contingent and Prospective Resources have been assessed using deterministic simulation modelling and probabilistic resource estimation for the Intra-Latrobe and Golden Beach Sub-Group in the Manta field This methodology incorporates a range of uncertainty relating to each of the key reservoir input parameters to predict the likely range of outcomes The conversion factor of 1PJ = 0172MMboe has been used to convert from Sales Gas (PJ) to Oil Equivalent (MMboe) Contingent Resources for the Manta Field have been aggregated by arithmetic summation The date of the Manta Contingent Resource assessment is 16 July 2015 and the assessment was announced to the ASX on 16 July 2015 Cooper Energy is not aware of any new information or data that materially affects the information provided in that release and all material assumptions and technical parameters underpinning the assessment provided in the announcement continues to apply
Basker gas and oil field Contingent and Resources have been assessed using deterministic simulation modelling and probabilistic resource estimation for the Intra-Latrobe Sub-Group in the Basker field This methodology incorporates a range of uncertainty relating to each of the key reservoir input parameters to predict the likely range of outcomes The conversion factor of 1PJ = 0172MMboe has been used to convert from Sales Gas (PJ) to Oil Equivalent (MMboe) Contingent Resources for the Basker Field have been aggregated by arithmetic summation The date of the Basker Contingent Resource assessment is 15 August 2014 and the assessment was announced to the ASX on 18 August 2014 Cooper Energy is not aware of any new information or data that materially affects the information provided in that release and all material assumptions and technical parameters underpinning the assessment provided in the announcement continues to apply
32
$ A$ Australian dollars unless specified otherwise
Bbl barrels of oil
boe barrel of oil equivalent
bopd barrel of oil per day
EBITDA earnings before interest tax depreciation and amortisation
FEED Front end engineering and design
kbbls thousand barrels
LTIFR Lost Time Injury Frequency Rate Lost Time Incidents per million man hours worked
MMbbl million barrels of oil
MMboe million barrels of oil equivalent
NOPSEMA National Offshore Petroleum Safety amp Environmental Management Authority
NOPTA National Offshore Petroleum Titles Administrator
NPAT net profit after tax
PEL 92 Joint Venture conducting operations in Western Flank Cooper Basin Petroleum Retention Licences 85 ndash 104 previously encompassed by
the PEL 92 exploration licence
TRCFR Total Recordable Case Frequency Rate Recordable cases per million hours worked
TSR total shareholder return
1P reserves Proved reserves
2P reserves Proved and Probable reserves
3P Proved Probable and Possible reserves
1C 2C 3C high medium and low estimates of contingent resources
- 1WRM Investor presentation March 2017
-
- Slide Number 1
- Disclaimer
- Slide Number 3
- Slide Number 4
- Slide Number 5
- Slide Number 6
- Slide Number 7
- Slide Number 8
- Slide Number 9
- Slide Number 10
- Slide Number 11
- Gold and Silver development asset with a definitive feasibility study (DFS) commenced
- Slide Number 13
- Slide Number 14
- Slide Number 15
- Slide Number 16
- Slide Number 17
- Slide Number 18
- Slide Number 19
- Slide Number 20
- Slide Number 21
- Slide Number 22
- Slide Number 23
- Slide Number 24
- Slide Number 25
- Slide Number 26
- Slide Number 27
- Slide Number 28
- Slide Number 29
- Mount Carrington Resource Statement
- Slide Number 31
- Slide Number 32
- Slide Number 33
- Slide Number 34
- Slide Number 35
- Slide Number 36
- Slide Number 37
-
- 2Aurelia Metals Presentation-Mar 2017-widescreen format
-
- Slide Number 1
- Slide Number 2
- Slide Number 3
- Slide Number 4
- Slide Number 5
- Slide Number 6
- Slide Number 7
- Slide Number 8
- Slide Number 9
- Slide Number 10
- Slide Number 11
- Slide Number 12
- Slide Number 13
- Slide Number 14
- Slide Number 15
- Slide Number 16
- Slide Number 17
- Slide Number 18
- Slide Number 19
- Slide Number 20
- Slide Number 21
-
- 320170321 Presentations Melbourne Mining Club Speaker
-

2
The information in this presentation
bull Is not an offer or recommendation to purchase or subscribe for shares in Cooper Energy Limited or to retain or sell any shares that are
currently held
bull Does not take into account the individual investment objectives or the financial situation of investors
bull Was prepared with due care and attention and is current at the date of the presentation
Actual results may materially vary from any forecasts (where applicable) in this presentation
Before making or varying any investment in shares of Cooper Energy Limited all investors should consider the appropriateness of that
investment in light of their individual investment objectives and financial situation and should seek their own independent professional advice
Qualified petroleum reserves and resources evaluator
This report contains information on petroleum reserves and resources which is based on and fairly represents information and supporting
documentation reviewed by Mr Andrew Thomas who is a full time employee of Cooper Energy Limited holding the position of Exploration
Manager holds a Bachelor of Science (Hons) is a member of the American Association of Petroleum Geologists and the Society of Petroleum
Engineers and is qualified in accordance with ASX listing rule 541 and has consented to the inclusion of this information in the form and context
in which it appears
Rounding
All numbers in this presentation have been rounded As a result some total figures may differ insignificantly from totals obtained from arithmetic
addition of the rounded numbers presented
Reserves and resources calculation
Information on the companyrsquos reserves and resources and their calculation are provided in the appendices to this presentation
Currency
All financial information is expressed in Australian dollars unless otherwise specified
3
Cooper Energy develops and supplies gas to south-east Australia and produces oil from the
western flank of the Cooper Basin
The companyrsquos portfolio features existing gas production 227 PJ of uncontracted gas
and two new gas projects to supply south-east Australia from 2019 onwards backed by long term
contracts with blue chip utility and industrial customers
Existing assets and plans have the company on a 6 year growth trajectory with capacity for
production growth over 20 times FY16 levels
4
Cooper Basin oil
PEL 495
bull Oil production from western flank of Cooper Basin
bull Single gas exploration permit in Otway Basin
bull Poland
bull Romania
bull Indonesia
bull Tunisia
2011 portfolio
5
Otway Basin
bull Builds acreage and technical capability
through merger with Somerton Energy
bull Sub-surface studies reinforce view of
prospectivity
Market
bull Demand and supply-side gas market analysis
bull Commenced engagement with gas buyers
Gippsland Basin
bull Invested in Bass Strait Oil Company which
holds Gippsland permits
bull Technical studies of prospectivity and gas
plays
6
Otway Basin
bull Drilling identifies gas bearing
reservoirs in deep sands Gippsland Basin
bull Acquires 65 interest in Basker Manta Gummy
permits
bull Commenced Manta business case analysis for
supply to south-east Australia
7
Otway Basin
bull Builds understanding of Otway
sub-surface
bull Confirms attraction of offshore
Otway
Gippsland Basin
bull Acquires 50 of Sole gas field
bull Acquires 50 of Orbost Gas Plant
bull Manta business case affirms economic
development opportunity
8
Gippsland Basinbull Sole gas field interest 100
bull Sole gas project FEED completed
bull Orbost Gas Plant 100
bull Manta gas field 100
Otway Basin
bull Acquires Casino Henry Vic P44
Minerva and Minerva Gas Plant
Market
bull O-I Australia gas contract
bull AGL gas contract
bull EnergyAustralia gas
contract
bull Alinta Energy gas
contract
9
Gas contracts
bull 188 PJ contracted from 2017 on
bull EnergyAustralia (Otway amp Sole)
bull AGL Energy (Sole)
bull Alinta Energy (Sole)
bull O-I Australia (Sole)
New gas projects
bull Phase 1 Sole from 2019
ndash Sanction Marchrsquo 17 for March lsquo19 first gas into plant
bull Phase 2 Manta
ndash appraisal well and resource upside
ndash from FY22
bull VIC P44 exploration prospects
Production
bull ~ 7 PJ pa from Casino Henry amp
Minerva1
bull Sold to EnergyAustralia
bull Uncontracted gas to market for
supply from March 18
bull Field life to 2026 (Casino Henry)Plant amp infrastructure
bull Orbost Gas Plant connected to
EGP (subject to APA HoA)
bull Minerva1 Gas Plant (10)
connected to SEA Gas pipeline
bull Patricia Baleen connected to
Orbost and Longtom
1Acquisition of 10 interest in Minerva and Minerva gas plant to be completed
Uncontracted gas
Total of 227 PJ uncontracted in
bull Otway
ndash 52 PJ 2P Casino Henry reserves from March 2018
bull Gippsland
ndash Sole 69 PJ 2C contingent resource uncontracted
ndash Manta 106 PJ 2C contingent resource plus
exploration potential
10
03
Jun-16 Jan-17
FY17 production1
MMboe expected
Gas
Oil
1
49 76
367
668
Jun-16 Jan-17
Contingent resources (2C)12
MMboe
Gas
Oil13
11
104
Jun-16 Jan-17
2P reserves12
MMboe
bull Addition of Otway gas production Jan to Jun 17
bull Gas accounts for 75 of anticipated FY17 production
bull Addition of 60 PJ of Otway Basin gas reserves
bull Gas accounts for 90 of 116 MMboe 2P reserves
bull Australian contingent resources 2C up 79
bull 128 PJ gas contingent resources (2C) added in Gippsland
116
416
744
1Australia only 2 Reserves and Contingent Resources at 1 January 2017 were announced to the ASX on 27 February 2017 and should be read in conjunction with the information provided on the calculation
of Reserves and Contingent Resources provided on page 29 Cooper Energy is not aware of any new information or data that materially affects the information provided in those releases and
all material assumptions and technical parameters underpinning the assessment provided in the announcement continues to apply
11
Forecast 1 south-east Australian gas demand and production
PJ pa
South-east Australia comprises NSW VIC SA and Tasmania
SE Australia demandsup1
1 EnergyQuest Energy Quarterly March 2017
0
10
20
30
40
50
60
70
80
90
100
2017 2018 2019 2020 2021 2022 2023 2024
Cooper Energy gas production profilePJ pa
Manta(100)
Sole (100)
Casino
bull Casino Henry gas contracted to February 2018
bull Casino Henry gas available to contract from March 2018
bull COE may sell down some of Sole Gas Project and Manta post
Sole FID
0
100
200
300
400
500
600
2016 2018 2020 2022 2024 2026 2028 2030 2032 2034 2036
Most certain supply tranche Less certain supply tranche
Least certain supply tranche Southern demand
12Source AEMO
13
1 Assumes
bull Sole sanction by March quarter 2017 for March quarter 2019 first Sole gas
to plant
bull Manta 3 appraisal well
bull Development well required for Casino Henry ~2020
bull Details on slide 26
3 5 1
1520 20 20 20 20 20 20
16102
13
17 11
37 36 36
28
1913
15
10
FY17 FY18 FY19 FY20 FY21 FY22 FY23 FY24 FY25 FY26 FY27 FY28 FY29
Gas production1 from current assets contracted amp uncontractedPJ pa
Uncontracted
Contracted
227 PJ comprises 52 PJ 2P Casino Henry gas and 175 PJ 2C Contingent uncontracted gas from Sole and Manta Profile illustrated includes additional 10 PJ anticipated from Manta Cooper Energy announced Sole Contingent Resources on 27 February 2017 and Manta Contingent Resource 16 July 2015 Cooper Energy is not aware of any new information or data that materially affects the information provided in those releases and all material assumptions and technical parameters underpinning the assessment provided in the announcement continues to apply See notes on page 29 for information on reserves and resources calculation
14
Resource economics
Health amp safety
Environment
CommunityFiscaldividend
SuccessfulSustainable
Value-generating resource
development
Balance not achieved people hurt project collapse uneconomic no community
benefit no fiscal dividend excessive energy
costs
Balance achieved safe environmentally
sound development
cost effective sustainable energy
community benefits
fiscal dividend
15
Casino Henry
bull Sustained growth profile over 6 years
bull Gas accounts for overwhelming majority of production
bull New assets and production profile generates
ndash FY17 production gt2x FY16 production
ndash FY19 production gt5x FY16 production
ndash FY22 production gt20x FY16 production
0
2
4
6
8
10
12
FY15 FY16 FY17 FY18 FY19 FY20 FY21 FY22 FY23 FY24
Production1
MMboe
Sole Gas Project
Manta Gas Project
Casino-Henry
Cooper Basin oil
Assumes1
bull Current equities COE may divest some Gippsland post Sole sanction
bull Sole sanction by March quarter 2017 for March quarter 2019 Sole gas to plant
bull Manta 3 appraisal well
bull Development well required for Casino Henry ~2020
bull No new exploration success
16
Sole FID
bull Financial commitment to project
bull Triggers 43 MMboe uplift in gas reserves
bull Translation of HoA with APA to formal agreement
bull Expected shortly after project sanction
Uncontracted Otway gas
bull Contracting gas to supply from March 2018
bull Expect to secure new agreements in winter 2017 with market reflective price
Operator status
bull Working to appointment as Operator in Gippsland and Otway
bull Enables cost efficiencies and competitive advantage as asset owner and JV participant
Beyond June 2017
bull Cooper Basin assets
bull Divest slice of Gippsland Basin portfolio
bull Manta exploration
13116
~53
Jun-16 Jan-17 June -17Proforma
Uplift in 2P reservesMMboe
Australia only Assumes commitment of Sole gas project provides uplift of
~43 MMboe
1
2
3
4
17
1 Execution of our gas strategy has deliveredCooper Energy has become a supplier and developer of gas for south east Australia at a time of great market need
2 FY17 growth is the first step of larger and sustainable growthReserves and production upgrades in the current year are the initial instalment of a 6 year growth trajectory offering gt 20 times growth in
production from existing assets and equities
3 Integration proceeding management capabilities have been reinforced consistent with growthUpgraded people resources with the addition of proven performance orientated executives integration is proceeding to schedule
4 Sole project stronger and proceeding to final phase financingProject now offering lower risk lower capital cost increased gas and increased returns and value upside for Cooper Energy shareholders
5 Milestones aheadSix months to June 17 is expected to see a number of milestones for further uplift and value transformation
Appendices
20
Key figures
Shares on issue1 6601 mill
Shareholders1 5923
Market capitalisation1 $260 mill
Debt Nil
Current employees 23
Cooper Energy is an independent Australian exploration and
production company
bull Listed in 2002 history of profitable operations and successful
exploration and development
bull Strong balance sheet zero debt
bull Raised new equity capital of c$85 million during 2016
bull Management team and board experienced in growing resource
companies
bull Growth profile extending over 6 years from existing assets and
agreements
59
10
2
29
Share register
Institutional
Corporate
Employees amp Directors
Private
1 As at 20 March 2017
21
Oil exploration amp production
Cooper Basin Western Flank
240000 ndash 280000 1 bbl pa
Operating cost ltA$30bbl
High margin + exploration upside
Gas production amp sales Gas projects amp contracting
Otway Basin Casino Henry amp Minerva
Sales of ~7- 8 PJ pa to EnergyAustralia
Minerva1 gas plant
Production of 15 MMboe pa
Gippsland and Otway Basins
Sole Manta projects Otway uncontracted gas
gt400 PJ gas to be developed or uncontracted
Production uplift of up to 95 MMboe2 pa as
projects come online on top of existing output
1 Subject to completion of transaction2 Based on current equity participation levels
22
Phase 1 Sole
bull 2C Resource1 249 PJ
bull Sanction March 2017
bull Sole gas into plant March 2019
bull Output ~25 PJ pa
bull COE equity 100
Phase 2 Manta
bull 2C Resource1 106 PJ gas3 2 MMbbl liquids
bull Appraisal 2018-19
bull Sanction 2021
bull First gas ~2023
bull Output pa 25 PJ gas 039 MMbbl pa
bull Exploration Manta Deep amp Chimaera
bull COE equity 100
Orbost Gas Plant
bull Existing gas plant
bull Connected to Eastern Gas Pipeline
bull Plant owned amp operated by APA Group (proposed in HoA announced 27217
Longtom(Seven Group 100)
Patricia Baleen (COE 100)
Enabling customersUpstream and Midstream HoA
1 Cooper Energy announced Sole Contingent Resources on 27 February 2017 and Manta Contingent Resource 16 July 2015 Cooper Energy is not aware of any new information or data that materially affects the information provided in those releases and all material
assumptions and technical parameters underpinning the assessment provided in the announcement continues to apply See notes on page 29 for information on reserves and resources calculation
33 km
58 km
65 km
23
Sole Gas Project (VIC L32 COE100 Operator )
bull 249 PJ 2C Contingent Resource1
bull 20 PJ pa contracted gas contracts with O-I Australia AGL Energy Alinta Energy
EnergyAustralia
bull Sanction expected by March 2017 for Sole gas into plant by March 2019
Manta (VIC RL131415 COE 100)
bull 106 PJ 2C Contingent Resource plus 3 million barrels liquids1
bull economic business case identified subject to appraisal
bull prospective resource upside to be tested amp appraisal well expected 2018
Patricia-Baleen (VICL21 COE 100)
bull Non-operating field shut in
bull Strategic significance as access point for Orbost Gas Plant for other fields
1 Reserves and Contingent Resources at 1 January 2017 were announced to the ASX on 27 February 2017 and an announcement on Manta Contingent Resource was announced on 16 July 2015 The resources information displayed should be read in conjunction with the information provided on the calculation of Reserves and Contingent Resources provided on page 29 Cooper Energy is not aware of any new information or data that materially affects the information provided in those releases and all material assumptions and technical parameters underpinning the assessment provided in the announcement continues to apply
24
Key Assets
bull Casino Henry gas project (50)
bull Minerva gas field and plant (10 interest)1
bull VICP44 exploration permit
Production (COE share effective from 1 January 2017)
bull Casino Henry (VICRL11 amp 12) 7 PJ pa supplied to EnergyAustralia
under contract expiring March 2018
bull Minerva (VICL22)~ 1 PJ pa (expected to deplete by mid 2017)
Plans
bull Preparation for operatorship transfer likely June 2017
bull Marketing of uncontracted gas available for sale from March 2018
bull Casino Henry development well
1Acquisition of 10 interest in Minerva agreed with Santos Ltd is subject to completion
25
bull First half production of 013 MMbbl vs 017 in H1 FY16
bull Production impacted by suspension of drilling in low oil price FY16
bull Operating costs reduced from A$2992bbl to A$2928bbl
bull Drilling resumed in FY17 with 4 wells drilled 2 successful 2 P amp A
bull No further drilling planned for FY17
bull Producing interests
ndash PEL 92 25 interest (Beach Energy 75 amp Operator)
ndash PEL 93 30 interest (Senex Energy 70 amp Operator)
11 10
16 15
7 4
3530
FY16 H1 FY17
Production costs amp netback Direct cost A$ per barrel
NetbackRoyaltyTransportOperatingCosts per
bbl down 2
26
bull Take or pay gas
processing agreement
1 Cooper Energy to sell Orbost Gas Plant to APA Group
Heads of Agreement (non-binding) provides for APA to take ownership subject to Sole FID
2 APA to be responsible for funding and performance of ~$250 million plant upgrade and processing of gas from Sole amp Manta
Plant to be developed according to existing Sole Development Plan Sole gas to be processed under take or pay tariff agreement
3 Cooper Energy to retain 100 of upstream retains ownership of gas processed through Orbost Gas Plant
Estimated project cost for Cooper Energy reduced to ~$355 million and opportunity to realise further value accretion in sell-down post FID
Orbost Gas Plant APA Group 100
APA
bull funds and completes plant upgrade
for Sole
bull operates plant for agreed tariff amp
provides processed sales gas to
EGP
Sole gas
field
COE 100
COE
bull manages upstream
development
bull supplies gas to Orbost
for processing
bull markets the gas
Upstream Midstream
Downstream COE retains ownership of gas
through to point of sale to customers
in EGP
Transaction elements
1refer joint APA Group Cooper Energy announcement 27 February 2017
27
28
3 5
2 7 7 6 7 7 6 5 4
1
1520 20 20 20
2020
20
16
10
6
10 5 5 5 55
55 9
9
25 25 25
18
10
75
1
FY17 FY18 FY19 FY20 FY21 FY22 FY23 FY24 FY25 FY26 FY27 FY28 FY29
Gas production profile by projectcontracted amp uncontracted PJ pa
Manta uncontracted
Sole uncontracted
Sole contracted
Otway uncontracted
Otway contracted
Otway 2P reserves
Casino Henry
Gippsland Gas Project Phase 1
Sole
Gippsland Gas Project Phase 2
Manta
Assumes
bull Sole sanction by March quarter 2017 for March quarter 2019 first Sole gas to plant
bull All contract options in respect of Sole field are exercised
bull Manta subject to Manta 3 appraisal well Manta profile illustrates all Manta gas as uncontracted (including 4 PJ pa option held by
AGL) Manta profile includes 106 PJ 2C resource and additional 10 PJ anticipated
bull Development well required for Casino Henry ~2020
bull No exploration success
29
Reserves
Proved
(1P)
Proved amp Probable
(2P)
Proved Probable amp Possible
(3P)
Cooper1 Otway2 Total Cooper1 Otway2 Total Cooper1 Otway2 Total
Developed
Sales Gas PJ 00 48 48 00 152 152 00 293 293
Oil + Condensate MMbbl 05 00 05 09 00 09 16 00 16
Total developed MMboe2 05 08 13 09 26 35 16 51 67
Undeveloped
Sales Gas PJ 00 344 344 00 451 451 00 627 627
Oil + Condensate PJ 01 00 02 03 11 03 05 01 05
Total undeveloped MMboe2 01 60 61 03 78 81 05 109 113
Total1 MMboe2 07 68 74 11 104 116 21 159 180
Contingent
Resources
1C 2C 3C
Gas Oil Total1 Gas Oil Total Gas Oil Total
PJ MMbbl MMboe2 PJ MMbbl MMboe2 PJ MMbbl MMboe2
Gippsland 2917 40 541 3885 76 744 5336 121 1039
Cooper 02 00 003 03 00 01 06 00 01
Total 1 2919 40 542 3888 76 744 5342 121 1040
Additional information on reserve and resource calculation is provided in the appendices to this document
1 Totals may not reflect arithmetic addition due to rounding The method of aggregation is by arithmetic sum by category As a result the 1P estimate may be conservative and the 3P estimate may be optimistic due to the effects
of arithmetic summation The conversion factor of 1 PJ = 0172 MMboe has been used to convert from Sales Gas (PJ) to Oil Equivalent (MMboe) 2 The reserves revisions include Cooper Energyrsquos share of future crude fuel
usage in the Cooper Basin The estimated fuel usage for PEL 92 is 1P 002 MMbbl 2P 003 MMbbl and 3P 006 MMbbl The estimated fuel usage for the Worrior Field (PPL 207) is 1P 001 MMbbl 2P 002 MMbbl and 3P 003
MMbbl 3 The Otway gas reserves for Casino Henry and Netherby fields are net of fuel gas
1 Totals may not reflect arithmetic addition due to rounding The method of aggregation is by arithmetic sum by category As a result the 1C estimate may be conservative and the 3C estimate may be optimistic due to the
effects of arithmetic summation 2 The conversion factor of 1 PJ = 0172 MMboe has been used to convert from Sales Gas (PJ) to Oil Equivalent (MMboe)
30
General Manager Operations
Iain MacDougallIain MacDougall has more than 25
yearsrsquo experience in the upstream
petroleum exploration and production
sector including senior management
roles within independent operators
and international experience with
Schlumberger In Australia previous
employment includes Stuart
Petroleum as Production and
Engineering Manager and then as
acting CEO prior to the takeover of
Stuart Petroleum by Senex Energy
Managing Director
David MaxwellDavid Maxwell has over 30 yearsrsquo
experience as a senior executive with
companies such as BG Group Woodside
and Santos As Senior Vice President at
QGC a BG Group business he led BGrsquos
entry into Australia its alliance with and
subsequent takeover of QGC Roles at
Woodside included director of gas and
marketing and membership of Woodsidersquos
executive committee
General Manager Exploration
amp Subsurface
Andrew ThomasAndrew Thomas is a successful
geoscientist with over 28 yearsrsquo
experience in oil and gas exploration
and development in companies
including Geoscience Australia
Santos Gulf Canada and Newfield
Exploration At Newfield he was SE
Asia New Ventures Manager and
Exploration Manager for offshore
Sarawak
Executive Director
Hector GordonHector Gordon is a highly
experienced geologist with over 35
yearsrsquo experience in the petroleum
industry Previous roles include
Managing Director Somerton
Energy and a number of senior
management and technical roles at
Beach Energy including Exploration
Manager Chief Operating Officer
and ultimately Chief Executive
Officer
Alison Evans is an experienced
company secretary and corporate legal
counsel with extensive knowledge of
corporate and commercial law in the
resources and energy sectors
Alison has held Company Secretary
and Legal Counsel roles at a number of
minerals and energy companies
including Centrex Metals GTL Energy
and AGL Ms Evans public company
experience is supported by her work at
leading corporate law firms
Company Secretary and
General Counsel
Alison Evans
General Manager Development
Duncan CleggDuncan Clegg has over 35 yearsrsquo
experience in upstream and midstream oil
and gas development including
management positions at Shell and
Woodside leading oil and gas
developments including FPSO subsea
and fixed platforms developments At
Woodside Duncan held several senior
executive positions including Director of
the Australian Business Unit Director of
the African Business Unit and CEO of the
North West Shelf Venture
Eddy Glavas has more than 18 years
experience in business development
finance commercial portfolio
management and strategy including 14
years in the oil and gas sector Prior to
joining Cooper Energy he was
employed by Santos as Manager
Corporate Development with
responsibility for managing multi-
disciplinary teams tasked with mergers
acquisitions partnerships and
divestitures
General Manager Commercial amp
Business Development
Eddy Glavas
Virginia Suttell is a chartered accountant
with more than 20 years experience
including 16 years in publicly listed entities
principally in group finance and secretarial
roles in the resources and media sectors
This has included the role of Chief Financial
Officer and Company Secretary for Monax
Mining Limited and Marmota Energy Limited
from 2007 to 2016 and 2007 to 2015
respectively Other previous appointments
include Group Financial Controller at
Austereo Group Limited
Chief Financial Officer
(Acting)
Virginia Suttell
31
The approach for all reserve and resource calculations is consistent with the definitions and guidelines in the Society of Petroleum Engineers (SPE) 2007 Petroleum Resources Management System (PRMS) The resource estimate methodologies incorporate a range of uncertainty relating to each of the key reservoir input parameters to predict the likely range of outcomes Cooper Energy has completed its own estimation of reserves and contingent resources based on information provided by the permit Operators Beach Energy Ltd Senex Ltd and Santos Ltd and in accordance with the definitions and guidelines in the Society of Petroleum Engineers (SPE) 2007 Petroleum Resources Management System (PRMS) Petroleum Reserves and Contingent Resources are prepared using deterministic and probabilistic methods The method of aggregation for all reserves and contingent resources tables is by arithmetic summation by category Aggregated 1P and 1C estimates may be conservative and aggregated 3P and 3C estimates may be optimistic due to the effects of arithmetic summation Totals may not exactly reflect arithmetic addition due to rounding
The information contained in this report regarding the Cooper Energy reserves and contingent resources is based on and fairly represents information and supporting documentation reviewed by Mr Andrew Thomas who is a full-time employee of Cooper Energy Limited holding the position of General Manager Exploration amp Subsurface holds a Bachelor of Science (Hons) is a member of the American Association of Petroleum Geologists and the Society of Petroleum Engineers is qualified in accordance with ASX listing rule 541 and has consented to the inclusion of this information in the form and context in which it appears
The Cooper Basin totals comprise the probabilistically aggregated PEL 92 project fields and the arithmetic summation of the Worrior project reserves Total includes 005 MMbbl oil reserves used for field fuel The Indonesia totals include removal of non-shareable oil (NSO) and comprise the probabilistically aggregated Tangai-Sukananti KSO project fields Totals are derived by arithmetic summation In the Otway Basin reserves for the Casino Henry and Netherby fields have been assessed by Cooper Energy The Reserves have been assessed using deterministic and probabilistic methodologies for the Waarre Formation at the Casino Henry and Netherby fields This methodology incorporates a range of uncertainty relating to each of the key reservoir input parameters to predict the likely range of outcomes Cooper Energy undertook the following analytical procedures to estimate the Reserves independent interpretation of 3D seismic data analysis of historical production data to assess accessed gas volumes and future production forecasts review of the Operatorrsquos reservoir and production simulation models to define raw gas recovery consistent with existing processing facilities and independent probabilistic Monte Carlo statistical calculations to establish the range of recoverable gas The Otway gas reserves for Casino Henry and Netherby fields are net of fuel gas The date of the Casino Henry and Netherby Reserve Assessment is 27 February 2017
Sole gas field The contingent resource for the Sole field has been re-estimated assuming a two well subsea development plan Advantages of a two well plan compared to the previous single well development includeincreased 2C estimate attributable to accessing previously undeveloped gas and reduced technical risk and enhanced field redundancy providing increased security of supply to the gas processing and gas sales agreements Contingent resources for the Sole field were released to the ASX on 26 November 2015 Post-acquisition of the remaining 50 equity in the Sole gas field the following methodologies were used by Cooper Energy to re-calculate the Sole contingent resource estimate probabilistic simulation modelling for the Kingfish Formation incorporation of a range of uncertainty relating to each of the key reservoir input parameters to predict the likely range of outcomes and review of the reservoir and simulation modelling assuming a two well subsea development The date of the Sole contingent resource assessment is 27 February 2017
Manta gas and oil field Contingent and Prospective Resources have been assessed using deterministic simulation modelling and probabilistic resource estimation for the Intra-Latrobe and Golden Beach Sub-Group in the Manta field This methodology incorporates a range of uncertainty relating to each of the key reservoir input parameters to predict the likely range of outcomes The conversion factor of 1PJ = 0172MMboe has been used to convert from Sales Gas (PJ) to Oil Equivalent (MMboe) Contingent Resources for the Manta Field have been aggregated by arithmetic summation The date of the Manta Contingent Resource assessment is 16 July 2015 and the assessment was announced to the ASX on 16 July 2015 Cooper Energy is not aware of any new information or data that materially affects the information provided in that release and all material assumptions and technical parameters underpinning the assessment provided in the announcement continues to apply
Basker gas and oil field Contingent and Resources have been assessed using deterministic simulation modelling and probabilistic resource estimation for the Intra-Latrobe Sub-Group in the Basker field This methodology incorporates a range of uncertainty relating to each of the key reservoir input parameters to predict the likely range of outcomes The conversion factor of 1PJ = 0172MMboe has been used to convert from Sales Gas (PJ) to Oil Equivalent (MMboe) Contingent Resources for the Basker Field have been aggregated by arithmetic summation The date of the Basker Contingent Resource assessment is 15 August 2014 and the assessment was announced to the ASX on 18 August 2014 Cooper Energy is not aware of any new information or data that materially affects the information provided in that release and all material assumptions and technical parameters underpinning the assessment provided in the announcement continues to apply
32
$ A$ Australian dollars unless specified otherwise
Bbl barrels of oil
boe barrel of oil equivalent
bopd barrel of oil per day
EBITDA earnings before interest tax depreciation and amortisation
FEED Front end engineering and design
kbbls thousand barrels
LTIFR Lost Time Injury Frequency Rate Lost Time Incidents per million man hours worked
MMbbl million barrels of oil
MMboe million barrels of oil equivalent
NOPSEMA National Offshore Petroleum Safety amp Environmental Management Authority
NOPTA National Offshore Petroleum Titles Administrator
NPAT net profit after tax
PEL 92 Joint Venture conducting operations in Western Flank Cooper Basin Petroleum Retention Licences 85 ndash 104 previously encompassed by
the PEL 92 exploration licence
TRCFR Total Recordable Case Frequency Rate Recordable cases per million hours worked
TSR total shareholder return
1P reserves Proved reserves
2P reserves Proved and Probable reserves
3P Proved Probable and Possible reserves
1C 2C 3C high medium and low estimates of contingent resources
- 1WRM Investor presentation March 2017
-
- Slide Number 1
- Disclaimer
- Slide Number 3
- Slide Number 4
- Slide Number 5
- Slide Number 6
- Slide Number 7
- Slide Number 8
- Slide Number 9
- Slide Number 10
- Slide Number 11
- Gold and Silver development asset with a definitive feasibility study (DFS) commenced
- Slide Number 13
- Slide Number 14
- Slide Number 15
- Slide Number 16
- Slide Number 17
- Slide Number 18
- Slide Number 19
- Slide Number 20
- Slide Number 21
- Slide Number 22
- Slide Number 23
- Slide Number 24
- Slide Number 25
- Slide Number 26
- Slide Number 27
- Slide Number 28
- Slide Number 29
- Mount Carrington Resource Statement
- Slide Number 31
- Slide Number 32
- Slide Number 33
- Slide Number 34
- Slide Number 35
- Slide Number 36
- Slide Number 37
-
- 2Aurelia Metals Presentation-Mar 2017-widescreen format
-
- Slide Number 1
- Slide Number 2
- Slide Number 3
- Slide Number 4
- Slide Number 5
- Slide Number 6
- Slide Number 7
- Slide Number 8
- Slide Number 9
- Slide Number 10
- Slide Number 11
- Slide Number 12
- Slide Number 13
- Slide Number 14
- Slide Number 15
- Slide Number 16
- Slide Number 17
- Slide Number 18
- Slide Number 19
- Slide Number 20
- Slide Number 21
-
- 320170321 Presentations Melbourne Mining Club Speaker
-

3
Cooper Energy develops and supplies gas to south-east Australia and produces oil from the
western flank of the Cooper Basin
The companyrsquos portfolio features existing gas production 227 PJ of uncontracted gas
and two new gas projects to supply south-east Australia from 2019 onwards backed by long term
contracts with blue chip utility and industrial customers
Existing assets and plans have the company on a 6 year growth trajectory with capacity for
production growth over 20 times FY16 levels
4
Cooper Basin oil
PEL 495
bull Oil production from western flank of Cooper Basin
bull Single gas exploration permit in Otway Basin
bull Poland
bull Romania
bull Indonesia
bull Tunisia
2011 portfolio
5
Otway Basin
bull Builds acreage and technical capability
through merger with Somerton Energy
bull Sub-surface studies reinforce view of
prospectivity
Market
bull Demand and supply-side gas market analysis
bull Commenced engagement with gas buyers
Gippsland Basin
bull Invested in Bass Strait Oil Company which
holds Gippsland permits
bull Technical studies of prospectivity and gas
plays
6
Otway Basin
bull Drilling identifies gas bearing
reservoirs in deep sands Gippsland Basin
bull Acquires 65 interest in Basker Manta Gummy
permits
bull Commenced Manta business case analysis for
supply to south-east Australia
7
Otway Basin
bull Builds understanding of Otway
sub-surface
bull Confirms attraction of offshore
Otway
Gippsland Basin
bull Acquires 50 of Sole gas field
bull Acquires 50 of Orbost Gas Plant
bull Manta business case affirms economic
development opportunity
8
Gippsland Basinbull Sole gas field interest 100
bull Sole gas project FEED completed
bull Orbost Gas Plant 100
bull Manta gas field 100
Otway Basin
bull Acquires Casino Henry Vic P44
Minerva and Minerva Gas Plant
Market
bull O-I Australia gas contract
bull AGL gas contract
bull EnergyAustralia gas
contract
bull Alinta Energy gas
contract
9
Gas contracts
bull 188 PJ contracted from 2017 on
bull EnergyAustralia (Otway amp Sole)
bull AGL Energy (Sole)
bull Alinta Energy (Sole)
bull O-I Australia (Sole)
New gas projects
bull Phase 1 Sole from 2019
ndash Sanction Marchrsquo 17 for March lsquo19 first gas into plant
bull Phase 2 Manta
ndash appraisal well and resource upside
ndash from FY22
bull VIC P44 exploration prospects
Production
bull ~ 7 PJ pa from Casino Henry amp
Minerva1
bull Sold to EnergyAustralia
bull Uncontracted gas to market for
supply from March 18
bull Field life to 2026 (Casino Henry)Plant amp infrastructure
bull Orbost Gas Plant connected to
EGP (subject to APA HoA)
bull Minerva1 Gas Plant (10)
connected to SEA Gas pipeline
bull Patricia Baleen connected to
Orbost and Longtom
1Acquisition of 10 interest in Minerva and Minerva gas plant to be completed
Uncontracted gas
Total of 227 PJ uncontracted in
bull Otway
ndash 52 PJ 2P Casino Henry reserves from March 2018
bull Gippsland
ndash Sole 69 PJ 2C contingent resource uncontracted
ndash Manta 106 PJ 2C contingent resource plus
exploration potential
10
03
Jun-16 Jan-17
FY17 production1
MMboe expected
Gas
Oil
1
49 76
367
668
Jun-16 Jan-17
Contingent resources (2C)12
MMboe
Gas
Oil13
11
104
Jun-16 Jan-17
2P reserves12
MMboe
bull Addition of Otway gas production Jan to Jun 17
bull Gas accounts for 75 of anticipated FY17 production
bull Addition of 60 PJ of Otway Basin gas reserves
bull Gas accounts for 90 of 116 MMboe 2P reserves
bull Australian contingent resources 2C up 79
bull 128 PJ gas contingent resources (2C) added in Gippsland
116
416
744
1Australia only 2 Reserves and Contingent Resources at 1 January 2017 were announced to the ASX on 27 February 2017 and should be read in conjunction with the information provided on the calculation
of Reserves and Contingent Resources provided on page 29 Cooper Energy is not aware of any new information or data that materially affects the information provided in those releases and
all material assumptions and technical parameters underpinning the assessment provided in the announcement continues to apply
11
Forecast 1 south-east Australian gas demand and production
PJ pa
South-east Australia comprises NSW VIC SA and Tasmania
SE Australia demandsup1
1 EnergyQuest Energy Quarterly March 2017
0
10
20
30
40
50
60
70
80
90
100
2017 2018 2019 2020 2021 2022 2023 2024
Cooper Energy gas production profilePJ pa
Manta(100)
Sole (100)
Casino
bull Casino Henry gas contracted to February 2018
bull Casino Henry gas available to contract from March 2018
bull COE may sell down some of Sole Gas Project and Manta post
Sole FID
0
100
200
300
400
500
600
2016 2018 2020 2022 2024 2026 2028 2030 2032 2034 2036
Most certain supply tranche Less certain supply tranche
Least certain supply tranche Southern demand
12Source AEMO
13
1 Assumes
bull Sole sanction by March quarter 2017 for March quarter 2019 first Sole gas
to plant
bull Manta 3 appraisal well
bull Development well required for Casino Henry ~2020
bull Details on slide 26
3 5 1
1520 20 20 20 20 20 20
16102
13
17 11
37 36 36
28
1913
15
10
FY17 FY18 FY19 FY20 FY21 FY22 FY23 FY24 FY25 FY26 FY27 FY28 FY29
Gas production1 from current assets contracted amp uncontractedPJ pa
Uncontracted
Contracted
227 PJ comprises 52 PJ 2P Casino Henry gas and 175 PJ 2C Contingent uncontracted gas from Sole and Manta Profile illustrated includes additional 10 PJ anticipated from Manta Cooper Energy announced Sole Contingent Resources on 27 February 2017 and Manta Contingent Resource 16 July 2015 Cooper Energy is not aware of any new information or data that materially affects the information provided in those releases and all material assumptions and technical parameters underpinning the assessment provided in the announcement continues to apply See notes on page 29 for information on reserves and resources calculation
14
Resource economics
Health amp safety
Environment
CommunityFiscaldividend
SuccessfulSustainable
Value-generating resource
development
Balance not achieved people hurt project collapse uneconomic no community
benefit no fiscal dividend excessive energy
costs
Balance achieved safe environmentally
sound development
cost effective sustainable energy
community benefits
fiscal dividend
15
Casino Henry
bull Sustained growth profile over 6 years
bull Gas accounts for overwhelming majority of production
bull New assets and production profile generates
ndash FY17 production gt2x FY16 production
ndash FY19 production gt5x FY16 production
ndash FY22 production gt20x FY16 production
0
2
4
6
8
10
12
FY15 FY16 FY17 FY18 FY19 FY20 FY21 FY22 FY23 FY24
Production1
MMboe
Sole Gas Project
Manta Gas Project
Casino-Henry
Cooper Basin oil
Assumes1
bull Current equities COE may divest some Gippsland post Sole sanction
bull Sole sanction by March quarter 2017 for March quarter 2019 Sole gas to plant
bull Manta 3 appraisal well
bull Development well required for Casino Henry ~2020
bull No new exploration success
16
Sole FID
bull Financial commitment to project
bull Triggers 43 MMboe uplift in gas reserves
bull Translation of HoA with APA to formal agreement
bull Expected shortly after project sanction
Uncontracted Otway gas
bull Contracting gas to supply from March 2018
bull Expect to secure new agreements in winter 2017 with market reflective price
Operator status
bull Working to appointment as Operator in Gippsland and Otway
bull Enables cost efficiencies and competitive advantage as asset owner and JV participant
Beyond June 2017
bull Cooper Basin assets
bull Divest slice of Gippsland Basin portfolio
bull Manta exploration
13116
~53
Jun-16 Jan-17 June -17Proforma
Uplift in 2P reservesMMboe
Australia only Assumes commitment of Sole gas project provides uplift of
~43 MMboe
1
2
3
4
17
1 Execution of our gas strategy has deliveredCooper Energy has become a supplier and developer of gas for south east Australia at a time of great market need
2 FY17 growth is the first step of larger and sustainable growthReserves and production upgrades in the current year are the initial instalment of a 6 year growth trajectory offering gt 20 times growth in
production from existing assets and equities
3 Integration proceeding management capabilities have been reinforced consistent with growthUpgraded people resources with the addition of proven performance orientated executives integration is proceeding to schedule
4 Sole project stronger and proceeding to final phase financingProject now offering lower risk lower capital cost increased gas and increased returns and value upside for Cooper Energy shareholders
5 Milestones aheadSix months to June 17 is expected to see a number of milestones for further uplift and value transformation
Appendices
20
Key figures
Shares on issue1 6601 mill
Shareholders1 5923
Market capitalisation1 $260 mill
Debt Nil
Current employees 23
Cooper Energy is an independent Australian exploration and
production company
bull Listed in 2002 history of profitable operations and successful
exploration and development
bull Strong balance sheet zero debt
bull Raised new equity capital of c$85 million during 2016
bull Management team and board experienced in growing resource
companies
bull Growth profile extending over 6 years from existing assets and
agreements
59
10
2
29
Share register
Institutional
Corporate
Employees amp Directors
Private
1 As at 20 March 2017
21
Oil exploration amp production
Cooper Basin Western Flank
240000 ndash 280000 1 bbl pa
Operating cost ltA$30bbl
High margin + exploration upside
Gas production amp sales Gas projects amp contracting
Otway Basin Casino Henry amp Minerva
Sales of ~7- 8 PJ pa to EnergyAustralia
Minerva1 gas plant
Production of 15 MMboe pa
Gippsland and Otway Basins
Sole Manta projects Otway uncontracted gas
gt400 PJ gas to be developed or uncontracted
Production uplift of up to 95 MMboe2 pa as
projects come online on top of existing output
1 Subject to completion of transaction2 Based on current equity participation levels
22
Phase 1 Sole
bull 2C Resource1 249 PJ
bull Sanction March 2017
bull Sole gas into plant March 2019
bull Output ~25 PJ pa
bull COE equity 100
Phase 2 Manta
bull 2C Resource1 106 PJ gas3 2 MMbbl liquids
bull Appraisal 2018-19
bull Sanction 2021
bull First gas ~2023
bull Output pa 25 PJ gas 039 MMbbl pa
bull Exploration Manta Deep amp Chimaera
bull COE equity 100
Orbost Gas Plant
bull Existing gas plant
bull Connected to Eastern Gas Pipeline
bull Plant owned amp operated by APA Group (proposed in HoA announced 27217
Longtom(Seven Group 100)
Patricia Baleen (COE 100)
Enabling customersUpstream and Midstream HoA
1 Cooper Energy announced Sole Contingent Resources on 27 February 2017 and Manta Contingent Resource 16 July 2015 Cooper Energy is not aware of any new information or data that materially affects the information provided in those releases and all material
assumptions and technical parameters underpinning the assessment provided in the announcement continues to apply See notes on page 29 for information on reserves and resources calculation
33 km
58 km
65 km
23
Sole Gas Project (VIC L32 COE100 Operator )
bull 249 PJ 2C Contingent Resource1
bull 20 PJ pa contracted gas contracts with O-I Australia AGL Energy Alinta Energy
EnergyAustralia
bull Sanction expected by March 2017 for Sole gas into plant by March 2019
Manta (VIC RL131415 COE 100)
bull 106 PJ 2C Contingent Resource plus 3 million barrels liquids1
bull economic business case identified subject to appraisal
bull prospective resource upside to be tested amp appraisal well expected 2018
Patricia-Baleen (VICL21 COE 100)
bull Non-operating field shut in
bull Strategic significance as access point for Orbost Gas Plant for other fields
1 Reserves and Contingent Resources at 1 January 2017 were announced to the ASX on 27 February 2017 and an announcement on Manta Contingent Resource was announced on 16 July 2015 The resources information displayed should be read in conjunction with the information provided on the calculation of Reserves and Contingent Resources provided on page 29 Cooper Energy is not aware of any new information or data that materially affects the information provided in those releases and all material assumptions and technical parameters underpinning the assessment provided in the announcement continues to apply
24
Key Assets
bull Casino Henry gas project (50)
bull Minerva gas field and plant (10 interest)1
bull VICP44 exploration permit
Production (COE share effective from 1 January 2017)
bull Casino Henry (VICRL11 amp 12) 7 PJ pa supplied to EnergyAustralia
under contract expiring March 2018
bull Minerva (VICL22)~ 1 PJ pa (expected to deplete by mid 2017)
Plans
bull Preparation for operatorship transfer likely June 2017
bull Marketing of uncontracted gas available for sale from March 2018
bull Casino Henry development well
1Acquisition of 10 interest in Minerva agreed with Santos Ltd is subject to completion
25
bull First half production of 013 MMbbl vs 017 in H1 FY16
bull Production impacted by suspension of drilling in low oil price FY16
bull Operating costs reduced from A$2992bbl to A$2928bbl
bull Drilling resumed in FY17 with 4 wells drilled 2 successful 2 P amp A
bull No further drilling planned for FY17
bull Producing interests
ndash PEL 92 25 interest (Beach Energy 75 amp Operator)
ndash PEL 93 30 interest (Senex Energy 70 amp Operator)
11 10
16 15
7 4
3530
FY16 H1 FY17
Production costs amp netback Direct cost A$ per barrel
NetbackRoyaltyTransportOperatingCosts per
bbl down 2
26
bull Take or pay gas
processing agreement
1 Cooper Energy to sell Orbost Gas Plant to APA Group
Heads of Agreement (non-binding) provides for APA to take ownership subject to Sole FID
2 APA to be responsible for funding and performance of ~$250 million plant upgrade and processing of gas from Sole amp Manta
Plant to be developed according to existing Sole Development Plan Sole gas to be processed under take or pay tariff agreement
3 Cooper Energy to retain 100 of upstream retains ownership of gas processed through Orbost Gas Plant
Estimated project cost for Cooper Energy reduced to ~$355 million and opportunity to realise further value accretion in sell-down post FID
Orbost Gas Plant APA Group 100
APA
bull funds and completes plant upgrade
for Sole
bull operates plant for agreed tariff amp
provides processed sales gas to
EGP
Sole gas
field
COE 100
COE
bull manages upstream
development
bull supplies gas to Orbost
for processing
bull markets the gas
Upstream Midstream
Downstream COE retains ownership of gas
through to point of sale to customers
in EGP
Transaction elements
1refer joint APA Group Cooper Energy announcement 27 February 2017
27
28
3 5
2 7 7 6 7 7 6 5 4
1
1520 20 20 20
2020
20
16
10
6
10 5 5 5 55
55 9
9
25 25 25
18
10
75
1
FY17 FY18 FY19 FY20 FY21 FY22 FY23 FY24 FY25 FY26 FY27 FY28 FY29
Gas production profile by projectcontracted amp uncontracted PJ pa
Manta uncontracted
Sole uncontracted
Sole contracted
Otway uncontracted
Otway contracted
Otway 2P reserves
Casino Henry
Gippsland Gas Project Phase 1
Sole
Gippsland Gas Project Phase 2
Manta
Assumes
bull Sole sanction by March quarter 2017 for March quarter 2019 first Sole gas to plant
bull All contract options in respect of Sole field are exercised
bull Manta subject to Manta 3 appraisal well Manta profile illustrates all Manta gas as uncontracted (including 4 PJ pa option held by
AGL) Manta profile includes 106 PJ 2C resource and additional 10 PJ anticipated
bull Development well required for Casino Henry ~2020
bull No exploration success
29
Reserves
Proved
(1P)
Proved amp Probable
(2P)
Proved Probable amp Possible
(3P)
Cooper1 Otway2 Total Cooper1 Otway2 Total Cooper1 Otway2 Total
Developed
Sales Gas PJ 00 48 48 00 152 152 00 293 293
Oil + Condensate MMbbl 05 00 05 09 00 09 16 00 16
Total developed MMboe2 05 08 13 09 26 35 16 51 67
Undeveloped
Sales Gas PJ 00 344 344 00 451 451 00 627 627
Oil + Condensate PJ 01 00 02 03 11 03 05 01 05
Total undeveloped MMboe2 01 60 61 03 78 81 05 109 113
Total1 MMboe2 07 68 74 11 104 116 21 159 180
Contingent
Resources
1C 2C 3C
Gas Oil Total1 Gas Oil Total Gas Oil Total
PJ MMbbl MMboe2 PJ MMbbl MMboe2 PJ MMbbl MMboe2
Gippsland 2917 40 541 3885 76 744 5336 121 1039
Cooper 02 00 003 03 00 01 06 00 01
Total 1 2919 40 542 3888 76 744 5342 121 1040
Additional information on reserve and resource calculation is provided in the appendices to this document
1 Totals may not reflect arithmetic addition due to rounding The method of aggregation is by arithmetic sum by category As a result the 1P estimate may be conservative and the 3P estimate may be optimistic due to the effects
of arithmetic summation The conversion factor of 1 PJ = 0172 MMboe has been used to convert from Sales Gas (PJ) to Oil Equivalent (MMboe) 2 The reserves revisions include Cooper Energyrsquos share of future crude fuel
usage in the Cooper Basin The estimated fuel usage for PEL 92 is 1P 002 MMbbl 2P 003 MMbbl and 3P 006 MMbbl The estimated fuel usage for the Worrior Field (PPL 207) is 1P 001 MMbbl 2P 002 MMbbl and 3P 003
MMbbl 3 The Otway gas reserves for Casino Henry and Netherby fields are net of fuel gas
1 Totals may not reflect arithmetic addition due to rounding The method of aggregation is by arithmetic sum by category As a result the 1C estimate may be conservative and the 3C estimate may be optimistic due to the
effects of arithmetic summation 2 The conversion factor of 1 PJ = 0172 MMboe has been used to convert from Sales Gas (PJ) to Oil Equivalent (MMboe)
30
General Manager Operations
Iain MacDougallIain MacDougall has more than 25
yearsrsquo experience in the upstream
petroleum exploration and production
sector including senior management
roles within independent operators
and international experience with
Schlumberger In Australia previous
employment includes Stuart
Petroleum as Production and
Engineering Manager and then as
acting CEO prior to the takeover of
Stuart Petroleum by Senex Energy
Managing Director
David MaxwellDavid Maxwell has over 30 yearsrsquo
experience as a senior executive with
companies such as BG Group Woodside
and Santos As Senior Vice President at
QGC a BG Group business he led BGrsquos
entry into Australia its alliance with and
subsequent takeover of QGC Roles at
Woodside included director of gas and
marketing and membership of Woodsidersquos
executive committee
General Manager Exploration
amp Subsurface
Andrew ThomasAndrew Thomas is a successful
geoscientist with over 28 yearsrsquo
experience in oil and gas exploration
and development in companies
including Geoscience Australia
Santos Gulf Canada and Newfield
Exploration At Newfield he was SE
Asia New Ventures Manager and
Exploration Manager for offshore
Sarawak
Executive Director
Hector GordonHector Gordon is a highly
experienced geologist with over 35
yearsrsquo experience in the petroleum
industry Previous roles include
Managing Director Somerton
Energy and a number of senior
management and technical roles at
Beach Energy including Exploration
Manager Chief Operating Officer
and ultimately Chief Executive
Officer
Alison Evans is an experienced
company secretary and corporate legal
counsel with extensive knowledge of
corporate and commercial law in the
resources and energy sectors
Alison has held Company Secretary
and Legal Counsel roles at a number of
minerals and energy companies
including Centrex Metals GTL Energy
and AGL Ms Evans public company
experience is supported by her work at
leading corporate law firms
Company Secretary and
General Counsel
Alison Evans
General Manager Development
Duncan CleggDuncan Clegg has over 35 yearsrsquo
experience in upstream and midstream oil
and gas development including
management positions at Shell and
Woodside leading oil and gas
developments including FPSO subsea
and fixed platforms developments At
Woodside Duncan held several senior
executive positions including Director of
the Australian Business Unit Director of
the African Business Unit and CEO of the
North West Shelf Venture
Eddy Glavas has more than 18 years
experience in business development
finance commercial portfolio
management and strategy including 14
years in the oil and gas sector Prior to
joining Cooper Energy he was
employed by Santos as Manager
Corporate Development with
responsibility for managing multi-
disciplinary teams tasked with mergers
acquisitions partnerships and
divestitures
General Manager Commercial amp
Business Development
Eddy Glavas
Virginia Suttell is a chartered accountant
with more than 20 years experience
including 16 years in publicly listed entities
principally in group finance and secretarial
roles in the resources and media sectors
This has included the role of Chief Financial
Officer and Company Secretary for Monax
Mining Limited and Marmota Energy Limited
from 2007 to 2016 and 2007 to 2015
respectively Other previous appointments
include Group Financial Controller at
Austereo Group Limited
Chief Financial Officer
(Acting)
Virginia Suttell
31
The approach for all reserve and resource calculations is consistent with the definitions and guidelines in the Society of Petroleum Engineers (SPE) 2007 Petroleum Resources Management System (PRMS) The resource estimate methodologies incorporate a range of uncertainty relating to each of the key reservoir input parameters to predict the likely range of outcomes Cooper Energy has completed its own estimation of reserves and contingent resources based on information provided by the permit Operators Beach Energy Ltd Senex Ltd and Santos Ltd and in accordance with the definitions and guidelines in the Society of Petroleum Engineers (SPE) 2007 Petroleum Resources Management System (PRMS) Petroleum Reserves and Contingent Resources are prepared using deterministic and probabilistic methods The method of aggregation for all reserves and contingent resources tables is by arithmetic summation by category Aggregated 1P and 1C estimates may be conservative and aggregated 3P and 3C estimates may be optimistic due to the effects of arithmetic summation Totals may not exactly reflect arithmetic addition due to rounding
The information contained in this report regarding the Cooper Energy reserves and contingent resources is based on and fairly represents information and supporting documentation reviewed by Mr Andrew Thomas who is a full-time employee of Cooper Energy Limited holding the position of General Manager Exploration amp Subsurface holds a Bachelor of Science (Hons) is a member of the American Association of Petroleum Geologists and the Society of Petroleum Engineers is qualified in accordance with ASX listing rule 541 and has consented to the inclusion of this information in the form and context in which it appears
The Cooper Basin totals comprise the probabilistically aggregated PEL 92 project fields and the arithmetic summation of the Worrior project reserves Total includes 005 MMbbl oil reserves used for field fuel The Indonesia totals include removal of non-shareable oil (NSO) and comprise the probabilistically aggregated Tangai-Sukananti KSO project fields Totals are derived by arithmetic summation In the Otway Basin reserves for the Casino Henry and Netherby fields have been assessed by Cooper Energy The Reserves have been assessed using deterministic and probabilistic methodologies for the Waarre Formation at the Casino Henry and Netherby fields This methodology incorporates a range of uncertainty relating to each of the key reservoir input parameters to predict the likely range of outcomes Cooper Energy undertook the following analytical procedures to estimate the Reserves independent interpretation of 3D seismic data analysis of historical production data to assess accessed gas volumes and future production forecasts review of the Operatorrsquos reservoir and production simulation models to define raw gas recovery consistent with existing processing facilities and independent probabilistic Monte Carlo statistical calculations to establish the range of recoverable gas The Otway gas reserves for Casino Henry and Netherby fields are net of fuel gas The date of the Casino Henry and Netherby Reserve Assessment is 27 February 2017
Sole gas field The contingent resource for the Sole field has been re-estimated assuming a two well subsea development plan Advantages of a two well plan compared to the previous single well development includeincreased 2C estimate attributable to accessing previously undeveloped gas and reduced technical risk and enhanced field redundancy providing increased security of supply to the gas processing and gas sales agreements Contingent resources for the Sole field were released to the ASX on 26 November 2015 Post-acquisition of the remaining 50 equity in the Sole gas field the following methodologies were used by Cooper Energy to re-calculate the Sole contingent resource estimate probabilistic simulation modelling for the Kingfish Formation incorporation of a range of uncertainty relating to each of the key reservoir input parameters to predict the likely range of outcomes and review of the reservoir and simulation modelling assuming a two well subsea development The date of the Sole contingent resource assessment is 27 February 2017
Manta gas and oil field Contingent and Prospective Resources have been assessed using deterministic simulation modelling and probabilistic resource estimation for the Intra-Latrobe and Golden Beach Sub-Group in the Manta field This methodology incorporates a range of uncertainty relating to each of the key reservoir input parameters to predict the likely range of outcomes The conversion factor of 1PJ = 0172MMboe has been used to convert from Sales Gas (PJ) to Oil Equivalent (MMboe) Contingent Resources for the Manta Field have been aggregated by arithmetic summation The date of the Manta Contingent Resource assessment is 16 July 2015 and the assessment was announced to the ASX on 16 July 2015 Cooper Energy is not aware of any new information or data that materially affects the information provided in that release and all material assumptions and technical parameters underpinning the assessment provided in the announcement continues to apply
Basker gas and oil field Contingent and Resources have been assessed using deterministic simulation modelling and probabilistic resource estimation for the Intra-Latrobe Sub-Group in the Basker field This methodology incorporates a range of uncertainty relating to each of the key reservoir input parameters to predict the likely range of outcomes The conversion factor of 1PJ = 0172MMboe has been used to convert from Sales Gas (PJ) to Oil Equivalent (MMboe) Contingent Resources for the Basker Field have been aggregated by arithmetic summation The date of the Basker Contingent Resource assessment is 15 August 2014 and the assessment was announced to the ASX on 18 August 2014 Cooper Energy is not aware of any new information or data that materially affects the information provided in that release and all material assumptions and technical parameters underpinning the assessment provided in the announcement continues to apply
32
$ A$ Australian dollars unless specified otherwise
Bbl barrels of oil
boe barrel of oil equivalent
bopd barrel of oil per day
EBITDA earnings before interest tax depreciation and amortisation
FEED Front end engineering and design
kbbls thousand barrels
LTIFR Lost Time Injury Frequency Rate Lost Time Incidents per million man hours worked
MMbbl million barrels of oil
MMboe million barrels of oil equivalent
NOPSEMA National Offshore Petroleum Safety amp Environmental Management Authority
NOPTA National Offshore Petroleum Titles Administrator
NPAT net profit after tax
PEL 92 Joint Venture conducting operations in Western Flank Cooper Basin Petroleum Retention Licences 85 ndash 104 previously encompassed by
the PEL 92 exploration licence
TRCFR Total Recordable Case Frequency Rate Recordable cases per million hours worked
TSR total shareholder return
1P reserves Proved reserves
2P reserves Proved and Probable reserves
3P Proved Probable and Possible reserves
1C 2C 3C high medium and low estimates of contingent resources
- 1WRM Investor presentation March 2017
-
- Slide Number 1
- Disclaimer
- Slide Number 3
- Slide Number 4
- Slide Number 5
- Slide Number 6
- Slide Number 7
- Slide Number 8
- Slide Number 9
- Slide Number 10
- Slide Number 11
- Gold and Silver development asset with a definitive feasibility study (DFS) commenced
- Slide Number 13
- Slide Number 14
- Slide Number 15
- Slide Number 16
- Slide Number 17
- Slide Number 18
- Slide Number 19
- Slide Number 20
- Slide Number 21
- Slide Number 22
- Slide Number 23
- Slide Number 24
- Slide Number 25
- Slide Number 26
- Slide Number 27
- Slide Number 28
- Slide Number 29
- Mount Carrington Resource Statement
- Slide Number 31
- Slide Number 32
- Slide Number 33
- Slide Number 34
- Slide Number 35
- Slide Number 36
- Slide Number 37
-
- 2Aurelia Metals Presentation-Mar 2017-widescreen format
-
- Slide Number 1
- Slide Number 2
- Slide Number 3
- Slide Number 4
- Slide Number 5
- Slide Number 6
- Slide Number 7
- Slide Number 8
- Slide Number 9
- Slide Number 10
- Slide Number 11
- Slide Number 12
- Slide Number 13
- Slide Number 14
- Slide Number 15
- Slide Number 16
- Slide Number 17
- Slide Number 18
- Slide Number 19
- Slide Number 20
- Slide Number 21
-
- 320170321 Presentations Melbourne Mining Club Speaker
-

4
Cooper Basin oil
PEL 495
bull Oil production from western flank of Cooper Basin
bull Single gas exploration permit in Otway Basin
bull Poland
bull Romania
bull Indonesia
bull Tunisia
2011 portfolio
5
Otway Basin
bull Builds acreage and technical capability
through merger with Somerton Energy
bull Sub-surface studies reinforce view of
prospectivity
Market
bull Demand and supply-side gas market analysis
bull Commenced engagement with gas buyers
Gippsland Basin
bull Invested in Bass Strait Oil Company which
holds Gippsland permits
bull Technical studies of prospectivity and gas
plays
6
Otway Basin
bull Drilling identifies gas bearing
reservoirs in deep sands Gippsland Basin
bull Acquires 65 interest in Basker Manta Gummy
permits
bull Commenced Manta business case analysis for
supply to south-east Australia
7
Otway Basin
bull Builds understanding of Otway
sub-surface
bull Confirms attraction of offshore
Otway
Gippsland Basin
bull Acquires 50 of Sole gas field
bull Acquires 50 of Orbost Gas Plant
bull Manta business case affirms economic
development opportunity
8
Gippsland Basinbull Sole gas field interest 100
bull Sole gas project FEED completed
bull Orbost Gas Plant 100
bull Manta gas field 100
Otway Basin
bull Acquires Casino Henry Vic P44
Minerva and Minerva Gas Plant
Market
bull O-I Australia gas contract
bull AGL gas contract
bull EnergyAustralia gas
contract
bull Alinta Energy gas
contract
9
Gas contracts
bull 188 PJ contracted from 2017 on
bull EnergyAustralia (Otway amp Sole)
bull AGL Energy (Sole)
bull Alinta Energy (Sole)
bull O-I Australia (Sole)
New gas projects
bull Phase 1 Sole from 2019
ndash Sanction Marchrsquo 17 for March lsquo19 first gas into plant
bull Phase 2 Manta
ndash appraisal well and resource upside
ndash from FY22
bull VIC P44 exploration prospects
Production
bull ~ 7 PJ pa from Casino Henry amp
Minerva1
bull Sold to EnergyAustralia
bull Uncontracted gas to market for
supply from March 18
bull Field life to 2026 (Casino Henry)Plant amp infrastructure
bull Orbost Gas Plant connected to
EGP (subject to APA HoA)
bull Minerva1 Gas Plant (10)
connected to SEA Gas pipeline
bull Patricia Baleen connected to
Orbost and Longtom
1Acquisition of 10 interest in Minerva and Minerva gas plant to be completed
Uncontracted gas
Total of 227 PJ uncontracted in
bull Otway
ndash 52 PJ 2P Casino Henry reserves from March 2018
bull Gippsland
ndash Sole 69 PJ 2C contingent resource uncontracted
ndash Manta 106 PJ 2C contingent resource plus
exploration potential
10
03
Jun-16 Jan-17
FY17 production1
MMboe expected
Gas
Oil
1
49 76
367
668
Jun-16 Jan-17
Contingent resources (2C)12
MMboe
Gas
Oil13
11
104
Jun-16 Jan-17
2P reserves12
MMboe
bull Addition of Otway gas production Jan to Jun 17
bull Gas accounts for 75 of anticipated FY17 production
bull Addition of 60 PJ of Otway Basin gas reserves
bull Gas accounts for 90 of 116 MMboe 2P reserves
bull Australian contingent resources 2C up 79
bull 128 PJ gas contingent resources (2C) added in Gippsland
116
416
744
1Australia only 2 Reserves and Contingent Resources at 1 January 2017 were announced to the ASX on 27 February 2017 and should be read in conjunction with the information provided on the calculation
of Reserves and Contingent Resources provided on page 29 Cooper Energy is not aware of any new information or data that materially affects the information provided in those releases and
all material assumptions and technical parameters underpinning the assessment provided in the announcement continues to apply
11
Forecast 1 south-east Australian gas demand and production
PJ pa
South-east Australia comprises NSW VIC SA and Tasmania
SE Australia demandsup1
1 EnergyQuest Energy Quarterly March 2017
0
10
20
30
40
50
60
70
80
90
100
2017 2018 2019 2020 2021 2022 2023 2024
Cooper Energy gas production profilePJ pa
Manta(100)
Sole (100)
Casino
bull Casino Henry gas contracted to February 2018
bull Casino Henry gas available to contract from March 2018
bull COE may sell down some of Sole Gas Project and Manta post
Sole FID
0
100
200
300
400
500
600
2016 2018 2020 2022 2024 2026 2028 2030 2032 2034 2036
Most certain supply tranche Less certain supply tranche
Least certain supply tranche Southern demand
12Source AEMO
13
1 Assumes
bull Sole sanction by March quarter 2017 for March quarter 2019 first Sole gas
to plant
bull Manta 3 appraisal well
bull Development well required for Casino Henry ~2020
bull Details on slide 26
3 5 1
1520 20 20 20 20 20 20
16102
13
17 11
37 36 36
28
1913
15
10
FY17 FY18 FY19 FY20 FY21 FY22 FY23 FY24 FY25 FY26 FY27 FY28 FY29
Gas production1 from current assets contracted amp uncontractedPJ pa
Uncontracted
Contracted
227 PJ comprises 52 PJ 2P Casino Henry gas and 175 PJ 2C Contingent uncontracted gas from Sole and Manta Profile illustrated includes additional 10 PJ anticipated from Manta Cooper Energy announced Sole Contingent Resources on 27 February 2017 and Manta Contingent Resource 16 July 2015 Cooper Energy is not aware of any new information or data that materially affects the information provided in those releases and all material assumptions and technical parameters underpinning the assessment provided in the announcement continues to apply See notes on page 29 for information on reserves and resources calculation
14
Resource economics
Health amp safety
Environment
CommunityFiscaldividend
SuccessfulSustainable
Value-generating resource
development
Balance not achieved people hurt project collapse uneconomic no community
benefit no fiscal dividend excessive energy
costs
Balance achieved safe environmentally
sound development
cost effective sustainable energy
community benefits
fiscal dividend
15
Casino Henry
bull Sustained growth profile over 6 years
bull Gas accounts for overwhelming majority of production
bull New assets and production profile generates
ndash FY17 production gt2x FY16 production
ndash FY19 production gt5x FY16 production
ndash FY22 production gt20x FY16 production
0
2
4
6
8
10
12
FY15 FY16 FY17 FY18 FY19 FY20 FY21 FY22 FY23 FY24
Production1
MMboe
Sole Gas Project
Manta Gas Project
Casino-Henry
Cooper Basin oil
Assumes1
bull Current equities COE may divest some Gippsland post Sole sanction
bull Sole sanction by March quarter 2017 for March quarter 2019 Sole gas to plant
bull Manta 3 appraisal well
bull Development well required for Casino Henry ~2020
bull No new exploration success
16
Sole FID
bull Financial commitment to project
bull Triggers 43 MMboe uplift in gas reserves
bull Translation of HoA with APA to formal agreement
bull Expected shortly after project sanction
Uncontracted Otway gas
bull Contracting gas to supply from March 2018
bull Expect to secure new agreements in winter 2017 with market reflective price
Operator status
bull Working to appointment as Operator in Gippsland and Otway
bull Enables cost efficiencies and competitive advantage as asset owner and JV participant
Beyond June 2017
bull Cooper Basin assets
bull Divest slice of Gippsland Basin portfolio
bull Manta exploration
13116
~53
Jun-16 Jan-17 June -17Proforma
Uplift in 2P reservesMMboe
Australia only Assumes commitment of Sole gas project provides uplift of
~43 MMboe
1
2
3
4
17
1 Execution of our gas strategy has deliveredCooper Energy has become a supplier and developer of gas for south east Australia at a time of great market need
2 FY17 growth is the first step of larger and sustainable growthReserves and production upgrades in the current year are the initial instalment of a 6 year growth trajectory offering gt 20 times growth in
production from existing assets and equities
3 Integration proceeding management capabilities have been reinforced consistent with growthUpgraded people resources with the addition of proven performance orientated executives integration is proceeding to schedule
4 Sole project stronger and proceeding to final phase financingProject now offering lower risk lower capital cost increased gas and increased returns and value upside for Cooper Energy shareholders
5 Milestones aheadSix months to June 17 is expected to see a number of milestones for further uplift and value transformation
Appendices
20
Key figures
Shares on issue1 6601 mill
Shareholders1 5923
Market capitalisation1 $260 mill
Debt Nil
Current employees 23
Cooper Energy is an independent Australian exploration and
production company
bull Listed in 2002 history of profitable operations and successful
exploration and development
bull Strong balance sheet zero debt
bull Raised new equity capital of c$85 million during 2016
bull Management team and board experienced in growing resource
companies
bull Growth profile extending over 6 years from existing assets and
agreements
59
10
2
29
Share register
Institutional
Corporate
Employees amp Directors
Private
1 As at 20 March 2017
21
Oil exploration amp production
Cooper Basin Western Flank
240000 ndash 280000 1 bbl pa
Operating cost ltA$30bbl
High margin + exploration upside
Gas production amp sales Gas projects amp contracting
Otway Basin Casino Henry amp Minerva
Sales of ~7- 8 PJ pa to EnergyAustralia
Minerva1 gas plant
Production of 15 MMboe pa
Gippsland and Otway Basins
Sole Manta projects Otway uncontracted gas
gt400 PJ gas to be developed or uncontracted
Production uplift of up to 95 MMboe2 pa as
projects come online on top of existing output
1 Subject to completion of transaction2 Based on current equity participation levels
22
Phase 1 Sole
bull 2C Resource1 249 PJ
bull Sanction March 2017
bull Sole gas into plant March 2019
bull Output ~25 PJ pa
bull COE equity 100
Phase 2 Manta
bull 2C Resource1 106 PJ gas3 2 MMbbl liquids
bull Appraisal 2018-19
bull Sanction 2021
bull First gas ~2023
bull Output pa 25 PJ gas 039 MMbbl pa
bull Exploration Manta Deep amp Chimaera
bull COE equity 100
Orbost Gas Plant
bull Existing gas plant
bull Connected to Eastern Gas Pipeline
bull Plant owned amp operated by APA Group (proposed in HoA announced 27217
Longtom(Seven Group 100)
Patricia Baleen (COE 100)
Enabling customersUpstream and Midstream HoA
1 Cooper Energy announced Sole Contingent Resources on 27 February 2017 and Manta Contingent Resource 16 July 2015 Cooper Energy is not aware of any new information or data that materially affects the information provided in those releases and all material
assumptions and technical parameters underpinning the assessment provided in the announcement continues to apply See notes on page 29 for information on reserves and resources calculation
33 km
58 km
65 km
23
Sole Gas Project (VIC L32 COE100 Operator )
bull 249 PJ 2C Contingent Resource1
bull 20 PJ pa contracted gas contracts with O-I Australia AGL Energy Alinta Energy
EnergyAustralia
bull Sanction expected by March 2017 for Sole gas into plant by March 2019
Manta (VIC RL131415 COE 100)
bull 106 PJ 2C Contingent Resource plus 3 million barrels liquids1
bull economic business case identified subject to appraisal
bull prospective resource upside to be tested amp appraisal well expected 2018
Patricia-Baleen (VICL21 COE 100)
bull Non-operating field shut in
bull Strategic significance as access point for Orbost Gas Plant for other fields
1 Reserves and Contingent Resources at 1 January 2017 were announced to the ASX on 27 February 2017 and an announcement on Manta Contingent Resource was announced on 16 July 2015 The resources information displayed should be read in conjunction with the information provided on the calculation of Reserves and Contingent Resources provided on page 29 Cooper Energy is not aware of any new information or data that materially affects the information provided in those releases and all material assumptions and technical parameters underpinning the assessment provided in the announcement continues to apply
24
Key Assets
bull Casino Henry gas project (50)
bull Minerva gas field and plant (10 interest)1
bull VICP44 exploration permit
Production (COE share effective from 1 January 2017)
bull Casino Henry (VICRL11 amp 12) 7 PJ pa supplied to EnergyAustralia
under contract expiring March 2018
bull Minerva (VICL22)~ 1 PJ pa (expected to deplete by mid 2017)
Plans
bull Preparation for operatorship transfer likely June 2017
bull Marketing of uncontracted gas available for sale from March 2018
bull Casino Henry development well
1Acquisition of 10 interest in Minerva agreed with Santos Ltd is subject to completion
25
bull First half production of 013 MMbbl vs 017 in H1 FY16
bull Production impacted by suspension of drilling in low oil price FY16
bull Operating costs reduced from A$2992bbl to A$2928bbl
bull Drilling resumed in FY17 with 4 wells drilled 2 successful 2 P amp A
bull No further drilling planned for FY17
bull Producing interests
ndash PEL 92 25 interest (Beach Energy 75 amp Operator)
ndash PEL 93 30 interest (Senex Energy 70 amp Operator)
11 10
16 15
7 4
3530
FY16 H1 FY17
Production costs amp netback Direct cost A$ per barrel
NetbackRoyaltyTransportOperatingCosts per
bbl down 2
26
bull Take or pay gas
processing agreement
1 Cooper Energy to sell Orbost Gas Plant to APA Group
Heads of Agreement (non-binding) provides for APA to take ownership subject to Sole FID
2 APA to be responsible for funding and performance of ~$250 million plant upgrade and processing of gas from Sole amp Manta
Plant to be developed according to existing Sole Development Plan Sole gas to be processed under take or pay tariff agreement
3 Cooper Energy to retain 100 of upstream retains ownership of gas processed through Orbost Gas Plant
Estimated project cost for Cooper Energy reduced to ~$355 million and opportunity to realise further value accretion in sell-down post FID
Orbost Gas Plant APA Group 100
APA
bull funds and completes plant upgrade
for Sole
bull operates plant for agreed tariff amp
provides processed sales gas to
EGP
Sole gas
field
COE 100
COE
bull manages upstream
development
bull supplies gas to Orbost
for processing
bull markets the gas
Upstream Midstream
Downstream COE retains ownership of gas
through to point of sale to customers
in EGP
Transaction elements
1refer joint APA Group Cooper Energy announcement 27 February 2017
27
28
3 5
2 7 7 6 7 7 6 5 4
1
1520 20 20 20
2020
20
16
10
6
10 5 5 5 55
55 9
9
25 25 25
18
10
75
1
FY17 FY18 FY19 FY20 FY21 FY22 FY23 FY24 FY25 FY26 FY27 FY28 FY29
Gas production profile by projectcontracted amp uncontracted PJ pa
Manta uncontracted
Sole uncontracted
Sole contracted
Otway uncontracted
Otway contracted
Otway 2P reserves
Casino Henry
Gippsland Gas Project Phase 1
Sole
Gippsland Gas Project Phase 2
Manta
Assumes
bull Sole sanction by March quarter 2017 for March quarter 2019 first Sole gas to plant
bull All contract options in respect of Sole field are exercised
bull Manta subject to Manta 3 appraisal well Manta profile illustrates all Manta gas as uncontracted (including 4 PJ pa option held by
AGL) Manta profile includes 106 PJ 2C resource and additional 10 PJ anticipated
bull Development well required for Casino Henry ~2020
bull No exploration success
29
Reserves
Proved
(1P)
Proved amp Probable
(2P)
Proved Probable amp Possible
(3P)
Cooper1 Otway2 Total Cooper1 Otway2 Total Cooper1 Otway2 Total
Developed
Sales Gas PJ 00 48 48 00 152 152 00 293 293
Oil + Condensate MMbbl 05 00 05 09 00 09 16 00 16
Total developed MMboe2 05 08 13 09 26 35 16 51 67
Undeveloped
Sales Gas PJ 00 344 344 00 451 451 00 627 627
Oil + Condensate PJ 01 00 02 03 11 03 05 01 05
Total undeveloped MMboe2 01 60 61 03 78 81 05 109 113
Total1 MMboe2 07 68 74 11 104 116 21 159 180
Contingent
Resources
1C 2C 3C
Gas Oil Total1 Gas Oil Total Gas Oil Total
PJ MMbbl MMboe2 PJ MMbbl MMboe2 PJ MMbbl MMboe2
Gippsland 2917 40 541 3885 76 744 5336 121 1039
Cooper 02 00 003 03 00 01 06 00 01
Total 1 2919 40 542 3888 76 744 5342 121 1040
Additional information on reserve and resource calculation is provided in the appendices to this document
1 Totals may not reflect arithmetic addition due to rounding The method of aggregation is by arithmetic sum by category As a result the 1P estimate may be conservative and the 3P estimate may be optimistic due to the effects
of arithmetic summation The conversion factor of 1 PJ = 0172 MMboe has been used to convert from Sales Gas (PJ) to Oil Equivalent (MMboe) 2 The reserves revisions include Cooper Energyrsquos share of future crude fuel
usage in the Cooper Basin The estimated fuel usage for PEL 92 is 1P 002 MMbbl 2P 003 MMbbl and 3P 006 MMbbl The estimated fuel usage for the Worrior Field (PPL 207) is 1P 001 MMbbl 2P 002 MMbbl and 3P 003
MMbbl 3 The Otway gas reserves for Casino Henry and Netherby fields are net of fuel gas
1 Totals may not reflect arithmetic addition due to rounding The method of aggregation is by arithmetic sum by category As a result the 1C estimate may be conservative and the 3C estimate may be optimistic due to the
effects of arithmetic summation 2 The conversion factor of 1 PJ = 0172 MMboe has been used to convert from Sales Gas (PJ) to Oil Equivalent (MMboe)
30
General Manager Operations
Iain MacDougallIain MacDougall has more than 25
yearsrsquo experience in the upstream
petroleum exploration and production
sector including senior management
roles within independent operators
and international experience with
Schlumberger In Australia previous
employment includes Stuart
Petroleum as Production and
Engineering Manager and then as
acting CEO prior to the takeover of
Stuart Petroleum by Senex Energy
Managing Director
David MaxwellDavid Maxwell has over 30 yearsrsquo
experience as a senior executive with
companies such as BG Group Woodside
and Santos As Senior Vice President at
QGC a BG Group business he led BGrsquos
entry into Australia its alliance with and
subsequent takeover of QGC Roles at
Woodside included director of gas and
marketing and membership of Woodsidersquos
executive committee
General Manager Exploration
amp Subsurface
Andrew ThomasAndrew Thomas is a successful
geoscientist with over 28 yearsrsquo
experience in oil and gas exploration
and development in companies
including Geoscience Australia
Santos Gulf Canada and Newfield
Exploration At Newfield he was SE
Asia New Ventures Manager and
Exploration Manager for offshore
Sarawak
Executive Director
Hector GordonHector Gordon is a highly
experienced geologist with over 35
yearsrsquo experience in the petroleum
industry Previous roles include
Managing Director Somerton
Energy and a number of senior
management and technical roles at
Beach Energy including Exploration
Manager Chief Operating Officer
and ultimately Chief Executive
Officer
Alison Evans is an experienced
company secretary and corporate legal
counsel with extensive knowledge of
corporate and commercial law in the
resources and energy sectors
Alison has held Company Secretary
and Legal Counsel roles at a number of
minerals and energy companies
including Centrex Metals GTL Energy
and AGL Ms Evans public company
experience is supported by her work at
leading corporate law firms
Company Secretary and
General Counsel
Alison Evans
General Manager Development
Duncan CleggDuncan Clegg has over 35 yearsrsquo
experience in upstream and midstream oil
and gas development including
management positions at Shell and
Woodside leading oil and gas
developments including FPSO subsea
and fixed platforms developments At
Woodside Duncan held several senior
executive positions including Director of
the Australian Business Unit Director of
the African Business Unit and CEO of the
North West Shelf Venture
Eddy Glavas has more than 18 years
experience in business development
finance commercial portfolio
management and strategy including 14
years in the oil and gas sector Prior to
joining Cooper Energy he was
employed by Santos as Manager
Corporate Development with
responsibility for managing multi-
disciplinary teams tasked with mergers
acquisitions partnerships and
divestitures
General Manager Commercial amp
Business Development
Eddy Glavas
Virginia Suttell is a chartered accountant
with more than 20 years experience
including 16 years in publicly listed entities
principally in group finance and secretarial
roles in the resources and media sectors
This has included the role of Chief Financial
Officer and Company Secretary for Monax
Mining Limited and Marmota Energy Limited
from 2007 to 2016 and 2007 to 2015
respectively Other previous appointments
include Group Financial Controller at
Austereo Group Limited
Chief Financial Officer
(Acting)
Virginia Suttell
31
The approach for all reserve and resource calculations is consistent with the definitions and guidelines in the Society of Petroleum Engineers (SPE) 2007 Petroleum Resources Management System (PRMS) The resource estimate methodologies incorporate a range of uncertainty relating to each of the key reservoir input parameters to predict the likely range of outcomes Cooper Energy has completed its own estimation of reserves and contingent resources based on information provided by the permit Operators Beach Energy Ltd Senex Ltd and Santos Ltd and in accordance with the definitions and guidelines in the Society of Petroleum Engineers (SPE) 2007 Petroleum Resources Management System (PRMS) Petroleum Reserves and Contingent Resources are prepared using deterministic and probabilistic methods The method of aggregation for all reserves and contingent resources tables is by arithmetic summation by category Aggregated 1P and 1C estimates may be conservative and aggregated 3P and 3C estimates may be optimistic due to the effects of arithmetic summation Totals may not exactly reflect arithmetic addition due to rounding
The information contained in this report regarding the Cooper Energy reserves and contingent resources is based on and fairly represents information and supporting documentation reviewed by Mr Andrew Thomas who is a full-time employee of Cooper Energy Limited holding the position of General Manager Exploration amp Subsurface holds a Bachelor of Science (Hons) is a member of the American Association of Petroleum Geologists and the Society of Petroleum Engineers is qualified in accordance with ASX listing rule 541 and has consented to the inclusion of this information in the form and context in which it appears
The Cooper Basin totals comprise the probabilistically aggregated PEL 92 project fields and the arithmetic summation of the Worrior project reserves Total includes 005 MMbbl oil reserves used for field fuel The Indonesia totals include removal of non-shareable oil (NSO) and comprise the probabilistically aggregated Tangai-Sukananti KSO project fields Totals are derived by arithmetic summation In the Otway Basin reserves for the Casino Henry and Netherby fields have been assessed by Cooper Energy The Reserves have been assessed using deterministic and probabilistic methodologies for the Waarre Formation at the Casino Henry and Netherby fields This methodology incorporates a range of uncertainty relating to each of the key reservoir input parameters to predict the likely range of outcomes Cooper Energy undertook the following analytical procedures to estimate the Reserves independent interpretation of 3D seismic data analysis of historical production data to assess accessed gas volumes and future production forecasts review of the Operatorrsquos reservoir and production simulation models to define raw gas recovery consistent with existing processing facilities and independent probabilistic Monte Carlo statistical calculations to establish the range of recoverable gas The Otway gas reserves for Casino Henry and Netherby fields are net of fuel gas The date of the Casino Henry and Netherby Reserve Assessment is 27 February 2017
Sole gas field The contingent resource for the Sole field has been re-estimated assuming a two well subsea development plan Advantages of a two well plan compared to the previous single well development includeincreased 2C estimate attributable to accessing previously undeveloped gas and reduced technical risk and enhanced field redundancy providing increased security of supply to the gas processing and gas sales agreements Contingent resources for the Sole field were released to the ASX on 26 November 2015 Post-acquisition of the remaining 50 equity in the Sole gas field the following methodologies were used by Cooper Energy to re-calculate the Sole contingent resource estimate probabilistic simulation modelling for the Kingfish Formation incorporation of a range of uncertainty relating to each of the key reservoir input parameters to predict the likely range of outcomes and review of the reservoir and simulation modelling assuming a two well subsea development The date of the Sole contingent resource assessment is 27 February 2017
Manta gas and oil field Contingent and Prospective Resources have been assessed using deterministic simulation modelling and probabilistic resource estimation for the Intra-Latrobe and Golden Beach Sub-Group in the Manta field This methodology incorporates a range of uncertainty relating to each of the key reservoir input parameters to predict the likely range of outcomes The conversion factor of 1PJ = 0172MMboe has been used to convert from Sales Gas (PJ) to Oil Equivalent (MMboe) Contingent Resources for the Manta Field have been aggregated by arithmetic summation The date of the Manta Contingent Resource assessment is 16 July 2015 and the assessment was announced to the ASX on 16 July 2015 Cooper Energy is not aware of any new information or data that materially affects the information provided in that release and all material assumptions and technical parameters underpinning the assessment provided in the announcement continues to apply
Basker gas and oil field Contingent and Resources have been assessed using deterministic simulation modelling and probabilistic resource estimation for the Intra-Latrobe Sub-Group in the Basker field This methodology incorporates a range of uncertainty relating to each of the key reservoir input parameters to predict the likely range of outcomes The conversion factor of 1PJ = 0172MMboe has been used to convert from Sales Gas (PJ) to Oil Equivalent (MMboe) Contingent Resources for the Basker Field have been aggregated by arithmetic summation The date of the Basker Contingent Resource assessment is 15 August 2014 and the assessment was announced to the ASX on 18 August 2014 Cooper Energy is not aware of any new information or data that materially affects the information provided in that release and all material assumptions and technical parameters underpinning the assessment provided in the announcement continues to apply
32
$ A$ Australian dollars unless specified otherwise
Bbl barrels of oil
boe barrel of oil equivalent
bopd barrel of oil per day
EBITDA earnings before interest tax depreciation and amortisation
FEED Front end engineering and design
kbbls thousand barrels
LTIFR Lost Time Injury Frequency Rate Lost Time Incidents per million man hours worked
MMbbl million barrels of oil
MMboe million barrels of oil equivalent
NOPSEMA National Offshore Petroleum Safety amp Environmental Management Authority
NOPTA National Offshore Petroleum Titles Administrator
NPAT net profit after tax
PEL 92 Joint Venture conducting operations in Western Flank Cooper Basin Petroleum Retention Licences 85 ndash 104 previously encompassed by
the PEL 92 exploration licence
TRCFR Total Recordable Case Frequency Rate Recordable cases per million hours worked
TSR total shareholder return
1P reserves Proved reserves
2P reserves Proved and Probable reserves
3P Proved Probable and Possible reserves
1C 2C 3C high medium and low estimates of contingent resources
- 1WRM Investor presentation March 2017
-
- Slide Number 1
- Disclaimer
- Slide Number 3
- Slide Number 4
- Slide Number 5
- Slide Number 6
- Slide Number 7
- Slide Number 8
- Slide Number 9
- Slide Number 10
- Slide Number 11
- Gold and Silver development asset with a definitive feasibility study (DFS) commenced
- Slide Number 13
- Slide Number 14
- Slide Number 15
- Slide Number 16
- Slide Number 17
- Slide Number 18
- Slide Number 19
- Slide Number 20
- Slide Number 21
- Slide Number 22
- Slide Number 23
- Slide Number 24
- Slide Number 25
- Slide Number 26
- Slide Number 27
- Slide Number 28
- Slide Number 29
- Mount Carrington Resource Statement
- Slide Number 31
- Slide Number 32
- Slide Number 33
- Slide Number 34
- Slide Number 35
- Slide Number 36
- Slide Number 37
-
- 2Aurelia Metals Presentation-Mar 2017-widescreen format
-
- Slide Number 1
- Slide Number 2
- Slide Number 3
- Slide Number 4
- Slide Number 5
- Slide Number 6
- Slide Number 7
- Slide Number 8
- Slide Number 9
- Slide Number 10
- Slide Number 11
- Slide Number 12
- Slide Number 13
- Slide Number 14
- Slide Number 15
- Slide Number 16
- Slide Number 17
- Slide Number 18
- Slide Number 19
- Slide Number 20
- Slide Number 21
-
- 320170321 Presentations Melbourne Mining Club Speaker
-

6
Otway Basin
bull Drilling identifies gas bearing
reservoirs in deep sands Gippsland Basin
bull Acquires 65 interest in Basker Manta Gummy
permits
bull Commenced Manta business case analysis for
supply to south-east Australia
7
Otway Basin
bull Builds understanding of Otway
sub-surface
bull Confirms attraction of offshore
Otway
Gippsland Basin
bull Acquires 50 of Sole gas field
bull Acquires 50 of Orbost Gas Plant
bull Manta business case affirms economic
development opportunity
8
Gippsland Basinbull Sole gas field interest 100
bull Sole gas project FEED completed
bull Orbost Gas Plant 100
bull Manta gas field 100
Otway Basin
bull Acquires Casino Henry Vic P44
Minerva and Minerva Gas Plant
Market
bull O-I Australia gas contract
bull AGL gas contract
bull EnergyAustralia gas
contract
bull Alinta Energy gas
contract
9
Gas contracts
bull 188 PJ contracted from 2017 on
bull EnergyAustralia (Otway amp Sole)
bull AGL Energy (Sole)
bull Alinta Energy (Sole)
bull O-I Australia (Sole)
New gas projects
bull Phase 1 Sole from 2019
ndash Sanction Marchrsquo 17 for March lsquo19 first gas into plant
bull Phase 2 Manta
ndash appraisal well and resource upside
ndash from FY22
bull VIC P44 exploration prospects
Production
bull ~ 7 PJ pa from Casino Henry amp
Minerva1
bull Sold to EnergyAustralia
bull Uncontracted gas to market for
supply from March 18
bull Field life to 2026 (Casino Henry)Plant amp infrastructure
bull Orbost Gas Plant connected to
EGP (subject to APA HoA)
bull Minerva1 Gas Plant (10)
connected to SEA Gas pipeline
bull Patricia Baleen connected to
Orbost and Longtom
1Acquisition of 10 interest in Minerva and Minerva gas plant to be completed
Uncontracted gas
Total of 227 PJ uncontracted in
bull Otway
ndash 52 PJ 2P Casino Henry reserves from March 2018
bull Gippsland
ndash Sole 69 PJ 2C contingent resource uncontracted
ndash Manta 106 PJ 2C contingent resource plus
exploration potential
10
03
Jun-16 Jan-17
FY17 production1
MMboe expected
Gas
Oil
1
49 76
367
668
Jun-16 Jan-17
Contingent resources (2C)12
MMboe
Gas
Oil13
11
104
Jun-16 Jan-17
2P reserves12
MMboe
bull Addition of Otway gas production Jan to Jun 17
bull Gas accounts for 75 of anticipated FY17 production
bull Addition of 60 PJ of Otway Basin gas reserves
bull Gas accounts for 90 of 116 MMboe 2P reserves
bull Australian contingent resources 2C up 79
bull 128 PJ gas contingent resources (2C) added in Gippsland
116
416
744
1Australia only 2 Reserves and Contingent Resources at 1 January 2017 were announced to the ASX on 27 February 2017 and should be read in conjunction with the information provided on the calculation
of Reserves and Contingent Resources provided on page 29 Cooper Energy is not aware of any new information or data that materially affects the information provided in those releases and
all material assumptions and technical parameters underpinning the assessment provided in the announcement continues to apply
11
Forecast 1 south-east Australian gas demand and production
PJ pa
South-east Australia comprises NSW VIC SA and Tasmania
SE Australia demandsup1
1 EnergyQuest Energy Quarterly March 2017
0
10
20
30
40
50
60
70
80
90
100
2017 2018 2019 2020 2021 2022 2023 2024
Cooper Energy gas production profilePJ pa
Manta(100)
Sole (100)
Casino
bull Casino Henry gas contracted to February 2018
bull Casino Henry gas available to contract from March 2018
bull COE may sell down some of Sole Gas Project and Manta post
Sole FID
0
100
200
300
400
500
600
2016 2018 2020 2022 2024 2026 2028 2030 2032 2034 2036
Most certain supply tranche Less certain supply tranche
Least certain supply tranche Southern demand
12Source AEMO
13
1 Assumes
bull Sole sanction by March quarter 2017 for March quarter 2019 first Sole gas
to plant
bull Manta 3 appraisal well
bull Development well required for Casino Henry ~2020
bull Details on slide 26
3 5 1
1520 20 20 20 20 20 20
16102
13
17 11
37 36 36
28
1913
15
10
FY17 FY18 FY19 FY20 FY21 FY22 FY23 FY24 FY25 FY26 FY27 FY28 FY29
Gas production1 from current assets contracted amp uncontractedPJ pa
Uncontracted
Contracted
227 PJ comprises 52 PJ 2P Casino Henry gas and 175 PJ 2C Contingent uncontracted gas from Sole and Manta Profile illustrated includes additional 10 PJ anticipated from Manta Cooper Energy announced Sole Contingent Resources on 27 February 2017 and Manta Contingent Resource 16 July 2015 Cooper Energy is not aware of any new information or data that materially affects the information provided in those releases and all material assumptions and technical parameters underpinning the assessment provided in the announcement continues to apply See notes on page 29 for information on reserves and resources calculation
14
Resource economics
Health amp safety
Environment
CommunityFiscaldividend
SuccessfulSustainable
Value-generating resource
development
Balance not achieved people hurt project collapse uneconomic no community
benefit no fiscal dividend excessive energy
costs
Balance achieved safe environmentally
sound development
cost effective sustainable energy
community benefits
fiscal dividend
15
Casino Henry
bull Sustained growth profile over 6 years
bull Gas accounts for overwhelming majority of production
bull New assets and production profile generates
ndash FY17 production gt2x FY16 production
ndash FY19 production gt5x FY16 production
ndash FY22 production gt20x FY16 production
0
2
4
6
8
10
12
FY15 FY16 FY17 FY18 FY19 FY20 FY21 FY22 FY23 FY24
Production1
MMboe
Sole Gas Project
Manta Gas Project
Casino-Henry
Cooper Basin oil
Assumes1
bull Current equities COE may divest some Gippsland post Sole sanction
bull Sole sanction by March quarter 2017 for March quarter 2019 Sole gas to plant
bull Manta 3 appraisal well
bull Development well required for Casino Henry ~2020
bull No new exploration success
16
Sole FID
bull Financial commitment to project
bull Triggers 43 MMboe uplift in gas reserves
bull Translation of HoA with APA to formal agreement
bull Expected shortly after project sanction
Uncontracted Otway gas
bull Contracting gas to supply from March 2018
bull Expect to secure new agreements in winter 2017 with market reflective price
Operator status
bull Working to appointment as Operator in Gippsland and Otway
bull Enables cost efficiencies and competitive advantage as asset owner and JV participant
Beyond June 2017
bull Cooper Basin assets
bull Divest slice of Gippsland Basin portfolio
bull Manta exploration
13116
~53
Jun-16 Jan-17 June -17Proforma
Uplift in 2P reservesMMboe
Australia only Assumes commitment of Sole gas project provides uplift of
~43 MMboe
1
2
3
4
17
1 Execution of our gas strategy has deliveredCooper Energy has become a supplier and developer of gas for south east Australia at a time of great market need
2 FY17 growth is the first step of larger and sustainable growthReserves and production upgrades in the current year are the initial instalment of a 6 year growth trajectory offering gt 20 times growth in
production from existing assets and equities
3 Integration proceeding management capabilities have been reinforced consistent with growthUpgraded people resources with the addition of proven performance orientated executives integration is proceeding to schedule
4 Sole project stronger and proceeding to final phase financingProject now offering lower risk lower capital cost increased gas and increased returns and value upside for Cooper Energy shareholders
5 Milestones aheadSix months to June 17 is expected to see a number of milestones for further uplift and value transformation
Appendices
20
Key figures
Shares on issue1 6601 mill
Shareholders1 5923
Market capitalisation1 $260 mill
Debt Nil
Current employees 23
Cooper Energy is an independent Australian exploration and
production company
bull Listed in 2002 history of profitable operations and successful
exploration and development
bull Strong balance sheet zero debt
bull Raised new equity capital of c$85 million during 2016
bull Management team and board experienced in growing resource
companies
bull Growth profile extending over 6 years from existing assets and
agreements
59
10
2
29
Share register
Institutional
Corporate
Employees amp Directors
Private
1 As at 20 March 2017
21
Oil exploration amp production
Cooper Basin Western Flank
240000 ndash 280000 1 bbl pa
Operating cost ltA$30bbl
High margin + exploration upside
Gas production amp sales Gas projects amp contracting
Otway Basin Casino Henry amp Minerva
Sales of ~7- 8 PJ pa to EnergyAustralia
Minerva1 gas plant
Production of 15 MMboe pa
Gippsland and Otway Basins
Sole Manta projects Otway uncontracted gas
gt400 PJ gas to be developed or uncontracted
Production uplift of up to 95 MMboe2 pa as
projects come online on top of existing output
1 Subject to completion of transaction2 Based on current equity participation levels
22
Phase 1 Sole
bull 2C Resource1 249 PJ
bull Sanction March 2017
bull Sole gas into plant March 2019
bull Output ~25 PJ pa
bull COE equity 100
Phase 2 Manta
bull 2C Resource1 106 PJ gas3 2 MMbbl liquids
bull Appraisal 2018-19
bull Sanction 2021
bull First gas ~2023
bull Output pa 25 PJ gas 039 MMbbl pa
bull Exploration Manta Deep amp Chimaera
bull COE equity 100
Orbost Gas Plant
bull Existing gas plant
bull Connected to Eastern Gas Pipeline
bull Plant owned amp operated by APA Group (proposed in HoA announced 27217
Longtom(Seven Group 100)
Patricia Baleen (COE 100)
Enabling customersUpstream and Midstream HoA
1 Cooper Energy announced Sole Contingent Resources on 27 February 2017 and Manta Contingent Resource 16 July 2015 Cooper Energy is not aware of any new information or data that materially affects the information provided in those releases and all material
assumptions and technical parameters underpinning the assessment provided in the announcement continues to apply See notes on page 29 for information on reserves and resources calculation
33 km
58 km
65 km
23
Sole Gas Project (VIC L32 COE100 Operator )
bull 249 PJ 2C Contingent Resource1
bull 20 PJ pa contracted gas contracts with O-I Australia AGL Energy Alinta Energy
EnergyAustralia
bull Sanction expected by March 2017 for Sole gas into plant by March 2019
Manta (VIC RL131415 COE 100)
bull 106 PJ 2C Contingent Resource plus 3 million barrels liquids1
bull economic business case identified subject to appraisal
bull prospective resource upside to be tested amp appraisal well expected 2018
Patricia-Baleen (VICL21 COE 100)
bull Non-operating field shut in
bull Strategic significance as access point for Orbost Gas Plant for other fields
1 Reserves and Contingent Resources at 1 January 2017 were announced to the ASX on 27 February 2017 and an announcement on Manta Contingent Resource was announced on 16 July 2015 The resources information displayed should be read in conjunction with the information provided on the calculation of Reserves and Contingent Resources provided on page 29 Cooper Energy is not aware of any new information or data that materially affects the information provided in those releases and all material assumptions and technical parameters underpinning the assessment provided in the announcement continues to apply
24
Key Assets
bull Casino Henry gas project (50)
bull Minerva gas field and plant (10 interest)1
bull VICP44 exploration permit
Production (COE share effective from 1 January 2017)
bull Casino Henry (VICRL11 amp 12) 7 PJ pa supplied to EnergyAustralia
under contract expiring March 2018
bull Minerva (VICL22)~ 1 PJ pa (expected to deplete by mid 2017)
Plans
bull Preparation for operatorship transfer likely June 2017
bull Marketing of uncontracted gas available for sale from March 2018
bull Casino Henry development well
1Acquisition of 10 interest in Minerva agreed with Santos Ltd is subject to completion
25
bull First half production of 013 MMbbl vs 017 in H1 FY16
bull Production impacted by suspension of drilling in low oil price FY16
bull Operating costs reduced from A$2992bbl to A$2928bbl
bull Drilling resumed in FY17 with 4 wells drilled 2 successful 2 P amp A
bull No further drilling planned for FY17
bull Producing interests
ndash PEL 92 25 interest (Beach Energy 75 amp Operator)
ndash PEL 93 30 interest (Senex Energy 70 amp Operator)
11 10
16 15
7 4
3530
FY16 H1 FY17
Production costs amp netback Direct cost A$ per barrel
NetbackRoyaltyTransportOperatingCosts per
bbl down 2
26
bull Take or pay gas
processing agreement
1 Cooper Energy to sell Orbost Gas Plant to APA Group
Heads of Agreement (non-binding) provides for APA to take ownership subject to Sole FID
2 APA to be responsible for funding and performance of ~$250 million plant upgrade and processing of gas from Sole amp Manta
Plant to be developed according to existing Sole Development Plan Sole gas to be processed under take or pay tariff agreement
3 Cooper Energy to retain 100 of upstream retains ownership of gas processed through Orbost Gas Plant
Estimated project cost for Cooper Energy reduced to ~$355 million and opportunity to realise further value accretion in sell-down post FID
Orbost Gas Plant APA Group 100
APA
bull funds and completes plant upgrade
for Sole
bull operates plant for agreed tariff amp
provides processed sales gas to
EGP
Sole gas
field
COE 100
COE
bull manages upstream
development
bull supplies gas to Orbost
for processing
bull markets the gas
Upstream Midstream
Downstream COE retains ownership of gas
through to point of sale to customers
in EGP
Transaction elements
1refer joint APA Group Cooper Energy announcement 27 February 2017
27
28
3 5
2 7 7 6 7 7 6 5 4
1
1520 20 20 20
2020
20
16
10
6
10 5 5 5 55
55 9
9
25 25 25
18
10
75
1
FY17 FY18 FY19 FY20 FY21 FY22 FY23 FY24 FY25 FY26 FY27 FY28 FY29
Gas production profile by projectcontracted amp uncontracted PJ pa
Manta uncontracted
Sole uncontracted
Sole contracted
Otway uncontracted
Otway contracted
Otway 2P reserves
Casino Henry
Gippsland Gas Project Phase 1
Sole
Gippsland Gas Project Phase 2
Manta
Assumes
bull Sole sanction by March quarter 2017 for March quarter 2019 first Sole gas to plant
bull All contract options in respect of Sole field are exercised
bull Manta subject to Manta 3 appraisal well Manta profile illustrates all Manta gas as uncontracted (including 4 PJ pa option held by
AGL) Manta profile includes 106 PJ 2C resource and additional 10 PJ anticipated
bull Development well required for Casino Henry ~2020
bull No exploration success
29
Reserves
Proved
(1P)
Proved amp Probable
(2P)
Proved Probable amp Possible
(3P)
Cooper1 Otway2 Total Cooper1 Otway2 Total Cooper1 Otway2 Total
Developed
Sales Gas PJ 00 48 48 00 152 152 00 293 293
Oil + Condensate MMbbl 05 00 05 09 00 09 16 00 16
Total developed MMboe2 05 08 13 09 26 35 16 51 67
Undeveloped
Sales Gas PJ 00 344 344 00 451 451 00 627 627
Oil + Condensate PJ 01 00 02 03 11 03 05 01 05
Total undeveloped MMboe2 01 60 61 03 78 81 05 109 113
Total1 MMboe2 07 68 74 11 104 116 21 159 180
Contingent
Resources
1C 2C 3C
Gas Oil Total1 Gas Oil Total Gas Oil Total
PJ MMbbl MMboe2 PJ MMbbl MMboe2 PJ MMbbl MMboe2
Gippsland 2917 40 541 3885 76 744 5336 121 1039
Cooper 02 00 003 03 00 01 06 00 01
Total 1 2919 40 542 3888 76 744 5342 121 1040
Additional information on reserve and resource calculation is provided in the appendices to this document
1 Totals may not reflect arithmetic addition due to rounding The method of aggregation is by arithmetic sum by category As a result the 1P estimate may be conservative and the 3P estimate may be optimistic due to the effects
of arithmetic summation The conversion factor of 1 PJ = 0172 MMboe has been used to convert from Sales Gas (PJ) to Oil Equivalent (MMboe) 2 The reserves revisions include Cooper Energyrsquos share of future crude fuel
usage in the Cooper Basin The estimated fuel usage for PEL 92 is 1P 002 MMbbl 2P 003 MMbbl and 3P 006 MMbbl The estimated fuel usage for the Worrior Field (PPL 207) is 1P 001 MMbbl 2P 002 MMbbl and 3P 003
MMbbl 3 The Otway gas reserves for Casino Henry and Netherby fields are net of fuel gas
1 Totals may not reflect arithmetic addition due to rounding The method of aggregation is by arithmetic sum by category As a result the 1C estimate may be conservative and the 3C estimate may be optimistic due to the
effects of arithmetic summation 2 The conversion factor of 1 PJ = 0172 MMboe has been used to convert from Sales Gas (PJ) to Oil Equivalent (MMboe)
30
General Manager Operations
Iain MacDougallIain MacDougall has more than 25
yearsrsquo experience in the upstream
petroleum exploration and production
sector including senior management
roles within independent operators
and international experience with
Schlumberger In Australia previous
employment includes Stuart
Petroleum as Production and
Engineering Manager and then as
acting CEO prior to the takeover of
Stuart Petroleum by Senex Energy
Managing Director
David MaxwellDavid Maxwell has over 30 yearsrsquo
experience as a senior executive with
companies such as BG Group Woodside
and Santos As Senior Vice President at
QGC a BG Group business he led BGrsquos
entry into Australia its alliance with and
subsequent takeover of QGC Roles at
Woodside included director of gas and
marketing and membership of Woodsidersquos
executive committee
General Manager Exploration
amp Subsurface
Andrew ThomasAndrew Thomas is a successful
geoscientist with over 28 yearsrsquo
experience in oil and gas exploration
and development in companies
including Geoscience Australia
Santos Gulf Canada and Newfield
Exploration At Newfield he was SE
Asia New Ventures Manager and
Exploration Manager for offshore
Sarawak
Executive Director
Hector GordonHector Gordon is a highly
experienced geologist with over 35
yearsrsquo experience in the petroleum
industry Previous roles include
Managing Director Somerton
Energy and a number of senior
management and technical roles at
Beach Energy including Exploration
Manager Chief Operating Officer
and ultimately Chief Executive
Officer
Alison Evans is an experienced
company secretary and corporate legal
counsel with extensive knowledge of
corporate and commercial law in the
resources and energy sectors
Alison has held Company Secretary
and Legal Counsel roles at a number of
minerals and energy companies
including Centrex Metals GTL Energy
and AGL Ms Evans public company
experience is supported by her work at
leading corporate law firms
Company Secretary and
General Counsel
Alison Evans
General Manager Development
Duncan CleggDuncan Clegg has over 35 yearsrsquo
experience in upstream and midstream oil
and gas development including
management positions at Shell and
Woodside leading oil and gas
developments including FPSO subsea
and fixed platforms developments At
Woodside Duncan held several senior
executive positions including Director of
the Australian Business Unit Director of
the African Business Unit and CEO of the
North West Shelf Venture
Eddy Glavas has more than 18 years
experience in business development
finance commercial portfolio
management and strategy including 14
years in the oil and gas sector Prior to
joining Cooper Energy he was
employed by Santos as Manager
Corporate Development with
responsibility for managing multi-
disciplinary teams tasked with mergers
acquisitions partnerships and
divestitures
General Manager Commercial amp
Business Development
Eddy Glavas
Virginia Suttell is a chartered accountant
with more than 20 years experience
including 16 years in publicly listed entities
principally in group finance and secretarial
roles in the resources and media sectors
This has included the role of Chief Financial
Officer and Company Secretary for Monax
Mining Limited and Marmota Energy Limited
from 2007 to 2016 and 2007 to 2015
respectively Other previous appointments
include Group Financial Controller at
Austereo Group Limited
Chief Financial Officer
(Acting)
Virginia Suttell
31
The approach for all reserve and resource calculations is consistent with the definitions and guidelines in the Society of Petroleum Engineers (SPE) 2007 Petroleum Resources Management System (PRMS) The resource estimate methodologies incorporate a range of uncertainty relating to each of the key reservoir input parameters to predict the likely range of outcomes Cooper Energy has completed its own estimation of reserves and contingent resources based on information provided by the permit Operators Beach Energy Ltd Senex Ltd and Santos Ltd and in accordance with the definitions and guidelines in the Society of Petroleum Engineers (SPE) 2007 Petroleum Resources Management System (PRMS) Petroleum Reserves and Contingent Resources are prepared using deterministic and probabilistic methods The method of aggregation for all reserves and contingent resources tables is by arithmetic summation by category Aggregated 1P and 1C estimates may be conservative and aggregated 3P and 3C estimates may be optimistic due to the effects of arithmetic summation Totals may not exactly reflect arithmetic addition due to rounding
The information contained in this report regarding the Cooper Energy reserves and contingent resources is based on and fairly represents information and supporting documentation reviewed by Mr Andrew Thomas who is a full-time employee of Cooper Energy Limited holding the position of General Manager Exploration amp Subsurface holds a Bachelor of Science (Hons) is a member of the American Association of Petroleum Geologists and the Society of Petroleum Engineers is qualified in accordance with ASX listing rule 541 and has consented to the inclusion of this information in the form and context in which it appears
The Cooper Basin totals comprise the probabilistically aggregated PEL 92 project fields and the arithmetic summation of the Worrior project reserves Total includes 005 MMbbl oil reserves used for field fuel The Indonesia totals include removal of non-shareable oil (NSO) and comprise the probabilistically aggregated Tangai-Sukananti KSO project fields Totals are derived by arithmetic summation In the Otway Basin reserves for the Casino Henry and Netherby fields have been assessed by Cooper Energy The Reserves have been assessed using deterministic and probabilistic methodologies for the Waarre Formation at the Casino Henry and Netherby fields This methodology incorporates a range of uncertainty relating to each of the key reservoir input parameters to predict the likely range of outcomes Cooper Energy undertook the following analytical procedures to estimate the Reserves independent interpretation of 3D seismic data analysis of historical production data to assess accessed gas volumes and future production forecasts review of the Operatorrsquos reservoir and production simulation models to define raw gas recovery consistent with existing processing facilities and independent probabilistic Monte Carlo statistical calculations to establish the range of recoverable gas The Otway gas reserves for Casino Henry and Netherby fields are net of fuel gas The date of the Casino Henry and Netherby Reserve Assessment is 27 February 2017
Sole gas field The contingent resource for the Sole field has been re-estimated assuming a two well subsea development plan Advantages of a two well plan compared to the previous single well development includeincreased 2C estimate attributable to accessing previously undeveloped gas and reduced technical risk and enhanced field redundancy providing increased security of supply to the gas processing and gas sales agreements Contingent resources for the Sole field were released to the ASX on 26 November 2015 Post-acquisition of the remaining 50 equity in the Sole gas field the following methodologies were used by Cooper Energy to re-calculate the Sole contingent resource estimate probabilistic simulation modelling for the Kingfish Formation incorporation of a range of uncertainty relating to each of the key reservoir input parameters to predict the likely range of outcomes and review of the reservoir and simulation modelling assuming a two well subsea development The date of the Sole contingent resource assessment is 27 February 2017
Manta gas and oil field Contingent and Prospective Resources have been assessed using deterministic simulation modelling and probabilistic resource estimation for the Intra-Latrobe and Golden Beach Sub-Group in the Manta field This methodology incorporates a range of uncertainty relating to each of the key reservoir input parameters to predict the likely range of outcomes The conversion factor of 1PJ = 0172MMboe has been used to convert from Sales Gas (PJ) to Oil Equivalent (MMboe) Contingent Resources for the Manta Field have been aggregated by arithmetic summation The date of the Manta Contingent Resource assessment is 16 July 2015 and the assessment was announced to the ASX on 16 July 2015 Cooper Energy is not aware of any new information or data that materially affects the information provided in that release and all material assumptions and technical parameters underpinning the assessment provided in the announcement continues to apply
Basker gas and oil field Contingent and Resources have been assessed using deterministic simulation modelling and probabilistic resource estimation for the Intra-Latrobe Sub-Group in the Basker field This methodology incorporates a range of uncertainty relating to each of the key reservoir input parameters to predict the likely range of outcomes The conversion factor of 1PJ = 0172MMboe has been used to convert from Sales Gas (PJ) to Oil Equivalent (MMboe) Contingent Resources for the Basker Field have been aggregated by arithmetic summation The date of the Basker Contingent Resource assessment is 15 August 2014 and the assessment was announced to the ASX on 18 August 2014 Cooper Energy is not aware of any new information or data that materially affects the information provided in that release and all material assumptions and technical parameters underpinning the assessment provided in the announcement continues to apply
32
$ A$ Australian dollars unless specified otherwise
Bbl barrels of oil
boe barrel of oil equivalent
bopd barrel of oil per day
EBITDA earnings before interest tax depreciation and amortisation
FEED Front end engineering and design
kbbls thousand barrels
LTIFR Lost Time Injury Frequency Rate Lost Time Incidents per million man hours worked
MMbbl million barrels of oil
MMboe million barrels of oil equivalent
NOPSEMA National Offshore Petroleum Safety amp Environmental Management Authority
NOPTA National Offshore Petroleum Titles Administrator
NPAT net profit after tax
PEL 92 Joint Venture conducting operations in Western Flank Cooper Basin Petroleum Retention Licences 85 ndash 104 previously encompassed by
the PEL 92 exploration licence
TRCFR Total Recordable Case Frequency Rate Recordable cases per million hours worked
TSR total shareholder return
1P reserves Proved reserves
2P reserves Proved and Probable reserves
3P Proved Probable and Possible reserves
1C 2C 3C high medium and low estimates of contingent resources
- 1WRM Investor presentation March 2017
-
- Slide Number 1
- Disclaimer
- Slide Number 3
- Slide Number 4
- Slide Number 5
- Slide Number 6
- Slide Number 7
- Slide Number 8
- Slide Number 9
- Slide Number 10
- Slide Number 11
- Gold and Silver development asset with a definitive feasibility study (DFS) commenced
- Slide Number 13
- Slide Number 14
- Slide Number 15
- Slide Number 16
- Slide Number 17
- Slide Number 18
- Slide Number 19
- Slide Number 20
- Slide Number 21
- Slide Number 22
- Slide Number 23
- Slide Number 24
- Slide Number 25
- Slide Number 26
- Slide Number 27
- Slide Number 28
- Slide Number 29
- Mount Carrington Resource Statement
- Slide Number 31
- Slide Number 32
- Slide Number 33
- Slide Number 34
- Slide Number 35
- Slide Number 36
- Slide Number 37
-
- 2Aurelia Metals Presentation-Mar 2017-widescreen format
-
- Slide Number 1
- Slide Number 2
- Slide Number 3
- Slide Number 4
- Slide Number 5
- Slide Number 6
- Slide Number 7
- Slide Number 8
- Slide Number 9
- Slide Number 10
- Slide Number 11
- Slide Number 12
- Slide Number 13
- Slide Number 14
- Slide Number 15
- Slide Number 16
- Slide Number 17
- Slide Number 18
- Slide Number 19
- Slide Number 20
- Slide Number 21
-
- 320170321 Presentations Melbourne Mining Club Speaker
-
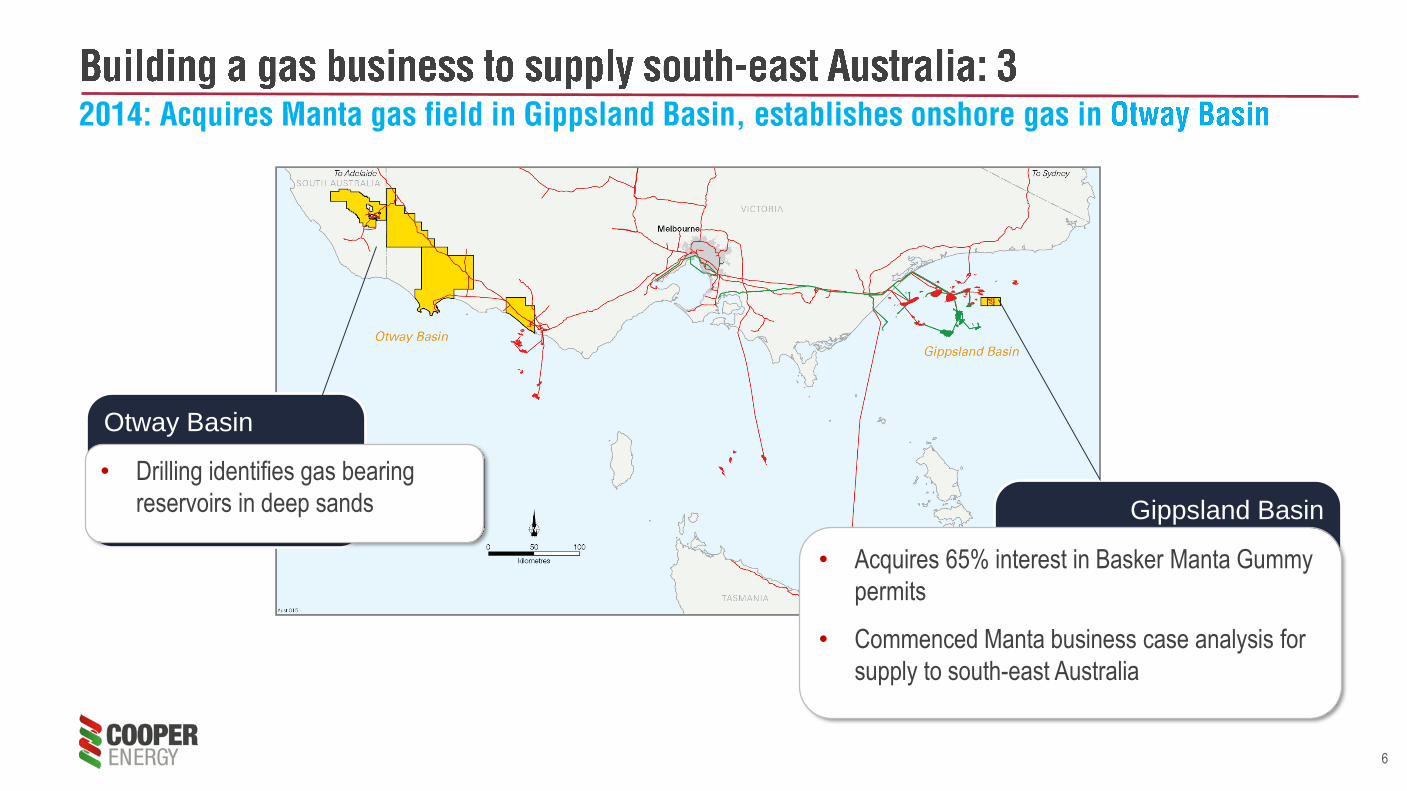

8
Gippsland Basinbull Sole gas field interest 100
bull Sole gas project FEED completed
bull Orbost Gas Plant 100
bull Manta gas field 100
Otway Basin
bull Acquires Casino Henry Vic P44
Minerva and Minerva Gas Plant
Market
bull O-I Australia gas contract
bull AGL gas contract
bull EnergyAustralia gas
contract
bull Alinta Energy gas
contract
9
Gas contracts
bull 188 PJ contracted from 2017 on
bull EnergyAustralia (Otway amp Sole)
bull AGL Energy (Sole)
bull Alinta Energy (Sole)
bull O-I Australia (Sole)
New gas projects
bull Phase 1 Sole from 2019
ndash Sanction Marchrsquo 17 for March lsquo19 first gas into plant
bull Phase 2 Manta
ndash appraisal well and resource upside
ndash from FY22
bull VIC P44 exploration prospects
Production
bull ~ 7 PJ pa from Casino Henry amp
Minerva1
bull Sold to EnergyAustralia
bull Uncontracted gas to market for
supply from March 18
bull Field life to 2026 (Casino Henry)Plant amp infrastructure
bull Orbost Gas Plant connected to
EGP (subject to APA HoA)
bull Minerva1 Gas Plant (10)
connected to SEA Gas pipeline
bull Patricia Baleen connected to
Orbost and Longtom
1Acquisition of 10 interest in Minerva and Minerva gas plant to be completed
Uncontracted gas
Total of 227 PJ uncontracted in
bull Otway
ndash 52 PJ 2P Casino Henry reserves from March 2018
bull Gippsland
ndash Sole 69 PJ 2C contingent resource uncontracted
ndash Manta 106 PJ 2C contingent resource plus
exploration potential
10
03
Jun-16 Jan-17
FY17 production1
MMboe expected
Gas
Oil
1
49 76
367
668
Jun-16 Jan-17
Contingent resources (2C)12
MMboe
Gas
Oil13
11
104
Jun-16 Jan-17
2P reserves12
MMboe
bull Addition of Otway gas production Jan to Jun 17
bull Gas accounts for 75 of anticipated FY17 production
bull Addition of 60 PJ of Otway Basin gas reserves
bull Gas accounts for 90 of 116 MMboe 2P reserves
bull Australian contingent resources 2C up 79
bull 128 PJ gas contingent resources (2C) added in Gippsland
116
416
744
1Australia only 2 Reserves and Contingent Resources at 1 January 2017 were announced to the ASX on 27 February 2017 and should be read in conjunction with the information provided on the calculation
of Reserves and Contingent Resources provided on page 29 Cooper Energy is not aware of any new information or data that materially affects the information provided in those releases and
all material assumptions and technical parameters underpinning the assessment provided in the announcement continues to apply
11
Forecast 1 south-east Australian gas demand and production
PJ pa
South-east Australia comprises NSW VIC SA and Tasmania
SE Australia demandsup1
1 EnergyQuest Energy Quarterly March 2017
0
10
20
30
40
50
60
70
80
90
100
2017 2018 2019 2020 2021 2022 2023 2024
Cooper Energy gas production profilePJ pa
Manta(100)
Sole (100)
Casino
bull Casino Henry gas contracted to February 2018
bull Casino Henry gas available to contract from March 2018
bull COE may sell down some of Sole Gas Project and Manta post
Sole FID
0
100
200
300
400
500
600
2016 2018 2020 2022 2024 2026 2028 2030 2032 2034 2036
Most certain supply tranche Less certain supply tranche
Least certain supply tranche Southern demand
12Source AEMO
13
1 Assumes
bull Sole sanction by March quarter 2017 for March quarter 2019 first Sole gas
to plant
bull Manta 3 appraisal well
bull Development well required for Casino Henry ~2020
bull Details on slide 26
3 5 1
1520 20 20 20 20 20 20
16102
13
17 11
37 36 36
28
1913
15
10
FY17 FY18 FY19 FY20 FY21 FY22 FY23 FY24 FY25 FY26 FY27 FY28 FY29
Gas production1 from current assets contracted amp uncontractedPJ pa
Uncontracted
Contracted
227 PJ comprises 52 PJ 2P Casino Henry gas and 175 PJ 2C Contingent uncontracted gas from Sole and Manta Profile illustrated includes additional 10 PJ anticipated from Manta Cooper Energy announced Sole Contingent Resources on 27 February 2017 and Manta Contingent Resource 16 July 2015 Cooper Energy is not aware of any new information or data that materially affects the information provided in those releases and all material assumptions and technical parameters underpinning the assessment provided in the announcement continues to apply See notes on page 29 for information on reserves and resources calculation
14
Resource economics
Health amp safety
Environment
CommunityFiscaldividend
SuccessfulSustainable
Value-generating resource
development
Balance not achieved people hurt project collapse uneconomic no community
benefit no fiscal dividend excessive energy
costs
Balance achieved safe environmentally
sound development
cost effective sustainable energy
community benefits
fiscal dividend
15
Casino Henry
bull Sustained growth profile over 6 years
bull Gas accounts for overwhelming majority of production
bull New assets and production profile generates
ndash FY17 production gt2x FY16 production
ndash FY19 production gt5x FY16 production
ndash FY22 production gt20x FY16 production
0
2
4
6
8
10
12
FY15 FY16 FY17 FY18 FY19 FY20 FY21 FY22 FY23 FY24
Production1
MMboe
Sole Gas Project
Manta Gas Project
Casino-Henry
Cooper Basin oil
Assumes1
bull Current equities COE may divest some Gippsland post Sole sanction
bull Sole sanction by March quarter 2017 for March quarter 2019 Sole gas to plant
bull Manta 3 appraisal well
bull Development well required for Casino Henry ~2020
bull No new exploration success
16
Sole FID
bull Financial commitment to project
bull Triggers 43 MMboe uplift in gas reserves
bull Translation of HoA with APA to formal agreement
bull Expected shortly after project sanction
Uncontracted Otway gas
bull Contracting gas to supply from March 2018
bull Expect to secure new agreements in winter 2017 with market reflective price
Operator status
bull Working to appointment as Operator in Gippsland and Otway
bull Enables cost efficiencies and competitive advantage as asset owner and JV participant
Beyond June 2017
bull Cooper Basin assets
bull Divest slice of Gippsland Basin portfolio
bull Manta exploration
13116
~53
Jun-16 Jan-17 June -17Proforma
Uplift in 2P reservesMMboe
Australia only Assumes commitment of Sole gas project provides uplift of
~43 MMboe
1
2
3
4
17
1 Execution of our gas strategy has deliveredCooper Energy has become a supplier and developer of gas for south east Australia at a time of great market need
2 FY17 growth is the first step of larger and sustainable growthReserves and production upgrades in the current year are the initial instalment of a 6 year growth trajectory offering gt 20 times growth in
production from existing assets and equities
3 Integration proceeding management capabilities have been reinforced consistent with growthUpgraded people resources with the addition of proven performance orientated executives integration is proceeding to schedule
4 Sole project stronger and proceeding to final phase financingProject now offering lower risk lower capital cost increased gas and increased returns and value upside for Cooper Energy shareholders
5 Milestones aheadSix months to June 17 is expected to see a number of milestones for further uplift and value transformation
Appendices
20
Key figures
Shares on issue1 6601 mill
Shareholders1 5923
Market capitalisation1 $260 mill
Debt Nil
Current employees 23
Cooper Energy is an independent Australian exploration and
production company
bull Listed in 2002 history of profitable operations and successful
exploration and development
bull Strong balance sheet zero debt
bull Raised new equity capital of c$85 million during 2016
bull Management team and board experienced in growing resource
companies
bull Growth profile extending over 6 years from existing assets and
agreements
59
10
2
29
Share register
Institutional
Corporate
Employees amp Directors
Private
1 As at 20 March 2017
21
Oil exploration amp production
Cooper Basin Western Flank
240000 ndash 280000 1 bbl pa
Operating cost ltA$30bbl
High margin + exploration upside
Gas production amp sales Gas projects amp contracting
Otway Basin Casino Henry amp Minerva
Sales of ~7- 8 PJ pa to EnergyAustralia
Minerva1 gas plant
Production of 15 MMboe pa
Gippsland and Otway Basins
Sole Manta projects Otway uncontracted gas
gt400 PJ gas to be developed or uncontracted
Production uplift of up to 95 MMboe2 pa as
projects come online on top of existing output
1 Subject to completion of transaction2 Based on current equity participation levels
22
Phase 1 Sole
bull 2C Resource1 249 PJ
bull Sanction March 2017
bull Sole gas into plant March 2019
bull Output ~25 PJ pa
bull COE equity 100
Phase 2 Manta
bull 2C Resource1 106 PJ gas3 2 MMbbl liquids
bull Appraisal 2018-19
bull Sanction 2021
bull First gas ~2023
bull Output pa 25 PJ gas 039 MMbbl pa
bull Exploration Manta Deep amp Chimaera
bull COE equity 100
Orbost Gas Plant
bull Existing gas plant
bull Connected to Eastern Gas Pipeline
bull Plant owned amp operated by APA Group (proposed in HoA announced 27217
Longtom(Seven Group 100)
Patricia Baleen (COE 100)
Enabling customersUpstream and Midstream HoA
1 Cooper Energy announced Sole Contingent Resources on 27 February 2017 and Manta Contingent Resource 16 July 2015 Cooper Energy is not aware of any new information or data that materially affects the information provided in those releases and all material
assumptions and technical parameters underpinning the assessment provided in the announcement continues to apply See notes on page 29 for information on reserves and resources calculation
33 km
58 km
65 km
23
Sole Gas Project (VIC L32 COE100 Operator )
bull 249 PJ 2C Contingent Resource1
bull 20 PJ pa contracted gas contracts with O-I Australia AGL Energy Alinta Energy
EnergyAustralia
bull Sanction expected by March 2017 for Sole gas into plant by March 2019
Manta (VIC RL131415 COE 100)
bull 106 PJ 2C Contingent Resource plus 3 million barrels liquids1
bull economic business case identified subject to appraisal
bull prospective resource upside to be tested amp appraisal well expected 2018
Patricia-Baleen (VICL21 COE 100)
bull Non-operating field shut in
bull Strategic significance as access point for Orbost Gas Plant for other fields
1 Reserves and Contingent Resources at 1 January 2017 were announced to the ASX on 27 February 2017 and an announcement on Manta Contingent Resource was announced on 16 July 2015 The resources information displayed should be read in conjunction with the information provided on the calculation of Reserves and Contingent Resources provided on page 29 Cooper Energy is not aware of any new information or data that materially affects the information provided in those releases and all material assumptions and technical parameters underpinning the assessment provided in the announcement continues to apply
24
Key Assets
bull Casino Henry gas project (50)
bull Minerva gas field and plant (10 interest)1
bull VICP44 exploration permit
Production (COE share effective from 1 January 2017)
bull Casino Henry (VICRL11 amp 12) 7 PJ pa supplied to EnergyAustralia
under contract expiring March 2018
bull Minerva (VICL22)~ 1 PJ pa (expected to deplete by mid 2017)
Plans
bull Preparation for operatorship transfer likely June 2017
bull Marketing of uncontracted gas available for sale from March 2018
bull Casino Henry development well
1Acquisition of 10 interest in Minerva agreed with Santos Ltd is subject to completion
25
bull First half production of 013 MMbbl vs 017 in H1 FY16
bull Production impacted by suspension of drilling in low oil price FY16
bull Operating costs reduced from A$2992bbl to A$2928bbl
bull Drilling resumed in FY17 with 4 wells drilled 2 successful 2 P amp A
bull No further drilling planned for FY17
bull Producing interests
ndash PEL 92 25 interest (Beach Energy 75 amp Operator)
ndash PEL 93 30 interest (Senex Energy 70 amp Operator)
11 10
16 15
7 4
3530
FY16 H1 FY17
Production costs amp netback Direct cost A$ per barrel
NetbackRoyaltyTransportOperatingCosts per
bbl down 2
26
bull Take or pay gas
processing agreement
1 Cooper Energy to sell Orbost Gas Plant to APA Group
Heads of Agreement (non-binding) provides for APA to take ownership subject to Sole FID
2 APA to be responsible for funding and performance of ~$250 million plant upgrade and processing of gas from Sole amp Manta
Plant to be developed according to existing Sole Development Plan Sole gas to be processed under take or pay tariff agreement
3 Cooper Energy to retain 100 of upstream retains ownership of gas processed through Orbost Gas Plant
Estimated project cost for Cooper Energy reduced to ~$355 million and opportunity to realise further value accretion in sell-down post FID
Orbost Gas Plant APA Group 100
APA
bull funds and completes plant upgrade
for Sole
bull operates plant for agreed tariff amp
provides processed sales gas to
EGP
Sole gas
field
COE 100
COE
bull manages upstream
development
bull supplies gas to Orbost
for processing
bull markets the gas
Upstream Midstream
Downstream COE retains ownership of gas
through to point of sale to customers
in EGP
Transaction elements
1refer joint APA Group Cooper Energy announcement 27 February 2017
27
28
3 5
2 7 7 6 7 7 6 5 4
1
1520 20 20 20
2020
20
16
10
6
10 5 5 5 55
55 9
9
25 25 25
18
10
75
1
FY17 FY18 FY19 FY20 FY21 FY22 FY23 FY24 FY25 FY26 FY27 FY28 FY29
Gas production profile by projectcontracted amp uncontracted PJ pa
Manta uncontracted
Sole uncontracted
Sole contracted
Otway uncontracted
Otway contracted
Otway 2P reserves
Casino Henry
Gippsland Gas Project Phase 1
Sole
Gippsland Gas Project Phase 2
Manta
Assumes
bull Sole sanction by March quarter 2017 for March quarter 2019 first Sole gas to plant
bull All contract options in respect of Sole field are exercised
bull Manta subject to Manta 3 appraisal well Manta profile illustrates all Manta gas as uncontracted (including 4 PJ pa option held by
AGL) Manta profile includes 106 PJ 2C resource and additional 10 PJ anticipated
bull Development well required for Casino Henry ~2020
bull No exploration success
29
Reserves
Proved
(1P)
Proved amp Probable
(2P)
Proved Probable amp Possible
(3P)
Cooper1 Otway2 Total Cooper1 Otway2 Total Cooper1 Otway2 Total
Developed
Sales Gas PJ 00 48 48 00 152 152 00 293 293
Oil + Condensate MMbbl 05 00 05 09 00 09 16 00 16
Total developed MMboe2 05 08 13 09 26 35 16 51 67
Undeveloped
Sales Gas PJ 00 344 344 00 451 451 00 627 627
Oil + Condensate PJ 01 00 02 03 11 03 05 01 05
Total undeveloped MMboe2 01 60 61 03 78 81 05 109 113
Total1 MMboe2 07 68 74 11 104 116 21 159 180
Contingent
Resources
1C 2C 3C
Gas Oil Total1 Gas Oil Total Gas Oil Total
PJ MMbbl MMboe2 PJ MMbbl MMboe2 PJ MMbbl MMboe2
Gippsland 2917 40 541 3885 76 744 5336 121 1039
Cooper 02 00 003 03 00 01 06 00 01
Total 1 2919 40 542 3888 76 744 5342 121 1040
Additional information on reserve and resource calculation is provided in the appendices to this document
1 Totals may not reflect arithmetic addition due to rounding The method of aggregation is by arithmetic sum by category As a result the 1P estimate may be conservative and the 3P estimate may be optimistic due to the effects
of arithmetic summation The conversion factor of 1 PJ = 0172 MMboe has been used to convert from Sales Gas (PJ) to Oil Equivalent (MMboe) 2 The reserves revisions include Cooper Energyrsquos share of future crude fuel
usage in the Cooper Basin The estimated fuel usage for PEL 92 is 1P 002 MMbbl 2P 003 MMbbl and 3P 006 MMbbl The estimated fuel usage for the Worrior Field (PPL 207) is 1P 001 MMbbl 2P 002 MMbbl and 3P 003
MMbbl 3 The Otway gas reserves for Casino Henry and Netherby fields are net of fuel gas
1 Totals may not reflect arithmetic addition due to rounding The method of aggregation is by arithmetic sum by category As a result the 1C estimate may be conservative and the 3C estimate may be optimistic due to the
effects of arithmetic summation 2 The conversion factor of 1 PJ = 0172 MMboe has been used to convert from Sales Gas (PJ) to Oil Equivalent (MMboe)
30
General Manager Operations
Iain MacDougallIain MacDougall has more than 25
yearsrsquo experience in the upstream
petroleum exploration and production
sector including senior management
roles within independent operators
and international experience with
Schlumberger In Australia previous
employment includes Stuart
Petroleum as Production and
Engineering Manager and then as
acting CEO prior to the takeover of
Stuart Petroleum by Senex Energy
Managing Director
David MaxwellDavid Maxwell has over 30 yearsrsquo
experience as a senior executive with
companies such as BG Group Woodside
and Santos As Senior Vice President at
QGC a BG Group business he led BGrsquos
entry into Australia its alliance with and
subsequent takeover of QGC Roles at
Woodside included director of gas and
marketing and membership of Woodsidersquos
executive committee
General Manager Exploration
amp Subsurface
Andrew ThomasAndrew Thomas is a successful
geoscientist with over 28 yearsrsquo
experience in oil and gas exploration
and development in companies
including Geoscience Australia
Santos Gulf Canada and Newfield
Exploration At Newfield he was SE
Asia New Ventures Manager and
Exploration Manager for offshore
Sarawak
Executive Director
Hector GordonHector Gordon is a highly
experienced geologist with over 35
yearsrsquo experience in the petroleum
industry Previous roles include
Managing Director Somerton
Energy and a number of senior
management and technical roles at
Beach Energy including Exploration
Manager Chief Operating Officer
and ultimately Chief Executive
Officer
Alison Evans is an experienced
company secretary and corporate legal
counsel with extensive knowledge of
corporate and commercial law in the
resources and energy sectors
Alison has held Company Secretary
and Legal Counsel roles at a number of
minerals and energy companies
including Centrex Metals GTL Energy
and AGL Ms Evans public company
experience is supported by her work at
leading corporate law firms
Company Secretary and
General Counsel
Alison Evans
General Manager Development
Duncan CleggDuncan Clegg has over 35 yearsrsquo
experience in upstream and midstream oil
and gas development including
management positions at Shell and
Woodside leading oil and gas
developments including FPSO subsea
and fixed platforms developments At
Woodside Duncan held several senior
executive positions including Director of
the Australian Business Unit Director of
the African Business Unit and CEO of the
North West Shelf Venture
Eddy Glavas has more than 18 years
experience in business development
finance commercial portfolio
management and strategy including 14
years in the oil and gas sector Prior to
joining Cooper Energy he was
employed by Santos as Manager
Corporate Development with
responsibility for managing multi-
disciplinary teams tasked with mergers
acquisitions partnerships and
divestitures
General Manager Commercial amp
Business Development
Eddy Glavas
Virginia Suttell is a chartered accountant
with more than 20 years experience
including 16 years in publicly listed entities
principally in group finance and secretarial
roles in the resources and media sectors
This has included the role of Chief Financial
Officer and Company Secretary for Monax
Mining Limited and Marmota Energy Limited
from 2007 to 2016 and 2007 to 2015
respectively Other previous appointments
include Group Financial Controller at
Austereo Group Limited
Chief Financial Officer
(Acting)
Virginia Suttell
31
The approach for all reserve and resource calculations is consistent with the definitions and guidelines in the Society of Petroleum Engineers (SPE) 2007 Petroleum Resources Management System (PRMS) The resource estimate methodologies incorporate a range of uncertainty relating to each of the key reservoir input parameters to predict the likely range of outcomes Cooper Energy has completed its own estimation of reserves and contingent resources based on information provided by the permit Operators Beach Energy Ltd Senex Ltd and Santos Ltd and in accordance with the definitions and guidelines in the Society of Petroleum Engineers (SPE) 2007 Petroleum Resources Management System (PRMS) Petroleum Reserves and Contingent Resources are prepared using deterministic and probabilistic methods The method of aggregation for all reserves and contingent resources tables is by arithmetic summation by category Aggregated 1P and 1C estimates may be conservative and aggregated 3P and 3C estimates may be optimistic due to the effects of arithmetic summation Totals may not exactly reflect arithmetic addition due to rounding
The information contained in this report regarding the Cooper Energy reserves and contingent resources is based on and fairly represents information and supporting documentation reviewed by Mr Andrew Thomas who is a full-time employee of Cooper Energy Limited holding the position of General Manager Exploration amp Subsurface holds a Bachelor of Science (Hons) is a member of the American Association of Petroleum Geologists and the Society of Petroleum Engineers is qualified in accordance with ASX listing rule 541 and has consented to the inclusion of this information in the form and context in which it appears
The Cooper Basin totals comprise the probabilistically aggregated PEL 92 project fields and the arithmetic summation of the Worrior project reserves Total includes 005 MMbbl oil reserves used for field fuel The Indonesia totals include removal of non-shareable oil (NSO) and comprise the probabilistically aggregated Tangai-Sukananti KSO project fields Totals are derived by arithmetic summation In the Otway Basin reserves for the Casino Henry and Netherby fields have been assessed by Cooper Energy The Reserves have been assessed using deterministic and probabilistic methodologies for the Waarre Formation at the Casino Henry and Netherby fields This methodology incorporates a range of uncertainty relating to each of the key reservoir input parameters to predict the likely range of outcomes Cooper Energy undertook the following analytical procedures to estimate the Reserves independent interpretation of 3D seismic data analysis of historical production data to assess accessed gas volumes and future production forecasts review of the Operatorrsquos reservoir and production simulation models to define raw gas recovery consistent with existing processing facilities and independent probabilistic Monte Carlo statistical calculations to establish the range of recoverable gas The Otway gas reserves for Casino Henry and Netherby fields are net of fuel gas The date of the Casino Henry and Netherby Reserve Assessment is 27 February 2017
Sole gas field The contingent resource for the Sole field has been re-estimated assuming a two well subsea development plan Advantages of a two well plan compared to the previous single well development includeincreased 2C estimate attributable to accessing previously undeveloped gas and reduced technical risk and enhanced field redundancy providing increased security of supply to the gas processing and gas sales agreements Contingent resources for the Sole field were released to the ASX on 26 November 2015 Post-acquisition of the remaining 50 equity in the Sole gas field the following methodologies were used by Cooper Energy to re-calculate the Sole contingent resource estimate probabilistic simulation modelling for the Kingfish Formation incorporation of a range of uncertainty relating to each of the key reservoir input parameters to predict the likely range of outcomes and review of the reservoir and simulation modelling assuming a two well subsea development The date of the Sole contingent resource assessment is 27 February 2017
Manta gas and oil field Contingent and Prospective Resources have been assessed using deterministic simulation modelling and probabilistic resource estimation for the Intra-Latrobe and Golden Beach Sub-Group in the Manta field This methodology incorporates a range of uncertainty relating to each of the key reservoir input parameters to predict the likely range of outcomes The conversion factor of 1PJ = 0172MMboe has been used to convert from Sales Gas (PJ) to Oil Equivalent (MMboe) Contingent Resources for the Manta Field have been aggregated by arithmetic summation The date of the Manta Contingent Resource assessment is 16 July 2015 and the assessment was announced to the ASX on 16 July 2015 Cooper Energy is not aware of any new information or data that materially affects the information provided in that release and all material assumptions and technical parameters underpinning the assessment provided in the announcement continues to apply
Basker gas and oil field Contingent and Resources have been assessed using deterministic simulation modelling and probabilistic resource estimation for the Intra-Latrobe Sub-Group in the Basker field This methodology incorporates a range of uncertainty relating to each of the key reservoir input parameters to predict the likely range of outcomes The conversion factor of 1PJ = 0172MMboe has been used to convert from Sales Gas (PJ) to Oil Equivalent (MMboe) Contingent Resources for the Basker Field have been aggregated by arithmetic summation The date of the Basker Contingent Resource assessment is 15 August 2014 and the assessment was announced to the ASX on 18 August 2014 Cooper Energy is not aware of any new information or data that materially affects the information provided in that release and all material assumptions and technical parameters underpinning the assessment provided in the announcement continues to apply
32
$ A$ Australian dollars unless specified otherwise
Bbl barrels of oil
boe barrel of oil equivalent
bopd barrel of oil per day
EBITDA earnings before interest tax depreciation and amortisation
FEED Front end engineering and design
kbbls thousand barrels
LTIFR Lost Time Injury Frequency Rate Lost Time Incidents per million man hours worked
MMbbl million barrels of oil
MMboe million barrels of oil equivalent
NOPSEMA National Offshore Petroleum Safety amp Environmental Management Authority
NOPTA National Offshore Petroleum Titles Administrator
NPAT net profit after tax
PEL 92 Joint Venture conducting operations in Western Flank Cooper Basin Petroleum Retention Licences 85 ndash 104 previously encompassed by
the PEL 92 exploration licence
TRCFR Total Recordable Case Frequency Rate Recordable cases per million hours worked
TSR total shareholder return
1P reserves Proved reserves
2P reserves Proved and Probable reserves
3P Proved Probable and Possible reserves
1C 2C 3C high medium and low estimates of contingent resources
- 1WRM Investor presentation March 2017
-
- Slide Number 1
- Disclaimer
- Slide Number 3
- Slide Number 4
- Slide Number 5
- Slide Number 6
- Slide Number 7
- Slide Number 8
- Slide Number 9
- Slide Number 10
- Slide Number 11
- Gold and Silver development asset with a definitive feasibility study (DFS) commenced
- Slide Number 13
- Slide Number 14
- Slide Number 15
- Slide Number 16
- Slide Number 17
- Slide Number 18
- Slide Number 19
- Slide Number 20
- Slide Number 21
- Slide Number 22
- Slide Number 23
- Slide Number 24
- Slide Number 25
- Slide Number 26
- Slide Number 27
- Slide Number 28
- Slide Number 29
- Mount Carrington Resource Statement
- Slide Number 31
- Slide Number 32
- Slide Number 33
- Slide Number 34
- Slide Number 35
- Slide Number 36
- Slide Number 37
-
- 2Aurelia Metals Presentation-Mar 2017-widescreen format
-
- Slide Number 1
- Slide Number 2
- Slide Number 3
- Slide Number 4
- Slide Number 5
- Slide Number 6
- Slide Number 7
- Slide Number 8
- Slide Number 9
- Slide Number 10
- Slide Number 11
- Slide Number 12
- Slide Number 13
- Slide Number 14
- Slide Number 15
- Slide Number 16
- Slide Number 17
- Slide Number 18
- Slide Number 19
- Slide Number 20
- Slide Number 21
-
- 320170321 Presentations Melbourne Mining Club Speaker
-

9
Gas contracts
bull 188 PJ contracted from 2017 on
bull EnergyAustralia (Otway amp Sole)
bull AGL Energy (Sole)
bull Alinta Energy (Sole)
bull O-I Australia (Sole)
New gas projects
bull Phase 1 Sole from 2019
ndash Sanction Marchrsquo 17 for March lsquo19 first gas into plant
bull Phase 2 Manta
ndash appraisal well and resource upside
ndash from FY22
bull VIC P44 exploration prospects
Production
bull ~ 7 PJ pa from Casino Henry amp
Minerva1
bull Sold to EnergyAustralia
bull Uncontracted gas to market for
supply from March 18
bull Field life to 2026 (Casino Henry)Plant amp infrastructure
bull Orbost Gas Plant connected to
EGP (subject to APA HoA)
bull Minerva1 Gas Plant (10)
connected to SEA Gas pipeline
bull Patricia Baleen connected to
Orbost and Longtom
1Acquisition of 10 interest in Minerva and Minerva gas plant to be completed
Uncontracted gas
Total of 227 PJ uncontracted in
bull Otway
ndash 52 PJ 2P Casino Henry reserves from March 2018
bull Gippsland
ndash Sole 69 PJ 2C contingent resource uncontracted
ndash Manta 106 PJ 2C contingent resource plus
exploration potential
10
03
Jun-16 Jan-17
FY17 production1
MMboe expected
Gas
Oil
1
49 76
367
668
Jun-16 Jan-17
Contingent resources (2C)12
MMboe
Gas
Oil13
11
104
Jun-16 Jan-17
2P reserves12
MMboe
bull Addition of Otway gas production Jan to Jun 17
bull Gas accounts for 75 of anticipated FY17 production
bull Addition of 60 PJ of Otway Basin gas reserves
bull Gas accounts for 90 of 116 MMboe 2P reserves
bull Australian contingent resources 2C up 79
bull 128 PJ gas contingent resources (2C) added in Gippsland
116
416
744
1Australia only 2 Reserves and Contingent Resources at 1 January 2017 were announced to the ASX on 27 February 2017 and should be read in conjunction with the information provided on the calculation
of Reserves and Contingent Resources provided on page 29 Cooper Energy is not aware of any new information or data that materially affects the information provided in those releases and
all material assumptions and technical parameters underpinning the assessment provided in the announcement continues to apply
11
Forecast 1 south-east Australian gas demand and production
PJ pa
South-east Australia comprises NSW VIC SA and Tasmania
SE Australia demandsup1
1 EnergyQuest Energy Quarterly March 2017
0
10
20
30
40
50
60
70
80
90
100
2017 2018 2019 2020 2021 2022 2023 2024
Cooper Energy gas production profilePJ pa
Manta(100)
Sole (100)
Casino
bull Casino Henry gas contracted to February 2018
bull Casino Henry gas available to contract from March 2018
bull COE may sell down some of Sole Gas Project and Manta post
Sole FID
0
100
200
300
400
500
600
2016 2018 2020 2022 2024 2026 2028 2030 2032 2034 2036
Most certain supply tranche Less certain supply tranche
Least certain supply tranche Southern demand
12Source AEMO
13
1 Assumes
bull Sole sanction by March quarter 2017 for March quarter 2019 first Sole gas
to plant
bull Manta 3 appraisal well
bull Development well required for Casino Henry ~2020
bull Details on slide 26
3 5 1
1520 20 20 20 20 20 20
16102
13
17 11
37 36 36
28
1913
15
10
FY17 FY18 FY19 FY20 FY21 FY22 FY23 FY24 FY25 FY26 FY27 FY28 FY29
Gas production1 from current assets contracted amp uncontractedPJ pa
Uncontracted
Contracted
227 PJ comprises 52 PJ 2P Casino Henry gas and 175 PJ 2C Contingent uncontracted gas from Sole and Manta Profile illustrated includes additional 10 PJ anticipated from Manta Cooper Energy announced Sole Contingent Resources on 27 February 2017 and Manta Contingent Resource 16 July 2015 Cooper Energy is not aware of any new information or data that materially affects the information provided in those releases and all material assumptions and technical parameters underpinning the assessment provided in the announcement continues to apply See notes on page 29 for information on reserves and resources calculation
14
Resource economics
Health amp safety
Environment
CommunityFiscaldividend
SuccessfulSustainable
Value-generating resource
development
Balance not achieved people hurt project collapse uneconomic no community
benefit no fiscal dividend excessive energy
costs
Balance achieved safe environmentally
sound development
cost effective sustainable energy
community benefits
fiscal dividend
15
Casino Henry
bull Sustained growth profile over 6 years
bull Gas accounts for overwhelming majority of production
bull New assets and production profile generates
ndash FY17 production gt2x FY16 production
ndash FY19 production gt5x FY16 production
ndash FY22 production gt20x FY16 production
0
2
4
6
8
10
12
FY15 FY16 FY17 FY18 FY19 FY20 FY21 FY22 FY23 FY24
Production1
MMboe
Sole Gas Project
Manta Gas Project
Casino-Henry
Cooper Basin oil
Assumes1
bull Current equities COE may divest some Gippsland post Sole sanction
bull Sole sanction by March quarter 2017 for March quarter 2019 Sole gas to plant
bull Manta 3 appraisal well
bull Development well required for Casino Henry ~2020
bull No new exploration success
16
Sole FID
bull Financial commitment to project
bull Triggers 43 MMboe uplift in gas reserves
bull Translation of HoA with APA to formal agreement
bull Expected shortly after project sanction
Uncontracted Otway gas
bull Contracting gas to supply from March 2018
bull Expect to secure new agreements in winter 2017 with market reflective price
Operator status
bull Working to appointment as Operator in Gippsland and Otway
bull Enables cost efficiencies and competitive advantage as asset owner and JV participant
Beyond June 2017
bull Cooper Basin assets
bull Divest slice of Gippsland Basin portfolio
bull Manta exploration
13116
~53
Jun-16 Jan-17 June -17Proforma
Uplift in 2P reservesMMboe
Australia only Assumes commitment of Sole gas project provides uplift of
~43 MMboe
1
2
3
4
17
1 Execution of our gas strategy has deliveredCooper Energy has become a supplier and developer of gas for south east Australia at a time of great market need
2 FY17 growth is the first step of larger and sustainable growthReserves and production upgrades in the current year are the initial instalment of a 6 year growth trajectory offering gt 20 times growth in
production from existing assets and equities
3 Integration proceeding management capabilities have been reinforced consistent with growthUpgraded people resources with the addition of proven performance orientated executives integration is proceeding to schedule
4 Sole project stronger and proceeding to final phase financingProject now offering lower risk lower capital cost increased gas and increased returns and value upside for Cooper Energy shareholders
5 Milestones aheadSix months to June 17 is expected to see a number of milestones for further uplift and value transformation
Appendices
20
Key figures
Shares on issue1 6601 mill
Shareholders1 5923
Market capitalisation1 $260 mill
Debt Nil
Current employees 23
Cooper Energy is an independent Australian exploration and
production company
bull Listed in 2002 history of profitable operations and successful
exploration and development
bull Strong balance sheet zero debt
bull Raised new equity capital of c$85 million during 2016
bull Management team and board experienced in growing resource
companies
bull Growth profile extending over 6 years from existing assets and
agreements
59
10
2
29
Share register
Institutional
Corporate
Employees amp Directors
Private
1 As at 20 March 2017
21
Oil exploration amp production
Cooper Basin Western Flank
240000 ndash 280000 1 bbl pa
Operating cost ltA$30bbl
High margin + exploration upside
Gas production amp sales Gas projects amp contracting
Otway Basin Casino Henry amp Minerva
Sales of ~7- 8 PJ pa to EnergyAustralia
Minerva1 gas plant
Production of 15 MMboe pa
Gippsland and Otway Basins
Sole Manta projects Otway uncontracted gas
gt400 PJ gas to be developed or uncontracted
Production uplift of up to 95 MMboe2 pa as
projects come online on top of existing output
1 Subject to completion of transaction2 Based on current equity participation levels
22
Phase 1 Sole
bull 2C Resource1 249 PJ
bull Sanction March 2017
bull Sole gas into plant March 2019
bull Output ~25 PJ pa
bull COE equity 100
Phase 2 Manta
bull 2C Resource1 106 PJ gas3 2 MMbbl liquids
bull Appraisal 2018-19
bull Sanction 2021
bull First gas ~2023
bull Output pa 25 PJ gas 039 MMbbl pa
bull Exploration Manta Deep amp Chimaera
bull COE equity 100
Orbost Gas Plant
bull Existing gas plant
bull Connected to Eastern Gas Pipeline
bull Plant owned amp operated by APA Group (proposed in HoA announced 27217
Longtom(Seven Group 100)
Patricia Baleen (COE 100)
Enabling customersUpstream and Midstream HoA
1 Cooper Energy announced Sole Contingent Resources on 27 February 2017 and Manta Contingent Resource 16 July 2015 Cooper Energy is not aware of any new information or data that materially affects the information provided in those releases and all material
assumptions and technical parameters underpinning the assessment provided in the announcement continues to apply See notes on page 29 for information on reserves and resources calculation
33 km
58 km
65 km
23
Sole Gas Project (VIC L32 COE100 Operator )
bull 249 PJ 2C Contingent Resource1
bull 20 PJ pa contracted gas contracts with O-I Australia AGL Energy Alinta Energy
EnergyAustralia
bull Sanction expected by March 2017 for Sole gas into plant by March 2019
Manta (VIC RL131415 COE 100)
bull 106 PJ 2C Contingent Resource plus 3 million barrels liquids1
bull economic business case identified subject to appraisal
bull prospective resource upside to be tested amp appraisal well expected 2018
Patricia-Baleen (VICL21 COE 100)
bull Non-operating field shut in
bull Strategic significance as access point for Orbost Gas Plant for other fields
1 Reserves and Contingent Resources at 1 January 2017 were announced to the ASX on 27 February 2017 and an announcement on Manta Contingent Resource was announced on 16 July 2015 The resources information displayed should be read in conjunction with the information provided on the calculation of Reserves and Contingent Resources provided on page 29 Cooper Energy is not aware of any new information or data that materially affects the information provided in those releases and all material assumptions and technical parameters underpinning the assessment provided in the announcement continues to apply
24
Key Assets
bull Casino Henry gas project (50)
bull Minerva gas field and plant (10 interest)1
bull VICP44 exploration permit
Production (COE share effective from 1 January 2017)
bull Casino Henry (VICRL11 amp 12) 7 PJ pa supplied to EnergyAustralia
under contract expiring March 2018
bull Minerva (VICL22)~ 1 PJ pa (expected to deplete by mid 2017)
Plans
bull Preparation for operatorship transfer likely June 2017
bull Marketing of uncontracted gas available for sale from March 2018
bull Casino Henry development well
1Acquisition of 10 interest in Minerva agreed with Santos Ltd is subject to completion
25
bull First half production of 013 MMbbl vs 017 in H1 FY16
bull Production impacted by suspension of drilling in low oil price FY16
bull Operating costs reduced from A$2992bbl to A$2928bbl
bull Drilling resumed in FY17 with 4 wells drilled 2 successful 2 P amp A
bull No further drilling planned for FY17
bull Producing interests
ndash PEL 92 25 interest (Beach Energy 75 amp Operator)
ndash PEL 93 30 interest (Senex Energy 70 amp Operator)
11 10
16 15
7 4
3530
FY16 H1 FY17
Production costs amp netback Direct cost A$ per barrel
NetbackRoyaltyTransportOperatingCosts per
bbl down 2
26
bull Take or pay gas
processing agreement
1 Cooper Energy to sell Orbost Gas Plant to APA Group
Heads of Agreement (non-binding) provides for APA to take ownership subject to Sole FID
2 APA to be responsible for funding and performance of ~$250 million plant upgrade and processing of gas from Sole amp Manta
Plant to be developed according to existing Sole Development Plan Sole gas to be processed under take or pay tariff agreement
3 Cooper Energy to retain 100 of upstream retains ownership of gas processed through Orbost Gas Plant
Estimated project cost for Cooper Energy reduced to ~$355 million and opportunity to realise further value accretion in sell-down post FID
Orbost Gas Plant APA Group 100
APA
bull funds and completes plant upgrade
for Sole
bull operates plant for agreed tariff amp
provides processed sales gas to
EGP
Sole gas
field
COE 100
COE
bull manages upstream
development
bull supplies gas to Orbost
for processing
bull markets the gas
Upstream Midstream
Downstream COE retains ownership of gas
through to point of sale to customers
in EGP
Transaction elements
1refer joint APA Group Cooper Energy announcement 27 February 2017
27
28
3 5
2 7 7 6 7 7 6 5 4
1
1520 20 20 20
2020
20
16
10
6
10 5 5 5 55
55 9
9
25 25 25
18
10
75
1
FY17 FY18 FY19 FY20 FY21 FY22 FY23 FY24 FY25 FY26 FY27 FY28 FY29
Gas production profile by projectcontracted amp uncontracted PJ pa
Manta uncontracted
Sole uncontracted
Sole contracted
Otway uncontracted
Otway contracted
Otway 2P reserves
Casino Henry
Gippsland Gas Project Phase 1
Sole
Gippsland Gas Project Phase 2
Manta
Assumes
bull Sole sanction by March quarter 2017 for March quarter 2019 first Sole gas to plant
bull All contract options in respect of Sole field are exercised
bull Manta subject to Manta 3 appraisal well Manta profile illustrates all Manta gas as uncontracted (including 4 PJ pa option held by
AGL) Manta profile includes 106 PJ 2C resource and additional 10 PJ anticipated
bull Development well required for Casino Henry ~2020
bull No exploration success
29
Reserves
Proved
(1P)
Proved amp Probable
(2P)
Proved Probable amp Possible
(3P)
Cooper1 Otway2 Total Cooper1 Otway2 Total Cooper1 Otway2 Total
Developed
Sales Gas PJ 00 48 48 00 152 152 00 293 293
Oil + Condensate MMbbl 05 00 05 09 00 09 16 00 16
Total developed MMboe2 05 08 13 09 26 35 16 51 67
Undeveloped
Sales Gas PJ 00 344 344 00 451 451 00 627 627
Oil + Condensate PJ 01 00 02 03 11 03 05 01 05
Total undeveloped MMboe2 01 60 61 03 78 81 05 109 113
Total1 MMboe2 07 68 74 11 104 116 21 159 180
Contingent
Resources
1C 2C 3C
Gas Oil Total1 Gas Oil Total Gas Oil Total
PJ MMbbl MMboe2 PJ MMbbl MMboe2 PJ MMbbl MMboe2
Gippsland 2917 40 541 3885 76 744 5336 121 1039
Cooper 02 00 003 03 00 01 06 00 01
Total 1 2919 40 542 3888 76 744 5342 121 1040
Additional information on reserve and resource calculation is provided in the appendices to this document
1 Totals may not reflect arithmetic addition due to rounding The method of aggregation is by arithmetic sum by category As a result the 1P estimate may be conservative and the 3P estimate may be optimistic due to the effects
of arithmetic summation The conversion factor of 1 PJ = 0172 MMboe has been used to convert from Sales Gas (PJ) to Oil Equivalent (MMboe) 2 The reserves revisions include Cooper Energyrsquos share of future crude fuel
usage in the Cooper Basin The estimated fuel usage for PEL 92 is 1P 002 MMbbl 2P 003 MMbbl and 3P 006 MMbbl The estimated fuel usage for the Worrior Field (PPL 207) is 1P 001 MMbbl 2P 002 MMbbl and 3P 003
MMbbl 3 The Otway gas reserves for Casino Henry and Netherby fields are net of fuel gas
1 Totals may not reflect arithmetic addition due to rounding The method of aggregation is by arithmetic sum by category As a result the 1C estimate may be conservative and the 3C estimate may be optimistic due to the
effects of arithmetic summation 2 The conversion factor of 1 PJ = 0172 MMboe has been used to convert from Sales Gas (PJ) to Oil Equivalent (MMboe)
30
General Manager Operations
Iain MacDougallIain MacDougall has more than 25
yearsrsquo experience in the upstream
petroleum exploration and production
sector including senior management
roles within independent operators
and international experience with
Schlumberger In Australia previous
employment includes Stuart
Petroleum as Production and
Engineering Manager and then as
acting CEO prior to the takeover of
Stuart Petroleum by Senex Energy
Managing Director
David MaxwellDavid Maxwell has over 30 yearsrsquo
experience as a senior executive with
companies such as BG Group Woodside
and Santos As Senior Vice President at
QGC a BG Group business he led BGrsquos
entry into Australia its alliance with and
subsequent takeover of QGC Roles at
Woodside included director of gas and
marketing and membership of Woodsidersquos
executive committee
General Manager Exploration
amp Subsurface
Andrew ThomasAndrew Thomas is a successful
geoscientist with over 28 yearsrsquo
experience in oil and gas exploration
and development in companies
including Geoscience Australia
Santos Gulf Canada and Newfield
Exploration At Newfield he was SE
Asia New Ventures Manager and
Exploration Manager for offshore
Sarawak
Executive Director
Hector GordonHector Gordon is a highly
experienced geologist with over 35
yearsrsquo experience in the petroleum
industry Previous roles include
Managing Director Somerton
Energy and a number of senior
management and technical roles at
Beach Energy including Exploration
Manager Chief Operating Officer
and ultimately Chief Executive
Officer
Alison Evans is an experienced
company secretary and corporate legal
counsel with extensive knowledge of
corporate and commercial law in the
resources and energy sectors
Alison has held Company Secretary
and Legal Counsel roles at a number of
minerals and energy companies
including Centrex Metals GTL Energy
and AGL Ms Evans public company
experience is supported by her work at
leading corporate law firms
Company Secretary and
General Counsel
Alison Evans
General Manager Development
Duncan CleggDuncan Clegg has over 35 yearsrsquo
experience in upstream and midstream oil
and gas development including
management positions at Shell and
Woodside leading oil and gas
developments including FPSO subsea
and fixed platforms developments At
Woodside Duncan held several senior
executive positions including Director of
the Australian Business Unit Director of
the African Business Unit and CEO of the
North West Shelf Venture
Eddy Glavas has more than 18 years
experience in business development
finance commercial portfolio
management and strategy including 14
years in the oil and gas sector Prior to
joining Cooper Energy he was
employed by Santos as Manager
Corporate Development with
responsibility for managing multi-
disciplinary teams tasked with mergers
acquisitions partnerships and
divestitures
General Manager Commercial amp
Business Development
Eddy Glavas
Virginia Suttell is a chartered accountant
with more than 20 years experience
including 16 years in publicly listed entities
principally in group finance and secretarial
roles in the resources and media sectors
This has included the role of Chief Financial
Officer and Company Secretary for Monax
Mining Limited and Marmota Energy Limited
from 2007 to 2016 and 2007 to 2015
respectively Other previous appointments
include Group Financial Controller at
Austereo Group Limited
Chief Financial Officer
(Acting)
Virginia Suttell
31
The approach for all reserve and resource calculations is consistent with the definitions and guidelines in the Society of Petroleum Engineers (SPE) 2007 Petroleum Resources Management System (PRMS) The resource estimate methodologies incorporate a range of uncertainty relating to each of the key reservoir input parameters to predict the likely range of outcomes Cooper Energy has completed its own estimation of reserves and contingent resources based on information provided by the permit Operators Beach Energy Ltd Senex Ltd and Santos Ltd and in accordance with the definitions and guidelines in the Society of Petroleum Engineers (SPE) 2007 Petroleum Resources Management System (PRMS) Petroleum Reserves and Contingent Resources are prepared using deterministic and probabilistic methods The method of aggregation for all reserves and contingent resources tables is by arithmetic summation by category Aggregated 1P and 1C estimates may be conservative and aggregated 3P and 3C estimates may be optimistic due to the effects of arithmetic summation Totals may not exactly reflect arithmetic addition due to rounding
The information contained in this report regarding the Cooper Energy reserves and contingent resources is based on and fairly represents information and supporting documentation reviewed by Mr Andrew Thomas who is a full-time employee of Cooper Energy Limited holding the position of General Manager Exploration amp Subsurface holds a Bachelor of Science (Hons) is a member of the American Association of Petroleum Geologists and the Society of Petroleum Engineers is qualified in accordance with ASX listing rule 541 and has consented to the inclusion of this information in the form and context in which it appears
The Cooper Basin totals comprise the probabilistically aggregated PEL 92 project fields and the arithmetic summation of the Worrior project reserves Total includes 005 MMbbl oil reserves used for field fuel The Indonesia totals include removal of non-shareable oil (NSO) and comprise the probabilistically aggregated Tangai-Sukananti KSO project fields Totals are derived by arithmetic summation In the Otway Basin reserves for the Casino Henry and Netherby fields have been assessed by Cooper Energy The Reserves have been assessed using deterministic and probabilistic methodologies for the Waarre Formation at the Casino Henry and Netherby fields This methodology incorporates a range of uncertainty relating to each of the key reservoir input parameters to predict the likely range of outcomes Cooper Energy undertook the following analytical procedures to estimate the Reserves independent interpretation of 3D seismic data analysis of historical production data to assess accessed gas volumes and future production forecasts review of the Operatorrsquos reservoir and production simulation models to define raw gas recovery consistent with existing processing facilities and independent probabilistic Monte Carlo statistical calculations to establish the range of recoverable gas The Otway gas reserves for Casino Henry and Netherby fields are net of fuel gas The date of the Casino Henry and Netherby Reserve Assessment is 27 February 2017
Sole gas field The contingent resource for the Sole field has been re-estimated assuming a two well subsea development plan Advantages of a two well plan compared to the previous single well development includeincreased 2C estimate attributable to accessing previously undeveloped gas and reduced technical risk and enhanced field redundancy providing increased security of supply to the gas processing and gas sales agreements Contingent resources for the Sole field were released to the ASX on 26 November 2015 Post-acquisition of the remaining 50 equity in the Sole gas field the following methodologies were used by Cooper Energy to re-calculate the Sole contingent resource estimate probabilistic simulation modelling for the Kingfish Formation incorporation of a range of uncertainty relating to each of the key reservoir input parameters to predict the likely range of outcomes and review of the reservoir and simulation modelling assuming a two well subsea development The date of the Sole contingent resource assessment is 27 February 2017
Manta gas and oil field Contingent and Prospective Resources have been assessed using deterministic simulation modelling and probabilistic resource estimation for the Intra-Latrobe and Golden Beach Sub-Group in the Manta field This methodology incorporates a range of uncertainty relating to each of the key reservoir input parameters to predict the likely range of outcomes The conversion factor of 1PJ = 0172MMboe has been used to convert from Sales Gas (PJ) to Oil Equivalent (MMboe) Contingent Resources for the Manta Field have been aggregated by arithmetic summation The date of the Manta Contingent Resource assessment is 16 July 2015 and the assessment was announced to the ASX on 16 July 2015 Cooper Energy is not aware of any new information or data that materially affects the information provided in that release and all material assumptions and technical parameters underpinning the assessment provided in the announcement continues to apply
Basker gas and oil field Contingent and Resources have been assessed using deterministic simulation modelling and probabilistic resource estimation for the Intra-Latrobe Sub-Group in the Basker field This methodology incorporates a range of uncertainty relating to each of the key reservoir input parameters to predict the likely range of outcomes The conversion factor of 1PJ = 0172MMboe has been used to convert from Sales Gas (PJ) to Oil Equivalent (MMboe) Contingent Resources for the Basker Field have been aggregated by arithmetic summation The date of the Basker Contingent Resource assessment is 15 August 2014 and the assessment was announced to the ASX on 18 August 2014 Cooper Energy is not aware of any new information or data that materially affects the information provided in that release and all material assumptions and technical parameters underpinning the assessment provided in the announcement continues to apply
32
$ A$ Australian dollars unless specified otherwise
Bbl barrels of oil
boe barrel of oil equivalent
bopd barrel of oil per day
EBITDA earnings before interest tax depreciation and amortisation
FEED Front end engineering and design
kbbls thousand barrels
LTIFR Lost Time Injury Frequency Rate Lost Time Incidents per million man hours worked
MMbbl million barrels of oil
MMboe million barrels of oil equivalent
NOPSEMA National Offshore Petroleum Safety amp Environmental Management Authority
NOPTA National Offshore Petroleum Titles Administrator
NPAT net profit after tax
PEL 92 Joint Venture conducting operations in Western Flank Cooper Basin Petroleum Retention Licences 85 ndash 104 previously encompassed by
the PEL 92 exploration licence
TRCFR Total Recordable Case Frequency Rate Recordable cases per million hours worked
TSR total shareholder return
1P reserves Proved reserves
2P reserves Proved and Probable reserves
3P Proved Probable and Possible reserves
1C 2C 3C high medium and low estimates of contingent resources
- 1WRM Investor presentation March 2017
-
- Slide Number 1
- Disclaimer
- Slide Number 3
- Slide Number 4
- Slide Number 5
- Slide Number 6
- Slide Number 7
- Slide Number 8
- Slide Number 9
- Slide Number 10
- Slide Number 11
- Gold and Silver development asset with a definitive feasibility study (DFS) commenced
- Slide Number 13
- Slide Number 14
- Slide Number 15
- Slide Number 16
- Slide Number 17
- Slide Number 18
- Slide Number 19
- Slide Number 20
- Slide Number 21
- Slide Number 22
- Slide Number 23
- Slide Number 24
- Slide Number 25
- Slide Number 26
- Slide Number 27
- Slide Number 28
- Slide Number 29
- Mount Carrington Resource Statement
- Slide Number 31
- Slide Number 32
- Slide Number 33
- Slide Number 34
- Slide Number 35
- Slide Number 36
- Slide Number 37
-
- 2Aurelia Metals Presentation-Mar 2017-widescreen format
-
- Slide Number 1
- Slide Number 2
- Slide Number 3
- Slide Number 4
- Slide Number 5
- Slide Number 6
- Slide Number 7
- Slide Number 8
- Slide Number 9
- Slide Number 10
- Slide Number 11
- Slide Number 12
- Slide Number 13
- Slide Number 14
- Slide Number 15
- Slide Number 16
- Slide Number 17
- Slide Number 18
- Slide Number 19
- Slide Number 20
- Slide Number 21
-
- 320170321 Presentations Melbourne Mining Club Speaker
-

10
03
Jun-16 Jan-17
FY17 production1
MMboe expected
Gas
Oil
1
49 76
367
668
Jun-16 Jan-17
Contingent resources (2C)12
MMboe
Gas
Oil13
11
104
Jun-16 Jan-17
2P reserves12
MMboe
bull Addition of Otway gas production Jan to Jun 17
bull Gas accounts for 75 of anticipated FY17 production
bull Addition of 60 PJ of Otway Basin gas reserves
bull Gas accounts for 90 of 116 MMboe 2P reserves
bull Australian contingent resources 2C up 79
bull 128 PJ gas contingent resources (2C) added in Gippsland
116
416
744
1Australia only 2 Reserves and Contingent Resources at 1 January 2017 were announced to the ASX on 27 February 2017 and should be read in conjunction with the information provided on the calculation
of Reserves and Contingent Resources provided on page 29 Cooper Energy is not aware of any new information or data that materially affects the information provided in those releases and
all material assumptions and technical parameters underpinning the assessment provided in the announcement continues to apply
11
Forecast 1 south-east Australian gas demand and production
PJ pa
South-east Australia comprises NSW VIC SA and Tasmania
SE Australia demandsup1
1 EnergyQuest Energy Quarterly March 2017
0
10
20
30
40
50
60
70
80
90
100
2017 2018 2019 2020 2021 2022 2023 2024
Cooper Energy gas production profilePJ pa
Manta(100)
Sole (100)
Casino
bull Casino Henry gas contracted to February 2018
bull Casino Henry gas available to contract from March 2018
bull COE may sell down some of Sole Gas Project and Manta post
Sole FID
0
100
200
300
400
500
600
2016 2018 2020 2022 2024 2026 2028 2030 2032 2034 2036
Most certain supply tranche Less certain supply tranche
Least certain supply tranche Southern demand
12Source AEMO
13
1 Assumes
bull Sole sanction by March quarter 2017 for March quarter 2019 first Sole gas
to plant
bull Manta 3 appraisal well
bull Development well required for Casino Henry ~2020
bull Details on slide 26
3 5 1
1520 20 20 20 20 20 20
16102
13
17 11
37 36 36
28
1913
15
10
FY17 FY18 FY19 FY20 FY21 FY22 FY23 FY24 FY25 FY26 FY27 FY28 FY29
Gas production1 from current assets contracted amp uncontractedPJ pa
Uncontracted
Contracted
227 PJ comprises 52 PJ 2P Casino Henry gas and 175 PJ 2C Contingent uncontracted gas from Sole and Manta Profile illustrated includes additional 10 PJ anticipated from Manta Cooper Energy announced Sole Contingent Resources on 27 February 2017 and Manta Contingent Resource 16 July 2015 Cooper Energy is not aware of any new information or data that materially affects the information provided in those releases and all material assumptions and technical parameters underpinning the assessment provided in the announcement continues to apply See notes on page 29 for information on reserves and resources calculation
14
Resource economics
Health amp safety
Environment
CommunityFiscaldividend
SuccessfulSustainable
Value-generating resource
development
Balance not achieved people hurt project collapse uneconomic no community
benefit no fiscal dividend excessive energy
costs
Balance achieved safe environmentally
sound development
cost effective sustainable energy
community benefits
fiscal dividend
15
Casino Henry
bull Sustained growth profile over 6 years
bull Gas accounts for overwhelming majority of production
bull New assets and production profile generates
ndash FY17 production gt2x FY16 production
ndash FY19 production gt5x FY16 production
ndash FY22 production gt20x FY16 production
0
2
4
6
8
10
12
FY15 FY16 FY17 FY18 FY19 FY20 FY21 FY22 FY23 FY24
Production1
MMboe
Sole Gas Project
Manta Gas Project
Casino-Henry
Cooper Basin oil
Assumes1
bull Current equities COE may divest some Gippsland post Sole sanction
bull Sole sanction by March quarter 2017 for March quarter 2019 Sole gas to plant
bull Manta 3 appraisal well
bull Development well required for Casino Henry ~2020
bull No new exploration success
16
Sole FID
bull Financial commitment to project
bull Triggers 43 MMboe uplift in gas reserves
bull Translation of HoA with APA to formal agreement
bull Expected shortly after project sanction
Uncontracted Otway gas
bull Contracting gas to supply from March 2018
bull Expect to secure new agreements in winter 2017 with market reflective price
Operator status
bull Working to appointment as Operator in Gippsland and Otway
bull Enables cost efficiencies and competitive advantage as asset owner and JV participant
Beyond June 2017
bull Cooper Basin assets
bull Divest slice of Gippsland Basin portfolio
bull Manta exploration
13116
~53
Jun-16 Jan-17 June -17Proforma
Uplift in 2P reservesMMboe
Australia only Assumes commitment of Sole gas project provides uplift of
~43 MMboe
1
2
3
4
17
1 Execution of our gas strategy has deliveredCooper Energy has become a supplier and developer of gas for south east Australia at a time of great market need
2 FY17 growth is the first step of larger and sustainable growthReserves and production upgrades in the current year are the initial instalment of a 6 year growth trajectory offering gt 20 times growth in
production from existing assets and equities
3 Integration proceeding management capabilities have been reinforced consistent with growthUpgraded people resources with the addition of proven performance orientated executives integration is proceeding to schedule
4 Sole project stronger and proceeding to final phase financingProject now offering lower risk lower capital cost increased gas and increased returns and value upside for Cooper Energy shareholders
5 Milestones aheadSix months to June 17 is expected to see a number of milestones for further uplift and value transformation
Appendices
20
Key figures
Shares on issue1 6601 mill
Shareholders1 5923
Market capitalisation1 $260 mill
Debt Nil
Current employees 23
Cooper Energy is an independent Australian exploration and
production company
bull Listed in 2002 history of profitable operations and successful
exploration and development
bull Strong balance sheet zero debt
bull Raised new equity capital of c$85 million during 2016
bull Management team and board experienced in growing resource
companies
bull Growth profile extending over 6 years from existing assets and
agreements
59
10
2
29
Share register
Institutional
Corporate
Employees amp Directors
Private
1 As at 20 March 2017
21
Oil exploration amp production
Cooper Basin Western Flank
240000 ndash 280000 1 bbl pa
Operating cost ltA$30bbl
High margin + exploration upside
Gas production amp sales Gas projects amp contracting
Otway Basin Casino Henry amp Minerva
Sales of ~7- 8 PJ pa to EnergyAustralia
Minerva1 gas plant
Production of 15 MMboe pa
Gippsland and Otway Basins
Sole Manta projects Otway uncontracted gas
gt400 PJ gas to be developed or uncontracted
Production uplift of up to 95 MMboe2 pa as
projects come online on top of existing output
1 Subject to completion of transaction2 Based on current equity participation levels
22
Phase 1 Sole
bull 2C Resource1 249 PJ
bull Sanction March 2017
bull Sole gas into plant March 2019
bull Output ~25 PJ pa
bull COE equity 100
Phase 2 Manta
bull 2C Resource1 106 PJ gas3 2 MMbbl liquids
bull Appraisal 2018-19
bull Sanction 2021
bull First gas ~2023
bull Output pa 25 PJ gas 039 MMbbl pa
bull Exploration Manta Deep amp Chimaera
bull COE equity 100
Orbost Gas Plant
bull Existing gas plant
bull Connected to Eastern Gas Pipeline
bull Plant owned amp operated by APA Group (proposed in HoA announced 27217
Longtom(Seven Group 100)
Patricia Baleen (COE 100)
Enabling customersUpstream and Midstream HoA
1 Cooper Energy announced Sole Contingent Resources on 27 February 2017 and Manta Contingent Resource 16 July 2015 Cooper Energy is not aware of any new information or data that materially affects the information provided in those releases and all material
assumptions and technical parameters underpinning the assessment provided in the announcement continues to apply See notes on page 29 for information on reserves and resources calculation
33 km
58 km
65 km
23
Sole Gas Project (VIC L32 COE100 Operator )
bull 249 PJ 2C Contingent Resource1
bull 20 PJ pa contracted gas contracts with O-I Australia AGL Energy Alinta Energy
EnergyAustralia
bull Sanction expected by March 2017 for Sole gas into plant by March 2019
Manta (VIC RL131415 COE 100)
bull 106 PJ 2C Contingent Resource plus 3 million barrels liquids1
bull economic business case identified subject to appraisal
bull prospective resource upside to be tested amp appraisal well expected 2018
Patricia-Baleen (VICL21 COE 100)
bull Non-operating field shut in
bull Strategic significance as access point for Orbost Gas Plant for other fields
1 Reserves and Contingent Resources at 1 January 2017 were announced to the ASX on 27 February 2017 and an announcement on Manta Contingent Resource was announced on 16 July 2015 The resources information displayed should be read in conjunction with the information provided on the calculation of Reserves and Contingent Resources provided on page 29 Cooper Energy is not aware of any new information or data that materially affects the information provided in those releases and all material assumptions and technical parameters underpinning the assessment provided in the announcement continues to apply
24
Key Assets
bull Casino Henry gas project (50)
bull Minerva gas field and plant (10 interest)1
bull VICP44 exploration permit
Production (COE share effective from 1 January 2017)
bull Casino Henry (VICRL11 amp 12) 7 PJ pa supplied to EnergyAustralia
under contract expiring March 2018
bull Minerva (VICL22)~ 1 PJ pa (expected to deplete by mid 2017)
Plans
bull Preparation for operatorship transfer likely June 2017
bull Marketing of uncontracted gas available for sale from March 2018
bull Casino Henry development well
1Acquisition of 10 interest in Minerva agreed with Santos Ltd is subject to completion
25
bull First half production of 013 MMbbl vs 017 in H1 FY16
bull Production impacted by suspension of drilling in low oil price FY16
bull Operating costs reduced from A$2992bbl to A$2928bbl
bull Drilling resumed in FY17 with 4 wells drilled 2 successful 2 P amp A
bull No further drilling planned for FY17
bull Producing interests
ndash PEL 92 25 interest (Beach Energy 75 amp Operator)
ndash PEL 93 30 interest (Senex Energy 70 amp Operator)
11 10
16 15
7 4
3530
FY16 H1 FY17
Production costs amp netback Direct cost A$ per barrel
NetbackRoyaltyTransportOperatingCosts per
bbl down 2
26
bull Take or pay gas
processing agreement
1 Cooper Energy to sell Orbost Gas Plant to APA Group
Heads of Agreement (non-binding) provides for APA to take ownership subject to Sole FID
2 APA to be responsible for funding and performance of ~$250 million plant upgrade and processing of gas from Sole amp Manta
Plant to be developed according to existing Sole Development Plan Sole gas to be processed under take or pay tariff agreement
3 Cooper Energy to retain 100 of upstream retains ownership of gas processed through Orbost Gas Plant
Estimated project cost for Cooper Energy reduced to ~$355 million and opportunity to realise further value accretion in sell-down post FID
Orbost Gas Plant APA Group 100
APA
bull funds and completes plant upgrade
for Sole
bull operates plant for agreed tariff amp
provides processed sales gas to
EGP
Sole gas
field
COE 100
COE
bull manages upstream
development
bull supplies gas to Orbost
for processing
bull markets the gas
Upstream Midstream
Downstream COE retains ownership of gas
through to point of sale to customers
in EGP
Transaction elements
1refer joint APA Group Cooper Energy announcement 27 February 2017
27
28
3 5
2 7 7 6 7 7 6 5 4
1
1520 20 20 20
2020
20
16
10
6
10 5 5 5 55
55 9
9
25 25 25
18
10
75
1
FY17 FY18 FY19 FY20 FY21 FY22 FY23 FY24 FY25 FY26 FY27 FY28 FY29
Gas production profile by projectcontracted amp uncontracted PJ pa
Manta uncontracted
Sole uncontracted
Sole contracted
Otway uncontracted
Otway contracted
Otway 2P reserves
Casino Henry
Gippsland Gas Project Phase 1
Sole
Gippsland Gas Project Phase 2
Manta
Assumes
bull Sole sanction by March quarter 2017 for March quarter 2019 first Sole gas to plant
bull All contract options in respect of Sole field are exercised
bull Manta subject to Manta 3 appraisal well Manta profile illustrates all Manta gas as uncontracted (including 4 PJ pa option held by
AGL) Manta profile includes 106 PJ 2C resource and additional 10 PJ anticipated
bull Development well required for Casino Henry ~2020
bull No exploration success
29
Reserves
Proved
(1P)
Proved amp Probable
(2P)
Proved Probable amp Possible
(3P)
Cooper1 Otway2 Total Cooper1 Otway2 Total Cooper1 Otway2 Total
Developed
Sales Gas PJ 00 48 48 00 152 152 00 293 293
Oil + Condensate MMbbl 05 00 05 09 00 09 16 00 16
Total developed MMboe2 05 08 13 09 26 35 16 51 67
Undeveloped
Sales Gas PJ 00 344 344 00 451 451 00 627 627
Oil + Condensate PJ 01 00 02 03 11 03 05 01 05
Total undeveloped MMboe2 01 60 61 03 78 81 05 109 113
Total1 MMboe2 07 68 74 11 104 116 21 159 180
Contingent
Resources
1C 2C 3C
Gas Oil Total1 Gas Oil Total Gas Oil Total
PJ MMbbl MMboe2 PJ MMbbl MMboe2 PJ MMbbl MMboe2
Gippsland 2917 40 541 3885 76 744 5336 121 1039
Cooper 02 00 003 03 00 01 06 00 01
Total 1 2919 40 542 3888 76 744 5342 121 1040
Additional information on reserve and resource calculation is provided in the appendices to this document
1 Totals may not reflect arithmetic addition due to rounding The method of aggregation is by arithmetic sum by category As a result the 1P estimate may be conservative and the 3P estimate may be optimistic due to the effects
of arithmetic summation The conversion factor of 1 PJ = 0172 MMboe has been used to convert from Sales Gas (PJ) to Oil Equivalent (MMboe) 2 The reserves revisions include Cooper Energyrsquos share of future crude fuel
usage in the Cooper Basin The estimated fuel usage for PEL 92 is 1P 002 MMbbl 2P 003 MMbbl and 3P 006 MMbbl The estimated fuel usage for the Worrior Field (PPL 207) is 1P 001 MMbbl 2P 002 MMbbl and 3P 003
MMbbl 3 The Otway gas reserves for Casino Henry and Netherby fields are net of fuel gas
1 Totals may not reflect arithmetic addition due to rounding The method of aggregation is by arithmetic sum by category As a result the 1C estimate may be conservative and the 3C estimate may be optimistic due to the
effects of arithmetic summation 2 The conversion factor of 1 PJ = 0172 MMboe has been used to convert from Sales Gas (PJ) to Oil Equivalent (MMboe)
30
General Manager Operations
Iain MacDougallIain MacDougall has more than 25
yearsrsquo experience in the upstream
petroleum exploration and production
sector including senior management
roles within independent operators
and international experience with
Schlumberger In Australia previous
employment includes Stuart
Petroleum as Production and
Engineering Manager and then as
acting CEO prior to the takeover of
Stuart Petroleum by Senex Energy
Managing Director
David MaxwellDavid Maxwell has over 30 yearsrsquo
experience as a senior executive with
companies such as BG Group Woodside
and Santos As Senior Vice President at
QGC a BG Group business he led BGrsquos
entry into Australia its alliance with and
subsequent takeover of QGC Roles at
Woodside included director of gas and
marketing and membership of Woodsidersquos
executive committee
General Manager Exploration
amp Subsurface
Andrew ThomasAndrew Thomas is a successful
geoscientist with over 28 yearsrsquo
experience in oil and gas exploration
and development in companies
including Geoscience Australia
Santos Gulf Canada and Newfield
Exploration At Newfield he was SE
Asia New Ventures Manager and
Exploration Manager for offshore
Sarawak
Executive Director
Hector GordonHector Gordon is a highly
experienced geologist with over 35
yearsrsquo experience in the petroleum
industry Previous roles include
Managing Director Somerton
Energy and a number of senior
management and technical roles at
Beach Energy including Exploration
Manager Chief Operating Officer
and ultimately Chief Executive
Officer
Alison Evans is an experienced
company secretary and corporate legal
counsel with extensive knowledge of
corporate and commercial law in the
resources and energy sectors
Alison has held Company Secretary
and Legal Counsel roles at a number of
minerals and energy companies
including Centrex Metals GTL Energy
and AGL Ms Evans public company
experience is supported by her work at
leading corporate law firms
Company Secretary and
General Counsel
Alison Evans
General Manager Development
Duncan CleggDuncan Clegg has over 35 yearsrsquo
experience in upstream and midstream oil
and gas development including
management positions at Shell and
Woodside leading oil and gas
developments including FPSO subsea
and fixed platforms developments At
Woodside Duncan held several senior
executive positions including Director of
the Australian Business Unit Director of
the African Business Unit and CEO of the
North West Shelf Venture
Eddy Glavas has more than 18 years
experience in business development
finance commercial portfolio
management and strategy including 14
years in the oil and gas sector Prior to
joining Cooper Energy he was
employed by Santos as Manager
Corporate Development with
responsibility for managing multi-
disciplinary teams tasked with mergers
acquisitions partnerships and
divestitures
General Manager Commercial amp
Business Development
Eddy Glavas
Virginia Suttell is a chartered accountant
with more than 20 years experience
including 16 years in publicly listed entities
principally in group finance and secretarial
roles in the resources and media sectors
This has included the role of Chief Financial
Officer and Company Secretary for Monax
Mining Limited and Marmota Energy Limited
from 2007 to 2016 and 2007 to 2015
respectively Other previous appointments
include Group Financial Controller at
Austereo Group Limited
Chief Financial Officer
(Acting)
Virginia Suttell
31
The approach for all reserve and resource calculations is consistent with the definitions and guidelines in the Society of Petroleum Engineers (SPE) 2007 Petroleum Resources Management System (PRMS) The resource estimate methodologies incorporate a range of uncertainty relating to each of the key reservoir input parameters to predict the likely range of outcomes Cooper Energy has completed its own estimation of reserves and contingent resources based on information provided by the permit Operators Beach Energy Ltd Senex Ltd and Santos Ltd and in accordance with the definitions and guidelines in the Society of Petroleum Engineers (SPE) 2007 Petroleum Resources Management System (PRMS) Petroleum Reserves and Contingent Resources are prepared using deterministic and probabilistic methods The method of aggregation for all reserves and contingent resources tables is by arithmetic summation by category Aggregated 1P and 1C estimates may be conservative and aggregated 3P and 3C estimates may be optimistic due to the effects of arithmetic summation Totals may not exactly reflect arithmetic addition due to rounding
The information contained in this report regarding the Cooper Energy reserves and contingent resources is based on and fairly represents information and supporting documentation reviewed by Mr Andrew Thomas who is a full-time employee of Cooper Energy Limited holding the position of General Manager Exploration amp Subsurface holds a Bachelor of Science (Hons) is a member of the American Association of Petroleum Geologists and the Society of Petroleum Engineers is qualified in accordance with ASX listing rule 541 and has consented to the inclusion of this information in the form and context in which it appears
The Cooper Basin totals comprise the probabilistically aggregated PEL 92 project fields and the arithmetic summation of the Worrior project reserves Total includes 005 MMbbl oil reserves used for field fuel The Indonesia totals include removal of non-shareable oil (NSO) and comprise the probabilistically aggregated Tangai-Sukananti KSO project fields Totals are derived by arithmetic summation In the Otway Basin reserves for the Casino Henry and Netherby fields have been assessed by Cooper Energy The Reserves have been assessed using deterministic and probabilistic methodologies for the Waarre Formation at the Casino Henry and Netherby fields This methodology incorporates a range of uncertainty relating to each of the key reservoir input parameters to predict the likely range of outcomes Cooper Energy undertook the following analytical procedures to estimate the Reserves independent interpretation of 3D seismic data analysis of historical production data to assess accessed gas volumes and future production forecasts review of the Operatorrsquos reservoir and production simulation models to define raw gas recovery consistent with existing processing facilities and independent probabilistic Monte Carlo statistical calculations to establish the range of recoverable gas The Otway gas reserves for Casino Henry and Netherby fields are net of fuel gas The date of the Casino Henry and Netherby Reserve Assessment is 27 February 2017
Sole gas field The contingent resource for the Sole field has been re-estimated assuming a two well subsea development plan Advantages of a two well plan compared to the previous single well development includeincreased 2C estimate attributable to accessing previously undeveloped gas and reduced technical risk and enhanced field redundancy providing increased security of supply to the gas processing and gas sales agreements Contingent resources for the Sole field were released to the ASX on 26 November 2015 Post-acquisition of the remaining 50 equity in the Sole gas field the following methodologies were used by Cooper Energy to re-calculate the Sole contingent resource estimate probabilistic simulation modelling for the Kingfish Formation incorporation of a range of uncertainty relating to each of the key reservoir input parameters to predict the likely range of outcomes and review of the reservoir and simulation modelling assuming a two well subsea development The date of the Sole contingent resource assessment is 27 February 2017
Manta gas and oil field Contingent and Prospective Resources have been assessed using deterministic simulation modelling and probabilistic resource estimation for the Intra-Latrobe and Golden Beach Sub-Group in the Manta field This methodology incorporates a range of uncertainty relating to each of the key reservoir input parameters to predict the likely range of outcomes The conversion factor of 1PJ = 0172MMboe has been used to convert from Sales Gas (PJ) to Oil Equivalent (MMboe) Contingent Resources for the Manta Field have been aggregated by arithmetic summation The date of the Manta Contingent Resource assessment is 16 July 2015 and the assessment was announced to the ASX on 16 July 2015 Cooper Energy is not aware of any new information or data that materially affects the information provided in that release and all material assumptions and technical parameters underpinning the assessment provided in the announcement continues to apply
Basker gas and oil field Contingent and Resources have been assessed using deterministic simulation modelling and probabilistic resource estimation for the Intra-Latrobe Sub-Group in the Basker field This methodology incorporates a range of uncertainty relating to each of the key reservoir input parameters to predict the likely range of outcomes The conversion factor of 1PJ = 0172MMboe has been used to convert from Sales Gas (PJ) to Oil Equivalent (MMboe) Contingent Resources for the Basker Field have been aggregated by arithmetic summation The date of the Basker Contingent Resource assessment is 15 August 2014 and the assessment was announced to the ASX on 18 August 2014 Cooper Energy is not aware of any new information or data that materially affects the information provided in that release and all material assumptions and technical parameters underpinning the assessment provided in the announcement continues to apply
32
$ A$ Australian dollars unless specified otherwise
Bbl barrels of oil
boe barrel of oil equivalent
bopd barrel of oil per day
EBITDA earnings before interest tax depreciation and amortisation
FEED Front end engineering and design
kbbls thousand barrels
LTIFR Lost Time Injury Frequency Rate Lost Time Incidents per million man hours worked
MMbbl million barrels of oil
MMboe million barrels of oil equivalent
NOPSEMA National Offshore Petroleum Safety amp Environmental Management Authority
NOPTA National Offshore Petroleum Titles Administrator
NPAT net profit after tax
PEL 92 Joint Venture conducting operations in Western Flank Cooper Basin Petroleum Retention Licences 85 ndash 104 previously encompassed by
the PEL 92 exploration licence
TRCFR Total Recordable Case Frequency Rate Recordable cases per million hours worked
TSR total shareholder return
1P reserves Proved reserves
2P reserves Proved and Probable reserves
3P Proved Probable and Possible reserves
1C 2C 3C high medium and low estimates of contingent resources
- 1WRM Investor presentation March 2017
-
- Slide Number 1
- Disclaimer
- Slide Number 3
- Slide Number 4
- Slide Number 5
- Slide Number 6
- Slide Number 7
- Slide Number 8
- Slide Number 9
- Slide Number 10
- Slide Number 11
- Gold and Silver development asset with a definitive feasibility study (DFS) commenced
- Slide Number 13
- Slide Number 14
- Slide Number 15
- Slide Number 16
- Slide Number 17
- Slide Number 18
- Slide Number 19
- Slide Number 20
- Slide Number 21
- Slide Number 22
- Slide Number 23
- Slide Number 24
- Slide Number 25
- Slide Number 26
- Slide Number 27
- Slide Number 28
- Slide Number 29
- Mount Carrington Resource Statement
- Slide Number 31
- Slide Number 32
- Slide Number 33
- Slide Number 34
- Slide Number 35
- Slide Number 36
- Slide Number 37
-
- 2Aurelia Metals Presentation-Mar 2017-widescreen format
-
- Slide Number 1
- Slide Number 2
- Slide Number 3
- Slide Number 4
- Slide Number 5
- Slide Number 6
- Slide Number 7
- Slide Number 8
- Slide Number 9
- Slide Number 10
- Slide Number 11
- Slide Number 12
- Slide Number 13
- Slide Number 14
- Slide Number 15
- Slide Number 16
- Slide Number 17
- Slide Number 18
- Slide Number 19
- Slide Number 20
- Slide Number 21
-
- 320170321 Presentations Melbourne Mining Club Speaker
-

13
1 Assumes
bull Sole sanction by March quarter 2017 for March quarter 2019 first Sole gas
to plant
bull Manta 3 appraisal well
bull Development well required for Casino Henry ~2020
bull Details on slide 26
3 5 1
1520 20 20 20 20 20 20
16102
13
17 11
37 36 36
28
1913
15
10
FY17 FY18 FY19 FY20 FY21 FY22 FY23 FY24 FY25 FY26 FY27 FY28 FY29
Gas production1 from current assets contracted amp uncontractedPJ pa
Uncontracted
Contracted
227 PJ comprises 52 PJ 2P Casino Henry gas and 175 PJ 2C Contingent uncontracted gas from Sole and Manta Profile illustrated includes additional 10 PJ anticipated from Manta Cooper Energy announced Sole Contingent Resources on 27 February 2017 and Manta Contingent Resource 16 July 2015 Cooper Energy is not aware of any new information or data that materially affects the information provided in those releases and all material assumptions and technical parameters underpinning the assessment provided in the announcement continues to apply See notes on page 29 for information on reserves and resources calculation
14
Resource economics
Health amp safety
Environment
CommunityFiscaldividend
SuccessfulSustainable
Value-generating resource
development
Balance not achieved people hurt project collapse uneconomic no community
benefit no fiscal dividend excessive energy
costs
Balance achieved safe environmentally
sound development
cost effective sustainable energy
community benefits
fiscal dividend
15
Casino Henry
bull Sustained growth profile over 6 years
bull Gas accounts for overwhelming majority of production
bull New assets and production profile generates
ndash FY17 production gt2x FY16 production
ndash FY19 production gt5x FY16 production
ndash FY22 production gt20x FY16 production
0
2
4
6
8
10
12
FY15 FY16 FY17 FY18 FY19 FY20 FY21 FY22 FY23 FY24
Production1
MMboe
Sole Gas Project
Manta Gas Project
Casino-Henry
Cooper Basin oil
Assumes1
bull Current equities COE may divest some Gippsland post Sole sanction
bull Sole sanction by March quarter 2017 for March quarter 2019 Sole gas to plant
bull Manta 3 appraisal well
bull Development well required for Casino Henry ~2020
bull No new exploration success
16
Sole FID
bull Financial commitment to project
bull Triggers 43 MMboe uplift in gas reserves
bull Translation of HoA with APA to formal agreement
bull Expected shortly after project sanction
Uncontracted Otway gas
bull Contracting gas to supply from March 2018
bull Expect to secure new agreements in winter 2017 with market reflective price
Operator status
bull Working to appointment as Operator in Gippsland and Otway
bull Enables cost efficiencies and competitive advantage as asset owner and JV participant
Beyond June 2017
bull Cooper Basin assets
bull Divest slice of Gippsland Basin portfolio
bull Manta exploration
13116
~53
Jun-16 Jan-17 June -17Proforma
Uplift in 2P reservesMMboe
Australia only Assumes commitment of Sole gas project provides uplift of
~43 MMboe
1
2
3
4
17
1 Execution of our gas strategy has deliveredCooper Energy has become a supplier and developer of gas for south east Australia at a time of great market need
2 FY17 growth is the first step of larger and sustainable growthReserves and production upgrades in the current year are the initial instalment of a 6 year growth trajectory offering gt 20 times growth in
production from existing assets and equities
3 Integration proceeding management capabilities have been reinforced consistent with growthUpgraded people resources with the addition of proven performance orientated executives integration is proceeding to schedule
4 Sole project stronger and proceeding to final phase financingProject now offering lower risk lower capital cost increased gas and increased returns and value upside for Cooper Energy shareholders
5 Milestones aheadSix months to June 17 is expected to see a number of milestones for further uplift and value transformation
Appendices
20
Key figures
Shares on issue1 6601 mill
Shareholders1 5923
Market capitalisation1 $260 mill
Debt Nil
Current employees 23
Cooper Energy is an independent Australian exploration and
production company
bull Listed in 2002 history of profitable operations and successful
exploration and development
bull Strong balance sheet zero debt
bull Raised new equity capital of c$85 million during 2016
bull Management team and board experienced in growing resource
companies
bull Growth profile extending over 6 years from existing assets and
agreements
59
10
2
29
Share register
Institutional
Corporate
Employees amp Directors
Private
1 As at 20 March 2017
21
Oil exploration amp production
Cooper Basin Western Flank
240000 ndash 280000 1 bbl pa
Operating cost ltA$30bbl
High margin + exploration upside
Gas production amp sales Gas projects amp contracting
Otway Basin Casino Henry amp Minerva
Sales of ~7- 8 PJ pa to EnergyAustralia
Minerva1 gas plant
Production of 15 MMboe pa
Gippsland and Otway Basins
Sole Manta projects Otway uncontracted gas
gt400 PJ gas to be developed or uncontracted
Production uplift of up to 95 MMboe2 pa as
projects come online on top of existing output
1 Subject to completion of transaction2 Based on current equity participation levels
22
Phase 1 Sole
bull 2C Resource1 249 PJ
bull Sanction March 2017
bull Sole gas into plant March 2019
bull Output ~25 PJ pa
bull COE equity 100
Phase 2 Manta
bull 2C Resource1 106 PJ gas3 2 MMbbl liquids
bull Appraisal 2018-19
bull Sanction 2021
bull First gas ~2023
bull Output pa 25 PJ gas 039 MMbbl pa
bull Exploration Manta Deep amp Chimaera
bull COE equity 100
Orbost Gas Plant
bull Existing gas plant
bull Connected to Eastern Gas Pipeline
bull Plant owned amp operated by APA Group (proposed in HoA announced 27217
Longtom(Seven Group 100)
Patricia Baleen (COE 100)
Enabling customersUpstream and Midstream HoA
1 Cooper Energy announced Sole Contingent Resources on 27 February 2017 and Manta Contingent Resource 16 July 2015 Cooper Energy is not aware of any new information or data that materially affects the information provided in those releases and all material
assumptions and technical parameters underpinning the assessment provided in the announcement continues to apply See notes on page 29 for information on reserves and resources calculation
33 km
58 km
65 km
23
Sole Gas Project (VIC L32 COE100 Operator )
bull 249 PJ 2C Contingent Resource1
bull 20 PJ pa contracted gas contracts with O-I Australia AGL Energy Alinta Energy
EnergyAustralia
bull Sanction expected by March 2017 for Sole gas into plant by March 2019
Manta (VIC RL131415 COE 100)
bull 106 PJ 2C Contingent Resource plus 3 million barrels liquids1
bull economic business case identified subject to appraisal
bull prospective resource upside to be tested amp appraisal well expected 2018
Patricia-Baleen (VICL21 COE 100)
bull Non-operating field shut in
bull Strategic significance as access point for Orbost Gas Plant for other fields
1 Reserves and Contingent Resources at 1 January 2017 were announced to the ASX on 27 February 2017 and an announcement on Manta Contingent Resource was announced on 16 July 2015 The resources information displayed should be read in conjunction with the information provided on the calculation of Reserves and Contingent Resources provided on page 29 Cooper Energy is not aware of any new information or data that materially affects the information provided in those releases and all material assumptions and technical parameters underpinning the assessment provided in the announcement continues to apply
24
Key Assets
bull Casino Henry gas project (50)
bull Minerva gas field and plant (10 interest)1
bull VICP44 exploration permit
Production (COE share effective from 1 January 2017)
bull Casino Henry (VICRL11 amp 12) 7 PJ pa supplied to EnergyAustralia
under contract expiring March 2018
bull Minerva (VICL22)~ 1 PJ pa (expected to deplete by mid 2017)
Plans
bull Preparation for operatorship transfer likely June 2017
bull Marketing of uncontracted gas available for sale from March 2018
bull Casino Henry development well
1Acquisition of 10 interest in Minerva agreed with Santos Ltd is subject to completion
25
bull First half production of 013 MMbbl vs 017 in H1 FY16
bull Production impacted by suspension of drilling in low oil price FY16
bull Operating costs reduced from A$2992bbl to A$2928bbl
bull Drilling resumed in FY17 with 4 wells drilled 2 successful 2 P amp A
bull No further drilling planned for FY17
bull Producing interests
ndash PEL 92 25 interest (Beach Energy 75 amp Operator)
ndash PEL 93 30 interest (Senex Energy 70 amp Operator)
11 10
16 15
7 4
3530
FY16 H1 FY17
Production costs amp netback Direct cost A$ per barrel
NetbackRoyaltyTransportOperatingCosts per
bbl down 2
26
bull Take or pay gas
processing agreement
1 Cooper Energy to sell Orbost Gas Plant to APA Group
Heads of Agreement (non-binding) provides for APA to take ownership subject to Sole FID
2 APA to be responsible for funding and performance of ~$250 million plant upgrade and processing of gas from Sole amp Manta
Plant to be developed according to existing Sole Development Plan Sole gas to be processed under take or pay tariff agreement
3 Cooper Energy to retain 100 of upstream retains ownership of gas processed through Orbost Gas Plant
Estimated project cost for Cooper Energy reduced to ~$355 million and opportunity to realise further value accretion in sell-down post FID
Orbost Gas Plant APA Group 100
APA
bull funds and completes plant upgrade
for Sole
bull operates plant for agreed tariff amp
provides processed sales gas to
EGP
Sole gas
field
COE 100
COE
bull manages upstream
development
bull supplies gas to Orbost
for processing
bull markets the gas
Upstream Midstream
Downstream COE retains ownership of gas
through to point of sale to customers
in EGP
Transaction elements
1refer joint APA Group Cooper Energy announcement 27 February 2017
27
28
3 5
2 7 7 6 7 7 6 5 4
1
1520 20 20 20
2020
20
16
10
6
10 5 5 5 55
55 9
9
25 25 25
18
10
75
1
FY17 FY18 FY19 FY20 FY21 FY22 FY23 FY24 FY25 FY26 FY27 FY28 FY29
Gas production profile by projectcontracted amp uncontracted PJ pa
Manta uncontracted
Sole uncontracted
Sole contracted
Otway uncontracted
Otway contracted
Otway 2P reserves
Casino Henry
Gippsland Gas Project Phase 1
Sole
Gippsland Gas Project Phase 2
Manta
Assumes
bull Sole sanction by March quarter 2017 for March quarter 2019 first Sole gas to plant
bull All contract options in respect of Sole field are exercised
bull Manta subject to Manta 3 appraisal well Manta profile illustrates all Manta gas as uncontracted (including 4 PJ pa option held by
AGL) Manta profile includes 106 PJ 2C resource and additional 10 PJ anticipated
bull Development well required for Casino Henry ~2020
bull No exploration success
29
Reserves
Proved
(1P)
Proved amp Probable
(2P)
Proved Probable amp Possible
(3P)
Cooper1 Otway2 Total Cooper1 Otway2 Total Cooper1 Otway2 Total
Developed
Sales Gas PJ 00 48 48 00 152 152 00 293 293
Oil + Condensate MMbbl 05 00 05 09 00 09 16 00 16
Total developed MMboe2 05 08 13 09 26 35 16 51 67
Undeveloped
Sales Gas PJ 00 344 344 00 451 451 00 627 627
Oil + Condensate PJ 01 00 02 03 11 03 05 01 05
Total undeveloped MMboe2 01 60 61 03 78 81 05 109 113
Total1 MMboe2 07 68 74 11 104 116 21 159 180
Contingent
Resources
1C 2C 3C
Gas Oil Total1 Gas Oil Total Gas Oil Total
PJ MMbbl MMboe2 PJ MMbbl MMboe2 PJ MMbbl MMboe2
Gippsland 2917 40 541 3885 76 744 5336 121 1039
Cooper 02 00 003 03 00 01 06 00 01
Total 1 2919 40 542 3888 76 744 5342 121 1040
Additional information on reserve and resource calculation is provided in the appendices to this document
1 Totals may not reflect arithmetic addition due to rounding The method of aggregation is by arithmetic sum by category As a result the 1P estimate may be conservative and the 3P estimate may be optimistic due to the effects
of arithmetic summation The conversion factor of 1 PJ = 0172 MMboe has been used to convert from Sales Gas (PJ) to Oil Equivalent (MMboe) 2 The reserves revisions include Cooper Energyrsquos share of future crude fuel
usage in the Cooper Basin The estimated fuel usage for PEL 92 is 1P 002 MMbbl 2P 003 MMbbl and 3P 006 MMbbl The estimated fuel usage for the Worrior Field (PPL 207) is 1P 001 MMbbl 2P 002 MMbbl and 3P 003
MMbbl 3 The Otway gas reserves for Casino Henry and Netherby fields are net of fuel gas
1 Totals may not reflect arithmetic addition due to rounding The method of aggregation is by arithmetic sum by category As a result the 1C estimate may be conservative and the 3C estimate may be optimistic due to the
effects of arithmetic summation 2 The conversion factor of 1 PJ = 0172 MMboe has been used to convert from Sales Gas (PJ) to Oil Equivalent (MMboe)
30
General Manager Operations
Iain MacDougallIain MacDougall has more than 25
yearsrsquo experience in the upstream
petroleum exploration and production
sector including senior management
roles within independent operators
and international experience with
Schlumberger In Australia previous
employment includes Stuart
Petroleum as Production and
Engineering Manager and then as
acting CEO prior to the takeover of
Stuart Petroleum by Senex Energy
Managing Director
David MaxwellDavid Maxwell has over 30 yearsrsquo
experience as a senior executive with
companies such as BG Group Woodside
and Santos As Senior Vice President at
QGC a BG Group business he led BGrsquos
entry into Australia its alliance with and
subsequent takeover of QGC Roles at
Woodside included director of gas and
marketing and membership of Woodsidersquos
executive committee
General Manager Exploration
amp Subsurface
Andrew ThomasAndrew Thomas is a successful
geoscientist with over 28 yearsrsquo
experience in oil and gas exploration
and development in companies
including Geoscience Australia
Santos Gulf Canada and Newfield
Exploration At Newfield he was SE
Asia New Ventures Manager and
Exploration Manager for offshore
Sarawak
Executive Director
Hector GordonHector Gordon is a highly
experienced geologist with over 35
yearsrsquo experience in the petroleum
industry Previous roles include
Managing Director Somerton
Energy and a number of senior
management and technical roles at
Beach Energy including Exploration
Manager Chief Operating Officer
and ultimately Chief Executive
Officer
Alison Evans is an experienced
company secretary and corporate legal
counsel with extensive knowledge of
corporate and commercial law in the
resources and energy sectors
Alison has held Company Secretary
and Legal Counsel roles at a number of
minerals and energy companies
including Centrex Metals GTL Energy
and AGL Ms Evans public company
experience is supported by her work at
leading corporate law firms
Company Secretary and
General Counsel
Alison Evans
General Manager Development
Duncan CleggDuncan Clegg has over 35 yearsrsquo
experience in upstream and midstream oil
and gas development including
management positions at Shell and
Woodside leading oil and gas
developments including FPSO subsea
and fixed platforms developments At
Woodside Duncan held several senior
executive positions including Director of
the Australian Business Unit Director of
the African Business Unit and CEO of the
North West Shelf Venture
Eddy Glavas has more than 18 years
experience in business development
finance commercial portfolio
management and strategy including 14
years in the oil and gas sector Prior to
joining Cooper Energy he was
employed by Santos as Manager
Corporate Development with
responsibility for managing multi-
disciplinary teams tasked with mergers
acquisitions partnerships and
divestitures
General Manager Commercial amp
Business Development
Eddy Glavas
Virginia Suttell is a chartered accountant
with more than 20 years experience
including 16 years in publicly listed entities
principally in group finance and secretarial
roles in the resources and media sectors
This has included the role of Chief Financial
Officer and Company Secretary for Monax
Mining Limited and Marmota Energy Limited
from 2007 to 2016 and 2007 to 2015
respectively Other previous appointments
include Group Financial Controller at
Austereo Group Limited
Chief Financial Officer
(Acting)
Virginia Suttell
31
The approach for all reserve and resource calculations is consistent with the definitions and guidelines in the Society of Petroleum Engineers (SPE) 2007 Petroleum Resources Management System (PRMS) The resource estimate methodologies incorporate a range of uncertainty relating to each of the key reservoir input parameters to predict the likely range of outcomes Cooper Energy has completed its own estimation of reserves and contingent resources based on information provided by the permit Operators Beach Energy Ltd Senex Ltd and Santos Ltd and in accordance with the definitions and guidelines in the Society of Petroleum Engineers (SPE) 2007 Petroleum Resources Management System (PRMS) Petroleum Reserves and Contingent Resources are prepared using deterministic and probabilistic methods The method of aggregation for all reserves and contingent resources tables is by arithmetic summation by category Aggregated 1P and 1C estimates may be conservative and aggregated 3P and 3C estimates may be optimistic due to the effects of arithmetic summation Totals may not exactly reflect arithmetic addition due to rounding
The information contained in this report regarding the Cooper Energy reserves and contingent resources is based on and fairly represents information and supporting documentation reviewed by Mr Andrew Thomas who is a full-time employee of Cooper Energy Limited holding the position of General Manager Exploration amp Subsurface holds a Bachelor of Science (Hons) is a member of the American Association of Petroleum Geologists and the Society of Petroleum Engineers is qualified in accordance with ASX listing rule 541 and has consented to the inclusion of this information in the form and context in which it appears
The Cooper Basin totals comprise the probabilistically aggregated PEL 92 project fields and the arithmetic summation of the Worrior project reserves Total includes 005 MMbbl oil reserves used for field fuel The Indonesia totals include removal of non-shareable oil (NSO) and comprise the probabilistically aggregated Tangai-Sukananti KSO project fields Totals are derived by arithmetic summation In the Otway Basin reserves for the Casino Henry and Netherby fields have been assessed by Cooper Energy The Reserves have been assessed using deterministic and probabilistic methodologies for the Waarre Formation at the Casino Henry and Netherby fields This methodology incorporates a range of uncertainty relating to each of the key reservoir input parameters to predict the likely range of outcomes Cooper Energy undertook the following analytical procedures to estimate the Reserves independent interpretation of 3D seismic data analysis of historical production data to assess accessed gas volumes and future production forecasts review of the Operatorrsquos reservoir and production simulation models to define raw gas recovery consistent with existing processing facilities and independent probabilistic Monte Carlo statistical calculations to establish the range of recoverable gas The Otway gas reserves for Casino Henry and Netherby fields are net of fuel gas The date of the Casino Henry and Netherby Reserve Assessment is 27 February 2017
Sole gas field The contingent resource for the Sole field has been re-estimated assuming a two well subsea development plan Advantages of a two well plan compared to the previous single well development includeincreased 2C estimate attributable to accessing previously undeveloped gas and reduced technical risk and enhanced field redundancy providing increased security of supply to the gas processing and gas sales agreements Contingent resources for the Sole field were released to the ASX on 26 November 2015 Post-acquisition of the remaining 50 equity in the Sole gas field the following methodologies were used by Cooper Energy to re-calculate the Sole contingent resource estimate probabilistic simulation modelling for the Kingfish Formation incorporation of a range of uncertainty relating to each of the key reservoir input parameters to predict the likely range of outcomes and review of the reservoir and simulation modelling assuming a two well subsea development The date of the Sole contingent resource assessment is 27 February 2017
Manta gas and oil field Contingent and Prospective Resources have been assessed using deterministic simulation modelling and probabilistic resource estimation for the Intra-Latrobe and Golden Beach Sub-Group in the Manta field This methodology incorporates a range of uncertainty relating to each of the key reservoir input parameters to predict the likely range of outcomes The conversion factor of 1PJ = 0172MMboe has been used to convert from Sales Gas (PJ) to Oil Equivalent (MMboe) Contingent Resources for the Manta Field have been aggregated by arithmetic summation The date of the Manta Contingent Resource assessment is 16 July 2015 and the assessment was announced to the ASX on 16 July 2015 Cooper Energy is not aware of any new information or data that materially affects the information provided in that release and all material assumptions and technical parameters underpinning the assessment provided in the announcement continues to apply
Basker gas and oil field Contingent and Resources have been assessed using deterministic simulation modelling and probabilistic resource estimation for the Intra-Latrobe Sub-Group in the Basker field This methodology incorporates a range of uncertainty relating to each of the key reservoir input parameters to predict the likely range of outcomes The conversion factor of 1PJ = 0172MMboe has been used to convert from Sales Gas (PJ) to Oil Equivalent (MMboe) Contingent Resources for the Basker Field have been aggregated by arithmetic summation The date of the Basker Contingent Resource assessment is 15 August 2014 and the assessment was announced to the ASX on 18 August 2014 Cooper Energy is not aware of any new information or data that materially affects the information provided in that release and all material assumptions and technical parameters underpinning the assessment provided in the announcement continues to apply
32
$ A$ Australian dollars unless specified otherwise
Bbl barrels of oil
boe barrel of oil equivalent
bopd barrel of oil per day
EBITDA earnings before interest tax depreciation and amortisation
FEED Front end engineering and design
kbbls thousand barrels
LTIFR Lost Time Injury Frequency Rate Lost Time Incidents per million man hours worked
MMbbl million barrels of oil
MMboe million barrels of oil equivalent
NOPSEMA National Offshore Petroleum Safety amp Environmental Management Authority
NOPTA National Offshore Petroleum Titles Administrator
NPAT net profit after tax
PEL 92 Joint Venture conducting operations in Western Flank Cooper Basin Petroleum Retention Licences 85 ndash 104 previously encompassed by
the PEL 92 exploration licence
TRCFR Total Recordable Case Frequency Rate Recordable cases per million hours worked
TSR total shareholder return
1P reserves Proved reserves
2P reserves Proved and Probable reserves
3P Proved Probable and Possible reserves
1C 2C 3C high medium and low estimates of contingent resources
- 1WRM Investor presentation March 2017
-
- Slide Number 1
- Disclaimer
- Slide Number 3
- Slide Number 4
- Slide Number 5
- Slide Number 6
- Slide Number 7
- Slide Number 8
- Slide Number 9
- Slide Number 10
- Slide Number 11
- Gold and Silver development asset with a definitive feasibility study (DFS) commenced
- Slide Number 13
- Slide Number 14
- Slide Number 15
- Slide Number 16
- Slide Number 17
- Slide Number 18
- Slide Number 19
- Slide Number 20
- Slide Number 21
- Slide Number 22
- Slide Number 23
- Slide Number 24
- Slide Number 25
- Slide Number 26
- Slide Number 27
- Slide Number 28
- Slide Number 29
- Mount Carrington Resource Statement
- Slide Number 31
- Slide Number 32
- Slide Number 33
- Slide Number 34
- Slide Number 35
- Slide Number 36
- Slide Number 37
-
- 2Aurelia Metals Presentation-Mar 2017-widescreen format
-
- Slide Number 1
- Slide Number 2
- Slide Number 3
- Slide Number 4
- Slide Number 5
- Slide Number 6
- Slide Number 7
- Slide Number 8
- Slide Number 9
- Slide Number 10
- Slide Number 11
- Slide Number 12
- Slide Number 13
- Slide Number 14
- Slide Number 15
- Slide Number 16
- Slide Number 17
- Slide Number 18
- Slide Number 19
- Slide Number 20
- Slide Number 21
-
- 320170321 Presentations Melbourne Mining Club Speaker
-

16
Sole FID
bull Financial commitment to project
bull Triggers 43 MMboe uplift in gas reserves
bull Translation of HoA with APA to formal agreement
bull Expected shortly after project sanction
Uncontracted Otway gas
bull Contracting gas to supply from March 2018
bull Expect to secure new agreements in winter 2017 with market reflective price
Operator status
bull Working to appointment as Operator in Gippsland and Otway
bull Enables cost efficiencies and competitive advantage as asset owner and JV participant
Beyond June 2017
bull Cooper Basin assets
bull Divest slice of Gippsland Basin portfolio
bull Manta exploration
13116
~53
Jun-16 Jan-17 June -17Proforma
Uplift in 2P reservesMMboe
Australia only Assumes commitment of Sole gas project provides uplift of
~43 MMboe
1
2
3
4
17
1 Execution of our gas strategy has deliveredCooper Energy has become a supplier and developer of gas for south east Australia at a time of great market need
2 FY17 growth is the first step of larger and sustainable growthReserves and production upgrades in the current year are the initial instalment of a 6 year growth trajectory offering gt 20 times growth in
production from existing assets and equities
3 Integration proceeding management capabilities have been reinforced consistent with growthUpgraded people resources with the addition of proven performance orientated executives integration is proceeding to schedule
4 Sole project stronger and proceeding to final phase financingProject now offering lower risk lower capital cost increased gas and increased returns and value upside for Cooper Energy shareholders
5 Milestones aheadSix months to June 17 is expected to see a number of milestones for further uplift and value transformation
Appendices
20
Key figures
Shares on issue1 6601 mill
Shareholders1 5923
Market capitalisation1 $260 mill
Debt Nil
Current employees 23
Cooper Energy is an independent Australian exploration and
production company
bull Listed in 2002 history of profitable operations and successful
exploration and development
bull Strong balance sheet zero debt
bull Raised new equity capital of c$85 million during 2016
bull Management team and board experienced in growing resource
companies
bull Growth profile extending over 6 years from existing assets and
agreements
59
10
2
29
Share register
Institutional
Corporate
Employees amp Directors
Private
1 As at 20 March 2017
21
Oil exploration amp production
Cooper Basin Western Flank
240000 ndash 280000 1 bbl pa
Operating cost ltA$30bbl
High margin + exploration upside
Gas production amp sales Gas projects amp contracting
Otway Basin Casino Henry amp Minerva
Sales of ~7- 8 PJ pa to EnergyAustralia
Minerva1 gas plant
Production of 15 MMboe pa
Gippsland and Otway Basins
Sole Manta projects Otway uncontracted gas
gt400 PJ gas to be developed or uncontracted
Production uplift of up to 95 MMboe2 pa as
projects come online on top of existing output
1 Subject to completion of transaction2 Based on current equity participation levels
22
Phase 1 Sole
bull 2C Resource1 249 PJ
bull Sanction March 2017
bull Sole gas into plant March 2019
bull Output ~25 PJ pa
bull COE equity 100
Phase 2 Manta
bull 2C Resource1 106 PJ gas3 2 MMbbl liquids
bull Appraisal 2018-19
bull Sanction 2021
bull First gas ~2023
bull Output pa 25 PJ gas 039 MMbbl pa
bull Exploration Manta Deep amp Chimaera
bull COE equity 100
Orbost Gas Plant
bull Existing gas plant
bull Connected to Eastern Gas Pipeline
bull Plant owned amp operated by APA Group (proposed in HoA announced 27217
Longtom(Seven Group 100)
Patricia Baleen (COE 100)
Enabling customersUpstream and Midstream HoA
1 Cooper Energy announced Sole Contingent Resources on 27 February 2017 and Manta Contingent Resource 16 July 2015 Cooper Energy is not aware of any new information or data that materially affects the information provided in those releases and all material
assumptions and technical parameters underpinning the assessment provided in the announcement continues to apply See notes on page 29 for information on reserves and resources calculation
33 km
58 km
65 km
23
Sole Gas Project (VIC L32 COE100 Operator )
bull 249 PJ 2C Contingent Resource1
bull 20 PJ pa contracted gas contracts with O-I Australia AGL Energy Alinta Energy
EnergyAustralia
bull Sanction expected by March 2017 for Sole gas into plant by March 2019
Manta (VIC RL131415 COE 100)
bull 106 PJ 2C Contingent Resource plus 3 million barrels liquids1
bull economic business case identified subject to appraisal
bull prospective resource upside to be tested amp appraisal well expected 2018
Patricia-Baleen (VICL21 COE 100)
bull Non-operating field shut in
bull Strategic significance as access point for Orbost Gas Plant for other fields
1 Reserves and Contingent Resources at 1 January 2017 were announced to the ASX on 27 February 2017 and an announcement on Manta Contingent Resource was announced on 16 July 2015 The resources information displayed should be read in conjunction with the information provided on the calculation of Reserves and Contingent Resources provided on page 29 Cooper Energy is not aware of any new information or data that materially affects the information provided in those releases and all material assumptions and technical parameters underpinning the assessment provided in the announcement continues to apply
24
Key Assets
bull Casino Henry gas project (50)
bull Minerva gas field and plant (10 interest)1
bull VICP44 exploration permit
Production (COE share effective from 1 January 2017)
bull Casino Henry (VICRL11 amp 12) 7 PJ pa supplied to EnergyAustralia
under contract expiring March 2018
bull Minerva (VICL22)~ 1 PJ pa (expected to deplete by mid 2017)
Plans
bull Preparation for operatorship transfer likely June 2017
bull Marketing of uncontracted gas available for sale from March 2018
bull Casino Henry development well
1Acquisition of 10 interest in Minerva agreed with Santos Ltd is subject to completion
25
bull First half production of 013 MMbbl vs 017 in H1 FY16
bull Production impacted by suspension of drilling in low oil price FY16
bull Operating costs reduced from A$2992bbl to A$2928bbl
bull Drilling resumed in FY17 with 4 wells drilled 2 successful 2 P amp A
bull No further drilling planned for FY17
bull Producing interests
ndash PEL 92 25 interest (Beach Energy 75 amp Operator)
ndash PEL 93 30 interest (Senex Energy 70 amp Operator)
11 10
16 15
7 4
3530
FY16 H1 FY17
Production costs amp netback Direct cost A$ per barrel
NetbackRoyaltyTransportOperatingCosts per
bbl down 2
26
bull Take or pay gas
processing agreement
1 Cooper Energy to sell Orbost Gas Plant to APA Group
Heads of Agreement (non-binding) provides for APA to take ownership subject to Sole FID
2 APA to be responsible for funding and performance of ~$250 million plant upgrade and processing of gas from Sole amp Manta
Plant to be developed according to existing Sole Development Plan Sole gas to be processed under take or pay tariff agreement
3 Cooper Energy to retain 100 of upstream retains ownership of gas processed through Orbost Gas Plant
Estimated project cost for Cooper Energy reduced to ~$355 million and opportunity to realise further value accretion in sell-down post FID
Orbost Gas Plant APA Group 100
APA
bull funds and completes plant upgrade
for Sole
bull operates plant for agreed tariff amp
provides processed sales gas to
EGP
Sole gas
field
COE 100
COE
bull manages upstream
development
bull supplies gas to Orbost
for processing
bull markets the gas
Upstream Midstream
Downstream COE retains ownership of gas
through to point of sale to customers
in EGP
Transaction elements
1refer joint APA Group Cooper Energy announcement 27 February 2017
27
28
3 5
2 7 7 6 7 7 6 5 4
1
1520 20 20 20
2020
20
16
10
6
10 5 5 5 55
55 9
9
25 25 25
18
10
75
1
FY17 FY18 FY19 FY20 FY21 FY22 FY23 FY24 FY25 FY26 FY27 FY28 FY29
Gas production profile by projectcontracted amp uncontracted PJ pa
Manta uncontracted
Sole uncontracted
Sole contracted
Otway uncontracted
Otway contracted
Otway 2P reserves
Casino Henry
Gippsland Gas Project Phase 1
Sole
Gippsland Gas Project Phase 2
Manta
Assumes
bull Sole sanction by March quarter 2017 for March quarter 2019 first Sole gas to plant
bull All contract options in respect of Sole field are exercised
bull Manta subject to Manta 3 appraisal well Manta profile illustrates all Manta gas as uncontracted (including 4 PJ pa option held by
AGL) Manta profile includes 106 PJ 2C resource and additional 10 PJ anticipated
bull Development well required for Casino Henry ~2020
bull No exploration success
29
Reserves
Proved
(1P)
Proved amp Probable
(2P)
Proved Probable amp Possible
(3P)
Cooper1 Otway2 Total Cooper1 Otway2 Total Cooper1 Otway2 Total
Developed
Sales Gas PJ 00 48 48 00 152 152 00 293 293
Oil + Condensate MMbbl 05 00 05 09 00 09 16 00 16
Total developed MMboe2 05 08 13 09 26 35 16 51 67
Undeveloped
Sales Gas PJ 00 344 344 00 451 451 00 627 627
Oil + Condensate PJ 01 00 02 03 11 03 05 01 05
Total undeveloped MMboe2 01 60 61 03 78 81 05 109 113
Total1 MMboe2 07 68 74 11 104 116 21 159 180
Contingent
Resources
1C 2C 3C
Gas Oil Total1 Gas Oil Total Gas Oil Total
PJ MMbbl MMboe2 PJ MMbbl MMboe2 PJ MMbbl MMboe2
Gippsland 2917 40 541 3885 76 744 5336 121 1039
Cooper 02 00 003 03 00 01 06 00 01
Total 1 2919 40 542 3888 76 744 5342 121 1040
Additional information on reserve and resource calculation is provided in the appendices to this document
1 Totals may not reflect arithmetic addition due to rounding The method of aggregation is by arithmetic sum by category As a result the 1P estimate may be conservative and the 3P estimate may be optimistic due to the effects
of arithmetic summation The conversion factor of 1 PJ = 0172 MMboe has been used to convert from Sales Gas (PJ) to Oil Equivalent (MMboe) 2 The reserves revisions include Cooper Energyrsquos share of future crude fuel
usage in the Cooper Basin The estimated fuel usage for PEL 92 is 1P 002 MMbbl 2P 003 MMbbl and 3P 006 MMbbl The estimated fuel usage for the Worrior Field (PPL 207) is 1P 001 MMbbl 2P 002 MMbbl and 3P 003
MMbbl 3 The Otway gas reserves for Casino Henry and Netherby fields are net of fuel gas
1 Totals may not reflect arithmetic addition due to rounding The method of aggregation is by arithmetic sum by category As a result the 1C estimate may be conservative and the 3C estimate may be optimistic due to the
effects of arithmetic summation 2 The conversion factor of 1 PJ = 0172 MMboe has been used to convert from Sales Gas (PJ) to Oil Equivalent (MMboe)
30
General Manager Operations
Iain MacDougallIain MacDougall has more than 25
yearsrsquo experience in the upstream
petroleum exploration and production
sector including senior management
roles within independent operators
and international experience with
Schlumberger In Australia previous
employment includes Stuart
Petroleum as Production and
Engineering Manager and then as
acting CEO prior to the takeover of
Stuart Petroleum by Senex Energy
Managing Director
David MaxwellDavid Maxwell has over 30 yearsrsquo
experience as a senior executive with
companies such as BG Group Woodside
and Santos As Senior Vice President at
QGC a BG Group business he led BGrsquos
entry into Australia its alliance with and
subsequent takeover of QGC Roles at
Woodside included director of gas and
marketing and membership of Woodsidersquos
executive committee
General Manager Exploration
amp Subsurface
Andrew ThomasAndrew Thomas is a successful
geoscientist with over 28 yearsrsquo
experience in oil and gas exploration
and development in companies
including Geoscience Australia
Santos Gulf Canada and Newfield
Exploration At Newfield he was SE
Asia New Ventures Manager and
Exploration Manager for offshore
Sarawak
Executive Director
Hector GordonHector Gordon is a highly
experienced geologist with over 35
yearsrsquo experience in the petroleum
industry Previous roles include
Managing Director Somerton
Energy and a number of senior
management and technical roles at
Beach Energy including Exploration
Manager Chief Operating Officer
and ultimately Chief Executive
Officer
Alison Evans is an experienced
company secretary and corporate legal
counsel with extensive knowledge of
corporate and commercial law in the
resources and energy sectors
Alison has held Company Secretary
and Legal Counsel roles at a number of
minerals and energy companies
including Centrex Metals GTL Energy
and AGL Ms Evans public company
experience is supported by her work at
leading corporate law firms
Company Secretary and
General Counsel
Alison Evans
General Manager Development
Duncan CleggDuncan Clegg has over 35 yearsrsquo
experience in upstream and midstream oil
and gas development including
management positions at Shell and
Woodside leading oil and gas
developments including FPSO subsea
and fixed platforms developments At
Woodside Duncan held several senior
executive positions including Director of
the Australian Business Unit Director of
the African Business Unit and CEO of the
North West Shelf Venture
Eddy Glavas has more than 18 years
experience in business development
finance commercial portfolio
management and strategy including 14
years in the oil and gas sector Prior to
joining Cooper Energy he was
employed by Santos as Manager
Corporate Development with
responsibility for managing multi-
disciplinary teams tasked with mergers
acquisitions partnerships and
divestitures
General Manager Commercial amp
Business Development
Eddy Glavas
Virginia Suttell is a chartered accountant
with more than 20 years experience
including 16 years in publicly listed entities
principally in group finance and secretarial
roles in the resources and media sectors
This has included the role of Chief Financial
Officer and Company Secretary for Monax
Mining Limited and Marmota Energy Limited
from 2007 to 2016 and 2007 to 2015
respectively Other previous appointments
include Group Financial Controller at
Austereo Group Limited
Chief Financial Officer
(Acting)
Virginia Suttell
31
The approach for all reserve and resource calculations is consistent with the definitions and guidelines in the Society of Petroleum Engineers (SPE) 2007 Petroleum Resources Management System (PRMS) The resource estimate methodologies incorporate a range of uncertainty relating to each of the key reservoir input parameters to predict the likely range of outcomes Cooper Energy has completed its own estimation of reserves and contingent resources based on information provided by the permit Operators Beach Energy Ltd Senex Ltd and Santos Ltd and in accordance with the definitions and guidelines in the Society of Petroleum Engineers (SPE) 2007 Petroleum Resources Management System (PRMS) Petroleum Reserves and Contingent Resources are prepared using deterministic and probabilistic methods The method of aggregation for all reserves and contingent resources tables is by arithmetic summation by category Aggregated 1P and 1C estimates may be conservative and aggregated 3P and 3C estimates may be optimistic due to the effects of arithmetic summation Totals may not exactly reflect arithmetic addition due to rounding
The information contained in this report regarding the Cooper Energy reserves and contingent resources is based on and fairly represents information and supporting documentation reviewed by Mr Andrew Thomas who is a full-time employee of Cooper Energy Limited holding the position of General Manager Exploration amp Subsurface holds a Bachelor of Science (Hons) is a member of the American Association of Petroleum Geologists and the Society of Petroleum Engineers is qualified in accordance with ASX listing rule 541 and has consented to the inclusion of this information in the form and context in which it appears
The Cooper Basin totals comprise the probabilistically aggregated PEL 92 project fields and the arithmetic summation of the Worrior project reserves Total includes 005 MMbbl oil reserves used for field fuel The Indonesia totals include removal of non-shareable oil (NSO) and comprise the probabilistically aggregated Tangai-Sukananti KSO project fields Totals are derived by arithmetic summation In the Otway Basin reserves for the Casino Henry and Netherby fields have been assessed by Cooper Energy The Reserves have been assessed using deterministic and probabilistic methodologies for the Waarre Formation at the Casino Henry and Netherby fields This methodology incorporates a range of uncertainty relating to each of the key reservoir input parameters to predict the likely range of outcomes Cooper Energy undertook the following analytical procedures to estimate the Reserves independent interpretation of 3D seismic data analysis of historical production data to assess accessed gas volumes and future production forecasts review of the Operatorrsquos reservoir and production simulation models to define raw gas recovery consistent with existing processing facilities and independent probabilistic Monte Carlo statistical calculations to establish the range of recoverable gas The Otway gas reserves for Casino Henry and Netherby fields are net of fuel gas The date of the Casino Henry and Netherby Reserve Assessment is 27 February 2017
Sole gas field The contingent resource for the Sole field has been re-estimated assuming a two well subsea development plan Advantages of a two well plan compared to the previous single well development includeincreased 2C estimate attributable to accessing previously undeveloped gas and reduced technical risk and enhanced field redundancy providing increased security of supply to the gas processing and gas sales agreements Contingent resources for the Sole field were released to the ASX on 26 November 2015 Post-acquisition of the remaining 50 equity in the Sole gas field the following methodologies were used by Cooper Energy to re-calculate the Sole contingent resource estimate probabilistic simulation modelling for the Kingfish Formation incorporation of a range of uncertainty relating to each of the key reservoir input parameters to predict the likely range of outcomes and review of the reservoir and simulation modelling assuming a two well subsea development The date of the Sole contingent resource assessment is 27 February 2017
Manta gas and oil field Contingent and Prospective Resources have been assessed using deterministic simulation modelling and probabilistic resource estimation for the Intra-Latrobe and Golden Beach Sub-Group in the Manta field This methodology incorporates a range of uncertainty relating to each of the key reservoir input parameters to predict the likely range of outcomes The conversion factor of 1PJ = 0172MMboe has been used to convert from Sales Gas (PJ) to Oil Equivalent (MMboe) Contingent Resources for the Manta Field have been aggregated by arithmetic summation The date of the Manta Contingent Resource assessment is 16 July 2015 and the assessment was announced to the ASX on 16 July 2015 Cooper Energy is not aware of any new information or data that materially affects the information provided in that release and all material assumptions and technical parameters underpinning the assessment provided in the announcement continues to apply
Basker gas and oil field Contingent and Resources have been assessed using deterministic simulation modelling and probabilistic resource estimation for the Intra-Latrobe Sub-Group in the Basker field This methodology incorporates a range of uncertainty relating to each of the key reservoir input parameters to predict the likely range of outcomes The conversion factor of 1PJ = 0172MMboe has been used to convert from Sales Gas (PJ) to Oil Equivalent (MMboe) Contingent Resources for the Basker Field have been aggregated by arithmetic summation The date of the Basker Contingent Resource assessment is 15 August 2014 and the assessment was announced to the ASX on 18 August 2014 Cooper Energy is not aware of any new information or data that materially affects the information provided in that release and all material assumptions and technical parameters underpinning the assessment provided in the announcement continues to apply
32
$ A$ Australian dollars unless specified otherwise
Bbl barrels of oil
boe barrel of oil equivalent
bopd barrel of oil per day
EBITDA earnings before interest tax depreciation and amortisation
FEED Front end engineering and design
kbbls thousand barrels
LTIFR Lost Time Injury Frequency Rate Lost Time Incidents per million man hours worked
MMbbl million barrels of oil
MMboe million barrels of oil equivalent
NOPSEMA National Offshore Petroleum Safety amp Environmental Management Authority
NOPTA National Offshore Petroleum Titles Administrator
NPAT net profit after tax
PEL 92 Joint Venture conducting operations in Western Flank Cooper Basin Petroleum Retention Licences 85 ndash 104 previously encompassed by
the PEL 92 exploration licence
TRCFR Total Recordable Case Frequency Rate Recordable cases per million hours worked
TSR total shareholder return
1P reserves Proved reserves
2P reserves Proved and Probable reserves
3P Proved Probable and Possible reserves
1C 2C 3C high medium and low estimates of contingent resources
- 1WRM Investor presentation March 2017
-
- Slide Number 1
- Disclaimer
- Slide Number 3
- Slide Number 4
- Slide Number 5
- Slide Number 6
- Slide Number 7
- Slide Number 8
- Slide Number 9
- Slide Number 10
- Slide Number 11
- Gold and Silver development asset with a definitive feasibility study (DFS) commenced
- Slide Number 13
- Slide Number 14
- Slide Number 15
- Slide Number 16
- Slide Number 17
- Slide Number 18
- Slide Number 19
- Slide Number 20
- Slide Number 21
- Slide Number 22
- Slide Number 23
- Slide Number 24
- Slide Number 25
- Slide Number 26
- Slide Number 27
- Slide Number 28
- Slide Number 29
- Mount Carrington Resource Statement
- Slide Number 31
- Slide Number 32
- Slide Number 33
- Slide Number 34
- Slide Number 35
- Slide Number 36
- Slide Number 37
-
- 2Aurelia Metals Presentation-Mar 2017-widescreen format
-
- Slide Number 1
- Slide Number 2
- Slide Number 3
- Slide Number 4
- Slide Number 5
- Slide Number 6
- Slide Number 7
- Slide Number 8
- Slide Number 9
- Slide Number 10
- Slide Number 11
- Slide Number 12
- Slide Number 13
- Slide Number 14
- Slide Number 15
- Slide Number 16
- Slide Number 17
- Slide Number 18
- Slide Number 19
- Slide Number 20
- Slide Number 21
-
- 320170321 Presentations Melbourne Mining Club Speaker
-

20
Key figures
Shares on issue1 6601 mill
Shareholders1 5923
Market capitalisation1 $260 mill
Debt Nil
Current employees 23
Cooper Energy is an independent Australian exploration and
production company
bull Listed in 2002 history of profitable operations and successful
exploration and development
bull Strong balance sheet zero debt
bull Raised new equity capital of c$85 million during 2016
bull Management team and board experienced in growing resource
companies
bull Growth profile extending over 6 years from existing assets and
agreements
59
10
2
29
Share register
Institutional
Corporate
Employees amp Directors
Private
1 As at 20 March 2017
21
Oil exploration amp production
Cooper Basin Western Flank
240000 ndash 280000 1 bbl pa
Operating cost ltA$30bbl
High margin + exploration upside
Gas production amp sales Gas projects amp contracting
Otway Basin Casino Henry amp Minerva
Sales of ~7- 8 PJ pa to EnergyAustralia
Minerva1 gas plant
Production of 15 MMboe pa
Gippsland and Otway Basins
Sole Manta projects Otway uncontracted gas
gt400 PJ gas to be developed or uncontracted
Production uplift of up to 95 MMboe2 pa as
projects come online on top of existing output
1 Subject to completion of transaction2 Based on current equity participation levels
22
Phase 1 Sole
bull 2C Resource1 249 PJ
bull Sanction March 2017
bull Sole gas into plant March 2019
bull Output ~25 PJ pa
bull COE equity 100
Phase 2 Manta
bull 2C Resource1 106 PJ gas3 2 MMbbl liquids
bull Appraisal 2018-19
bull Sanction 2021
bull First gas ~2023
bull Output pa 25 PJ gas 039 MMbbl pa
bull Exploration Manta Deep amp Chimaera
bull COE equity 100
Orbost Gas Plant
bull Existing gas plant
bull Connected to Eastern Gas Pipeline
bull Plant owned amp operated by APA Group (proposed in HoA announced 27217
Longtom(Seven Group 100)
Patricia Baleen (COE 100)
Enabling customersUpstream and Midstream HoA
1 Cooper Energy announced Sole Contingent Resources on 27 February 2017 and Manta Contingent Resource 16 July 2015 Cooper Energy is not aware of any new information or data that materially affects the information provided in those releases and all material
assumptions and technical parameters underpinning the assessment provided in the announcement continues to apply See notes on page 29 for information on reserves and resources calculation
33 km
58 km
65 km
23
Sole Gas Project (VIC L32 COE100 Operator )
bull 249 PJ 2C Contingent Resource1
bull 20 PJ pa contracted gas contracts with O-I Australia AGL Energy Alinta Energy
EnergyAustralia
bull Sanction expected by March 2017 for Sole gas into plant by March 2019
Manta (VIC RL131415 COE 100)
bull 106 PJ 2C Contingent Resource plus 3 million barrels liquids1
bull economic business case identified subject to appraisal
bull prospective resource upside to be tested amp appraisal well expected 2018
Patricia-Baleen (VICL21 COE 100)
bull Non-operating field shut in
bull Strategic significance as access point for Orbost Gas Plant for other fields
1 Reserves and Contingent Resources at 1 January 2017 were announced to the ASX on 27 February 2017 and an announcement on Manta Contingent Resource was announced on 16 July 2015 The resources information displayed should be read in conjunction with the information provided on the calculation of Reserves and Contingent Resources provided on page 29 Cooper Energy is not aware of any new information or data that materially affects the information provided in those releases and all material assumptions and technical parameters underpinning the assessment provided in the announcement continues to apply
24
Key Assets
bull Casino Henry gas project (50)
bull Minerva gas field and plant (10 interest)1
bull VICP44 exploration permit
Production (COE share effective from 1 January 2017)
bull Casino Henry (VICRL11 amp 12) 7 PJ pa supplied to EnergyAustralia
under contract expiring March 2018
bull Minerva (VICL22)~ 1 PJ pa (expected to deplete by mid 2017)
Plans
bull Preparation for operatorship transfer likely June 2017
bull Marketing of uncontracted gas available for sale from March 2018
bull Casino Henry development well
1Acquisition of 10 interest in Minerva agreed with Santos Ltd is subject to completion
25
bull First half production of 013 MMbbl vs 017 in H1 FY16
bull Production impacted by suspension of drilling in low oil price FY16
bull Operating costs reduced from A$2992bbl to A$2928bbl
bull Drilling resumed in FY17 with 4 wells drilled 2 successful 2 P amp A
bull No further drilling planned for FY17
bull Producing interests
ndash PEL 92 25 interest (Beach Energy 75 amp Operator)
ndash PEL 93 30 interest (Senex Energy 70 amp Operator)
11 10
16 15
7 4
3530
FY16 H1 FY17
Production costs amp netback Direct cost A$ per barrel
NetbackRoyaltyTransportOperatingCosts per
bbl down 2
26
bull Take or pay gas
processing agreement
1 Cooper Energy to sell Orbost Gas Plant to APA Group
Heads of Agreement (non-binding) provides for APA to take ownership subject to Sole FID
2 APA to be responsible for funding and performance of ~$250 million plant upgrade and processing of gas from Sole amp Manta
Plant to be developed according to existing Sole Development Plan Sole gas to be processed under take or pay tariff agreement
3 Cooper Energy to retain 100 of upstream retains ownership of gas processed through Orbost Gas Plant
Estimated project cost for Cooper Energy reduced to ~$355 million and opportunity to realise further value accretion in sell-down post FID
Orbost Gas Plant APA Group 100
APA
bull funds and completes plant upgrade
for Sole
bull operates plant for agreed tariff amp
provides processed sales gas to
EGP
Sole gas
field
COE 100
COE
bull manages upstream
development
bull supplies gas to Orbost
for processing
bull markets the gas
Upstream Midstream
Downstream COE retains ownership of gas
through to point of sale to customers
in EGP
Transaction elements
1refer joint APA Group Cooper Energy announcement 27 February 2017
27
28
3 5
2 7 7 6 7 7 6 5 4
1
1520 20 20 20
2020
20
16
10
6
10 5 5 5 55
55 9
9
25 25 25
18
10
75
1
FY17 FY18 FY19 FY20 FY21 FY22 FY23 FY24 FY25 FY26 FY27 FY28 FY29
Gas production profile by projectcontracted amp uncontracted PJ pa
Manta uncontracted
Sole uncontracted
Sole contracted
Otway uncontracted
Otway contracted
Otway 2P reserves
Casino Henry
Gippsland Gas Project Phase 1
Sole
Gippsland Gas Project Phase 2
Manta
Assumes
bull Sole sanction by March quarter 2017 for March quarter 2019 first Sole gas to plant
bull All contract options in respect of Sole field are exercised
bull Manta subject to Manta 3 appraisal well Manta profile illustrates all Manta gas as uncontracted (including 4 PJ pa option held by
AGL) Manta profile includes 106 PJ 2C resource and additional 10 PJ anticipated
bull Development well required for Casino Henry ~2020
bull No exploration success
29
Reserves
Proved
(1P)
Proved amp Probable
(2P)
Proved Probable amp Possible
(3P)
Cooper1 Otway2 Total Cooper1 Otway2 Total Cooper1 Otway2 Total
Developed
Sales Gas PJ 00 48 48 00 152 152 00 293 293
Oil + Condensate MMbbl 05 00 05 09 00 09 16 00 16
Total developed MMboe2 05 08 13 09 26 35 16 51 67
Undeveloped
Sales Gas PJ 00 344 344 00 451 451 00 627 627
Oil + Condensate PJ 01 00 02 03 11 03 05 01 05
Total undeveloped MMboe2 01 60 61 03 78 81 05 109 113
Total1 MMboe2 07 68 74 11 104 116 21 159 180
Contingent
Resources
1C 2C 3C
Gas Oil Total1 Gas Oil Total Gas Oil Total
PJ MMbbl MMboe2 PJ MMbbl MMboe2 PJ MMbbl MMboe2
Gippsland 2917 40 541 3885 76 744 5336 121 1039
Cooper 02 00 003 03 00 01 06 00 01
Total 1 2919 40 542 3888 76 744 5342 121 1040
Additional information on reserve and resource calculation is provided in the appendices to this document
1 Totals may not reflect arithmetic addition due to rounding The method of aggregation is by arithmetic sum by category As a result the 1P estimate may be conservative and the 3P estimate may be optimistic due to the effects
of arithmetic summation The conversion factor of 1 PJ = 0172 MMboe has been used to convert from Sales Gas (PJ) to Oil Equivalent (MMboe) 2 The reserves revisions include Cooper Energyrsquos share of future crude fuel
usage in the Cooper Basin The estimated fuel usage for PEL 92 is 1P 002 MMbbl 2P 003 MMbbl and 3P 006 MMbbl The estimated fuel usage for the Worrior Field (PPL 207) is 1P 001 MMbbl 2P 002 MMbbl and 3P 003
MMbbl 3 The Otway gas reserves for Casino Henry and Netherby fields are net of fuel gas
1 Totals may not reflect arithmetic addition due to rounding The method of aggregation is by arithmetic sum by category As a result the 1C estimate may be conservative and the 3C estimate may be optimistic due to the
effects of arithmetic summation 2 The conversion factor of 1 PJ = 0172 MMboe has been used to convert from Sales Gas (PJ) to Oil Equivalent (MMboe)
30
General Manager Operations
Iain MacDougallIain MacDougall has more than 25
yearsrsquo experience in the upstream
petroleum exploration and production
sector including senior management
roles within independent operators
and international experience with
Schlumberger In Australia previous
employment includes Stuart
Petroleum as Production and
Engineering Manager and then as
acting CEO prior to the takeover of
Stuart Petroleum by Senex Energy
Managing Director
David MaxwellDavid Maxwell has over 30 yearsrsquo
experience as a senior executive with
companies such as BG Group Woodside
and Santos As Senior Vice President at
QGC a BG Group business he led BGrsquos
entry into Australia its alliance with and
subsequent takeover of QGC Roles at
Woodside included director of gas and
marketing and membership of Woodsidersquos
executive committee
General Manager Exploration
amp Subsurface
Andrew ThomasAndrew Thomas is a successful
geoscientist with over 28 yearsrsquo
experience in oil and gas exploration
and development in companies
including Geoscience Australia
Santos Gulf Canada and Newfield
Exploration At Newfield he was SE
Asia New Ventures Manager and
Exploration Manager for offshore
Sarawak
Executive Director
Hector GordonHector Gordon is a highly
experienced geologist with over 35
yearsrsquo experience in the petroleum
industry Previous roles include
Managing Director Somerton
Energy and a number of senior
management and technical roles at
Beach Energy including Exploration
Manager Chief Operating Officer
and ultimately Chief Executive
Officer
Alison Evans is an experienced
company secretary and corporate legal
counsel with extensive knowledge of
corporate and commercial law in the
resources and energy sectors
Alison has held Company Secretary
and Legal Counsel roles at a number of
minerals and energy companies
including Centrex Metals GTL Energy
and AGL Ms Evans public company
experience is supported by her work at
leading corporate law firms
Company Secretary and
General Counsel
Alison Evans
General Manager Development
Duncan CleggDuncan Clegg has over 35 yearsrsquo
experience in upstream and midstream oil
and gas development including
management positions at Shell and
Woodside leading oil and gas
developments including FPSO subsea
and fixed platforms developments At
Woodside Duncan held several senior
executive positions including Director of
the Australian Business Unit Director of
the African Business Unit and CEO of the
North West Shelf Venture
Eddy Glavas has more than 18 years
experience in business development
finance commercial portfolio
management and strategy including 14
years in the oil and gas sector Prior to
joining Cooper Energy he was
employed by Santos as Manager
Corporate Development with
responsibility for managing multi-
disciplinary teams tasked with mergers
acquisitions partnerships and
divestitures
General Manager Commercial amp
Business Development
Eddy Glavas
Virginia Suttell is a chartered accountant
with more than 20 years experience
including 16 years in publicly listed entities
principally in group finance and secretarial
roles in the resources and media sectors
This has included the role of Chief Financial
Officer and Company Secretary for Monax
Mining Limited and Marmota Energy Limited
from 2007 to 2016 and 2007 to 2015
respectively Other previous appointments
include Group Financial Controller at
Austereo Group Limited
Chief Financial Officer
(Acting)
Virginia Suttell
31
The approach for all reserve and resource calculations is consistent with the definitions and guidelines in the Society of Petroleum Engineers (SPE) 2007 Petroleum Resources Management System (PRMS) The resource estimate methodologies incorporate a range of uncertainty relating to each of the key reservoir input parameters to predict the likely range of outcomes Cooper Energy has completed its own estimation of reserves and contingent resources based on information provided by the permit Operators Beach Energy Ltd Senex Ltd and Santos Ltd and in accordance with the definitions and guidelines in the Society of Petroleum Engineers (SPE) 2007 Petroleum Resources Management System (PRMS) Petroleum Reserves and Contingent Resources are prepared using deterministic and probabilistic methods The method of aggregation for all reserves and contingent resources tables is by arithmetic summation by category Aggregated 1P and 1C estimates may be conservative and aggregated 3P and 3C estimates may be optimistic due to the effects of arithmetic summation Totals may not exactly reflect arithmetic addition due to rounding
The information contained in this report regarding the Cooper Energy reserves and contingent resources is based on and fairly represents information and supporting documentation reviewed by Mr Andrew Thomas who is a full-time employee of Cooper Energy Limited holding the position of General Manager Exploration amp Subsurface holds a Bachelor of Science (Hons) is a member of the American Association of Petroleum Geologists and the Society of Petroleum Engineers is qualified in accordance with ASX listing rule 541 and has consented to the inclusion of this information in the form and context in which it appears
The Cooper Basin totals comprise the probabilistically aggregated PEL 92 project fields and the arithmetic summation of the Worrior project reserves Total includes 005 MMbbl oil reserves used for field fuel The Indonesia totals include removal of non-shareable oil (NSO) and comprise the probabilistically aggregated Tangai-Sukananti KSO project fields Totals are derived by arithmetic summation In the Otway Basin reserves for the Casino Henry and Netherby fields have been assessed by Cooper Energy The Reserves have been assessed using deterministic and probabilistic methodologies for the Waarre Formation at the Casino Henry and Netherby fields This methodology incorporates a range of uncertainty relating to each of the key reservoir input parameters to predict the likely range of outcomes Cooper Energy undertook the following analytical procedures to estimate the Reserves independent interpretation of 3D seismic data analysis of historical production data to assess accessed gas volumes and future production forecasts review of the Operatorrsquos reservoir and production simulation models to define raw gas recovery consistent with existing processing facilities and independent probabilistic Monte Carlo statistical calculations to establish the range of recoverable gas The Otway gas reserves for Casino Henry and Netherby fields are net of fuel gas The date of the Casino Henry and Netherby Reserve Assessment is 27 February 2017
Sole gas field The contingent resource for the Sole field has been re-estimated assuming a two well subsea development plan Advantages of a two well plan compared to the previous single well development includeincreased 2C estimate attributable to accessing previously undeveloped gas and reduced technical risk and enhanced field redundancy providing increased security of supply to the gas processing and gas sales agreements Contingent resources for the Sole field were released to the ASX on 26 November 2015 Post-acquisition of the remaining 50 equity in the Sole gas field the following methodologies were used by Cooper Energy to re-calculate the Sole contingent resource estimate probabilistic simulation modelling for the Kingfish Formation incorporation of a range of uncertainty relating to each of the key reservoir input parameters to predict the likely range of outcomes and review of the reservoir and simulation modelling assuming a two well subsea development The date of the Sole contingent resource assessment is 27 February 2017
Manta gas and oil field Contingent and Prospective Resources have been assessed using deterministic simulation modelling and probabilistic resource estimation for the Intra-Latrobe and Golden Beach Sub-Group in the Manta field This methodology incorporates a range of uncertainty relating to each of the key reservoir input parameters to predict the likely range of outcomes The conversion factor of 1PJ = 0172MMboe has been used to convert from Sales Gas (PJ) to Oil Equivalent (MMboe) Contingent Resources for the Manta Field have been aggregated by arithmetic summation The date of the Manta Contingent Resource assessment is 16 July 2015 and the assessment was announced to the ASX on 16 July 2015 Cooper Energy is not aware of any new information or data that materially affects the information provided in that release and all material assumptions and technical parameters underpinning the assessment provided in the announcement continues to apply
Basker gas and oil field Contingent and Resources have been assessed using deterministic simulation modelling and probabilistic resource estimation for the Intra-Latrobe Sub-Group in the Basker field This methodology incorporates a range of uncertainty relating to each of the key reservoir input parameters to predict the likely range of outcomes The conversion factor of 1PJ = 0172MMboe has been used to convert from Sales Gas (PJ) to Oil Equivalent (MMboe) Contingent Resources for the Basker Field have been aggregated by arithmetic summation The date of the Basker Contingent Resource assessment is 15 August 2014 and the assessment was announced to the ASX on 18 August 2014 Cooper Energy is not aware of any new information or data that materially affects the information provided in that release and all material assumptions and technical parameters underpinning the assessment provided in the announcement continues to apply
32
$ A$ Australian dollars unless specified otherwise
Bbl barrels of oil
boe barrel of oil equivalent
bopd barrel of oil per day
EBITDA earnings before interest tax depreciation and amortisation
FEED Front end engineering and design
kbbls thousand barrels
LTIFR Lost Time Injury Frequency Rate Lost Time Incidents per million man hours worked
MMbbl million barrels of oil
MMboe million barrels of oil equivalent
NOPSEMA National Offshore Petroleum Safety amp Environmental Management Authority
NOPTA National Offshore Petroleum Titles Administrator
NPAT net profit after tax
PEL 92 Joint Venture conducting operations in Western Flank Cooper Basin Petroleum Retention Licences 85 ndash 104 previously encompassed by
the PEL 92 exploration licence
TRCFR Total Recordable Case Frequency Rate Recordable cases per million hours worked
TSR total shareholder return
1P reserves Proved reserves
2P reserves Proved and Probable reserves
3P Proved Probable and Possible reserves
1C 2C 3C high medium and low estimates of contingent resources
- 1WRM Investor presentation March 2017
-
- Slide Number 1
- Disclaimer
- Slide Number 3
- Slide Number 4
- Slide Number 5
- Slide Number 6
- Slide Number 7
- Slide Number 8
- Slide Number 9
- Slide Number 10
- Slide Number 11
- Gold and Silver development asset with a definitive feasibility study (DFS) commenced
- Slide Number 13
- Slide Number 14
- Slide Number 15
- Slide Number 16
- Slide Number 17
- Slide Number 18
- Slide Number 19
- Slide Number 20
- Slide Number 21
- Slide Number 22
- Slide Number 23
- Slide Number 24
- Slide Number 25
- Slide Number 26
- Slide Number 27
- Slide Number 28
- Slide Number 29
- Mount Carrington Resource Statement
- Slide Number 31
- Slide Number 32
- Slide Number 33
- Slide Number 34
- Slide Number 35
- Slide Number 36
- Slide Number 37
-
- 2Aurelia Metals Presentation-Mar 2017-widescreen format
-
- Slide Number 1
- Slide Number 2
- Slide Number 3
- Slide Number 4
- Slide Number 5
- Slide Number 6
- Slide Number 7
- Slide Number 8
- Slide Number 9
- Slide Number 10
- Slide Number 11
- Slide Number 12
- Slide Number 13
- Slide Number 14
- Slide Number 15
- Slide Number 16
- Slide Number 17
- Slide Number 18
- Slide Number 19
- Slide Number 20
- Slide Number 21
-
- 320170321 Presentations Melbourne Mining Club Speaker
-
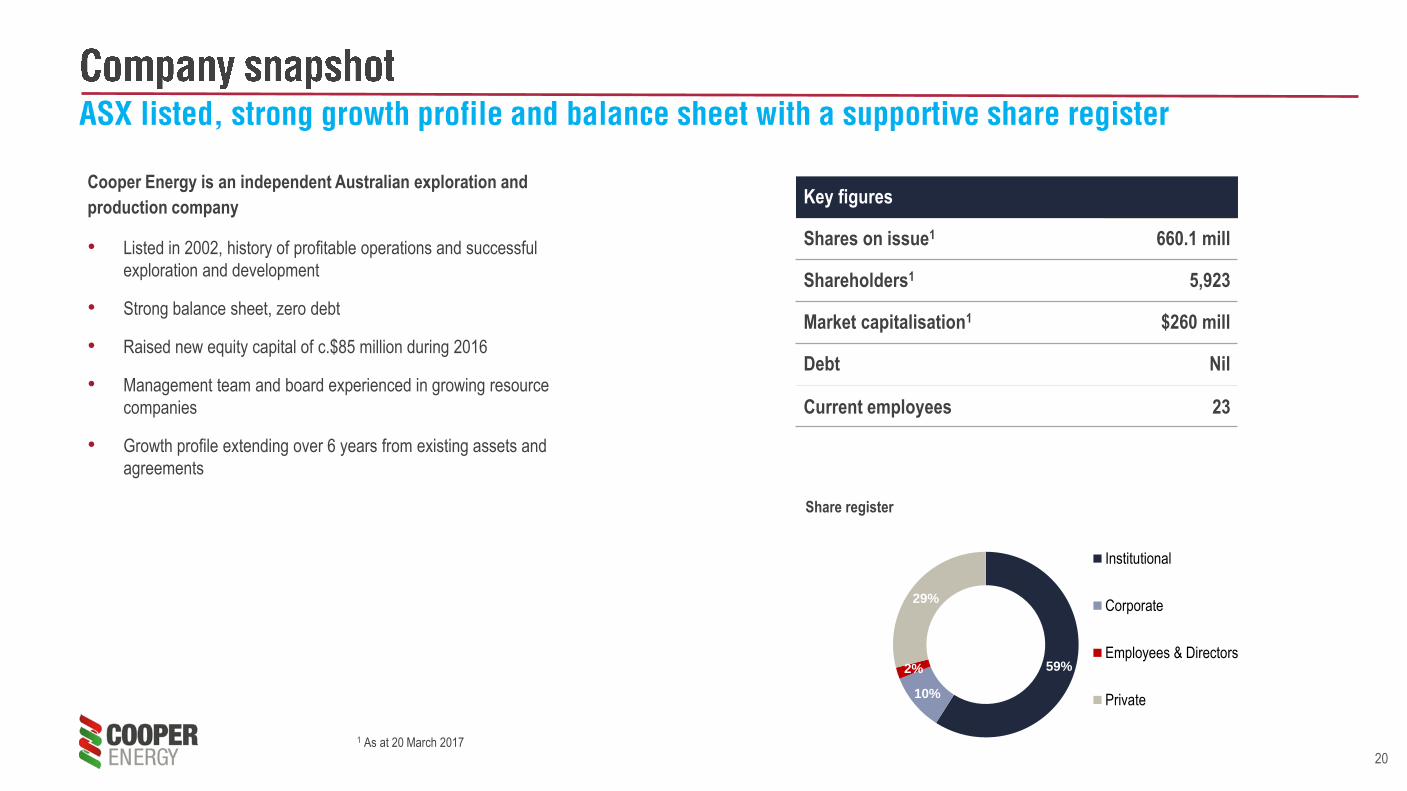
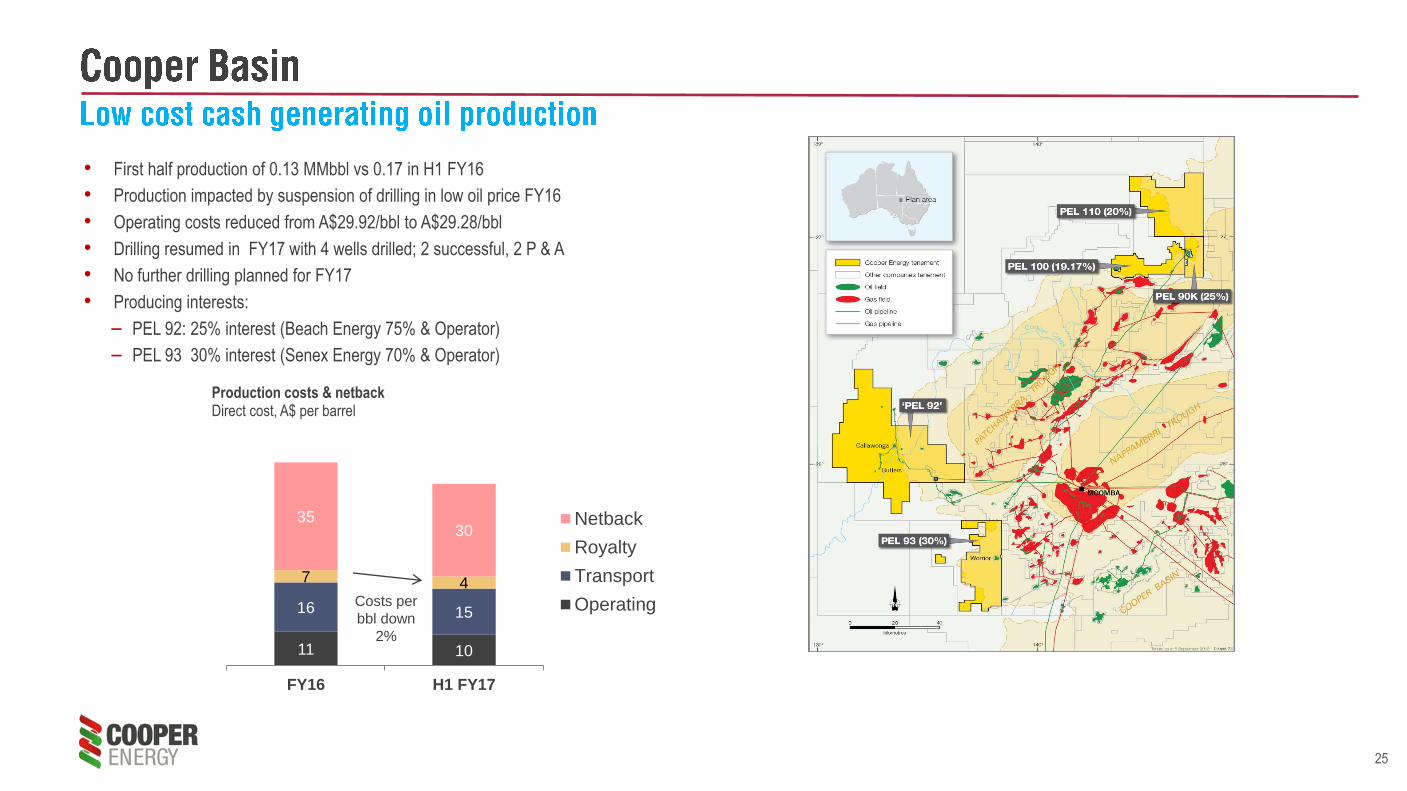