(asx: erj for personal use only2015/03/31 · (aten) technology without using any additional fuel...
TRANSCRIPT
Enerji Ltd
ABN 62 009 423 189
(ASX: ERJ)
Annual Report
Annual Report
EN
ER
JI L
IMIT
ED
ANNUAL REPORT
31 December 2014
For
per
sona
l use
onl
y
Annual Report 2
EN
ER
JI L
IMIT
ED
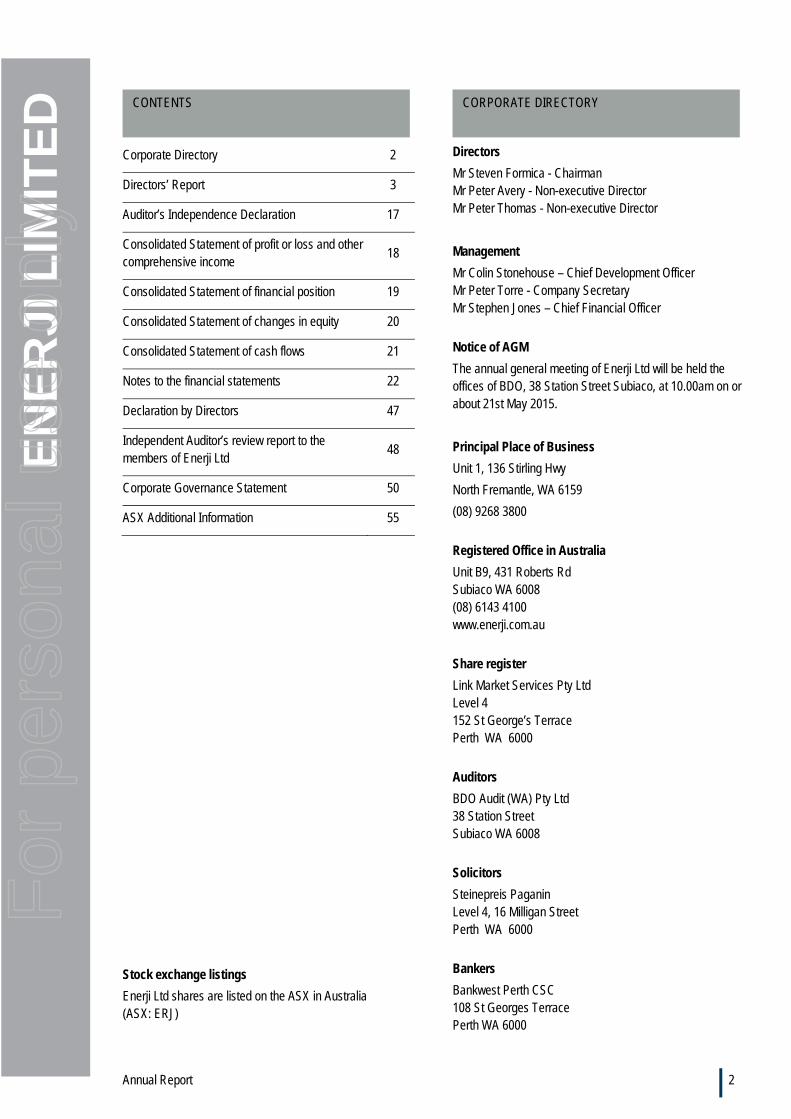
Corporate Directory 2
Directors’ Report 3
Auditor’s Independence Declaration 17
Consolidated Statement of profit or loss and other comprehensive income
18
Consolidated Statement of financial position 19
Consolidated Statement of changes in equity 20
Consolidated Statement of cash flows 21
Notes to the financial statements 22
Declaration by Directors 47
Independent Auditor’s review report to the members of Enerji Ltd
48
Corporate Governance Statement 50
ASX Additional Information 55
Stock exchange listings
Enerji Ltd shares are listed on the ASX in Australia (ASX: ERJ)
Directors
Mr Steven Formica - Chairman Mr Peter Avery - Non-executive Director Mr Peter Thomas - Non-executive Director
Management
Mr Colin Stonehouse – Chief Development Officer Mr Peter Torre - Company Secretary Mr Stephen Jones – Chief Financial Officer
Notice of AGM
The annual general meeting of Enerji Ltd will be held the offices of BDO, 38 Station Street Subiaco, at 10.00am on or about 21st May 2015.
Principal Place of Business
Unit 1, 136 Stirling Hwy
North Fremantle, WA 6159
(08) 9268 3800
Registered Office in Australia
Unit B9, 431 Roberts Rd Subiaco WA 6008 (08) 6143 4100 www.enerji.com.au
Share register
Link Market Services Pty Ltd Level 4 152 St George’s Terrace Perth WA 6000
Auditors
BDO Audit (WA) Pty Ltd 38 Station Street Subiaco WA 6008
Solicitors
Steinepreis Paganin Level 4, 16 Milligan Street Perth WA 6000
Bankers
Bankwest Perth CSC 108 St Georges Terrace Perth WA 6000
CONTENTS
CORPORATE DIRECTORY
For
per
sona
l use
onl
y
Annual Report 3
EN
ER
JI L
IMIT
ED
The directors present their report together with the financial report of the consolidated entity (referred to hereafter as the Group) consisting of Enerji Ltd (“Enerji” or “the Company”), and subsidiaries for the year ended 31 December 2014 and the auditor’s report thereon.
Directors
The directors of the company at any time during or since the end of the financial year are:
Mr Steven Formica (appointed 24 April 2014) – Non-executive Chairman
Mr Peter Avery (appointed 24 April 2014) - Non-executive Director
Mr Peter Thomas (appointed 9 February 2015) - Non-executive Director
Mr Justin Audcent (appointed 17 January 2014, resigned 9 February 2015) – Independent Non-executive Director
Mr Colin Stonehouse (resigned 1 September 2014) - CEO and Managing Director
Mr Rolf Hasselström (resigned 29 August 2014) - Non-executive Director
Mr Geoff Reid (resigned 17 January 2014) – Executive Director
Company Secretary
Mr Peter Torre (appointed 1 September 2014)
Mr Geoff Reid (resigned 1 September 2014)
Information on directors
Steven Formica – Non-Executive Chairman
Steve Formica has been a successful businessman for over 30 years. He has been involved in multiple successful business ventures either as a founding shareholder, operational Managing Director or as a Non-Executive Director. Steve serves as a Director of both FPG Projects and Viridian Property Group, both successful property developers and Lindian Resources Limited.
Other current directorships
FPG Projects
Viridian Property Group
Lindian Resources Limited
Former directorships in last 3 years
None
Special responsibilities
Chair of the board.
Interests in shares and options
43,832,709 ordinary shares in Enerji Limited.
4,126,597 options in Enerji Limited.
Peter Avery – Non-executive director
Peter Avery has over 20 years professional experience within the stockbroking industry. During the previous 10 years, Peter has held a senior role as a private client advisor at Perth broking firm, DJ Carmichael (DJC). Prior to joining DJC, Peter developed specialist skills as an equity advisor at Todd Partners managing client portfolios.
Peter’s industry experience includes extensive capital raisings within the resource and mining sectors and he holds a Diploma of Financial Planning from Deakin University.
Other current directorships
None
Former directorships in last 3 years
Baru Resources Limited Special responsibilities
Investor Relations.
Interests in shares and options
105,652,093 ordinary shares in Enerji Limited.
7,881,667 options in Enerji Limited.
Peter Thomas – Non-executive director
(appointed 9 February 2015)
Peter Thomas has a broad international business background of over 20 years in finance and natural resources. Most recently, he was a senior executive at Fortescue Metals Group where for over ten years he held the roles of CFO (TPI), General Manager Rail, Project Director, General Manager Christmas Creek project and Director of Shared Services. Prior to that, Peter was an investment banker in New York and London working for Lehman Brothers. He has served on several boards in both the listed and non-listed space. Peter has an MBA from Harvard University and a BEc (finance, actuarial studies) and BSc (mathematics) from Macquarie University and is a Graduate of the Australian Institute of Company Directors.
Other current directorships
None
Former directorships in last 3 years
None
Special responsibilities
None.
Interests in shares and options
Nil ordinary shares in Enerji Limited.
Nil options in Enerji Limited.
DIRECTORS’ REPORT
For
per
sona
l use
onl
y
Annual Report 4
EN
ER
JI L
IMIT
ED
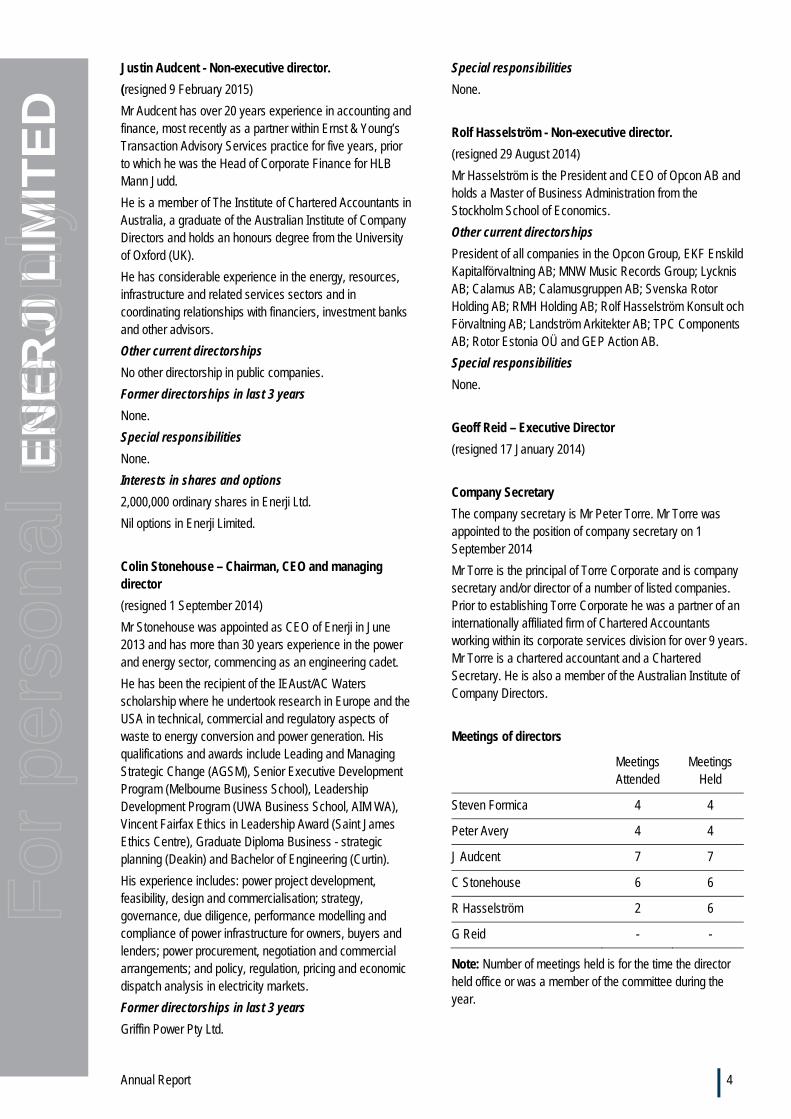
Justin Audcent - Non-executive director.
(resigned 9 February 2015)
Mr Audcent has over 20 years experience in accounting and finance, most recently as a partner within Ernst & Young’s Transaction Advisory Services practice for five years, prior to which he was the Head of Corporate Finance for HLB Mann Judd.
He is a member of The Institute of Chartered Accountants in Australia, a graduate of the Australian Institute of Company Directors and holds an honours degree from the University of Oxford (UK).
He has considerable experience in the energy, resources, infrastructure and related services sectors and in coordinating relationships with financiers, investment banks and other advisors.
Other current directorships
No other directorship in public companies.
Former directorships in last 3 years
None.
Special responsibilities
None.
Interests in shares and options
2,000,000 ordinary shares in Enerji Ltd.
Nil options in Enerji Limited.
Colin Stonehouse – Chairman, CEO and managing director
(resigned 1 September 2014)
Mr Stonehouse was appointed as CEO of Enerji in June 2013 and has more than 30 years experience in the power and energy sector, commencing as an engineering cadet.
He has been the recipient of the IEAust/AC Waters scholarship where he undertook research in Europe and the USA in technical, commercial and regulatory aspects of waste to energy conversion and power generation. His qualifications and awards include Leading and Managing Strategic Change (AGSM), Senior Executive Development Program (Melbourne Business School), Leadership Development Program (UWA Business School, AIM WA), Vincent Fairfax Ethics in Leadership Award (Saint James Ethics Centre), Graduate Diploma Business - strategic planning (Deakin) and Bachelor of Engineering (Curtin).
His experience includes: power project development, feasibility, design and commercialisation; strategy, governance, due diligence, performance modelling and compliance of power infrastructure for owners, buyers and lenders; power procurement, negotiation and commercial arrangements; and policy, regulation, pricing and economic dispatch analysis in electricity markets.
Former directorships in last 3 years
Griffin Power Pty Ltd.
Special responsibilities
None.
Rolf Hasselström - Non-executive director.
(resigned 29 August 2014)
Mr Hasselström is the President and CEO of Opcon AB and holds a Master of Business Administration from the Stockholm School of Economics.
Other current directorships
President of all companies in the Opcon Group, EKF Enskild Kapitalförvaltning AB; MNW Music Records Group; Lycknis AB; Calamus AB; Calamusgruppen AB; Svenska Rotor Holding AB; RMH Holding AB; Rolf Hasselström Konsult och Förvaltning AB; Landström Arkitekter AB; TPC Components AB; Rotor Estonia OÜ and GEP Action AB.
Special responsibilities
None.
Geoff Reid – Executive Director
(resigned 17 January 2014)
Company Secretary
The company secretary is Mr Peter Torre. Mr Torre was appointed to the position of company secretary on 1 September 2014
Mr Torre is the principal of Torre Corporate and is company secretary and/or director of a number of listed companies. Prior to establishing Torre Corporate he was a partner of an internationally affiliated firm of Chartered Accountants working within its corporate services division for over 9 years. Mr Torre is a chartered accountant and a Chartered Secretary. He is also a member of the Australian Institute of Company Directors.
Meetings of directors
Meetings Attended
Meetings Held
Steven Formica 4 4
Peter Avery 4 4
J Audcent 7 7
C Stonehouse 6 6
R Hasselström 2 6
G Reid - -
Note: Number of meetings held is for the time the director held office or was a member of the committee during the year.
For
per
sona
l use
onl
y
Annual Report 5
EN
ER
JI L
IMIT
ED
Corporate actions
Consolidation of capital
At an EGM on 31 January 2014 shareholders voted in favour of a resolution to consolidate the issued capital through a conversion of every 10 securities in the Company into 1 security in the Company, The consolidation took effect on 17 February 2014.
Entitlement Offer
The Company announced a fully underwritten entitlement offer (Offer) on 11 February 2014. This Offer is 1 New Share for every 1 Share held. The Offer closed 18 March 2014.
Principal activities
The principal activities of the Group during the course of the financial year were:
Design and development of systems to produce electricity from heat.
Review of operations
Enerji is a thermal energy company that harnesses waste heat from power generation and industrial processes to generate electricity. It delivers power generation solutions to customers that optimise the use of their energy sources and reduce their electricity costs. It does this by turning low grade heat into electricity through its unique patented new Accretive Thermal Energy Node (ATEN) technology without using any additional fuel or creating any additional emissions. ATEN captures heat accretively from a range of different sources and simultaneously conditions it for use in a single heat-to-power system. Enerji’s different ATEN systems have been developed with a compact, standardised design which is suitable for prefabricated, modular manufacture. This removes the need for bespoke infrastructure which has been the industry norm. By considerably reducing project complexity, time and cost the Directors believe ATEN will disrupt and grow the heat-to-power market.
During 2014, Enerji initiated its “Five-Projects” strategy, focused on developing a pipeline of five commercial projects which utilise its technology.
These projects have been selected based on the following key criteria:
Opportunity to develop new intellectual property for the future benefit of the company while optimising the research and development outcomes;
Capacity to utilise the company’s technology commercially to generate revenues;
Scope for a staged project development process that progressively builds customer confidence and commitment from initial project screening through to full installation; and
Streamline the project delivery process including supply chain improvements, competitive processes, continuous improvement and cost reduction.
The company is progressing discussions with commercial partners in respect of five separate projects which it aims to progress to phased development agreements. Enerji continues to focus the company’s resources on the commercialisation of these five projects.
The first of these was announced subsequent to the year end, in February 2015. Enerji entered a binding agreement with Carbon Reduction Ventures Pty Ltd and Morawa Solar Thermal Pty Ltd for the planned development of a Hybrid Solar Thermal Project in Australia using its ATEN 3 technology. It will combine waste heat from a fossil fuel power station with solar thermal energy to generate power with zero emissions. The project is supported by WA State Government funding through its Low Emissions Energy Development (LEED) Fund.
This was a major milestone for Enerji and a catalyst for the commercialisation of its ATEN systems and validation of its ongoing IP development.
Three of the other projects involve waste heat recovery from existing large industrial facilities in different regions of Australia. These are considerably more complex and of a larger scale.
The final project is for waste heat recovery from a larger scale power station.
As the projects are commercially sensitive Enerji is limited in what it can disclose, however the company will keep the market updated as these projects progress towards the development phase.
To facilitate delivery of the Five-Projects strategy, changes have been implemented to the company’s Board and management. These were implemented in September 2014 to strengthen Enerji’s governance structure and allow key management to focus on business and project development.
Enerji has also taken a number of corporate and commercial actions including:
Closing out the Carnarvon pilot plant construction and testing, capturing valuable data and settling costs and liabilities.
Clearing loans and borrowings. The short-term loan facility with Macquarie Bank was paid out and convertible notes with a face value of $220,000 were redeemed in August 2014. The remaining $90,000 in convertible notes was negotiated for redemption in April 2015 following the receipt of the 2014 R&D Tax Rebate.
For
per
sona
l use
onl
y
Annual Report 6
EN
ER
JI L
IMIT
ED
Arranging a new R&D Finance facility in December 2014 with Metamor Capital Partners. This facility enables Enerji to progress its Five-Project strategy by accessing funds that are to be realised as part of the year-end tax return lodgment.
Restructuring the business and achieving operational cost savings, with a view to minimising the need for additional funding prior to securing contracted projects (with each project expected to secure project funding as a pre-condition to proceeding).
The activities during the year and subsequent to the year end have provided Enerji with a solid platform for future growth.
Results of operations
The consolidated entity recorded an operating loss after income tax of $10,674,665 (2013: $4,924,410 loss). The loss including the following items of significance:
Amortisation of distribution right acquired ($1,009,399)
Impairment of prepayments ($5,422,978) Impairment of property plant and equipment
($2,066,668)
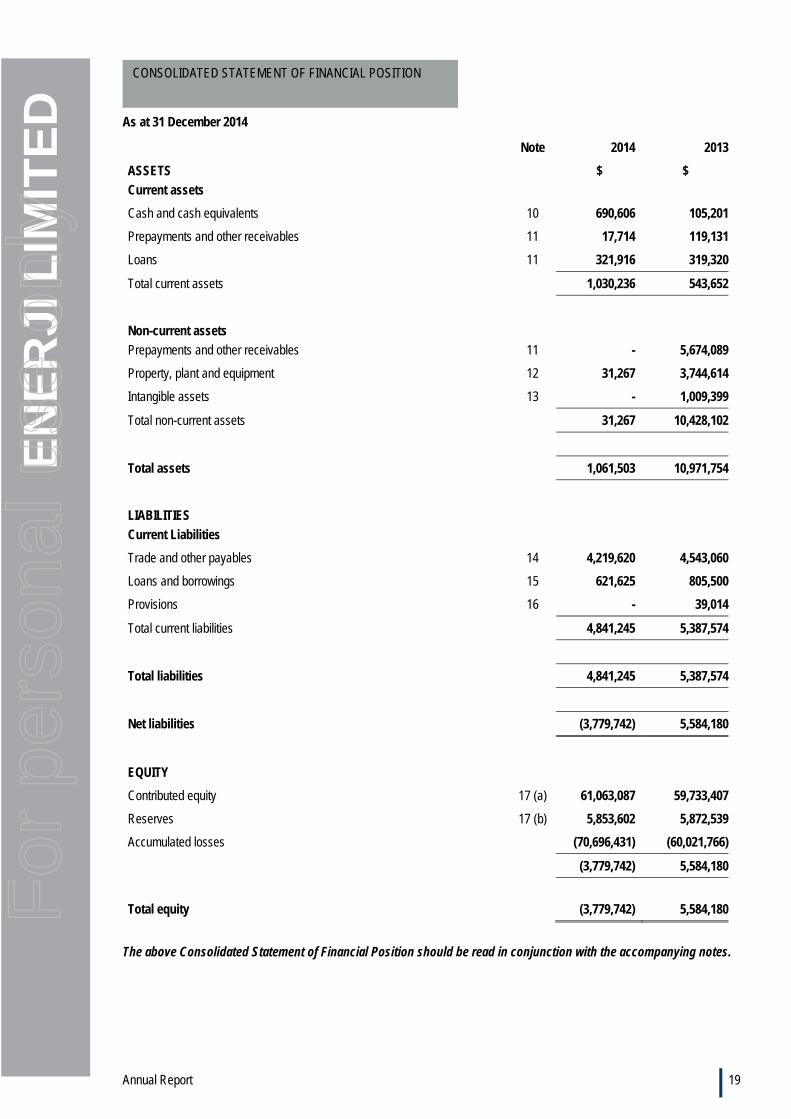
The net liabilities of the consolidated entity at 31 December 2014 were $3,779,742 (2013: net assets $5,584,180).
As at 31 December 2014 the Group had cash and cash equivalents of $690,606.
The net cash outflow from operating activities of $344,641 and net cash outflow from investing activities of $57,890, relate to payments to advance new projects.
Remuneration Report – 2014 (Audited)
The directors present the Enerji Limited 2014 remuneration report, outlining key aspects of our remuneration policy and framework, and remuneration awarded this year.
The report is structured as follows:
a) Key Management personnel (KMP) covered in this report
b) Remuneration policy, link to performance and elements of remuneration
c) Link between remuneration and performance d) Remuneration expenses for executive KMP e) Non-executive director arrangements f) Contractual arrangements for KMP g) Other statutory information
a) Key management personnel covered in this report
Non-executive and executive directors (see above for details about each director)
Mr Steven Formica (appointed 24 April 2014) – Non-executive chairman
Mr Peter Avery (appointed 24 April 2014) - Non-executive Director
Mr Justin Audcent (appointed 17 January 2014, resigned 9 February 2015) - Non-executive Director
Mr Rolf Hasselström (resigned 29 August 2014) - Non-executive Director
Mr Colin Stonehouse (resigned 1 September 2014) - CEO and Managing Director
Mr Geoff Reid (appointed 27 December 2013, resigned 17 January 2014) – Executive Director
Other key management personnel
Mr Colin Stonehouse (appointed 1 September 2014) – Chief Development Officer
Mr Stephen Jones (appointed 1 September 2014) – Chief Financial Officer
Mr Ken MacCormick (appointed 18 November 2013, resigned 31 August 2014) – General Manager Development
Changes since the end of the reporting period
Mr Peter Thomas was appointed as a non-executive director on 9 February 2015.
b) Remuneration policy, link to performance and elements of remuneration
Our remuneration committee is made up of the Board Chair and a non-executive director.
The company’s key management have been restructured with new key management and a new non-executive directors appointed.
The Company announced a new Board Plan on 20 January 2014 with the appointment of a new Chairman being achieved on 24 April 2014. The final aspect of the plan was achieved on 1 September 2014 with the change of roles from Managing Director to Chief Development Officer.
During the reporting period no payments were made to a person before the person took office as part of the consideration for the person agreeing to hold office.
Non-Executive Directors
On appointment to the board, all non-executive directors enter into a service agreement with the company in the form of a letter of appointment. The letter summarises the board policies and terms, including compensation, relevant to the office of director.
Presently no element of director remuneration is ‘at risk’, that is, fees are not based on the performance of the Company or equity based.
For
per
sona
l use
onl
y
Annual Report 7
EN
ER
JI L
IMIT
ED
Executive management
Executive management have authority and responsibility for planning, directing and controlling the activities of the company. Compensation levels for executive management of the Company are set competitively to attract and retain appropriately qualified and experienced and senior executives.
The compensation structures for executives are designed to attract suitably qualified candidates, reward the achievement of strategic objectives and achieve the broader outcome of the creation of value for shareholders. The compensation structure takes into account the executives’ capability and experience, level of responsibility and ability to contribute to the Company’s performance, including, in particular, the establishment of revenue streams and growth in shareholder returns.
Fixed compensation consists of a base salary or fee (calculated on a total cost basis, including any fringe benefits tax related to employee benefits) as well as employer contributions to superannuation funds. The board through a process that considers individual and company achievement reviews compensation levels annually.
c) Link between remuneration and performance
There was no performance-linked remuneration paid during the reporting period. The Group will be seeking to establish a short-term incentive (STI) scheme and a long-term incentive (LTI) scheme, presently there is no formal policy in place but the remuneration committee will consider this. Mr Stonehouse had short-term and long-term incentives in his 2013 Services Agreement signed 24 June 2013 (refer later in this report for details). Mr Stonehouse’s 2014 Ames Agreement (refer later in this report for details) has deferred payments for work completed that is based on achievement of future milestones. The shareholders in general meetings approve all securities issues to key management and executive directors. This is the only link between remuneration and shareholder wealth.
There is only a relatively short history of the compensation structure for the Company and the remuneration committee is formulating the new policy to consider this.
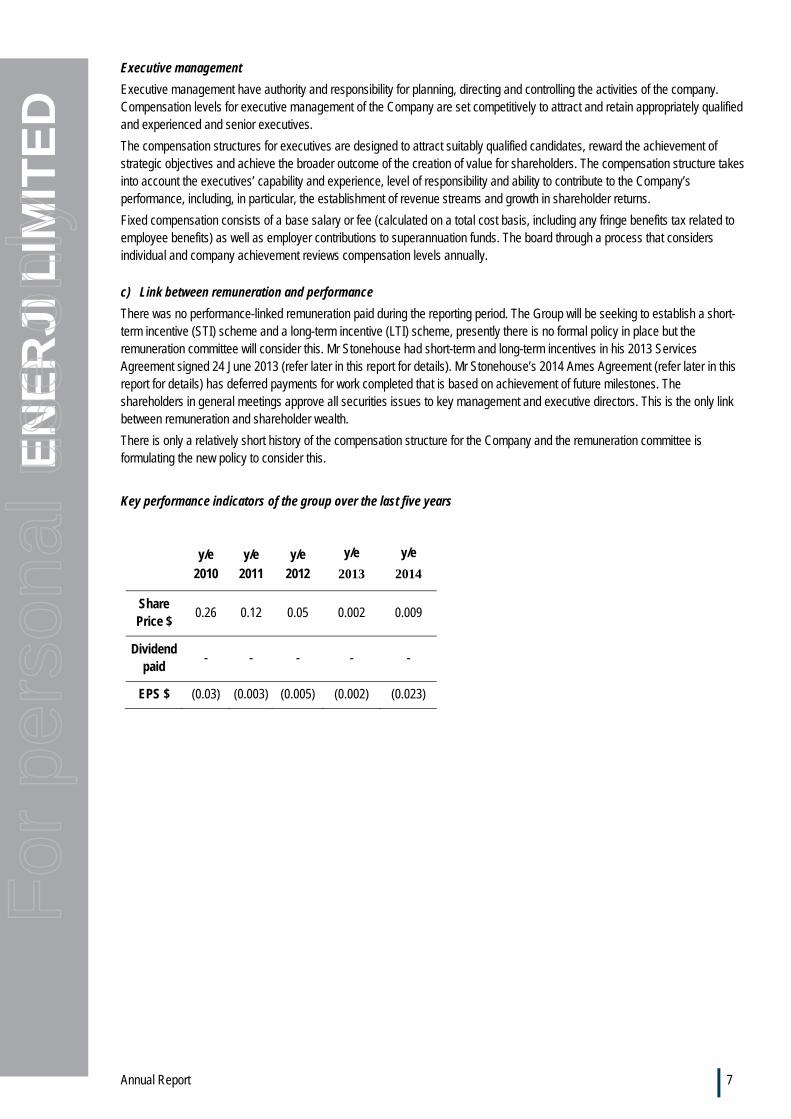
Key performance indicators of the group over the last five years
y/e
2010
y/e
2011
y/e
2012
y/e
2013
y/e
2014
Share Price $
0.26 0.12 0.05 0.002 0.009
Dividend paid
- - - - -
EPS $ (0.03) (0.003) (0.005) (0.002) (0.023)
For
per
sona
l use
onl
y
Annual Report 8
EN
ER
JI L
IMIT
ED
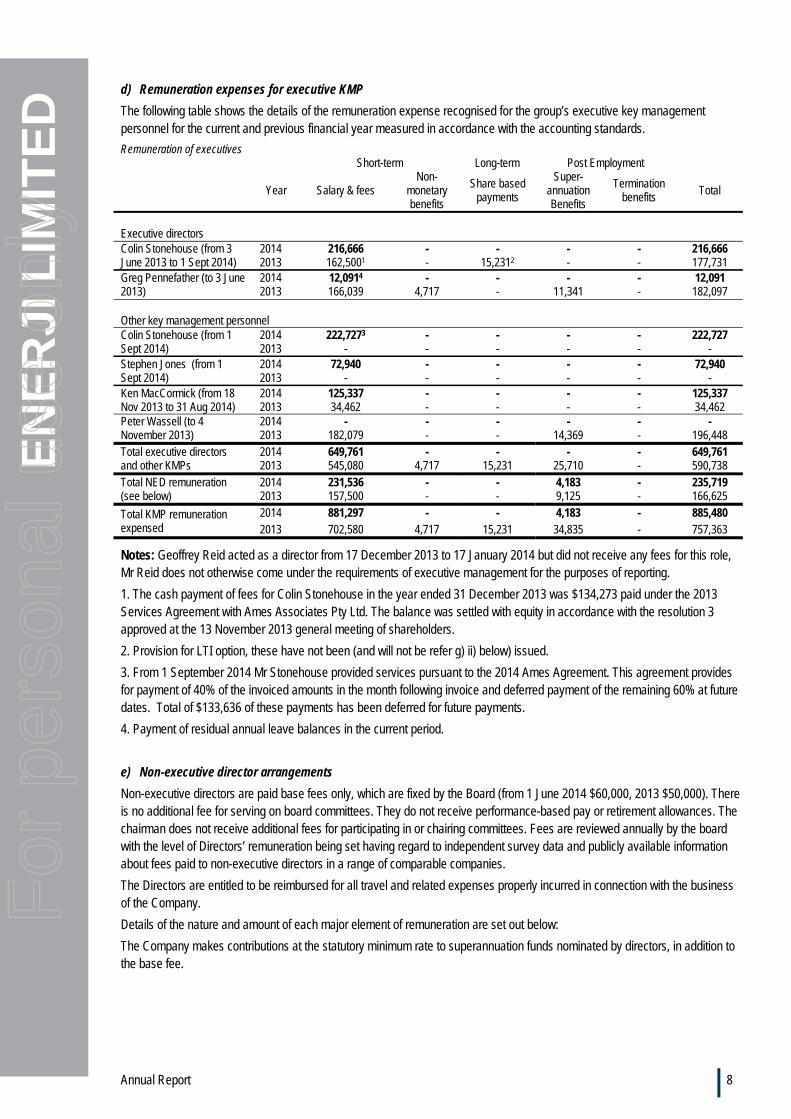
d) Remuneration expenses for executive KMP
The following table shows the details of the remuneration expense recognised for the group’s executive key management personnel for the current and previous financial year measured in accordance with the accounting standards.
Remuneration of executives Short-term Long-term Post Employment
Year Salary & fees
Non-monetary benefits
Share based payments
Super-annuation Benefits
Termination benefits
Total
Executive directors Colin Stonehouse (from 3 June 2013 to 1 Sept 2014)
2014 216,666 - - - - 216,666 2013 162,5001 - 15,2312 - - 177,731
Greg Pennefather (to 3 June 2013)
2014 12,0914 - - - - 12,091 2013 166,039 4,717 - 11,341 - 182,097
Other key management personnel Colin Stonehouse (from 1 Sept 2014)
2014 222,7273 - - - - 222,727 2013 - - - - - -
Stephen Jones (from 1 Sept 2014)
2014 72,940 - - - - 72,940 2013 - - - - - -
Ken MacCormick (from 18 Nov 2013 to 31 Aug 2014)
2014 125,337 - - - - 125,337 2013 34,462 - - - - 34,462
Peter Wassell (to 4 November 2013)
2014 - - - - - - 2013 182,079 - - 14,369 - 196,448
Total executive directors and other KMPs
2014 649,761 - - - - 649,761 2013 545,080 4,717 15,231 25,710 - 590,738
Total NED remuneration (see below)
2014 231,536 - - 4,183 - 235,719 2013 157,500 - - 9,125 - 166,625
Total KMP remuneration expensed
2014 881,297 - - 4,183 - 885,480 2013 702,580 4,717 15,231 34,835 - 757,363
Notes: Geoffrey Reid acted as a director from 17 December 2013 to 17 January 2014 but did not receive any fees for this role, Mr Reid does not otherwise come under the requirements of executive management for the purposes of reporting.
1. The cash payment of fees for Colin Stonehouse in the year ended 31 December 2013 was $134,273 paid under the 2013 Services Agreement with Ames Associates Pty Ltd. The balance was settled with equity in accordance with the resolution 3 approved at the 13 November 2013 general meeting of shareholders.
2. Provision for LTI option, these have not been (and will not be refer g) ii) below) issued.
3. From 1 September 2014 Mr Stonehouse provided services pursuant to the 2014 Ames Agreement. This agreement provides for payment of 40% of the invoiced amounts in the month following invoice and deferred payment of the remaining 60% at future dates. Total of $133,636 of these payments has been deferred for future payments.
4. Payment of residual annual leave balances in the current period.
e) Non-executive director arrangements
Non-executive directors are paid base fees only, which are fixed by the Board (from 1 June 2014 $60,000, 2013 $50,000). There is no additional fee for serving on board committees. They do not receive performance-based pay or retirement allowances. The chairman does not receive additional fees for participating in or chairing committees. Fees are reviewed annually by the board with the level of Directors’ remuneration being set having regard to independent survey data and publicly available information about fees paid to non-executive directors in a range of comparable companies.
The Directors are entitled to be reimbursed for all travel and related expenses properly incurred in connection with the business of the Company.
Details of the nature and amount of each major element of remuneration are set out below:
The Company makes contributions at the statutory minimum rate to superannuation funds nominated by directors, in addition to the base fee.
For
per
sona
l use
onl
y
Annual Report 9
EN
ER
JI L
IMIT
ED
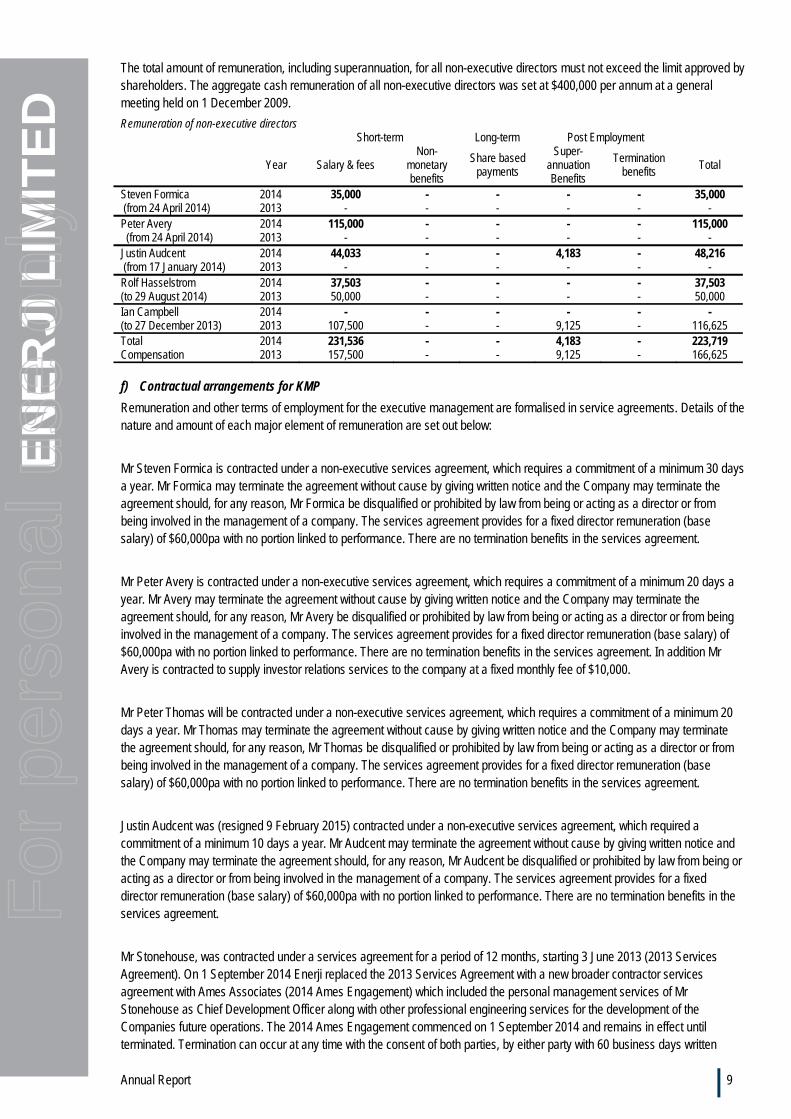
The total amount of remuneration, including superannuation, for all non-executive directors must not exceed the limit approved by shareholders. The aggregate cash remuneration of all non-executive directors was set at $400,000 per annum at a general meeting held on 1 December 2009.
Remuneration of non-executive directors Short-term Long-term Post Employment
Year Salary & fees
Non-monetary benefits
Share based payments
Super-annuation Benefits
Termination benefits
Total
Steven Formica 2014 35,000 - - - - 35,000 (from 24 April 2014) 2013 - - - - - - Peter Avery 2014 115,000 - - - - 115,000 (from 24 April 2014) 2013 - - - - - - Justin Audcent 2014 44,033 - - 4,183 - 48,216 (from 17 January 2014) 2013 - - - - - - Rolf Hasselstrom 2014 37,503 - - - - 37,503 (to 29 August 2014) 2013 50,000 - - - - 50,000 Ian Campbell 2014 - - - - - - (to 27 December 2013) 2013 107,500 - - 9,125 - 116,625 Total 2014 231,536 - - 4,183 - 223,719 Compensation 2013 157,500 - - 9,125 - 166,625 f) Contractual arrangements for KMP
Remuneration and other terms of employment for the executive management are formalised in service agreements. Details of the nature and amount of each major element of remuneration are set out below:
Mr Steven Formica is contracted under a non-executive services agreement, which requires a commitment of a minimum 30 days a year. Mr Formica may terminate the agreement without cause by giving written notice and the Company may terminate the agreement should, for any reason, Mr Formica be disqualified or prohibited by law from being or acting as a director or from being involved in the management of a company. The services agreement provides for a fixed director remuneration (base salary) of $60,000pa with no portion linked to performance. There are no termination benefits in the services agreement.
Mr Peter Avery is contracted under a non-executive services agreement, which requires a commitment of a minimum 20 days a year. Mr Avery may terminate the agreement without cause by giving written notice and the Company may terminate the agreement should, for any reason, Mr Avery be disqualified or prohibited by law from being or acting as a director or from being involved in the management of a company. The services agreement provides for a fixed director remuneration (base salary) of $60,000pa with no portion linked to performance. There are no termination benefits in the services agreement. In addition Mr Avery is contracted to supply investor relations services to the company at a fixed monthly fee of $10,000.
Mr Peter Thomas will be contracted under a non-executive services agreement, which requires a commitment of a minimum 20 days a year. Mr Thomas may terminate the agreement without cause by giving written notice and the Company may terminate the agreement should, for any reason, Mr Thomas be disqualified or prohibited by law from being or acting as a director or from being involved in the management of a company. The services agreement provides for a fixed director remuneration (base salary) of $60,000pa with no portion linked to performance. There are no termination benefits in the services agreement.
Justin Audcent was (resigned 9 February 2015) contracted under a non-executive services agreement, which required a commitment of a minimum 10 days a year. Mr Audcent may terminate the agreement without cause by giving written notice and the Company may terminate the agreement should, for any reason, Mr Audcent be disqualified or prohibited by law from being or acting as a director or from being involved in the management of a company. The services agreement provides for a fixed director remuneration (base salary) of $60,000pa with no portion linked to performance. There are no termination benefits in the services agreement.
Mr Stonehouse, was contracted under a services agreement for a period of 12 months, starting 3 June 2013 (2013 Services Agreement). On 1 September 2014 Enerji replaced the 2013 Services Agreement with a new broader contractor services agreement with Ames Associates (2014 Ames Engagement) which included the personal management services of Mr Stonehouse as Chief Development Officer along with other professional engineering services for the development of the Companies future operations. The 2014 Ames Engagement commenced on 1 September 2014 and remains in effect until terminated. Termination can occur at any time with the consent of both parties, by either party with 60 business days written
For
per
sona
l use
onl
y
Annual Report 10
EN
ER
JI L
IMIT
ED
notice or by either party if the other party is in default of the terms of the agreement and fails to remedy the default within 20 business days.
The short and long term incentives of the 2013 Services Agreement including options linked to company performance have been superceded by the terms of the 2014 Ames Engagement.
Rolf Hasselström was (resigned on 29 August 2014) employed under a non-executive services agreement, which requires a commitment of a minimum 20 days a year. Mr Hasselström may terminate the agreement without cause by giving written notice and the Company may terminate the agreement should, for any reason, Mr Hasselström be disqualified or prohibited by law from being or acting as a director or from being involved in the management of a company. The non-executive services agreement provides for a fixed director remuneration (base salary) of $50,000pa with no portion linked to performance. There are no termination benefits in the non-executive services agreement.
Stephen Jones is contracted under a services agreement with a fixed retainer of $144,000pa and no fixed termination date, no termination notice period or benefits.
Ken MacCormick was contracted under a services agreement, which terminated on 3 February 2014. Mr MacCormick remained engaged until August 2014 to assist in the completion of various tasks. There was no base salary component. There were no termination benefits applicable under this contract.
During the reporting period no payments were made to a person before the person took office as part of the consideration for the person agreeing to hold office.
Share-based compensation
During or since the end of the financial year, the Company issued no ordinary shares as share based payments for remuneration of non-executive directors or executive management.
Options over ordinary shares in the Company that were conditionally agreed as compensation to Mr Stonehouse as incentives on achieving long-term targets in 2013 have never been issued. With the superceding of the 2013 Service Agreement these options will not be issued. Further details are provided under service agreements above.
The Board does not have a policy that restricts the holders of securities issued as share based payments as part of their remuneration from entering into other arrangements that limit their exposure to losses that would result from share price decreases. The Board is not aware of any holder entering into any such arrangements.
Other than noted above no terms of equity-settled share based payment transactions (including options granted as compensation to a key management person or Director) have been altered or modified by the Company during the reporting period. No options have been exercised as a result of previously issue remuneration options.
For
per
sona
l use
onl
y
Annual Report 11
EN
ER
JI L
IMIT
ED
g) Other statutory information
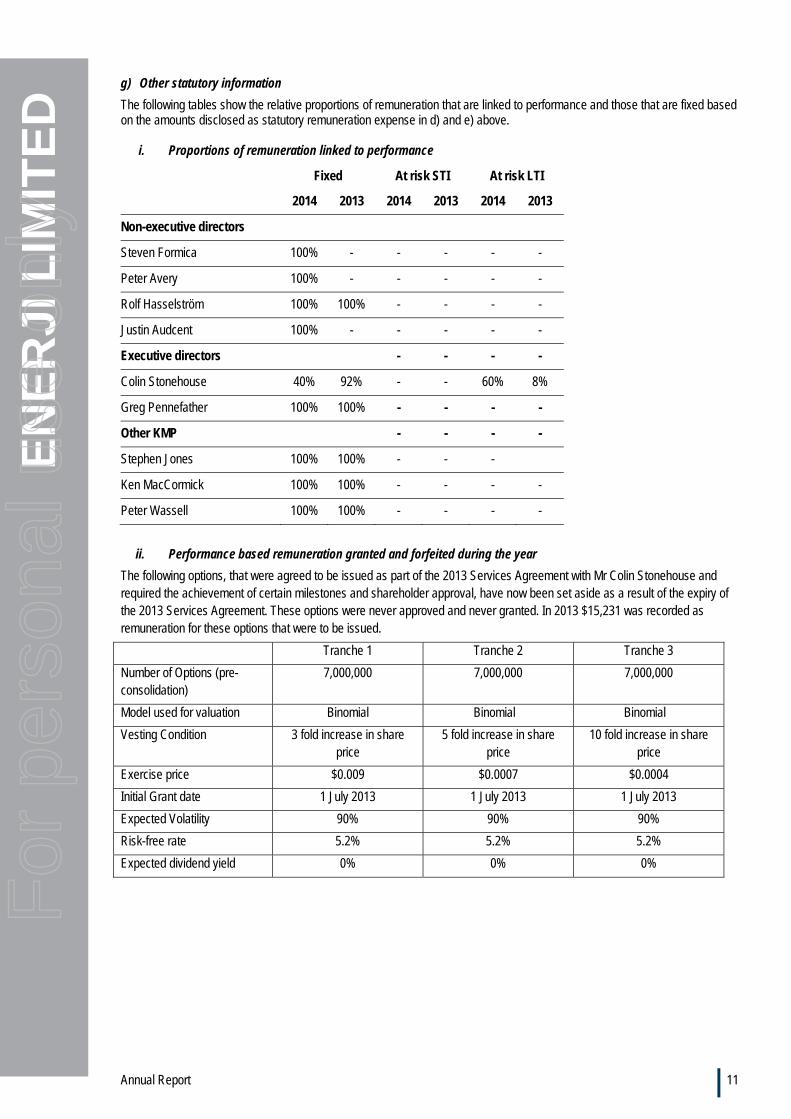
The following tables show the relative proportions of remuneration that are linked to performance and those that are fixed based on the amounts disclosed as statutory remuneration expense in d) and e) above.
i. Proportions of remuneration linked to performance
Fixed At risk STI At risk LTI
2014 2013 2014 2013 2014 2013
Non-executive directors
Steven Formica 100% - - - - -
Peter Avery 100% - - - - -
Rolf Hasselström 100% 100% - - - -
Justin Audcent 100% - - - - -
Executive directors - - - -
Colin Stonehouse 40% 92% - - 60% 8%
Greg Pennefather 100% 100% - - - -
Other KMP - - - -
Stephen Jones 100% 100% - - -
Ken MacCormick 100% 100% - - - -
Peter Wassell 100% 100% - - - -
ii. Performance based remuneration granted and forfeited during the year
The following options, that were agreed to be issued as part of the 2013 Services Agreement with Mr Colin Stonehouse and required the achievement of certain milestones and shareholder approval, have now been set aside as a result of the expiry of the 2013 Services Agreement. These options were never approved and never granted. In 2013 $15,231 was recorded as remuneration for these options that were to be issued.
Tranche 1 Tranche 2 Tranche 3
Number of Options (pre-consolidation)
7,000,000 7,000,000 7,000,000
Model used for valuation Binomial Binomial Binomial
Vesting Condition 3 fold increase in share price
5 fold increase in share price
10 fold increase in share price
Exercise price $0.009 $0.0007 $0.0004
Initial Grant date 1 July 2013 1 July 2013 1 July 2013
Expected Volatility 90% 90% 90%
Risk-free rate 5.2% 5.2% 5.2%
Expected dividend yield 0% 0% 0%
For
per
sona
l use
onl
y
Annual Report 12
EN
ER
JI L
IMIT
ED
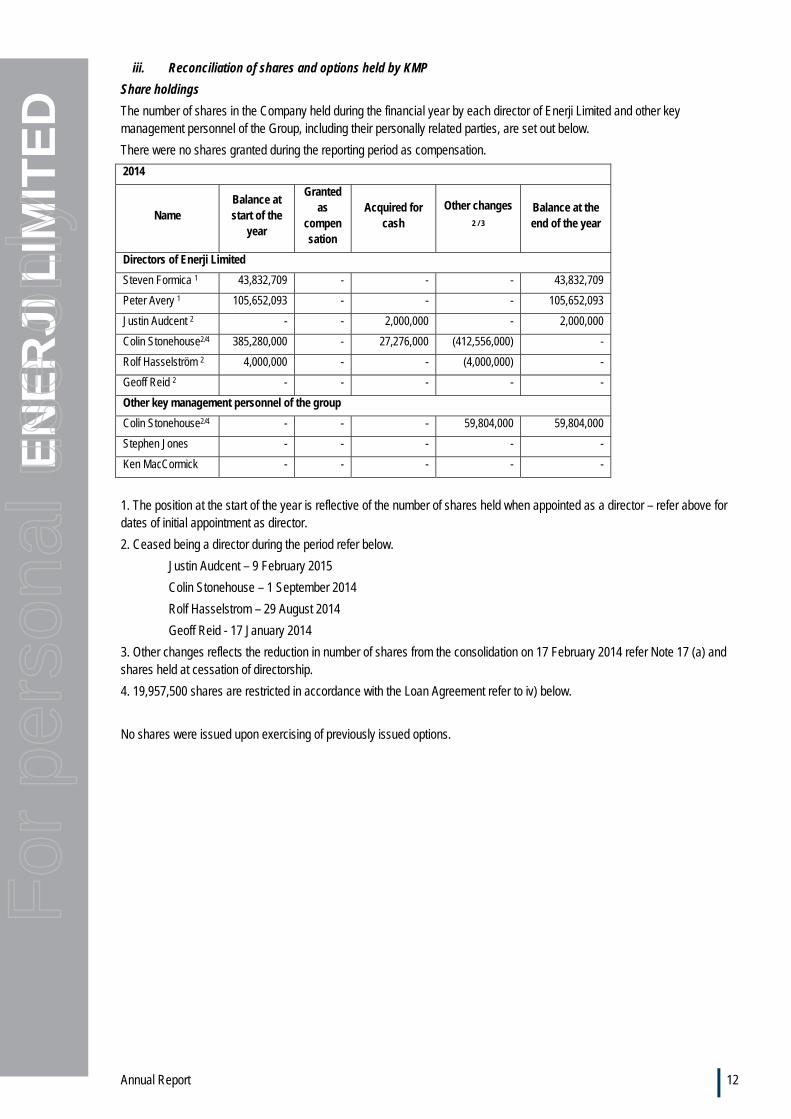
iii. Reconciliation of shares and options held by KMP
Share holdings
The number of shares in the Company held during the financial year by each director of Enerji Limited and other key management personnel of the Group, including their personally related parties, are set out below.
There were no shares granted during the reporting period as compensation.
2014
Name Balance at start of the
year
Granted as
compensation
Acquired for cash
Other changes 2 / 3
Balance at the end of the year
Directors of Enerji Limited
Steven Formica 1 43,832,709 - - - 43,832,709
Peter Avery 1 105,652,093 - - - 105,652,093
Justin Audcent 2 - - 2,000,000 - 2,000,000
Colin Stonehouse2/4 385,280,000 - 27,276,000 (412,556,000) -
Rolf Hasselström 2 4,000,000 - - (4,000,000) -
Geoff Reid 2 - - - - -
Other key management personnel of the group
Colin Stonehouse2/4 - - - 59,804,000 59,804,000
Stephen Jones - - - - -
Ken MacCormick - - - - -
1. The position at the start of the year is reflective of the number of shares held when appointed as a director – refer above for dates of initial appointment as director.
2. Ceased being a director during the period refer below.
Justin Audcent – 9 February 2015
Colin Stonehouse – 1 September 2014
Rolf Hasselstrom – 29 August 2014
Geoff Reid - 17 January 2014
3. Other changes reflects the reduction in number of shares from the consolidation on 17 February 2014 refer Note 17 (a) and shares held at cessation of directorship.
4. 19,957,500 shares are restricted in accordance with the Loan Agreement refer to iv) below.
No shares were issued upon exercising of previously issued options.
For
per
sona
l use
onl
y
Annual Report 13
EN
ER
JI L
IMIT
ED
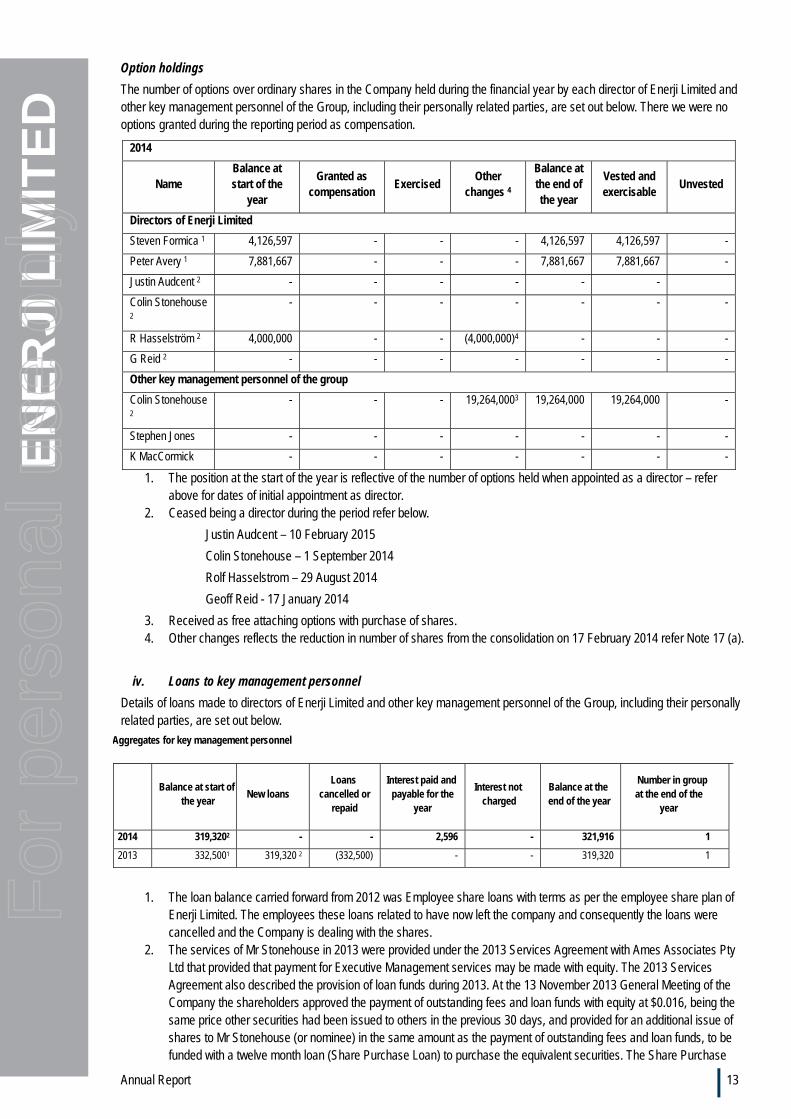
Option holdings
The number of options over ordinary shares in the Company held during the financial year by each director of Enerji Limited and other key management personnel of the Group, including their personally related parties, are set out below. There we were no options granted during the reporting period as compensation.
1. The position at the start of the year is reflective of the number of options held when appointed as a director – refer above for dates of initial appointment as director.
2. Ceased being a director during the period refer below.
Justin Audcent – 10 February 2015
Colin Stonehouse – 1 September 2014
Rolf Hasselstrom – 29 August 2014
Geoff Reid - 17 January 2014
3. Received as free attaching options with purchase of shares. 4. Other changes reflects the reduction in number of shares from the consolidation on 17 February 2014 refer Note 17 (a).
iv. Loans to key management personnel
Details of loans made to directors of Enerji Limited and other key management personnel of the Group, including their personally related parties, are set out below.
Aggregates for key management personnel
Balance at start of
the year New loans
Loans cancelled or
repaid
Interest paid and payable for the
year
Interest not charged
Balance at the end of the year
Number in group at the end of the
year
2014 319,3202 - - 2,596 - 321,916 1
2013 332,5001 319,320 2 (332,500) - - 319,320 1
1. The loan balance carried forward from 2012 was Employee share loans with terms as per the employee share plan of Enerji Limited. The employees these loans related to have now left the company and consequently the loans were cancelled and the Company is dealing with the shares.
2. The services of Mr Stonehouse in 2013 were provided under the 2013 Services Agreement with Ames Associates Pty Ltd that provided that payment for Executive Management services may be made with equity. The 2013 Services Agreement also described the provision of loan funds during 2013. At the 13 November 2013 General Meeting of the Company the shareholders approved the payment of outstanding fees and loan funds with equity at $0.016, being the same price other securities had been issued to others in the previous 30 days, and provided for an additional issue of shares to Mr Stonehouse (or nominee) in the same amount as the payment of outstanding fees and loan funds, to be funded with a twelve month loan (Share Purchase Loan) to purchase the equivalent securities. The Share Purchase
2014
Name Balance at start of the
year
Granted as compensation
Exercised Other
changes 4
Balance at the end of the year
Vested and exercisable
Unvested
Directors of Enerji Limited
Steven Formica 1 4,126,597 - - - 4,126,597 4,126,597 -
Peter Avery 1 7,881,667 - - - 7,881,667 7,881,667 -
Justin Audcent 2 - - - - - -
Colin Stonehouse 2
- - - - - - -
R Hasselström 2 4,000,000 - - (4,000,000)4 - - -
G Reid 2 - - - - - - -
Other key management personnel of the group
Colin Stonehouse 2
- - - 19,264,0003 19,264,000 19,264,000 -
Stephen Jones - - - - - - -
K MacCormick - - - - - - -
For
per
sona
l use
onl
y
Annual Report 14
EN
ER
JI L
IMIT
ED
Loan had a maturity date of 13 November 2014 and is currently being renegotiated. The terms of the new agreement are yet to be finalised however they are expected to be on a commercial and an arms-length basis.
v. Other transactions with key management personnel
Mr Avery is contracted to supply investor relations services to the company at a fixed monthly fee of $10,000.
Mr Avery provided underwriting services during the year and received a $25,000 underwriting fee paid in shares.
vi. Reliance on external remuneration consultants
The remuneration committee have not sought any recommendations from external remuneration consultants. Remuneration levels for Directors and KMP are reviewed annually by the board with the level of Non-executive Directors’ remuneration being set having regard to independent survey data and publicly available information about fees paid to non-executive directors in a range of comparable companies.
vii. Voting of Shareholders at last years annual general meeting
Enerji Limited received more than 90% of “yes” votes on its remuneration report for the 2013 Financial Year. The company did not receive any specific feedback at the AGM or throughout the year on its remuneration practices. This is the end of the Audited Remuneration Report.
For
per
sona
l use
onl
y
Annual Report 15
EN
ER
JI L
IMIT
ED
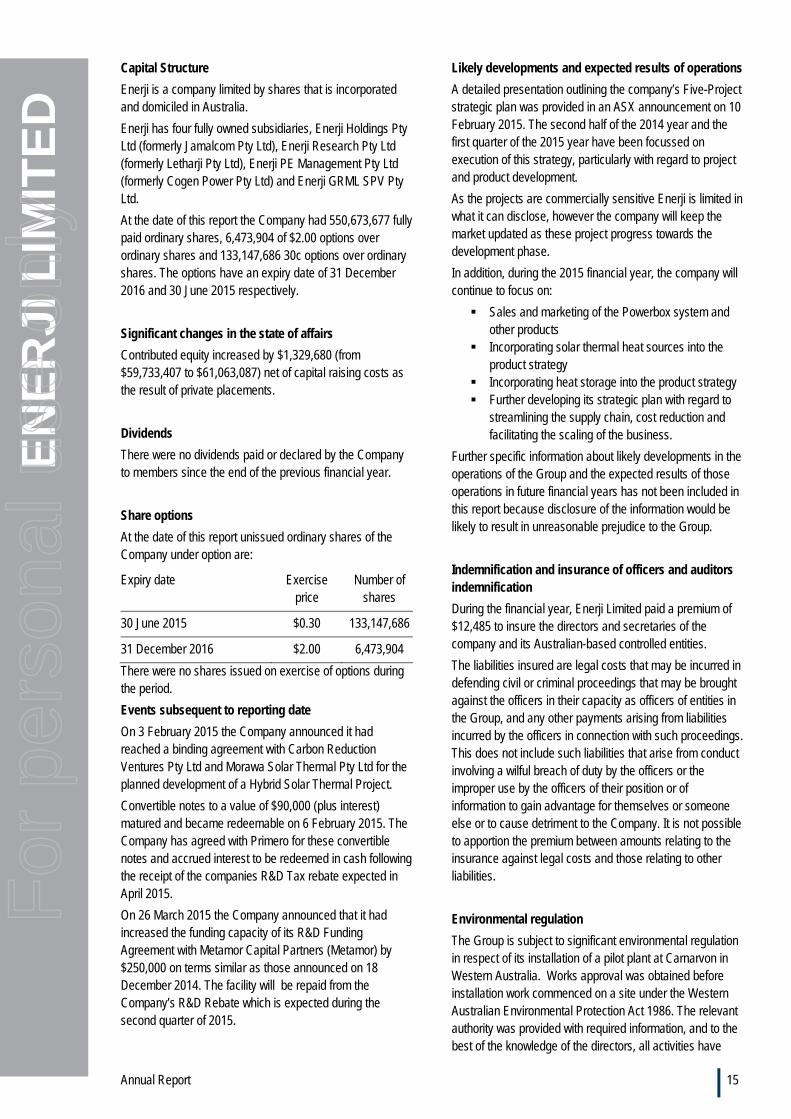
Capital Structure
Enerji is a company limited by shares that is incorporated and domiciled in Australia.
Enerji has four fully owned subsidiaries, Enerji Holdings Pty Ltd (formerly Jamalcom Pty Ltd), Enerji Research Pty Ltd (formerly Letharji Pty Ltd), Enerji PE Management Pty Ltd (formerly Cogen Power Pty Ltd) and Enerji GRML SPV Pty Ltd.
At the date of this report the Company had 550,673,677 fully paid ordinary shares, 6,473,904 of $2.00 options over ordinary shares and 133,147,686 30c options over ordinary shares. The options have an expiry date of 31 December 2016 and 30 June 2015 respectively.
Significant changes in the state of affairs
Contributed equity increased by $1,329,680 (from $59,733,407 to $61,063,087) net of capital raising costs as the result of private placements.
Dividends
There were no dividends paid or declared by the Company to members since the end of the previous financial year.
Share options
At the date of this report unissued ordinary shares of the Company under option are:
Expiry date Exercise price
Number of shares
30 June 2015 $0.30 133,147,686
31 December 2016 $2.00 6,473,904
There were no shares issued on exercise of options during the period.
Events subsequent to reporting date
On 3 February 2015 the Company announced it had reached a binding agreement with Carbon Reduction Ventures Pty Ltd and Morawa Solar Thermal Pty Ltd for the planned development of a Hybrid Solar Thermal Project.
Convertible notes to a value of $90,000 (plus interest) matured and became redeemable on 6 February 2015. The Company has agreed with Primero for these convertible notes and accrued interest to be redeemed in cash following the receipt of the companies R&D Tax rebate expected in April 2015.
On 26 March 2015 the Company announced that it had increased the funding capacity of its R&D Funding Agreement with Metamor Capital Partners (Metamor) by $250,000 on terms similar as those announced on 18 December 2014. The facility will be repaid from the Company’s R&D Rebate which is expected during the second quarter of 2015.
Likely developments and expected results of operations
A detailed presentation outlining the company’s Five-Project strategic plan was provided in an ASX announcement on 10 February 2015. The second half of the 2014 year and the first quarter of the 2015 year have been focussed on execution of this strategy, particularly with regard to project and product development.
As the projects are commercially sensitive Enerji is limited in what it can disclose, however the company will keep the market updated as these project progress towards the development phase.
In addition, during the 2015 financial year, the company will continue to focus on:
Sales and marketing of the Powerbox system and other products
Incorporating solar thermal heat sources into the product strategy
Incorporating heat storage into the product strategy Further developing its strategic plan with regard to
streamlining the supply chain, cost reduction and facilitating the scaling of the business.
Further specific information about likely developments in the operations of the Group and the expected results of those operations in future financial years has not been included in this report because disclosure of the information would be likely to result in unreasonable prejudice to the Group.
Indemnification and insurance of officers and auditors indemnification
During the financial year, Enerji Limited paid a premium of $12,485 to insure the directors and secretaries of the company and its Australian-based controlled entities.
The liabilities insured are legal costs that may be incurred in defending civil or criminal proceedings that may be brought against the officers in their capacity as officers of entities in the Group, and any other payments arising from liabilities incurred by the officers in connection with such proceedings. This does not include such liabilities that arise from conduct involving a wilful breach of duty by the officers or the improper use by the officers of their position or of information to gain advantage for themselves or someone else or to cause detriment to the Company. It is not possible to apportion the premium between amounts relating to the insurance against legal costs and those relating to other liabilities.
Environmental regulation
The Group is subject to significant environmental regulation in respect of its installation of a pilot plant at Carnarvon in Western Australia. Works approval was obtained before installation work commenced on a site under the Western Australian Environmental Protection Act 1986. The relevant authority was provided with required information, and to the best of the knowledge of the directors, all activities have
For
per
sona
l use
onl
y
Annual Report 16
EN
ER
JI L
IMIT
ED
been undertaken in compliance with the requirements of the works approvals in place.
Proceedings on behalf of the Company
No person has applied to the court under section 237 of the Corporations Act 2001 for leave to bring proceedings on behalf of the Company, or to intervene in any proceedings to which the Company is a party, for the purpose of taking responsibility on behalf of the Company for all or part of those proceedings.
No proceedings have been brought or intervened in on behalf of the Company with leave of the Court under section 237 of the Corporations Act 2001.
Non-audit services
There were no non-audit services provided by the auditors during the reporting period. The auditor’s remuneration is disclosed in Note 18 to the financial statements.
Auditor’s independence declaration
A copy of the auditor’s independence declaration as required under section 307C of the Corporations Act 2001 is set out on page 17.
This report is made in accordance with a resolution of directors.
Steven Formica
Director
Perth
30 March 2015
For
per
sona
l use
onl
y
Annual Report 17
38 Station StreetSubiaco, WA 6008PO Box 700 West Perth WA 6872Australia
Tel: +61 8 6382 4600Fax: +61 8 6382 4601www.bdo.com.au
DECLARATION OF INDEPENDENCE BY BRAD MCVEIGH TO THE DIRECTORS OF ENERJI LIMITED
As lead auditor of Enerji Limited for the year ended 31 December 2014, I declare that, to the best ofmy knowledge and belief, there have been:
1. No contraventions of the auditor independence requirements of the Corporations Act 2001 inrelation to the audit; and
2. No contraventions of any applicable code of professional conduct in relation to the audit.
This declaration is in respect of Enerji Limited and the entities it controlled during the period.
Brad McVeigh
Director
BDO Audit (WA) Pty Ltd
Perth, 30 March 2015
BDO Audit (WA) Pty Ltd ABN 79 112 284 787 is a member of a national association of independent entities which are all members of BDO Australia Ltd ABN 77 050 110 275,an Australian company limited by guarantee. BDO Audit (WA) Pty Ltd and BDO Australia Ltd are members of BDO International Ltd, a UK company limited by guarantee, andform part of the international BDO network of independent member firms. Liability limited by a scheme approved under Professional Standards Legislation other than forthe acts or omissions of financial services licensees
For
per
sona
l use
onl
y
Annual Report 18
EN
ER
JI L
IMIT
ED
For the year ended 31 December 2014
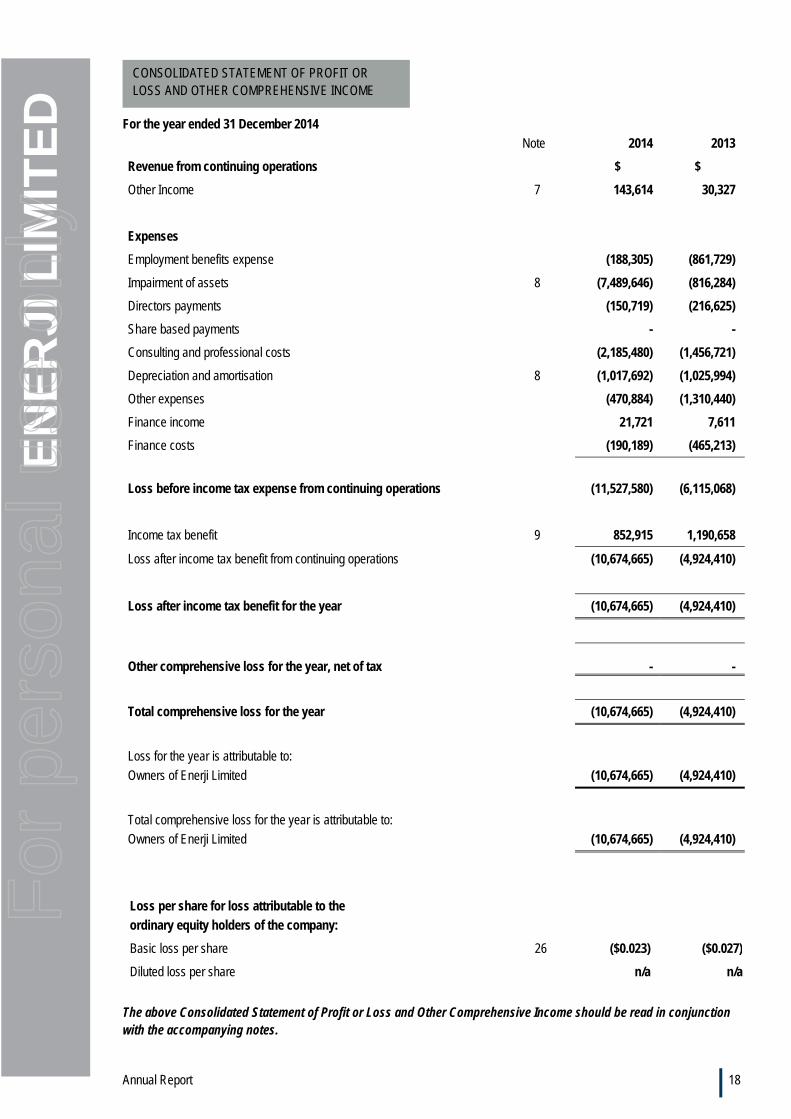
Note 2014 2013
Revenue from continuing operations $ $
Other Income 7 143,614 30,327
Expenses
Employment benefits expense (188,305) (861,729)
Impairment of assets 8 (7,489,646) (816,284)
Directors payments (150,719) (216,625)
Share based payments - -
Consulting and professional costs (2,185,480) (1,456,721)
Depreciation and amortisation 8 (1,017,692) (1,025,994)
Other expenses (470,884) (1,310,440)
Finance income 21,721 7,611
Finance costs (190,189) (465,213)
Loss before income tax expense from continuing operations
(11,527,580) (6,115,068)
Income tax benefit 9 852,915 1,190,658
Loss after income tax benefit from continuing operations (10,674,665) (4,924,410)
Loss after income tax benefit for the year (10,674,665) (4,924,410)
Other comprehensive loss for the year, net of tax
- -
Total comprehensive loss for the year (10,674,665) (4,924,410)
Loss for the year is attributable to:
Owners of Enerji Limited (10,674,665) (4,924,410)
Total comprehensive loss for the year is attributable to:
Owners of Enerji Limited
(10,674,665) (4,924,410)
The above Consolidated Statement of Profit or Loss and Other Comprehensive Income should be read in conjunction with the accompanying notes.
Loss per share for loss attributable to the
ordinary equity holders of the company:
Basic loss per share 26 ($0.023) ($0.027)
Diluted loss per share n/a n/a
CONSOLIDATED STATEMENT OF PROFIT OR LOSS AND OTHER COMPREHENSIVE INCOME
For
per
sona
l use
onl
y
Annual Report 19
EN
ER
JI L
IMIT
ED
As at 31 December 2014
Note 2014 2013
ASSETS
Current assets
$ $
Cash and cash equivalents 10 690,606 105,201
Prepayments and other receivables 11 17,714 119,131
Loans 11 321,916 319,320
Total current assets 1,030,236 543,652
Non-current assets
Prepayments and other receivables 11
- 5,674,089
Property, plant and equipment 12 31,267 3,744,614
Intangible assets 13 - 1,009,399
Total non-current assets 31,267 10,428,102
Total assets 1,061,503 10,971,754
LIABILITIES
Current Liabilities
Trade and other payables 14 4,219,620 4,543,060
Loans and borrowings 15 621,625 805,500
Provisions 16 - 39,014
Total current liabilities 4,841,245 5,387,574
Total liabilities 4,841,245 5,387,574
Net liabilities (3,779,742) 5,584,180
EQUITY
Contributed equity 17 (a) 61,063,087 59,733,407
Reserves 17 (b) 5,853,602 5,872,539
Accumulated losses (70,696,431) (60,021,766)
(3,779,742) 5,584,180
Total equity
(3,779,742) 5,584,180
The above Consolidated Statement of Financial Position should be read in conjunction with the accompanying notes.
CONSOLIDATED STATEMENT OF FINANCIAL POSITION
For
per
sona
l use
onl
y
Annual Report 20
EN
ER
JI L
IMIT
ED
The above Consolidated Statement of Changes in Equity should be read in conjunction with the accompanying notes.
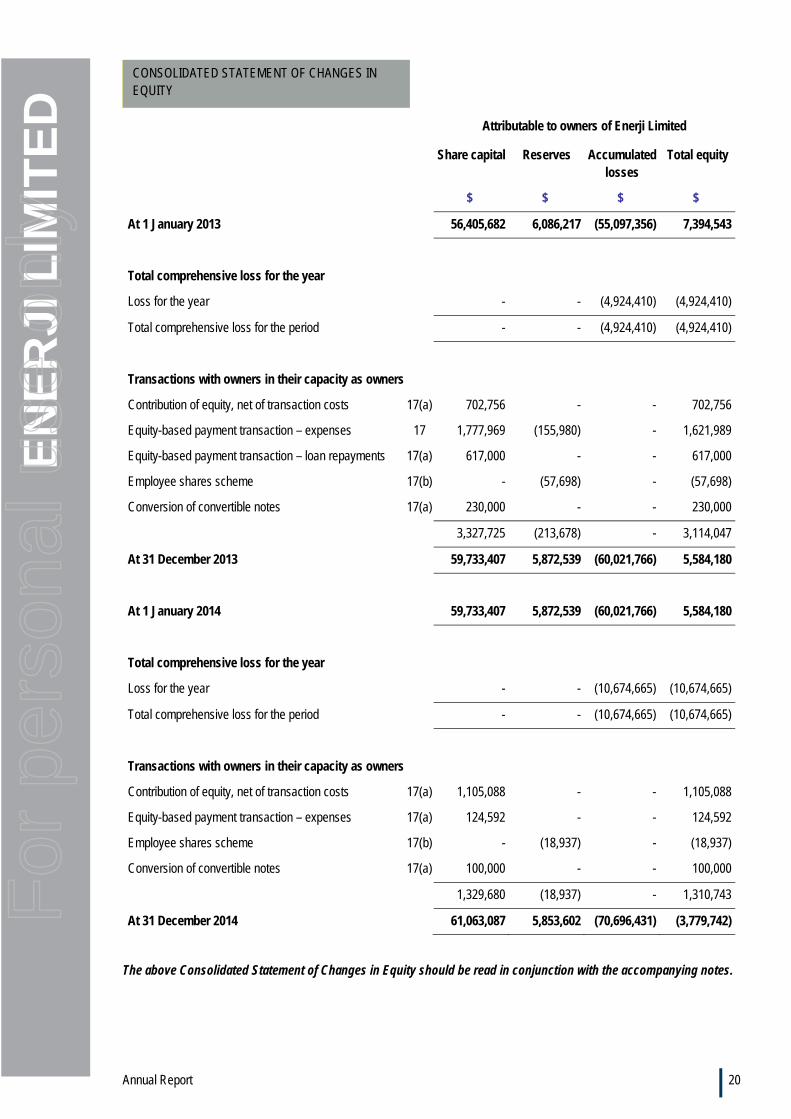
Attributable to owners of Enerji Limited
Share capital Reserves Accumulated losses
Total equity
$ $ $ $
At 1 January 2013 56,405,682 6,086,217 (55,097,356) 7,394,543
Total comprehensive loss for the year
Loss for the year - - (4,924,410) (4,924,410)
Total comprehensive loss for the period - - (4,924,410) (4,924,410)
Transactions with owners in their capacity as owners
Contribution of equity, net of transaction costs 17(a) 702,756 - - 702,756
Equity-based payment transaction – expenses 17 1,777,969 (155,980) - 1,621,989
Equity-based payment transaction – loan repayments 17(a) 617,000 - - 617,000
Employee shares scheme 17(b) - (57,698) - (57,698)
Conversion of convertible notes 17(a) 230,000 - - 230,000
3,327,725 (213,678) - 3,114,047
At 31 December 2013 59,733,407 5,872,539 (60,021,766) 5,584,180
At 1 January 2014 59,733,407 5,872,539 (60,021,766) 5,584,180
Total comprehensive loss for the year
Loss for the year - - (10,674,665) (10,674,665)
Total comprehensive loss for the period - - (10,674,665) (10,674,665)
Transactions with owners in their capacity as owners
Contribution of equity, net of transaction costs 17(a) 1,105,088 - - 1,105,088
Equity-based payment transaction – expenses 17(a) 124,592 - - 124,592
Employee shares scheme 17(b) - (18,937) - (18,937)
Conversion of convertible notes 17(a) 100,000 - - 100,000
1,329,680 (18,937) - 1,310,743
At 31 December 2014 61,063,087 5,853,602 (70,696,431) (3,779,742)
CONSOLIDATED STATEMENT OF CHANGES IN EQUITY
For
per
sona
l use
onl
y
Annual Report 21
EN
ER
JI L
IMIT
ED
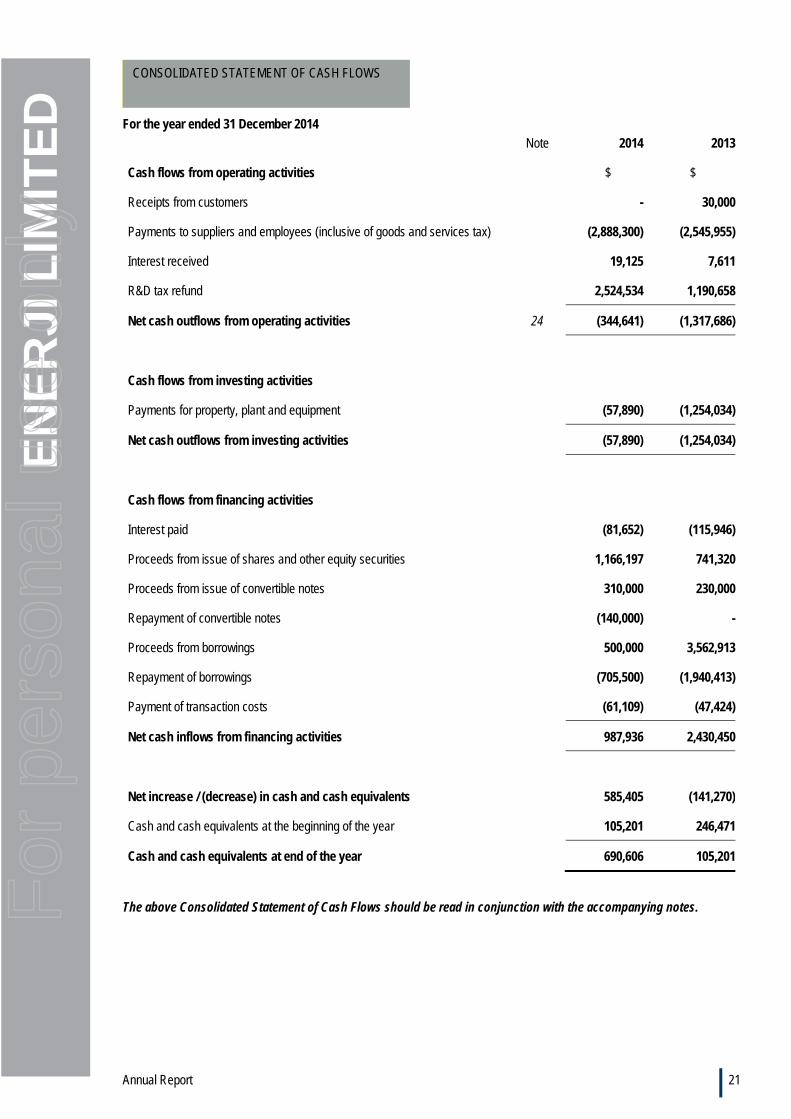
For the year ended 31 December 2014
Note 2014 2013
Cash flows from operating activities $ $
Receipts from customers - 30,000
Payments to suppliers and employees (inclusive of goods and services tax) (2,888,300) (2,545,955)
Interest received 19,125 7,611
R&D tax refund 2,524,534 1,190,658
Net cash outflows from operating activities 24 (344,641) (1,317,686)
Cash flows from investing activities
Payments for property, plant and equipment (57,890) (1,254,034)
Net cash outflows from investing activities (57,890) (1,254,034)
Cash flows from financing activities
Interest paid (81,652) (115,946)
Proceeds from issue of shares and other equity securities 1,166,197 741,320
Proceeds from issue of convertible notes 310,000 230,000
Repayment of convertible notes (140,000) -
Proceeds from borrowings 500,000 3,562,913
Repayment of borrowings (705,500) (1,940,413)
Payment of transaction costs (61,109) (47,424)
Net cash inflows from financing activities 987,936 2,430,450
Net increase / (decrease) in cash and cash equivalents 585,405 (141,270)
Cash and cash equivalents at the beginning of the year 105,201 246,471
Cash and cash equivalents at end of the year 690,606 105,201
The above Consolidated Statement of Cash Flows should be read in conjunction with the accompanying notes.
CONSOLIDATED STATEMENT OF CASH FLOWS
For
per
sona
l use
onl
y
Annual Report 22
EN
ER
JI L
IMIT
ED
31 December 2014
1 Reporting entity
Enerji Limited (the “Company”) is a company domiciled in Australia. The address of the Company’s registered office is Unit B9, 431 Roberts Rd Subiaco WA 6008. The consolidated financial statements of the Company as at and for the year ended 31 December 2014 comprise the Company and its subsidiaries (together referred to as the “Group” and individually as “Group entities”). The Group primarily is involved in the marketing of energy recovery and clean energy generation solutions.
2 Basis of preparation
(a) Statement of compliance
The financial statements are general purpose financial statements which have been prepared in accordance with Australian Accounting Standards (AASBs) (including Australian Interpretations) adopted by the Australian Accounting Standards Board (AASB) and the Corporations Act 2001. The consolidated financial statements of the Group comply with International Financial Reporting Standards (IFRSs) and interpretations adopted by the International Accounting Standards Board (IASB).
(b) Basis of measurement
The consolidated financial statements have been prepared on the historical cost basis.
(c) Functional and presentation currency
These consolidated financial statements are presented in Australian dollars, which is the functional currency of the Company and each of its subsidiaries.
(d) Critical accounting estimates and judgements
Estimates and judgments are continually evaluated and are based on historical experience and other factors, including expectations of future events that may have a financial impact on the entity and that are believed to be reasonable under the circumstances.
(e) Critical judgements in applying the entity’s accounting policies
a. In the 2014 financial statements, the Group made a significant judgement about the impairment of property, plant and equipment, namely the Carnarvon Power Station WHPS Project and prepayments related to the Opcon Powerboxes. While the Group has prospects for the use of these assets that will ultimately yield future cashflows if successful, the Group has followed the guidance of AASB 136 Impairment of Assets to determine when an asset is impaired. The determination requires detail judgement. In making this judgement, the Group evaluates, among other factors, the replacement value of the asset against the cost. The replacement value of the project is based on the cost to design, construct and install a similar project.
(f) Changes in accounting policies
No changes to the Group’s accounting policies for the year.
(g) Going concern
The financial statements have been prepared on the going concern basis, which contemplates the continuity of normal business activity and the realisation of assets and the settlement of liabilities in the normal course of business.
The Group incurred a comprehensive loss after tax for the year ended 31 December 2014 of $10,674,665 (2013: $4,924,410) and experienced net cash outflows from operating activities of $344,641 (2013: $1,317,686).
The Group has a net working capital deficiency of $3,811,009 at 31 December 2014, the largest items being $2,295,676 that relates to the supply of up to four future Opcon Powerboxes not yet received, and $449,886 as a component of services provided with agreed deferred terms (refer to Note 21 (c)).
In order to meet its current liabilities and continue to make instalments on further Powerboxes and complete new projects, the Group will be required to secure funding in the form of; debt such as project or equipment finance, receive project revenue, receive grants, or raise equity. Furthermore, the Group is registered to claim an R&D tax offset and receive a tax refund equivalent to the value of certain deductions available under the R&D tax incentive. The anticipated R&D tax offset refund entitlement for the current year is $1,300,000, which is expected to be received during the second quarter of 2015. The Group’s Management has held preliminary discussions with a number of Australian financial institutions specifically to be satisfied of the reasonableness of this approach. The Company provided technical data and independent valuation material to the financial institutions and the informal feedback from them is that the technology and the valuations are acceptable and that a funding application would be routinely considered once a project is advanced to the appropriate stage, i.e. revenue is contracted.
NOTES TO THE CONSOLIDATED FINANCIAL STATEMENTS
For
per
sona
l use
onl
y
Annual Report 23
EN
ER
JI L
IMIT
ED
In the event that the Group is not able to successfully secure funding in the form of either debt such as project or equipment finance, receive project revenue, receive grants, raise equity or receive the R&D tax offset refund entitlement as discussed above, there is material uncertainty that may cast significant doubt as to whether the Group will continue as a going concern, and therefore whether it will realise the assets and extinguish the liabilities in the normal course of business and at the amounts stated in the financial statements.
Having regard to the matters set out above the Directors believe that at the date of signing the financial statements, there are reasonable grounds to believe that the Group will be able to meet its obligations as and when they fall due.
3. Significant accounting policies
The accounting policies set out below have been applied consistently to all periods presented in these consolidated financial statements, and have been applied consistently by Group entities.
(a) Basis of consolidation
(i) Business combinations
The acquisition method of accounting is used to account for all business combinations, including business combinations involving entities or businesses under common control, regardless of whether equity instruments or other assets are acquired. The consideration transferred for the acquisition of a subsidiary comprises the fair values of the assets transferred, the liabilities incurred and the equity interests issued by the Group. The consideration transferred also includes the fair value of any contingent consideration arrangement and the fair value of any pre-existing equity interest in the subsidiary. Acquisition-related costs are expensed as incurred. Identifiable assets acquired and liabilities and contingent liabilities assumed in a business combination are, with limited exceptions, measured initially at their fair values at the acquisition date. On an acquisition-by-acquisition basis, the Group recognises any non-controlling interest in the acquiree, either at fair value or at the non-controlling interest’s proportionate share of the acquiree’s net identifiable assets.
The excess of the consideration transferred, the amount of any non-controlling interest in the acquiree and the acquisition-date fair value of any previous equity interest in the acquiree over the fair value of the Group’s share of the net identifiable assets acquired is recorded as goodwill. If those amounts are less than the fair value of the net identifiable assets of the subsidiary acquired and the measurement of all amounts has been reviewed, the difference is recognised directly in profit or loss as a bargain purchase.
Contingent liabilities
A contingent liability of the acquiree is assumed in a business combination only if such a liability represents a present obligation and arises from a past event, and its fair value can be measured reliably.
Transaction costs
Transaction costs that the Group incurs in connection with a business combination, such as finder’s fees, legal fees, due diligence fees, and other professional and consulting fees, are expensed as incurred.
(ii) Subsidiaries
Subsidiaries are entities controlled by the Group. The financial statements of subsidiaries are included in the consolidated financial statements from the date that control commences until the date that control ceases. The accounting policies of subsidiaries have been changed when necessary to align them with the policies adopted by the Group. In the Company’s financial statements, investments in subsidiaries are carried at cost.
(iii) Transactions eliminated on consolidation
Intra-group balances and transactions, and any unrealised income and expenses arising from intra-group transactions, are eliminated in preparing the consolidated financial statements.
(b) Foreign currency
(i) Foreign currency transactions
Transactions in foreign currencies are translated to the respective functional currencies of Group entities at exchange rates at the dates of the transactions. Monetary assets and liabilities denominated in foreign currencies at the reporting date are retranslated to the functional currency at the exchange rate at that date. Non-monetary assets and liabilities denominated in foreign currencies that are measured at fair value are retranslated to the functional currency at the exchange rate at the date that the fair value was determined.
(c) Financial instruments
(i) Non-derivative financial assets
For
per
sona
l use
onl
y
Annual Report 24
EN
ER
JI L
IMIT
ED
The Group initially recognises loans and receivables and deposits on the date that they are originated. All other financial assets (including assets designated at fair value through profit or loss) are recognised initially on the trade date at which the Group becomes a party to the contractual provisions of the instrument.
The Group derecognises a financial asset when the contractual rights to the cash flows from the asset expire, or it transfers the rights to receive the contractual cash flows on the financial asset in a transaction in which substantially all the risks and rewards of ownership of the financial asset are transferred. Any interest in transferred financial assets that is created or retained by the Group is recognised as a separate asset or liability.
Financial assets and liabilities are offset and the net amount presented in the statement of financial position when, and only when, the Group has a legal right to offset the amounts and intends either to settle on a net basis or to realise the asset and settle the liability simultaneously.
The Group has the following non-derivative financial assets.
Loans and receivables
Loans and receivables are financial assets with fixed or determinable payments that are not quoted in an active market. Such assets are recognised initially at fair value plus any directly attributable transaction costs. Subsequent to initial recognition loans and receivables are measured at amortised cost using the effective interest method, less any impairment losses. Loans and receivables comprise trade and other receivables.
(ii) Non-derivative financial liabilities
The Group recognises financial liabilities (including liabilities designated at fair value through profit or loss) initially on the trade date at which the Group becomes a party to the contractual provisions of the instrument. The Group derecognises a financial liability when its contractual obligations are discharged or cancelled or expire. Financial assets and liabilities are offset and the net amount presented in the statement of financial position when, and only when, the Group has a legal right to offset the amounts and intends either to settle on a net basis or to realise the asset and settle the liability simultaneously.
The Group has non-derivative financial liabilities comprising trade and other payables and loans, which are recognised initially at fair value and subsequently at amortised cost. Trade and other payables represent liabilities for goods and services provided to the Group prior to the end of the financial year that are unpaid and arise when the Group has an obligation to make future payments in respect of the purchase of these goods and services.
(d) Share capital
Ordinary shares
Ordinary shares are classified as equity. Incremental costs directly attributable to the issue of ordinary shares and share options are recognised as a deduction from equity, net of any tax effects.
(e) Cash and cash equivalents
Cash and cash equivalents in the statement of financial position comprise cash at bank and in hand and short-term deposits with an original maturity of three months or less that are readily convertible to known amounts of cash and which are subject to an insignificant risk of changes in value.
For the purposes of the statement of cash flows, cash and cash equivalents consist of cash and cash equivalents as defined above.
(f) Property, plant and equipment
(i) Recognition and measurement
Items of property, plant and equipment are measured at cost less accumulated depreciation and accumulated impairment losses.
Cost includes expenditure that is directly attributable to the acquisition of the asset. The cost of self-constructed assets includes the cost of materials and direct labour, any other costs directly attributable to bringing the assets to a working condition for their intended use, the costs of dismantling and removing the items and restoring the site on which they are located and capitalised borrowing costs. Cost also may include transfers from other comprehensive income of any gain or loss on qualifying cash flow hedges of foreign currency purchases of property, plant and equipment. Purchased software that is integral to the functionality of the related equipment is capitalised as part of that equipment.
When parts of an item of property, plant and equipment have different useful lives, they are accounted for as separate items (major components) of property, plant and equipment.
Gains and losses on disposal of an item of property, plant and equipment are determined by comparing the proceeds from disposal with the carrying amount of property, plant and equipment and are recognised net within other income in profit or loss.
For
per
sona
l use
onl
y
Annual Report 25
EN
ER
JI L
IMIT
ED
(ii) Subsequent costs
The cost of replacing a part of an item of property, plant and equipment is recognised in the carrying amount of the item if it is probable that the future economic benefits embodied within the part will flow to the Group, and its cost can be measured reliably. The carrying amount of the replaced part is derecognised. The costs of the day-to-day servicing of property, plant and equipment are recognised in profit or loss as incurred.
(iii) Depreciation
Depreciation is calculated over the depreciable amount, which is the cost of an asset, or other amount substituted for cost, less its residual value.
Depreciation is recognised in profit or loss on a straight-line basis over the estimated useful lives of each part of an item of property, plant and equipment, since this most closely reflects the expected pattern of consumption of the future economic benefits embodied in the asset.
The estimated useful lives for the current and comparative periods are as follows:
• Plant and equipment (Construction in progress assets and fittings and equipment) 5 years
• Computers (Office furniture, fittings and equipment) 4 years
• Fixtures and fittings (Construction in progress assets) 10 years
• Major components (Construction in progress assets) 10 - 15 years.
Depreciation methods, useful lives and residual values are reviewed at each financial year-end and adjusted if appropriate.
(g) Leases
Operating lease payments are recognised as an operating expense in the statement of profit or loss and other comprehensive income on a straight-line basis over the lease term.
(h) Intangible assets
(i) Goodwill
Goodwill is measured at cost less accumulated impairment losses.
(ii) Research and development
Expenditure on research activities, undertaken with the prospect of gaining new scientific or technical knowledge and understanding, is recognised in profit or loss as incurred.
Development activities involve a plan or design for the production of new or substantially improved products and processes. Development expenditure is capitalised only if development costs can be measured reliably, the product or process is technically and commercially feasible, future economic benefits are probable, and the Group intends to and has sufficient resources to complete development and to use or sell the asset. The expenditure capitalised includes the cost of materials, direct labour and overhead costs that are directly attributable to preparing the asset for its intended use, and capitalised borrowing costs. Other development expenditure is recognised in profit or loss as incurred.
Capitalised development expenditure is measured at cost less accumulated amortisation and accumulated impairment losses.
(iii) Amortisation
Amortisation is recognised in the profit and loss on a straight-line basis over the estimated useful lives of the intangible assets from the date they are available for use unless such lives are indefinite. Goodwill and intangible assets with an indefinite useful life are not amortised but are systematically tested for impairment annually. The estimated useful lives for the current and comparative periods are as follows:
Distribution Licence - 5 years
(iv) Distribution rights
Costs associated with the initial acquisition of Enerji Holdings Pty Ltd (formerly Jamalcom Pty Ltd), the holder of the distribution rights for Opcon Powerboxes in Australia were capitalised as intangible assets. The directors review the carrying value of the Distribution Rights to ensure the carrying value does not exceed their recoverable amount and if an impairment in value arises, the intangible asset is written down.
(i) Leased assets
Leases under the terms of which the Group assumes substantially all the risks and rewards of ownership are classified as finance leases. Upon initial recognition the leased asset is measured at an amount equal to the lower of its fair value and the
For
per
sona
l use
onl
y
Annual Report 26
EN
ER
JI L
IMIT
ED
present value of the minimum lease payments. Subsequent to initial recognition, the asset is accounted for in accordance with the accounting policy applicable to that asset.
Other leases are operating leases and are not recognised as assets in the Group’s statement of financial position.
(j) Impairment
(i) Financial assets (including receivables)
A financial asset not carried at fair value through profit or loss is assessed at each reporting date to determine whether there is objective evidence that it is impaired. A financial asset is impaired if objective evidence indicates that a loss event has occurred after the initial recognition of the asset, and that the loss event had a negative effect on the estimated future cash flows of that asset that can be estimated reliably.
Objective evidence that financial assets (including equity securities) are impaired can include default or delinquency by a debtor, restructuring of an amount due to the Group on terms that the Group would not consider otherwise, indications that a debtor or issuer will enter bankruptcy or the disappearance of an active market for a security. In addition, for an investment in an equity security, a significant or prolonged decline in its fair value below its cost is objective evidence of impairment.
The Group considers evidence of impairment for receivables at both a specific asset and collective level. All individually significant receivables are assessed for specific impairment. All individually significant receivables found not to be specifically impaired are then collectively assessed for any impairment that has been incurred but not yet identified.
In assessing collective impairment the Group uses historical trends of the probability of default, timing of recoveries and the amount of loss incurred, adjusted for management’s judgement as to whether current economic and credit conditions are such that the actual losses are likely to be greater or less than suggested by historical trends.
An impairment loss in respect of a financial asset measured at amortised cost is calculated as the difference between its carrying amount and the present value of the estimated future cash flows discounted at the asset’s original effective interest rate. Losses are recognised in profit or loss and reflected in an allowance account against receivables. Interest on the impaired asset continues to be recognised through the unwinding of the discount. When a subsequent event causes the amount of impairment loss to decrease, the decrease in impairment loss is reversed through profit or loss.
(ii) Non-financial assets
The carrying amounts of the Group’s non-financial assets, other than inventories and deferred tax assets, are reviewed at each reporting date to determine whether there is any indication of impairment. If any such indication exists, then the asset’s recoverable amount is estimated. For goodwill, and intangible assets that have indefinite useful lives or that are not yet available for use, the recoverable amount is estimated each year at the same time.
The recoverable amount of an asset or cash-generating unit is the greater of its value in use and its fair value less costs to sell. In assessing value in use, the estimated future cash flows are discounted to their present value using a pre-tax discount rate that reflects current market assessments of the time value of money and the risks specific to the asset. For the purpose of impairment testing, assets that cannot be tested individually are grouped together into the smallest group of assets that generates cash inflows from continuing use that are largely independent of the cash inflows of other assets or groups of assets (the “cash-generating unit”). Subject to an operating segment ceiling test, for the purposes of goodwill impairment testing, CGUs to which goodwill has been allocated are aggregated so that the level at which impairment is tested reflects the lowest level at which goodwill is monitored for internal reporting purposes. Goodwill acquired in a business combination is allocated to groups of CGUs that are expected to benefit from the synergies of the combination.
The Group’s corporate assets do not generate separate cash inflows. If there is an indication that a corporate asset may be impaired, then the recoverable amount is determined for the CGU to which the corporate asset belongs.
An impairment loss is recognised if the carrying amount of an asset or its CGU exceeds its estimated recoverable amount. Impairment losses are recognised in profit or loss. Impairment losses recognised in respect of CGUs are allocated first to reduce the carrying amount of any goodwill allocated to the units, and then to reduce the carrying amounts of the other assets in the unit (group of units) on a pro rata basis.
An impairment loss in respect of goodwill is not reversed. In respect of other assets, impairment losses recognised in prior periods are assessed at each reporting date for any indications that the loss has decreased or no longer exists. An impairment loss is reversed if there has been a change in the estimates used to determine the recoverable amount. An impairment loss is reversed only to the extent that the asset’s carrying amount does not exceed the carrying amount that would have been determined, net of depreciation or amortisation, if no impairment loss had been recognised.
For
per
sona
l use
onl
y
Annual Report 27
EN
ER
JI L
IMIT
ED
(k) Employee benefits
(i) Short-term obligations
Liabilities for wages and salaries, including non-monetary benefits and accumulating sick leave that are expected to be settled wholly within 12 months after the end of the period in which the employees render the related service are recognised in respect of employees’ services up to the end of the reporting period and are measured at the amounts expected to be paid when the liabilities are settled. The liabilities are presented as current employee benefit obligations in the balance sheet. (ii) Other long-term employee benefit obligations
The liabilities for long service leave and annual leave are not expected to be settled wholly within 12 months after the end of the period in which the employees render the related service. They are therefore measured as the present value of expected future payments to be made in respect of services provided by employees up to the end of the reporting period using the projected unit credit method. Consideration is given to expected future wage and salary levels, experience of employee departures and periods of service. Expected future payments are discounted using market yields at the end of the reporting period of government bonds with terms and currencies that match, as closely as possible, the estimated future cash outflows. Remeasurements as a result of experience adjustments and changes in actuarial assumptions are recognised in profit or loss. The obligations are presented as current liabilities in the balance sheet if the entity does not have an unconditional right to defer settlement for at least twelve months after the reporting period, regardless of when the actual settlement is expected to occur.
(iii) Termination benefits
Termination benefits are recognised as an expense when the Group is demonstrably committed, without realistic possibility of withdrawal, to a formal detailed plan to either terminate employment before the normal retirement date, or to provide termination benefits as a result of an offer made to encourage voluntary redundancy. Termination benefits for voluntary redundancies are recognised as an expense if the Group has made an offer of voluntary redundancy, it is probable that the offer will be accepted, and the number of acceptances can be estimated reliably. If benefits are payable more than 12 months after the reporting period, then they are discounted to their present value.
(iv) Share-based payment transactions
The grant date fair value of share-based payment awards granted to employees is recognised as an employee expense, with a corresponding increase in equity.
Share-based payment arrangements in which the Group receives goods or services as consideration for its own equity instruments are accounted for as equity-settled share-based payment transactions, regardless of how the equity instruments are obtained by the Group.
(l) Provisions
A provision is recognised if, as a result of a past event, the Group has a present legal or constructive obligation the amount of which at can be estimated reliably, and it is probable that an outflow of economic benefits will be required to settle the obligation. Provisions are determined by discounting the expected future cash flows at a pre-tax rate that reflects current market assessments of the time value of money and the risks specific to the liability. The unwinding of the discount is recognised as finance cost.
(m) Finance income and finance costs
Finance income comprises interest income on funds invested. Interest income is recognised as it accrues in profit or loss, using the effective interest method.
Finance costs comprise interest expense on borrowings and convertible notes, unwinding of the discount on provisions, and impairment losses recognised on financial assets. Borrowing costs that are not directly attributable to the acquisition, construction or production of a qualifying asset are recognised in profit or loss using the effective interest method.
Foreign currency gains and losses are reported on a net basis.
(n) Income tax
Income tax expense comprises current and deferred tax. Current and deferred tax are recognised in profit or loss except to the extent that it relates to a business combination, or items recognised directly in equity or in other comprehensive income.
Current tax is the expected tax payable or receivable on the taxable income or loss for the year, using tax rates enacted or substantively enacted at the reporting date, and any adjustment to tax payable in respect of previous years.
For
per
sona
l use
onl
y
Annual Report 28
EN
ER
JI L
IMIT
ED
Deferred tax is recognised in respect of temporary differences between the carrying amounts of assets and liabilities for financial reporting purposes and the amounts used for taxation purposes. Deferred tax is not recognised for the following temporary differences: the initial recognition of assets or liabilities in a transaction that is not a business combination and that affects neither accounting nor taxable profit or loss, and differences relating to investments in subsidiaries and associates and jointly controlled entities to the extent that it is probable that they will not reverse in the foreseeable future. In addition, deferred tax is not recognised for taxable temporary differences arising on the initial recognition of goodwill. Deferred tax is measured at the tax rates that are expected to be applied to temporary differences when they reverse, based on the laws that have been enacted or substantively enacted by the reporting date. Deferred tax assets and liabilities are offset if there is a legally enforceable right to offset current tax liabilities and assets, and they relate to income taxes levied by the same tax authority on the same taxable entity, or on different tax entities, but they intend to settle current tax liabilities and assets on a net basis or their tax assets and liabilities will be realised simultaneously.
A deferred tax asset is recognised for unused tax losses, tax credits and deductible temporary differences, to the extent that it is probable that future taxable profits will be available against which they can be utilised. Deferred tax assets are reviewed at each reporting date and are reduced to the extent that it is no longer probable that the related tax benefit will be realised.
Additional income tax expenses that arise from the distribution of cash dividends are recognised at the same time that the liability to pay the related dividend is recognised. The Group does not distribute non-cash assets as dividends to its shareholders.
As per Note 9, the R&D tax offset refund in recognised in the Consolidated statement of profit or loss and other comprehensive income in the period it is received.
(o) Goods and services tax
Revenue, expenses and assets are recognised net of the amount of goods and services tax (GST), except where the amount of GST incurred is not recoverable from the taxation authority. In these circumstances, the GST is recognised as part of the cost of acquisition of the asset or as part of the expense.
Receivables and payables are stated with the amount of GST included. The net amount of GST recoverable from, or payable to, the ATO is included as a current asset or liability in the statement of financial position.
Cash flows are included in the statement of cash flows on a gross basis. The GST components of cash flows arising from investing and financing activities which are recoverable from, or payable to, the ATO are classified as operating cash flows.
(p) Earnings per share
The Group presents basic and diluted earnings per share (EPS) data for its ordinary shares. Basic EPS is calculated by dividing the profit or loss attributable to ordinary shareholders of the Company by the weighted average number of ordinary shares outstanding during the period. Diluted EPS is determined by adjusting the profit or loss attributable to ordinary shareholders and the weighted average number of ordinary shares outstanding adjusted for the effects of all dilutive potential ordinary shares, which comprise convertible notes and share options granted to employees.
(q) Segment reporting
The Group determines and presents operating segments based on the information that internally is provided to the Chief Development Officer, who is the Group’s chief operating decision maker.
An operating segment is a component of the Group that engages in business activities from which it may earn revenues and incur expenses, including revenues and expenses that relate to transactions with any of the Group’s other components.
The Group is organised into one operating segment. These operating segments are based on the internal reports that are reviewed and used by the Board of Directors in assessing performance and in determining the allocation of resources.
(r) Revenue recognition Revenue is measured at the fair value of the consideration received or receivable. Amounts disclosed as revenue are net of returns, trade allowances, rebates and amounts collected on behalf of third parties.
The group recognises revenue when the amount of revenue can be reliably measured, it is probable that future economic benefits will flow to the entity and specific criteria have been met for each of the group’s activities. The group bases its estimates on historical results, taking into consideration the type of customer, the type of transaction and the specifics of each arrangement.
Revenue recognition for interest income is explained in Note 3 (m) .
(s) New and amended standards adopted by the Group
New Standards and amendments to standards that are mandatory for the first time for the financial year beginning 1 January 2014 have not affected the amounts recognised in the current period or any prior period and are not likely to affect future periods.
For
per
sona
l use
onl
y
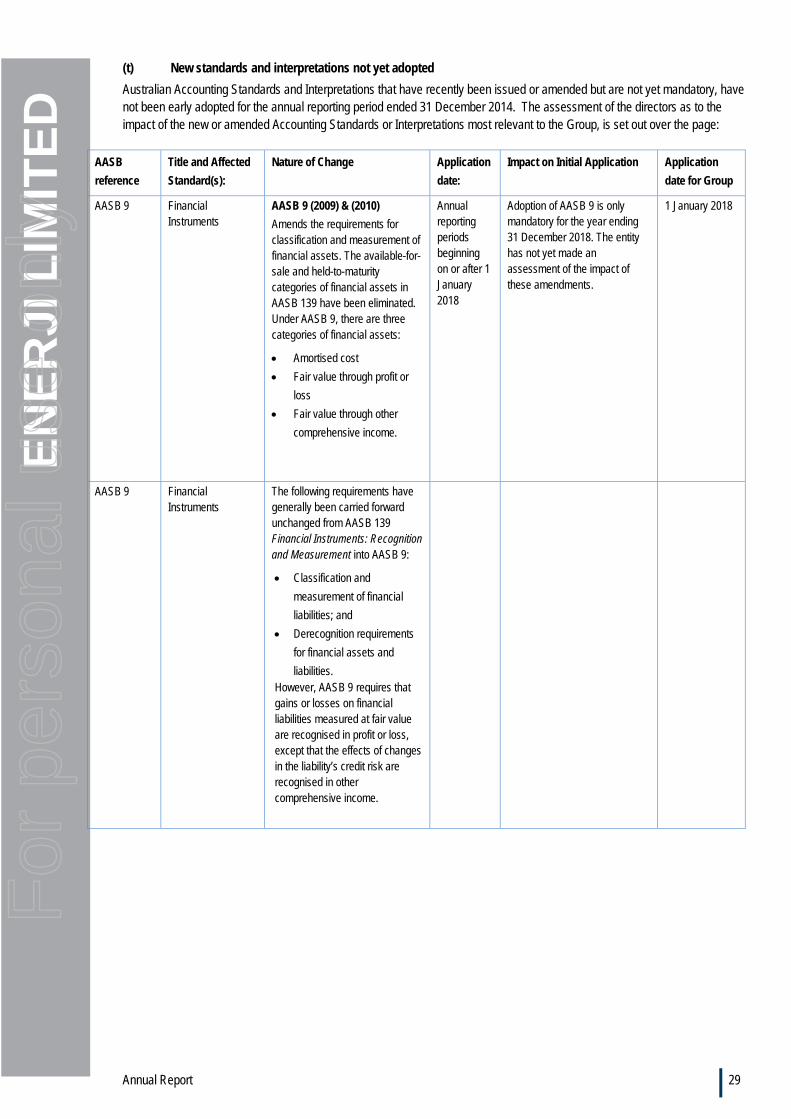
Annual Report 29
EN
ER
JI L
IMIT
ED
(t) New standards and interpretations not yet adopted
Australian Accounting Standards and Interpretations that have recently been issued or amended but are not yet mandatory, have not been early adopted for the annual reporting period ended 31 December 2014. The assessment of the directors as to the impact of the new or amended Accounting Standards or Interpretations most relevant to the Group, is set out over the page:
AASB
reference
Title and Affected
Standard(s):
Nature of Change Application
date:
Impact on Initial Application Application
date for Group
AASB 9 Financial Instruments
AASB 9 (2009) & (2010)
Amends the requirements for classification and measurement of financial assets. The available-for-sale and held-to-maturity categories of financial assets in AASB 139 have been eliminated. Under AASB 9, there are three categories of financial assets:
Amortised cost
Fair value through profit or
loss
Fair value through other
comprehensive income.
Annual reporting periods beginning on or after 1 January 2018
Adoption of AASB 9 is only mandatory for the year ending 31 December 2018. The entity has not yet made an assessment of the impact of these amendments.
1 January 2018
AASB 9 Financial Instruments
The following requirements have generally been carried forward unchanged from AASB 139 Financial Instruments: Recognition and Measurement into AASB 9:
Classification and
measurement of financial
liabilities; and
Derecognition requirements
for financial assets and
liabilities. However, AASB 9 requires that gains or losses on financial liabilities measured at fair value are recognised in profit or loss, except that the effects of changes in the liability’s credit risk are recognised in other comprehensive income.
For
per
sona
l use
onl
y
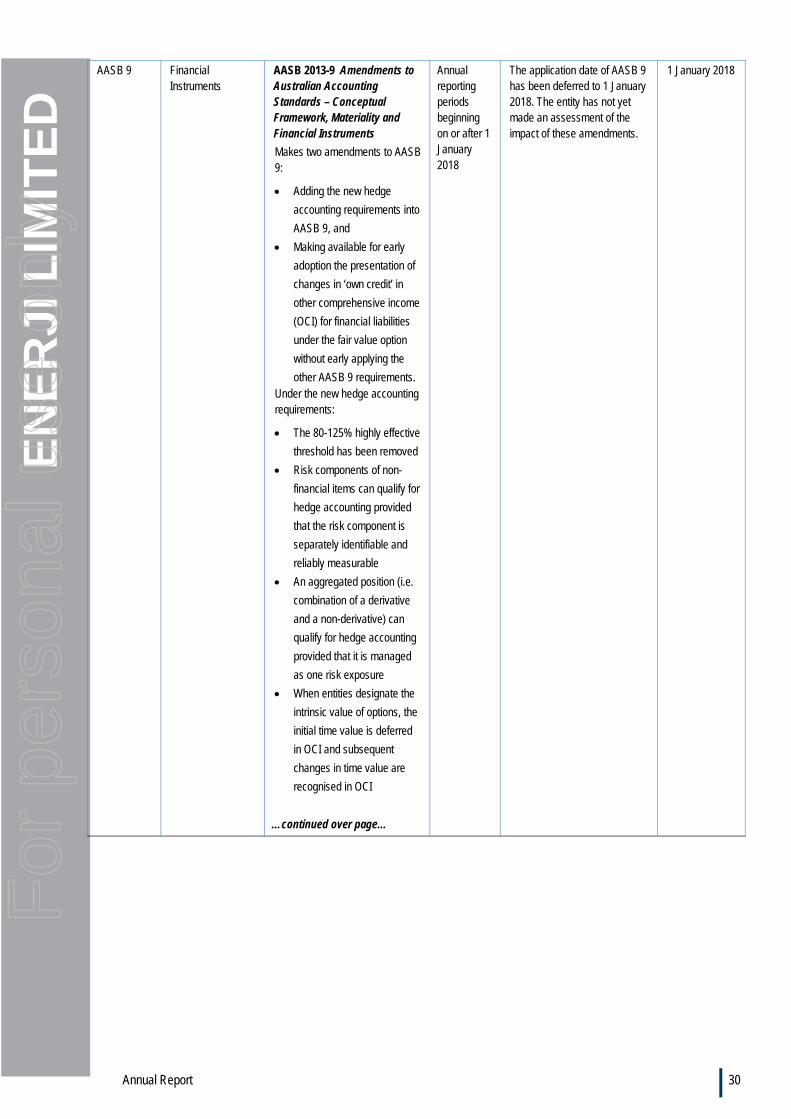
Annual Report 30
EN
ER
JI L
IMIT
ED
AASB 9 Financial Instruments
AASB 2013-9 Amendments to Australian Accounting Standards – Conceptual Framework, Materiality and Financial Instruments
Makes two amendments to AASB 9:
Adding the new hedge
accounting requirements into
AASB 9, and
Making available for early
adoption the presentation of
changes in ‘own credit’ in
other comprehensive income
(OCI) for financial liabilities
under the fair value option
without early applying the
other AASB 9 requirements. Under the new hedge accounting requirements:
The 80-125% highly effective
threshold has been removed
Risk components of non-
financial items can qualify for
hedge accounting provided
that the risk component is
separately identifiable and
reliably measurable
An aggregated position (i.e.
combination of a derivative
and a non-derivative) can
qualify for hedge accounting
provided that it is managed
as one risk exposure
When entities designate the
intrinsic value of options, the
initial time value is deferred
in OCI and subsequent
changes in time value are
recognised in OCI
…continued over page…
Annual reporting periods beginning on or after 1 January 2018
The application date of AASB 9 has been deferred to 1 January 2018. The entity has not yet made an assessment of the impact of these amendments.
1 January 2018 F
or p
erso
nal u
se o
nly
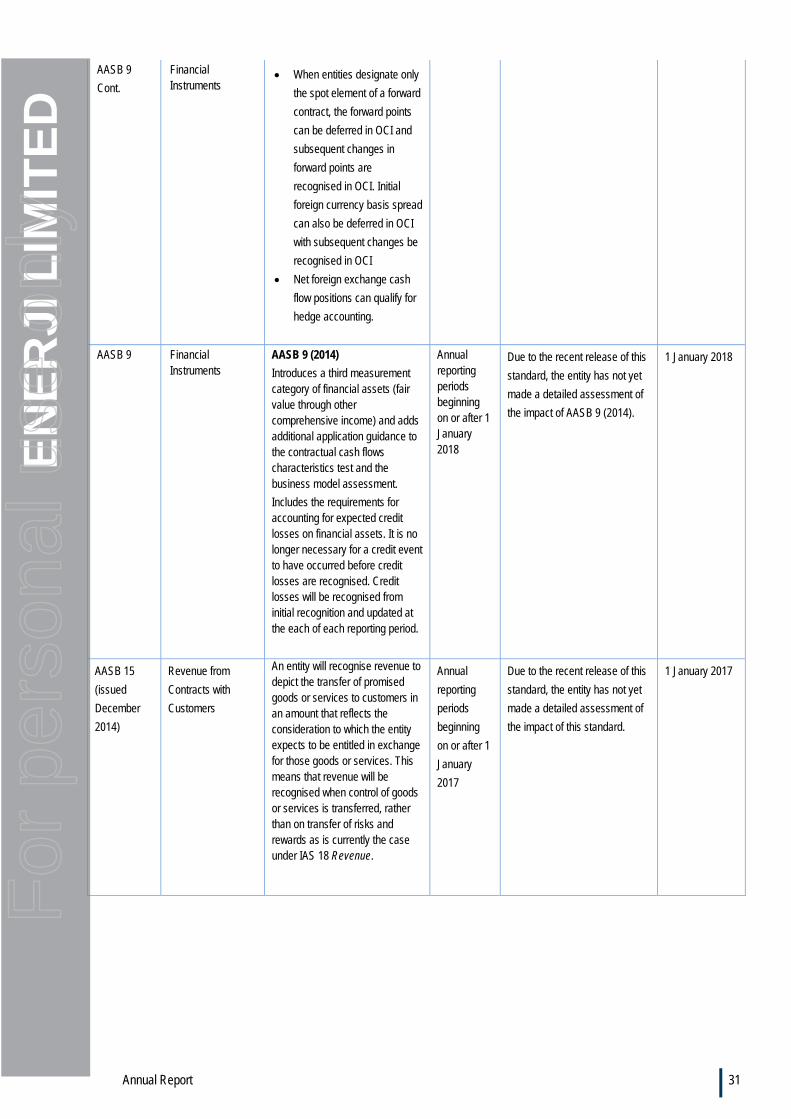
Annual Report 31
EN
ER
JI L
IMIT
ED
AASB 9
Cont.
Financial Instruments
When entities designate only
the spot element of a forward
contract, the forward points
can be deferred in OCI and
subsequent changes in
forward points are
recognised in OCI. Initial
foreign currency basis spread
can also be deferred in OCI
with subsequent changes be
recognised in OCI
Net foreign exchange cash
flow positions can qualify for
hedge accounting.
AASB 9 Financial Instruments
AASB 9 (2014)
Introduces a third measurement category of financial assets (fair value through other comprehensive income) and adds additional application guidance to the contractual cash flows characteristics test and the business model assessment.
Includes the requirements for accounting for expected credit losses on financial assets. It is no longer necessary for a credit event to have occurred before credit losses are recognised. Credit losses will be recognised from initial recognition and updated at the each of each reporting period.
Annual reporting periods beginning on or after 1 January 2018
Due to the recent release of this
standard, the entity has not yet
made a detailed assessment of
the impact of AASB 9 (2014).
1 January 2018
AASB 15
(issued
December
2014)
Revenue from
Contracts with
Customers
An entity will recognise revenue to depict the transfer of promised goods or services to customers in an amount that reflects the consideration to which the entity expects to be entitled in exchange for those goods or services. This means that revenue will be recognised when control of goods or services is transferred, rather than on transfer of risks and rewards as is currently the case under IAS 18 Revenue.
Annual
reporting
periods
beginning
on or after 1
January
2017
Due to the recent release of this
standard, the entity has not yet
made a detailed assessment of
the impact of this standard.
1 January 2017
For
per
sona
l use
onl
y
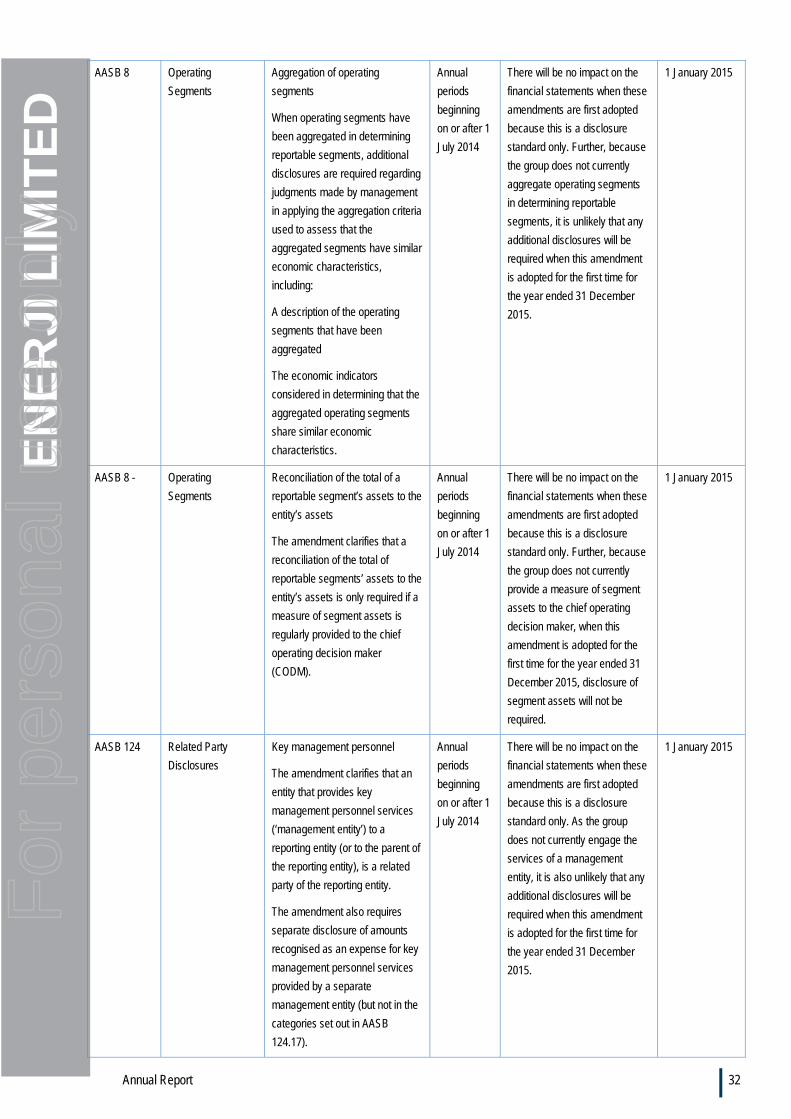
Annual Report 32
EN
ER
JI L
IMIT
ED
AASB 8 Operating
Segments
Aggregation of operating
segments
When operating segments have
been aggregated in determining
reportable segments, additional
disclosures are required regarding
judgments made by management
in applying the aggregation criteria
used to assess that the
aggregated segments have similar
economic characteristics,
including:
A description of the operating
segments that have been
aggregated
The economic indicators
considered in determining that the
aggregated operating segments
share similar economic
characteristics.
Annual
periods
beginning
on or after 1
July 2014
There will be no impact on the
financial statements when these
amendments are first adopted
because this is a disclosure
standard only. Further, because
the group does not currently
aggregate operating segments
in determining reportable
segments, it is unlikely that any
additional disclosures will be
required when this amendment
is adopted for the first time for
the year ended 31 December
2015.
1 January 2015
AASB 8 - Operating
Segments
Reconciliation of the total of a
reportable segment’s assets to the
entity’s assets
The amendment clarifies that a
reconciliation of the total of
reportable segments’ assets to the
entity’s assets is only required if a
measure of segment assets is
regularly provided to the chief
operating decision maker
(CODM).
Annual
periods
beginning
on or after 1
July 2014
There will be no impact on the
financial statements when these
amendments are first adopted
because this is a disclosure
standard only. Further, because
the group does not currently
provide a measure of segment
assets to the chief operating
decision maker, when this
amendment is adopted for the
first time for the year ended 31
December 2015, disclosure of
segment assets will not be
required.
1 January 2015
AASB 124 Related Party
Disclosures
Key management personnel
The amendment clarifies that an
entity that provides key
management personnel services
(‘management entity’) to a
reporting entity (or to the parent of
the reporting entity), is a related
party of the reporting entity.
The amendment also requires
separate disclosure of amounts
recognised as an expense for key
management personnel services
provided by a separate
management entity (but not in the
categories set out in AASB
124.17).
Annual
periods
beginning
on or after 1
July 2014
There will be no impact on the
financial statements when these
amendments are first adopted
because this is a disclosure
standard only. As the group
does not currently engage the
services of a management
entity, it is also unlikely that any
additional disclosures will be
required when this amendment
is adopted for the first time for
the year ended 31 December
2015.
1 January 2015
For
per
sona
l use
onl
y
Annual Report 33
EN
ER
JI L
IMIT
ED
4. Determination of fair values
A number of the Group’s accounting policies and disclosures require the determination of fair value, for financial assets and liabilities. Fair values have been determined for measurement and / or disclosure purposes based on the following methods. When applicable, further information about the assumptions made in determining fair values is disclosed in the notes specific to that asset or liability.
(i) Share-based payment transactions
The fair value of options issued as share-based payment are measured using an appropriate pricing model. Measurement inputs include share price on measurement date, exercise price of the instrument, expected volatility (based on weighted average historic volatility adjusted for changes expected due to publicly available information), weighted average expected life of the instruments (based on historical experience and general option holder behaviour), expected dividends, and the risk-free interest rate (based on government bonds).
The fair value of shares issued as share-based payment is measured based on the share price on the date of issue.
5. Financial risk management
The Board of Directors has overall responsibility for the establishment and oversight of the risk management framework. The executive directors are responsible for developing and monitoring risk management policies and report regularly to the Board of Directors on their activities. Details of credit risk, liquidity risk, currency risk, interest rate risk and capital management are disclosed in Note 28 to the financial statements.
6 Segment information
Operating segments are reported in a manner consistent with the internal reporting provided to the chief operating decision maker. The chief operating decision maker, who is responsible for allocating resources and assessing performance of the operating segments, has been identified as the Chief Development Officer. The Group has determined that it has one operating segment.
7 Other income
2014 2013
Settlement of convertible notes 143,308 -
Realised foreign exchange gain (net) 306 327
Other income - 30,000
143,614 30,327
8 Expenses
Loss before income tax includes the following specific expenses:
Depreciation 2014 2013
Plant and equipment 8,293 16,590
Total depreciation 8,293 16,590
Amortisation
Distribution rights 1,009,399 1,009,404
Total amortisation expense 1,009,399 1,009,404
Total depreciation and amortisation 1,017,692 1,025,994
Impairment of assets
Prepayments 5,422,978 -
Plant and equipment 2,066,668 816,284
Total impairment 7,489,646 816,284
On review of the future value of pilot plant at Carnarvon Power Station it was determined to write-down the asset value to its estimated recoverable amount. (Refer Note 12).
Loss on disposal of assets (24,657) -
Settlement of receivables (43,761) -
Rental expenses relating to operating leases 95,286 22,074
Defined contribution superannuation expense 25,508 81,645
For
per
sona
l use
onl
y
Annual Report 34
EN
ER
JI L
IMIT
ED
9 Income tax benefit
(a) Income tax benefit
Deferred tax credit arising from temporary differences 2014 2013
Write-back of tax effect on tax treatment of impairment (1,671,619) -
Receipt of a R&D tax rebate 2,524,534 1,190,658
Total income tax benefit 852,915 1,190,658
Attributable to:
Continuing operations 852,915 1,190,658
852,915 1,190,658
Under the R&D tax incentive legislation, small companies can claim an R&D tax offset, under section 355-100 of the Income Tax Assessment Act 1997 (ITAA97), that is, a refundable tax offset, equivalent to the value of certain deductions available under the R&D tax incentive. For the 2013 year, total eligible R&D expenditure was $5,610,077 (2012: $2,645,907) therefore R&D tax offset refund entitlement received in 2014 @ 45% was $2,524,534 (2013: $1,190,658).
(b) Numerical reconciliation of income tax expense to prima facie tax payable
2014 2013
Loss from continuing operations before income tax expense 11,527,580 6,115,068
Tax at the Australian tax rate of 30% (2013 – 30%) 3,458,274 1,834,520
Tax effect of amounts which are not deductible (taxable) in calculating taxable income:
R&D tax rebate (2,524,534) (1,190,658)
Write-back of tax effect on tax treatment of impairment 1,671,619 -
Non-deductible expenses 15,588 3,820
Deferred tax assets not brought to account (1,768,032) (1,838,340)
Income tax benefit 852,915 1,190,658
The franking account balance at year end was $nil (2013: $nil).
Net deferred tax assets have not been brought to account as it is not probable within the immediate future that tax profits will be available against which deductible temporary differences and tax losses can be utilised.
(c) Tax losses
Unused tax losses for which no deferred tax asset has been recognised 16,818,703 15,050,671
Potential tax benefit @ 30% 5,045,611 4,515,201
All unused tax losses were incurred by Australian entities.
Unrecognised deferred tax balances will only be available subject to continuing to meet the relevant statutory tests.
10 Current assets – Cash and cash equivalents
2014 2013
Cash at bank and in hand 590,606 5,201
Restricted cash – bank guarantee 100,000 100,000
690,606 105,201
The bank guarantee will be release on satisfaction of the underlying contract.
For
per
sona
l use
onl
y
Annual Report 35
EN
ER
JI L
IMIT
ED
11 Current assets - Prepayments and other receivables
Current 2014 2013
Other receivables 17,714 119,131
Loan to related party (refer note 21) 321,916 319,320
339,630 438,451
Non-current
Prepayments – Opcon Powerboxes - 5,491,767
Capitalised borrowing costs - 19,128
Other receivables - 163,194
- 5,674,089
Fair value and credit risk
The fair value of securities held for certain trade receivables is insignificant as it is the fair value of any collateral sold or re-pledged. Refer to note 28 for more information on the risk management policy of the Group and the credit quality of the entity’s trade receivables.
Impaired receivables and receivables past due
None of the current receivables are impaired.
Loan to related party
Refer to Note 21 for further details.
Prepayments to Opcon
Prepayments in 2013 comprised deposits and other amounts paid to Opcon AB with respect to orders for Powerboxes. During the year to 31 December 2014, no further prepayments have been made to Opcon AB (December 2013: $nil) for 3rd Generation Powerboxes ordered. At 31 December 2014 the directors have recorded an impairment of this prepayment value in accordance with accounting standards due to the uncertainty of future revenue. The Group still has valid claims to the 3rd Generation Powerboxes in construction that these prepayments were made for.
12 Non-current assets - Property, plant and equipment
Construction in progress
Office furniture,
fittings and equipment
Total
Year ended 31 December 2013
Opening net book amount 3,692,052 74,109 3,766,161
Additions 808,377 2,950 811,327
Impairment charge (816,284) - (816,284)
Depreciation charge - (16,590) (16,590)
Net book amount at 31 December 2013 3,684,145 60,469 3,744,614
At 31 December 2013
Cost or fair value 6,422,429 135,150 6,557,579
Accumulated depreciation - (74,681) (74,681)
Impairment of assets (2,738,284) - (2,738,284)
Net book amount 3,684,145 60,469 3,744,614
For
per
sona
l use
onl
y
Annual Report 36
EN
ER
JI L
IMIT
ED
Year ended 31 December 2014
Opening net book amount 3,684,145 60,469 3,744,614
Additions 54,142 3,748 57,890
Disposals - (24,657) (24,657)
Impairment charge (3,738,287) - (3,738,287)
Depreciation charge - (8,293) (8,293)
Net book amount at 31 December 2014 - 31,267 31,267
At 31 December 2014
Cost or fair value 6,476,571 96,734 6,573,305
Accumulated depreciation - (65,467) (65,467)
Impairment of assets (6,476,571) - (6,476,571)
Net book amount - 31,267 31,267
At the end of 2013 a review was undertaken of the fair value of the Carnarvon project. The result of this review was to impair the carrying value down to the replacement value of the project, resulting in an impairment amount of $816,284 and a carrying value of $3,684,145 at 31 December 2013.
The 2013 R&D rebate received in 2014 of $2,524,534 included an R&D deduction of $1,671,619 related to the write off of value of assets employed in the R&D activity. Under accounting standard AASB 120 the Group has recorded the R&D rebate received that is related to this deduction as an impairment in the asset value.
At 31 December 2014 the directors undertook a further review of the carrying value of the Carnarvon project. In accordance with Accounting Standard AASB 136 the Group has provided for a further impairment $2,066,668 reducing the carrying value to nil.
13 Non-current assets - Intangible assets
Distribution rights
Year ended 31 December 2013
Opening net book amount 2,018,803
Amortisation charge (1,009,404)
Closing net book amount 1,009,399
At 31 December 2013
Cost 8,340,284
Impairment of asset - 2010 (3,340,284)
Accumulated amortisation and impairment (3,990,601)
Net book amount 1,009,399
Year ended 31 December 2014
Opening net book amount 1,009,399
Amortisation charge (1,009,399)
Closing net book amount -
At 31 December 2014
Cost 8,340,284
Impairment of asset - 2010 (3,340,284)
Accumulated amortisation and impairment (5,000,000)
Net book amount -
Intangible assets comprise distribution rights associated with the purchase of Enerji Holdings Pty Ltd (formerly Jamalcom Pty Ltd) with a carrying value of NIL.
For
per
sona
l use
onl
y
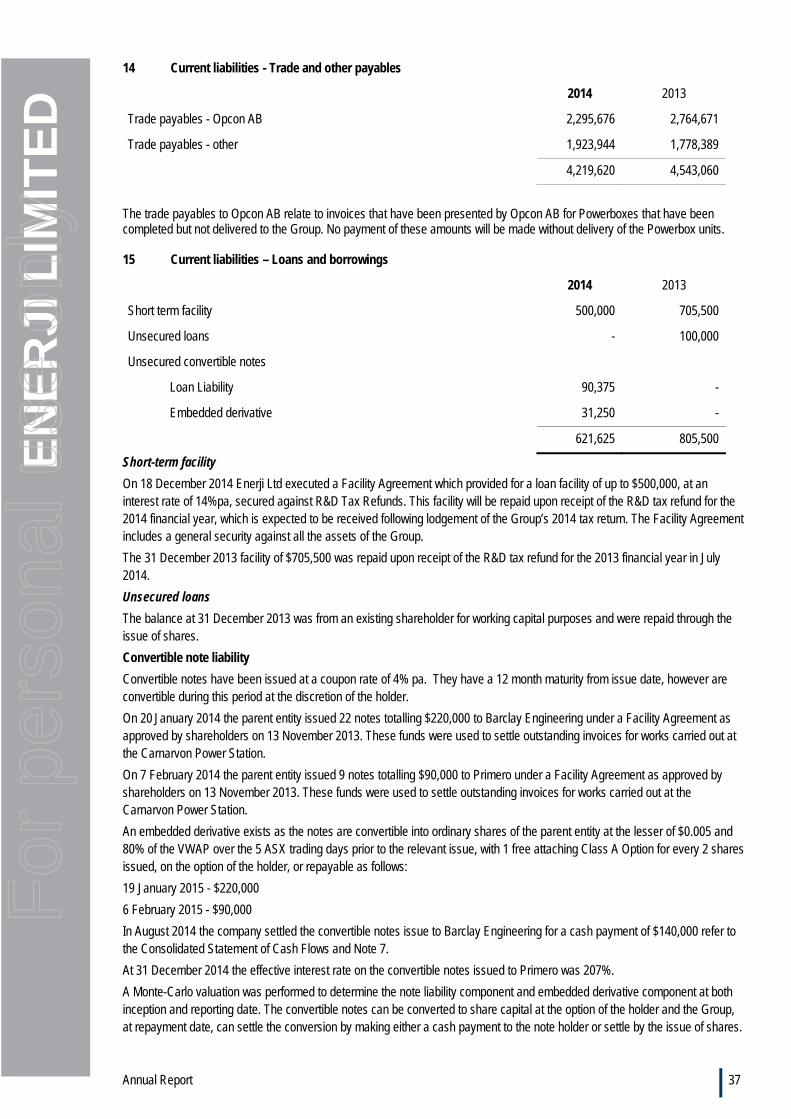
Annual Report 37
EN
ER
JI L
IMIT
ED
14 Current liabilities - Trade and other payables
2014 2013
Trade payables - Opcon AB 2,295,676 2,764,671
Trade payables - other 1,923,944 1,778,389
4,219,620 4,543,060
The trade payables to Opcon AB relate to invoices that have been presented by Opcon AB for Powerboxes that have been completed but not delivered to the Group. No payment of these amounts will be made without delivery of the Powerbox units. 15 Current liabilities – Loans and borrowings
2014 2013
Short term facility 500,000 705,500
Unsecured loans - 100,000
Unsecured convertible notes
Loan Liability 90,375 -
Embedded derivative 31,250 -
621,625 805,500
Short-term facility
On 18 December 2014 Enerji Ltd executed a Facility Agreement which provided for a loan facility of up to $500,000, at an interest rate of 14%pa, secured against R&D Tax Refunds. This facility will be repaid upon receipt of the R&D tax refund for the 2014 financial year, which is expected to be received following lodgement of the Group’s 2014 tax return. The Facility Agreement includes a general security against all the assets of the Group.
The 31 December 2013 facility of $705,500 was repaid upon receipt of the R&D tax refund for the 2013 financial year in July 2014.
Unsecured loans
The balance at 31 December 2013 was from an existing shareholder for working capital purposes and were repaid through the issue of shares.
Convertible note liability
Convertible notes have been issued at a coupon rate of 4% pa. They have a 12 month maturity from issue date, however are convertible during this period at the discretion of the holder.
On 20 January 2014 the parent entity issued 22 notes totalling $220,000 to Barclay Engineering under a Facility Agreement as approved by shareholders on 13 November 2013. These funds were used to settle outstanding invoices for works carried out at the Carnarvon Power Station.
On 7 February 2014 the parent entity issued 9 notes totalling $90,000 to Primero under a Facility Agreement as approved by shareholders on 13 November 2013. These funds were used to settle outstanding invoices for works carried out at the Carnarvon Power Station.
An embedded derivative exists as the notes are convertible into ordinary shares of the parent entity at the lesser of $0.005 and 80% of the VWAP over the 5 ASX trading days prior to the relevant issue, with 1 free attaching Class A Option for every 2 shares issued, on the option of the holder, or repayable as follows:
19 January 2015 - $220,000
6 February 2015 - $90,000
In August 2014 the company settled the convertible notes issue to Barclay Engineering for a cash payment of $140,000 refer to the Consolidated Statement of Cash Flows and Note 7.
At 31 December 2014 the effective interest rate on the convertible notes issued to Primero was 207%.
A Monte-Carlo valuation was performed to determine the note liability component and embedded derivative component at both inception and reporting date. The convertible notes can be converted to share capital at the option of the holder and the Group, at repayment date, can settle the conversion by making either a cash payment to the note holder or settle by the issue of shares.
For
per
sona
l use
onl
y
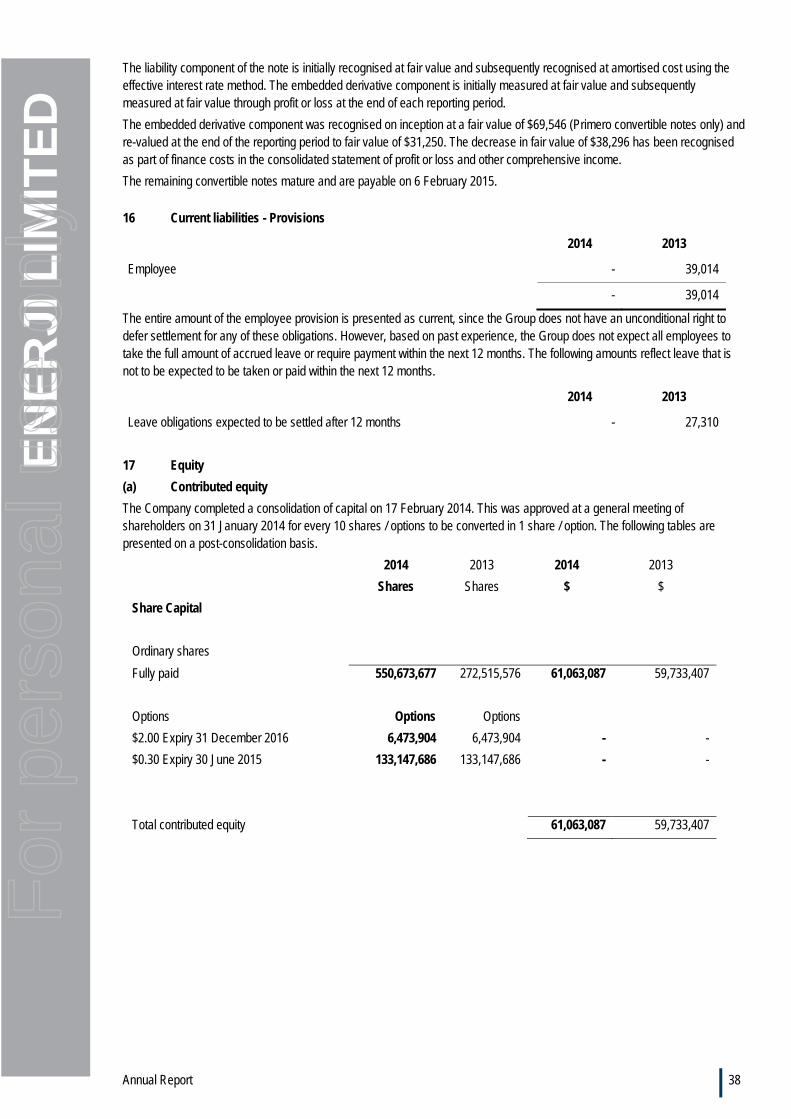
Annual Report 38
EN
ER
JI L
IMIT
ED
The liability component of the note is initially recognised at fair value and subsequently recognised at amortised cost using the effective interest rate method. The embedded derivative component is initially measured at fair value and subsequently measured at fair value through profit or loss at the end of each reporting period.
The embedded derivative component was recognised on inception at a fair value of $69,546 (Primero convertible notes only) and re-valued at the end of the reporting period to fair value of $31,250. The decrease in fair value of $38,296 has been recognised as part of finance costs in the consolidated statement of profit or loss and other comprehensive income.
The remaining convertible notes mature and are payable on 6 February 2015.
16 Current liabilities - Provisions
2014 2013
Employee - 39,014
- 39,014
The entire amount of the employee provision is presented as current, since the Group does not have an unconditional right to defer settlement for any of these obligations. However, based on past experience, the Group does not expect all employees to take the full amount of accrued leave or require payment within the next 12 months. The following amounts reflect leave that is not to be expected to be taken or paid within the next 12 months.
2014 2013
Leave obligations expected to be settled after 12 months - 27,310
17 Equity
(a) Contributed equity
The Company completed a consolidation of capital on 17 February 2014. This was approved at a general meeting of shareholders on 31 January 2014 for every 10 shares / options to be converted in 1 share / option. The following tables are presented on a post-consolidation basis.
2014 2013 2014 2013
Shares Shares $ $
Share Capital
Ordinary shares
Fully paid 550,673,677 272,515,576 61,063,087 59,733,407
Options Options Options
$2.00 Expiry 31 December 2016 6,473,904 6,473,904 - -
$0.30 Expiry 30 June 2015 133,147,686 133,147,686 - -
Total contributed equity 61,063,087 59,733,407
For
per
sona
l use
onl
y
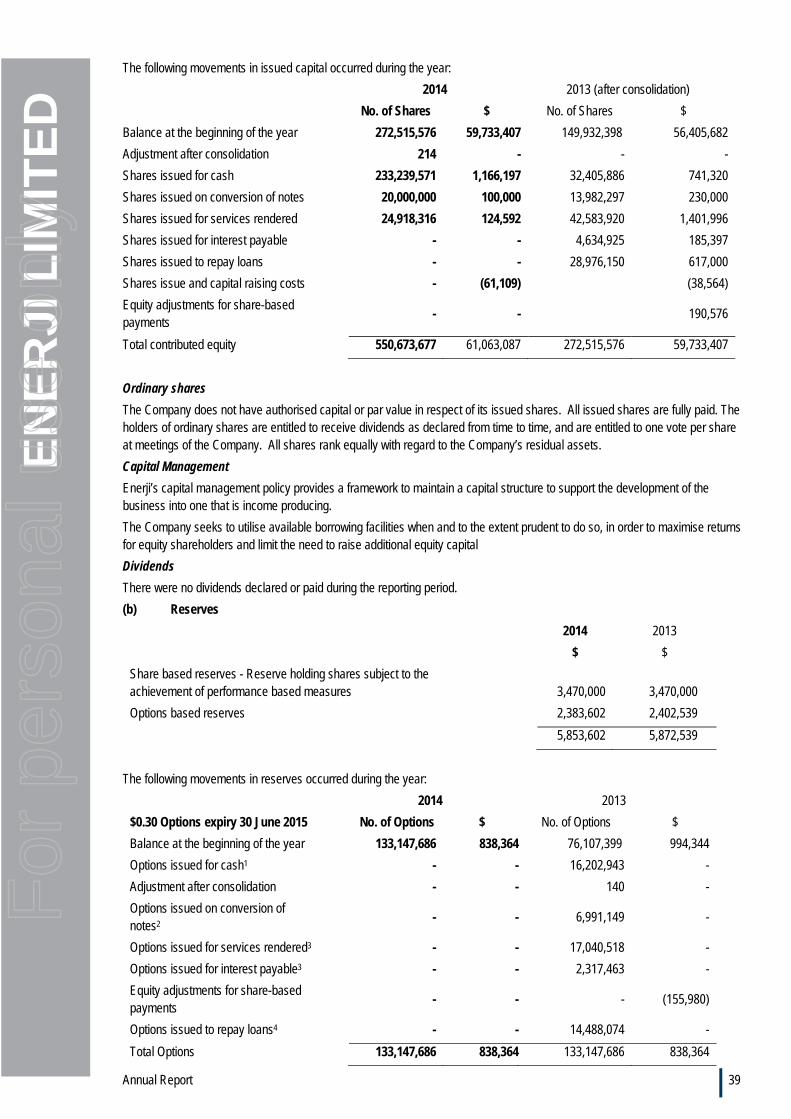
Annual Report 39
EN
ER
JI L
IMIT
ED
The following movements in issued capital occurred during the year:
2014 2013 (after consolidation)
No. of Shares $ No. of Shares $
Balance at the beginning of the year 272,515,576 59,733,407 149,932,398 56,405,682
Adjustment after consolidation 214 - - -
Shares issued for cash 233,239,571 1,166,197 32,405,886 741,320
Shares issued on conversion of notes 20,000,000 100,000 13,982,297 230,000
Shares issued for services rendered 24,918,316 124,592 42,583,920 1,401,996
Shares issued for interest payable - - 4,634,925 185,397
Shares issued to repay loans - - 28,976,150 617,000
Shares issue and capital raising costs - (61,109) (38,564)
Equity adjustments for share-based payments
- - 190,576
Total contributed equity 550,673,677 61,063,087 272,515,576 59,733,407
Ordinary shares
The Company does not have authorised capital or par value in respect of its issued shares. All issued shares are fully paid. The holders of ordinary shares are entitled to receive dividends as declared from time to time, and are entitled to one vote per share at meetings of the Company. All shares rank equally with regard to the Company’s residual assets.
Capital Management
Enerji’s capital management policy provides a framework to maintain a capital structure to support the development of the business into one that is income producing.
The Company seeks to utilise available borrowing facilities when and to the extent prudent to do so, in order to maximise returns for equity shareholders and limit the need to raise additional equity capital
Dividends
There were no dividends declared or paid during the reporting period.
(b) Reserves
2014 2013
$ $
Share based reserves - Reserve holding shares subject to the achievement of performance based measures
3,470,000 3,470,000
Options based reserves 2,383,602 2,402,539
5,853,602 5,872,539
The following movements in reserves occurred during the year:
2014 2013
$0.30 Options expiry 30 June 2015 No. of Options $ No. of Options $
Balance at the beginning of the year 133,147,686 838,364 76,107,399 994,344
Options issued for cash1 - - 16,202,943 -
Adjustment after consolidation - - 140 -
Options issued on conversion of notes2
- - 6,991,149 -
Options issued for services rendered3 - - 17,040,518 -
Options issued for interest payable3 - - 2,317,463 -
Equity adjustments for share-based payments
- - - (155,980)
Options issued to repay loans4 - - 14,488,074 -
Total Options 133,147,686 838,364 133,147,686 838,364
For
per
sona
l use
onl
y
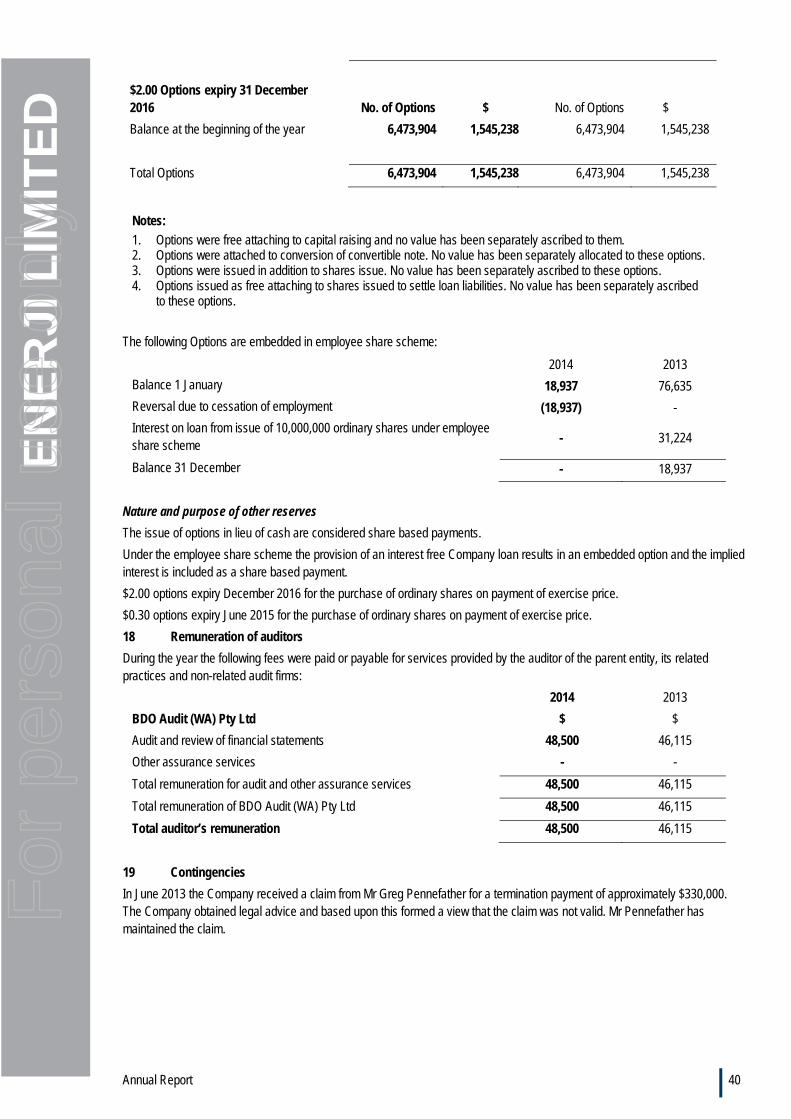
Annual Report 40
EN
ER
JI L
IMIT
ED
$2.00 Options expiry 31 December 2016
No. of Options $ No. of Options $
Balance at the beginning of the year 6,473,904 1,545,238 6,473,904 1,545,238
Total Options 6,473,904 1,545,238 6,473,904 1,545,238
Notes:
1. Options were free attaching to capital raising and no value has been separately ascribed to them. 2. Options were attached to conversion of convertible note. No value has been separately allocated to these options. 3. Options were issued in addition to shares issue. No value has been separately ascribed to these options. 4. Options issued as free attaching to shares issued to settle loan liabilities. No value has been separately ascribed
to these options.
The following Options are embedded in employee share scheme:
2014 2013
Balance 1 January 18,937 76,635
Reversal due to cessation of employment (18,937) -
Interest on loan from issue of 10,000,000 ordinary shares under employee share scheme - 31,224
Balance 31 December - 18,937
Nature and purpose of other reserves
The issue of options in lieu of cash are considered share based payments.
Under the employee share scheme the provision of an interest free Company loan results in an embedded option and the implied interest is included as a share based payment.
$2.00 options expiry December 2016 for the purchase of ordinary shares on payment of exercise price.
$0.30 options expiry June 2015 for the purchase of ordinary shares on payment of exercise price.
18 Remuneration of auditors
During the year the following fees were paid or payable for services provided by the auditor of the parent entity, its related practices and non-related audit firms:
2014 2013
BDO Audit (WA) Pty Ltd $ $
Audit and review of financial statements 48,500 46,115
Other assurance services - -
Total remuneration for audit and other assurance services 48,500 46,115
Total remuneration of BDO Audit (WA) Pty Ltd 48,500 46,115
Total auditor’s remuneration 48,500 46,115
19 Contingencies
In June 2013 the Company received a claim from Mr Greg Pennefather for a termination payment of approximately $330,000. The Company obtained legal advice and based upon this formed a view that the claim was not valid. Mr Pennefather has maintained the claim.
For
per
sona
l use
onl
y
Annual Report 41
EN
ER
JI L
IMIT
ED
20 Commitments
(a) Lease commitments
During the period the Group moved from its premises in West Perth to North Fremantle. The North Fremantle premises are leased under a standard commercial / industrial property lease with a 12 month term which commenced on 19 May 2014. The previous lease was assumed by another lease. Commitments for minimum lease payments in relation to non-cancellable operating leases are payable as follows:
2014 2013
$ $
Within one year 10,000 148,488
Later than one year but not later than five years - 148,488
10,000 296,976
(b) Opcon Energy Systems AB
Pursuant to the Australian distribution agreement with Opcon Energy System AB there is no minimum commitment to purchase Opcon Powerboxes. At present there are six Opcon Powerboxes on order, with outstanding payments on these of AU$2,295,676.
(c) Bank Guarantees
Pursuant to the power purchase agreement with Horizon Power a bank guarantee is required resulting in $100,000 being deposited with ANZ.
21 Related party transactions
(a) Key management personnel compensation
2014 2013
Short-term employee benefits 881,297 707,297
Post-employment benefits 4,183 34,835
Share based payments - 15,231
885,480 757,363
Detailed remuneration disclosures are provided in the remuneration report on pages 6 to 14.
(b) Transactions with other related parties
Mr Peter Avery receives fees of $10,000 per month for the provision of Investor Relations services. The total amount paid to Mr Avery for these services in the period is $80,000.
Mr Avery provided underwriting services during the year and received a $25,000 underwriting fee paid in shares.
(c) Loans to related parties
Mr Colin Stonehouse is engaged by the Company through his engineering company Ames Associates Pty Ltd. From 3 June 2013 to 1 September 2014 these services were provided under the 2013 Services Agreement with Mr Stonehouse functioning as an executive director. The 2013 Services Agreement also described the provision of loan funds during 2013. At the 13 November 2013 General Meeting of the Company the shareholders approved the payment of outstanding fees and loan funds with equity, and provided for an additional issue of shares to Mr Stonehouse (or nominee) in the same amount as the payment of outstanding fees and loan funds, to be funded with a twelve month loan (Share Purchase Loan) to purchase the equivalent securities. The Share Purchase Loan is shown in Note 11 as a Loan to related party. From 1 September 2014 the 2013 Services Agreement came to an end and was replaced with the 2014 Ames Agreement under which Mr Stonehouse provides personal management services as Chief Development Officer and also professional engineering service assignments from time to time as directed by the Company. The 2014 Ames Agreement has a fee payment structure which includes payments for fees with a discount, un-deferred fees and deferred fees. Invoices issued pursuant to the 2014 Ames Agreement include $222,727 related to Mr Stonehouse personal management services and $799,032 for all other professional engineering service assignments. The professional engineering services invoices had an un-deferred component of $349,146 and a deferred component of $449,886. The deferred component of any invoice is directly related to a nominated project milestone and the timing of the payment is within 5 days of the project milestone occurring. The Share Purchase Loan had a maturity date of 13 November 2014 and is currently being renegotiated. The terms of the new agreement are yet to be finalised however they are expected to be on a commercial and an arms-length basis.
For
per
sona
l use
onl
y
Annual Report 42
EN
ER
JI L
IMIT
ED
22 Subsidiaries and transactions with non-controlling interests
Significant investments in subsidiaries during the year ended 31 December 2014 are set out below:
Name of entity Country of
incorporation Class of shares
Equity holding
2014 2013
% %
Enerji Holdings Pty Ltd (formerly Jamalcom Pty Ltd) Australia Ordinary 100 100
Enerji Research Pty Ltd (formerly Letharji Pty Ltd) Australia Ordinary 100 100
Enerji PE Management Pty Ltd (formerly Cogen Power Pty Ltd) Australia Ordinary 100 100
Enerji GMRL SPV Pty Ltd Australia Ordinary 100 100
23 Events occurring after the reporting period
On 3 February 2015 the Company announced it had reached a binding agreement with Carbon Reduction Ventures Pty Ltd and Morawa Solar Thermal Pty Ltd for the planned development of a Hybrid Solar Thermal Project.
Convertible notes to a value of $90,000 (plus interest) matured and became redeemable on 6 February 2015. The Company has agreed with Primero for these convertible notes and accrued interest to be redeemed following the receipt of the companies R&D Tax rebate expected in April 2015.
On 26 March 2015 the Company announced that it had increased the funding capacity of its R&D Funding Agreement with Metamor Capital Partners (Metamor) by $250,000 on terms similar as those announced on 18 December 2014. The facility will be repaid from the Company’s R&D Rebate which is expected during the second quarter of 2015.
There are no other events occurring after the reporting period that need to be disclosed.
24 Reconciliation of loss after income tax to net cash inflow from operating activities
2014 2013
$ $
Loss for the period (10,674,665) (4,924,410)
Finance expense / (income) 138,932 -
Depreciation and amortisation 1,017,692 1,025,994
Asset impairment 3,738,287 816,284
Unrealised foreign exchange losses - 420,314
Loss on disposal of assets 24,657
Share-based payment transactions - 1,587,393
Change in other receivables 98,821 (34,203)
Change in prepayments 5,674,089 (319,320)
Change in trade and other payables (323,440) 1,366,590
Change in employee provision (39,014) (65,670)
R&D Tax concession offset - (1,190,658)
Net cash outflow from operating activities (344,641) (1,317,686)
25 Non-cash investing and financing activities
2014 2013
$ $
Acquisition of plant and equipment by means of equity issue - 613,432
Repayment of loans by means of equity issue 100,000 617,000
For
per
sona
l use
onl
y
Annual Report 43
EN
ER
JI L
IMIT
ED
26 Earnings per share
2014 2013
Basic loss per share $ $
From continuing operations attributable to the ordinary equity holders of the Company (0.023) (0.027)
Total basic loss per share (0.023) (0.027)
The calculation of basic loss per share for the year ended 31 December 2014 is based on the loss attributable to ordinary shareholders of $10,674,665 (2013: $4,924,410) and a weighted number of ordinary shares outstanding of 473,619,877 (2013: 182,261,865 after consolidation refer to Note 17 (a)).
There are no instruments on issue that are considered dilutive for calculating dilutive earnings per share.
27 Share-based payments
(a) Employee share scheme
A scheme under which shares may be issued by the Company to employees with an interest free loan for the purchase price of the shares was approved by shareholders at a general meeting on 1 December 2009.
Under the scheme, no invitations to participate in the plan were given in the year ended 31 December 2014.
(b) Expenses arising from share-based payment transactions
Total expenses arising from share-based payment transactions recognised during the period as part of employee benefit expense were as follows:
2014 2013
$ $
Expense payments - -
Effective put option included in employee share scheme - (57,698)
- (57,698)
28 Financial instruments
Financial risk management policies
The Group financial instruments consist mainly of deposits with banks, accounts receivables and payable and domestic loans.
The Board of Directors analyse financial risk exposure at Board Meetings to evaluate treasury management strategies in the context of the most recent economic conditions and forecasts.
The Board’s overall risk management strategy seeks to assist the Group in meeting its financial targets, whilst minimizing potential adverse effects on financial performance.
Credit risk
Credit risk is the risk of financial loss to the Group if a customer or other counterparty to a financial instrument fails to discharge their obligations.
The carrying amount of the Group’s financial assets represents the maximum credit exposure. The Group’s maximum exposure to credit risk at the reporting date was:
Carrying amount
Note 2014 2013
Loans and receivables – current 11 339,630 438,451
Loans and receivables – non current - 163,194
Cash and cash equivalents 10 690,606 105,201
1,030,236 706,846
The Group manages credit risk through dealing with creditworthy counterparties and balances are monitored on an ongoing basis.
Group sensitivity
Based on the financial instruments held at 31 December 2014, had the Australian dollar weakened/strengthened by 5% against the SEK with all other variables held constant, the Group’s post-tax loss for the year would have been $10,565,745/$10,783,585.
For
per
sona
l use
onl
y
Annual Report 44
EN
ER
JI L
IMIT
ED
Liquidity risk
The Group has limited exposure to liquidity risk as the Group’s main liabilities are trade and other payables.
All financial liabilities have contractual maturities of less than 6 months.
The Group manages liquidity risk by monitoring forecast cash flows and ensuring adequate access to funds from unutilised borrowing facilities or other sources.
Currency and market risk
The Group, has a hedging policy in place and uses Travelex to provide advice and solutions for the management of the Group’s currency exposure.
At present, the Group has no foreign currency hedges in respect of forecast sales and purchases. The Group also has no hedges in place for its trade receivables and trade payables denominated in a foreign currency.
The Group operates internationally and is exposed to foreign exchange risk arising from various currency exposures, primarily with respect to the SEK (swedish krona).
Foreign exchange risk arises from future commercial transactions and recognised assets and liabilities denominated in a currency that is not the entity’s functional currency. The risk is measured using sensitivity analysis and cash flow forecasting.
Management has set up a policy that all transactions in foreign currencies be transacted at spot. Management will continually review this policy based on volumes of foreign currency required.
Interest rate risk
The Group’s exposure to interest rates relate primarily to cash and cash equivalents. As at 31 December 2014 the Group has no financial liabilities subject to interest rate movements. Sensitivity to interest rate risk is considered immaterial.
Summarised sensitivity analysis
The Group has used ranges of rate and price fluctuations that approximate the rates observed over the reporting period to estimate its sensitivity to market rates. The Group’s main interest rate exposures are to Australian short-term interest rates; its foreign exchange risk is to the Swedish Krona.
The Group’s exposure to foreign currency risk at the end of the reporting period, expressed in Australian dollar, was as follows:
2014
$
2013
$
Trade payables - SEK 2,178,397 2,764,671
Based on the financial instruments held at 31 December 2014, had the Australia dollar weakened/strengthened by 5% against the SEK with all other variables held constant, the Group’s post-tax loss for the year would have been $108,920 higher/$108,920 lower, mainly as a result of foreign exchange gains/losses on translation of SEK denominated liabilities as detailed in the above table.
Fair values
The net fair value and carrying amounts of financial assets and financial liabilities are disclosed in the Consolidated Statement of Financial Position and in the Notes to the Consolidated Statement of Financial Position.
This note provides an update on the judgements and estimates made by the group in determining the fair values of the financial instruments.
For unlisted investments where there is no organised financial market the net fair value has been based on a reasonable estimation of the underlying net assets or discounted cash flows of the investment, where this could not be done, they have been carried at cost. No financial assets or financial liabilities are readily traded on organised markets in standardised form other than investments.
For
per
sona
l use
onl
y
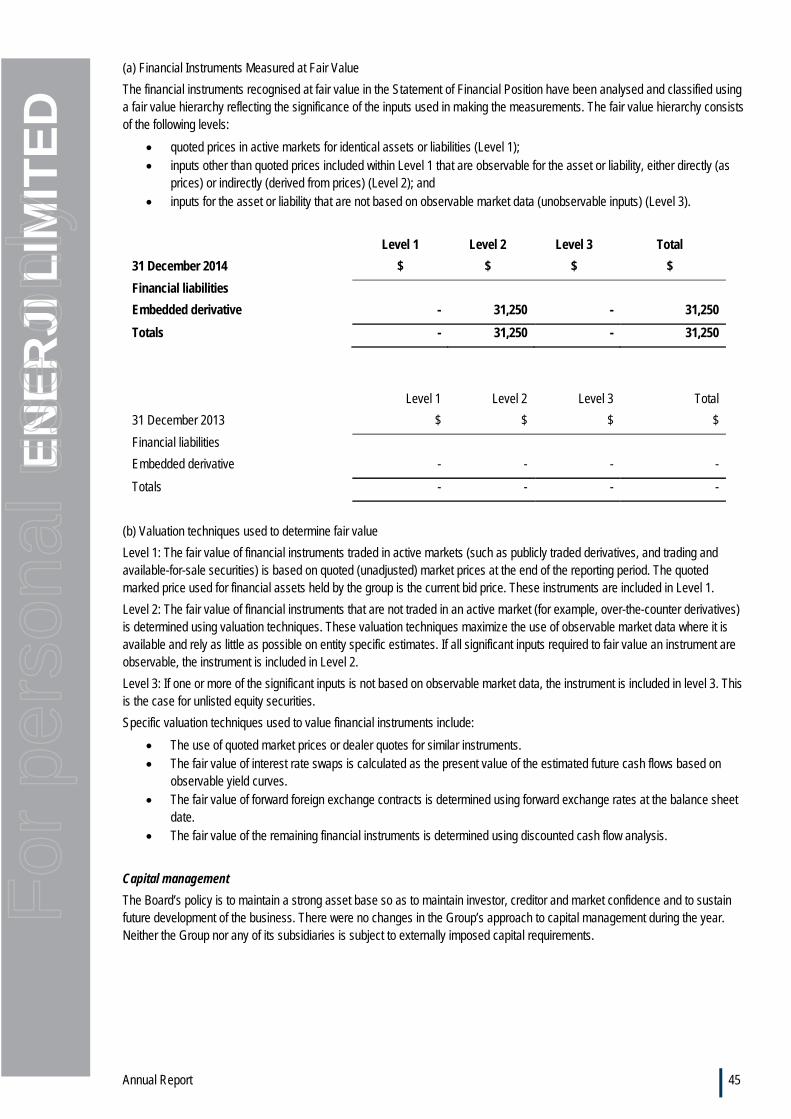
Annual Report 45
EN
ER
JI L
IMIT
ED
(a) Financial Instruments Measured at Fair Value
The financial instruments recognised at fair value in the Statement of Financial Position have been analysed and classified using a fair value hierarchy reflecting the significance of the inputs used in making the measurements. The fair value hierarchy consists of the following levels:
quoted prices in active markets for identical assets or liabilities (Level 1); inputs other than quoted prices included within Level 1 that are observable for the asset or liability, either directly (as
prices) or indirectly (derived from prices) (Level 2); and inputs for the asset or liability that are not based on observable market data (unobservable inputs) (Level 3).
Level 1 Level 2 Level 3 Total
31 December 2014 $ $ $ $
Financial liabilities
Embedded derivative - 31,250 - 31,250
Totals - 31,250 - 31,250
Level 1 Level 2 Level 3 Total
31 December 2013 $ $ $ $
Financial liabilities
Embedded derivative - - - -
Totals - - - -
(b) Valuation techniques used to determine fair value
Level 1: The fair value of financial instruments traded in active markets (such as publicly traded derivatives, and trading and available-for-sale securities) is based on quoted (unadjusted) market prices at the end of the reporting period. The quoted marked price used for financial assets held by the group is the current bid price. These instruments are included in Level 1.
Level 2: The fair value of financial instruments that are not traded in an active market (for example, over-the-counter derivatives) is determined using valuation techniques. These valuation techniques maximize the use of observable market data where it is available and rely as little as possible on entity specific estimates. If all significant inputs required to fair value an instrument are observable, the instrument is included in Level 2.
Level 3: If one or more of the significant inputs is not based on observable market data, the instrument is included in level 3. This is the case for unlisted equity securities.
Specific valuation techniques used to value financial instruments include:
The use of quoted market prices or dealer quotes for similar instruments. The fair value of interest rate swaps is calculated as the present value of the estimated future cash flows based on
observable yield curves. The fair value of forward foreign exchange contracts is determined using forward exchange rates at the balance sheet
date. The fair value of the remaining financial instruments is determined using discounted cash flow analysis.
Capital management
The Board’s policy is to maintain a strong asset base so as to maintain investor, creditor and market confidence and to sustain future development of the business. There were no changes in the Group’s approach to capital management during the year. Neither the Group nor any of its subsidiaries is subject to externally imposed capital requirements.
For
per
sona
l use
onl
y
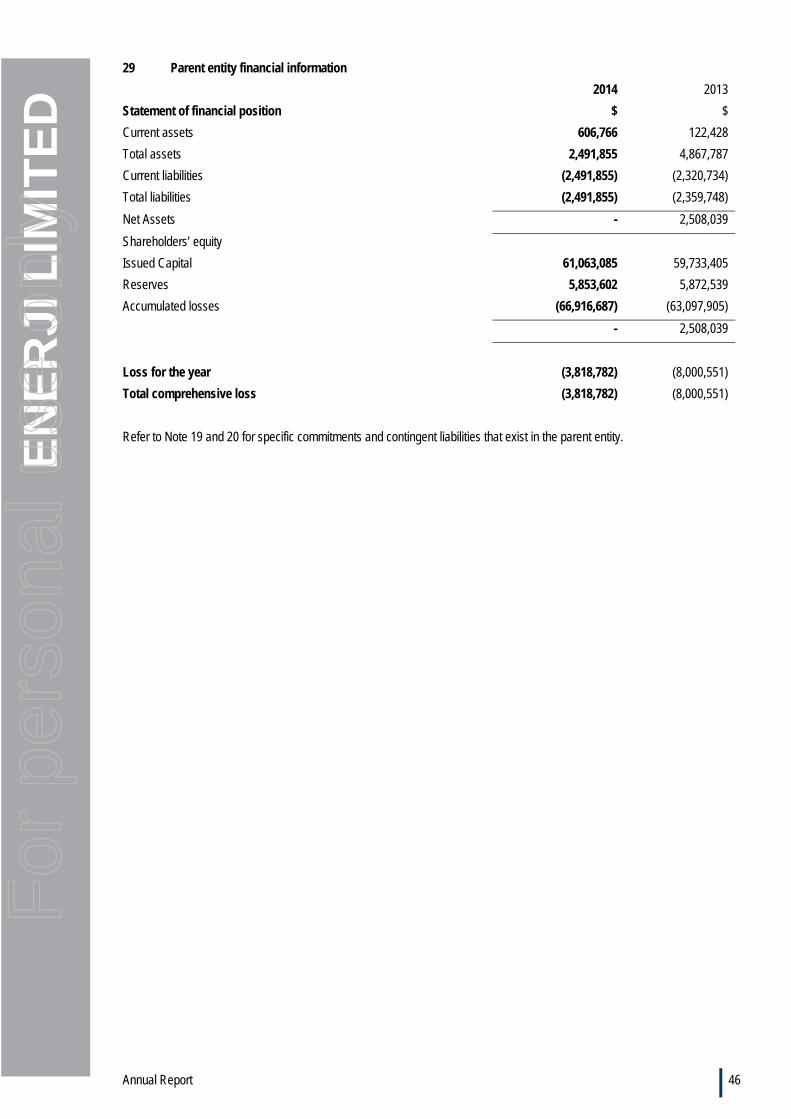
Annual Report 46
EN
ER
JI L
IMIT
ED
29 Parent entity financial information
2014 2013
Statement of financial position $ $
Current assets 606,766 122,428
Total assets 2,491,855 4,867,787
Current liabilities (2,491,855) (2,320,734)
Total liabilities (2,491,855) (2,359,748)
Net Assets - 2,508,039
Shareholders’ equity
Issued Capital 61,063,085 59,733,405
Reserves 5,853,602 5,872,539
Accumulated losses (66,916,687) (63,097,905)
- 2,508,039
Loss for the year (3,818,782) (8,000,551)
Total comprehensive loss (3,818,782) (8,000,551)
Refer to Note 19 and 20 for specific commitments and contingent liabilities that exist in the parent entity.
For
per
sona
l use
onl
y
Annual Report 47
EN
ER
JI L
IMIT
ED
The directors of the Company declare that:
1. The financial statements, comprising the statement of profit or loss and other comprehensive income, statement of financial position, statement of cash flows, statement of changes in equity, accompanying notes, are in accordance with the Corporations Act 2001 and:
(a) comply with Accounting Standards, the Corporations Regulations 2001 and other mandatory professional reporting requirements; and
(b) give a true and fair view of the consolidated entity’s financial position as at 31 December 2014 and of its performance for the year ended on that date.
2. The Company has included in the notes to the financial statements an explicit and unreserved statement of compliance with International Financial Reporting Standards.
3. In the directors’ opinion, there are reasonable grounds to believe that the Company will be able to pay its debts as and when they become due and payable.
4. The directors have been given the declarations by the chief executive officer and chief financial officer required by section 295A.
This declaration is made in accordance with a resolution of the Board of Directors and is signed for and on behalf of the directors by:
Steven Formica
Director
Perth
30 March 2015
DECLARATION BY DIRECTORS
For
per
sona
l use
onl
y
Annual Report 48
38 Station StreetSubiaco, WA 6008PO Box 700 West Perth WA 6872Australia
Tel: +61 8 6382 4600Fax: +61 8 6382 4601www.bdo.com.au
INDEPENDENT AUDITOR’S REPORT
To the members of Enerji Limited
Report on the Financial Report
We have audited the accompanying financial report of Enerji Limited, which comprises theconsolidated statement of financial position as at 31 December 2014, the consolidated statement ofprofit or loss and other comprehensive income, the consolidated statement of changes in equity andthe consolidated statement of cash flows for the year then ended, notes comprising a summary ofsignificant accounting policies and other explanatory information, and the directors’ declaration of theconsolidated entity comprising the company and the entities it controlled at the year’s end or fromtime to time during the financial year.
Directors’ Responsibility for the Financial Report
The directors of the company are responsible for the preparation of the financial report that gives atrue and fair view in accordance with Australian Accounting Standards and the Corporations Act 2001and for such internal control as the directors determine is necessary to enable the preparation of thefinancial report that gives a true and fair view and is free from material misstatement, whether due tofraud or error. In Note 2(a), the directors also state, in accordance with Accounting Standard AASB 101Presentation of Financial Statements, that the financial statements comply with InternationalFinancial Reporting Standards.
Auditor’s Responsibility
Our responsibility is to express an opinion on the financial report based on our audit. We conducted ouraudit in accordance with Australian Auditing Standards. Those standards require that we comply withrelevant ethical requirements relating to audit engagements and plan and perform the audit to obtainreasonable assurance about whether the financial report is free from material misstatement.
An audit involves performing procedures to obtain audit evidence about the amounts and disclosures inthe financial report. The procedures selected depend on the auditor’s judgement, including theassessment of the risks of material misstatement of the financial report, whether due to fraud or error.In making those risk assessments, the auditor considers internal control relevant to the company’spreparation of the financial report that gives a true and fair view in order to design audit proceduresthat are appropriate in the circumstances, but not for the purpose of expressing an opinion on theeffectiveness of the company’s internal control. An audit also includes evaluating the appropriatenessof accounting policies used and the reasonableness of accounting estimates made by the directors, aswell as evaluating the overall presentation of the financial report.
We believe that the audit evidence we have obtained is sufficient and appropriate to provide a basisfor our audit opinion.
Independence
In conducting our audit, we have complied with the independence requirements of the CorporationsAct 2001. We confirm that the independence declaration required by the Corporations Act 2001, which
BDO Audit (WA) Pty Ltd ABN 79 112 284 787 is a member of a national association of independent entities which are all members of BDO Australia Ltd ABN 77 050 110 275,an Australian company limited by guarantee. BDO Audit (WA) Pty Ltd and BDO Australia Ltd are members of BDO International Ltd, a UK company limited by guarantee, andform part of the international BDO network of independent member firms. Liability limited by a scheme approved under Professional Standards Legislation other than forthe acts or omissions of financial services licensees
For
per
sona
l use
onl
y
Annual Report 49
has been given to the directors of Enerji Limited, would be in the same terms if given to the directorsas at the time of this auditor’s report.
Opinion
In our opinion:
(a) the financial report of Enerji Limited is in accordance with the Corporations Act 2001, including:
(i) giving a true and fair view of the consolidated entity’s financial position as at 31 December2014 and of its performance for the year ended on that date; and
(ii) complying with Australian Accounting Standards and the Corporations Regulations 2001; and
(b) the financial report also complies with International Financial Reporting Standards as disclosed inNote 2(a).
Emphasis of matter
Without modifying our opinion, we draw attention to Note 2(g) in the financial report, which indicatesthat the ability of the consolidated entity to continue as a going concern is dependent upon securingfunding in the form of debt such as project or equipment finance, receipt of project revenue, receiptof grants, or raising equity in order to meet its current liabilities and continue to make instalments onfurther Powerboxes and complete new projects. These conditions, along with other matters as set outin Note 2(g), indicate the existence of a material uncertainty that may cast significant doubt about theconsolidated entity’s ability to continue as a going concern and therefore, the consolidated entity maybe unable to realise its assets and discharge its liabilities in the normal course of business.
Report on the Remuneration Report
We have audited the Remuneration Report included the directors’ report for the year ended 31December 2014. The directors of the company are responsible for the preparation and presentation ofthe Remuneration Report in accordance with section 300A of the Corporations Act 2001. Ourresponsibility is to express an opinion on the Remuneration Report, based on our audit conducted inaccordance with Australian Auditing Standards.
Opinion
In our opinion, the Remuneration Report of Enerji Limited for the year ended 31 December 2014complies with section 300A of the Corporations Act 2001.
BDO Audit (WA) Pty Ltd
Brad McVeigh
Director
Perth, 30 March 2015
For
per
sona
l use
onl
y
Annual Report 50
EN
ER
JI L
IMIT
ED
The Board of Directors of Enerji Ltd (ERJ) is responsible for the corporate governance of the Company. The Board guides and monitors the business and affairs of the Company on behalf of the shareholders by whom they are elected and to whom they are accountable.
In accordance with the Australian Securities Exchange (ASX) Corporate Governance Council’s (“CGC”) “Principles of Good Corporate Governance and Best Practice Recommendations” the Corporate Governance Statement must contain certain specific information and must disclose the extent to which the Company has followed the guidelines during the period. Where a recommendation has not been followed, that fact must be disclosed together with the reasons for the departure.
The Company’s corporate governance practices were in place throughout the year and are compliant, unless otherwise stated, with the Corporate Governance Council’s principles and recommendations, which are noted below.
Principle 1. Lay solid foundations for management and oversight
Principle 2. Structure the Board to add value
Principle 3. Promote ethical and responsible decision making
Principle 4. Safeguard integrity in financial reporting
Principle 5. Make timely and balanced disclosure
Principle 6. Respect the rights of shareholders
Principle 7. Recognise and manage risk
Principle 8. Remunerate fairly and responsibly
A summary of the corporate governance policies and practices adopted by ERJ is set out below.
Role of the Board of Directors
The Board of ERJ is responsible for setting the Company’s strategic direction and providing effective governance over ERJs’ affairs in conjunction with the overall supervision of the Company’s business with the view of maximising shareholder value. The Board's key responsibilities are to:
(a) chart the direction, strategies and financial objectives for ERJ and monitor the implementation of those policies, strategies and financial objectives;
(b) monitor compliance with regulatory requirements, ethical standards and external commitments;
(c) appoint, evaluate the performance of, determine the remuneration of, plan for the succession of and, where appropriate, remove the Chief Executive Officer if in place or similar person acting in the executive capacity; and
(d) ensure that the Board continues to have the mix of skills and experience necessary to conduct ERJs' activities, and that appropriate directors are selected and appointed as required.
In accordance with ERJs’ Constitution, the Board delegates responsibility for the day–to–day management of ERJ to the and Chief Executive Officer if this position is filled or the Chairman (subject to any limits of such delegated authority as determined by the Board from time to time). Management as a whole is charged with reporting to the Board on the performance of the Company.
Board structure and composition
The Board currently is comprised of 3 directors, one of which is an independent non–executive Director who were appointed in February 2015. There were various changes in the Board throughout 2014 and the Board continues to assess its skillset to ensure it consists of the appropriate mix of skills. Details of each directors skill, expertise and background are contained within the directors report included with the company’s annual financial statements.
Independence, in this context, is defined to mean a non–executive Director who is free from any interest and any business or other relationship that could, or could reasonably be perceived to, materially interfere with the Director's ability to act in the best interests of ERJ. The definition of independence in ASX Recommendation 2.1 is taken into account for this purpose.
CORPORATE GOVERNANCE STATEMENT
For
per
sona
l use
onl
y
Annual Report 51
EN
ER
JI L
IMIT
ED
Statement of Corporate Governance (Cont’d)
In the absence of any significant scale in the Company’s existing operations, the Board does not believe that the existence of further independent non-executive directors would be of any additional benefit to the Company. As stated above, the Board will ensure that it continues to have the mix of skills and experience necessary to conduct ERJs' activities, and that appropriate directors are selected and appointed as required.
Details of directors’ shareholdings are disclosed in the directors’ report and financial report. There are no retirement schemes other than the payment of statutory superannuation contributions.
Any equity based compensation of directors is required to be approved in advance by shareholders.
Presently, the roles of Chairman and Chief Executive Officer have been separated. The present Chairman of the Company is not considered to be an independent director. Notwithstanding this, all directors of the Company are, and were during the reporting period, independent in character and judgment.
The Chief Executive Officer or a similar position held by the key executive of the Company is responsible for supervising the management of the business as designated by the Board. This ensures the appropriate independent functioning of the Board and management.
ERJs’ non–executive Directors may not hold office for a continuous period in excess of three years or past the third annual general meeting following their appointment, whichever is longer, without submitting for re–election. Directors are elected or re–elected, as the case may be, by shareholders in a general meeting. Directors may offer themselves for re–election. A Director appointed by the Directors (e.g., to fill a casual vacancy) will hold office only until the conclusion of the next annual general meeting of ERJ but is eligible for re–election at that meeting.
Under ERJs’ Constitution, voting requires a simple majority of the Board. The Chairman holds a casting vote.
The Company has procedures enabling any director or committee of the board to seek external professional advice as considered necessary, at the Company’s expense subject to prior consultation with the Chairman. A copy of any advice sought by a director would be made available to all directors.
Board and management effectiveness
Responsibility for the overall direction and management of ERJ, its corporate governance and the internal workings of ERJ rests with the Board notwithstanding the delegation of certain functions to the Chief Executive Officer and management generally (such delegation effected at all times in accordance with ERJ’ Constitution and its corporate governance policies).
An evaluation procedure in relation to the Board, individual Directors, Board Committees and Company executives was adopted by the Board in October 2014. An evaluation procedure did not take place during the year as the Board underwent considerable change throughout the year. The evaluation of the Board as a whole will be facilitated through the use of a questionnaire required to be completed by each Board Member, the results of which will be summarized and discussed with the Chairman of the Board and tabled for discussion at a Board Meeting. Similarly each individual director will be required to self-assess his performance and to discuss the results with the Chairman. The same procedure is undertaken for the Audit, Compliance and Risk Committee and the Remuneration and Nomination Committee.
To ensure management, as well as Board effectiveness, the Board, through the Remuneration and Nomination Committee has direct responsibility for evaluating the performance of the Chief Executive Officer or similar position. A formal will be undertaken at the end of the 2015 financial year.
Financial reporting, Internal Control and Risk Management
The Board has overall responsibility for ERJ’ systems of internal control. These systems are designed to ensure effective and efficient operations, including financial reporting and compliance with laws and regulation, with a view to managing risk of failure to achieve business objectives. It must be recognized however that internal control systems provide only reasonable and not absolute assurance against the risk of material loss.
The Board reviews the financial position of ERJ on a regular basis. For annual financial statements, the Chief Executive Officer, or similar position, and the Company Financial Officer are required to state in writing that:
For
per
sona
l use
onl
y
Annual Report 52
EN
ER
JI L
IMIT
ED
Statement of Corporate Governance (Cont’d)
the Company’s financial reports present a true and fair view, in all material respects, of the Company’s financial condition and operational results in accordance with the relevant accounting standards; and
are founded on a system of risk management and internal compliance and control and the Company’s risk management and internal compliance and control system is operating efficiently and effectively in all material respects.
Management has not formally reported to the Board on the effectiveness of the Company’s management of material business risk, however risk reports will be provided to the Board via the Audit and Risk Committee. Each reportable risk is discussed ensuring appropriate mitigation strategies are implemented by the Group. Management and the Board interact on a day to day basis and risk is currently being considered across the financial, operational and organization aspects of the Company’s business. The Company will continue to monitor, assess and report its business risks
Committees of the Board of Directors
The Board has established two permanent Board committees to assist the Board in the performance of its functions:
(a) the Audit and Risk Committee; and
(b) the Remuneration and Nomination Committee (established in October 2014).
Each committee has a charter, which sets out the Committee's purpose and responsibilities. The Committees are described further below.
Audit and Risk Committee
The purpose of the Audit and Risk Committee is to provide assistance to the Board in its review of:
(a) ERJ’s financial reporting, internal control structure and risk management systems;
(b) the internal and external audit functions; and
(c) ERJ’s compliance with legal and regulatory requirements in relation to the above.
The Audit and Risk Committee has specific responsibilities in relation to ERJ’s financial reporting process; the assessment of accounting, financial and internal controls; the appointment of external auditor; the assessment of the external audit; the independence of the external auditor; and setting the scope of the external audit.
The members of the Audit and Risk Committee are presently all members of the Board and chaired by the chairmen of the Board. Whilst this is not considered best practice, given the present makeup of the Board, the functioning of the committee provides specific focus on matters set out under the charter of the Audit and Risk Committee.
It is envisaged once the Company further develops and enhances its Board composition, the Audit and Risk Committee will comprise at least three non–executive Directors that have diverse, complementary backgrounds, with two independent non–executive Directors. The Chairman of the Audit, Compliance and Risk Committee will be an independent non–executive Director.
Remuneration and Nomination Committee
The purpose of the Remuneration and Nomination Committee is to discharge the Board's responsibilities relating to the nomination and selection of Directors and the compensation of the Company's executives and Directors.
The key responsibilities of the Remuneration and Nomination Committee are to:
(a) ensure the establishment and maintenance of a formal and transparent procedure for the selection and appointment of new Directors to the Board; and
(b) establish transparent and coherent remuneration policies and practices, which will enable ERJ to attract, retain and motivate executives and Directors who will create value for shareholders and to fairly and responsibly reward executives.
The members of the Remuneration and Nomination Committee are presently all members of the Board and chaired by the chairmen of the Board. Whilst this is not considered best practice, given the present makeup of the Board, the functioning of the committee provides specific focus on matters set out under the charter of the Remuneration and Nomination Committee.
For
per
sona
l use
onl
y
Annual Report 53
EN
ER
JI L
IMIT
ED
Statement of Corporate Governance (Cont’d)
It is envisaged once the Company further develops and enhances its Board composition, the Remuneration and Nomination Committee will comprise at least three non–executive Directors that have diverse, complementary backgrounds, with two independent non–executive Directors. The Chairman of the Remuneration and Nomination Committee will be an independent non–executive Director.
The remuneration policy which sets out the terms and conditions for the Chief Executive Officer and other senior executives is set out in the Remuneration Report included in the Directors Report.
Timely and balanced disclosure
ERJ is committed to promoting investor confidence and ensuring that shareholders and the market have equal access to information and are provided with timely and balanced disclosure of all material matters concerning the Company. Additionally, ERJ recognises its continuous disclosure obligations under the ASX Listing Rules and the Corporations Act.
The Company’s shareholders are responsible for voting on the appointment of directors. The Board informs shareholders of all major developments affecting the Company by:
Preparing half yearly and annual financial reports and making these available to all shareholders.
Preparing quarterly activity cash flow reports.
Advising the market of matters requiring disclosure under Australian Stock Exchange Continuous Disclosure Rules.
Maintaining a record of significant ASX announcements on the Company’s website.
Submitting proposed major changes in the Company’s affairs to a vote of shareholders, as required by the Corporation Law.
Reporting to shareholders at annual general meetings on the Company’s activities during the year. All shareholders that are unable to attend these meetings are encouraged to communicate issues or ask questions by writing to the Company.
The Company has adopted a formal disclosure policy. The Board and management are aware of their responsibilities in respect of identifying material information and coordinating disclosure of that information where required by the ASX Listing Rules.
Ethical and responsible decision–making
Code of Conduct
The Board has created a framework for managing the Company including internal controls, business risk management processes and appropriate ethical standards.
The Board has adopted practices for maintaining confidence in the Company's integrity including promoting integrity, trust, fairness and honesty in the way employees and Directors conduct themselves and ERJs' business, avoiding conflicts of interest and not misusing company resources.
Diversity
The Company employs a broad mix of individuals reflecting its philosophy of hiring the best candidate for all positions at all levels irrespective of race, religion or gender. In terms of the composition of the Board and Board nominations, the Board will consider the requirements of the Davies Report and the Australian Stock Exchange Corporate Governance Principles as part of the overall Board appointment process of determining the composition of the Board that is the most appropriate for the Group.
The Company implemented a diversity policy in October 2014. The objective of the policy is for the Company to embrace the diversity of skills, ideas and experiences of an individual and recognise that a workforce is made up of people with differences in age, gender, sexual orientation, disability, religion or national origin or social origin contributes to ERJ’s success and organizational strength. It ensures all employees are treated with fairness and respect.
For
per
sona
l use
onl
y
Annual Report 54
EN
ER
JI L
IMIT
ED
Statement of Corporate Governance (Cont’d)
ERJ is committed to embedding a corporate culture that embraces diversity through;
Recruitment on the basis of competence and performance and selection of candidates from a diverse pool of qualified
candidates
Maintaining selection criteria that does not indirectly disadvantage people from certain groups
Providing equal employment opportunities through performance and flexible working practices
Maintaining a safe working environment and supportive culture by taking action against inappropriate workplace and
business behaviour that is deemed as unlawful (discrimination, harassment, bullying, vilification and victimization)
Promoting diversity across all levels of the business
Undertaking diversity initiatives and measuring their success
Regularly surveying our work climate
The Board of Directors establishing measurable objectives in achieving
gender diversity.
The Company currently employs minimal full time staff with most functions contracted to third parties and as such no measurable objectives have been set. There are no female directors.
Securities Trading Policy
A Securities Trading Policy has been adopted by the Board to set a standard of conduct, which demonstrates ERJ’s commitment to ensuring awareness of the insider trading laws, and that employees and Directors comply with those laws. The Securities Trading Policy imposes additional share trading restrictions on Directors, the Company Secretary, executives and employees involved in monthly financial accounting processes ("specified persons").
Under the Securities Trading Policy, specified persons are only permitted to buy and sell securities if they do not possess non–public price sensitive information and trading occurs outside of specified restricted periods. These periods are the periods commencing on the first day of the month before the end of the half–year or full year period and ending on the next business day after the announcement of the results for that period. In addition, before a specified person can deal in ERJ’s securities they must obtain clearance from the appropriate officer, confirming that there is no reason why they cannot trade.
Other Information
The ASX guidelines also prescribe that the Company should maintain a dedicated corporate governance information section on its website. Such a dedicated information section is not presently available on the Company’s website, although the annual financial report will be posted to the website and the Statement of Corporate Governance can be viewed there.
For
per
sona
l use
onl
y
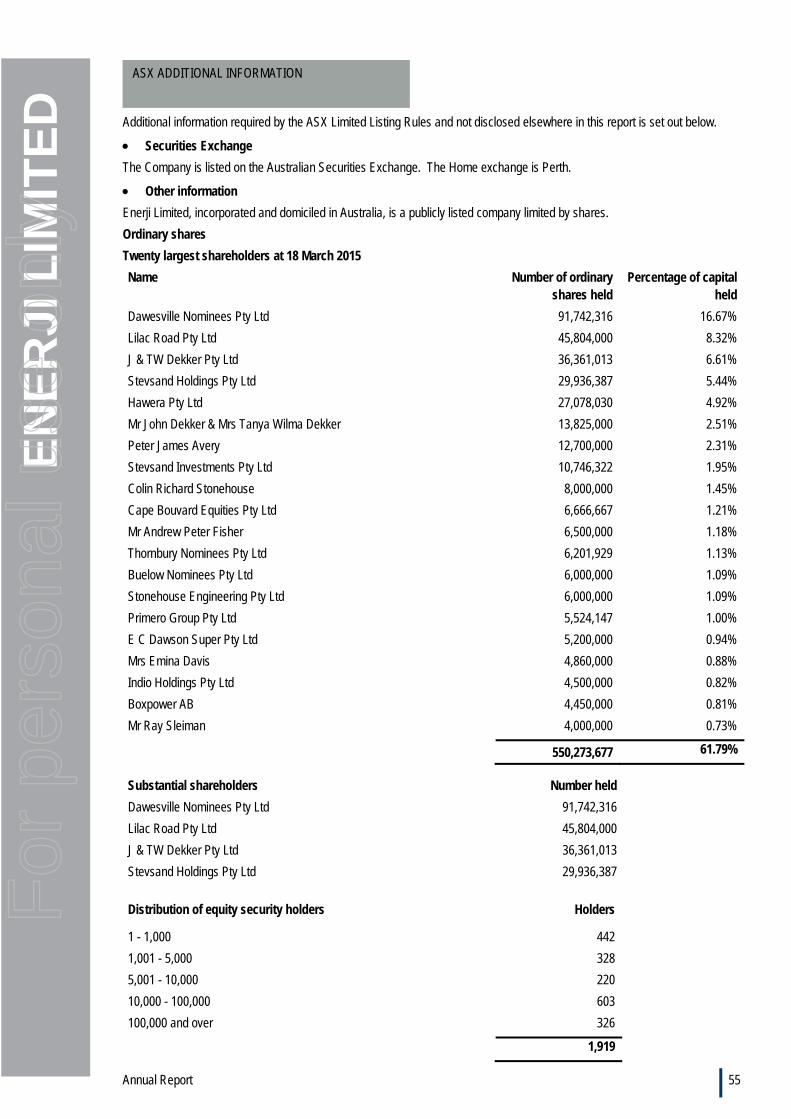
Annual Report 55
EN
ER
JI L
IMIT
ED
Additional information required by the ASX Limited Listing Rules and not disclosed elsewhere in this report is set out below.
Securities Exchange
The Company is listed on the Australian Securities Exchange. The Home exchange is Perth.
Other information
Enerji Limited, incorporated and domiciled in Australia, is a publicly listed company limited by shares.
Ordinary shares
Twenty largest shareholders at 18 March 2015
Name Number of ordinary shares held
Percentage of capital held
Dawesville Nominees Pty Ltd 91,742,316 16.67%
Lilac Road Pty Ltd 45,804,000 8.32%
J & TW Dekker Pty Ltd 36,361,013 6.61%
Stevsand Holdings Pty Ltd 29,936,387 5.44%
Hawera Pty Ltd 27,078,030 4.92%
Mr John Dekker & Mrs Tanya Wilma Dekker 13,825,000 2.51%
Peter James Avery 12,700,000 2.31%
Stevsand Investments Pty Ltd 10,746,322 1.95%
Colin Richard Stonehouse 8,000,000 1.45%
Cape Bouvard Equities Pty Ltd 6,666,667 1.21%
Mr Andrew Peter Fisher 6,500,000 1.18%
Thornbury Nominees Pty Ltd 6,201,929 1.13%
Buelow Nominees Pty Ltd 6,000,000 1.09%
Stonehouse Engineering Pty Ltd 6,000,000 1.09%
Primero Group Pty Ltd 5,524,147 1.00%
E C Dawson Super Pty Ltd 5,200,000 0.94%
Mrs Emina Davis 4,860,000 0.88%
Indio Holdings Pty Ltd 4,500,000 0.82%
Boxpower AB 4,450,000 0.81%
Mr Ray Sleiman 4,000,000 0.73%
550,273,677 61.79%
Substantial shareholders Number held
Dawesville Nominees Pty Ltd 91,742,316
Lilac Road Pty Ltd 45,804,000
J & TW Dekker Pty Ltd 36,361,013
Stevsand Holdings Pty Ltd 29,936,387
Distribution of equity security holders Holders
1 - 1,000 442
1,001 - 5,000 328
5,001 - 10,000 220
10,000 - 100,000 603
100,000 and over 326
1,919
ASX ADDITIONAL INFORMATION
For
per
sona
l use
onl
y
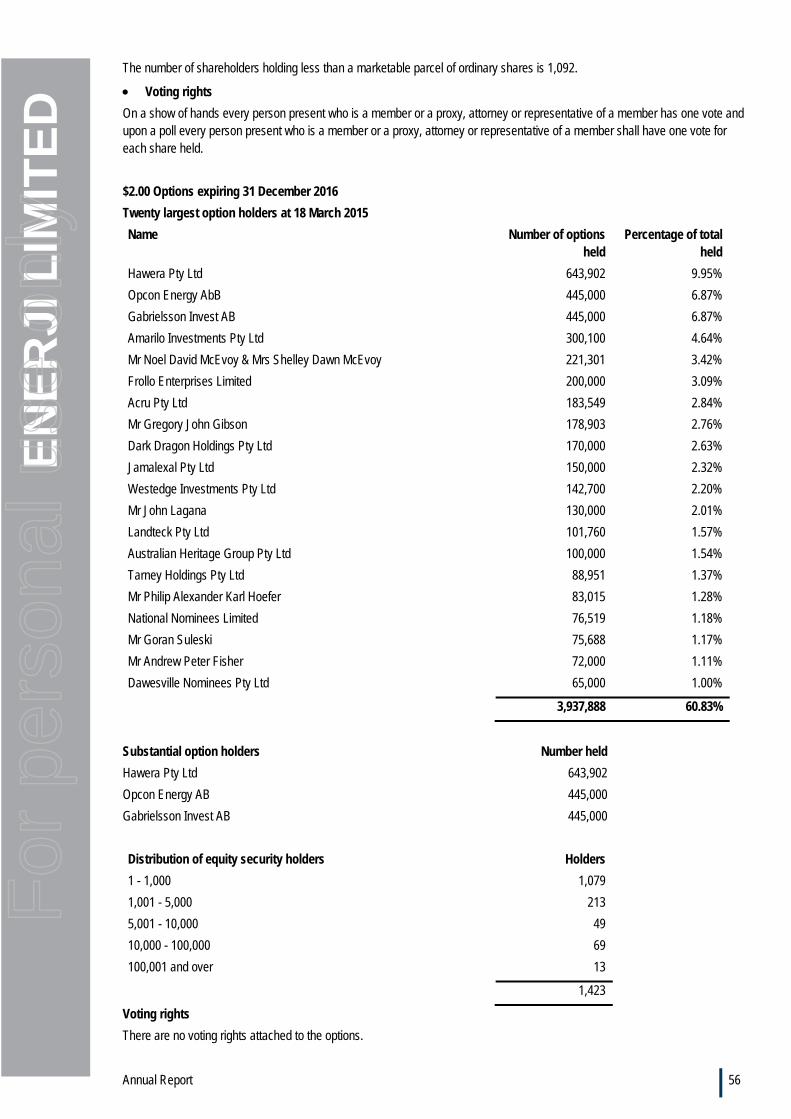
Annual Report 56
EN
ER
JI L
IMIT
ED
The number of shareholders holding less than a marketable parcel of ordinary shares is 1,092.
Voting rights
On a show of hands every person present who is a member or a proxy, attorney or representative of a member has one vote and upon a poll every person present who is a member or a proxy, attorney or representative of a member shall have one vote for each share held.
$2.00 Options expiring 31 December 2016
Twenty largest option holders at 18 March 2015
Name Number of options held
Percentage of total held
Hawera Pty Ltd 643,902 9.95%
Opcon Energy AbB 445,000 6.87%
Gabrielsson Invest AB 445,000 6.87%
Amarilo Investments Pty Ltd 300,100 4.64%
Mr Noel David McEvoy & Mrs Shelley Dawn McEvoy 221,301 3.42%
Frollo Enterprises Limited 200,000 3.09%
Acru Pty Ltd 183,549 2.84%
Mr Gregory John Gibson 178,903 2.76%
Dark Dragon Holdings Pty Ltd 170,000 2.63%
Jamalexal Pty Ltd 150,000 2.32%
Westedge Investments Pty Ltd 142,700 2.20%
Mr John Lagana 130,000 2.01%
Landteck Pty Ltd 101,760 1.57%
Australian Heritage Group Pty Ltd 100,000 1.54%
Tarney Holdings Pty Ltd 88,951 1.37%
Mr Philip Alexander Karl Hoefer 83,015 1.28%
National Nominees Limited 76,519 1.18%
Mr Goran Suleski 75,688 1.17%
Mr Andrew Peter Fisher 72,000 1.11%
Dawesville Nominees Pty Ltd 65,000 1.00%
3,937,888 60.83%
Substantial option holders Number held
Hawera Pty Ltd 643,902
Opcon Energy AB 445,000
Gabrielsson Invest AB 445,000
Distribution of equity security holders Holders
1 - 1,000 1,079
1,001 - 5,000 213
5,001 - 10,000 49
10,000 - 100,000 69
100,001 and over 13
1,423
Voting rights
There are no voting rights attached to the options.
For
per
sona
l use
onl
y
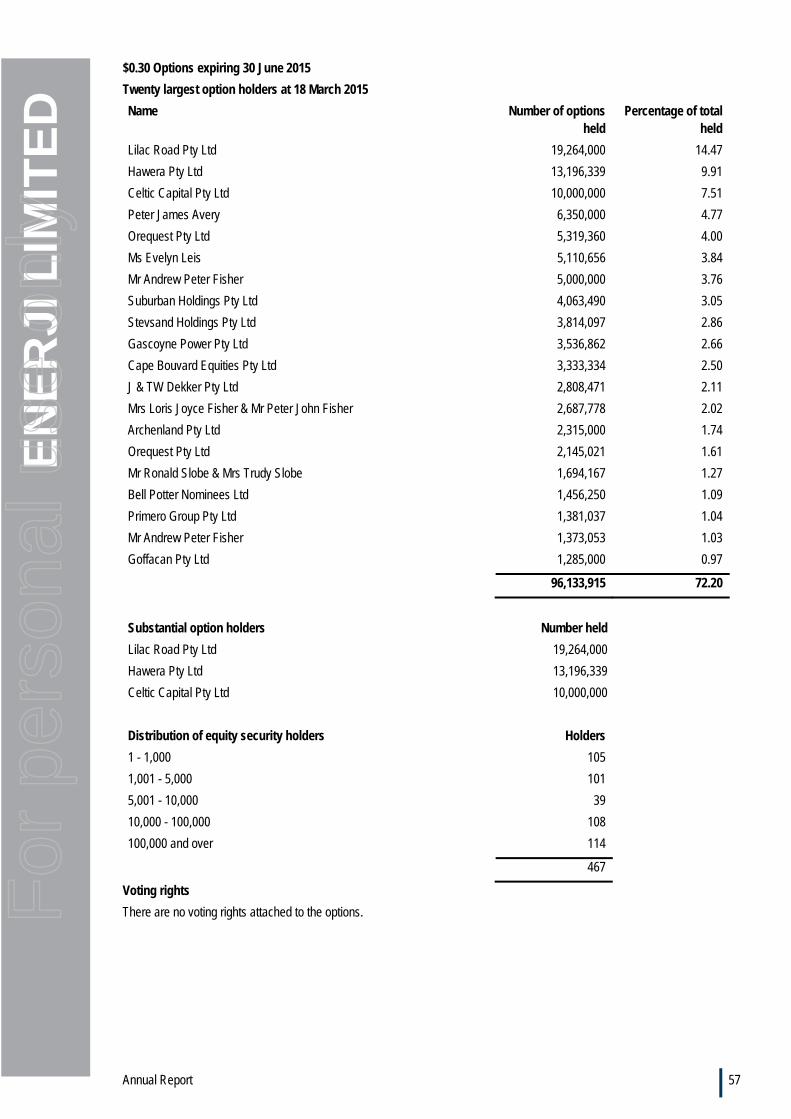
Annual Report 57
EN
ER
JI L
IMIT
ED
$0.30 Options expiring 30 June 2015
Twenty largest option holders at 18 March 2015
Name Number of options held
Percentage of total held
Lilac Road Pty Ltd 19,264,000 14.47
Hawera Pty Ltd 13,196,339 9.91
Celtic Capital Pty Ltd 10,000,000 7.51
Peter James Avery 6,350,000 4.77
Orequest Pty Ltd 5,319,360 4.00
Ms Evelyn Leis 5,110,656 3.84
Mr Andrew Peter Fisher 5,000,000 3.76
Suburban Holdings Pty Ltd 4,063,490 3.05
Stevsand Holdings Pty Ltd 3,814,097 2.86
Gascoyne Power Pty Ltd 3,536,862 2.66
Cape Bouvard Equities Pty Ltd 3,333,334 2.50
J & TW Dekker Pty Ltd 2,808,471 2.11
Mrs Loris Joyce Fisher & Mr Peter John Fisher 2,687,778 2.02
Archenland Pty Ltd 2,315,000 1.74
Orequest Pty Ltd 2,145,021 1.61
Mr Ronald Slobe & Mrs Trudy Slobe 1,694,167 1.27
Bell Potter Nominees Ltd 1,456,250 1.09
Primero Group Pty Ltd 1,381,037 1.04
Mr Andrew Peter Fisher 1,373,053 1.03
Goffacan Pty Ltd 1,285,000 0.97
96,133,915 72.20
Substantial option holders Number held
Lilac Road Pty Ltd 19,264,000
Hawera Pty Ltd 13,196,339
Celtic Capital Pty Ltd 10,000,000
Distribution of equity security holders Holders
1 - 1,000 105
1,001 - 5,000 101
5,001 - 10,000 39
10,000 - 100,000 108
100,000 and over 114
467
Voting rights
There are no voting rights attached to the options.
For
per
sona
l use
onl
y