asx announcement chair and ceo presentation to …
TRANSCRIPT

20 October 2021 ASX Announcement
CHAIR AND CEO PRESENTATION TO SHAREHOLDERS
Super Retail Group Limited (ASX:SUL) is pleased to provide the Chair and CEO Presentation to Shareholders in relation to the 2021 Annual General Meeting. The release of this announcement has been authorised by the Board of Super Retail Group Limited. Investor enquiries: Robert Wruck, Head of Investor Relations Ph.: 0414 521 124 E: [email protected] Media enquiries: Kate Carini Ph.: 07 3482 7404 E: [email protected]

ABN: 81 108 676 204
AGMCEO’S PRESENTATION
2021
20 October 2021
Authorised for release by the Super Retail Group Board
S U P E R R E T A I L G R O U P
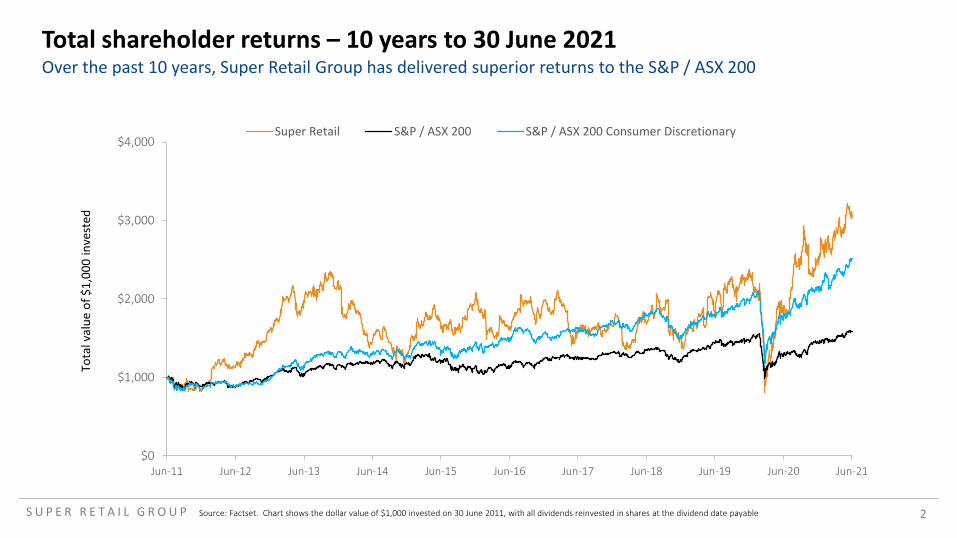
Over the past 10 years, Super Retail Group has delivered superior returns to the S&P / ASX 200Total shareholder returns – 10 years to 30 June 2021
$0
$1,000
$2,000
$3,000
$4,000
Jun-11 Jun-12 Jun-13 Jun-14 Jun-15 Jun-16 Jun-17 Jun-18 Jun-19 Jun-20 Jun-21
Super Retail S&P / ASX 200 S&P / ASX 200 Consumer Discretionary
Source: Factset. Chart shows the dollar value of $1,000 invested on 30 June 2011, with all dividends reinvested in shares at the dividend date payable
Tota
l val
ue o
f $1,
000
inve
sted
2
S U P E R R E T A I L G R O U P
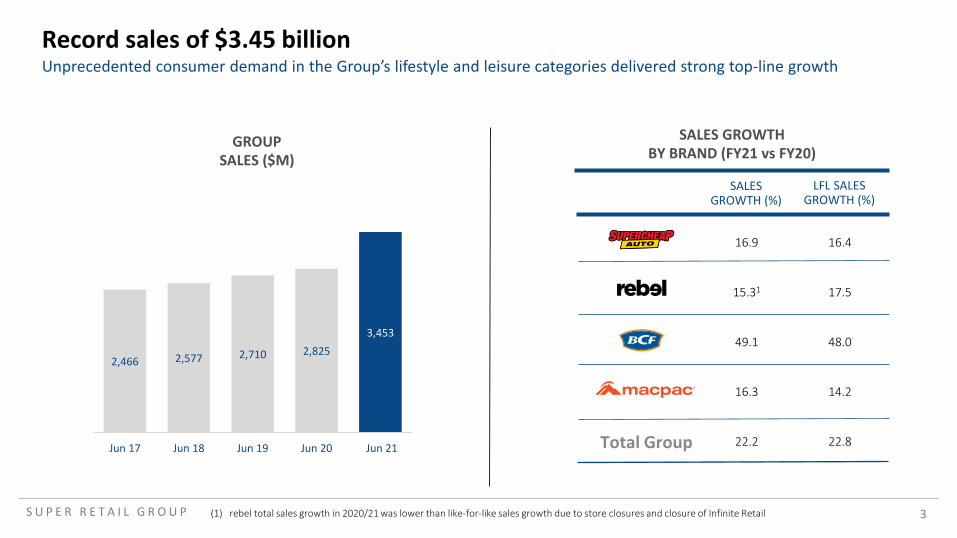
Unprecedented consumer demand in the Group’s lifestyle and leisure categories delivered strong top-line growthRecord sales of $3.45 billion
SALES GROWTH (%)
LFL SALES GROWTH (%)
16.9 16.4
15.31 17.5
49.1 48.0
16.3 14.2
22.2 22.8Total Group
2,466 2,577 2,710 2,8253,453
Jun 17 Jun 18 Jun 19 Jun 20 Jun 21
GROUPSALES ($M)
SALES GROWTHBY BRAND (FY21 vs FY20)
(1) rebel total sales growth in 2020/21 was lower than like-for-like sales growth due to store closures and closure of Infinite Retail 3

Financial highlights
SALES• Group sales up 22 per cent to $3.45b• Group like-for-like sales growth of 23 per cent
EARNINGS • Segment EBIT up 80 per cent to $476.8m1
• Segment PBT up 108 per cent to $435.8m1
• Statutory NPAT up 173 per cent to $301.0m • Normalised NPAT up 107 per cent to $306.8m1
• Basic EPS up 139 per cent to 133.4 cents• Final fully franked dividend of 55 cents per share, bringing
the full year dividend to 88 cents per share
ONLINE• Online sales up 43 per cent to $415.6m• Online sales represented 12 per cent of total sales • Click & Collect sales up 56 per cent to $192.1m• Home delivery sales up 34 per cent to $223.5m
BALANCE SHEET
• Strong balance sheet with no bank debt • Cash balance of $242.3m• $600m of undrawn debt facilities
(1) Post AASB 16 Leases 4

Operating highlights
CUSTOMERS• 8m active club members - up 22 per cent • Average customer NPS of 62.6• Active club members represented 63 per cent of Group
sales
OMNI-CHANNEL• Click & Collect represented 46 per cent of online sales• Completed more than 1.5 million home delivery orders• 30 per cent of Group online sales supported by
analytically driven data and insights
BRANDS • Market-leading brand awareness scores1:• Supercheap Auto – 85 per cent• rebel - 94 per cent• BCF – 76 per cent • Macpac – 86 per cent
SUPPLY CHAIN• Shipped container TEUs2 up 54 per cent to 15,341• Pallets delivered up 25 per cent to 408,000• 24 per cent reduction in split orders
(1) FY21 Stellar Market research brand awareness scores. Macpac brand awareness score is for New Zealand(2) TEUs are a unit of cargo capacity and means twenty-foot equivalent unit 5
S U P E R R E T A I L G R O U P
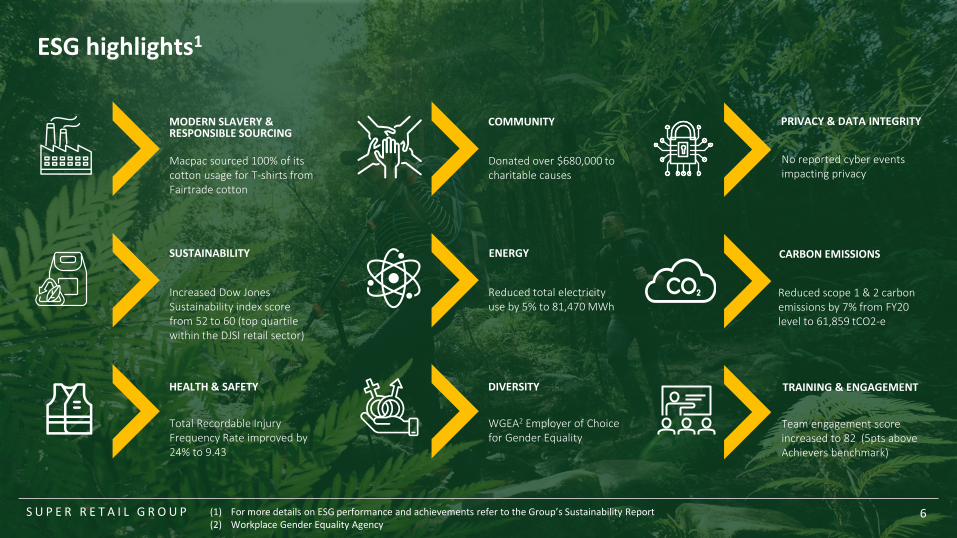
Macpac sourced 100% of its cotton usage for T-shirts from Fairtrade cotton
MODERN SLAVERY & RESPONSIBLE SOURCING
Donated over $680,000 to charitable causes
COMMUNITY
No reported cyber events impacting privacy
PRIVACY & DATA INTEGRITY
Increased Dow Jones Sustainability index score from 52 to 60 (top quartile within the DJSI retail sector)
SUSTAINABILITY
Reduced total electricity use by 5% to 81,470 MWh
ENERGY
Reduced scope 1 & 2 carbon emissions by 7% from FY20 level to 61,859 tCO2-e
CARBON EMISSIONS
Total Recordable Injury Frequency Rate improved by 24% to 9.43
HEALTH & SAFETY
WGEA2 Employer of Choice for Gender Equality
DIVERSITY
Team engagement score increased to 82 (5pts above Achievers benchmark)
TRAINING & ENGAGEMENT
ESG highlights1
6S U P E R R E T A I L G R O U P (1) For more details on ESG performance and achievements refer to the Group’s Sustainability Report(2) Workplace Gender Equality Agency

S U P E R R E T A I L G R O U P
Our Strategy
7
STRATEGIC DRIVERS
GROWING ANNUAL
CUSTOMER VALUE
BEING AN EFFICIENT
OMNI-RETAILER
ENSURING ORGANIC
GROWTH AND CAPITAL
DISCIPLINE
PRIMARYVALUELEVERS
12345
GROW THE FOURCORE BRANDS
LEVERAGE CLOSENESS TOOUR CUSTOMER
CONNECTED OMNI-RETAILSUPPLY CHAIN
SIMPLIFY THEBUSINESS
EXCEL IN OMNI-RETAILEXECUTION

S U P E R R E T A I L G R O U P
Investment in digital supported by long term shift to online
8
3% 3%4%
5%
8%
6%6%
9%
7%
10%
7%
14%
9%
17%
8%
16%
11%
21%
Supercheap Auto rebel BCF Macpac
FY17 FY18 FY19 FY20 FY21
(1) Macpac was acquired at the end of FY18. Data included from FY19 onwards.
Growing online sales validate the Group’s omni-retail business strategy and continued investment in our digital capability
ONLINE SALES AS A PERCENTAGE OF TOTAL SALES – BY BRAND1

S U P E R R E T A I L G R O U P
Leveraging our growing club member baseLoyalty and data analytics
• Added 1.4m customers to our loyalty programs in the past 12 months to reach 8m members
• Club loyalty members represent 63 per cent of Group sales
• The Group is deploying capital into rebuilding our loyalty programs, developing a customer data platform and building our analytics capability
• Completed quantitative and qualitative customer research and loyalty club reviews leading to the development of updated Customer Value Propositions for all brands
• Investing in capability to tailor loyalty benefits to meet segmented customer profiles and make hyper-personalised offers to individual customers utilising data analysis
• Key objectives and outcomes:
• Implement a structured loyalty program driving visitation and transaction value growth
• Develop analytical insight to drive improvement in marketing, merchandise, logistics, and store performance
• Employ customer solution-driven merchandising and marketing strategies
5.25.5
6.16.6
8.0
Jun 17 Jun 18 Jun 19 Jun 20 Jun 21
ACTIVE CLUB MEMBERS (M)4-YEAR CAGR 11.4%
9

S U P E R R E T A I L G R O U P 10S U P E R R E T A I L G R O U P
Stores– network optimisation
• Supercheap Auto store improvement program is targeting the conversion of ~170 old generation stores into new generation stores over the next 5 years
• Conversion to next generation stores delivers favourable economics:• Target single digit percentage
sales uplift in year 1 and payback in less than 5 years
• Refurbishment store capex averages circa $0.45m
• Conversion of top 25 stores and consolidation and conversion of first CBD flagship store to rCX format.
• Six stores to be upgraded to rCX format in FY22, including first CBD flagship in Adelaide
• rCX Parramatta performing above expectations• Investment in in-store
experience has driven sales growth of +67% vs FY20
• NPS of 62 (+14 vs prior period)
• Circa 600 sqm store (compared to standard 1200 sqm format) delivering sales intensity ~30% above fleet average
• Reduced floorspace, higher sales intensity and lower rent (compared to metro) creates favourable economics
• Successfully trialled at Echuca and Victor Harbour
• Targeting smaller catchment regional areas
• $0.4m capex per store
• Increase penetration in Australian market
• Successful winter launch of sales of Macpac products in rebel and BCF
• Expanded distribution network has increased Macpac sales and helped to grow brand awareness in Australia
• ~$4 million of Macpac sales to rebel and BCF in fourth quarter of FY21
STORE REFURBISHMENT rCX ROLL OUT SMALL FORMAT ROLL OUT STORE ROLL OUT

S U P E R R E T A I L G R O U P
Supercheap Auto
• Total sales growth of 16.9 per cent driven by like-for-like sales growth
• Like-for-like sales growth of 16.4 per cent reflected transaction growth and higher average transaction value driven by increase units per transaction and average unit value
• Online sales grew by 31 per cent to $107 million, representing 8 per cent of sales
• Auto accessories and car care delivered the strongest category growth
• 4WD & Outdoor, in car tech and roof racks, safety and comfort as well as car detailing were the fastest growing sub-categories
• Western Australia, South Australia and New South Wales delivered the strongest sales growth
• Gross margin expansion was driven by lower promotional sales, reduced promotional and clearance depth and a favourable net recovery of supply cost inflation
• Segment normalised PBT margin improved by 320bps to 14.7 per cent due improved gross margins and cost leverage
• Active Club Plus membership increased to 2.3m and club members represented 46 per cent of total sales
• SCA opened two new stores and closed one store resulting in 327 stores at period end
$mFY21
Pre AASB 161Change on PCP2
FY21Post AASB 16
Sales 1,308.8 16.9% 1,308.8
LFL sales growth 16.4%
Segment EBITDA 241.3 38.1% 315.7
EBITDA margin % 18.4% 2.8% 24.1%
Segment EBIT 192.7 42.8% 204.2
Segment EBIT margin %
14.7% 2.7% 15.6%
Segment normalised PBT
n/a n/a 192.3
Segment normalised PBT %
14.7%
11(1) Excludes AASB 16 Leases(2) Change measured on a pre AASB 16 Leases basis

S U P E R R E T A I L G R O U P
rebel
• Total sales growth of 15.3 per cent driven by like-for-like sales growth
• Like-for-like sales growth of 17.5 per cent1 was driven by increased transaction and higher average transaction value, due to increased items per transaction and higher average item value
• Online sales grew by 36 per cent to $193 million, representing 16 per cent of sales
• Like-for-like sales growth was achieved in all categories with performance sports delivering the strongest growth
• Football, basketball, licensed apparel and kids apparel were the fastest growing sub-categories. Fitness equipment and accessories also performed well as COVID-19 related lockdowns lifted at-home fitness activity
• Queensland, New South Wales and Western Australia delivered the strongest sales growth
• Gross margins increased due to lower promotional activity, sales mix to higher margin products and favourable net recovery of supply cost inflation
• Segment normalised PBT margin improved by 470bps to 13.9 per cent
• Active club membership increased to 3.2m and club member sales represented 68 per cent of rebel sales
• Rebel opened one store and closed eight stores resulting in 153 stores at period end
(1) Like-for-like sales growth was higher than sales growth due to store closures and closure of Infinite Retail(2) Excludes AASB 16 Leases(3) Change measured on a pre AASB 16 Leases basis
$mFY21
Pre AASB 162Change on PCP3
FY21Post AASB 16
Sales 1,197.0 15.3% 1,197.0
LFL sales growth1 17.5%
Segment EBITDA 206.1 62.8% 285.9
EBITDA margin % 17.2% 5.0% 23.9%
Segment EBIT 168.0 73.9% 180.0
Segment EBIT margin %
14.0% 4.7% 15.0%
Segment normalised PBT
n/a n/a 166.7
Segment normalised PBT %
13.9%
12

S U P E R R E T A I L G R O U P
BCF
• Total sales increased by 49.1 per cent driven by LFL sales growth
• Like-for-like sales increased by 48.0 per cent due to increased transactions and higher average transaction value
• Online sales grew by 90 per cent to $86 million, representing 11per cent of sales
• Boating, camping and fishing categories all grew strongly, reflecting elevated levels of domestic tourism and leisure activity
• Caravan, 4WD, camp shelter & bedding, barbeque, trailer, watersports, footwear and apparel were among the fastest growing sub-categories
• All states performed strongly, with Victoria and Western Australia delivering the strongest sales growth
• Gross margins increased due to lower promotional sales, reduced promotional and clearance depth and a favourable net recovery of supply cost inflation
• Segment normalised PBT margin improved by 930bps to 12.1 per cent driven by significant cost leverage
• Active club membership increased to 2m and club member sales represented 84 per cent of BCF sales
• BCF opened 3 stores resulting in 142 stores at period end
$mFY21
Pre AASB 161Change on PCP2
FY21Post AASB 16
Sales 797.7 49.1% 797.7
LFL sales growth 48.0%
Segment EBITDA 116.8 234.7% 167.1
EBITDA margin % 14.6% 8.1% 21.0%
Segment EBIT 95.9 510.8% 105.2
Segment EBIT margin %
12.0% 9.1% 13.2%
Segment normalised PBT
n/a n/a 96.4
Segment normalised PBT %
12.1%
(1) Excludes AASB 16 Leases (2) Change measured on a pre AASB 16 Leases basis
13

S U P E R R E T A I L G R O U P
Macpac
• Sales grew by 16.3 per cent as a result of a 14.2 per cent increase in like-for-like sales
• In Australia, like-for-like sales increased by 9.7 per cent despite restrictions on offshore travel, which impacted luggage, thermal and insulation sales, and Melbourne store closures due to COVID-19 lockdowns
• In New Zealand, like-for-like sales increased by 21.1 per cent despite a lack of inbound tourism and the closure of Auckland stores due to COVID-19 lockdowns
• Online sales grew by 38 per cent to $30 million, representing 21 per cent of sales
• Tents, sleeping bags and camping accessories were the fastest growing categories
• Strong second-half performance with H2 like-for-like sales growth of 31.8 per cent. Macpac stores sales benefited from increased brand awareness associated with the successful launch of Macpac product in rebel and BCF stores in the fourth quarter
• Gross margins recovered to FY19 levels due to increase average selling price, improvements in product sourcing costs and favourable FX
• Segment normalised PBT margin increased by 660bps to 11.0 per cent
• Active club membership increased to 0.5m and club members represented 66per cent of Macpac sales
• Macpac opened four stores resulting in 76 stores at period end
$mFY21
Pre AASB 161Change on PCP2
FY21Post AASB 16
Sales 153.4 16.3% 153.4
LFL sales growth 14.2%
Segment EBITDA 21.4 111.9% 35.7
EBITDA margin % 14.0% 6.3% 23.3%
Segment EBIT 17.4 141.7% 18.1
Segment EBIT margin %
11.3% 5.8% 11.8%
Segment normalised PBT
n/a n/a 16.9
Segment normalised PBT %
11.0%
(1) Excludes AASB 16 Leases(2) Change measured on a pre AASB 16 Leases basis
14

S U P E R R E T A I L G R O U P
FY22 trading and operating update
15
• COVID-19 lockdowns have adversely impacted trade in the first 16 weeks. Macpac has been particularly impacted by lockdowns in the key markets of NSW, Victoria, ACT and New Zealand which were more severe than in the previous corresponding period.
• Excluding the major impacted markets of NSW and Victoria, Group like-for-like sales in the first 16 weeks of FY22 were 6 per cent lower than FY21 and 27 per cent higher than FY20.
• Online sales have increased by 96 per cent and represent 30 per cent of Group sales, year to date. Click & Collect grew by 163 per cent, outpacing home delivery, and represented 59 per cent of online sales during this period.
• Gross margin improvements that were achieved in FY21 have been sustained in the first 16 weeks of FY22.
• The Group is well positioned for the key cyber and Christmas trading period with a fortified inventory position across all four of its core brands. The Group expects promotional activity to normalise over this period.
• Freight and logistic costs associated with elevated levels of inventory could impact future gross margin as the outlook for supply chain remains challenging.
• As indicated at its full year results announcement, the Group is undertaking investment in its customer loyalty and data and analytics capability. This multi-year program is underway. This is a significant investment that will impact operating expenses in the first half and beyond. Otherwise, in the first 16 weeks, operating expenses as a percentage of sales have normalised to H1 FY20 levels.
• The Group has a strong inventory position and is well placed to take advantage of the expected uplift in consumer demand in the auto, leisure and outdoor categories over the summer holiday period. .
(1) No adjustment has been made to LFL sales for COVID-19 related store closures. Given the impact of COVID-19 on FY21 sales, the Group has reported FY22 like-for-like sales against both FY21 and FY20 trading, to enable a comparison with non-COVID impacted trading conditions.
• Group like-for-like sales growth as at week 16LFL sales growth (%)1 LFL sales growth (%)1
(week 1 to 16) (week 1 to 16)versus FY21 versus FY20
Supercheap Auto (13) 5
rebel (10) 4
BCF (12) 38
Macpac (10) (10)
Group (12) 10

S U P E R R E T A I L G R O U P
This presentation was prepared by Super Retail Group Limited (ACN 108 676 204) (“SRG”). The
presentation is not an invitation or offer for subscription or purchase or recommendation of
securities. It does not consider the investment objectives, financial situation and particular
needs of an investor. Before making an investment in SRG, the investor or prospective investor
should consider whether such an investment is appropriate to their particular investment
needs, objectives and financial circumstance and consult an investment adviser if necessary.
Information, including forecast financial information and forward-looking statements, in this
presentation should not be considered a recommendation in relation to holding, purchasing or
selling shares in SRG. Due care has been used in the preparation of financial information.
However, actual results may vary from forecasts and any variation may be materially positive or
negative. Forecasts and forward-looking statements are by their very nature subject to
uncertainty and contingencies, many of which are outside the control of SRG. Past performance
is not an indication of future performance.
Disclaimer
16