asx | amn for personal use only
TRANSCRIPT

ASX | AMN
Investor PresentationMay 2016
For
per
sona
l use
onl
y

May 2016
Company Highlights
2
Our vision is to create a new potash export industry in Australia
Strategic focus on sulphate of potash (SOP) in Western Australia
SOP is premium potash fertilizer used for high-value crops
Supply shortage is an incentive for new primary (salt lake) production
Current prices are approx. US$700 per tonne
Mackay SOP Project, Western Australia (100% Agrimin)
Largest un-developed salt lake SOP Mineral Resource (drainable) in the world
Lake Mackay covers 3,500km2 and is a globally significant SOP asset
Potentially a multi-generational operation located in a safe and stable country
For
per
sona
l use
onl
y
May 2016
Corporate Snapshot
3
Key Personnel
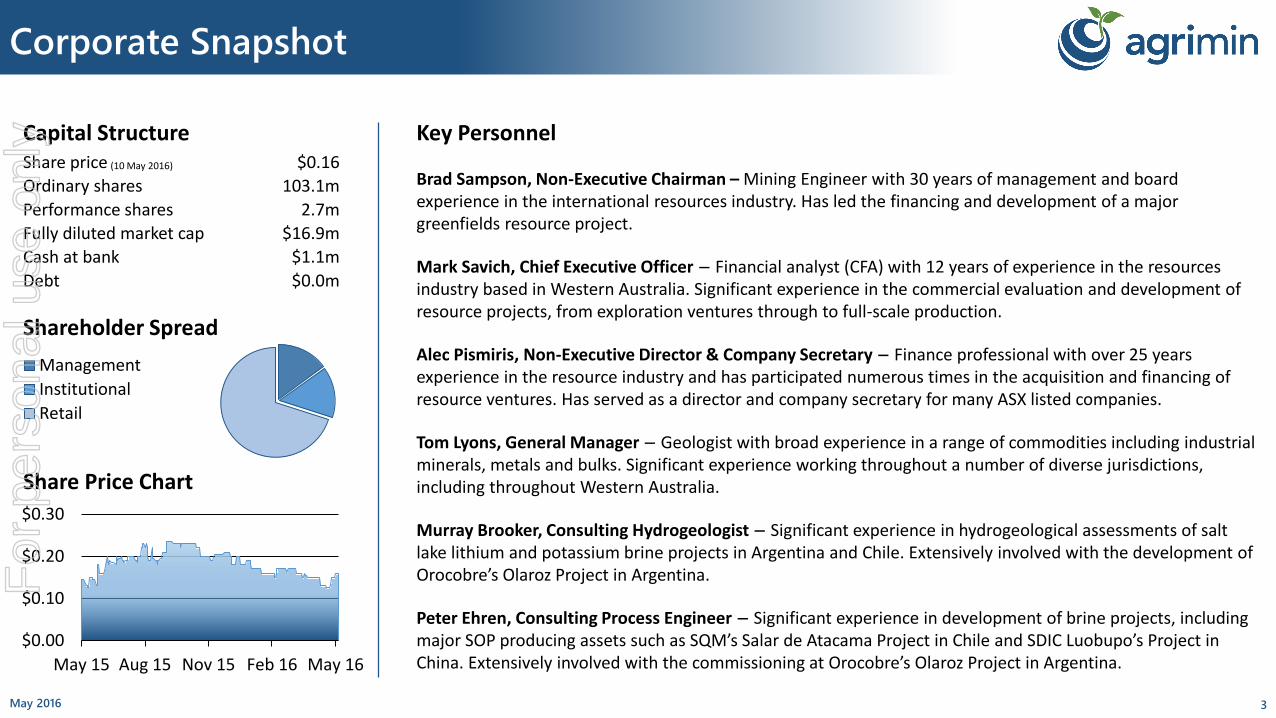
Brad Sampson, Non-Executive Chairman – Mining Engineer with 30 years of management and board experience in the international resources industry. Has led the financing and development of a major greenfields resource project.
Mark Savich, Chief Executive Officer – Financial analyst (CFA) with 12 years of experience in the resources industry based in Western Australia. Significant experience in the commercial evaluation and development of resource projects, from exploration ventures through to full-scale production.
Alec Pismiris, Non-Executive Director & Company Secretary – Finance professional with over 25 years experience in the resource industry and has participated numerous times in the acquisition and financing of resource ventures. Has served as a director and company secretary for many ASX listed companies.
Tom Lyons, General Manager – Geologist with broad experience in a range of commodities including industrial minerals, metals and bulks. Significant experience working throughout a number of diverse jurisdictions, including throughout Western Australia.
Murray Brooker, Consulting Hydrogeologist – Significant experience in hydrogeological assessments of salt lake lithium and potassium brine projects in Argentina and Chile. Extensively involved with the development of Orocobre’s Olaroz Project in Argentina.
Peter Ehren, Consulting Process Engineer – Significant experience in development of brine projects, including major SOP producing assets such as SQM’s Salar de Atacama Project in Chile and SDIC Luobupo’s Project in China. Extensively involved with the commissioning at Orocobre’s Olaroz Project in Argentina.
Capital StructureShare price (10 May 2016)
Ordinary shares
Performance shares
Fully diluted market cap
Cash at bank
Debt
Shareholder Spread
Share Price Chart
$0.16
103.1m
2.7m
$16.9m
$1.1m
$0.0m
Management
Institutional
Retail
$0.00
$0.10
$0.20
$0.30
May 15 Aug 15 Nov 15 Feb 16 May 16
For
per
sona
l use
onl
y

May 2016
Sulphate of Potash (SOP)
4
Orange without SOP Orange with SOP
Source: IC Potash Source: Bunnings Warehouse
A specialty potash fertilizer for high-value crops
Sulphate of potash (SOP) is used on crops such as fruits, vegetables and tree nuts
It improves the nutritional value, taste, appearance and shelf life of crops
Its use is essential for chloride-sensitive crops and has advantages in saline and arid soils
SOP contains almost no chloride, compared to muriate of potash (MOP) which contains 46% chloride
For
per
sona
l use
onl
y

May 2016
Potash Consumption
5
SOP market turnover is circa US$4 billion per annum
In 2015, global potash consumption was approx. 60Mt – including 54Mt of MOP (KCl) and 6Mt of SOP (K2SO4)
Primary production (i.e. salt lakes) currently accounts for 2.3Mtpa or 40% of global SOP production
More than half of global SOP production comes high-cost secondary sources, being the Mannheim Process and reacted salts
MOP
SOP
NOPSOPM
Total Potash Consumption(~56Mt per annum)
Primary SOP
Mannheim
Reacted Salts
SOP Installed Production Capacity(~7Mt per annum)
Source: Yara International
For
per
sona
l use
onl
y

May 2016
SOP Production
6
Industry Cash Cost Curve (2015) Top 10 SOP Producers
High-cost secondary production provides a price floor
Installed Production Capacity
For
per
sona
l use
onl
y

May 2016
Potash Prices
7
Source: CRU
SOP prices have decoupled from MOP prices
Prices for standard SOP products are currently trading at approx. US$700/t
Current weakness in MOP prices has had limited impact on SOP prices
Key supply and demand fundamentals support the current SOP price:
Price inelasticity: SOP demand is driven by high-value crops, where the cost of fertilizer has less of an impact on crop profitability
High marginal cost: SOP supply is reliant on secondary production (Mannheim Process) which has a high production cost and an unwanted hydrochloric acid by-product
Global SOP and MOP Prices
For
per
sona
l use
onl
y
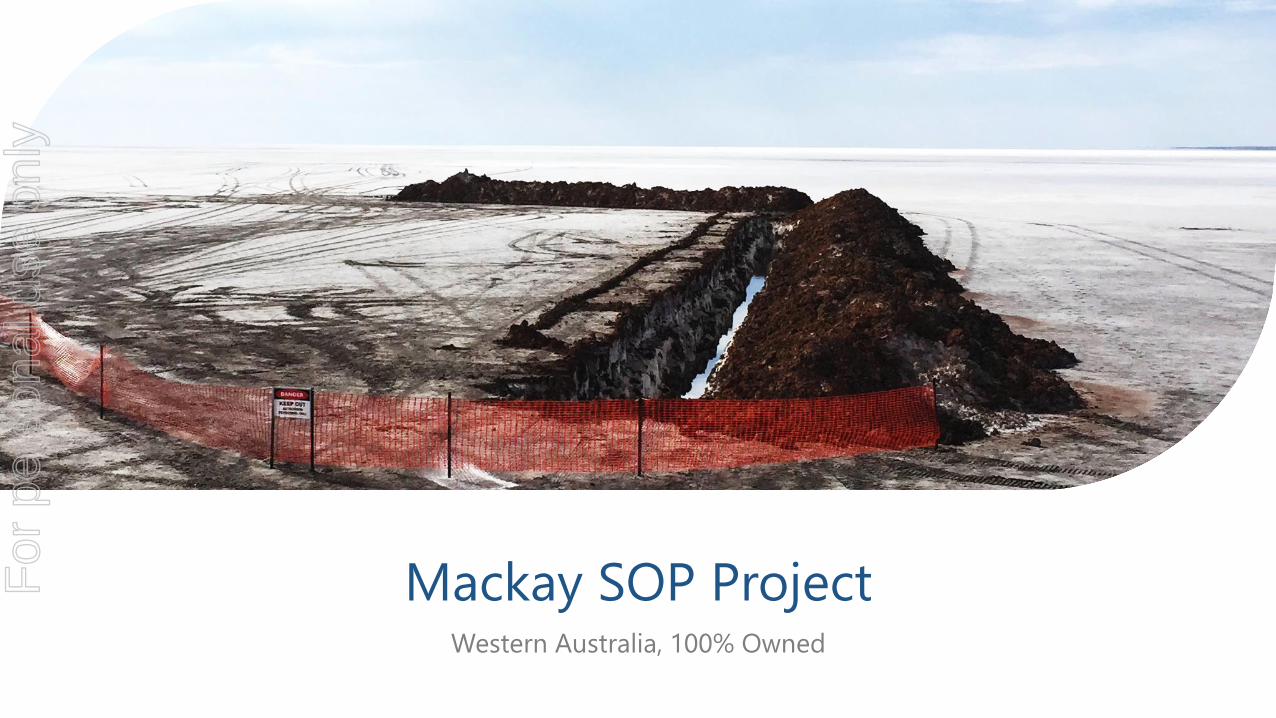
Mackay SOP ProjectWestern Australia, 100% Owned
For
per
sona
l use
onl
y

May 2016
Project Overview
9
Five 100% owned tenements in Western Australia
Extensive area of 2,294km2 spanning Lake Mackay
Tenements were granted in 2015
Land Access Agreement in place with Traditional Owners
Drainable Mineral Resources of 23.2Mt of SOP within 25m from surface
In-situ Mineral Resources of 164Mt of SOP and open at depth
Excellent net evaporation rate of approx. 3,400mm per annum
Transport infrastructure is in place and fit for haulage
Location Map
Road from Alice Springs to Kiwirrkurra
For
per
sona
l use
onl
y

May 2016
Competitive Advantages
10
Shallow brine and high flows for extraction
Suitable lakebed surface for evaporation ponds
Lake Mackay offers the key geological features needed for a potash brine operation
For
per
sona
l use
onl
y

May 2016
Geological Model
11
Lake Mackay consists of two flat lying units
Upper Zone (0 – 6m)
A unit of coarse gypsum sand of approx. 2m thick grading downward into sandy and silty clay, with significant sand, to depths beyond 6m
Lower Zone (6 – 25m)
A unit of predominantly clay intermixed with sands and silts, and interbedded layers of granular and crystalline gypsum
Lake Mackay deposit remains open at depth
Brine saturated sediments start from an average of 40cm below surface
A weathered sandstone/siltstone unit was intersected in some holes in the southwest, and elsewhere most holes remained open as drilling was limited to 30m due to rig capacity
Geological Model of Lake Mackay
For
per
sona
l use
onl
y

May 2016
Mineral Resources
12
Substantial and shallow Mineral Resources
Indicated and Inferred Mineral Resources of 44,088 gigalitres of brine at 3,603mg/L Potassium – based on specific yield (drainable porosity)
Indicated and Inferred Mineral Resources contain 23.2Mt of SOP
To a shallow average depth of only 24.7m and remain largely open at depth
Covering an area of 2,201km2 and do not incorporate any aquifer recharge
Based on data from 66 drill holes completed during the 2015 field program
Mineral Resources are compliant with the JORC Code (2012 Edition) and international standards for the reporting of brine resources and prepared by an independent geological consultancy
Mineral Resource Outline and Drill Collar Locations
For
per
sona
l use
onl
y

May 2016
Brine Extraction
13
Hydrogeological model supports large-scale flow rates
Preliminary hydrogeological modelling supports potential to yield large-scale quantities of brine to support commercial production
Lake Mackay is the end point of an enormous catchment area of approx. 87,000km2 and offers excellent recharge potential
Model base case produces continual brine flow at a steady state 2,150 L/sec based on a 250km trench network (average 5.5m depth) over an nominal 20 year mine life
Equates to a brine extraction rate of 68 gigalitres (or 68,000,000m3) per year
Model developed by independent hydrogeological consultancy and is based on data collected from field pump tests and laboratory testwork
Trench Design used in Hydrogeological Model
Field Pump Tests on Trenches
For
per
sona
l use
onl
y
May 2016
Example: Qarhan Salt Lake, China
14
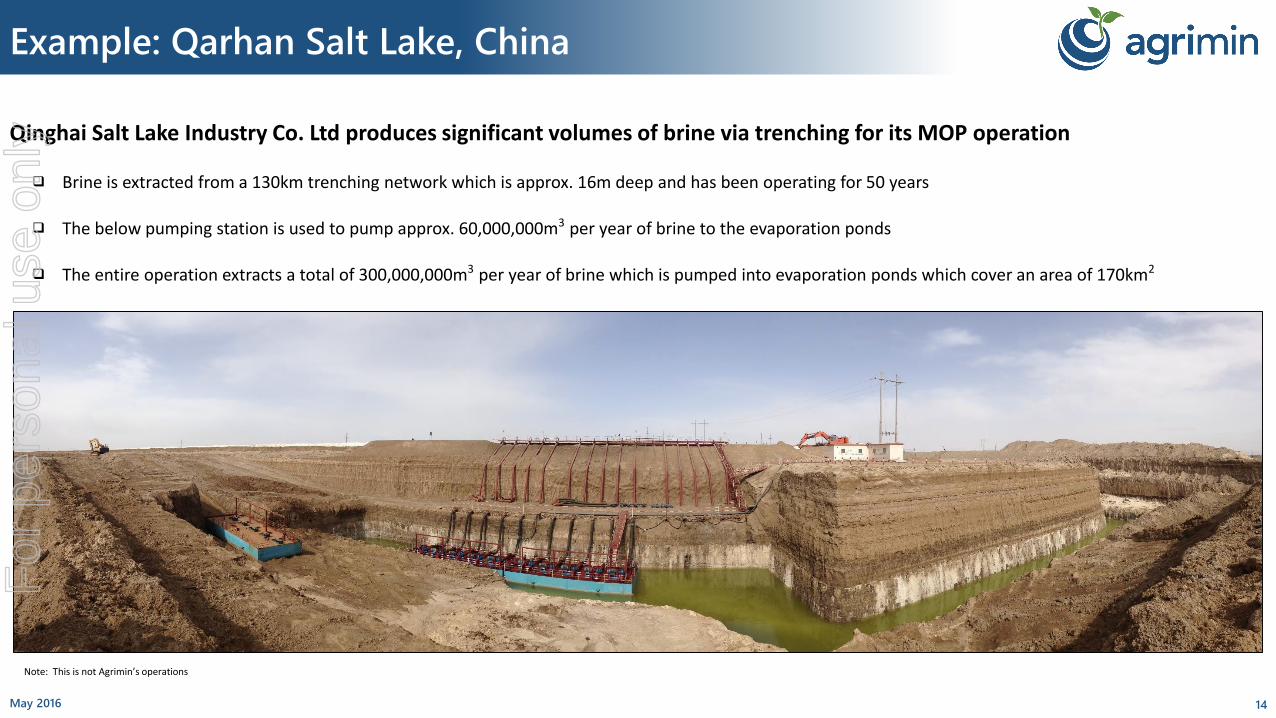
Note: This is not Agrimin’s operations
Qinghai Salt Lake Industry Co. Ltd produces significant volumes of brine via trenching for its MOP operation
Brine is extracted from a 130km trenching network which is approx. 16m deep and has been operating for 50 years
The below pumping station is used to pump approx. 60,000,000m3 per year of brine to the evaporation ponds
The entire operation extracts a total of 300,000,000m3 per year of brine which is pumped into evaporation ponds which cover an area of 170km2
For
per
sona
l use
onl
y

May 2016
Solar Evaporation Ponds
15
Geotechnical study confirms suitable conditions for large-scale ponds
Field investigations and laboratory testwork confirm suitable lakebed materials for un-lined ponds
Geotechnical study indicated that a simple cut-to-fill method can be used to construct pond walls
Preliminary pond design has an area of approx. 50km2, only 1.5% of Lake Mackay’s lakebed area
Sufficient lakebed area is available for subsequent low-cost lateral extension of ponds
Material Sample DescriptionDry Density
(t/m3)Moisture
Content (%)Permeability
(m/s)
In-situ Lakebed Silty clay (undisturbed) 1.37 32.2 3.2 x 10-08
Air Dried Lakebed Sandy clay (undisturbed) 1.49 30.7 1.4 x 10⁻¹⁰
Compacted Lakebed Sandy silty clay (disturbed) 1.78 16.0 -
Laboratory Permeability and Compaction Test Results
Silty Clay for Evaporation Ponds
For
per
sona
l use
onl
y

May 2016
Processing
16
Evaporation trial demonstrates brine suitability for conventional processing
Evaporation trial at an independent laboratory in Perth has been completed using a 460L brine sample (actual Lake Mackay brine – not synthetically modified in any way)
Trial successfully precipitated the targeted Potassium salts – Leonite and Kainite
Trial has provided an initial definition of the evaporation route of the Mackay Project brine
Further analyses of the harvested salts are pending and will be used for refinement of the current process flow diagram
Evaporation trial was a critical path item for the current Scoping Study which is now due for completion within 10 weeks
Average Brine Concentrations from Drilling
K
(mg/L)
Mg
(mg/L)
SO₄
(mg/L)
S.G.
(t/m3)
3,603 3,036 23,051 1.18
Evaporation Trial
Notes: Concentrations shown are the average from brine analyses from 27 aircore drill holes completed in 2015
For
per
sona
l use
onl
y
May 2016
Ideal Climate
17
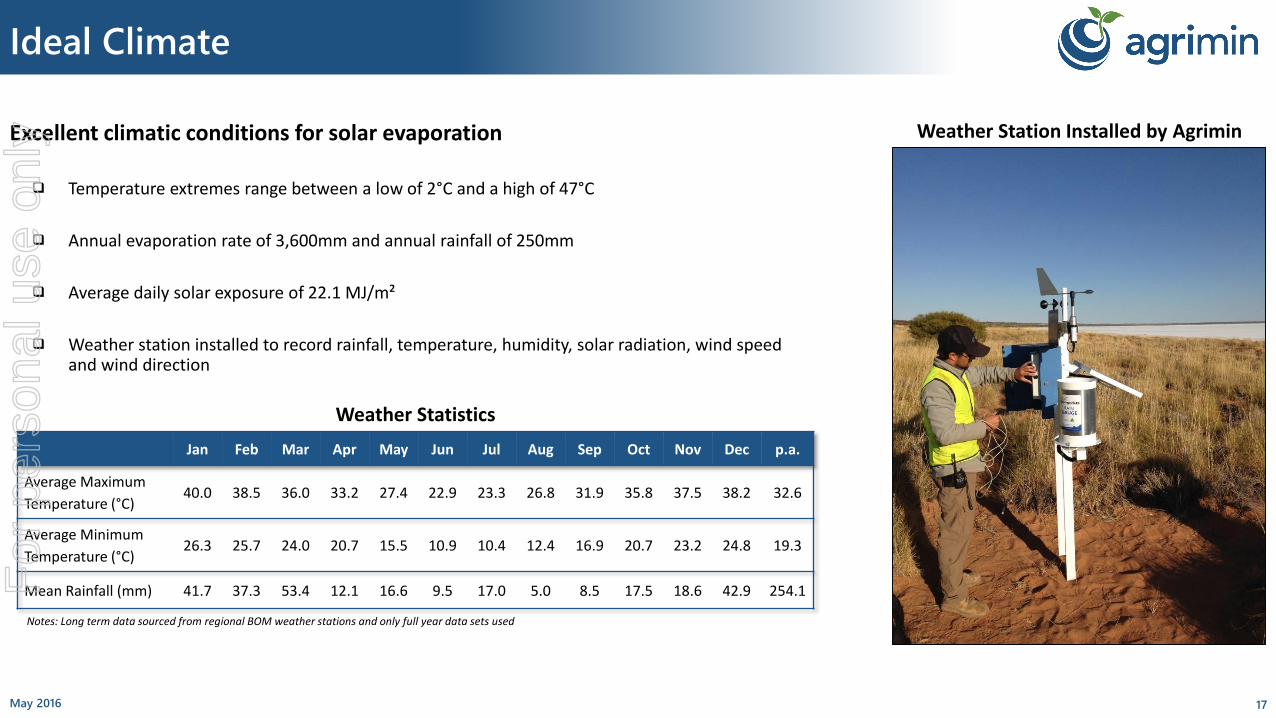
Jan Feb Mar Apr May Jun Jul Aug Sep Oct Nov Dec p.a.
Average Maximum
Temperature (°C)40.0 38.5 36.0 33.2 27.4 22.9 23.3 26.8 31.9 35.8 37.5 38.2 32.6
Average Minimum
Temperature (°C)26.3 25.7 24.0 20.7 15.5 10.9 10.4 12.4 16.9 20.7 23.2 24.8 19.3
Mean Rainfall (mm) 41.7 37.3 53.4 12.1 16.6 9.5 17.0 5.0 8.5 17.5 18.6 42.9 254.1
Excellent climatic conditions for solar evaporation
Temperature extremes range between a low of 2°C and a high of 47°C
Annual evaporation rate of 3,600mm and annual rainfall of 250mm
Average daily solar exposure of 22.1 MJ/m²
Weather station installed to record rainfall, temperature, humidity, solar radiation, wind speed and wind direction
Weather Station Installed by Agrimin
Weather Statistics
Notes: Long term data sourced from regional BOM weather stations and only full year data sets used
For
per
sona
l use
onl
y

May 2016
Example: Lake MacLeod Salt Mine, WA
18
Source: Rio Tinto (these are not Agrimin’s operations)
Trenches and solar evaporation ponds are currently used in WA
Collection trenches have been dug into Lake MacLeod and brine is pumped out at an average rate of 920 L/sec into an 8.5km transport channel
A total of 16.5km2 of solar evaporation ponds have been constructed on Lake MacLeod
For
per
sona
l use
onl
y

May 2016
Transport Infrastructure in Place
19
Transport Study confirms high-quality infrastructure
Road: Project is connected to Alice Springs via well-maintained sealed and unsealed roads which are used to transport fuel and supplies to communities
Rail: Alice Springs is connected to shipping terminals at Darwin via the Adelaide-to-Darwin railway. Bulk trains currently run between various mines and the Port of Darwin
Port: Port of Darwin caters for bulk carriers and comprises a bulk loading berth. Approx. 3.4Mt was shipped in 2014-15, mostly bulk mineral exports
Gary Junction Road at WA-NT Border Adelaide-to-Darwin Railway Port of Darwin
Map of Transport Corridor
For
per
sona
l use
onl
y
May 2016
Social Licence to Operate
20
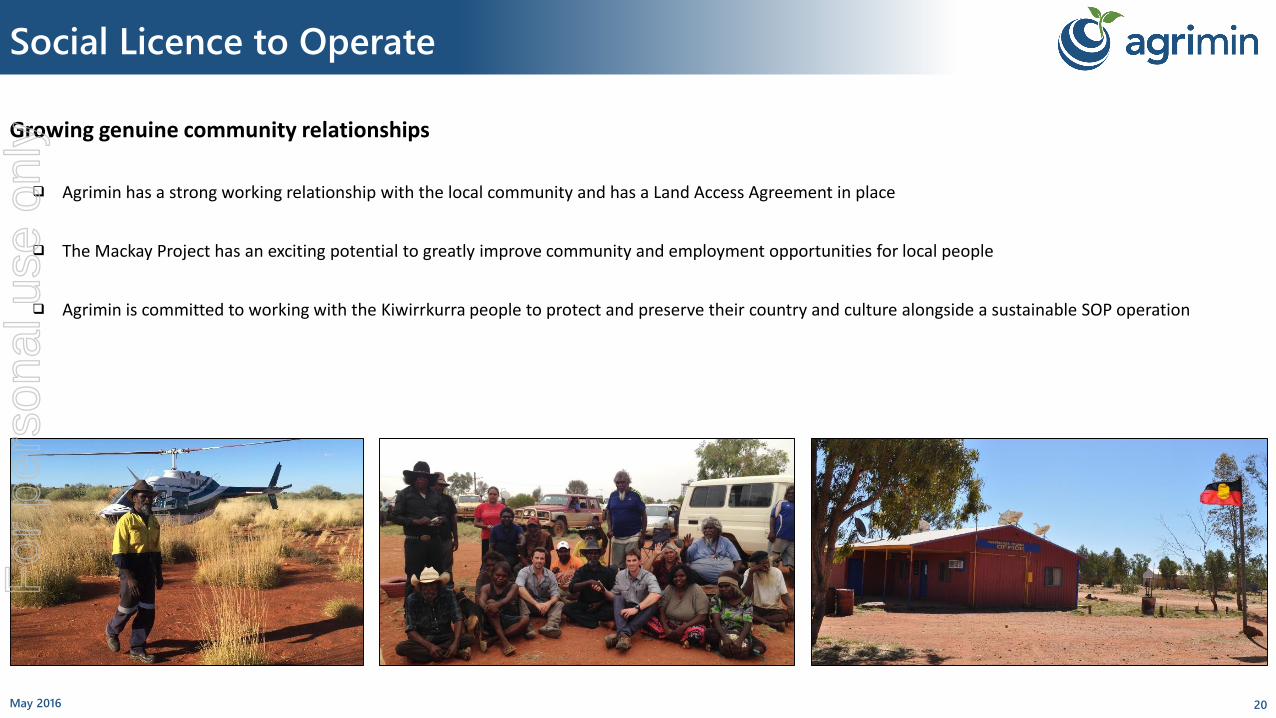
Growing genuine community relationships
Agrimin has a strong working relationship with the local community and has a Land Access Agreement in place
The Mackay Project has an exciting potential to greatly improve community and employment opportunities for local people
Agrimin is committed to working with the Kiwirrkurra people to protect and preserve their country and culture alongside a sustainable SOP operation
For
per
sona
l use
onl
y
May 2016
Benchmarking to Existing SOP Operations
21
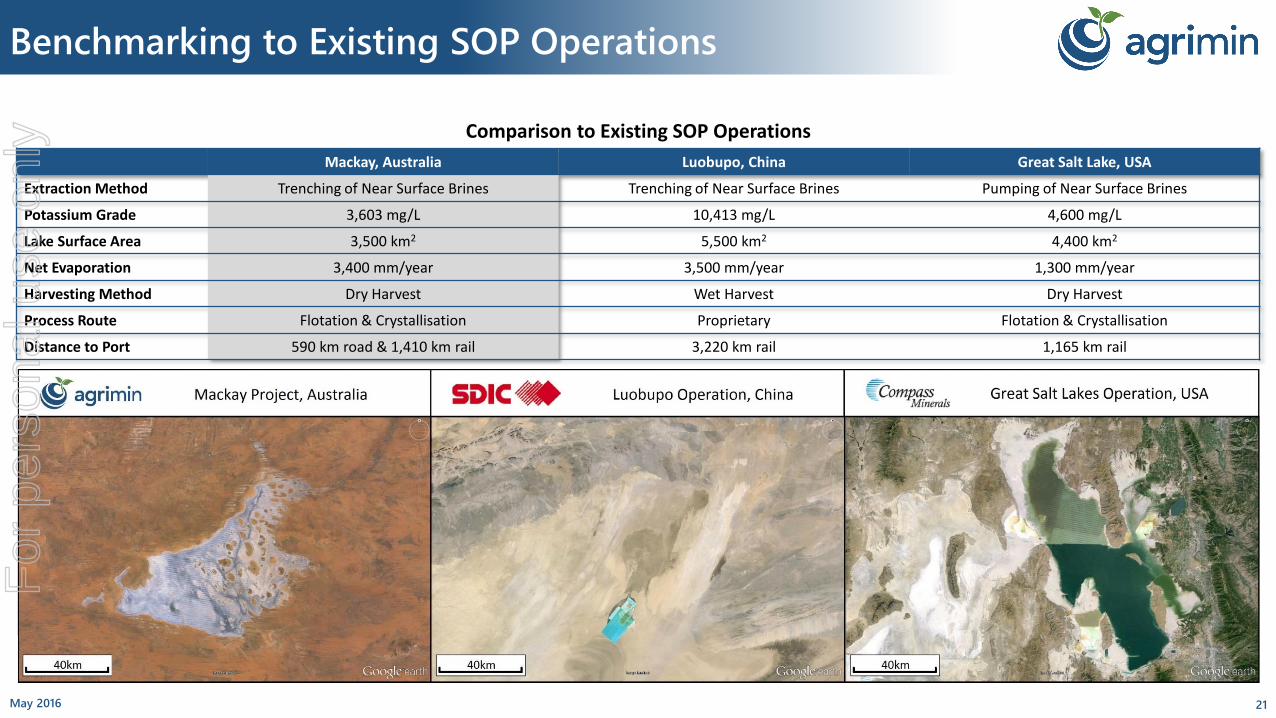
Mackay, Australia Luobupo, China Great Salt Lake, USA
Extraction Method Trenching of Near Surface Brines Trenching of Near Surface Brines Pumping of Near Surface Brines
Potassium Grade 3,603 mg/L 10,413 mg/L 4,600 mg/L
Lake Surface Area 3,500 km2 5,500 km2 4,400 km2
Net Evaporation 3,400 mm/year 3,500 mm/year 1,300 mm/year
Harvesting Method Dry Harvest Wet Harvest Dry Harvest
Process Route Flotation & Crystallisation Proprietary Flotation & Crystallisation
Distance to Port 590 km road & 1,410 km rail 3,220 km rail 1,165 km rail
Comparison to Existing SOP Operations
For
per
sona
l use
onl
y

May 2016
Summary
22
Agrimin’s competitive advantages:
Shallow and drainable SOP Mineral Resources
Flow rates for large-scale brine extraction via trenching
Geotechnical conditions for un-lined evaporation ponds
Brine chemistry for conventional processing routes
Climatic conditions for high solar evaporation rates
Supportive local community
The Mackay Project is a unique and globally significant SOP asset and the current SOP supply shortage and prevailing price provides an excellent window of opportunity for AgriminF
or p
erso
nal u
se o
nly
May 2016
Important Information
23
Important InformationThis presentation has been prepared as a summary only, and does not contain all information about Agrimin Limited’s (“Agrimin” or “the Company”) assets and liabilities, financial position and performance,profits and losses, prospects, and the rights and liabilities attaching to Agrmin’s securities. The securities issued by Agrimin are considered speculative and there is no guarantee that they will make a return on thecapital invested, that dividends will be paid on the shares or that there will be an increase in the value of the shares in the future. Agrimin does not purport to give financial or investment advice. No account hasbeen taken of the objectives, financial situation or needs of any recipient of this report. Recipients of this report should carefully consider whether the securities issued by Agrimin are an appropriate investmentfor them in light of their personal circumstances, including their financial and taxation position.
Forward Looking StatementsSome of the statements contained in this report are forward looking statements. Forward looking statements include but are not limited to, statements concerning estimates of potash tonnages, expected costs,statements relating to the continued advancement of Agrimin’s projects and other statements which are not historical facts. When used in this report, and on other published information of Agrimin, the wordssuch as “aim”, “could”, “estimate”, “expect”, “intend”, “may”, “potential”, “should” and similar expressions are forward-looking statements. Although Agrimin believes that its expectations reflected in theforward-looking statements are reasonable, such statements involve risk and uncertainties and no assurance can be given that actual results will be consistent with these forward-looking statements. Variousfactors could cause actual results to differ from these forward looking statements include the potential that Agrimin’s projects may experience technical, geological, metallurgical and mechanical problems,changes in product prices and other risks not anticipated by Agrimin.
Competent Person’s StatementThe information in this statement that relates to the Mineral Resource Estimate of December 2015 and to Exploration Results for the Mackay Project is based on information compiled or reviewed by Mr MurrayBrooker who is a full-time employee of Hydrominex Geoscience Pty Ltd. Mr Brooker is a geologist and hydrogeologist and is an independent consultant to Agrimin. Mr Brooker is a Member of the AustralianInstitute of Geoscientists and has sufficient experience, which is relevant to the style of mineralisation and type of deposit under consideration, and to the activity he is undertaking, to qualify as a CompetentPerson in terms of the ‘Australasian Code for Reporting of Exploration Results, Mineral Resources and Ore Reserves’ (JORC Code 2012 Edition). Mr Brooker consents to the inclusion of such information in thisstatement in the form and context in which it appears.
The information in this statement that relates to Mineral Processing for the Mackay Project is based on information compiled or reviewed by Mr Peter Ehren who is a full-time employee of Process andEnvironmental Consultancy (Ehren-González Limitada). Mr Ehren is a Mineral Process Engineer and is an independent consultant to Agrimin. Mr Ehren is a Member of the Australasian Institute of Mining andMetallurgy and has sufficient experience, which is relevant to the style of mineralisation and type of deposit under consideration, and to the activity he is undertaking, to qualify as a Competent Person in terms ofthe ‘Australasian Code for Reporting of Exploration Results, Mineral Resources and Ore Reserves’ (JORC Code 2012 Edition). Mr Ehren consents to the inclusion of such information in this statement in the formand context in which it appears.
For
per
sona
l use
onl
y
Registered Office Further Information
Level 7, BGC Centre, 28 The Esplanade Mark Savich
Perth, Western Australia 6000 Chief Executive Officer
Australia M: +61 402 746 757
For
per
sona
l use
onl
y

May 2016
Mineral Resources
25
Category Zone Depth (m) Volume (M m3) Average Total Porosity SOP Grade (kg/m3) Contained SOP (Mt)
Indicated Upper 0.4 – 2.7 4,036 45.0% 8.41 15.0
Inferred Upper 0.4 – 6.0 7,047 45.0% 8.25 26.0
Inferred Lower 6.0 – 24.7 33,004 45.0% 8.23 122.0
Total Upper & Lower 0.4 – 24.7 44,088 45.0% 8.25 164.0
Mineral Resources – Total Porosity
Notes:
1. Average depth of drilling was 24.7m, however the estimation extends to 30.0mwhere drilling reached this depth
2. Water table is at 0.4m below surface
3. Potassium grades are converted to SOP using a conversion factor of 2.23
4. Resource to 2.7m depth is 89% Indicated. The remaining 11% to 2.7m is Inferred. Resource from 2.7 – 6.0m is all Inferred
5. The resource in this table supersedes the previous resource and exploration target announced in November 2014
6. Errors are due to rounding
Category Zone Depth (m) Volume (M m3) Average Specific Yield SOP Grade (kg/m3) Contained SOP (Mt)
Indicated Upper 0.4 – 2.7 4,036 12.5% 8.41 4.3
Inferred Upper 0.4 – 6.0 7,047 9.4% 8.25 5.5
Total Upper 0.4 – 6.0 11,083 10.5% 8.31 9.7
Inferred Lower 6.0 – 24.7 33,004 5.0% 8.23 13.6
Total Upper & Lower 0.4 – 24.7 44,088 6.0% 8.25 23.2
Mineral Resources – Specific Yield
For
per
sona
l use
onl
y