aswath damodaran156 measuring investment returns aswath damodaran stern school of business
TRANSCRIPT
Aswath Damodaran 1
Measuring Investment Returns
Aswath Damodaran
Stern School of Business
Aswath Damodaran 2
First Principles
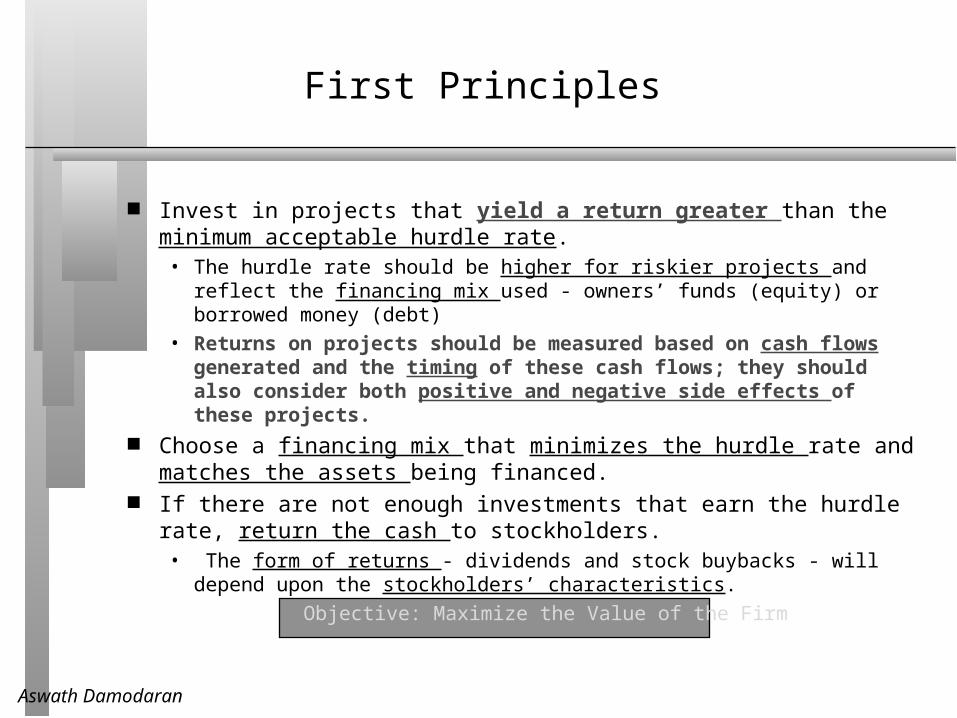
Invest in projects that yield a return greater than the minimum acceptable hurdle rate.
• The hurdle rate should be higher for riskier projects and reflect the financing mix used - owners’ funds (equity) or borrowed money (debt)
• Returns on projects should be measured based on cash flows generated and the timing of these cash flows; they should also consider both positive and negative side effects of these projects.
Choose a financing mix that minimizes the hurdle rate and matches the assets being financed.
If there are not enough investments that earn the hurdle rate, return the cash to stockholders.
• The form of returns - dividends and stock buybacks - will depend upon the stockholders’ characteristics.
Objective: Maximize the Value of the Firm
Aswath Damodaran 3
Measures of return: earnings versus cash flows
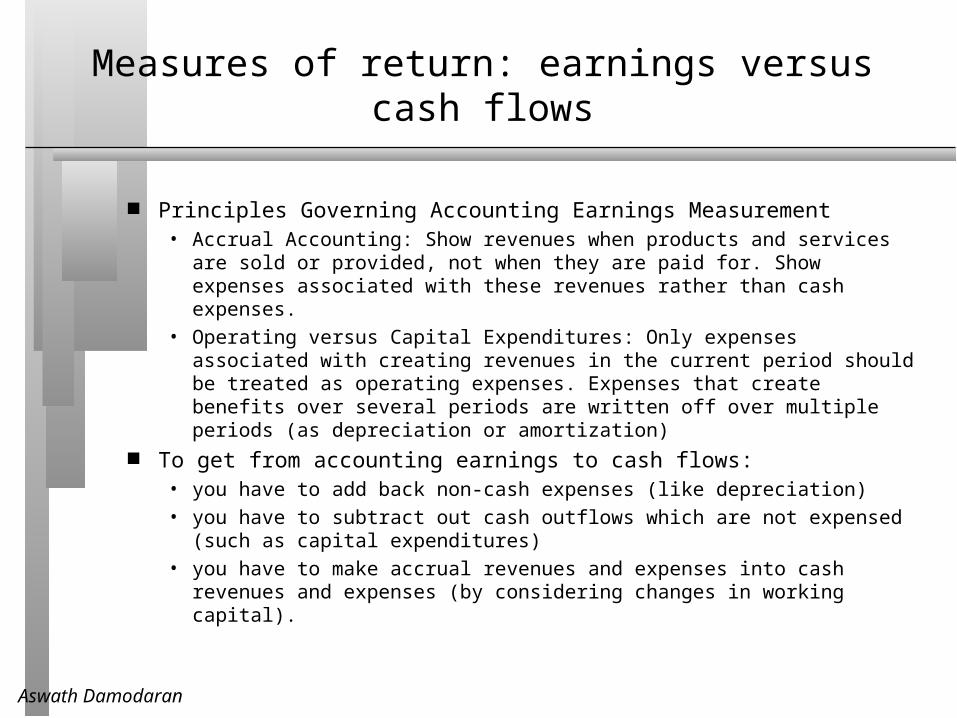
Principles Governing Accounting Earnings Measurement• Accrual Accounting: Show revenues when products and services are sold
or provided, not when they are paid for. Show expenses associated with these revenues rather than cash expenses.
• Operating versus Capital Expenditures: Only expenses associated with creating revenues in the current period should be treated as operating expenses. Expenses that create benefits over several periods are written off over multiple periods (as depreciation or amortization)
To get from accounting earnings to cash flows:• you have to add back non-cash expenses (like depreciation)
• you have to subtract out cash outflows which are not expensed (such as capital expenditures)
• you have to make accrual revenues and expenses into cash revenues and expenses (by considering changes in working capital).
Aswath Damodaran 4
Measuring Returns Right: The Basic Principles
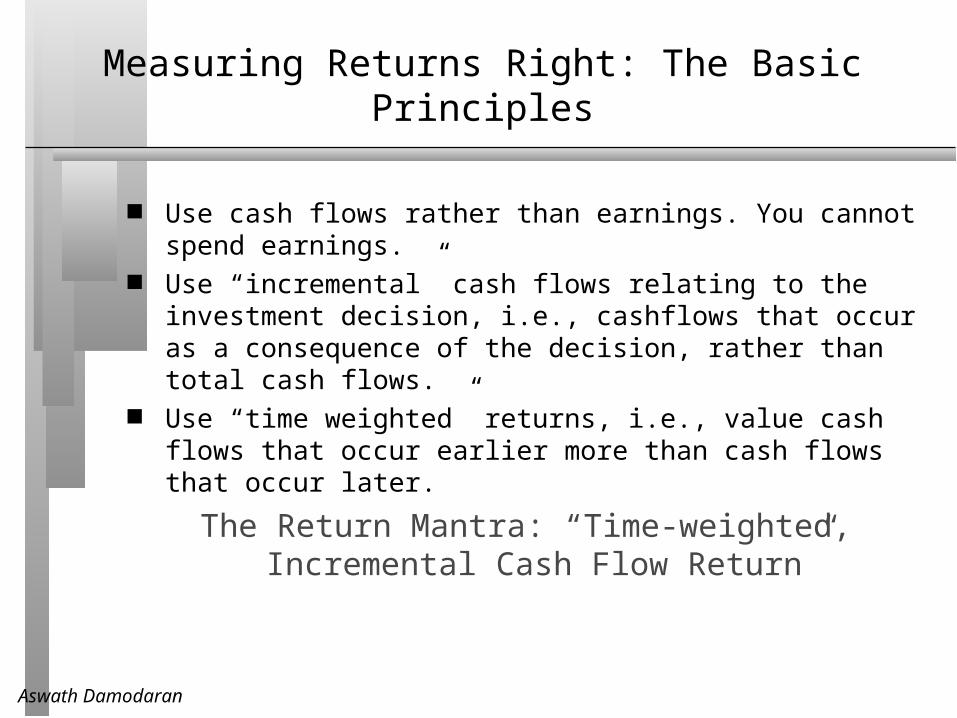
Use cash flows rather than earnings. You cannot spend earnings. Use “incremental” cash flows relating to the investment decision, i.e.,
cashflows that occur as a consequence of the decision, rather than total cash flows.
Use “time weighted” returns, i.e., value cash flows that occur earlier more than cash flows that occur later.
The Return Mantra: “Time-weighted, Incremental Cash Flow Return”
Aswath Damodaran 5
Earnings versus Cash Flows: A Disney Theme Park
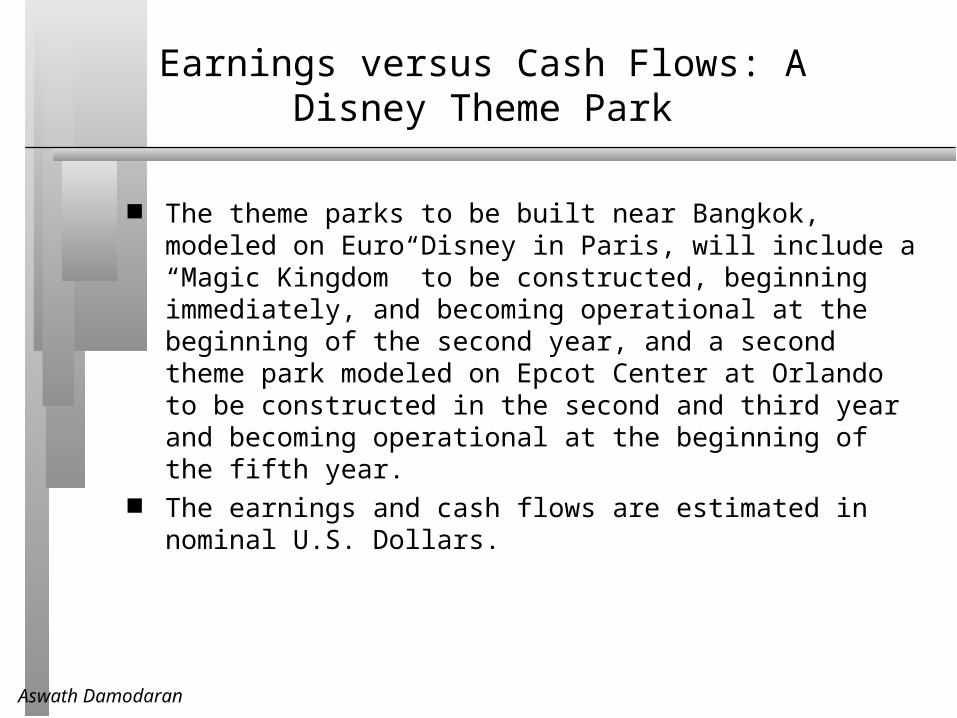
The theme parks to be built near Bangkok, modeled on Euro Disney in Paris, will include a “Magic Kingdom” to be constructed, beginning immediately, and becoming operational at the beginning of the second year, and a second theme park modeled on Epcot Center at Orlando to be constructed in the second and third year and becoming operational at the beginning of the fifth year.
The earnings and cash flows are estimated in nominal U.S. Dollars.
Aswath Damodaran 6
Key Assumptions on Start Up and Construction
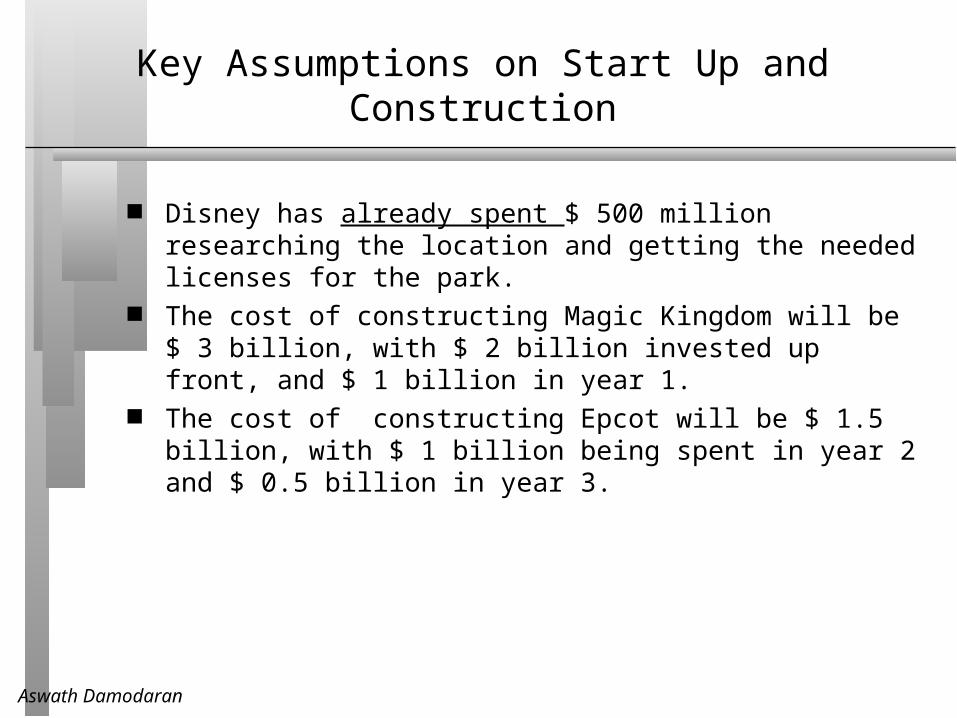
Disney has already spent $ 500 million researching the location and getting the needed licenses for the park.
The cost of constructing Magic Kingdom will be $ 3 billion, with $ 2 billion invested up front, and $ 1 billion in year 1.
The cost of constructing Epcot will be $ 1.5 billion, with $ 1 billion being spent in year 2 and $ 0.5 billion in year 3.
Aswath Damodaran 7
Key Revenue Assumptions
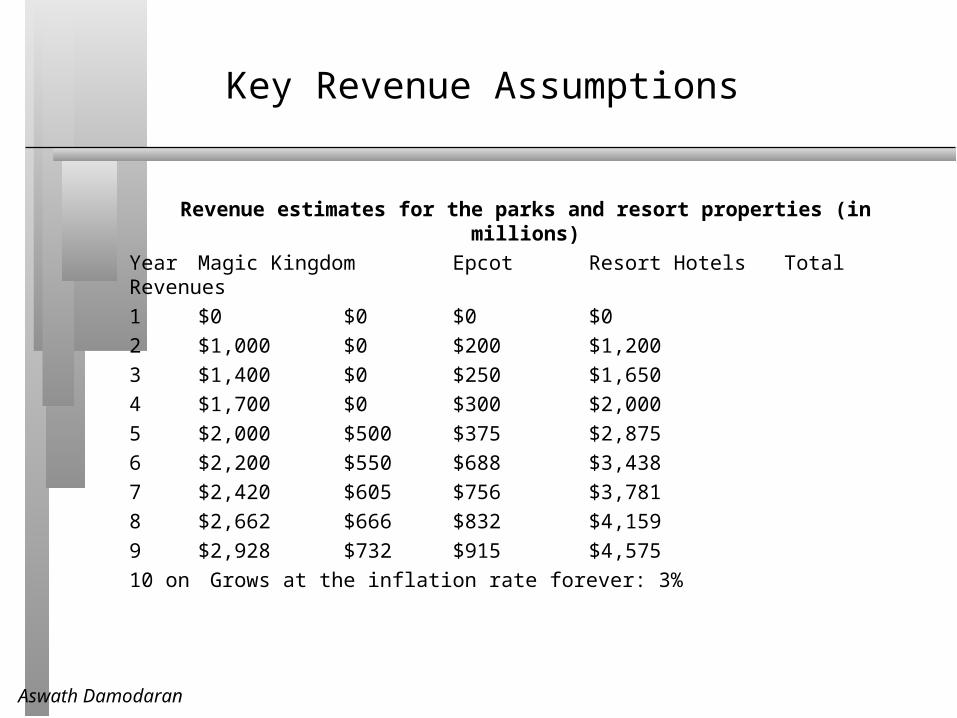
Revenue estimates for the parks and resort properties (in millions)
Year Magic Kingdom Epcot Resort Hotels Total Revenues
1 $0 $0 $0 $0
2 $1,000 $0 $200 $1,200
3 $1,400 $0 $250 $1,650
4 $1,700 $0 $300 $2,000
5 $2,000 $500 $375 $2,875
6 $2,200 $550 $688 $3,438
7 $2,420 $605 $756 $3,781
8 $2,662 $666 $832 $4,159
9 $2,928 $732 $915 $4,575
10 on Grows at the inflation rate forever: 3%
Aswath Damodaran 8
Key Expense Assumptions
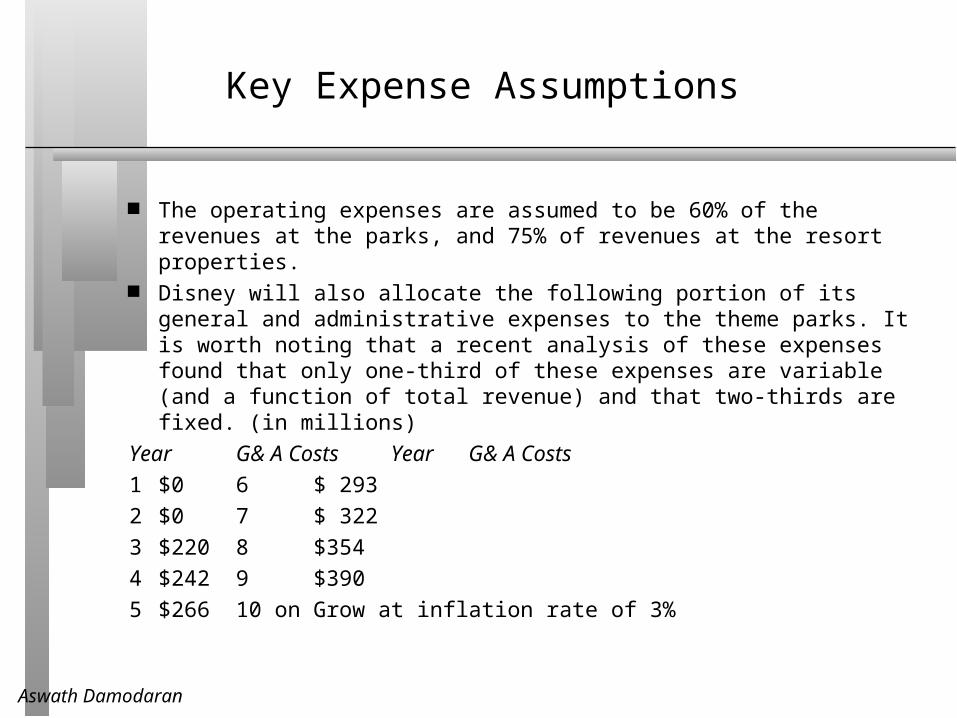
The operating expenses are assumed to be 60% of the revenues at the parks, and 75% of revenues at the resort properties.
Disney will also allocate the following portion of its general and administrative expenses to the theme parks. It is worth noting that a recent analysis of these expenses found that only one-third of these expenses are variable (and a function of total revenue) and that two-thirds are fixed. (in millions)
Year G& A Costs Year G& A Costs
1 $0 6 $ 293
2 $0 7 $ 322
3 $220 8 $354
4 $242 9 $390
5 $266 10 on Grow at inflation rate of 3%
Aswath Damodaran 9
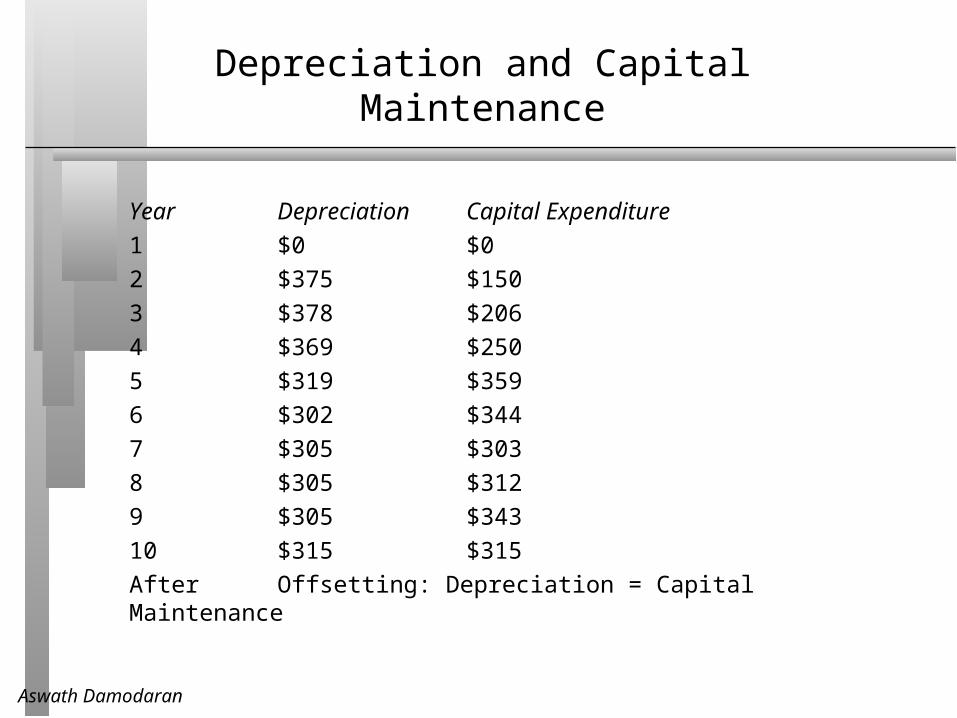
Depreciation and Capital Maintenance
Year Depreciation Capital Expenditure
1 $0 $0
2 $375 $150
3 $378 $206
4 $369 $250
5 $319 $359
6 $302 $344
7 $305 $303
8 $305 $312
9 $305 $343
10 $315 $315
After Offsetting: Depreciation = Capital Maintenance
Aswath Damodaran 10
Other Assumptions
Disney will have to maintain net working capital (primarily consisting of inventory at the theme parks and the resort properties, netted against accounts payable) of 5% of revenues, with the investments in working capital being made at the beginning of each year.
The income from the investment will be taxed at a marginal tax rate of 36%.
Aswath Damodaran 11
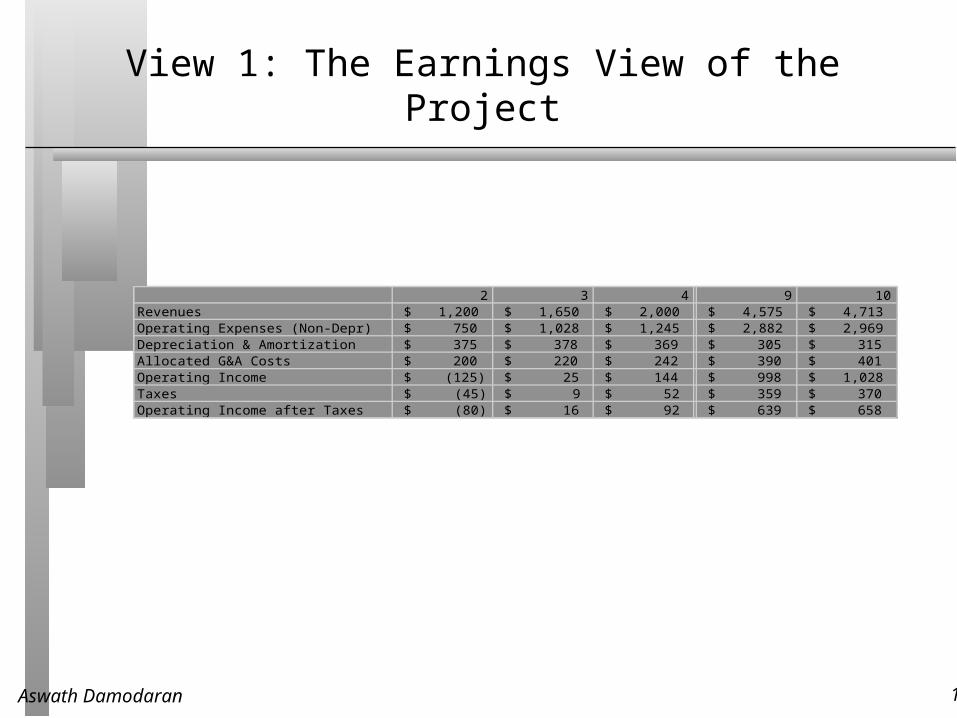
View 1: The Earnings View of the Project
2 3 4 9 10Revenues 1,200$ 1,650$ 2,000$ 4,575$ 4,713$ Operating Expenses (Non-Depr) 750$ 1,028$ 1,245$ 2,882$ 2,969$ Depreciation & Amortization 375$ 378$ 369$ 305$ 315$ Allocated G&A Costs 200$ 220$ 242$ 390$ 401$ Operating Income (125)$ 25$ 144$ 998$ 1,028$ Taxes (45)$ 9$ 52$ 359$ 370$ Operating Income after Taxes (80)$ 16$ 92$ 639$ 658$
Aswath Damodaran 12
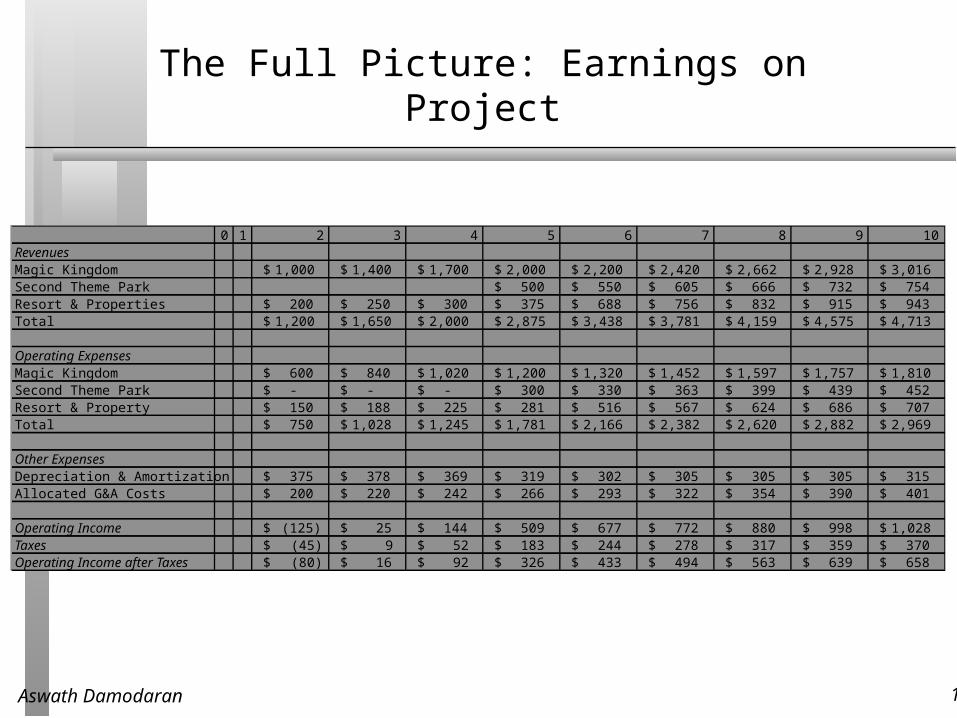
The Full Picture: Earnings on Project
0 1 2 3 4 5 6 7 8 9 10RevenuesMagic Kingdom 1,000$ 1,400$ 1,700$ 2,000$ 2,200$ 2,420$ 2,662$ 2,928$ 3,016$ Second Theme Park 500$ 550$ 605$ 666$ 732$ 754$ Resort & Properties 200$ 250$ 300$ 375$ 688$ 756$ 832$ 915$ 943$ Total 1,200$ 1,650$ 2,000$ 2,875$ 3,438$ 3,781$ 4,159$ 4,575$ 4,713$
Operating ExpensesMagic Kingdom 600$ 840$ 1,020$ 1,200$ 1,320$ 1,452$ 1,597$ 1,757$ 1,810$ Second Theme Park -$ -$ -$ 300$ 330$ 363$ 399$ 439$ 452$ Resort & Property 150$ 188$ 225$ 281$ 516$ 567$ 624$ 686$ 707$ Total 750$ 1,028$ 1,245$ 1,781$ 2,166$ 2,382$ 2,620$ 2,882$ 2,969$
Other ExpensesDepreciation & Amortization 375$ 378$ 369$ 319$ 302$ 305$ 305$ 305$ 315$ Allocated G&A Costs 200$ 220$ 242$ 266$ 293$ 322$ 354$ 390$ 401$
Operating Income (125)$ 25$ 144$ 509$ 677$ 772$ 880$ 998$ 1,028$ Taxes (45)$ 9$ 52$ 183$ 244$ 278$ 317$ 359$ 370$ Operating Income after Taxes (80)$ 16$ 92$ 326$ 433$ 494$ 563$ 639$ 658$
Aswath Damodaran 13
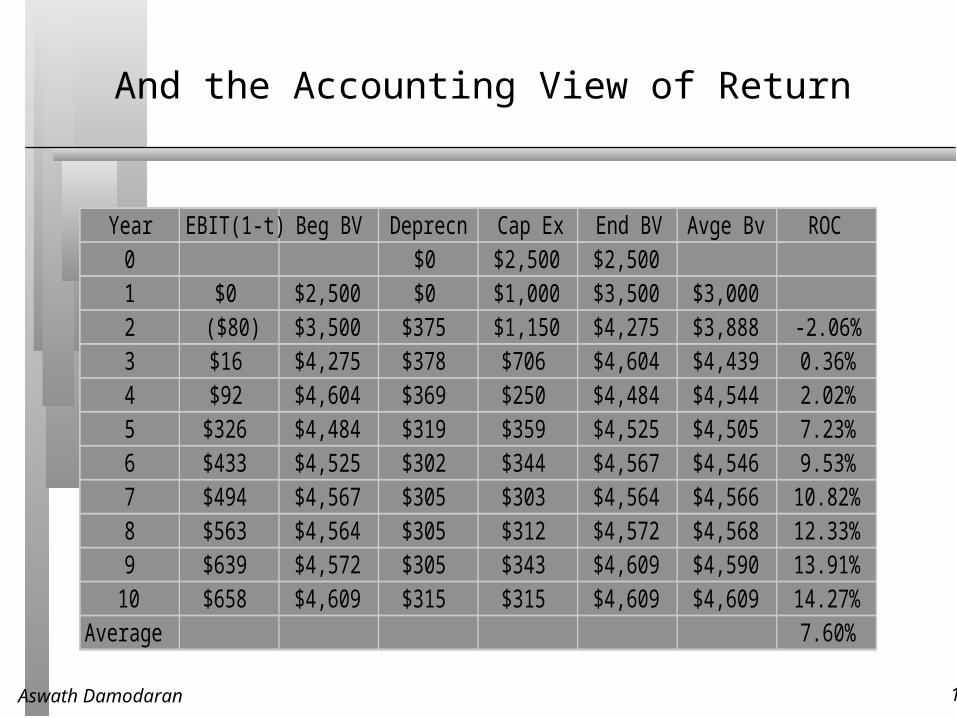
And the Accounting View of Return
Year EBIT(1-t) Beg BV Deprecn Cap Ex End BV Avge Bv ROC0 $0 $2,500 $2,5001 $0 $2,500 $0 $1,000 $3,500 $3,0002 ($80) $3,500 $375 $1,150 $4,275 $3,888 -2.06%3 $16 $4,275 $378 $706 $4,604 $4,439 0.36%4 $92 $4,604 $369 $250 $4,484 $4,544 2.02%5 $326 $4,484 $319 $359 $4,525 $4,505 7.23%6 $433 $4,525 $302 $344 $4,567 $4,546 9.53%7 $494 $4,567 $305 $303 $4,564 $4,566 10.82%8 $563 $4,564 $305 $312 $4,572 $4,568 12.33%9 $639 $4,572 $305 $343 $4,609 $4,590 13.91%
10 $658 $4,609 $315 $315 $4,609 $4,609 14.27%Average 7.60%
Aswath Damodaran 14
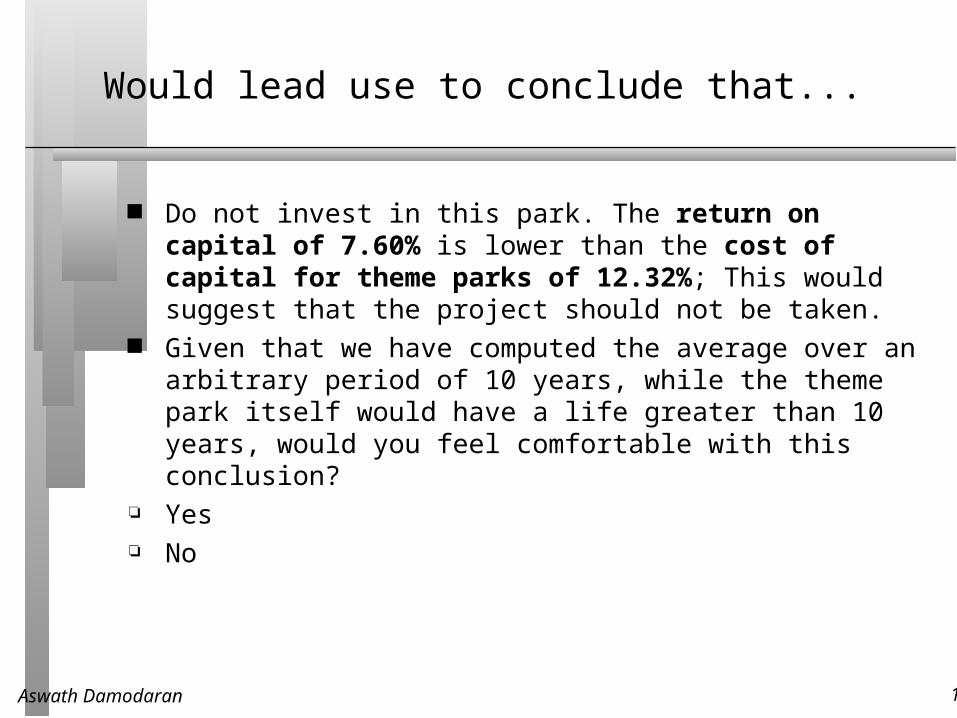
Would lead use to conclude that...
Do not invest in this park. The return on capital of 7.60% is lower than the cost of capital for theme parks of 12.32%; This would suggest that the project should not be taken.
Given that we have computed the average over an arbitrary period of 10 years, while the theme park itself would have a life greater than 10 years, would you feel comfortable with this conclusion?
Yes No
Aswath Damodaran 15
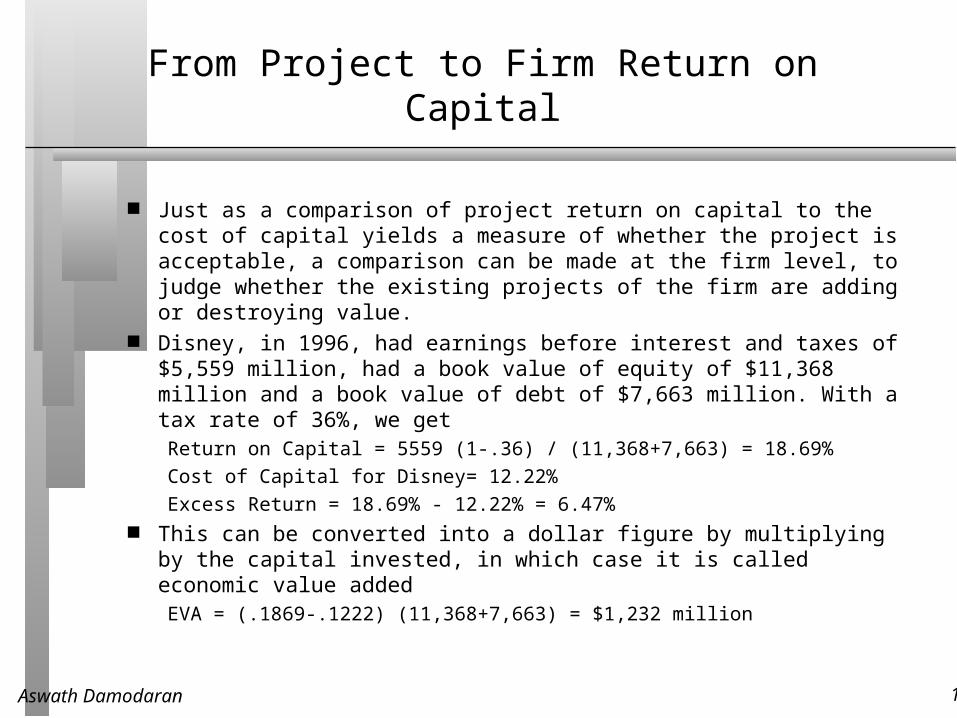
From Project to Firm Return on Capital
Just as a comparison of project return on capital to the cost of capital yields a measure of whether the project is acceptable, a comparison can be made at the firm level, to judge whether the existing projects of the firm are adding or destroying value.
Disney, in 1996, had earnings before interest and taxes of $5,559 million, had a book value of equity of $11,368 million and a book value of debt of $7,663 million. With a tax rate of 36%, we getReturn on Capital = 5559 (1-.36) / (11,368+7,663) = 18.69%
Cost of Capital for Disney= 12.22%
Excess Return = 18.69% - 12.22% = 6.47% This can be converted into a dollar figure by multiplying by the capital
invested, in which case it is called economic value addedEVA = (.1869-.1222) (11,368+7,663) = $1,232 million
Aswath Damodaran 16
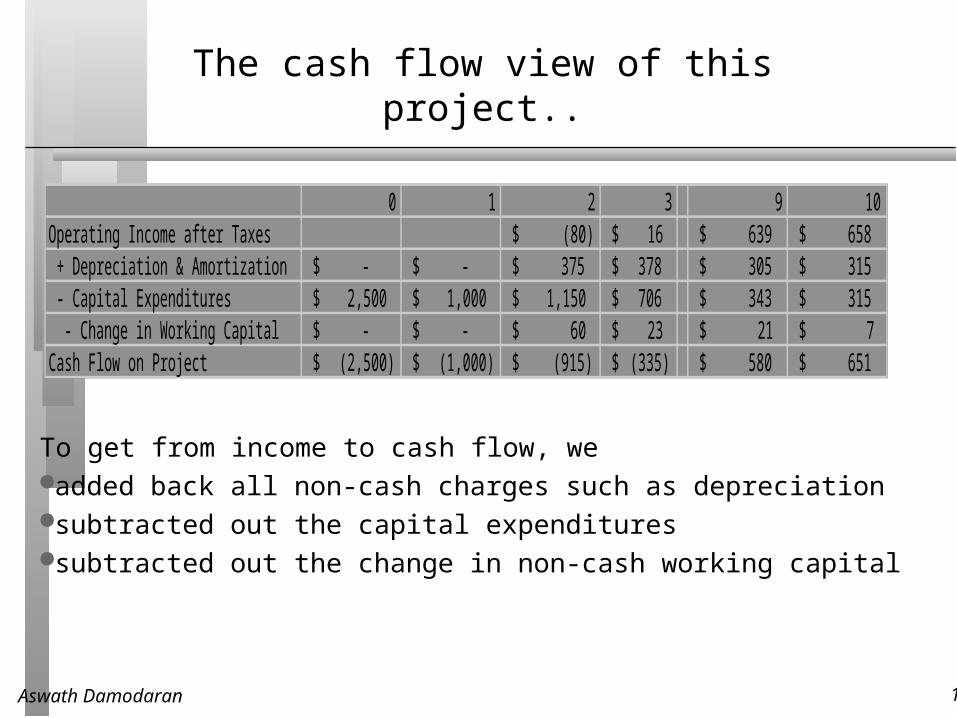
The cash flow view of this project..
• 0 1 2 3 9 10Operating Income after Taxes (80)$ 16$ 639$ 658$ + Depreciation & Amortization -$ -$ 375$ 378$ 305$ 315$ - Capital Expenditures 2,500$ 1,000$ 1,150$ 706$ 343$ 315$ - Change in Working Capital -$ -$ 60$ 23$ 21$ 7$
Cash Flow on Project (2,500)$ (1,000)$ (915)$ (335)$ 580$ 651$
To get from income to cash flow, weadded back all non-cash charges such as depreciationsubtracted out the capital expendituressubtracted out the change in non-cash working capital
Aswath Damodaran 17
The Depreciation Tax Benefit
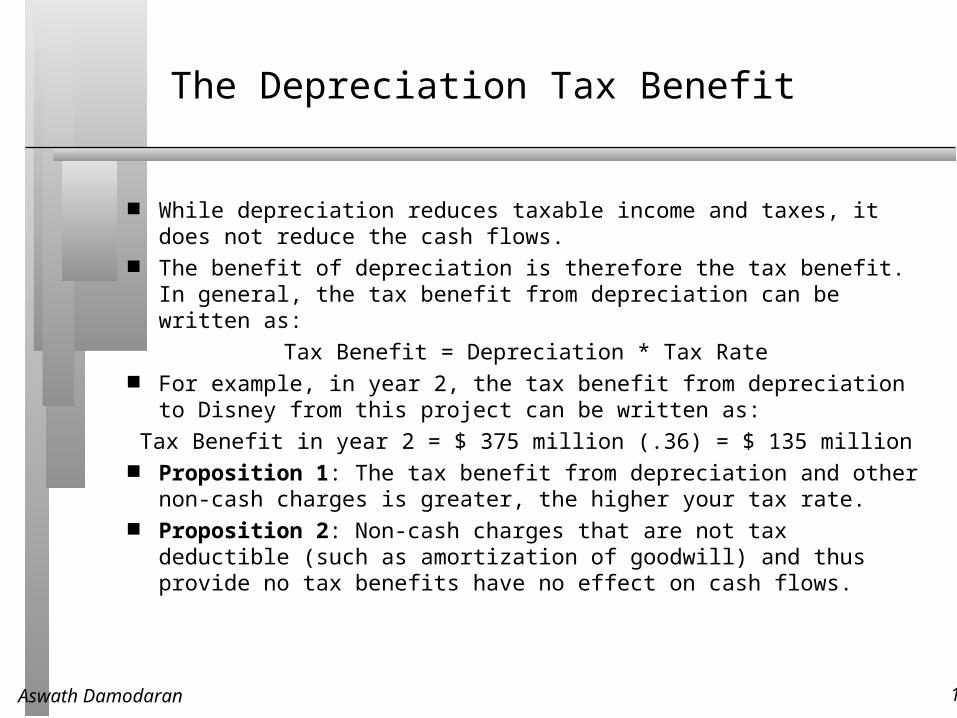
While depreciation reduces taxable income and taxes, it does not reduce the cash flows.
The benefit of depreciation is therefore the tax benefit. In general, the tax benefit from depreciation can be written as:
Tax Benefit = Depreciation * Tax Rate For example, in year 2, the tax benefit from depreciation to Disney from
this project can be written as:
Tax Benefit in year 2 = $ 375 million (.36) = $ 135 million Proposition 1: The tax benefit from depreciation and other non-cash
charges is greater, the higher your tax rate. Proposition 2: Non-cash charges that are not tax deductible (such as
amortization of goodwill) and thus provide no tax benefits have no effect on cash flows.
Aswath Damodaran 18
Depreciation Methods
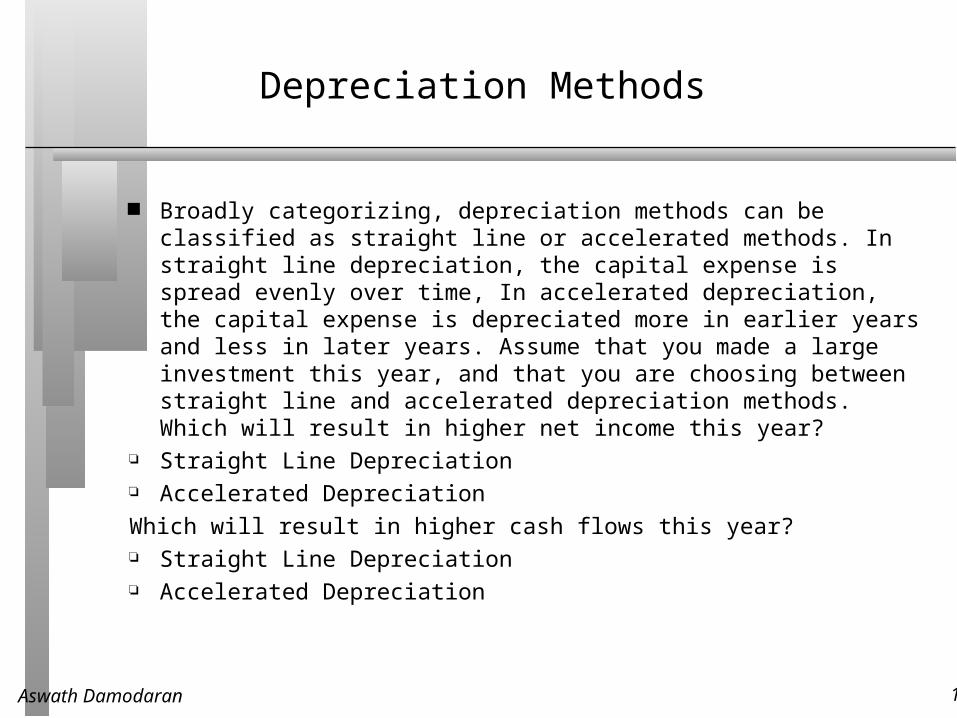
Broadly categorizing, depreciation methods can be classified as straight line or accelerated methods. In straight line depreciation, the capital expense is spread evenly over time, In accelerated depreciation, the capital expense is depreciated more in earlier years and less in later years. Assume that you made a large investment this year, and that you are choosing between straight line and accelerated depreciation methods. Which will result in higher net income this year?
Straight Line Depreciation Accelerated Depreciation
Which will result in higher cash flows this year? Straight Line Depreciation Accelerated Depreciation
Aswath Damodaran 19
The Capital Expenditures Effect
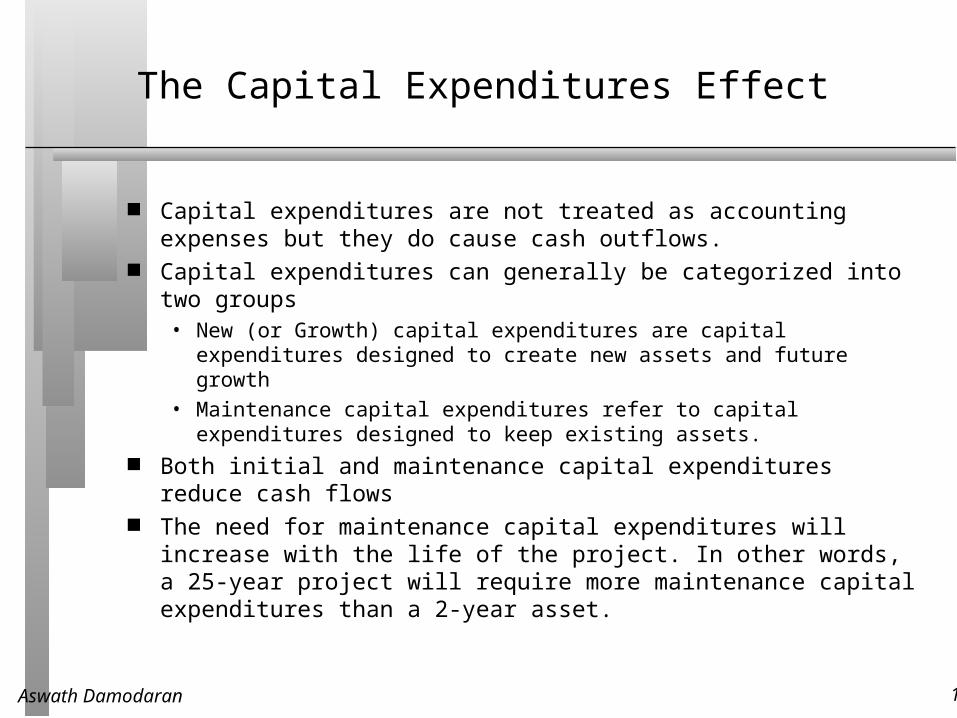
Capital expenditures are not treated as accounting expenses but they do cause cash outflows.
Capital expenditures can generally be categorized into two groups• New (or Growth) capital expenditures are capital expenditures designed
to create new assets and future growth
• Maintenance capital expenditures refer to capital expenditures designed to keep existing assets.
Both initial and maintenance capital expenditures reduce cash flows The need for maintenance capital expenditures will increase with the
life of the project. In other words, a 25-year project will require more maintenance capital expenditures than a 2-year asset.
Aswath Damodaran 20
To cap ex or not to cap ex
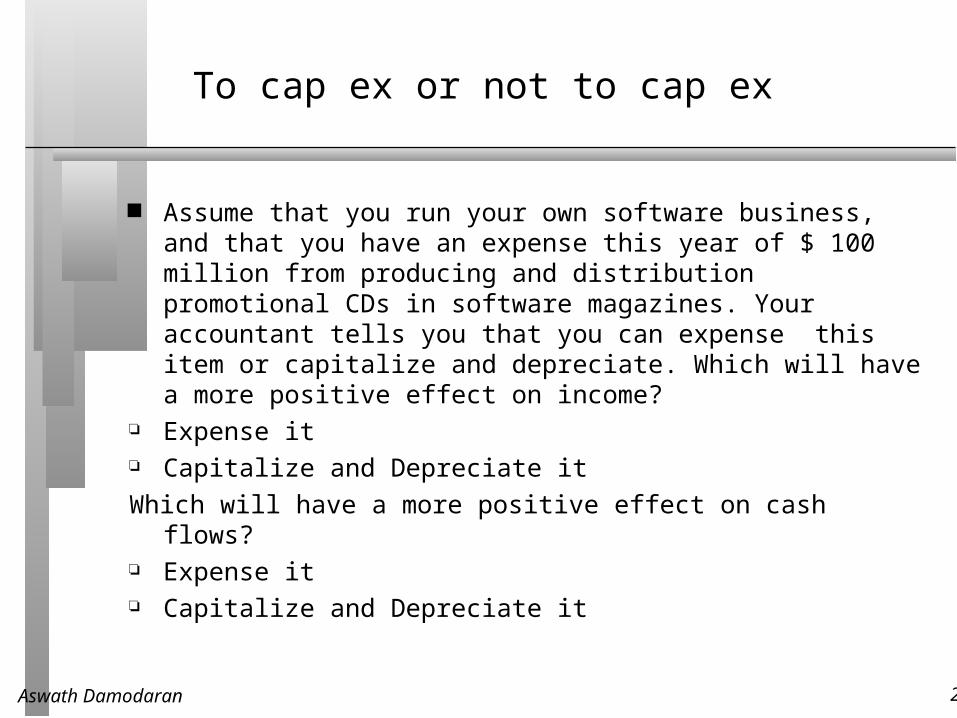
Assume that you run your own software business, and that you have an expense this year of $ 100 million from producing and distribution promotional CDs in software magazines. Your accountant tells you that you can expense this item or capitalize and depreciate. Which will have a more positive effect on income?
Expense it Capitalize and Depreciate it
Which will have a more positive effect on cash flows? Expense it Capitalize and Depreciate it
Aswath Damodaran 21
The Working Capital Effect
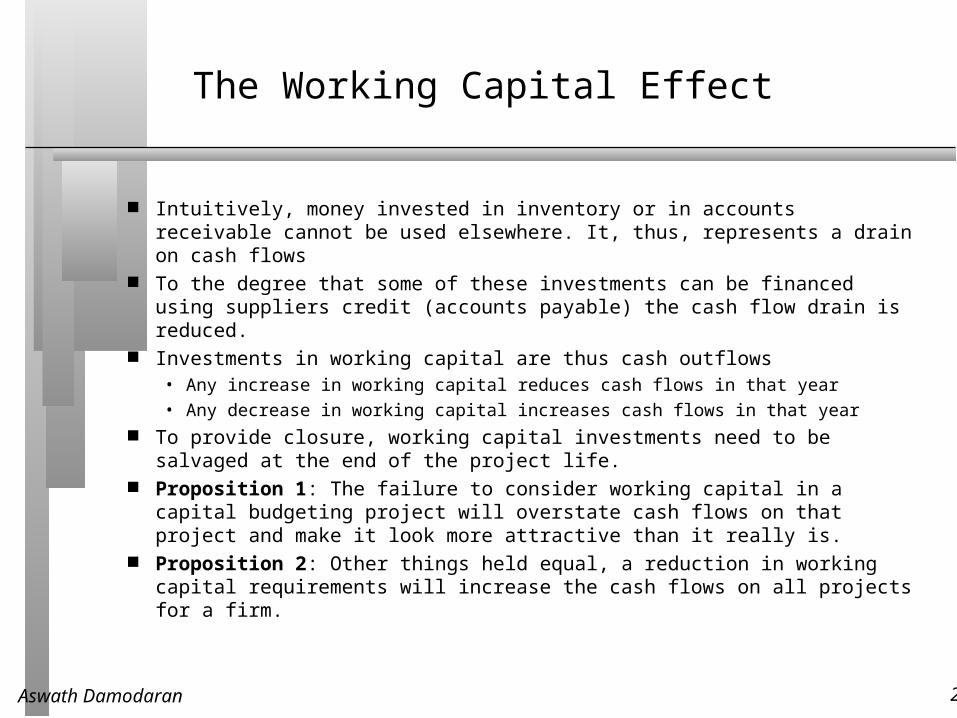
Intuitively, money invested in inventory or in accounts receivable cannot be used elsewhere. It, thus, represents a drain on cash flows
To the degree that some of these investments can be financed using suppliers credit (accounts payable) the cash flow drain is reduced.
Investments in working capital are thus cash outflows• Any increase in working capital reduces cash flows in that year• Any decrease in working capital increases cash flows in that year
To provide closure, working capital investments need to be salvaged at the end of the project life.
Proposition 1: The failure to consider working capital in a capital budgeting project will overstate cash flows on that project and make it look more attractive than it really is.
Proposition 2: Other things held equal, a reduction in working capital requirements will increase the cash flows on all projects for a firm.
Aswath Damodaran 22
The incremental cash flows on the project
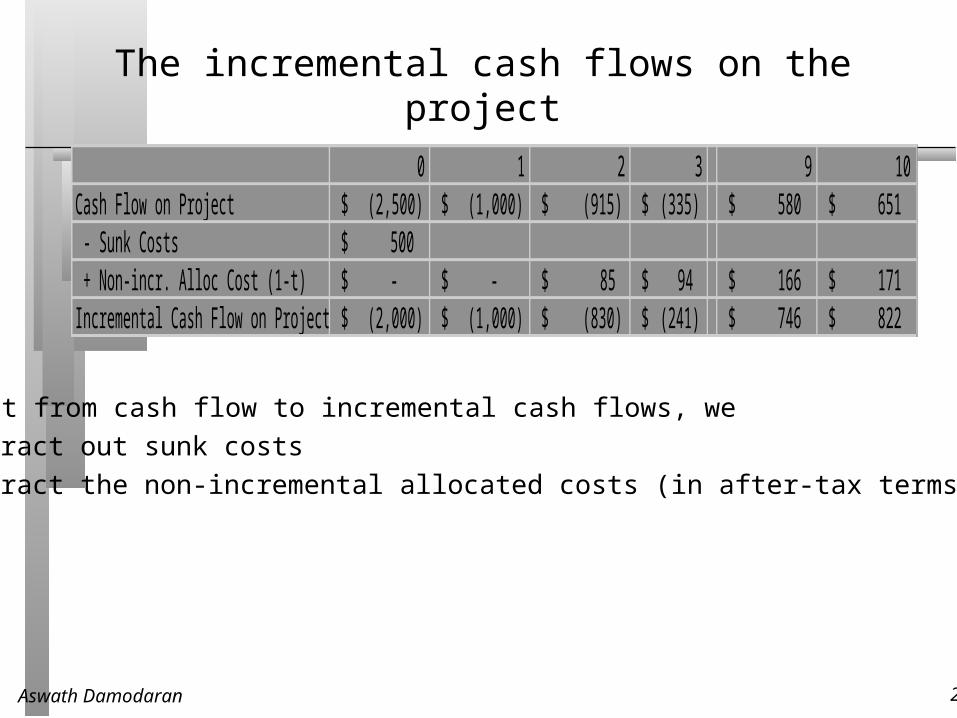
0 1 2 3 9 10Cash Flow on Project (2,500)$ (1,000)$ (915)$ (335)$ 580$ 651$ - Sunk Costs 500$ + Non-incr. Alloc Cost (1-t) -$ -$ 85$ 94$ 166$ 171$ Incremental Cash Flow on Project (2,000)$ (1,000)$ (830)$ (241)$ 746$ 822$
To get from cash flow to incremental cash flows, wesubtract out sunk costssubtract the non-incremental allocated costs (in after-tax terms)
Aswath Damodaran 23
Sunk Costs
Any expenditure that has already been incurred, and cannot be recovered (even if a project is rejected) is called a sunk cost
When analyzing a project, sunk costs should not be considered since they are incremental
By this definition, market testing expenses and R&D expenses are both likely to be sunk costs before the projects that are based upon them are analyzed. If sunk costs are not considered in project analysis, how can a firm ensure that these costs are covered?
Aswath Damodaran 24
Allocated Costs
Firms allocate costs to individual projects from a centralized pool (such as general and administrative expenses) based upon some characteristic of the project (sales is a common choice)
For large firms, these allocated costs can result in the rejection of projects
To the degree that these costs are not incremental (and would exist anyway), this makes the firm worse off.
Thus, it is only the incremental component of allocated costs that should show up in project analysis.
How, looking at these pooled expenses, do we know how much of the costs are fixed and how much are variable?
Aswath Damodaran 25
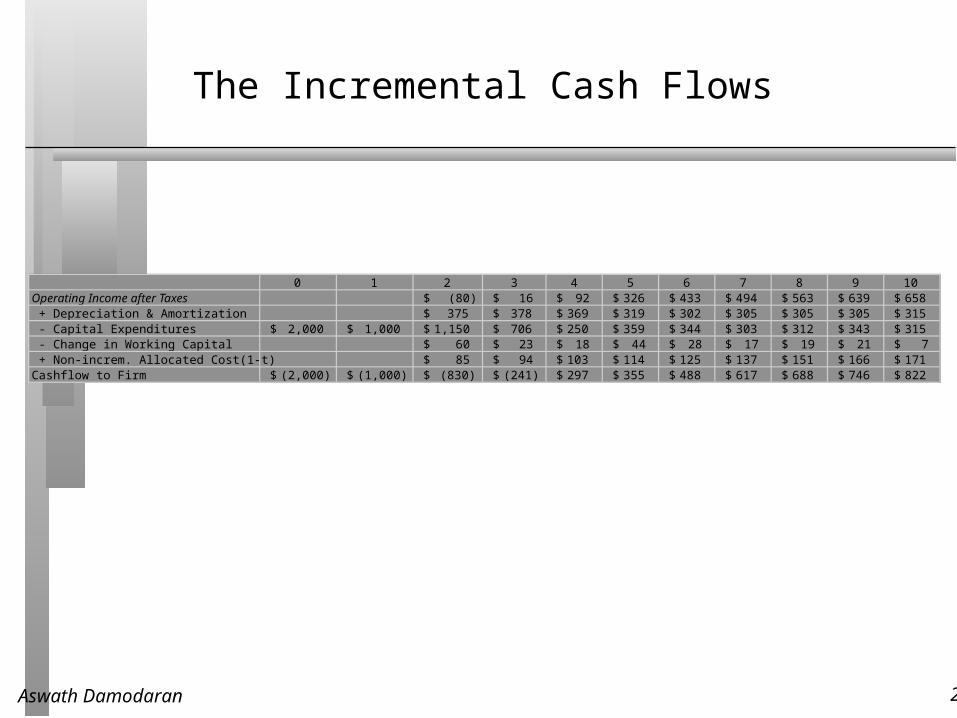
The Incremental Cash Flows
0 1 2 3 4 5 6 7 8 9 10Operating Income after Taxes (80)$ 16$ 92$ 326$ 433$ 494$ 563$ 639$ 658$ + Depreciation & Amortization 375$ 378$ 369$ 319$ 302$ 305$ 305$ 305$ 315$ - Capital Expenditures 2,000$ 1,000$ 1,150$ 706$ 250$ 359$ 344$ 303$ 312$ 343$ 315$ - Change in Working Capital 60$ 23$ 18$ 44$ 28$ 17$ 19$ 21$ 7$ + Non-increm. Allocated Cost(1-t) 85$ 94$ 103$ 114$ 125$ 137$ 151$ 166$ 171$ Cashflow to Firm (2,000)$ (1,000)$ (830)$ (241)$ 297$ 355$ 488$ 617$ 688$ 746$ 822$
Aswath Damodaran 26
To Time-Weighted Cash Flows
Incremental cash flows in the earlier years are worth more than incremental cash flows in later years.
In fact, cash flows across time cannot be added up. They have to be brought to the same point in time before aggregation.
This process of moving cash flows through time is• discounting, when future cash flows are brought to the present
• compounding, when present cash flows are taken to the future The discounting and compounding is done at a discount rate that will
reflect• Expected inflation: Higher Inflation -> Higher Discount Rates
• Expected real rate: Higher real rate -> Higher Discount rate
• Expected uncertainty: Higher uncertainty -> Higher Discount Rate
Aswath Damodaran 27
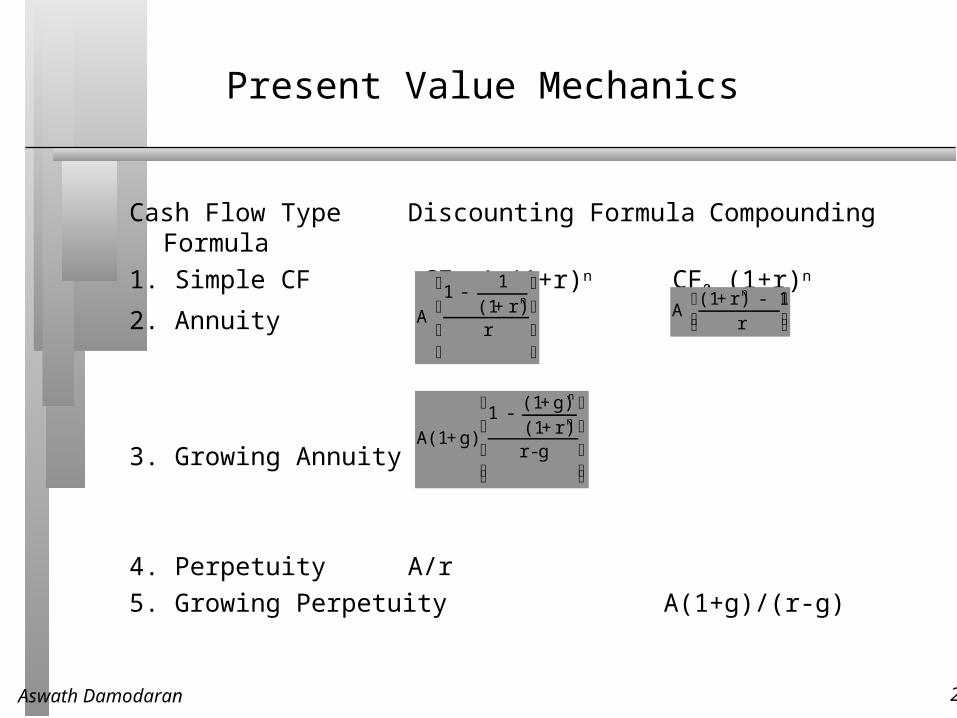
Present Value Mechanics
Cash Flow Type Discounting Formula Compounding Formula
1. Simple CF CFn / (1+r)n CF0 (1+r)n
2. Annuity
3. Growing Annuity
4. Perpetuity A/r
5. Growing Perpetuity A(1+g)/(r-g)
A
1 - 1
(1+ r)n
r
⎡
⎣
⎢ ⎢
⎤
⎦
⎥ ⎥
A (1 + r)n - 1
r
⎡ ⎣ ⎢
⎤ ⎦ ⎥
A(1+ g)
1 - (1 + g)n
(1 + r)n
r - g
⎡
⎣
⎢ ⎢ ⎢
⎤
⎦
⎥ ⎥ ⎥
Aswath Damodaran 28
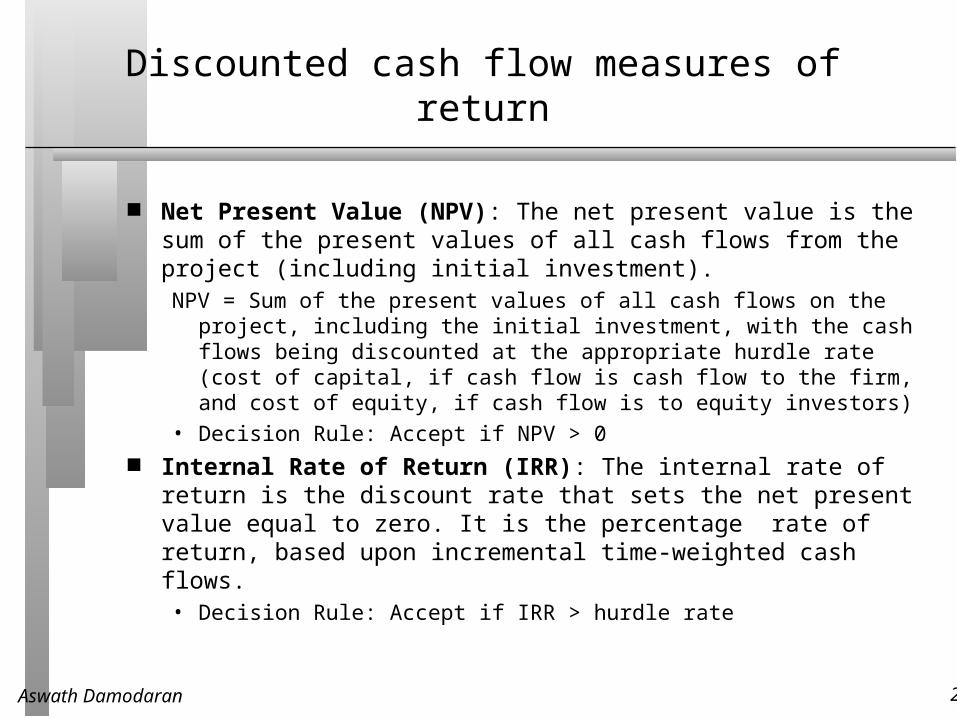
Discounted cash flow measures of return
Net Present Value (NPV): The net present value is the sum of the present values of all cash flows from the project (including initial investment).NPV = Sum of the present values of all cash flows on the project, including
the initial investment, with the cash flows being discounted at the appropriate hurdle rate (cost of capital, if cash flow is cash flow to the firm, and cost of equity, if cash flow is to equity investors)
• Decision Rule: Accept if NPV > 0 Internal Rate of Return (IRR): The internal rate of return is the
discount rate that sets the net present value equal to zero. It is the percentage rate of return, based upon incremental time-weighted cash flows.• Decision Rule: Accept if IRR > hurdle rate
Aswath Damodaran 29
Closure on Cash Flows
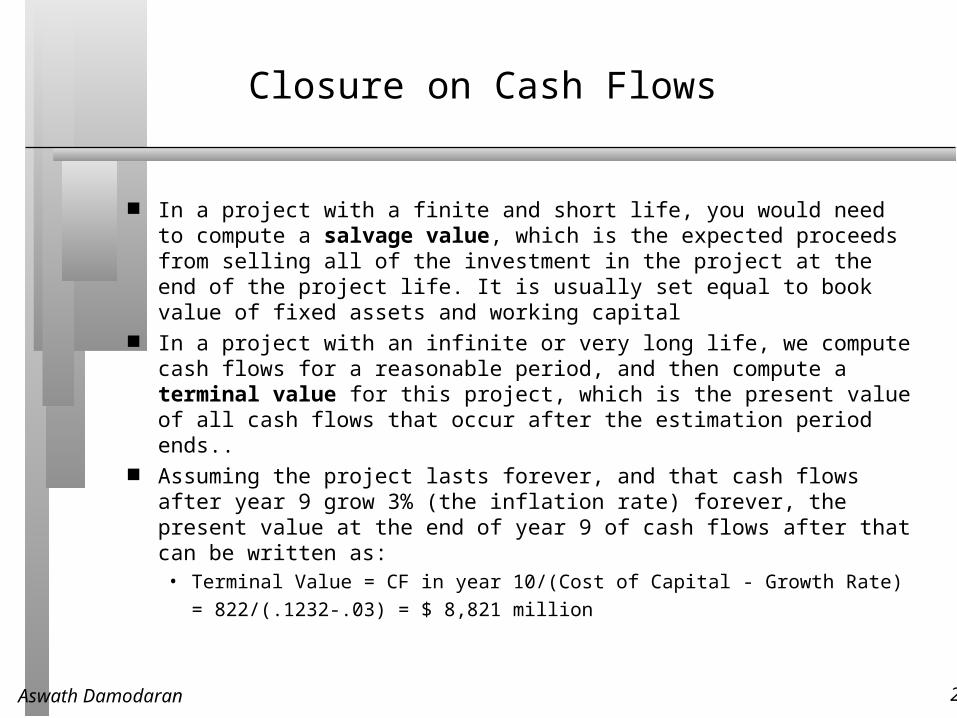
In a project with a finite and short life, you would need to compute a salvage value, which is the expected proceeds from selling all of the investment in the project at the end of the project life. It is usually set equal to book value of fixed assets and working capital
In a project with an infinite or very long life, we compute cash flows for a reasonable period, and then compute a terminal value for this project, which is the present value of all cash flows that occur after the estimation period ends..
Assuming the project lasts forever, and that cash flows after year 9 grow 3% (the inflation rate) forever, the present value at the end of year 9 of cash flows after that can be written as:• Terminal Value = CF in year 10/(Cost of Capital - Growth Rate)
= 822/(.1232-.03) = $ 8,821 million
Aswath Damodaran 30
Which yields a NPV of..
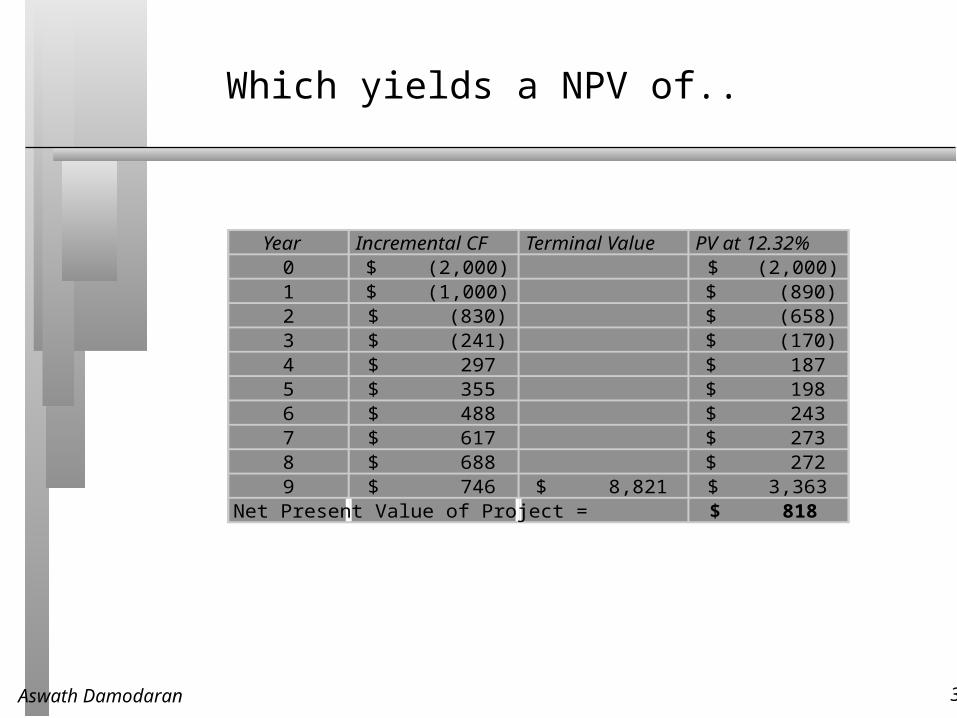
Year Incremental CF Terminal Value PV at 12.32%0 (2,000)$ (2,000)$ 1 (1,000)$ (890)$ 2 (830)$ (658)$ 3 (241)$ (170)$ 4 297$ 187$ 5 355$ 198$ 6 488$ 243$ 7 617$ 273$ 8 688$ 272$ 9 746$ 8,821$ 3,363$
Net Present Value of Project = 818$
Aswath Damodaran 31
Which makes the argument that..
The project should be accepted. The positive net present value suggests that the project will add value to the firm, and earn a return in excess of the cost of capital.
By taking the project, Disney will increase its value as a firm by $818 million.
Aswath Damodaran 32
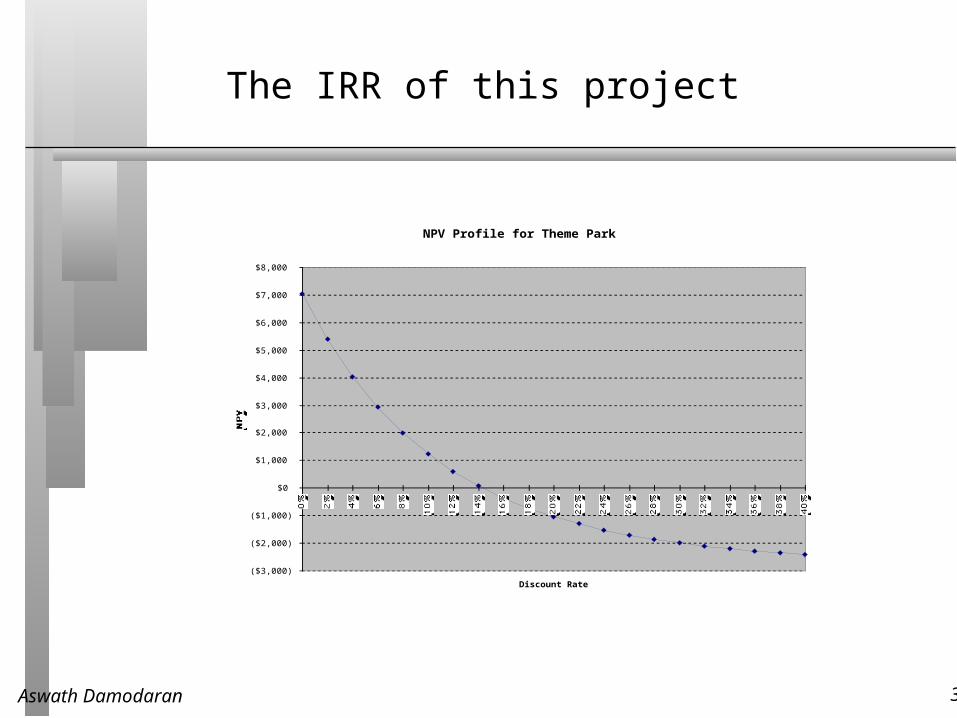
The IRR of this project
NPV Profile for Theme Park
($3,000)
($2,000)
($1,000)
$0
$1,000
$2,000
$3,000
$4,000
$5,000
$6,000
$7,000
$8,000
0% 2% 4% 6% 8%10% 12% 14% 16% 18% 20% 22% 24% 26% 28% 30% 32% 34% 36% 38% 40%
Discount Rate
NPV
Aswath Damodaran 33
The IRR suggests..
The project is a good one. Using time-weighted, incremental cash flows, this project provides a return of 15.32%. This is greater than the cost of capital of 12.32%.
The IRR and the NPV will yield similar results most of the time, though there are differences between the two approaches that may cause project rankings to vary depending upon the approach used.
Aswath Damodaran 34
Case 1: IRR versus NPV
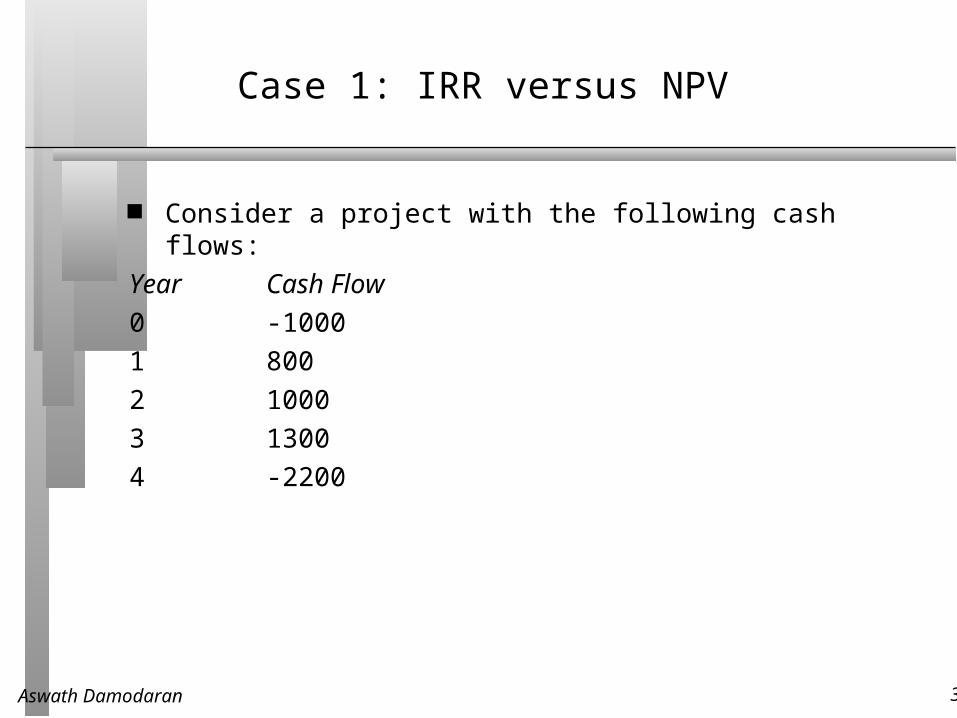
Consider a project with the following cash flows:
Year Cash Flow
0 -1000
1 800
2 1000
3 1300
4 -2200
Aswath Damodaran 35
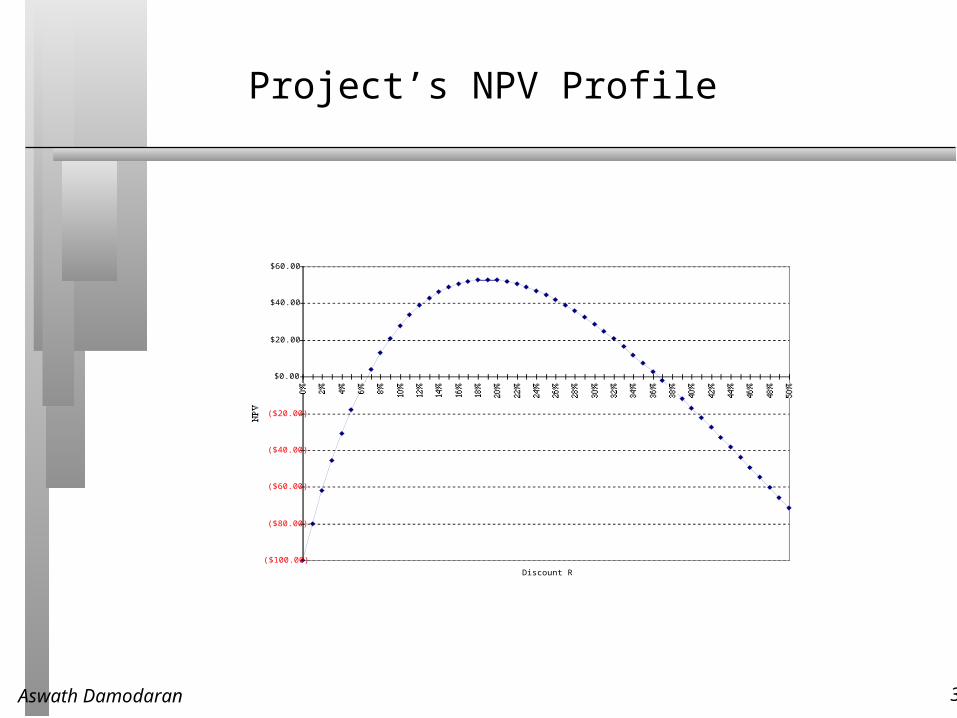
Project’s NPV Profile
($100.00)
($80.00)
($60.00)
($40.00)
($20.00)
$0.00
$20.00
$40.00
$60.00
0% 2% 4% 6% 8% 10% 12% 14% 16% 18% 20% 22% 24% 26% 28% 30% 32% 34% 36% 38% 40% 42% 44% 46% 48% 50%
Discount Rate
NPV
Aswath Damodaran 36
What do we do now?
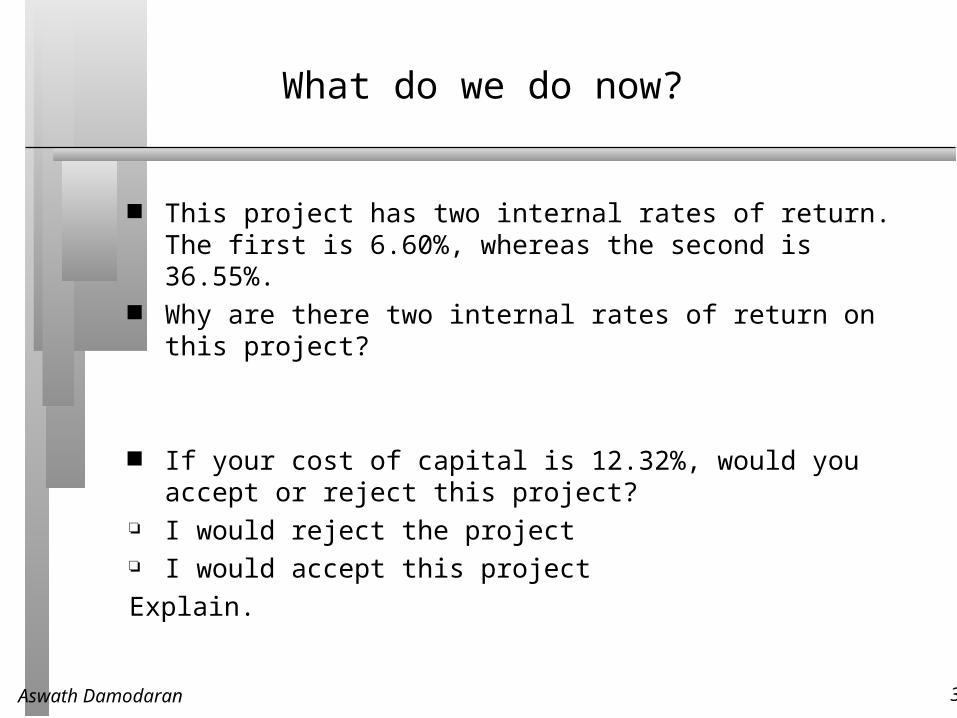
This project has two internal rates of return. The first is 6.60%, whereas the second is 36.55%.
Why are there two internal rates of return on this project?
If your cost of capital is 12.32%, would you accept or reject this project?
I would reject the project I would accept this project
Explain.
Aswath Damodaran 37
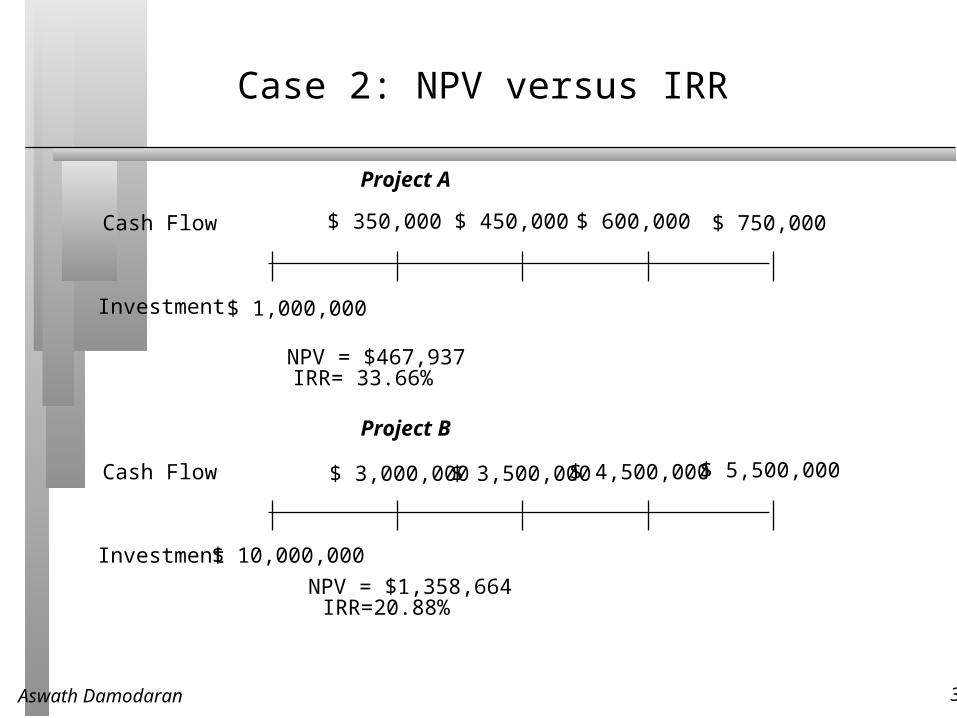
Case 2: NPV versus IRR
Cash Flow
Investment
$ 350,000
$ 1,000,000
Project A
Cash Flow
Investment
Project B
NPV = $467,937IRR= 33.66%
$ 450,000 $ 600,000 $ 750,000
NPV = $1,358,664IRR=20.88%
$ 10,000,000
$ 3,000,000 $ 3,500,000 $ 4,500,000 $ 5,500,000
Aswath Damodaran 38
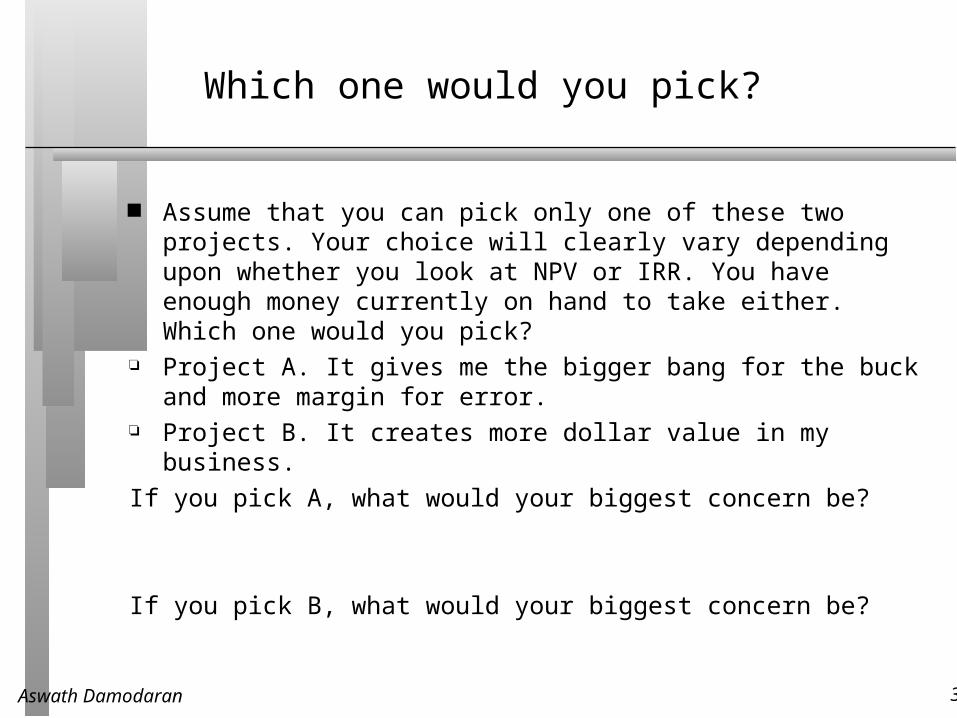
Which one would you pick?
Assume that you can pick only one of these two projects. Your choice will clearly vary depending upon whether you look at NPV or IRR. You have enough money currently on hand to take either. Which one would you pick?
Project A. It gives me the bigger bang for the buck and more margin for error.
Project B. It creates more dollar value in my business.
If you pick A, what would your biggest concern be?
If you pick B, what would your biggest concern be?
Aswath Damodaran 39
Capital Rationing, Uncertainty and Choosing a Rule
If a business has limited access to capital, has a stream of surplus value projects and faces more uncertainty in its project cash flows, it is much more likely to use IRR as its decision rule.
Small, high-growth companies and private businesses are much more likely to use IRR.
If a business has substantial funds on hand, access to capital, limited surplus value projects, and more certainty on its project cash flows, it is much more likely to use NPV as its decision rule.
As firms go public and grow, they are much more likely to gain from using NPV.
Aswath Damodaran 40
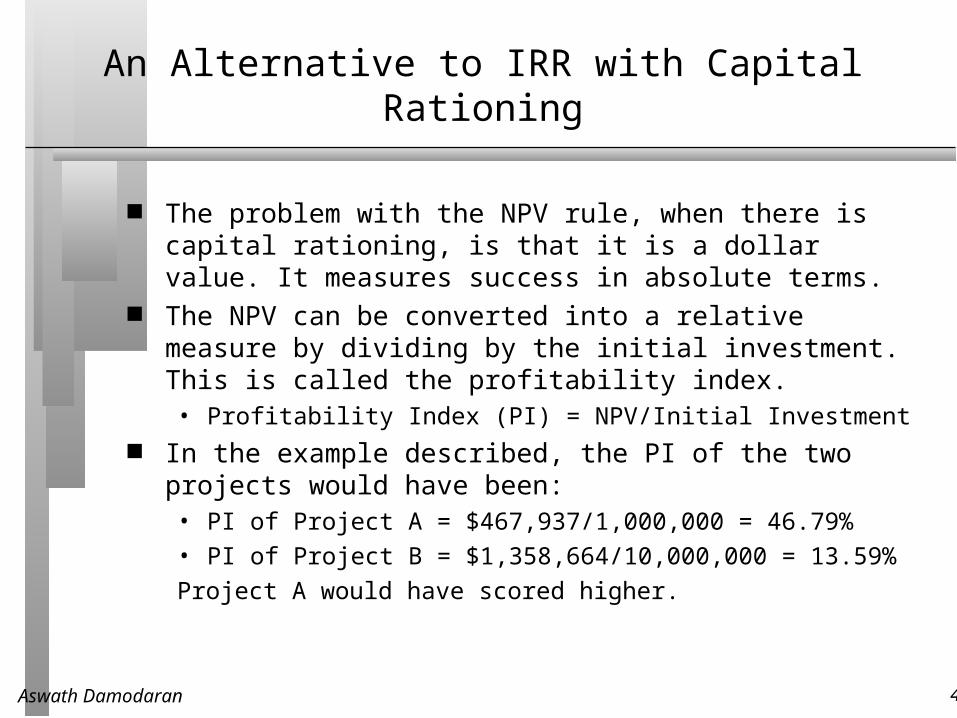
An Alternative to IRR with Capital Rationing
The problem with the NPV rule, when there is capital rationing, is that it is a dollar value. It measures success in absolute terms.
The NPV can be converted into a relative measure by dividing by the initial investment. This is called the profitability index.• Profitability Index (PI) = NPV/Initial Investment
In the example described, the PI of the two projects would have been:• PI of Project A = $467,937/1,000,000 = 46.79%
• PI of Project B = $1,358,664/10,000,000 = 13.59%
Project A would have scored higher.
Aswath Damodaran 41
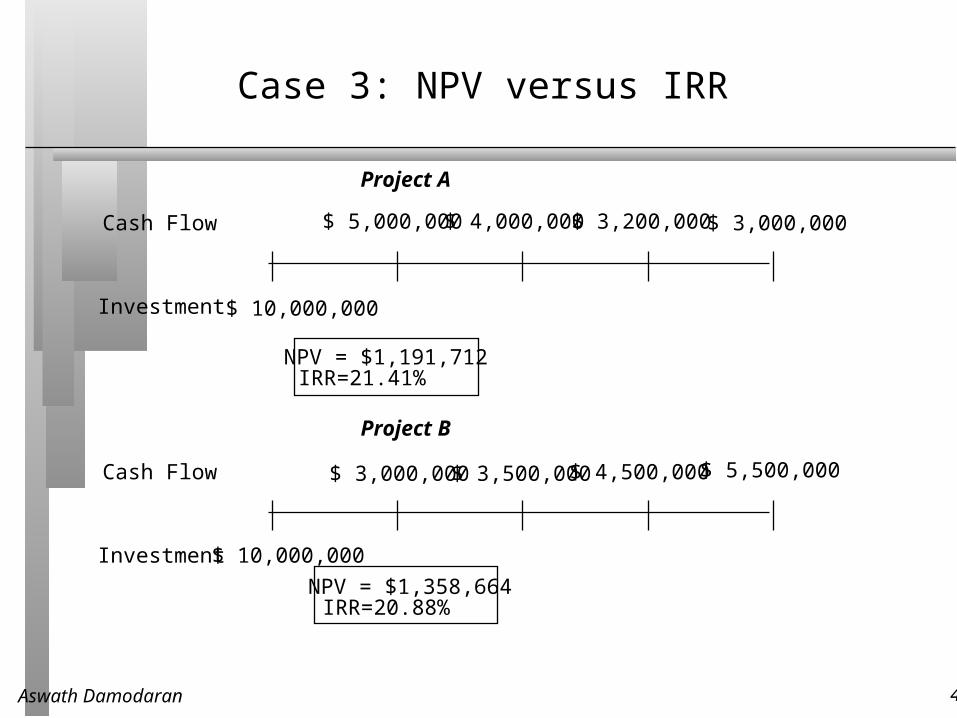
Case 3: NPV versus IRR
Cash Flow
Investment
$ 5,000,000
$ 10,000,000
Project A
Cash Flow
Investment
Project B
NPV = $1,191,712IRR=21.41%
$ 4,000,000 $ 3,200,000 $ 3,000,000
NPV = $1,358,664IRR=20.88%
$ 10,000,000
$ 3,000,000 $ 3,500,000 $ 4,500,000 $ 5,500,000
Aswath Damodaran 42
Why the difference?
These projects are of the same scale. Both the NPV and IRR use time-weighted cash flows. Yet, the rankings are different. Why?
Which one would you pick? Project A. It gives me the bigger bang for the buck and more margin
for error. Project B. It creates more dollar value in my business.
Aswath Damodaran 43
NPV, IRR and the Reinvestment Rate Assumption
The NPV rule assumes that intermediate cash flows on the project get reinvested at the hurdle rate (which is based upon what projects of comparable risk should earn).
The IRR rule assumes that intermediate cash flows on the project get reinvested at the IRR. Implicit is the assumption that the firm has an infinite stream of projects yielding similar IRRs.
Conclusion: When the IRR is high (the project is creating significant surplus value) and the project life is long, the IRR will overstate the true return on the project.
Aswath Damodaran 44
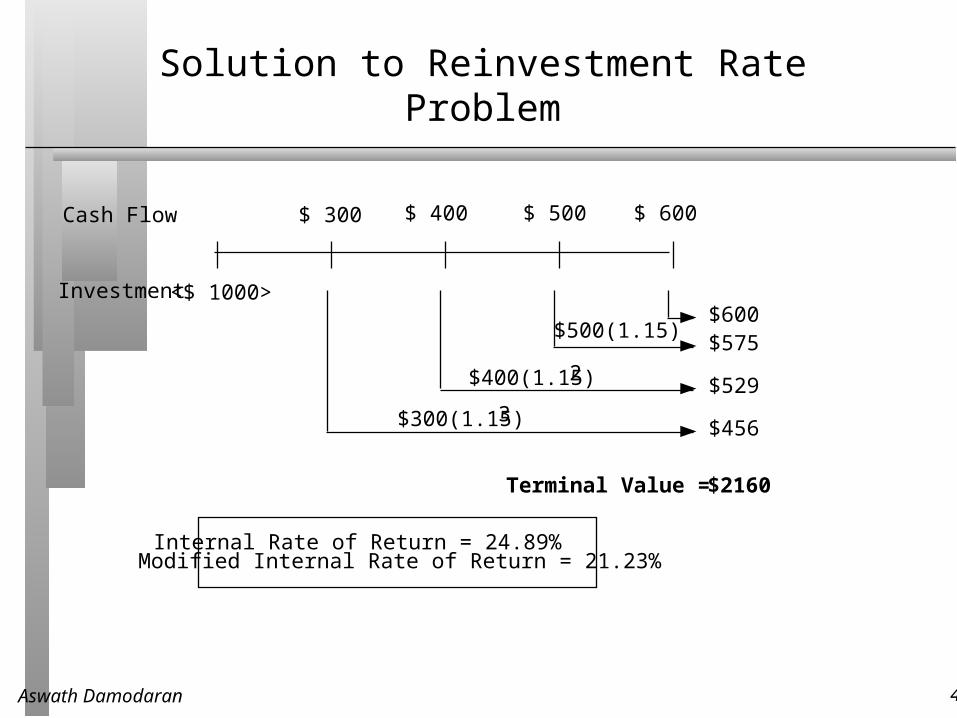
Solution to Reinvestment Rate Problem
Cash Flow
Investment
$ 300 $ 400 $ 500 $ 600
<$ 1000>
$300(1.15)3
$400(1.15)2
$500(1.15)$600$575
$529
$456
Terminal Value = $2160
Internal Rate of Return = 24.89%Modified Internal Rate of Return = 21.23%
Aswath Damodaran 45
Why NPV and IRR may differ..
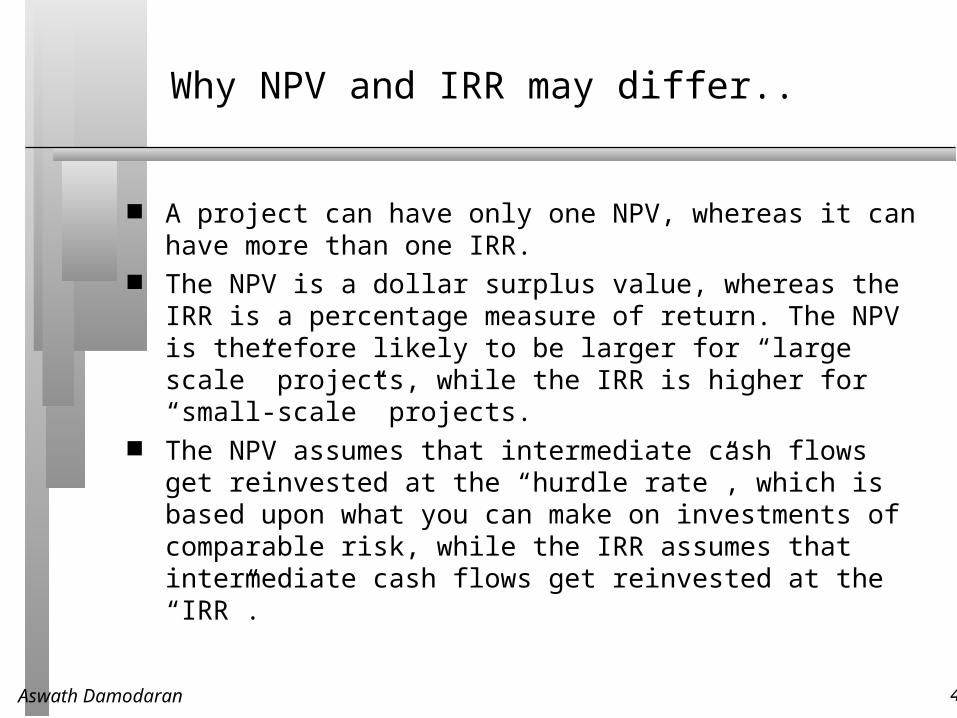
A project can have only one NPV, whereas it can have more than one IRR.
The NPV is a dollar surplus value, whereas the IRR is a percentage measure of return. The NPV is therefore likely to be larger for “large scale” projects, while the IRR is higher for “small-scale” projects.
The NPV assumes that intermediate cash flows get reinvested at the “hurdle rate”, which is based upon what you can make on investments of comparable risk, while the IRR assumes that intermediate cash flows get reinvested at the “IRR”.
Aswath Damodaran 46
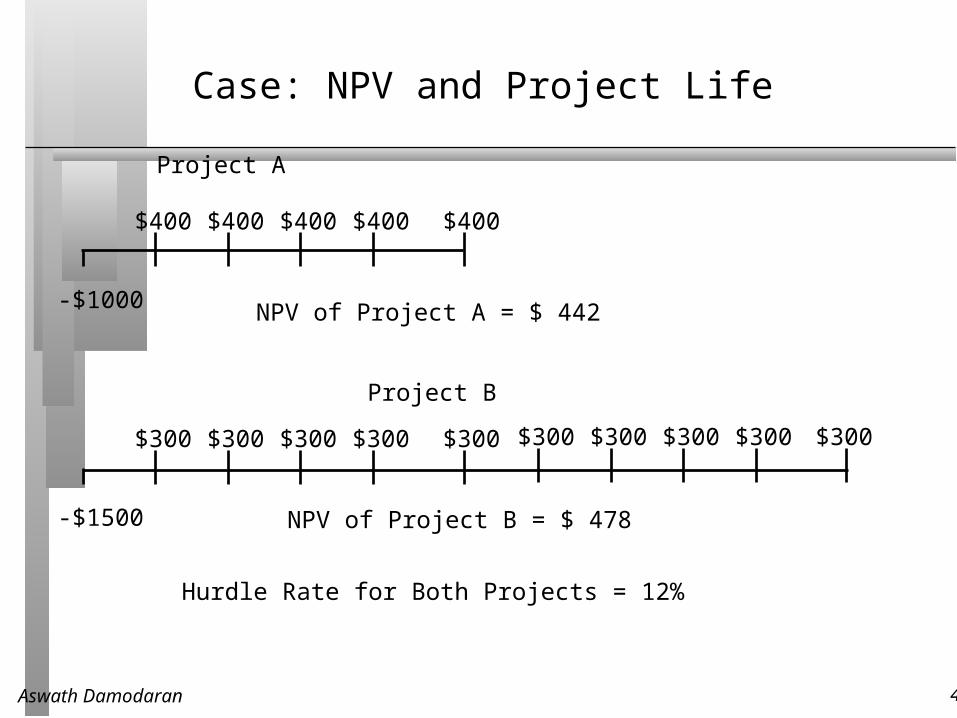
Case: NPV and Project Life
Project A
-$1500
$300 $300 $300 $300$300
-$1000
$400 $400 $400 $400$400
$300 $300 $300 $300$300
Project B
NPV of Project A = $ 442
NPV of Project B = $ 478
Hurdle Rate for Both Projects = 12%

Aswath Damodaran 47
Choosing Between Mutually Exclusive Projects
The net present values of mutually exclusive projects with different lives cannot be compared, since there is a bias towards longer-life projects.
To do the comparison, we have to• replicate the projects till they have the same life (or)
• convert the net present values into annuities
Aswath Damodaran 48
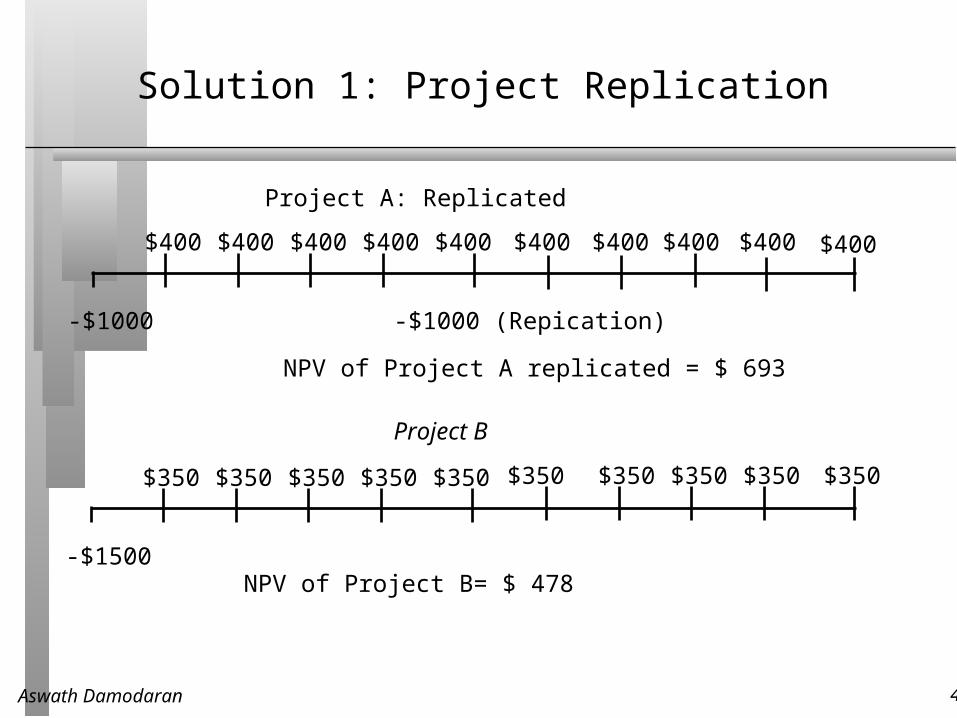
Solution 1: Project Replication
Project A: Replicated
-$1500
$350 $350 $350 $350$350 $350 $350 $350 $350$350
Project B
-$1000
$400 $400 $400 $400$400 $400 $400 $400 $400$400
-$1000 (Repication)
NPV of Project A replicated = $ 693
NPV of Project B= $ 478
Aswath Damodaran 49
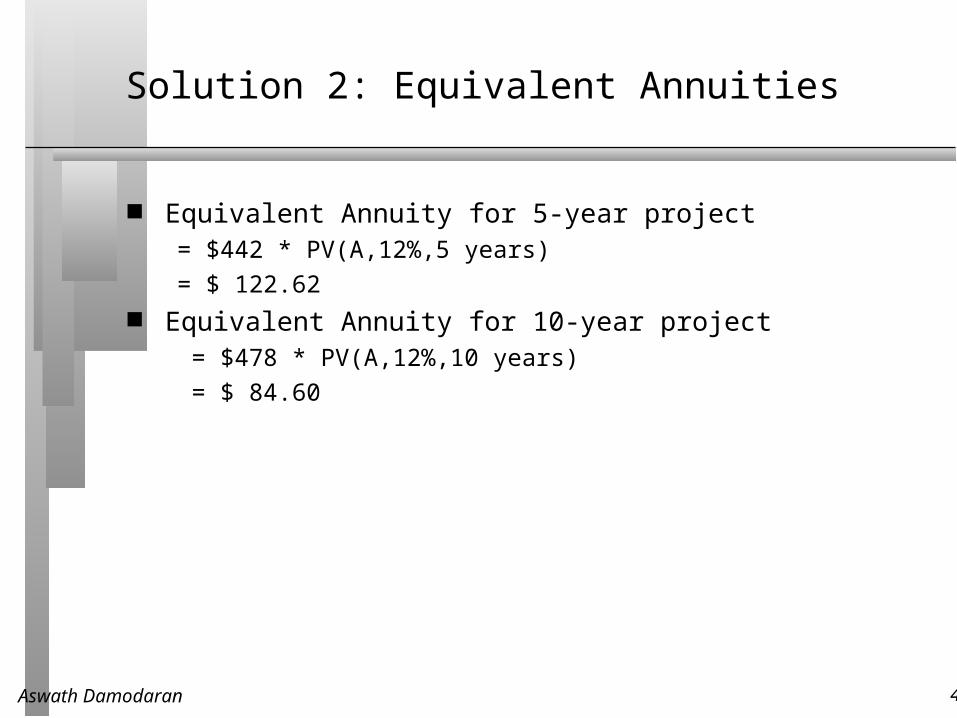
Solution 2: Equivalent Annuities
Equivalent Annuity for 5-year project = $442 * PV(A,12%,5 years)
= $ 122.62 Equivalent Annuity for 10-year project
= $478 * PV(A,12%,10 years)
= $ 84.60
Aswath Damodaran 50
What would you choose as your investment tool?
Given the advantages/disadvantages outlined for each of the different decision rules, which one would you choose to adopt?
Return on Investment (ROE, ROA) Payback or Discounted Payback Net Present Value Internal Rate of Return Profitability Index
Aswath Damodaran 51
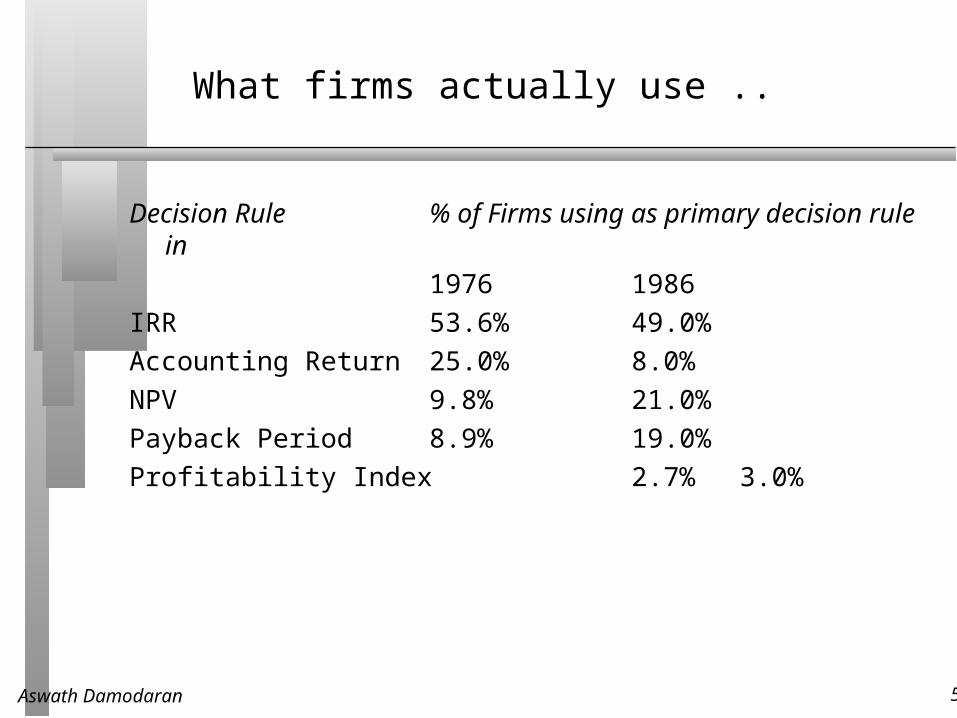
What firms actually use ..
Decision Rule % of Firms using as primary decision rule in
1976 1986
IRR 53.6% 49.0%
Accounting Return 25.0% 8.0%
NPV 9.8% 21.0%
Payback Period 8.9% 19.0%
Profitability Index 2.7% 3.0%
Aswath Damodaran 52
The Disney Theme Park: The Risks of International Expansion
The cash flows on the Bangkok Disney park will be in Thai Baht. This will expose Disney to exchange rate risk. In addition, there are political and economic risks to consider in an investment in Thailand. The discount rate of 12.32% that we used is a cost of capital for U.S. theme parks. Would you use a higher rate for this project?
Yes No
Aswath Damodaran 53
Should there be a risk premium for foreign projects?
The exchange rate risk may be diversifiable risk (and hence should not command a premium) if• the company has projects is a large number of countries (or)
• the investors in the company are globally diversified.
For Disney, this risk should not affect the cost of capital used. The same diversification argument can also be applied against
political risk, which would mean that it too should not affect the discount rate. It may, however, affect the cash flows, by reducing the expected life or cash flows on the project.
For Disney, this risk too is assumed to not affect the cost of capital
Aswath Damodaran 54
Domestic versus international expansion
The analysis was done in dollars. Would the conclusions have been any different if we had done the analysis in Thai Baht?
Yes No
Aswath Damodaran 55
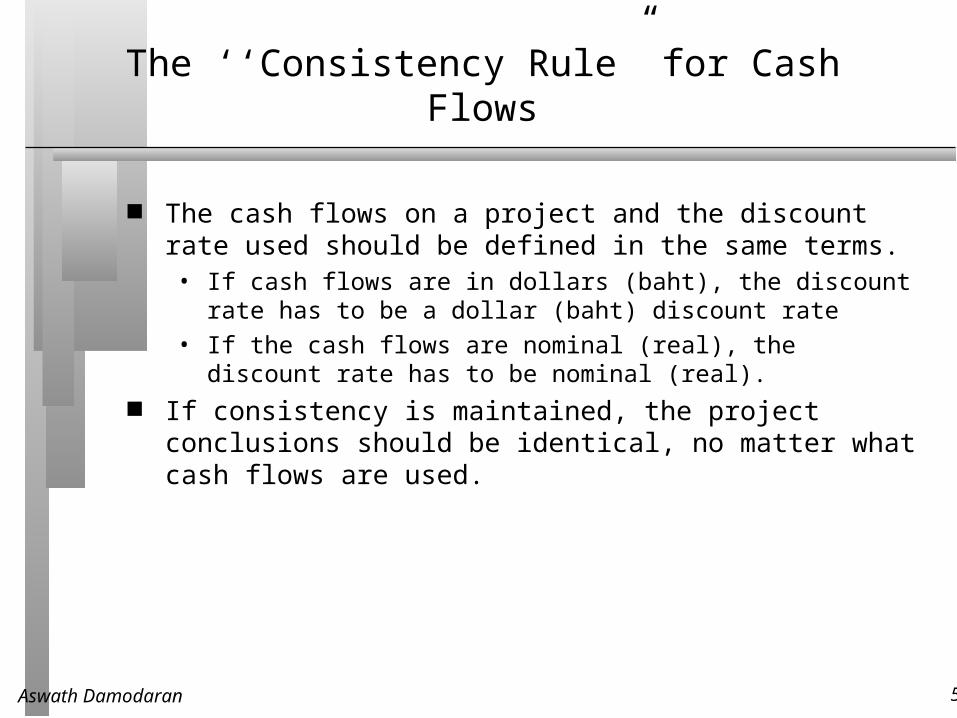
The ‘‘Consistency Rule” for Cash Flows
The cash flows on a project and the discount rate used should be defined in the same terms. • If cash flows are in dollars (baht), the discount rate has to be a dollar
(baht) discount rate
• If the cash flows are nominal (real), the discount rate has to be nominal (real).
If consistency is maintained, the project conclusions should be identical, no matter what cash flows are used.
Aswath Damodaran 56
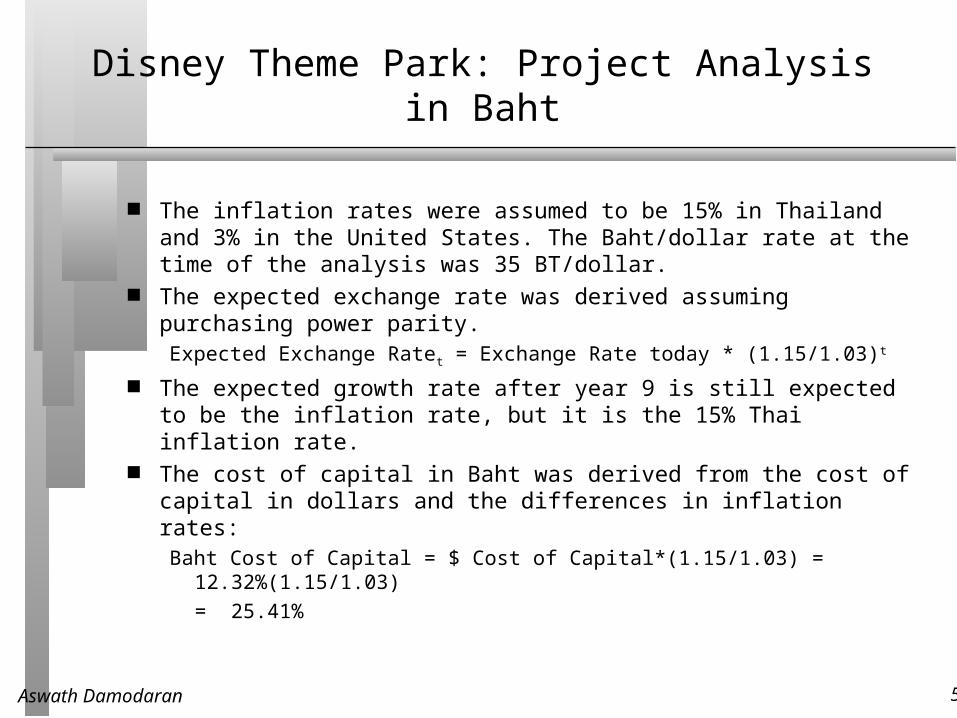
Disney Theme Park: Project Analysis in Baht
The inflation rates were assumed to be 15% in Thailand and 3% in the United States. The Baht/dollar rate at the time of the analysis was 35 BT/dollar.
The expected exchange rate was derived assuming purchasing power parity.Expected Exchange Ratet = Exchange Rate today * (1.15/1.03)t
The expected growth rate after year 9 is still expected to be the inflation rate, but it is the 15% Thai inflation rate.
The cost of capital in Baht was derived from the cost of capital in dollars and the differences in inflation rates:Baht Cost of Capital = $ Cost of Capital*(1.15/1.03) = 12.32%(1.15/1.03)
= 25.41%
Aswath Damodaran 57
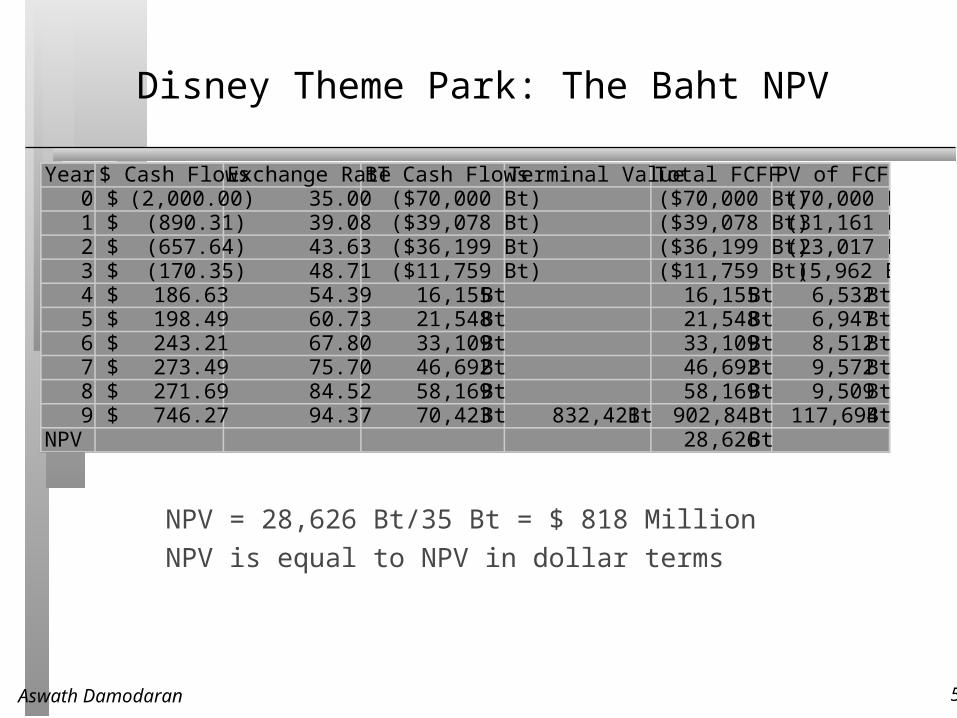
Disney Theme Park: The Baht NPV
Year $ Cash Flows Exchange Rate BT Cash Flows Terminal Value Total FCFF PV of FCFF0 (2,000.00)$ 35.00 ($70,000 Bt) ($70,000 Bt) (70,000 Bt)1 (890.31)$ 39.08 ($39,078 Bt) ($39,078 Bt) (31,161 Bt)2 (657.64)$ 43.63 ($36,199 Bt) ($36,199 Bt) (23,017 Bt)3 (170.35)$ 48.71 ($11,759 Bt) ($11,759 Bt) (5,962 Bt)4 186.63$ 54.39 16,155 Bt 16,155 Bt 6,532 Bt5 198.49$ 60.73 21,548 Bt 21,548 Bt 6,947 Bt6 243.21$ 67.80 33,109 Bt 33,109 Bt 8,512 Bt7 273.49$ 75.70 46,692 Bt 46,692 Bt 9,572 Bt8 271.69$ 84.52 58,169 Bt 58,169 Bt 9,509 Bt9 746.27$ 94.37 70,423 Bt 832,421 Bt 902,843 Bt 117,694 Bt
NPV 28,626 Bt
NPV = 28,626 Bt/35 Bt = $ 818 Million
NPV is equal to NPV in dollar terms
Aswath Damodaran 58
Dealing with Inflation
In our analysis, we used nominal dollars and Bt. Would the NPV have been different if we had used real cash flows instead of nominal cash flows?
It would be much lower, since real cash flows are lower than nominal cash flows
It would be much higher It should be unaffected
Aswath Damodaran 59
Disney Theme Park
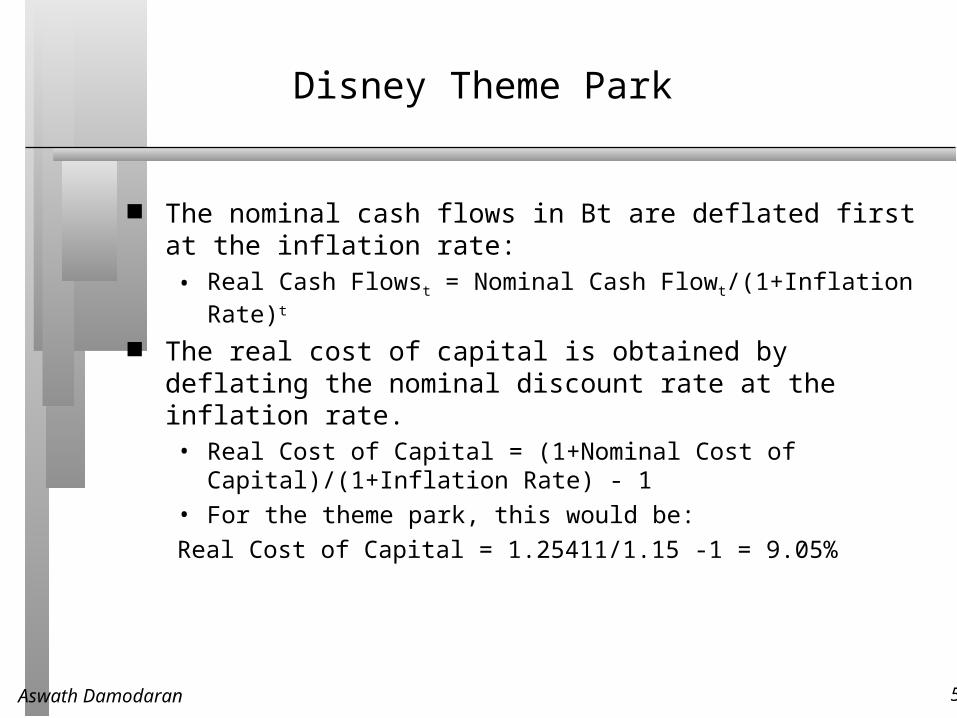
The nominal cash flows in Bt are deflated first at the inflation rate:• Real Cash Flowst = Nominal Cash Flowt/(1+Inflation Rate)t
The real cost of capital is obtained by deflating the nominal discount rate at the inflation rate.• Real Cost of Capital = (1+Nominal Cost of Capital)/(1+Inflation Rate) - 1
• For the theme park, this would be:
Real Cost of Capital = 1.25411/1.15 -1 = 9.05%
Aswath Damodaran 60
Disney Theme Park: Real NPV
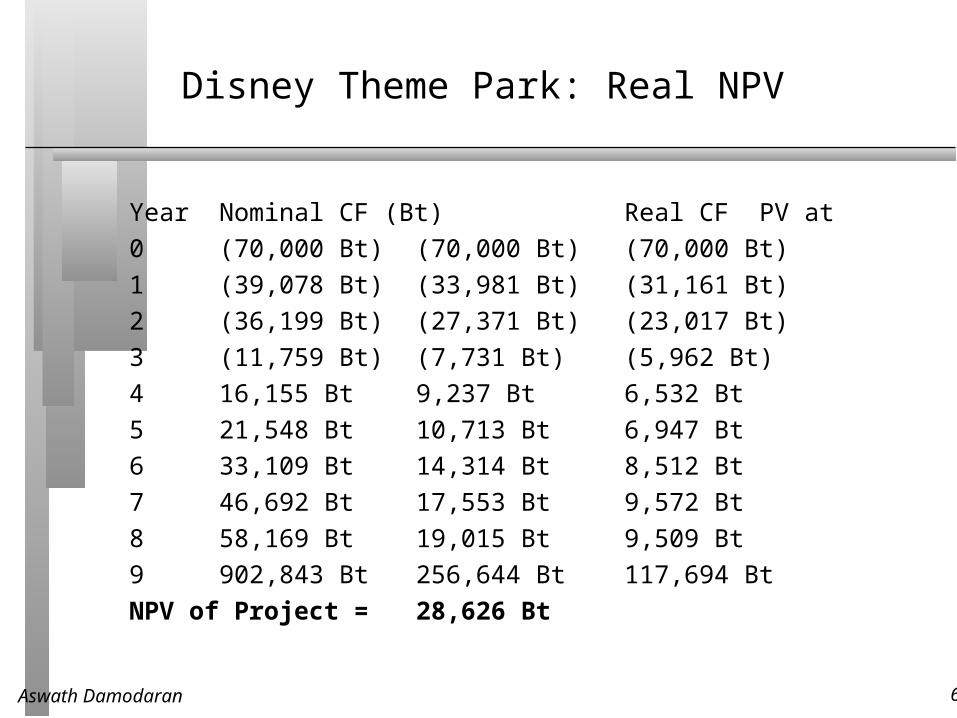
Year Nominal CF (Bt) Real CF PV at
0 (70,000 Bt) (70,000 Bt) (70,000 Bt)
1 (39,078 Bt) (33,981 Bt) (31,161 Bt)
2 (36,199 Bt) (27,371 Bt) (23,017 Bt)
3 (11,759 Bt) (7,731 Bt) (5,962 Bt)
4 16,155 Bt 9,237 Bt 6,532 Bt
5 21,548 Bt 10,713 Bt 6,947 Bt
6 33,109 Bt 14,314 Bt 8,512 Bt
7 46,692 Bt 17,553 Bt 9,572 Bt
8 58,169 Bt 19,015 Bt 9,509 Bt
9 902,843 Bt 256,644 Bt 117,694 Bt
NPV of Project = 28,626 Bt
Aswath Damodaran 61
Equity Analysis: The Parallels
The investment analysis can be done entirely in equity terms, as well. The returns, cashflows and hurdle rates will all be defined from the perspective of equity investors.
If using accounting returns,• Return will be Return on Equity (ROE) = Net Income/BV of Equity
• ROE has to be greater than cost of equity If using discounted cashflow models,
• Cashflows will be cashflows after debt payments to equity investors
• Hurdle rate will be cost of equity
Aswath Damodaran 62
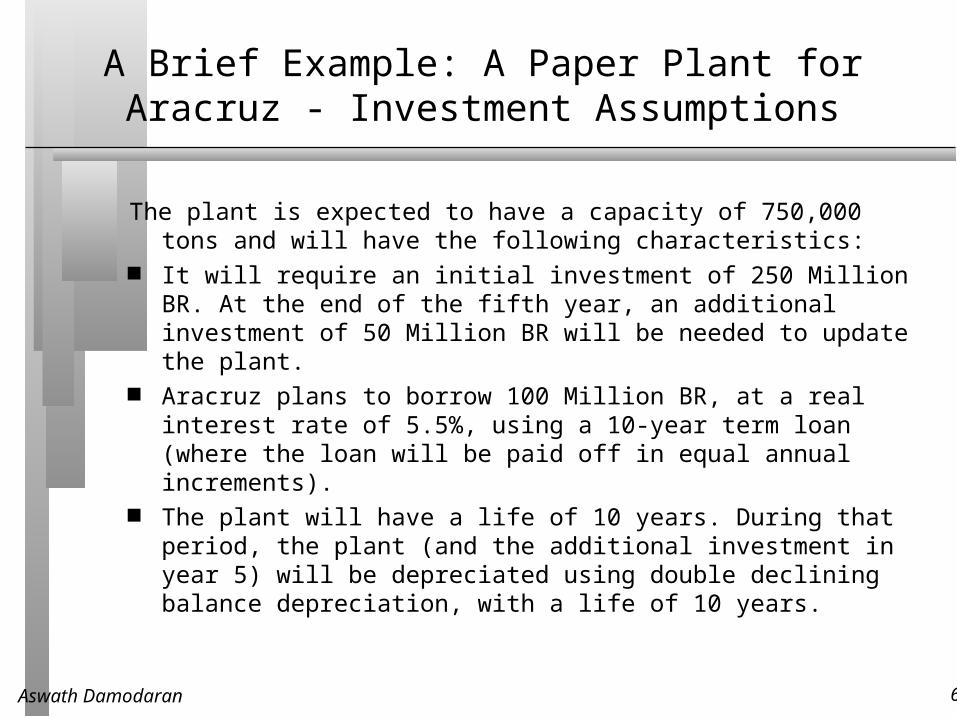
A Brief Example: A Paper Plant for Aracruz - Investment Assumptions
The plant is expected to have a capacity of 750,000 tons and will have the following characteristics:
It will require an initial investment of 250 Million BR. At the end of the fifth year, an additional investment of 50 Million BR will be needed to update the plant.
Aracruz plans to borrow 100 Million BR, at a real interest rate of 5.5%, using a 10-year term loan (where the loan will be paid off in equal annual increments).
The plant will have a life of 10 years. During that period, the plant (and the additional investment in year 5) will be depreciated using double declining balance depreciation, with a life of 10 years.
Aswath Damodaran 63
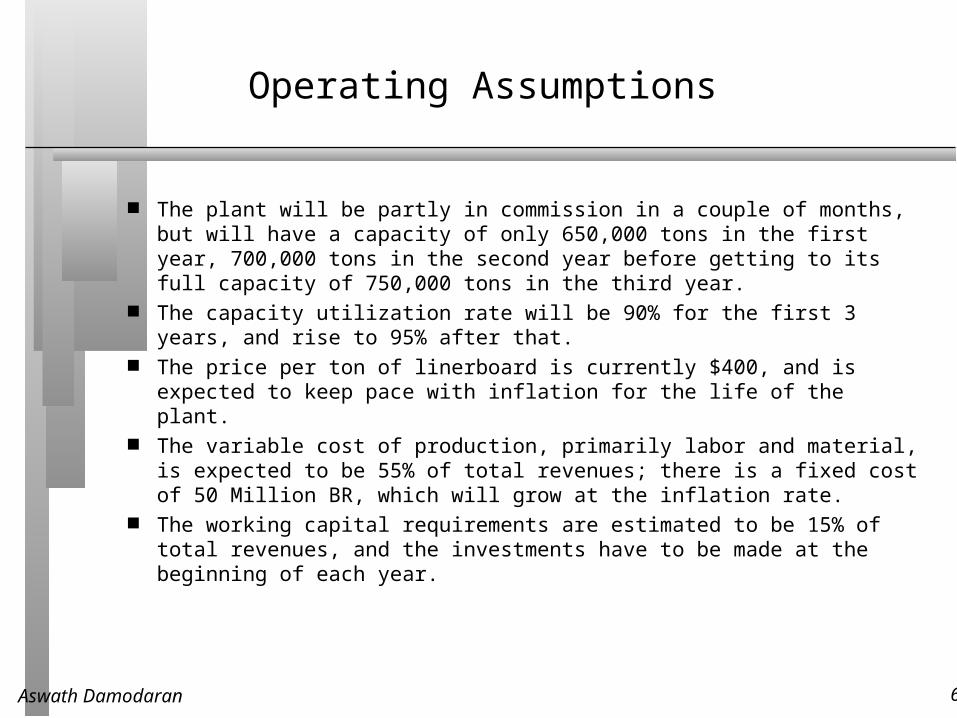
Operating Assumptions
The plant will be partly in commission in a couple of months, but will have a capacity of only 650,000 tons in the first year, 700,000 tons in the second year before getting to its full capacity of 750,000 tons in the third year.
The capacity utilization rate will be 90% for the first 3 years, and rise to 95% after that.
The price per ton of linerboard is currently $400, and is expected to keep pace with inflation for the life of the plant.
The variable cost of production, primarily labor and material, is expected to be 55% of total revenues; there is a fixed cost of 50 Million BR, which will grow at the inflation rate.
The working capital requirements are estimated to be 15% of total revenues, and the investments have to be made at the beginning of each year.
Aswath Damodaran 64
Assumptions about Salvage
At the end of the tenth year, the plant is expected to be salvaged at book value.
At the end of the tenth year, it is anticipated that the entire working capital will be salvaged.
Aswath Damodaran 65
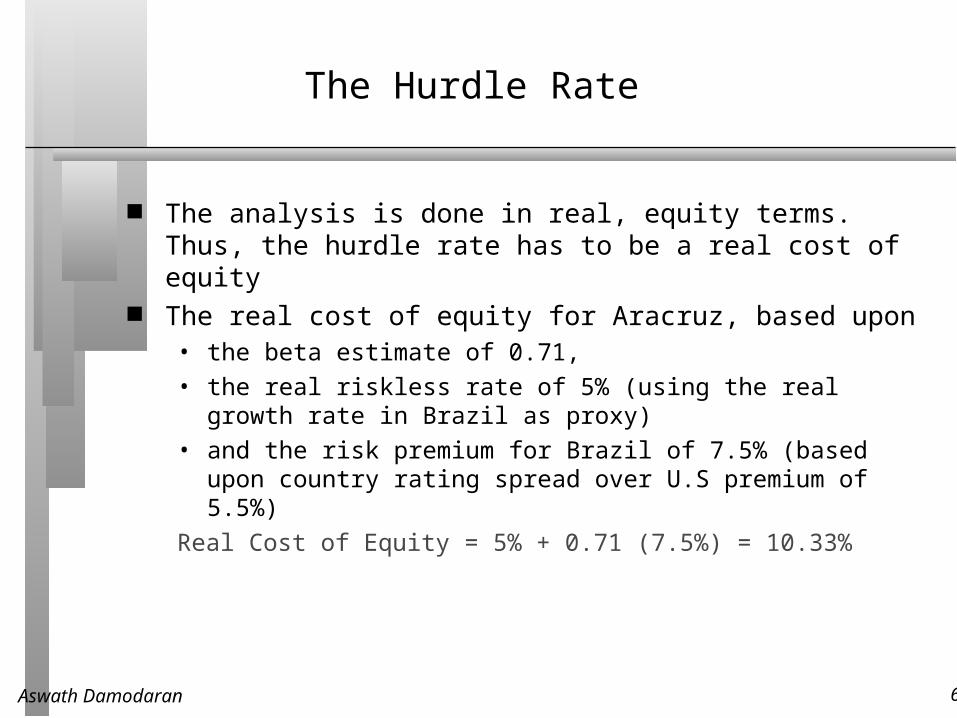
The Hurdle Rate
The analysis is done in real, equity terms. Thus, the hurdle rate has to be a real cost of equity
The real cost of equity for Aracruz, based upon • the beta estimate of 0.71,
• the real riskless rate of 5% (using the real growth rate in Brazil as proxy)
• and the risk premium for Brazil of 7.5% (based upon country rating spread over U.S premium of 5.5%)
Real Cost of Equity = 5% + 0.71 (7.5%) = 10.33%
Aswath Damodaran 66
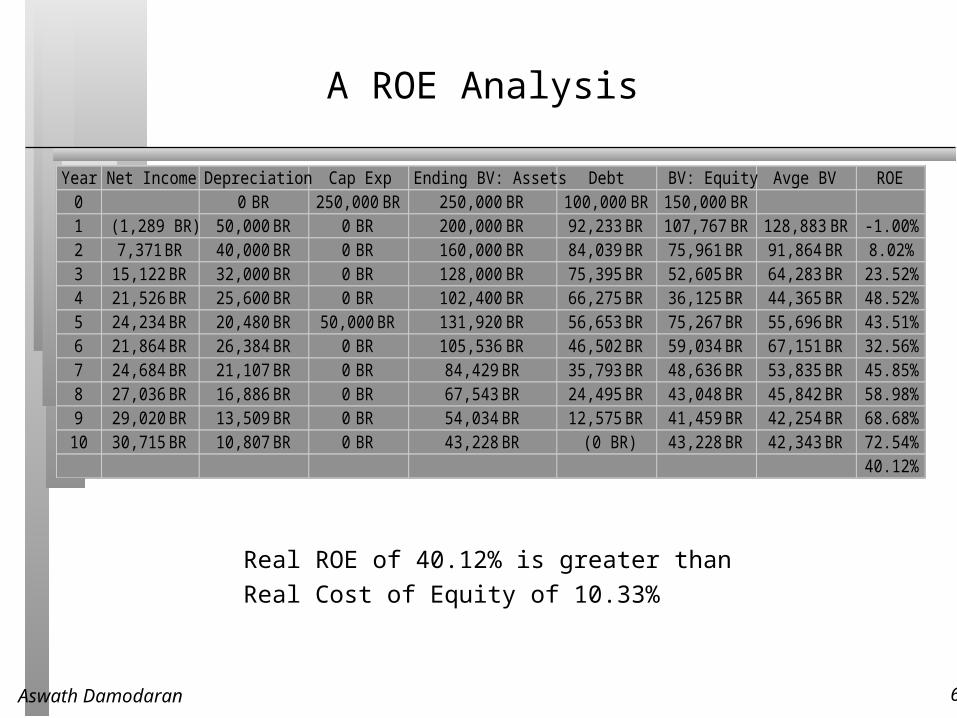
A ROE Analysis
Year Net Income Depreciation Cap Exp Ending BV: Assets Debt BV: Equity Avge BV ROE0 0 BR 250,000 BR 250,000 BR 100,000 BR 150,000 BR1 (1,289 BR) 50,000 BR 0 BR 200,000 BR 92,233 BR 107,767 BR 128,883 BR -1.00%2 7,371 BR 40,000 BR 0 BR 160,000 BR 84,039 BR 75,961 BR 91,864 BR 8.02%3 15,122 BR 32,000 BR 0 BR 128,000 BR 75,395 BR 52,605 BR 64,283 BR 23.52%4 21,526 BR 25,600 BR 0 BR 102,400 BR 66,275 BR 36,125 BR 44,365 BR 48.52%5 24,234 BR 20,480 BR 50,000 BR 131,920 BR 56,653 BR 75,267 BR 55,696 BR 43.51%6 21,864 BR 26,384 BR 0 BR 105,536 BR 46,502 BR 59,034 BR 67,151 BR 32.56%7 24,684 BR 21,107 BR 0 BR 84,429 BR 35,793 BR 48,636 BR 53,835 BR 45.85%8 27,036 BR 16,886 BR 0 BR 67,543 BR 24,495 BR 43,048 BR 45,842 BR 58.98%9 29,020 BR 13,509 BR 0 BR 54,034 BR 12,575 BR 41,459 BR 42,254 BR 68.68%10 30,715 BR 10,807 BR 0 BR 43,228 BR (0 BR) 43,228 BR 42,343 BR 72.54%
40.12%
Real ROE of 40.12% is greater than
Real Cost of Equity of 10.33%
Aswath Damodaran 67
From Project ROE to Firm ROE
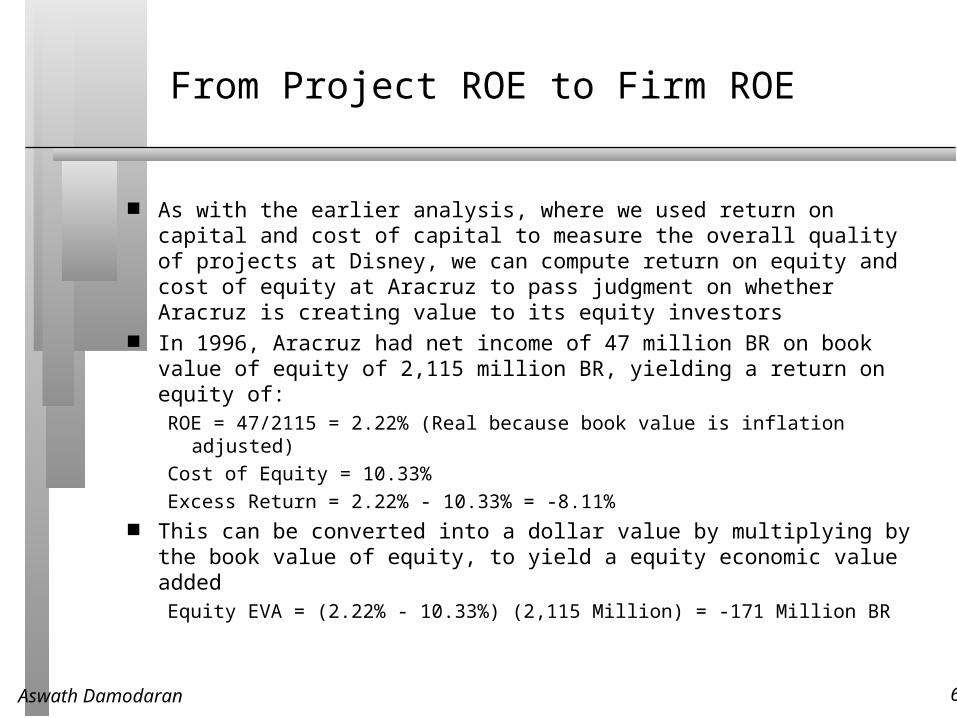
As with the earlier analysis, where we used return on capital and cost of capital to measure the overall quality of projects at Disney, we can compute return on equity and cost of equity at Aracruz to pass judgment on whether Aracruz is creating value to its equity investors
In 1996, Aracruz had net income of 47 million BR on book value of equity of 2,115 million BR, yielding a return on equity of:ROE = 47/2115 = 2.22% (Real because book value is inflation adjusted)
Cost of Equity = 10.33%
Excess Return = 2.22% - 10.33% = -8.11% This can be converted into a dollar value by multiplying by the book
value of equity, to yield a equity economic value addedEquity EVA = (2.22% - 10.33%) (2,115 Million) = -171 Million BR
Aswath Damodaran 68
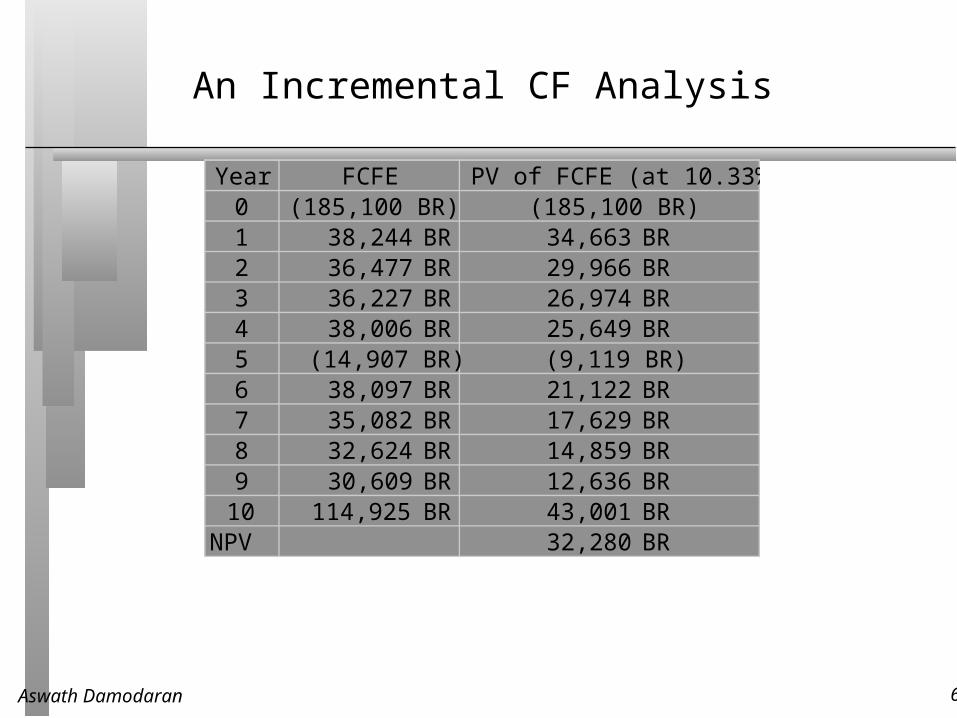
An Incremental CF Analysis
Year FCFE PV of FCFE (at 10.33%)0 (185,100 BR) (185,100 BR)1 38,244 BR 34,663 BR2 36,477 BR 29,966 BR3 36,227 BR 26,974 BR4 38,006 BR 25,649 BR5 (14,907 BR) (9,119 BR)6 38,097 BR 21,122 BR7 35,082 BR 17,629 BR8 32,624 BR 14,859 BR9 30,609 BR 12,636 BR
10 114,925 BR 43,001 BRNPV 32,280 BR
Aswath Damodaran 69
The Role of Sensitivity Analysis
Our conclusions on a project are clearly conditioned on a large number of assumptions about revenues, costs and other variables over very long time periods.
To the degree that these assumptions are wrong, our conclusions can also be wrong.
One way to gain confidence in the conclusions is to check to see how sensitive the decision measure (NPV, IRR..) is to changes in key assumptions.
Aswath Damodaran 70
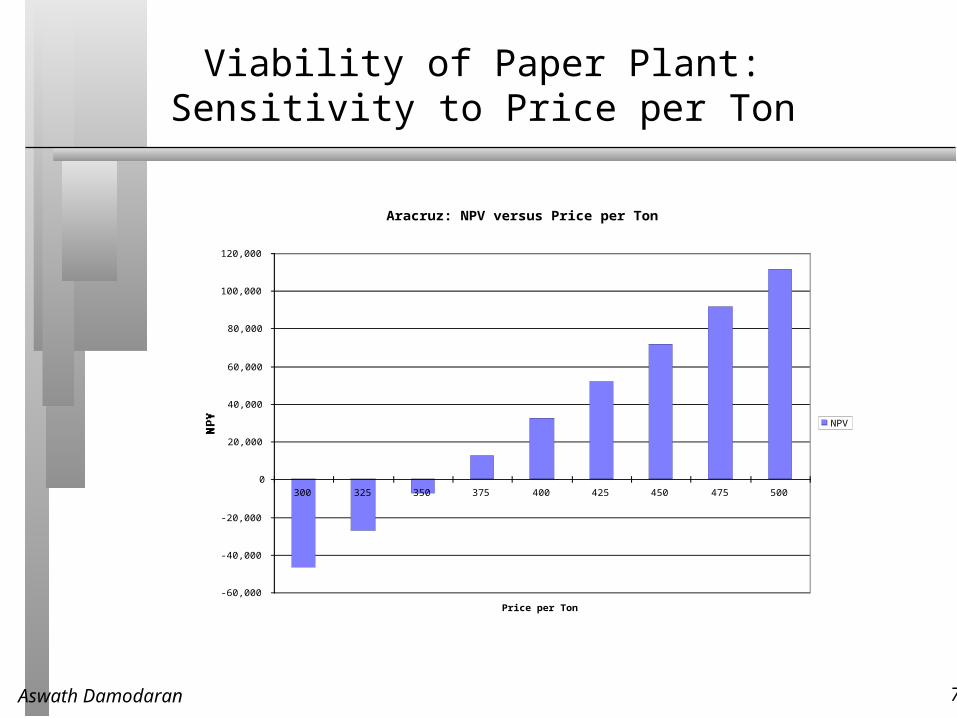
Viability of Paper Plant: Sensitivity to Price per Ton
Aracruz: NPV versus Price per Ton
-60,000
-40,000
-20,000
0
20,000
40,000
60,000
80,000
100,000
120,000
300 325 350 375 400 425 450 475 500
Price per Ton
NPVNPV
Aswath Damodaran 71
What does sensitivity analysis tell us?
Assume that the manager at Aracruz who has to decide on whether to take this plant is very conservative. She looks at the sensitivity analysis and decides not to take the project because the NPV would turn negative if the price drops below $360 per ton. (Though the expected price per ton is $400, there is a significant probability of the price dropping below $360.)Is this the right thing to do?
Yes No
Explain.
Aswath Damodaran 72
Side Costs and Benefits
Most projects considered by any business create side costs and benefits for that business.
The side costs include the costs created by the use of resources that the business already owns (opportunity costs) and lost revenues for other projects that the firm may have.
The benefits that may not be captured in the traditional capital budgeting analysis include project synergies (where cash flow benefits may accrue to other projects) and options embedded in projects (including the options to delay, expand or abandon a project).
The returns on a project should incorporate these costs and benefits.
Aswath Damodaran 73
Opportunity Cost
An opportunity cost arises when a project uses a resource that may already have been paid for by the firm.
When a resource that is already owned by a firm is being considered for use in a project, this resource has to be priced on its next best alternative use, which may be• a sale of the asset, in which case the opportunity cost is the expected
proceeds from the sale, net of any capital gains taxes
• renting or leasing the asset out, in which case the opportunity cost is the expected present value of the after-tax rental or lease revenues.
• use elsewhere in the business, in which case the opportunity cost is the cost of replacing it.
Aswath Damodaran 74
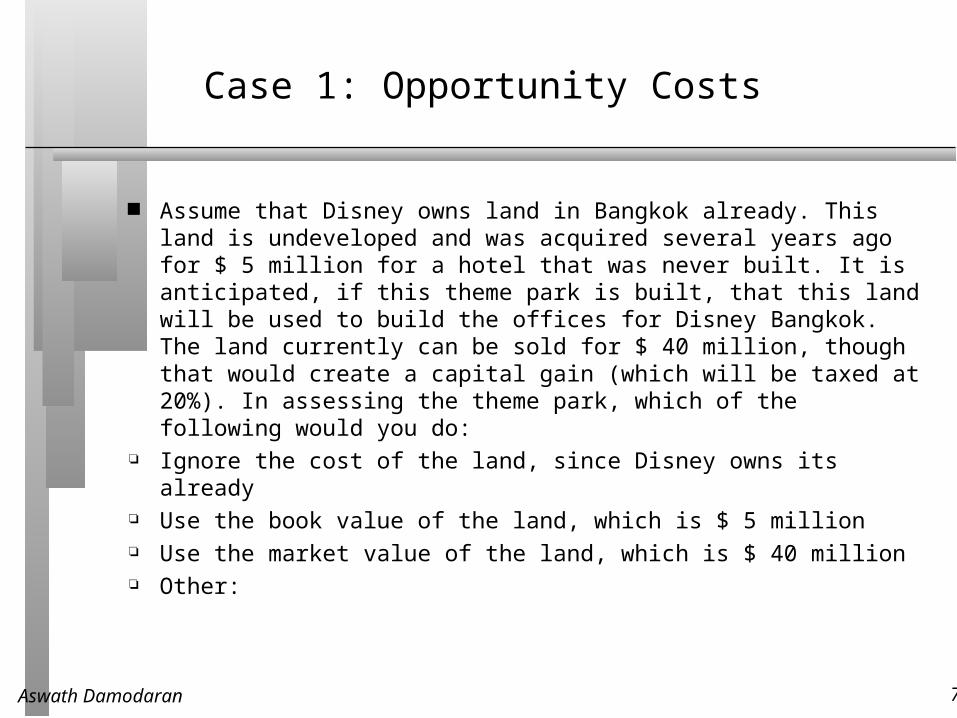
Case 1: Opportunity Costs
Assume that Disney owns land in Bangkok already. This land is undeveloped and was acquired several years ago for $ 5 million for a hotel that was never built. It is anticipated, if this theme park is built, that this land will be used to build the offices for Disney Bangkok. The land currently can be sold for $ 40 million, though that would create a capital gain (which will be taxed at 20%). In assessing the theme park, which of the following would you do:
Ignore the cost of the land, since Disney owns its already Use the book value of the land, which is $ 5 million Use the market value of the land, which is $ 40 million Other:
Aswath Damodaran 75
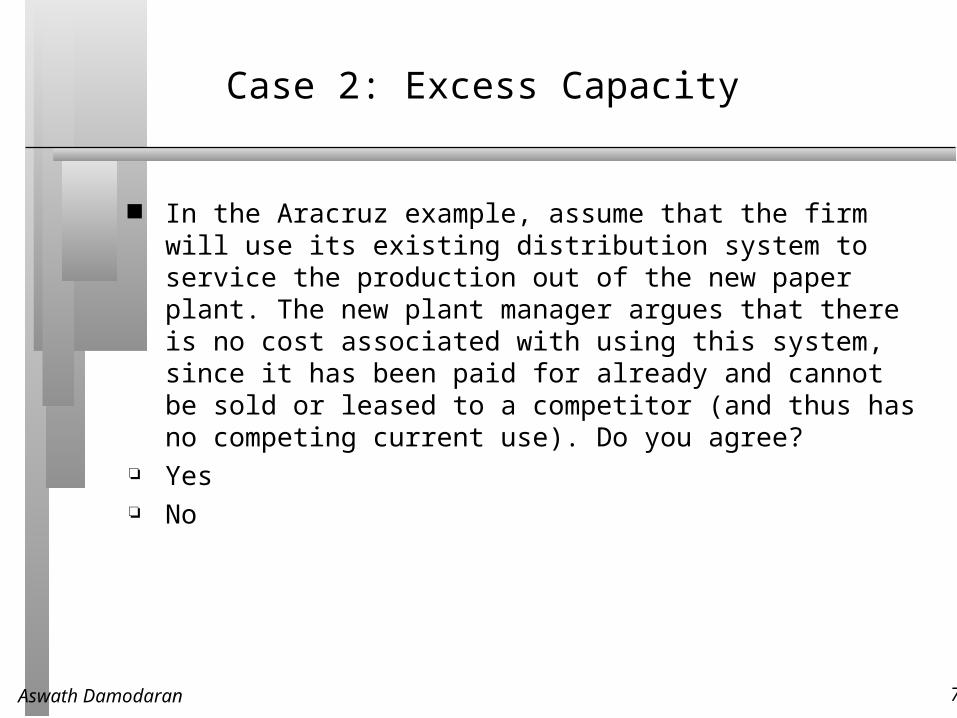
Case 2: Excess Capacity
In the Aracruz example, assume that the firm will use its existing distribution system to service the production out of the new paper plant. The new plant manager argues that there is no cost associated with using this system, since it has been paid for already and cannot be sold or leased to a competitor (and thus has no competing current use). Do you agree?
Yes No
Aswath Damodaran 76
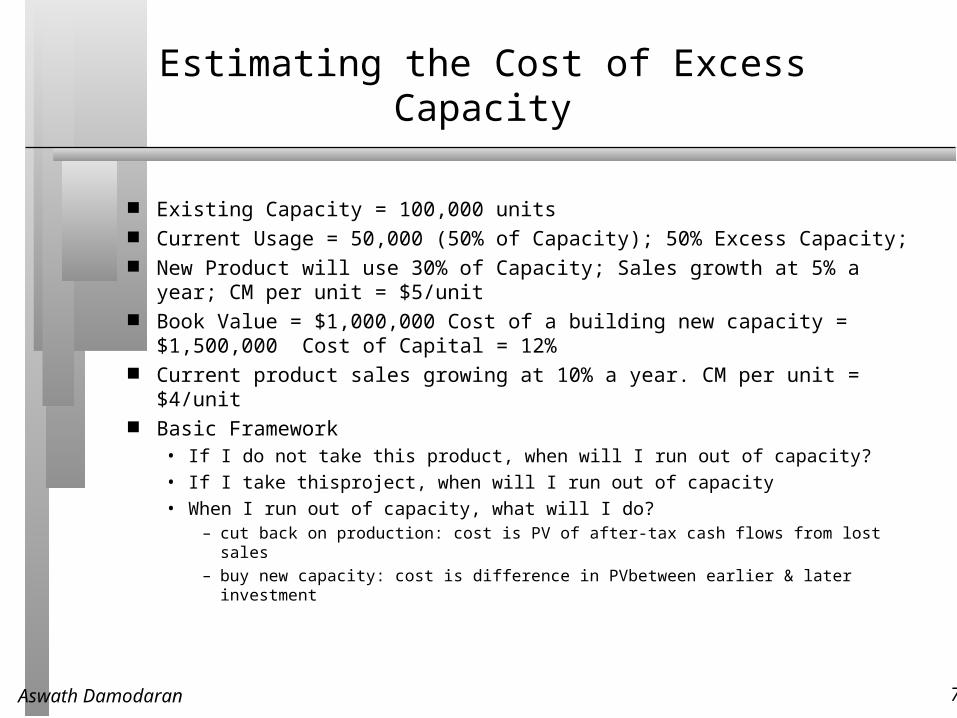
Estimating the Cost of Excess Capacity
Existing Capacity = 100,000 units Current Usage = 50,000 (50% of Capacity); 50% Excess Capacity; New Product will use 30% of Capacity; Sales growth at 5% a year; CM
per unit = $5/unit Book Value = $1,000,000 Cost of a building new capacity = $1,500,000
Cost of Capital = 12% Current product sales growing at 10% a year. CM per unit = $4/unit Basic Framework
• If I do not take this product, when will I run out of capacity?• If I take thisproject, when will I run out of capacity• When I run out of capacity, what will I do?
– cut back on production: cost is PV of after-tax cash flows from lost sales
– buy new capacity: cost is difference in PVbetween earlier & later investment
Aswath Damodaran 77
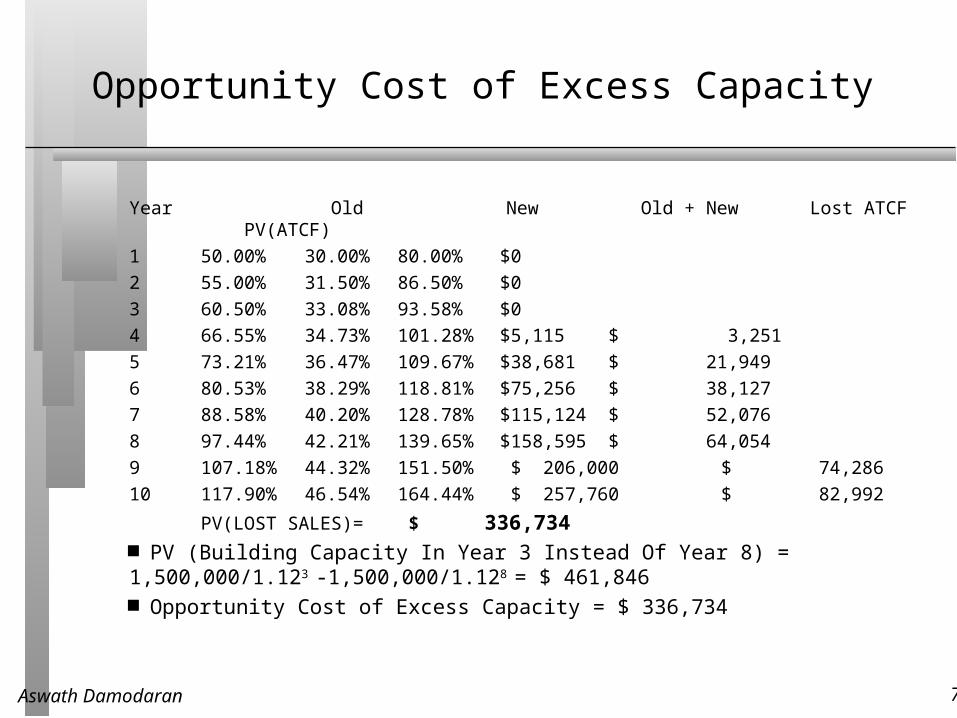
Opportunity Cost of Excess Capacity
Year Old New Old + New Lost ATCF PV(ATCF)
1 50.00% 30.00% 80.00% $0
2 55.00% 31.50% 86.50% $0
3 60.50% 33.08% 93.58% $0
4 66.55% 34.73% 101.28% $5,115 $ 3,251
5 73.21% 36.47% 109.67% $38,681 $ 21,949
6 80.53% 38.29% 118.81% $75,256 $ 38,127
7 88.58% 40.20% 128.78% $115,124 $ 52,076
8 97.44% 42.21% 139.65% $158,595 $ 64,054
9 107.18% 44.32% 151.50% $ 206,000 $ 74,286
10 117.90% 46.54% 164.44% $ 257,760 $ 82,992
PV(LOST SALES)= $ 336,734 PV (Building Capacity In Year 3 Instead Of Year 8) = 1,500,000/1.123 -1,500,000/1.128 = $ 461,846 Opportunity Cost of Excess Capacity = $ 336,734
Aswath Damodaran 78
Costs for Other Projects
Projects often create side-costs for other projects. The key question that has to be asked then is: Is this an incremental cost, as a result of the project, or would it have occurred anyway?
If it is an incremental cost, it should be considered in project analysis. If it would have occurred anyway, it should be ignored.
Aswath Damodaran 79
Product and Project Cannibalization: A Real Cost?
Assume that in the Disney theme park example, 20% of the revenues at the Bangkok Disney park are expected to come from people who would have gone to Disneyland in Anaheim, California. In doing the analysis of the park, would you
Look at only incremental revenues (i.e. 80% of the total revenue) Look at total revenues at the park Choose an intermediate number
Would your answer be different if you were analyzing whether to introduce a new show on the Disney cable channel on Saturday mornings that is expected to attract 20% of its viewers from ABC (which is also owned by Disney)?
Yes No
Aswath Damodaran 80
Project Synergies
A project may provide benefits for other projects within the firm. If this is the case, these benefits have to be valued and shown in the initial project analysis.
Consider, for instance, a typical Disney animated movie. Assume that it costs $ 50 million to produce and promote. This movie, in addition to theatrical revenues, also produces revenues from• the sale of merchandise (stuffed toys, plastic figures, clothes ..)
• increased attendance at the theme parks
• stage shows (see “Beauty and the Beast” and the “Lion King”)
• television series based upon the movie
Aswath Damodaran 81
Project Options
One of the limitations of traditional investment analysis is that it is static and does not do a good job of capturing the options embedded in investment.• The first of these options is the option to delay taking a project, when a
firm has exclusive rights to it, until a later date.
• The second of these options is taking one project may allow us to take advantage of other opportunities (projects) in the future
• The last option that is embedded in projects is the option to abandon a project, if the cash flows do not measure up.
These options all add value to projects and may make a “bad” project (from traditional analysis) into a good one.
Aswath Damodaran 82
The Option to Delay
When a firm has exclusive rights to a project or product for a specific period, it can delay taking this project or product until a later date.
A traditional investment analysis just answers the question of whether the project is a “good” one if taken today.
Thus, the fact that a project does not pass muster today (because its NPV is negative, or its IRR is less than its hurdle rate) does not mean that the rights to this project are not valuable.
Aswath Damodaran 83
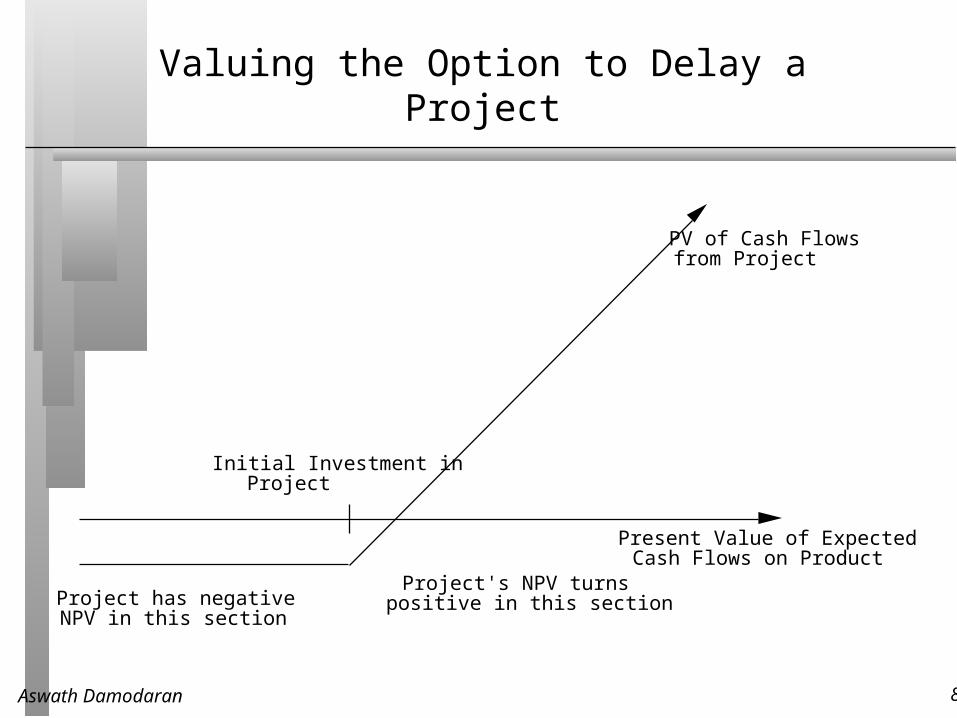
Valuing the Option to Delay a Project
Present Value of Expected Cash Flows on Product
PV of Cash Flows from Project
Initial Investment in Project
Project has negativeNPV in this section
Project's NPV turns positive in this section
Aswath Damodaran 84
Insights for Investment Analyses
Having the exclusive rights to a product or project is valuable, even if the product or project is not viable today.
The value of these rights increases with the volatility of the underlying business.
The cost of acquiring these rights (by buying them or spending money on development - R&D, for instance) has to be weighed off against these benefits.
Aswath Damodaran 85
The Option to Expand/Take Other Projects
Taking a project today may allow a firm to consider and take other valuable projects in the future.
Thus, even though a project may have a negative NPV, it may be a project worth taking if the option it provides the firm (to take other projects in the future) provides a more-than-compensating value.
These are the options that firms often call “strategic options” and use as a rationale for taking on “negative NPV” or even “negative return” projects.
Aswath Damodaran 86
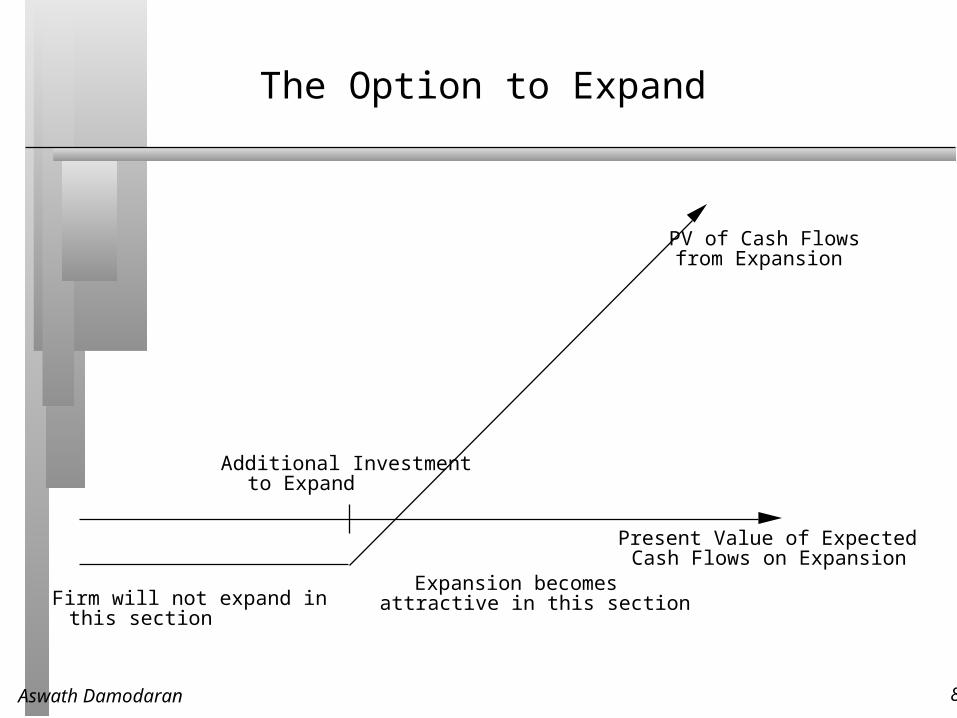
The Option to Expand
Present Value of Expected Cash Flows on Expansion
PV of Cash Flows from Expansion
Additional Investment to Expand
Firm will not expand inthis section
Expansion becomes attractive in this section
Aswath Damodaran 87
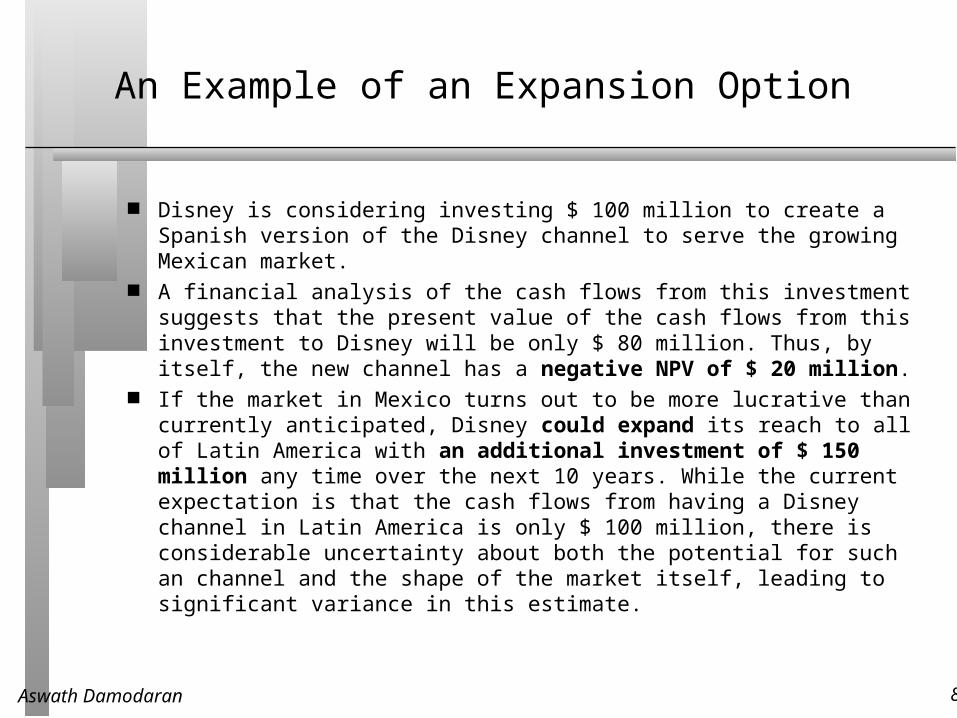
An Example of an Expansion Option
Disney is considering investing $ 100 million to create a Spanish version of the Disney channel to serve the growing Mexican market.
A financial analysis of the cash flows from this investment suggests that the present value of the cash flows from this investment to Disney will be only $ 80 million. Thus, by itself, the new channel has a negative NPV of $ 20 million.
If the market in Mexico turns out to be more lucrative than currently anticipated, Disney could expand its reach to all of Latin America with an additional investment of $ 150 million any time over the next 10 years. While the current expectation is that the cash flows from having a Disney channel in Latin America is only $ 100 million, there is considerable uncertainty about both the potential for such an channel and the shape of the market itself, leading to significant variance in this estimate.
Aswath Damodaran 88
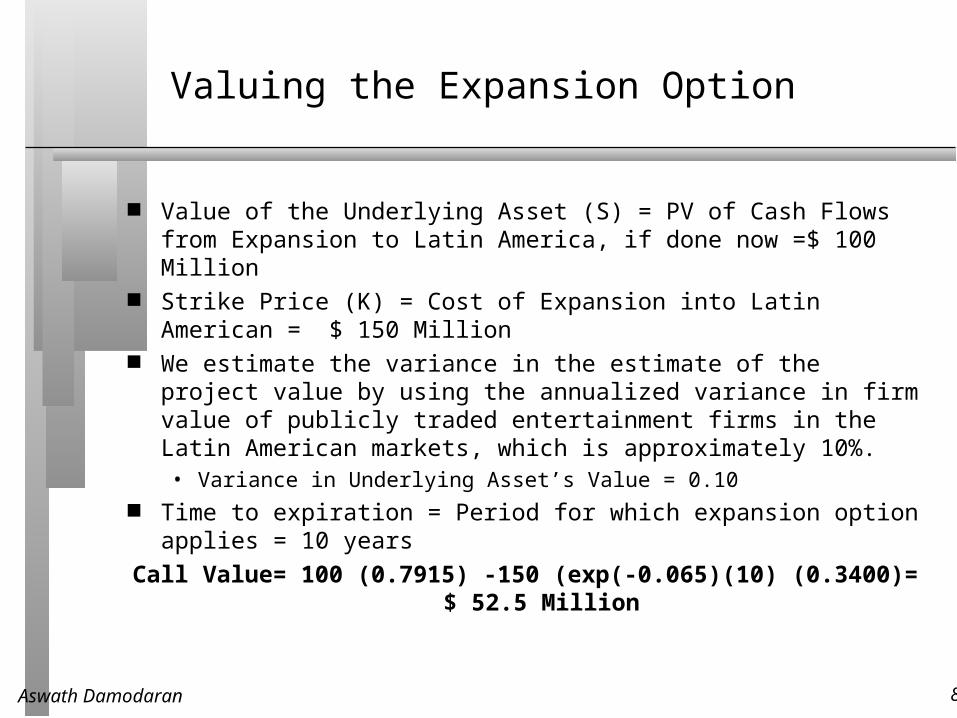
Valuing the Expansion Option
Value of the Underlying Asset (S) = PV of Cash Flows from Expansion to Latin America, if done now =$ 100 Million
Strike Price (K) = Cost of Expansion into Latin American = $ 150 Million
We estimate the variance in the estimate of the project value by using the annualized variance in firm value of publicly traded entertainment firms in the Latin American markets, which is approximately 10%. • Variance in Underlying Asset’s Value = 0.10
Time to expiration = Period for which expansion option applies = 10 years
Call Value= 100 (0.7915) -150 (exp(-0.065)(10) (0.3400)= $ 52.5 Million
Aswath Damodaran 89
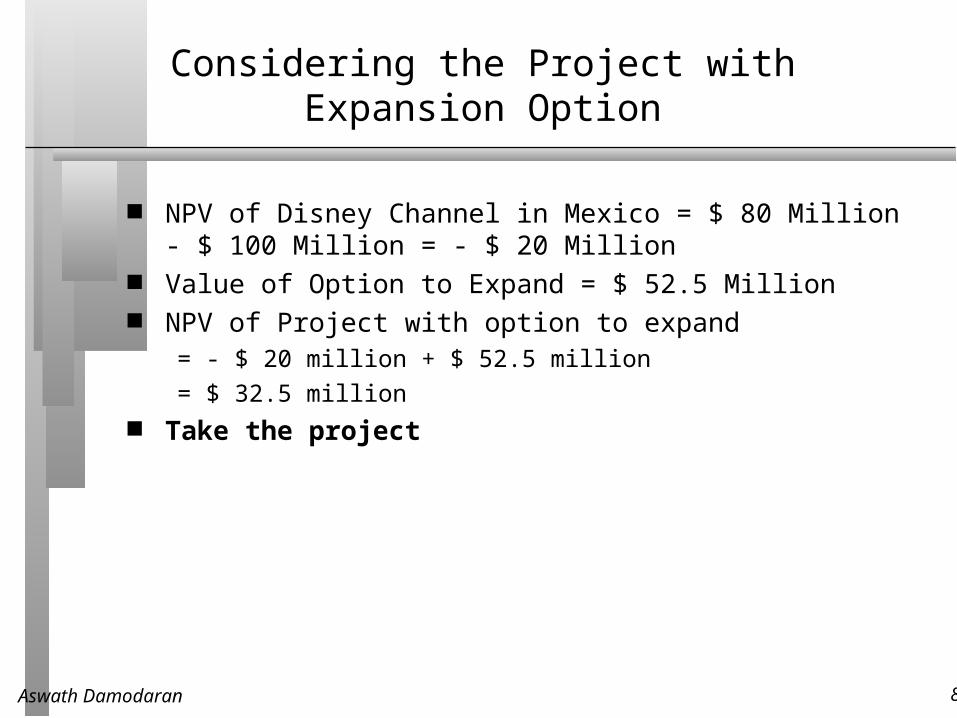
Considering the Project with Expansion Option
NPV of Disney Channel in Mexico = $ 80 Million - $ 100 Million = - $ 20 Million
Value of Option to Expand = $ 52.5 Million NPV of Project with option to expand
= - $ 20 million + $ 52.5 million
= $ 32.5 million Take the project
Aswath Damodaran 90
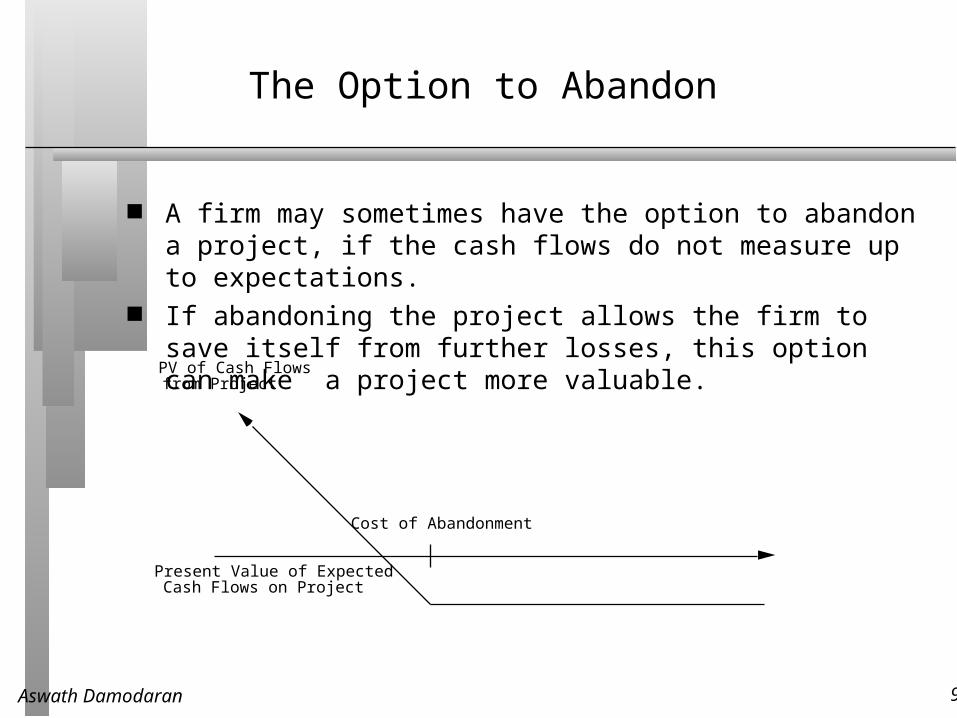
The Option to Abandon
A firm may sometimes have the option to abandon a project, if the cash flows do not measure up to expectations.
If abandoning the project allows the firm to save itself from further losses, this option can make a project more valuable.
Present Value of Expected Cash Flows on Project
PV of Cash Flows from Project
Cost of Abandonment
Aswath Damodaran 91
Valuing the Option to Abandon
Disney is considering taking a 25-year project which• requires an initial investment of $ 250 million in an real estate
partnership to develop time share properties with a South Florida real estate developer,
• has a present value of expected cash flows is $ 254 million. While the net present value of $ 4 million is small, assume that Disney
has the option to abandon this project anytime by selling its share back to the developer in the next 5 years for $ 150 million.
A simulation of the cash flows on this time share investment yields a variance in the present value of the cash flows from being in the partnership is 0.09.
Aswath Damodaran 92
Project with Option to Abandon
Value of the Underlying Asset (S) = PV of Cash Flows from Project= $ 254 million
Strike Price (K) = Salvage Value from Abandonment = $ 150 million Variance in Underlying Asset’s Value = 0.09 Time to expiration = Life of the Project =5 years Dividend Yield = 1/Life of the Project = 1/25 = 0.04 (We are
assuming that the project’s present value will drop by roughly 1/n each year into the project)
Assume that the five-year riskless rate is 7%. The value of the put option can be estimated as follows:
Aswath Damodaran 93
Should Disney take this project?
Call Value = 254 exp(0.04)(5) (0.9105) -150 (exp(-0.07)(5) (0.7496) = $ 110.12 million
Put Value= $ 110.12 - 254 exp(0.04)(5) +150 (exp(-0.07)(5) = $ 7.86 million
The value of this abandonment option has to be added on to the net present value of the project of $ 4 million, yielding a total net present value with the abandonment option of $ 11.86 million.
Aswath Damodaran 94
Back to First Principles
Invest in projects that yield a return greater than the minimum acceptable hurdle rate.• The hurdle rate should be higher for riskier projects and reflect the
financing mix used - owners’ funds (equity) or borrowed money (debt)
• Returns on projects should be measured based on cash flows generated and the timing of these cash flows; they should also consider both positive and negative side effects of these projects.
Choose a financing mix that minimizes the hurdle rate and matches the assets being financed.
If there are not enough investments that earn the hurdle rate, return the cash to stockholders.• The form of returns - dividends and stock buybacks - will depend upon
the stockholders’ characteristics.