astronomy and formation of groups and clusters of...
TRANSCRIPT

Astron. Astrophys. 341, 1–7 (1999) ASTRONOMYAND
ASTROPHYSICS
Formation of groups and clusters of galaxies
Alexander Knebe and Volker Muller
Astrophysikalisches Institut Potsdam, An der Sternwarte 16, D-14482 Potsdam, Germany
Received 30 March 1998 / Accepted 25 September 1998
Abstract. The formation, inner properties, and spatial distri-bution of galaxy groups and clusters are closely related to thebackground cosmological model. We use numerical simulationsof variants of the CDM model with different cosmological pa-rameters and distinguish relaxed objects from recent mergersusing the degree of virialisation. Mergers occur mostly in deeppotential wells and mark the most important structure forma-tion processes. As a consequence, the autocorrelation functionof merged halos has a higher amplitude and is steeper than thatof the virialized clusters. This can be directly connected to thesame result found from the observation of luminous infraredgalaxies; they are as well more strongly correlated and can pri-marily be identified with ongoing merging events.
Key words: cosmology: observations – cosmology: large-scalestructure of Universe
1. Introduction
Gravitational instability is commonly accepted as the basicmechanism for structure formation on large scales. Combinedwith the CDM model it leads to the picture of hierarchical clus-tering with wide support from deep galaxy and cluster observa-tions. During the recent phase of cosmic evolution groups andclusters of galaxies condense from large scale density enhance-ments, and they grow by accretion and merger processes of theenvironmental cosmic matter. We expect traces of such recentformation processes still in presently observed objects, such asdeviations from virial equilibrium, eccentric shapes, and sub-structures. X-ray observations of clusters show a large varietyof morphologies which hopefully could discriminate betweendifferent cosmologies (Mohr et al. 1995). In lowΩ0 universesstructure formation ceases at earlier times compared to cosmo-logical models with a higher value for the density parameter. Onthe contrary, recent simulations show a remarkable similarity ofinternal structures as the average density profile when they arecompared at rescaled radii normalized to a typical scale as thevirial radius (Jing et al. 1995, Thomas et al. 1997). For theseanalyses they concentrate on a sample of isolated clusters in highresolution cosmological simulations which emphasizes the re-laxed structure found. In the contrary, we intend to concentrate
on the appearance and the clustering of a sample of simulatedclusters showing evidence of perturbations and interaction. Wediscuss cluster formation using dissipationlessN -body simula-tions of variants of the CDM model with different cosmologicalparametersΩ0, Λ0, andH0 = 100h km s−1Mpc−1, whereh isthe Hubble parameter in units of 100 kms−1Mpc−1. Our goalis to interpret the simulated data of the structure and spatial dis-tribution of groups and clusters which can discriminate betweenthe models, and which can also help to get an understanding ofthe physics underlying the formation of these objects.
One of the critical questions inN -body simulations is theidentification of groups and clusters of galaxies. There areseveral methods such as the standard friends-of-friends algo-rithm (FOF) introduced by Davis et al. (1985), the spheri-cal overdensity method described by Lacey & Cole (1994) ormore refined algorithm just as the DENMAX procedure (Gelb& Bertschinger 1994) or the hierarchical FOF group finding(Klypin et al. 1997). But it is by no means clear which of thesemethods best fits the observational procedures for identifyinggroups and clusters of galaxies. We decided to use the stan-dard FOF group finder because this algorithm picks up particlegroups without preferring any special geometry. Additionallywe adopted the virial theorem: particle groups that do not obeythis relation are investigated in detail. Visual inspection of suchobjects often shows the FOF group finder’s tendency to link sep-arate groups by small bridges, and groupings of particles withstrongly discordant velocities. Quantifying their number andspecifics helps in understanding some of the most impressiveobjects in the large scale matter distribution of the universe. Weshould remark that among the unvirialized groups, there existsa number of low mass badly resolved objects which are not ofinterest in this study.
The outline of the paper is as follows. First we specify theN -body simulations. Next we discuss the cluster halos and theirproperties. In Sect. 4 we study the spatial clustering of the differ-ent groups. We conclude with a discussion of our main results.
2. CosmologicalN -body simulations
We base our analysis on four cosmological models all with anamplitude as measured by the 4-year COBE experiment, cf.Bunn & White (1997). First we take the standard CDM-model,
2 A. Knebe & V. Muller: Formation of groups and clusters of galaxies
Table 1. Physical properties of the numerical simulations. The boxsize L is given in h−1Mpc, the particle massmp in units of1011 h−1M.
Ω0 ΩΛ,0 h σ8 L mp
SCDM 1.0 0.0 0.5 1.18 200 11.0ΛCDM 0.3 0.7 0.7 1.00 280 8.7OCDM1 0.3 0.0 0.7 0.48 280 8.7OCDM2 0.5 0.0 0.7 0.96 280 15.0
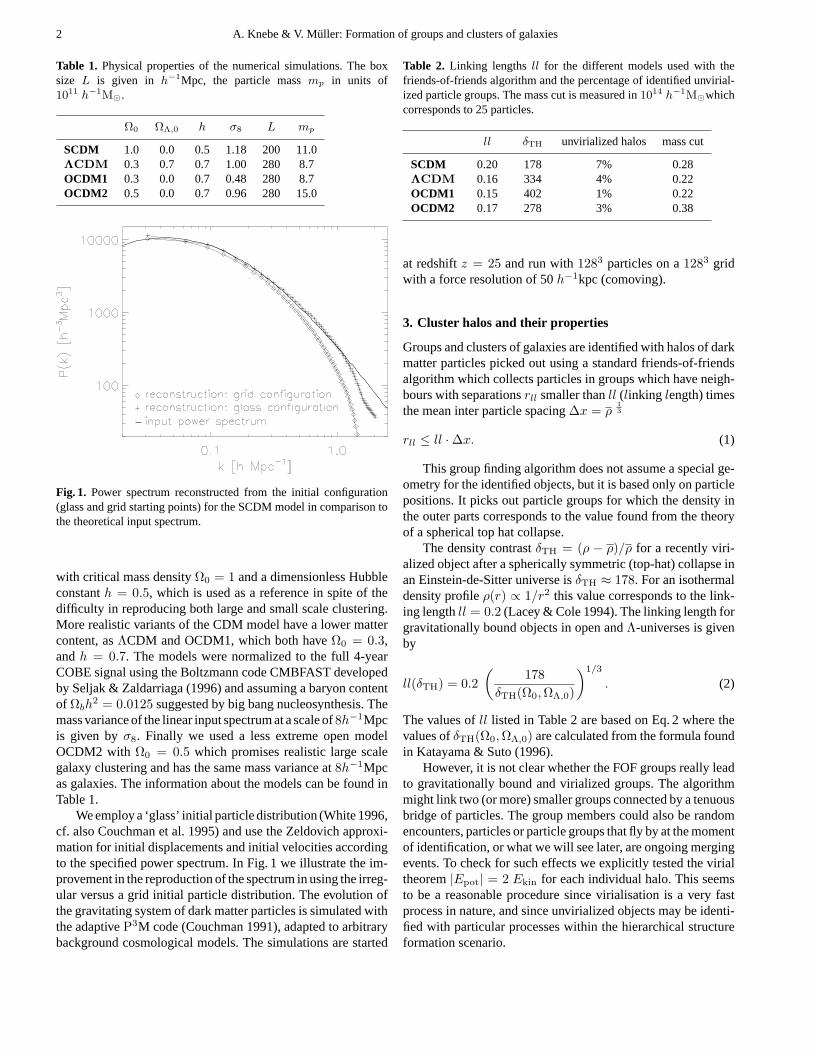
Fig. 1. Power spectrum reconstructed from the initial configuration(glass and grid starting points) for the SCDM model in comparison tothe theoretical input spectrum.
with critical mass densityΩ0 = 1 and a dimensionless Hubbleconstanth = 0.5, which is used as a reference in spite of thedifficulty in reproducing both large and small scale clustering.More realistic variants of the CDM model have a lower mattercontent, asΛCDM and OCDM1, which both haveΩ0 = 0.3,andh = 0.7. The models were normalized to the full 4-yearCOBE signal using the Boltzmann code CMBFAST developedby Seljak & Zaldarriaga (1996) and assuming a baryon contentof Ωbh
2 = 0.0125 suggested by big bang nucleosynthesis. Themass variance of the linear input spectrum at a scale of8h−1Mpcis given byσ8. Finally we used a less extreme open modelOCDM2 with Ω0 = 0.5 which promises realistic large scalegalaxy clustering and has the same mass variance at8h−1Mpcas galaxies. The information about the models can be found inTable 1.
We employ a ‘glass’ initial particle distribution (White 1996,cf. also Couchman et al. 1995) and use the Zeldovich approxi-mation for initial displacements and initial velocities accordingto the specified power spectrum. In Fig. 1 we illustrate the im-provement in the reproduction of the spectrum in using the irreg-ular versus a grid initial particle distribution. The evolution ofthe gravitating system of dark matter particles is simulated withthe adaptiveP3M code (Couchman 1991), adapted to arbitrarybackground cosmological models. The simulations are started
Table 2. Linking lengthsll for the different models used with thefriends-of-friends algorithm and the percentage of identified unvirial-ized particle groups. The mass cut is measured in1014 h−1Mwhichcorresponds to 25 particles.
ll δTH unvirialized halos mass cut
SCDM 0.20 178 7% 0.28ΛCDM 0.16 334 4% 0.22OCDM1 0.15 402 1% 0.22OCDM2 0.17 278 3% 0.38
at redshiftz = 25 and run with1283 particles on a1283 gridwith a force resolution of 50h−1kpc (comoving).
3. Cluster halos and their properties
Groups and clusters of galaxies are identified with halos of darkmatter particles picked out using a standard friends-of-friendsalgorithm which collects particles in groups which have neigh-bours with separationsrll smaller thanll (linking length) timesthe mean inter particle spacing∆x = ρ
13
rll ≤ ll · ∆x. (1)
This group finding algorithm does not assume a special ge-ometry for the identified objects, but it is based only on particlepositions. It picks out particle groups for which the density inthe outer parts corresponds to the value found from the theoryof a spherical top hat collapse.
The density contrastδTH = (ρ − ρ)/ρ for a recently viri-alized object after a spherically symmetric (top-hat) collapse inan Einstein-de-Sitter universe isδTH ≈ 178. For an isothermaldensity profileρ(r) ∝ 1/r2 this value corresponds to the link-ing lengthll = 0.2 (Lacey & Cole 1994). The linking length forgravitationally bound objects in open andΛ-universes is givenby
ll(δTH) = 0.2(
178δTH(Ω0,ΩΛ,0)
)1/3
. (2)
The values ofll listed in Table 2 are based on Eq. 2 where thevalues ofδTH(Ω0,ΩΛ,0) are calculated from the formula foundin Katayama & Suto (1996).
However, it is not clear whether the FOF groups really leadto gravitationally bound and virialized groups. The algorithmmight link two (or more) smaller groups connected by a tenuousbridge of particles. The group members could also be randomencounters, particles or particle groups that fly by at the momentof identification, or what we will see later, are ongoing mergingevents. To check for such effects we explicitly tested the virialtheorem|Epot| = 2 Ekin for each individual halo. This seemsto be a reasonable procedure since virialisation is a very fastprocess in nature, and since unvirialized objects may be identi-fied with particular processes within the hierarchical structureformation scenario.

A. Knebe & V. Muller: Formation of groups and clusters of galaxies 3
Fig. 2. Virial theorem for clusters in theΛCDM model (units are arbi-trary).
Following Spitzer (1969), the potential energy can be ap-proximated by
|Epot,approx| ≈ 0.4 GM2
rh, (3)
whererh is the half-mass radius of the system. For the smallerhalos the potential energy calculated using Eq. 3 can be com-pared with the direct summation
|Epot,direct| =N∑
i=1
N∑j=i+1
Gmimj
|ri − rj | (4)
This shows that the factor 0.4 is a good choice for most of theclusters.
|Epot,approx| . |Epot,direct| (5)
Therefore, the approximation given by Eq. 3 is used throughoutthe further analysis.
The kinetic energy of an identified object is calculated bysumming over all particle velocities with respect to the motionof the cluster centre
Ekin =12
N∑i=1
mi(vi − vcentre)2. (6)
Since all particles have the same massm ≡ mi the kineticenergy can be connected to the velocity dispersion,
σ2v =
2Nm
Ekin. (7)
Fig. 2 shows the virial relation as a scatter plot for all par-ticle groups identified in theΛCDM model at a redshift ofz = 0. The ‘lower’ virial relation shown by the straight line,|Epot| ≈ 1.8 Ekin, can be understood as the influence ofan outer pressure of radially infalling particles into the halos(Cole & Lacey 1996). The bend of the virial relation at low en-ergies towards the theoretical expectation proves that the surface
Fig. 3. Relation between velocity dispersion and the mass for theΛCDM model. The virialized halos are marked with points and theobjects that are not in virial equilibrium are marked using diamonds.The solid line is a fit to the scaling relationσv ∝ M
13 .
influence becomes less important for groups of small particlenumbers, i.e. their stage is less influenced by a steady accretionrate than the high mass halos. An opposite effect concerns amuch smaller number of groups with velocity dispersions whichare too high compared to their potential energy. These clustersare considered unvirialized and are treated separately in the fol-lowing analysis, and are investigated in detail. There are manymore unvirialized FOF-groups of low and intermediate rich-ness. In Table 2 we give the percentage of unvirialized objectsamong all FOF clusters for the different cosmological models.It becomes obvious that the percentage of unvirialized groups ishighest in SCDM and lowest in OCDM1. This reflects the earlyformation of groups in lowΩ0 models, but also theΛCDMmodel has a higher percentage of unvirialized groups in com-parison to OCDM1.
Now we investigate in more detail the nature of the halosthat are not gravitationally bound.
3.1. Velocity dispersion – mass
First we discuss the correlation of velocity dispersion and themass of virialized and unbound groups. We expect a tight cor-relation of both quantities for virialized objects if we assume anisothermal sphere for the halo and a cutoff at constant density,which can easily be taken to be the mean cosmic density of thehalos at the time when they form or suffer their last big merger.Since most halos form quite recently this cutoff is almost con-stant, and we get
σv = Vc/√
2 ∝ M13 . (8)
As can be seen from Fig. 3 this is represented very well in oursimulations with a large scatter for the light clusters which wasalso found by Cole & Lacey (1996); we have fitted the data forthe virialized particle groups to the scaling relationσv ∝ Mα

4 A. Knebe & V. Muller: Formation of groups and clusters of galaxies
whereα was found to be exactly 1/3. Fig. 3 also suggests thatthe unvirialized objects mostly lie at the low mass end of the dis-tribution with high velocity dispersions. Cole & Lacey (1996)argue that the tail of groups withσv > Vc/
√2 likely repre-
sent objects that belong to larger virialized structures. But if werepeat our analysis using a larger linking lengthll we derivesimilar results: even for FOF groups identified with a linkinglength corresponding to an overdensityδ δTH we find un-bound groups in the tailσv > Vc/
√2 in contradiction to the
claim of Cole & Lacey (1996). It should be mentioned that atthe low mass end the FOF groups are not well resolved becausethese objects consist only of few particles. More interesting thanthe low mass groups are the small number of halos of all masses,lying beneath the virial relationσv = Vc/
√2. They represent
groups in the process of merging which are unbound becausethey are too extended. In most cases they represent halos withmore then one centre which are connected by slight tidal bridgesand similar structures. These systems are not very frequent, i.e.they do not survive for a long time, but they mark most inter-esting places in the simulation box. And it can be expected thatthey are sites for active structure formation processes in nature.
The results for the different cosmological models introducedin Table 1 are comparable and therefore only a plot for theΛCDM model is presented.
3.2. Eigenvalues of the inertia tensor
The next point we are going to investigate is the shape and theaxis ratios of the identified galaxy clusters. To this aim we cal-culate the eigenvalues of the inertia tensor for each FOF group,which are given in the ordera > b > c. In Fig. 4 we showa scatter plot of the ratios of the eigenvalues for theΛCDM-simulation atz = 0. In this plot, spherical groups are situatedin the upper right corner, oblate clusters in the right and prolateclusters in the upper part. It is well known (Dubinsky 1992, War-ren et al. 1992, Cole & Lacey 1996) that hierarchical clusteringleads to triaxial ellipsoids with a typical axis ratio of 1:0.7:0.5which is well represented by our simulations.
The unvirialized halos inhabit more the lower left part of thediagram, again characterizing the soft merging, i.e. the elonga-tion of the groups due to tidal interaction of the progenitorswhich marks the direction of the encounters, and in some casesto an elongation of the clusters in a second direction due tonon-central encounters. Typically unvirialized clusters have anaxis ratio of 1:0.4:0.3, i.e. they are more oblate and in generaldeviate stronger from sphericity than virialized clusters.
These findings again to not depend strongly on the the cos-mological background model. We get similar axis ratios whenlooking at the SCDM or the OCDM2 model.
3.3. Impact parameters
Let us now discuss how the impact parameter and the rela-tive motion between mergers influences the virialisation of themerger products. To this aim we consider merging events occur-ring from redshiftz = 0.1 to z = 0.0 between particle groups
Fig. 4. Axis ratio of virialized (dots) and unvirialized groups (dia-monds) for theΛCDM-simulation atz = 0.
Table 3.Mean values for the impact parameter (inh−1 Mpc) separatedfor virialized and unvirialized objects.
virialized objects unvirialized objects
SCDM 0.92± 0.60 1.19± 0.59ΛCDM 0.91± 0.45 1.18± 0.48OCDM2 0.91± 0.48 1.26± 0.50
Table 4.Mean values for the impact velocities (in km/s) separated forvirialized and unvirialized objects.
virialized objects unvirialized objects
SCDM 670± 500 900± 450ΛCDM 560± 300 600± 280OCDM2 640± 380 830± 350
containing more than 25 particles, and we specialize on halosfor which the mass ratio of the two most massive progenitorsis greater than 1/3. The results are listed in Table 3 where wehave neglected the analysis of the OCDM1 model; this modelis outstanding because of our normalisation. It does not pro-duce enough galaxy clusters so that the examination of mergingevents will not provide reasonable results as can be seen by thevery low percentage of unvirialized objects in Table 2.
Using the same constraints on the identification of mergerswe have calculated the mean values for the impact velocities.The results can be found in Table 4 and show that the two mostmassive progenitors of clusters that are identified to be not invirial equilibrium collide with slightly higher velocities com-pared to the impact velocities of progenitors leading to virializedobjects.
As we can see from Table 3 the mean value of the impactparameter for non-virialized particle groups is slightly largerthan the corresponding value for bound objects. This again is

A. Knebe & V. Muller: Formation of groups and clusters of galaxies 5
Table 5. Percentage of objects that have virialized from redshiftz =0.2 toz = 0.1 andz = 0.1 toz = 0.0. Again a masscut of 25 particleshas been used.
z = 0.2 → z = 0.1 z = 0.1 → z = 0.0
SCDM (74± 4)% (63± 4)%ΛCDM (46± 6)% (90± 5)%OCDM2 (83± 7)% (84± 7)%
a hint for a merging event where the two progenitors had notenough time to relax to a gravitational bound object, they havejust started to conflate.
3.4. Virialisation
If the unvirialized objects are ongoing mergers they should leadto gravitational bound objects after a short phase of relaxation.This is going to be checked now. We identify unvirialized par-ticle groups at a redshift ofz = 0.1 (0.2) and have a look atthe percentage of these objects that are found to be in virialequilibrium at a redshift ofz = 0.0 (0.1).
We can see that most of the unbound particle groups virializebetween the considered redshifts, for theΛCDM model nearlyall objects have settled to virial equilibrium within the redshiftintervalz = 0.1 → z = 0.0. This shows that the time duringwhich the cluster is unbound is very short, virialisation is a fastprocess. The low percentage for theΛCDM model at the earlyredshift can be explained, because we have found that mostof the halos had heavy interaction with the surroundings fromredshift z = 0.2 to z = 0.1, and so they remained in theirnon virial state. Additionally some of the objects identified atredshiftz = 0.2 do not exist anymore at the later redshift: theygot disrupted by tidal forces from nearby objects.
Fig. 5 shows the most massive unvirialized cluster in theSCDM simulation atz = 0 (M = 3 · 1015h−1M) and itstwo almost equal mass progenitors atz = 0.1. Obviously thisis quite a soft merger which means that the relative velocity atz = 0.1 is not much larger than the inner velocity dispersion.The progenitors perform an almost central encounter, duringwhich only a small orbital angular momentum is transferredto increase the spin of the resulting halo, and there is a quicksettling into a new virial equilibrium as the small percentage ofunvirialized objects proves. The absolute value of the velocityvector shown in this plot is arbitrary, just the direction and therelative lengths are correct to give and impression of how thetwo progenitors collide.
4. Correlation functions
One of the basic constraints of cosmological models is the shapeand the amplitude of the two-point correlation function. Formany years it has been the standard way to describe the cluster-ing of galaxies and galaxy clusters. The assumption that galaxies(and clusters) only form from high-density regions above somethreshold valueδc leads to a correlation of points exceeding
Fig. 5.Projections of a cube of(10h−1Mpc)3 of the SCDM simulationbox at redshiftsz = 0.1 and z = 0, containing the most massiveunvirialized cluster. Only the particles in the cluster and in the twomost massive progenitors are shown which are both virialized objects.
this valueδc that is enhanced in comparison to the dark mat-ter correlation function (Kaiser 1984). This effect suggests theintroduction of a biasing parameterb,
ξcluster(r) = b2ξmass(r). (9)
But it is by no means compelling that the bias factor isindependent of scale as we can see from Table 6 and Fig. 6.
If we apply this correlation statistics to our simulations wefind that the unvirialized objects are more strongly correlatedthan the relaxed systems. In Fig. 6 we show this result again onlyfor theΛCDM model. We find that the correlation between viri-alized groups lies only a factor two over the correlation functionof dark matter. We fitted standard power laws
ξ(r) = (r0/r)γ (10)
which are shown in the Fig. 6 as dashed lines. Galaxy groups intheΛCDM model have a correlation lengthr0 ∼ 9 h−1Mpc and
6 A. Knebe & V. Muller: Formation of groups and clusters of galaxies
Fig. 6. Correlation functions for theΛCDM model. Histograms frombelow (atr > 3h−1Mpc) denote dark matter particles, virialized clus-ters (fixed number density ofn = 10−5h3Mpc−3) and unvirializedgroups. The dashed lines are fits with parameters specified in Table 6.
Table 6.Fit parameter of the correlation functions for dark matter (firstcolumn), bound clusters (second column) and unbound clusters (thirdcolumn) for three cosmological models.
dark matter bound groups unbound groupsr0 γ r0 γ N r0 γ
SCDM 5.4 2.3 6.6 1.8 800 9.2 2.5ΛCDM 5.6 2.0 9.3 1.7 2200 13.8 2.5OCDM2 4.5 2.2 7.9 2.0 2200 11.4 2.5
Table 7.Parameter for the correlation functions calculated for differentmass cuts for the virialized halos. The mass cut is given as the numberof particles.
SCDM ΛCDM OCDM2mass cut r0 γ r0 γ r0 γ
25 4.0 2.1 6.2 1.8 5.6 1.750 4.5 1.8 8.3 1.7 6.7 1.9
100 5.1 1.7 9.1 1.7 8.4 2.1
a slopeγ = 1.7. The correlation function turns negative beyond30 h−1Mpc. Fits for the other models are given in Table 6. Toget comparable values for the different cosmologies we fixedthe cluster number density ton = 10−5h3Mpc−3 and usedonly theN = nV most massive clusters for the calculation ofthe correlation function (values forN are given in Table 6, too).Obviously the amplitudes in SCDM and OCDM2 are smallerthan in theΛCDM model, i.e., these models have too smallpower on large scales for describing the clustering of groupsand clusters of galaxies.
In Table 7 we demonstrate the strong dependence of the am-plitude of the correlation function on the mass cuts. High masshalos mark high density maxima in the dark matter distributionwhich are stronger clustered (Kaiser 1984). The slope remains
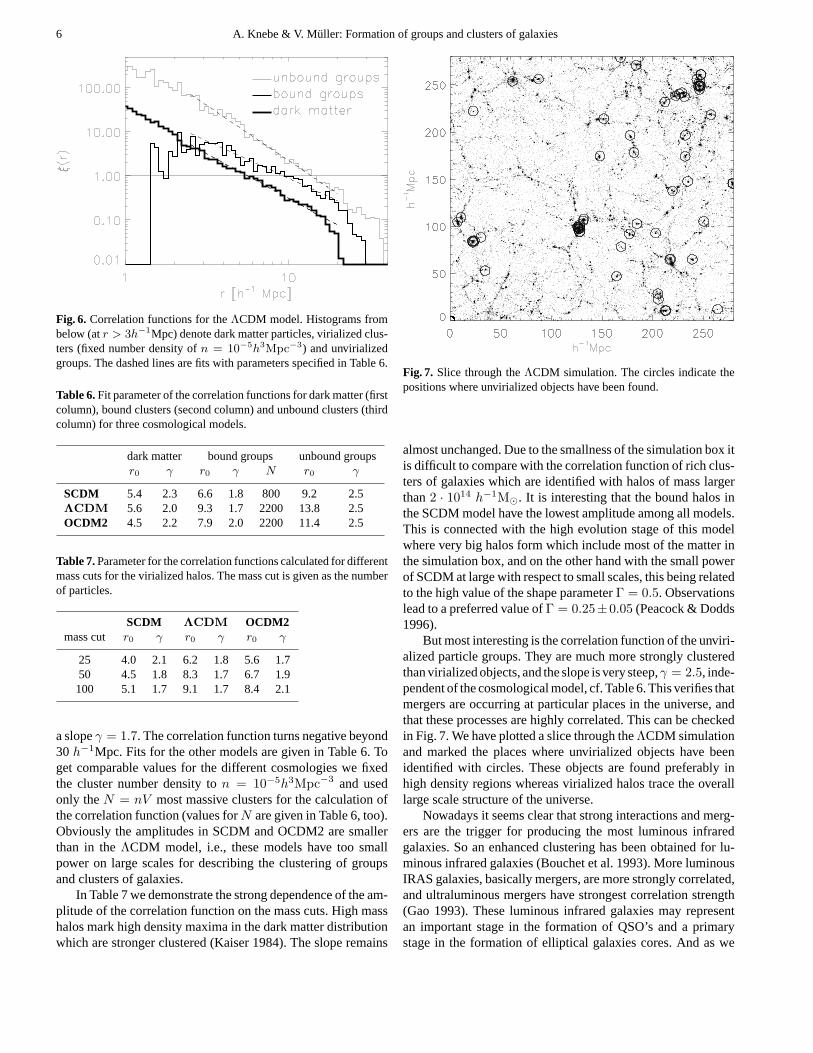
Fig. 7. Slice through theΛCDM simulation. The circles indicate thepositions where unvirialized objects have been found.
almost unchanged. Due to the smallness of the simulation box itis difficult to compare with the correlation function of rich clus-ters of galaxies which are identified with halos of mass largerthan2 · 1014 h−1M. It is interesting that the bound halos inthe SCDM model have the lowest amplitude among all models.This is connected with the high evolution stage of this modelwhere very big halos form which include most of the matter inthe simulation box, and on the other hand with the small powerof SCDM at large with respect to small scales, this being relatedto the high value of the shape parameterΓ = 0.5. Observationslead to a preferred value ofΓ = 0.25±0.05 (Peacock & Dodds1996).
But most interesting is the correlation function of the unviri-alized particle groups. They are much more strongly clusteredthan virialized objects, and the slope is very steep,γ = 2.5, inde-pendent of the cosmological model, cf. Table 6. This verifies thatmergers are occurring at particular places in the universe, andthat these processes are highly correlated. This can be checkedin Fig. 7. We have plotted a slice through theΛCDM simulationand marked the places where unvirialized objects have beenidentified with circles. These objects are found preferably inhigh density regions whereas virialized halos trace the overalllarge scale structure of the universe.
Nowadays it seems clear that strong interactions and merg-ers are the trigger for producing the most luminous infraredgalaxies. So an enhanced clustering has been obtained for lu-minous infrared galaxies (Bouchet et al. 1993). More luminousIRAS galaxies, basically mergers, are more strongly correlated,and ultraluminous mergers have strongest correlation strength(Gao 1993). These luminous infrared galaxies may representan important stage in the formation of QSO’s and a primarystage in the formation of elliptical galaxies cores. And as we

A. Knebe & V. Muller: Formation of groups and clusters of galaxies 7
have found, these objects form at special places in the universewhere the most massive galaxy clusters are found.
5. Conclusions
We have collected a number of reasons for looking at virialisa-tion as a reasonable criterion for identifying groups and clustersof galaxies in numerical simulations. The virial theorem welldescribed an overwhelming majority of the halos in our simula-tions. A slight bend in the virial relation can be ascribed to theeffective pressure of the permanent spherical accretion streamin the halos.
Special attention has been devoted to the unvirialized halos.We have shown that they are characterized by quite recent softmergers which lead to more anisotropic halos and are stronglycorrelated over scales of up to 40h−1Mpc. This is confirmed bythe result obtained for luminous infrared galaxies. In our simu-lations we find a very fast virialisation of the halos which leadsto the small percentage of such objects at any given time. Butthe virialisation itself was not a basic goal of our simulations. Itmust be checked whether this time depends on the relatively lowmass resolution in our big simulation boxes. The SCDM modelis found to have the largest evolution rate of the halo abundanceto z = 0, and has the largest percentage of unvirialized objects.On the contrary, the more realisticΛCDM and OCDM2 modelshave a quite small number of recent mergers.
The stronger anisotropy of the merger products leads to typ-ical triaxial ellipsoids with axis ratios of 1:0.4:0.3 which repre-sents an measurable effect in large cluster samples. The mergingprocesses are characterized by basically central encounters. Notmuch angular momentum is transferred to the merger productwhich leads to a self-similar growth of the rotation of the halos,(e.g. Knebe 1998).
The large differences in the correlation functions of the mod-els makes it worthwhile to further compare differences in thelarge-scale matter distributions of the different models.
Acknowledgements.We are grateful to H. Couchman for making hisnumerical code public. Also we acknowledge the use of CMBFASTprovided by U. Seljak and M. Zaldarriaga. We are glad about useful andencouraging discussions with J. Colberg. S. Gottlober and D. Woodsread carefully the manuscript and made valuable comments.
References
Bouchet F.R., Strauss M.A., Davis M., et al., 1993, ApJ 417, 36Bunn E.F., White M., 1997, ApJ 480, 6Cole S., Lacey C., 1996, MNRAS 281, 716Couchman H.M.P., 1991, ApJ 368, L23Couchman H.M.P., Thomas P.A., Pearce F.R., 1995, ApJ 352, 797Davis M., Efstathiou G., Frenk C. S., White S.D.M., 1985, ApJ 292,
371Dubinski J., 1992, ApJ 401, 441Gao Y., 1993, In: Hollenbach D., Thronson H., Shull J.M. (eds.) The
Evolution of Galaxies and Their Environment. NASA Conf. Pub.3190, Ames: NASA 1993, 54
Gelb J., Bertschinger E., 1994, ApJ 436, 467Jing Y.P., Mo H.J., Borner G., Fang L.Z., 1995, MNRAS 276, 417Kaiser N., 1984, ApJ 284, L9Katayama T., Suto Y., 1996, ApJ 469, 480Knebe A., 1998, In: Muller V., et al. (eds.) Large Scale Structures:
Tracks and Traces. Proceedings of the 12th Potsdam CosmologyWorkshop, World Scientific 1998, p. 175
Klypin A., Gottlober S., Kravtsov A.V., (astro-ph/9708191)Lacey C., Cole S., 1993, MNRAS 262, 627Lacey C., Cole S., 1994, MNRAS 271, 676Mohr J.J., Evrard, A.E., Faricant, D.G., Geller, M.J., 1995, ApJ 447, 8Peacock J.A., Dodds S.J., 1996, MNRAS 280, 1020Seljak U., Zaldarriaga M., 1996, ApJ 469, 437Spitzer L., 1969, ApJ 158, L139Thomas P.A., Colberg J.M., Couchman H.M.P., et al., 1997, MNRAS
submitted (astro-ph/9707018)Warren M.S., Quinn P.J., Salmon J.K., Zurek W.H., 1992, ApJ 399,
405White S.D.M., 1996, In: Schaeffer R., Silk J., Spiro M., Zinn-Justin J.
(eds.) Cosmology and Large-Scale Structure. Elsevier 1996, p. 349