assurance services on “positive water balance”...assurance services on “positive water...
TRANSCRIPT
Assurance Services on “Positive Water Balance”
to
PepsiCo India Holdings Pvt. Ltd
Deloitte Touché Tohmatsu India Private Limited
February 2010

SECTION- A
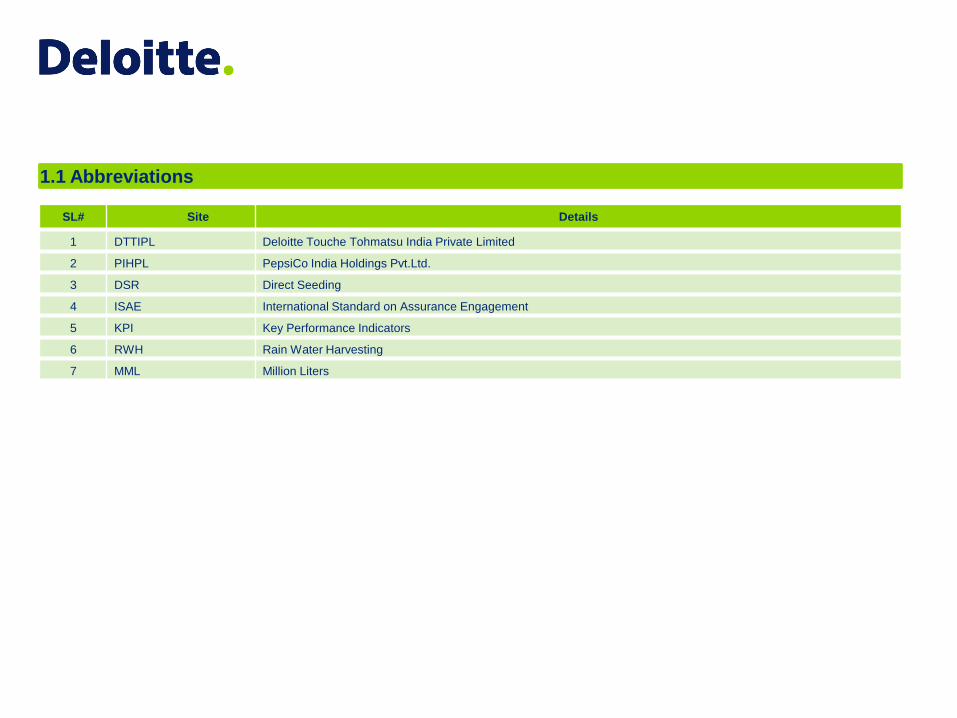
SL# Site Details
1 DTTIPL Deloitte Touche Tohmatsu India Private Limited
2 PIHPL PepsiCo India Holdings Pvt.Ltd.
3 DSR Direct Seeding
4 ISAE International Standard on Assurance Engagement
5 KPI Key Performance Indicators
6 RWH Rain Water Harvesting
7 MML Million Liters
1.1 Abbreviations

SECTION- B
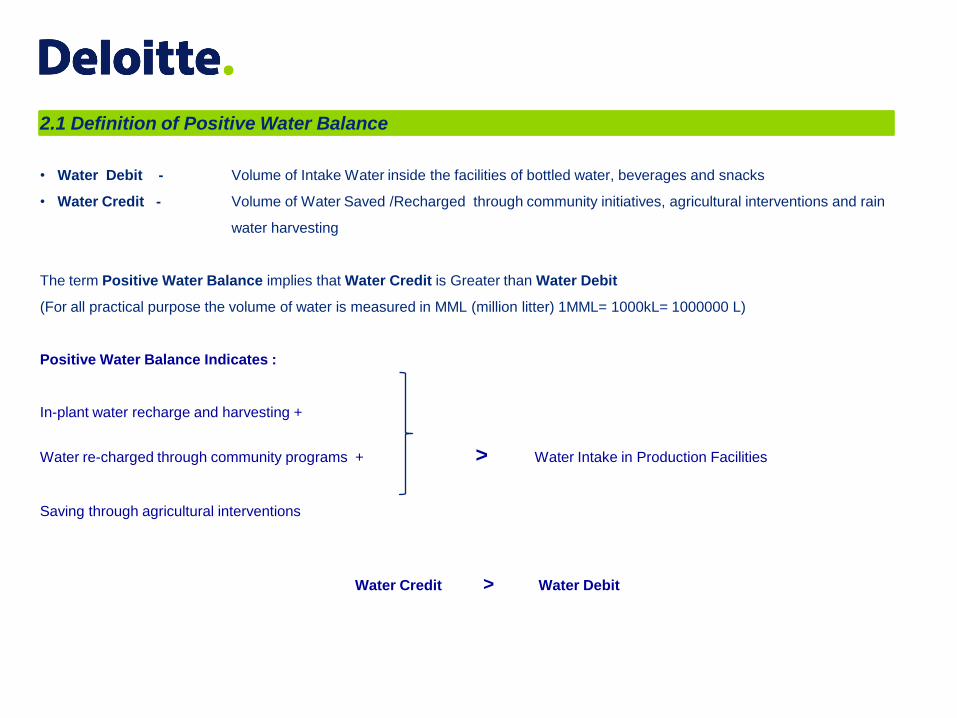
2.1 Definition of Positive Water Balance
• Water Debit - Volume of Intake Water inside the facilities of bottled water, beverages and snacks
• Water Credit - Volume of Water Saved /Recharged through community initiatives, agricultural interventions and rain
water harvesting
The term Positive Water Balance implies that Water Credit is Greater than Water Debit
(For all practical purpose the volume of water is measured in MML (million litter) 1MML= 1000kL= 1000000 L)
Positive Water Balance Indicates :
In-plant water recharge and harvesting +
Water re-charged through community programs + > Water Intake in Production Facilities
Saving through agricultural interventions
Water Credit > Water Debit
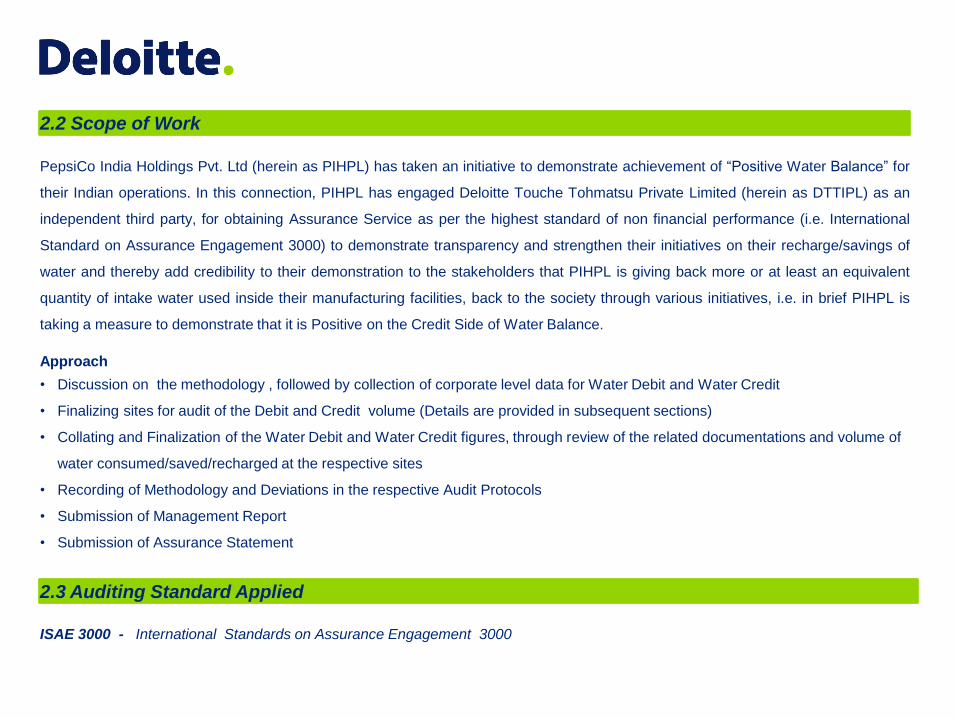
2.2 Scope of Work
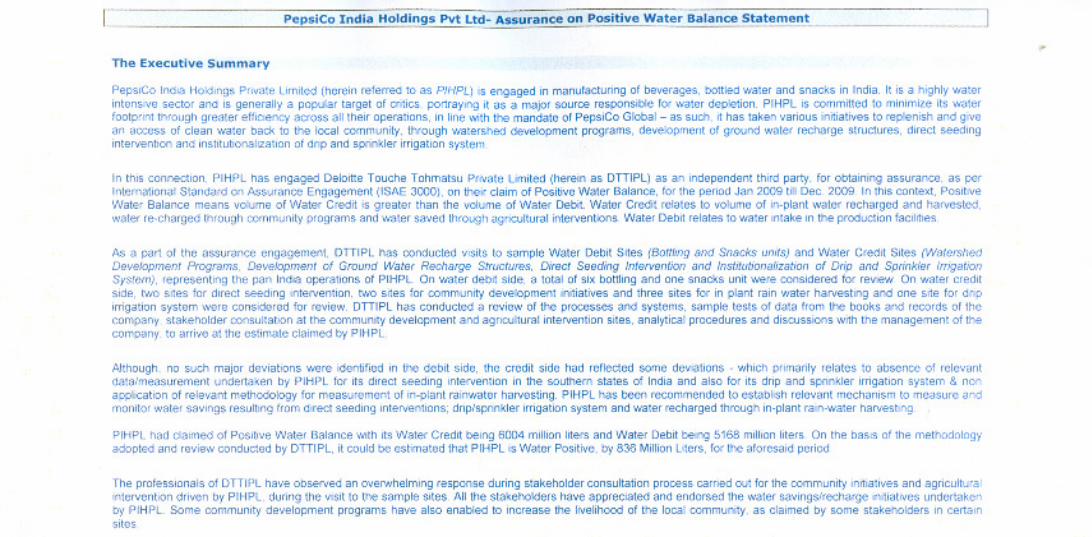
PepsiCo India Holdings Pvt. Ltd (herein as PIHPL) has taken an initiative to demonstrate achievement of “Positive Water Balance” for
their Indian operations. In this connection, PIHPL has engaged Deloitte Touche Tohmatsu Private Limited (herein as DTTIPL) as an
independent third party, for obtaining Assurance Service as per the highest standard of non financial performance (i.e. International
Standard on Assurance Engagement 3000) to demonstrate transparency and strengthen their initiatives on their recharge/savings of
water and thereby add credibility to their demonstration to the stakeholders that PIHPL is giving back more or at least an equivalent
quantity of intake water used inside their manufacturing facilities, back to the society through various initiatives, i.e. in brief PIHPL is
taking a measure to demonstrate that it is Positive on the Credit Side of Water Balance.
Approach
• Discussion on the methodology , followed by collection of corporate level data for Water Debit and Water Credit
• Finalizing sites for audit of the Debit and Credit volume (Details are provided in subsequent sections)
• Collating and Finalization of the Water Debit and Water Credit figures, through review of the related documentations and volume of
water consumed/saved/recharged at the respective sites
• Recording of Methodology and Deviations in the respective Audit Protocols
• Submission of Management Report
• Submission of Assurance Statement
2.3 Auditing Standard Applied
ISAE 3000 - International Standards on Assurance Engagement 3000
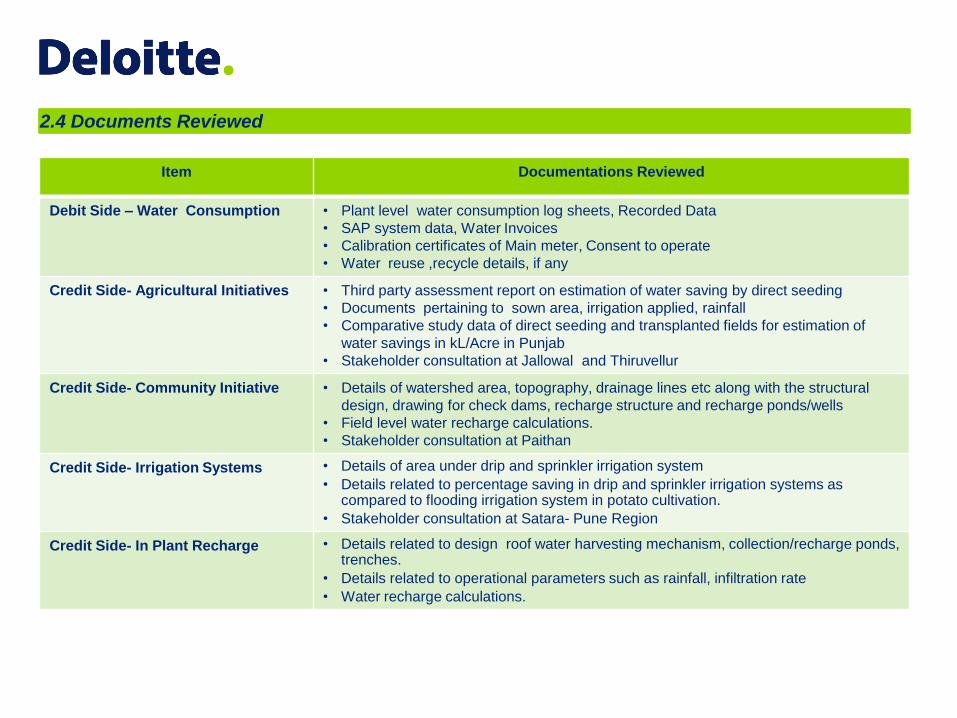
2.4 Documents Reviewed
Item Documentations Reviewed
Debit Side – Water Consumption • Plant level water consumption log sheets, Recorded Data
• SAP system data, Water Invoices
• Calibration certificates of Main meter, Consent to operate
• Water reuse ,recycle details, if any
Credit Side- Agricultural Initiatives • Third party assessment report on estimation of water saving by direct seeding
• Documents pertaining to sown area, irrigation applied, rainfall
• Comparative study data of direct seeding and transplanted fields for estimation of
water savings in kL/Acre in Punjab
• Stakeholder consultation at Jallowal and Thiruvellur
Credit Side- Community Initiative • Details of watershed area, topography, drainage lines etc along with the structural
design, drawing for check dams, recharge structure and recharge ponds/wells
• Field level water recharge calculations.
• Stakeholder consultation at Paithan
Credit Side- Irrigation Systems • Details of area under drip and sprinkler irrigation system
• Details related to percentage saving in drip and sprinkler irrigation systems as compared to flooding irrigation system in potato cultivation.
• Stakeholder consultation at Satara- Pune Region
Credit Side- In Plant Recharge • Details related to design roof water harvesting mechanism, collection/recharge ponds, trenches.
• Details related to operational parameters such as rainfall, infiltration rate
• Water recharge calculations.

2.5 Sample Sites
Debit Side- Water Consumption
Credit Side - Water Recharged/Saved
SL # Site Details Location
Bottling Units
1 Aurangabad Debit Side Maharashtra, India
2 Palkkad Debit Side Kerela,India
3 Nelamangla Debit Side Karnataka, India
4 Madurai Debit Side Tamilnadu,India
5 Panipat Debit Side Haryana, India
6 Jamshedpur Debit Side Jharkhand, India
Snacks Unit
1 Pune Debit Side Maharashtra, India
SL# Site Details Location
1 Jalandar, Jallowal Farms Agricultural Initiative Punjab, India
2 Thiruvellur Agricultural Initiative Tamil Nadu, India
3 Painthan, Aurangabad Check Dams, Well Recharge Structures Maharashtra, India
4 Tonchinkuppe, Hosur, T.Kempali (near Nelamangla) Recharge Ponds and DROP Initiative Karnataka, India
5 Aurangabad Bottling Unit In Plant RWH Maharashtra, India
6 Palkkad Bottling Unit In Plant RWH Kerela,India
7 Nelamangla Bottling Unit In Plant RWH Karnataka, India
8 Satara-Pune Drip Irrigation for Potato Cultivation Maharashtra, India
2.6 Methodology and Verified Data
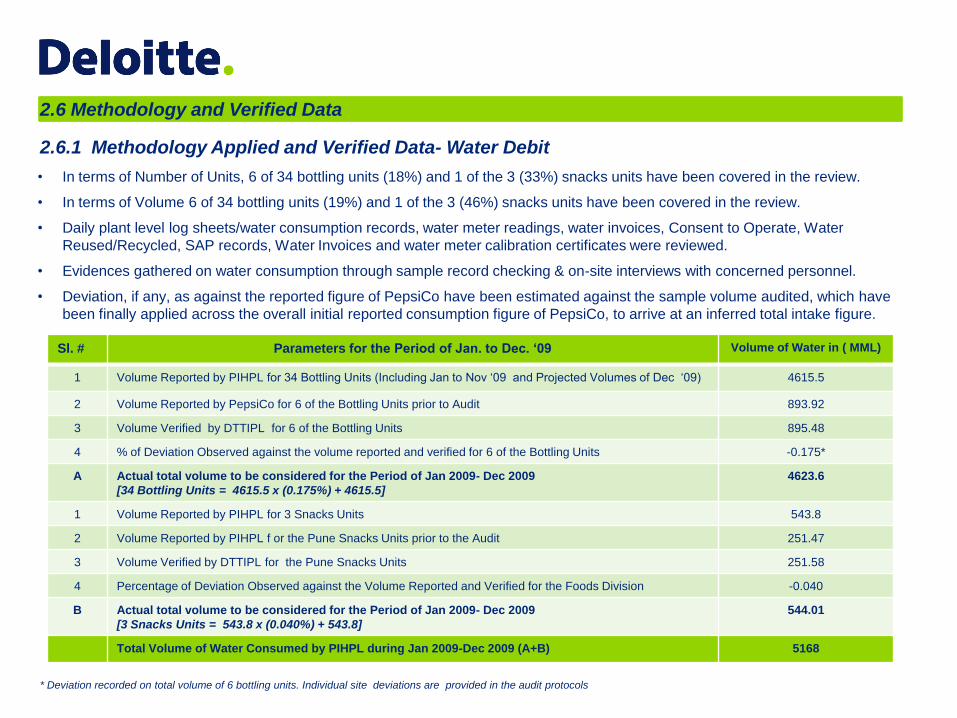
2.6.1 Methodology Applied and Verified Data- Water Debit
Sl. # Parameters for the Period of Jan. to Dec. „09 Volume of Water in ( MML)
1 Volume Reported by PIHPL for 34 Bottling Units (Including Jan to Nov „09 and Projected Volumes of Dec „09) 4615.5
2 Volume Reported by PepsiCo for 6 of the Bottling Units prior to Audit 893.92
3 Volume Verified by DTTIPL for 6 of the Bottling Units 895.48
4 % of Deviation Observed against the volume reported and verified for 6 of the Bottling Units -0.175*
A Actual total volume to be considered for the Period of Jan 2009- Dec 2009
[34 Bottling Units = 4615.5 x (0.175%) + 4615.5]
4623.6
1 Volume Reported by PIHPL for 3 Snacks Units 543.8
2 Volume Reported by PIHPL f or the Pune Snacks Units prior to the Audit 251.47
3 Volume Verified by DTTIPL for the Pune Snacks Units 251.58
4 Percentage of Deviation Observed against the Volume Reported and Verified for the Foods Division -0.040
B Actual total volume to be considered for the Period of Jan 2009- Dec 2009
[3 Snacks Units = 543.8 x (0.040%) + 543.8]
544.01
Total Volume of Water Consumed by PIHPL during Jan 2009-Dec 2009 (A+B) 5168
• In terms of Number of Units, 6 of 34 bottling units (18%) and 1 of the 3 (33%) snacks units have been covered in the review.
• In terms of Volume 6 of 34 bottling units (19%) and 1 of the 3 (46%) snacks units have been covered in the review.
• Daily plant level log sheets/water consumption records, water meter readings, water invoices, Consent to Operate, Water
Reused/Recycled, SAP records, Water Invoices and water meter calibration certificates were reviewed.
• Evidences gathered on water consumption through sample record checking & on-site interviews with concerned personnel.
• Deviation, if any, as against the reported figure of PepsiCo have been estimated against the sample volume audited, which have
been finally applied across the overall initial reported consumption figure of PepsiCo, to arrive at an inferred total intake figure.
* Deviation recorded on total volume of 6 bottling units. Individual site deviations are provided in the audit protocols
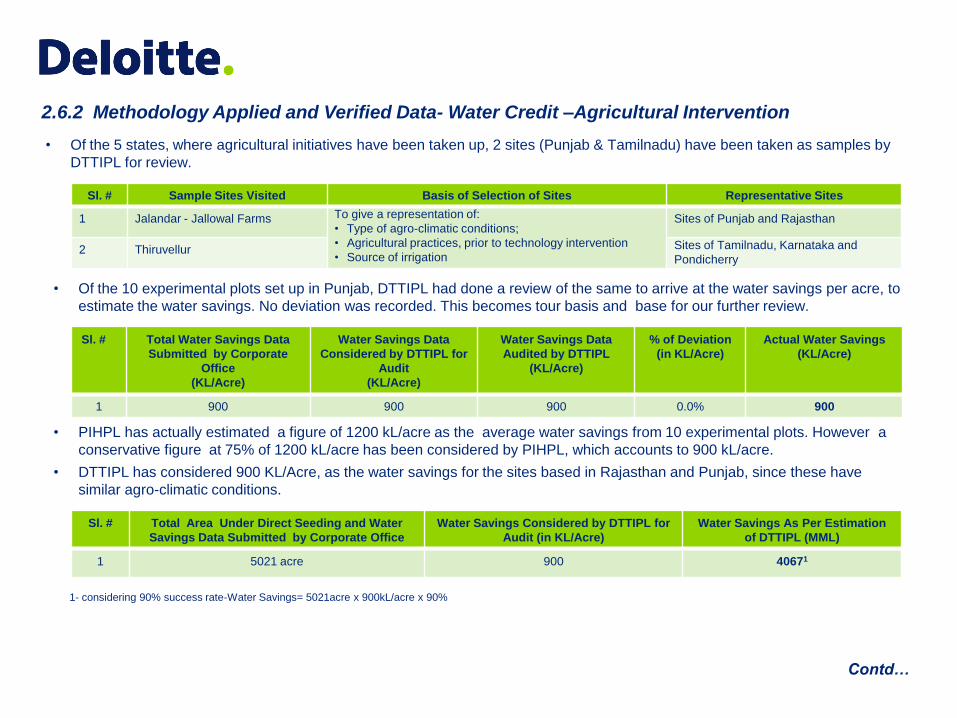
• Of the 5 states, where agricultural initiatives have been taken up, 2 sites (Punjab & Tamilnadu) have been taken as samples by
DTTIPL for review.
Sl. # Total Water Savings Data
Submitted by Corporate
Office
(KL/Acre)
Water Savings Data
Considered by DTTIPL for
Audit
(KL/Acre)
Water Savings Data
Audited by DTTIPL
(KL/Acre)
% of Deviation
(in KL/Acre)
Actual Water Savings
(KL/Acre)
1 900 900 900 0.0% 900
• Of the 10 experimental plots set up in Punjab, DTTIPL had done a review of the same to arrive at the water savings per acre, to
estimate the water savings. No deviation was recorded. This becomes tour basis and base for our further review.
• DTTIPL has considered 900 KL/Acre, as the water savings for the sites based in Rajasthan and Punjab, since these have
similar agro-climatic conditions.
Sl. # Sample Sites Visited Basis of Selection of Sites Representative Sites
1 Jalandar - Jallowal Farms To give a representation of:
• Type of agro-climatic conditions;
• Agricultural practices, prior to technology intervention
• Source of irrigation
Sites of Punjab and Rajasthan
2 Thiruvellur Sites of Tamilnadu, Karnataka and
Pondicherry
Sl. # Total Area Under Direct Seeding and Water
Savings Data Submitted by Corporate Office
Water Savings Considered by DTTIPL for
Audit (in KL/Acre)
Water Savings As Per Estimation
of DTTIPL (MML)
1 5021 acre 900 40671
2.6.2 Methodology Applied and Verified Data- Water Credit –Agricultural Intervention
Contd…
• PIHPL has actually estimated a figure of 1200 kL/acre as the average water savings from 10 experimental plots. However a
conservative figure at 75% of 1200 kL/acre has been considered by PIHPL, which accounts to 900 kL/acre.
1- considering 90% success rate-Water Savings= 5021acre x 900kL/acre x 90%
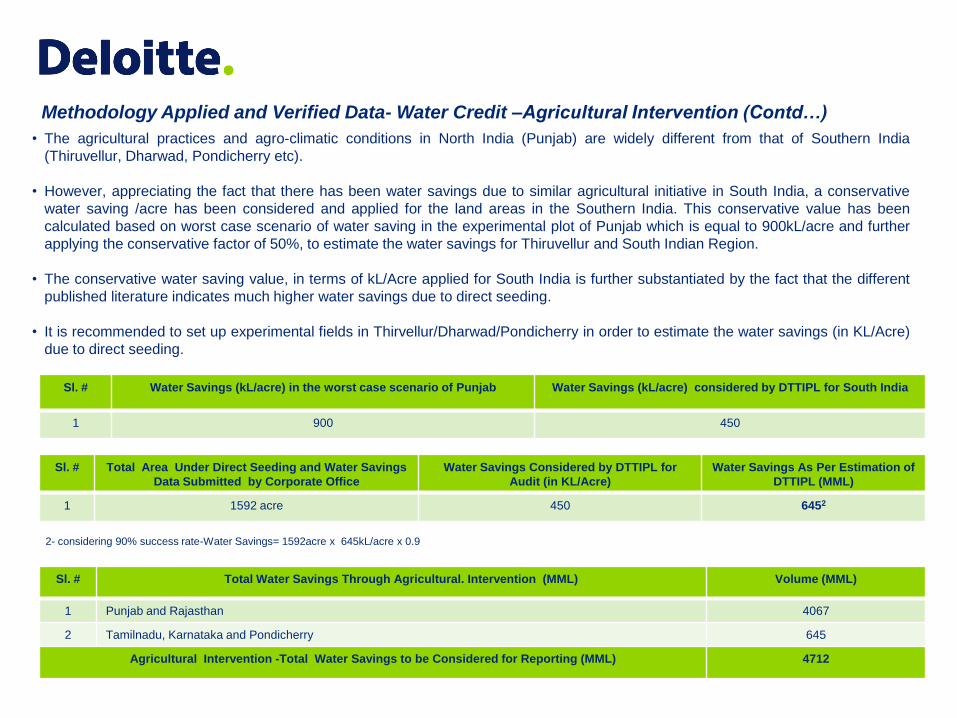
• The agricultural practices and agro-climatic conditions in North India (Punjab) are widely different from that of Southern India
(Thiruvellur, Dharwad, Pondicherry etc).
• However, appreciating the fact that there has been water savings due to similar agricultural initiative in South India, a conservative
water saving /acre has been considered and applied for the land areas in the Southern India. This conservative value has been
calculated based on worst case scenario of water saving in the experimental plot of Punjab which is equal to 900kL/acre and further
applying the conservative factor of 50%, to estimate the water savings for Thiruvellur and South Indian Region.
• The conservative water saving value, in terms of kL/Acre applied for South India is further substantiated by the fact that the different
published literature indicates much higher water savings due to direct seeding.
• It is recommended to set up experimental fields in Thirvellur/Dharwad/Pondicherry in order to estimate the water savings (in KL/Acre)
due to direct seeding.
Sl. # Water Savings (kL/acre) in the worst case scenario of Punjab Water Savings (kL/acre) considered by DTTIPL for South India
1 900 450
Sl. # Total Water Savings Through Agricultural. Intervention (MML) Volume (MML)
1 Punjab and Rajasthan 4067
2 Tamilnadu, Karnataka and Pondicherry 645
Agricultural Intervention -Total Water Savings to be Considered for Reporting (MML) 4712
Methodology Applied and Verified Data- Water Credit –Agricultural Intervention (Contd…)
Sl. # Total Area Under Direct Seeding and Water Savings
Data Submitted by Corporate Office
Water Savings Considered by DTTIPL for
Audit (in KL/Acre)
Water Savings As Per Estimation of
DTTIPL (MML)
1 1592 acre 450 6452
2- considering 90% success rate-Water Savings= 1592acre x 645kL/acre x 0.9
Sl. # Initiative Total Water
Recharge Data
Submitted by
PepsiCo Corporate
Office (in MML)
Water Recharge Data
Considered by
DTTIPL for Audit
(in MML)
Water Recharge
Data Audited by
DTTIPL
(in MML)
% Deviation
Observed &
Recorded Post
Audit
Actual Water
Recharge
Assessed
(in MML)
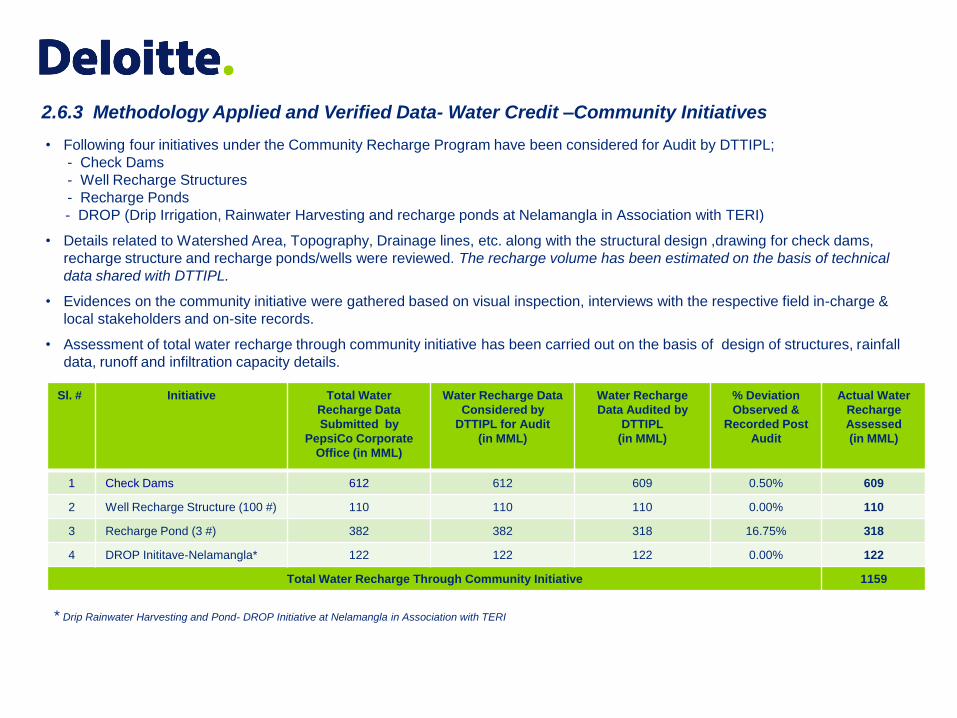
1 Check Dams 612 612 609 0.50% 609
2 Well Recharge Structure (100 #) 110 110 110 0.00% 110
3 Recharge Pond (3 #) 382 382 318 16.75% 318
4 DROP Inititave-Nelamangla* 122 122 122 0.00% 122
Total Water Recharge Through Community Initiative 1159
• Following four initiatives under the Community Recharge Program have been considered for Audit by DTTIPL;
- Check Dams
- Well Recharge Structures
- Recharge Ponds
- DROP (Drip Irrigation, Rainwater Harvesting and recharge ponds at Nelamangla in Association with TERI)
• Details related to Watershed Area, Topography, Drainage lines, etc. along with the structural design ,drawing for check dams,
recharge structure and recharge ponds/wells were reviewed. The recharge volume has been estimated on the basis of technical
data shared with DTTIPL.
• Evidences on the community initiative were gathered based on visual inspection, interviews with the respective field in-charge &
local stakeholders and on-site records.
• Assessment of total water recharge through community initiative has been carried out on the basis of design of structures, rainfall
data, runoff and infiltration capacity details.
2.6.3 Methodology Applied and Verified Data- Water Credit –Community Initiatives
* Drip Rainwater Harvesting and Pond- DROP Initiative at Nelamangla in Association with TERI
Sl.
#
Units Total Water Recharge Data
Submitted by Corporate Office
(MML)
Water Consumption Data
Considered by DTTIPL for
Audit
(MML)
(3 # in Beverage Units & 1 # in
Foods Division)
Water Consumption
figure as estimated by
DTTIPL
(MML)
(3 Beverage Units)
% Deviation
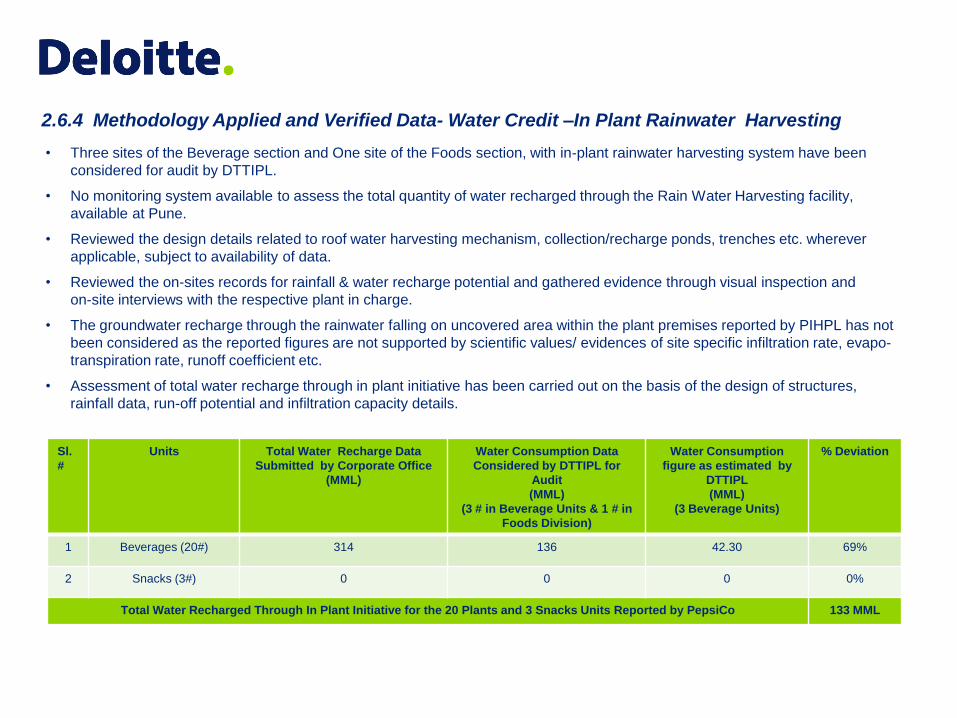
1 Beverages (20#) 314 136 42.30 69%
2 Snacks (3#) 0 0 0 0%
Total Water Recharged Through In Plant Initiative for the 20 Plants and 3 Snacks Units Reported by PepsiCo 133 MML
• Three sites of the Beverage section and One site of the Foods section, with in-plant rainwater harvesting system have been
considered for audit by DTTIPL.
• No monitoring system available to assess the total quantity of water recharged through the Rain Water Harvesting facility,
available at Pune.
• Reviewed the design details related to roof water harvesting mechanism, collection/recharge ponds, trenches etc. wherever
applicable, subject to availability of data.
• Reviewed the on-sites records for rainfall & water recharge potential and gathered evidence through visual inspection and
on-site interviews with the respective plant in charge.
• The groundwater recharge through the rainwater falling on uncovered area within the plant premises reported by PIHPL has not
been considered as the reported figures are not supported by scientific values/ evidences of site specific infiltration rate, evapo-
transpiration rate, runoff coefficient etc.
• Assessment of total water recharge through in plant initiative has been carried out on the basis of the design of structures,
rainfall data, run-off potential and infiltration capacity details.
2.6.4 Methodology Applied and Verified Data- Water Credit –In Plant Rainwater Harvesting
Sl. # Initiative Aerial Coverage
(acre)
Water Savings
(kL/acre)
Water Savings
(MML)
Water Savings
Considered by
DTTIPL
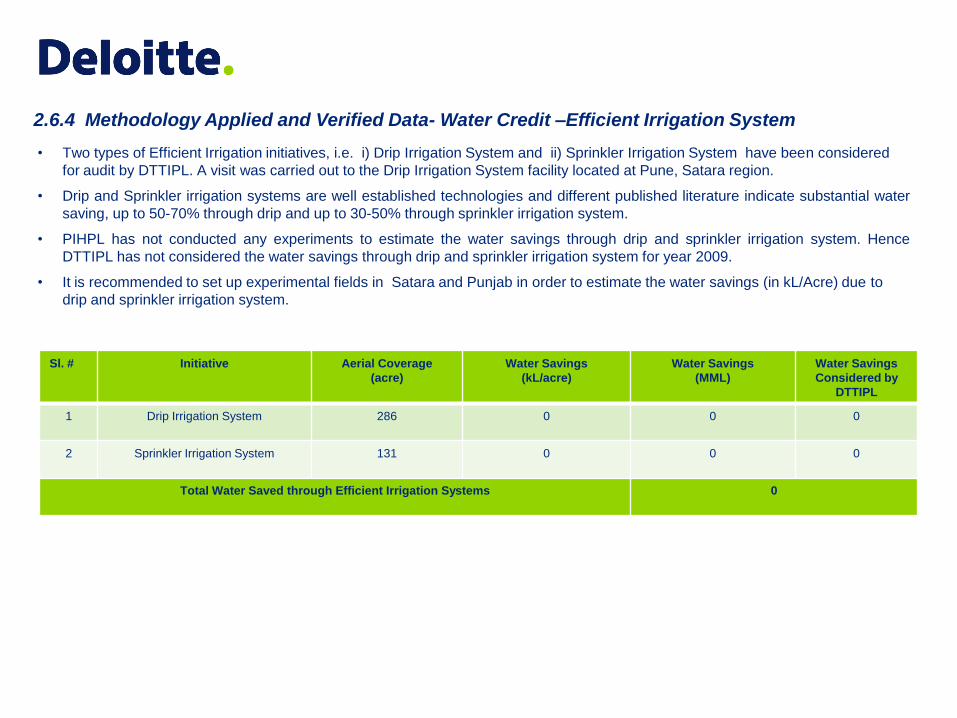
1 Drip Irrigation System 286 0 0 0
2 Sprinkler Irrigation System 131 0 0 0
Total Water Saved through Efficient Irrigation Systems 0
• Two types of Efficient Irrigation initiatives, i.e. i) Drip Irrigation System and ii) Sprinkler Irrigation System have been considered
for audit by DTTIPL. A visit was carried out to the Drip Irrigation System facility located at Pune, Satara region.
• Drip and Sprinkler irrigation systems are well established technologies and different published literature indicate substantial water
saving, up to 50-70% through drip and up to 30-50% through sprinkler irrigation system.
• PIHPL has not conducted any experiments to estimate the water savings through drip and sprinkler irrigation system. Hence
DTTIPL has not considered the water savings through drip and sprinkler irrigation system for year 2009.
• It is recommended to set up experimental fields in Satara and Punjab in order to estimate the water savings (in kL/Acre) due to
drip and sprinkler irrigation system.
2.6.4 Methodology Applied and Verified Data- Water Credit –Efficient Irrigation System
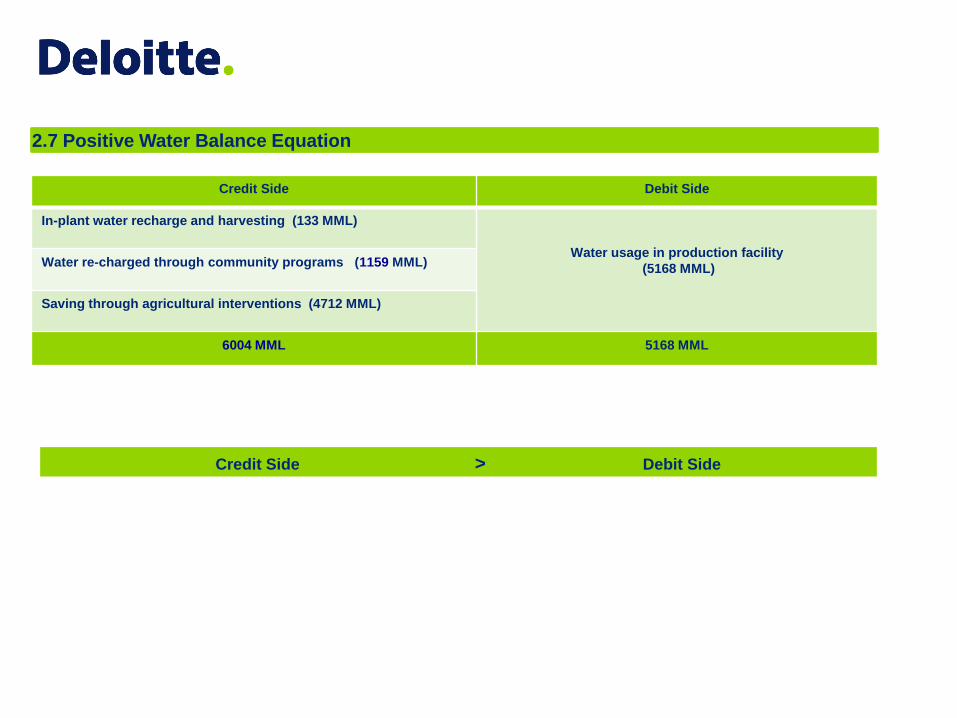
2.7 Positive Water Balance Equation
Credit Side Debit Side
In-plant water recharge and harvesting (133 MML)
Water usage in production facility
(5168 MML)Water re-charged through community programs (1159 MML)
Saving through agricultural interventions (4712 MML)
6004 MML 5168 MML
Credit Side > Debit Side