association of single nucleotide polymorphic sites causing wheat
TRANSCRIPT
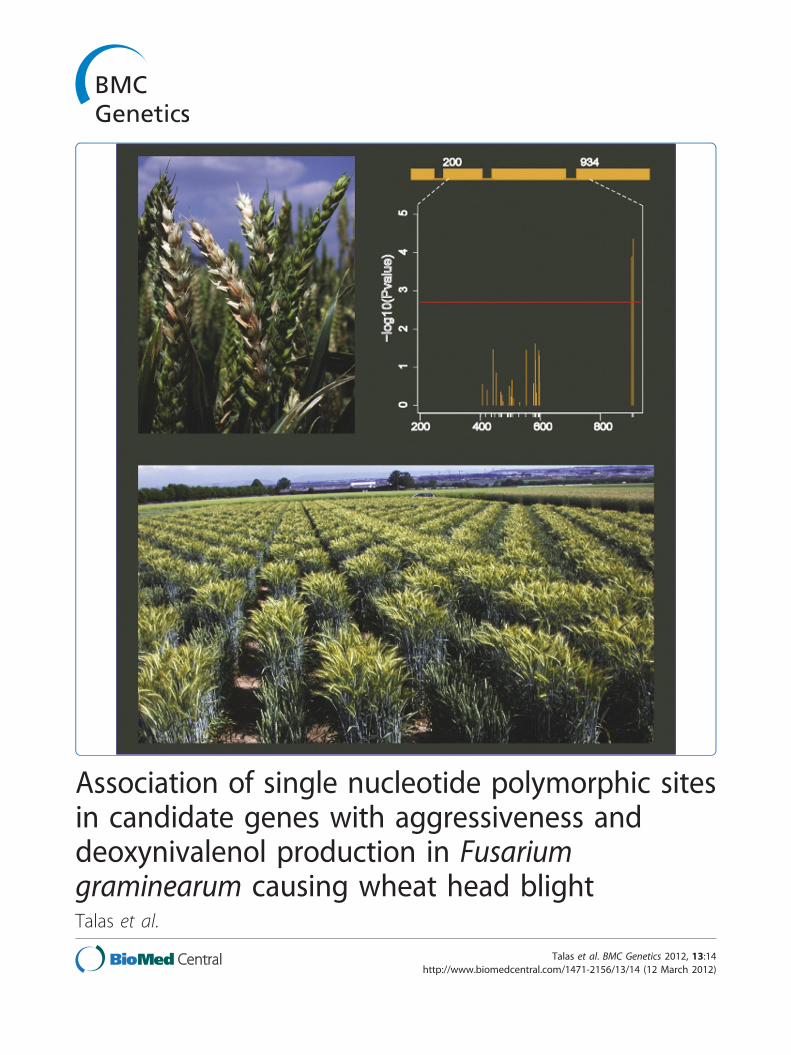
Association of single nucleotide polymorphic sitesin candidate genes with aggressiveness anddeoxynivalenol production in Fusariumgraminearum causing wheat head blightTalas et al.
Talas et al. BMC Genetics 2012, 13:14http://www.biomedcentral.com/1471-2156/13/14 (12 March 2012)

RESEARCH ARTICLE Open Access
Association of single nucleotide polymorphic sitesin candidate genes with aggressiveness anddeoxynivalenol production in Fusariumgraminearum causing wheat head blightFiras Talas1,3, Tobias Würschum1, Jochen C Reif1, Heiko K Parzies2 and Thomas Miedaner1*
Abstract
Background: Fusarium graminearum sensu stricto (s.s.) is an ubiquitous pathogen of cereals. The economic impactof Fusarium head blight (FHB) is characterized by crop losses and mycotoxin contamination. Our objective was toassociate SNP diversity within candidate genes with phenotypic traits. A total of 77 F. graminearum s.s. isolates wastested for severity of fungal infection (= aggressiveness) and deoxynivalenol (DON) production in an inoculatedfield experiment at two locations in each of two years. For seven genes known to control fungal growth (MetAP1,Erf2) or DON production (TRI1, TRI5, TRI6 TRI10 and TRI14) single nucleotides polymorphic sites (SNPs) weredetermined and evaluated for the extent of linkage disequilibrium (LD). Associations of SNPs with both phenotypictraits were tested using linear mixed models.
Results: Decay of LD was in most instances fast. Two neighboring SNPs in MetAP1 and one SNP in Erf2 weresignificantly (P < 0.05) associated with aggressiveness explaining proportions of genotypic variance (pG) of 25.6%,0.5%, and 13.1%, respectively. One SNP in TRI1 was significantly associated with DON production (pG = 4.4).
Conclusions: We argue that using the published sequence information of Fusarium graminearum as a template toamplify comparative sequence parts of candidate genes is an effective method to detect quantitative trait loci. Ourfindings underline the potential of candidate gene association mapping approaches to identify functional SNPsunderlying aggressiveness and DON production for F. graminearum s.s populations.
Keywords: Aggressiveness, Association mapping, DON, Fusarium graminearum, FHB, Linkage disequilibrium, QTL,Triticum aestivum, SNP
BackgroundFusarium head blight (FHB) is a destructive disease tocereals including wheat and barley. Fusarium grami-nearum (teleomorph Gibberella zeae) is considered tobe the main causal agent of this disease in addition toother species such as F. culmorum [1]. F. graminearumcomplex has been subdivided into several cryptic species[2], the main member in Germany is F. graminearumsensu stricto (s.s.) [3]. FHB disease leads to prematurelybleached spikes in infected plants [1] with considerable
yield losses and contamination by mycotoxins such asdeoxynivalenol (DON) [4]. DON is the most commonfood and feed contaminant in Europe and the maximumpermissible level in unprocessed wheat used for food is1.25 mg kg-1 [5].The quantitative ability of an isolate to cause disease
on a susceptible host plant in a non-race specific patho-system is defined as aggressiveness [6]. Aggressiveness isan important factor determining the potential ability ofan isolate to cause yield losses. Large genetic variationof aggressiveness, type of mycotoxin, and DON produc-tion was found among isolates sampled in the samecountry or even the same field [7-11]. The molecularcauses of this tremendous variation in aggressiveness
* Correspondence: [email protected] Hohenheim, State Plant Breeding Institute (720), Fruwirthstr. 21,70593 Stuttgart, GermanyFull list of author information is available at the end of the article
Talas et al. BMC Genetics 2012, 13:14http://www.biomedcentral.com/1471-2156/13/14
© 2012 Talas et al; licensee BioMed Central Ltd. This is an Open Access article distributed under the terms of the Creative CommonsAttribution License (http://creativecommons.org/licenses/by/2.0), which permits unrestricted use, distribution, and reproduction inany medium, provided the original work is properly cited.

and DON production in F. graminearum are stillunclear. To date, only one QTL (quantitative trait locus)study from a single cross was reported detecting at leasttwo QTL for aggressiveness [12]. It was shown before,that a large amount of molecular variation was foundwithin field populations of F. graminearum s.s. usingSSR (simple sequence repeat) markers. Comparing 12individual field populations each consisting of 30 iso-lates, Talas et al. [3] reported that 71% of the molecularvariation was assigned within populations and 29%between populations. A cause for this high diversitymight be the mating system. F. graminearum is a hap-loid, homothallic fungus and propagates asexually byconidia and sexually by ascospores allowing both selfingand outcrossing [7]. With the availability of the fullgenomic sequence of F. graminearum [13], it is nowpossible to deeper analyze this variation by a candidategene approach. An array of candidate genes, includingcomponents of transcription, signal transduction, host-specific nutrition, host infection/colonization and tri-chothecene biosynthesis is available in the version 3.2 ofthe Pathogen-Host Interactions database [14]. The can-didate genes we were aiming for are known to controlDON biosynthesis and/or aggressiveness (TRI1, TRI5,TRI6, TRI10, TRI14) [15,16] or are expected to have alink to aggressiveness but are yet uncharacterized forFusarium spp. (MetAP1, Erf2) [17,18]. Candidate geneassociation mapping is a sensitive tool if the mappingresolution is high enough [19]. The resolution of asso-ciation mapping depends on the extent of linkage dise-quilibrium (LD), i.e. the non-random association ofalleles present in a species [20]. Low LD was reported inF. graminearum estimated by different types of geneticmakers such as VNTR, AFLP, RFLP [7,11,21], but nodata on LD within and among genes is available.Because LD is species and population specific, it shouldconsequently be determined before conducting an asso-ciation mapping study.The specific objectives of our study were to: (i) inves-
tigate the nucleotide diversity on gene level, (ii) investi-gate the extent of LD between single nucleotidepolymorphic sites (SNPs) within and among candidategenes, (iii) identify SNPs of candidate genes Erf2 andMetAP1 for testing whether they affect the quantitativevariation for aggressiveness, and (iv) evaluate associa-tions of SNPs in TRI1 and other four genes of the TRI5cluster with variation in DON production.
ResultsPhenotypic analysisPhenotypic data were analyzed in detail in a companionstudy [9]. All 77 F. graminearum s.s. isolates producedsymptoms of FHB disease in all environments. Briefly,genotypic proportion of phenotypic variance of the
isolates was significant (P < 0.01) for both traits: Aggres-siveness measured as FHB rating on scale from 0 to 100and DON production measured as DON concentrationin wheat kernels in mg kg-1. Isolate × environmentinteraction variance was significant (P < 0.01) only formean FHB rating but not for DON production. Entry-mean heritability was moderate for mean FHB rating(0.55) and DON production (0.62).Histograms based on best linear unbiased estimators
(BLUEs) followed a normal distribution for both traits(Figure 1). The mean of FHB infection among all iso-lates was 30.6% ranging from 18.4 to 38.9%. AverageDON production was 12.6 mg kg-1 ranging from 3.5 to21.6 mg kg-1. One isolate (WET24) produced a very lowconcentration of DON (0.3 mg kg-1) and was found tobe a nivalenol producer by chemotype-specific primers.
Analysis of population structure and diversityPrincipal coordinate analysis (PCoA) based on modifiedRogers’ distances between all isolates did not show adistinct separation of the isolates sampled from differentlocations (Figure 2A). Explained variance graduallydecreased according to the first ten principal coordi-nates (Figure 2B). The violin plot (Figure 2C) had a con-tinuous density of distribution over all ten principalcoordinates without any division within the principalcoordinates. Genetic similarity ranged from 0.057 to 1.0with a mean value of 0.31 (Figure 2D).
Estimation of nucleotide diversity and linkagedisequilibriumPercentage of polymorphic sites per total sequencedregion of each gene (without singletons) varied from0.9% (5/513) on TRI10b to 8.8% (65/734) on MetAP1indicating a high nucleotide diversity in most testedgenes (Table 1). LD of SNPs within the gene MetAP1decayed rapidly within 200 bp of physical distance, i.e.,the robust locally fitted regression of r2 values has atrend to decay from r2 = 0.35 to r2 < 0.1, whereas LD
Mean FHB rating [%]
Obs
erva
tions
20 25 30 35 40
1015
05
meanA
DON production [mg kg-1]
Obs
erva
tions
10 15 20
1015
0 5
05
meanB
Figure 1 Histograms for 77 F. graminearum isolates. Best linearunbiased estimates (BLUEs) for mean FHB rating (A) and DONcontent (B) calculated across four environments (location × yearcombinations)
Talas et al. BMC Genetics 2012, 13:14http://www.biomedcentral.com/1471-2156/13/14
Page 2 of 10

within the gene Erf2 had r2 values ranging from 0.8 to0.2 and the regression of r2 trends to decay already after150 bp (Figure 3). LD with r2 values higher than 0.1were detected between all allele combinations within thetested genes followed by a rapid decay negatively corre-lated with the physical distance in base pair (Figure 4).In line with the rapid decay, LD between genes located
on the same chromosome (i.e., TRI1 and MetAP1) islow (r2 < 0.1). Interestingly, 48%, 19%, and 45% of theSNP pairs between the genes TRI10/MetAP1, MetAP1/TRI5 and MetAP1/Erf2, respectively, have higher valuesof r2 than 0.1, although they are located on differentchromosomes. Low r2 values (< 0.1) were observed forSNPs of gene pairs TRI10/Erf2 and TRI5/Erf2, whereasr2 values of 0.2 were detected between SNP pairs ofTRI10b and TRI5, followed by a rapid decay of LD.
Association analysis for aggressiveness and mycotoxinTwo adjacent SNPs of the gene MetAP1 were signifi-cantly associated (P < 0.05 using Bonferroni-Holm cor-rection) [22] with mean FHB rating with an explainedgenotypic proportion of variance pG = 25.6 and 0.5,respectively (Table 2, Figure 5A). Additionally, one SNPin the gene Erf2 was significantly associated with thistrait showing a pG of 13.1% (Table 2, Figure 5A). A sin-gle SNP significantly associated with DON productionwas identified in the TRI1 gene explaining 4.4% of the
Loc. ALoc. BLoc. C
−0.4 −0.2 0.0 0.2 0.4
−0.4
−0.2
0.0
0.2
0.4
Principal coordinate 1 (14.6 %)
Prin
cipa
l coo
rdin
ate
2 (1
1.8
%)
10
−0.4
−0.2
0.0
0.2
0.4
1 2 3 4 5 6 7 8 9
Principal coordinate
Prin
cipa
l coo
rdin
ates
of
the
77 is
olat
es
Exp
lain
ed v
aria
nce
[%]
101 2 3 4 5 6 7 8 9Principal coordinate
A
C
B
Genetic similarity
Obs
erva
tions
0.0 0.2 0.4 0.6 0.8 1.0
050
010
0015
00
meanD10
150
5
Figure 2 Population structure and familial relatedness. (A)Principal coordinate analysis of the 77 isolates, based on modifiedRogers’ distance estimates whereas location A = Hohenheim,location B = Schickelsheim, and location C = Wetze, (B) Explainedgenotypic variance of the first ten principal coordinates, (C) Violinplot showing the density distribution of the first ten principalcoordinates, (D) Histogram of the genetic similarities among the 77isolates.
Table 1 Sequenced regions of candidate genes and its related nucleotide polymorphism
Gene IDa Sequenced region relative tothe ATG
No. of SNPsdetected
No. ofsingletons
Nucleotide diversity(%)b
No. of SNPs with allelefrequency > 0.1
TRI1(FGSG_00071)
311-1065 73 54 2.5 3
TRI6(FGSG_16251)
35-558 36 29 1.3 0
TRI5(FGSG_03537)
479-1080 70 38 5.3 4
TRI10 a(FGSG_03538)
31-678 123 80 6.6 0
TRI10 b(FGSG_03538)
760-1273 34 29 0.9 1
TRI14(FGSG_03543)
277-976 43 23 2.9 0
MetAP1(FGSG_01397)
200-934 106 41 8.8 25
Erf2(FGSG_08531)
1193-1825 80 42 6.0 11
a The given gene ID is the entry number of the MIPS F. graminearum genome database (FGDB; Wong et al. 2011)b Nucleotide diversity is the frequency of SNPs (without singletons) relative to the total length of the sequenced gene region
100 150
0.0
0.2
0.4
0.6
0.8
1.0
Erf2
Distance [bp]
Link
age
dise
quili
briu
m [r
2 ]
0 100 200 300 400Distance [bp]
MetAP1
500
0.0
0.2
0.4
0.6
0.8
1.0
Link
age
dise
quili
briu
m [r
2 ]
Figure 3 Linkage disequilibrium (LD) decay. Robust locally fittedregression of linkage disequilibrium over base-pair distance withinthe two candidate genes, MetAP1 (25 SNPs) and Erf2 (11 SNPs).
Talas et al. BMC Genetics 2012, 13:14http://www.biomedcentral.com/1471-2156/13/14
Page 3 of 10

genotypic variance of DON production (Table 2, Figure5B). All detected SNPs that were associated to the men-tioned phenotypic traits were non-synonymously substi-tuted (Table 2). Applying a haplotype analysis acrossgenes, we could confirm a significant associationbetween mean FHB rating and MetAP1 and betweenDON production and TRI1 (Additional file1).
DiscussionAssociation mapping based on candidate genes is a pro-mising tool for high-resolution mapping of genes contri-buting to quantitative traits [23]. Nevertheless, it has not
yet applied to investigate the basis of quantitative varia-tion in aggressiveness and/or DON production in F. gra-minearum. This is a totally different approach thanusing knock-out mutants [24], because we are aimingfor the analysis of quantitative differences produced bysingle nucleotide changes of the respective genes in aset of 77 isolates. The high number of singletons may,besides sequencing noise, be caused by frequent sexualrecombination of the fungus. Therefore, we used a strictthreshold and were analyzing only SNPs with allele fre-quencies > 0.1.
23 29 66 03 05 37 38 39 42 43 44 45 47 55 68 71 74 75 76 80 81 84 85 87 90 93 96 98 02 08 21 50 60 36 37 38 43 47 55 65 67 68 75 81SNP
2329660305373839424344454755687174757680818485879093969802082150603637384347556567687581
SNPTRI1 MetAP1 TRI10b TRI5 Erf2
TRI1
Met
AP
1TR
I10b
TRI5
Erf2
Chr. I Chr. II Chr. IV
Figure 4 Pairwaise linkage disequilibrium (LD). The structure ofLD within and among five candidate genes for 77 Fusarium isolates.Significant LD (P < 0.05, above diagonal) and LD measured as r2
between all pairs of selected SNP loci (below diagonal). Thehorizontal and vertical lines separate the candidate genes, redcoloring indicates significant LD and the higher the r2 values (r2 ≥0.1), the darker is the used color, white indicates non-significant LDor r2 = 0.
Table 2 SNPs in the candidate genes significantly associated with mean FHB rating or DON content
Trait/Candidate gene SNP # Positiona Polymorphism Changes in amino acidsb P-value pG (%)c
Mean FHB rating (%)
MetAP1 SNP 05 904 A, G H, R 1.28 × 10⁻⁴ 25.6
SNP 03 909 A, C T, P 1.94 × 10⁻⁴ 0.5
Erf2 SNP 47 1424 C, T Q, Stop 6.61 × 10⁻⁴ 13.1
DON production (mg kg-1)
TRI1 SNP 23 851 A, G R, Q 8.62 × 10⁻³ 4.4a The position is relative to the start codon (ATG)b Different amino acids coded by SNPs located in exon regions (non-synonymous SNPs)c The proportion of explained genotypic variance in percent (pG) after Bonferroni-Holm procedure
A
B
1200 1300 1400 1500 1600 1700 1800
0−l
og10
(Pva
lue)
SN
P81
SN
P75
SN
P68
SN
P67
SN
P65
SN
P55
SN
P47
SN
P38
SN
P36
12
3
Position in Gene [bp from ATG]
200 400 600 800
−log
10(P
valu
e)
SN
P98
SN
P96
SN
P93
SN
P90
SN
P87
SN
P85
SN
P84
SN
P81
SN
P80
SN
P76
SN
P75
SN
P74
SN
P71
SN
P68
SN
P55
SN
P47
SN
P45
SN
P44
SN
P43
SN
P42
SN
P39
SN
P38
SN
P37
SN
P05
SN
P03
01
23
45
Position in Gene [bp from ATG]
400 600 800 1000
0.0
0.5
1.0
1.5
2.0
2.5
−log
10(P
valu
e)
SN
P66
SN
P29
SN
P23
Position in Gene [bp from ATG]
TRI1 (FGSG_00071)311 1065
200 934
MetAP1 (FGSG_01397)Erf2 (FGSG_08531 )1193 1825
Figure 5 Significant associations in the candidate genes. (A)Erf2 and MetAp1 for mean FHB rating and (B) TRI1 for DON content.The dashed horizontal line indicates the threshold (Bonferroni-corrected P < 0.05).
Talas et al. BMC Genetics 2012, 13:14http://www.biomedcentral.com/1471-2156/13/14
Page 4 of 10

Choice of candidate genesThe genes for deoxynivalenol (DON) biosynthesis resideprimarily in a 25 kb cluster (TRI5 cluster), TRI1 genebelong to a second smaller cluster that has a differentchromosomal localization [16]. TRI1, TRI5, TRI14 havea direct effect on the production of DON or acetylatedDON, TRI6 and TRI10 are regulating this pathway.TRI14 export the deoxynivalenol outside the mycelia inaddition to its major role in aggressiveness [15].The function of MetAP1 is still not described in
Fusarium spp., a deletion, however, reduces growth inSaccharomyces cerevisiae [18,25,26]. In both, prokaryotesand eukaryotes the N-terminal methionine is oftencleaved by methionine aminopeptidase encoded by thegene MetAP1 [18]. Erf2 gene is a component of the RASprotein subcellular localization pathway in yeast [17].RAS2 gene is known to affect the pathogenesis of F. gra-minearum by regulation of hyphal growth and expres-sion of hydrolytic enzymes [27]. Failing ofpalmitoylation mainly controlled by the Erf2 gene in S.cerevisiae reduces amount of RAS protein at the plasmamembrane and lead to poor growth of yeast [17]. Bothgenes are not indispensible for fungal growth becausetheir deletion does not prevent any growth at least in S.cerevisiae. And the 77 isolates analyzed in this study, allhad a similar growth in vitro, produced enough sporesfor inoculation and were able to infect the host in thefield. Significant, quantitative differences for aggressive-ness and DON production, however, were found illus-trating those genes with regulatory functions might beinvolved. Implementing associations between new candi-date genes and important phenotypic traits may providea useful tool to rapidly check a possible contribution ofthese genes to QTL of DON production or aggressive-ness in F. graminearum as shown previously in mammalresearch [23]. If an association is found, a more detailedanalysis of the function of the respective genes should,of course, follow.
Molecular diversity of the 77 isolatesAll isolates were checked by respective primers for theirdesignation to F. graminearum s.s. Nucleotide diversitywithin candidate genes of this study ranged from 1 to 9per 100 bp being high compared to 0 to 2 SNPs per 100bp reported by Cuomo et al. [13]. This was not unex-pected since Cuomo et al. [13] used just two isolates(PH-1 and GZ3639) while in this study 77 isolates wereanalyzed. Many genes in F. graminearum are localizedin regions of high SNP density, i.e. highly variableregions, especially those expressed during plant infec-tion. Moreover, it is known that the density of SNPs isbiased in F. graminearum in a way that 50% of theSNPs are within 13% of the genome sequence, the high-est SNP density was reported in some regions of
chromosome II, where most of the TRI genes arelocated [13]. The high nucleotide diversity of thesegroups of genes suggests that the fungus has a greatcapacity for adaptability and genetic change during itsinteraction with the host plant [13]. Despite this, wefound much more SNPs with allele frequencies > 0.1 inthe MetAP1 and Erf2 genes than in the TRI genes ana-lyzed. This was not the case, when just the number ofdetected SNPs is regarded, indicating that nucleotidediversity may be similar, but more rare haplotypes occurin the TRI genes. Moreover, high SNPs density wasdetected in one or two large interstitial regions on cho-mosomes I, II, and IV [13].
Population structure and consequences for associationmappingCorrecting for population and/or family structure isessential for association mapping to decrease the num-ber of false positive QTL [28]. An appropriate statisticalmodel should provide an excellent compromise betweencorrecting for population stratification to decrease theprobability of detecting false positive SNP-trait associa-tions but still retaining enough information within theSNPs for QTL detection [29]. Although some groupingaccording to the sampling location might be seen in thePCoA, the violin plots did not show any separated knotson the first ten principle coordinates (Figure 2). Thus,no distinct subpopulations were identified and correc-tion for familial relatedness between isolates should besufficient. Therefore, trait-SNP association was investi-gated in detail with the K model, which incorporatedestimates of kinship coefficients based on SSR data.
Extent of linkage disequilibrium and resolution ofassociation mappingRapid decay of regression parameter r2 in a short physi-cal distance of 200 bp within two genes was presentedin this study (Figure 3), providing a high resolution ofassociation mapping. Generally, low LD was reported inF. graminearum populations using selection-neutralmarkers (VNTR, AFLP, or RFLP) especially in theregion that includes the TRI5 gene cluster [11]. More-over, the weak correlation between r2 and physical dis-tance in addition to the large proportion of unlinkedSNP with significant LD, such as SNPs between genepairs TRI5/MetAP1, TRI10/MetAP1, or MetAP1/Erf2(Figure 4), suggest the presence of other forces generat-ing LD between unlinked SNPs. The values of r2
between most pairs of SNPs in TRI5/TRI10b are > 0.1,presenting these two genes in LD, that might refer tothe controlling role of TRI10 on TRI5 gene cluster[24,30,31]. That TRI10 and TRI5 are located close toeach other on the same chromosome play a minor rolehence the detected LD decay is occurring within 200 bp.
Talas et al. BMC Genetics 2012, 13:14http://www.biomedcentral.com/1471-2156/13/14
Page 5 of 10

Selection acting on oligo- or polygenic traits such asaggressiveness and DON production might be responsi-ble for this [32]; an alternative explanation would be theinvolvement in the same trait network with other phy-siologically important genes.
Association mapping of genes underlying aggressivenessand DON productionWe identified three SNPs related to aggressiveness andone SNP related to DON production using the fairlyconservative Bonferroni-Holm correction. Setting thethreshold for detection of trait associations to an allelefrequency of 0.1 might underestimate the number ofQTL detected but is due to the restricted populationsize. Association between SNPs of candidate gene Erf2and phenotypic data revealed a significant association tomean FHB rating, but not to DON content. This mightbe explained by the fact that the Erf2 gene is involved inRAS2 processing or trafficking that precedes palmitoyla-tion of RAS2 genes [17]. RAS2 is known to regulate theaggressiveness through affecting fungal growth and reg-ulating other pathogenicity genes, e.g., Gmpk1, whichcontrols the induction of extracellular enzymes requiredfor pathogenesis [27]. Further study is needed to under-stand how Erf2 affects differences in aggressiveness of F.graminearum isolates.Two SNPs in MetAP1 gene significantly associated
with aggressiveness were located adjacent to each otherforming a collinearity pattern. The role of MetAP1 wasreported in S. cerevisiae as reducing cell growth by N-terminal protein modification. A similar role might beexpected for MetAP1 in F. graminearum, hence signifi-cant positive correlations between aggressiveness andfungal biomass (r = 0.7, P = 0.01), and fungal biomassand DON content (r = 0.8, P = 0.01) were reportedamong 50 F. graminearum isolates [33]. Nevertheless,analyzed isolates were sampled from visually diseasedspikelets, thus all were able to infect wheat ears andinduce symptoms, non-aggressive isolates were notincluded in our F. graminearum population sample.A single SNP detected in TRI1 was associated with DON
production in F. graminearum. TRI1 encodes a cyto-chrome P450 monooxygenase that catalyzes hydroxylationof C-8 position during trichothecene biosynthesis [34].This confirmation change obviously does not affectaggressiveness, because the respective SNP is just asso-ciated with DON content but not with aggressiveness.
ConclusionsThis is the first candidate gene association mappingstudy provided insights on some genes involved inaggressiveness and DON concentration of F. grami-nearum s.s. The described associations should be vali-dated using a larger number of isolates and different
environments. The validated genes are an importantstarting point for further functional analyses.
MethodsFungal materialEars of winter wheat (Triticum aestivum L.) showingsymptoms of FHB were sampled from three commercialfields in Germany to establish a fungal population of F.graminearum s.s.: Stuttgart-Hohenheim in southwestGermany in 2008, Wetze and Schickelsheim in LowerSaxony in 2006 and 2007, respectively. From eachinfected head, one isolate was recovered, transferredonto a fresh SNA plate and placed under permanentUV light for induction of sporulation as describedrecently [3]. From each isolate, one single spore waspicked out under the microscope and transferred onto afresh SNA plate to establish a single-spore culture. Thesingle-spore isolates were checked morphologically andanalyzed for their species specificity and chemotype bydifferent PCR-based assays as described recently indetail [3]. In total, 77 single-spore isolates of F. grami-nearum s.s. (former lineage 7) were inoculated on themoderately resistant German spring wheat cultivar Tai-fun (KWS LOCHOW GMBH, Bergen, Germany) foranalyzing aggressiveness and DON production in thefield.
Design of field studiesField experiments were planted at each of two locationsin 2009 and 2010: Hohenheim (HOH, longitude 9° 12’58″, latitude 48° 42’ 50″, altitude 400 m) and ObererLindenhof (OLI, longitude 9° 18’ 12″, latitude 48° 28’26″, altitude 700 m), resulting in four environments(location × year combinations). Mean annual tempera-tures at HOH and OLI were 10.1°C and 9.0°C, respec-tively, mean annual precipitations were 644 mm and723 mm, respectively, across 2009 and 2010. Plants weregrown in two-rowed micro-plots of 1 m length and 0.42m width. Plots were arranged in a chessboard-likedesign, i.e., each plot with a wheat entry was borderedby four plots of similar size that were planted with along-strawed spring triticale cultivar Nilex (NORDSAATGmbH, Halberstadt, Germany) to reduce inter-plotinterference caused by drifting of inoculum duringspraying or secondary distribution of spores. The experi-ment was arranged in a split-plot design with two repli-cations. The main plot factor was the F. graminearum s.s. population, the subplot factor the isolate. Both factorswere assigned to a randomized complete block design.Eight plots per replication included in the subplot factorwere not inoculated to estimate the degree of naturalinfection.Inoculum was sprayed with a concentration of 2 × 10⁵
spores ml-1 onto the wheat heads of each plot.
Talas et al. BMC Genetics 2012, 13:14http://www.biomedcentral.com/1471-2156/13/14
Page 6 of 10

Inoculation was performed at full flowering time of thewheat cultivar to ensure maximum susceptibility ofwheat to F. graminearum. Fusarium head blight (FHB)aggressiveness was rated visually four times as the per-centage of infected spikelets per plot (0-100%). This rat-ing included both the number of infected spikes perplot and the number of infected spikelets per spike. Tocompare FHB reactions, the arithmetic means of fourratings were used and assigned as mean FHB ratingthroughout the paper. All plots were harvested by hand,threshed, and the grain analyzed to quantify the amountof DON by a commercially available immunotest (R-bio-pharm AG, Darmstadt, Germany) as previouslydescribed in detail [9]. This test cannot differentiatebetween DON and 3-ADON, so the results include bothmycotoxins. Generally, however, the amount of 3-ADON is only 2-3% of total DON content [35]. In eachof the four environments, the natural infection rate wasvery low ranging from 0 to 3% FHB rating and from 0to 0.34 mg kg-1 DON concentration. Prediction of NIVchemotype was done using the primers N11, 15D11,3D11, and 11R in a multiplex polymerase chain reaction(PCR) as designed by Zhang et al. [36].
Detection of population structure and gene sequencingIn order to analyze the population structure, all isolateswere fingerprinted with 19 simple sequence repeat (SSR)markers dispersed throughout the whole genome follow-ing standard protocols [3].Five candidate genes were chosen according to their
role in trichothecene biosynthesis and/or aggressiveness(TRI1, TRI5, TRI6, TRI10, and TRI14). Two other, yetuncharacterized candidate genes in Fusarium spp. (Erf2,MetAP1) were tested for a possible association withaggressiveness. Nucleotide sequences of these geneswere imported from Fusarium graminearum databaseFGDB [37]. The selected genes were (Table 3): TRI1(FGSG_00071), TRI5 (FGSG_03538), TRI6(FGSG_16251), TRI10 (FGSG_03538), TRI14(FGSG_03543), MetAP1 (FGSG_01397), and Erf2(FGSG_08531). Specific primers were designed (seeAdditional file 2) to amplify parts of these genes usingthe software Primer Premier 4.0 (Premier Biosoft Inter-national, CA, U.S.A.).Polymerase chain reaction (PCR) was performed using
the designed primers related to each gene separately fol-lowing standard protocols, however, with a differentannealing temperature for each gene (Table 3). Purifica-tion of PCR products was performed by precipitatingthe DNA with 10% (v/v) of 3 M Sodium Acetate and25% (v/v) of absolute cold ethanol overnight. Precipi-tated DNA was cleaned twice with 70% ethanol andfinally diluted in 10 μl ddH2O. Purified PCR productswere sequenced (QIAGEN® Sequencing Services,
Hilden, Germany). The sequence was performed oncefor each isolate, hence the alignment was mostly identi-cal (the sequence was repeated in case it fail to align tothe other sequence or in case of high noise in thesequence). Expected sizes of PCR products wereobtained for all tested genes. All sequences of TRI6 andTRI14 were located in the coding region of the genes(exon, see Additional file 1). Sequences of the genesTRI5, MetAP1, Erf2, and TRI10 (two parts) werestretched over two exons. Sequences of genes wereobtained from right to left sides of PCR products, justgenes MetAP1 and Erf2 were obtained from left to rightside. Sequence of TRI1 was located over four exonsaccording to the reference sequence. Number of identi-fied SNPs was high over all sequenced regions of candi-date genes (Table 1). The sequences were aligned(according to the initial matrix published in FGDB)using CLC sequence viewer 6.3 (CLC-bio, Aarhus, Den-mark) to identify single nucleotide polymorphisms(SNPs) among the 77 isolates.
Phenotypic data analysesThe following linear mixed model was used to estimatevariance components: yijn = μ+Isoi+Envj+(Iso × Env)ij+Repn+eijn, where μ is the population mean, Isoi thegenetic effect of the ith isolate, Envj the effect of the jthenvironment, Iso × Env the isolate times environmentinteraction effect, Repn the effect of the nth replication,and eijn the residual error. Variance components weredetermined by the restricted maximum likelihood(REML) method using the software ASReml 2.0 (VSNInternational Ltd, Hemel Hempstead, U.K.). Significancefor variance component estimates was tested by modelcomparison with likelihood ratio tests where the halfedP values were used as an approximation [38]. Heritabil-ity (h2) on an entry-mean basis was estimated as theratio of genotypic to phenotypic variance according toMelchinger et al. [39]. Furthermore, genotypes wereregarded as fixed effects and best linear unbiased esti-mates (BLUEs) were determined for all isolates andtraits.Genetic relatedness among the 77 isolates was deter-
mined by applying principal coordinate analysis (PCoA)[40] based on the modified Rogers’ distances of the iso-lates [41]. Linkage disequilibrium (LD) between theselected SNPs was assessed by the LD measure r2 [42]and significance of LD was tested with Fisher’s exacttests [43]. LD and PCoA computations were performedwith the software package Plabsoft [44].
Association analysisA two-step association approach was applied in thisstudy and the BLUEs per environment were used asinput for the association analysis. The linear mixed
Talas et al. BMC Genetics 2012, 13:14http://www.biomedcentral.com/1471-2156/13/14
Page 7 of 10

model for the association approach was: yijn = μ+ap+Isoi+Envj+eijp, where ap is the effect of allele p. The alleleeffect ap was modeled as fixed effect whereas Isoi andEnvj were regarded as random effects. We assumed thatthe variance of the random genetic effect was Var(g) =2Ks2g, where s2g refers to the genetic variance estimatedby REML and K was a 77 × 77 matrix of kinship coeffi-cients that define the degree of genetic covariancebetween all pairs of entries. We followed the suggestionof Bernardo [45] and calculated the kinship coefficientKij between isolates i and j on the basis of the SSR mar-ker data as Kij = 1+(Sij-1)/(1-Tij), where Sij is the pro-portion of marker loci with shared variants betweenisolates i and j, and Tij is the average probability that avariant from one isolate i and a variant from one isolatej are alike in state, given that they are not identical bydescent. The coefficient Tij was estimated separately foreach gene and trait using a REML method setting nega-tive kinship values between isolates to zero. SNPs withallele frequencies < 0.1 were not considered in the asso-ciation analysis or LD estimation. The obtained opti-mum T values were for DON content: TRI1 (0.025),TRI5 (0.575), TRI10 (0.375), MetAP1 (0.300), and Erf2(0.400). For mean FHB rating: TRI1 (0.600), TRI5(0.150), TRI10 (0.200), MetAP1 (0.075), and Erf2 (0.275).For the detection of main effects of the candidate geneSNPs, these were fitted as fixed effects in the mixedmodel and their significance was tested by a Wald Ftest. Based on the Wald F statistic, we performed testsfor the presence of marker-phenotype associations witha significant (P < 0.05) effect on DON content andmean FHB rating applying the Bonferroni-Holm proce-dure [22] to correct for multiple testing.
The proportion of genotypic variance (pG) explainedby the detected SNP was calculated by fitting each SNPin a linear model to obtain R2
adj. The ratio pG = R2adj/
h2 yielded the proportion of genotypic variance [46]. Inthe case of MetAP1, where two SNPs were detected formean FHB rating, both were simultaneously fitted in thelinear model in the order of their P values to correct forcollinearity. Haplotype analyses were performed with thesame procedure to test the association with both pheno-typic traits (Additional file 2: Table S1). We applied thesame threshold level like for SNP analyses. All mixedmodel calculations were performed using the softwareASReml 2.0 (VSN International Ltd, Hemel Hempstead,U.K.).
Additional material
Additional file 1: Genomic organizations of the seven candidategenes with exons in black color. The sequenced region is shown as agreen bar above each gene.
Additional file 2: Table S1. Haplotype analysis of the genes MetAP1 andTRI1.
AcknowledgementsThis work was funded by the German Academic Exchange Service (DAAD),Bonn, Germany and by the State Plant Breeding Institute (720), UniversitaetHohenheim, Germany. The authors like to thank Mrs. B. Lieberherr forexcellent assistance in field work.
Author details1Universitaet Hohenheim, State Plant Breeding Institute (720), Fruwirthstr. 21,70593 Stuttgart, Germany. 2Universitaet Hohenheim (350), Institute of PlantBreeding, Seed Science & Population Genetics, Fruwirthstr. 21, 70593Stuttgart, Germany. 3National Commission of Biotechnology (NCBT), P. O.Box. 31902, Damascus, Syria.
Table 3 Name of tested genes, chromosomal localization, primer sequence and expected amplified DNA products
No. Gene IDa Chromosome Sequences of the primers Ta (°C) Expected products (bp) Gene size (bp)
1 TRI1 (FGSG_00071) I F CACCAGTTTGCAGGATGT 53.2 850 1980
R AATGGGAGTGATTAGTTCG
2 TRI5 (FGSG_03537) II F TGGCGGATCTATCTATTCA 57.1 750 1129
R CTTCTTGGCGTCCTCTGT
3 TRI6 (FGSG_1625) II F ATGGAGGCCGAATCTCAC 54.4 600 673
R CCACCCTGCTAAAGACCCT
4 TRI10 a (FGSG_03538) II F ATTTCCCAAAGCCTAGACAA 54.2 700 1264
R GGCCGTAATCTTCAAATGGT
5 TRI10 b (FGSG_03538) II F GCACCATTTGAAGATTACGG 54.2 550
R CGTCAAGTCTTCCCATCTCA
6 TRI14 (FGSG_03543) II F AGCCCGAACCCGCTACAT 57.3 750 1116
R CGAACCTGCTGCTCTTAC
7 MetAP1 (FGSG_01397) I F AACGATGCCGGATCGTCA 55.3 800 1403
R TTGCCAAACTCTCGGATCAA
8 Erf2 (FGSG_08531) IV F AGGCATCTTTGTTGTTGTG 52.4 750 2040
R TTGGTAATACGTGGGTTGTa The given gene ID is the entry number of the MIPS F. graminearum genome database (FGDB; Wong et al. 2011)
Talas et al. BMC Genetics 2012, 13:14http://www.biomedcentral.com/1471-2156/13/14
Page 8 of 10
Authors’ contributionsFT carried out the phenotypic and molecular analyses, performed parts ofthe statistical analyses and drafted the manuscript. TW performed parts ofthe statistical analyses and helped to draft the manuscript, JCR edited themanuscript, HKP† participated in the design of the study and supported thetechnical realization. TM participated in the design of the field study andhelped to draft the manuscript. All authors read and approved the finalmanuscript.
Competing interestsThe authors declare that they have no competing interests.
Received: 23 September 2011 Accepted: 12 March 2012Published: 12 March 2012
References1. Agrios GN: Plant Pathology. 5 edition. San Diego: Elsevier Press; 2004.2. O’Donnell K, Ward TJ, Geiser DM, Kistler HC, Aoki T: Genealogical
concordance between the mating type locus and seven other nucleargenes supports formal recognition of nine phylogenetically distinctspecies within the Fusarium graminearum clade. Fungal Genet Biol 2004,41(6):600-623.
3. Talas F, Parzies HK, Miedaner T: Diversity in genetic structure andchemotype composition of Fusarium graminearum sensu strictopopulations causing wheat head blight in individual fields in Germany.Eur J Plant Pathol 2011, 131(1):39-48.
4. Miedaner T, Cumagun CJR, Chakraborty S: Population genetics of threeimportant head blight pathogens Fusarium graminearum, F.pseudograminearum and F. culmorum. J Phytopathol 2008, 156(3):129-139.
5. European Commission: Commission Regulation (EC) No. 1126/2007 of 28September 2007 amending Regulation (EC) No. 1881/2006 setting maximumlevels for certain contaminants in foodstuffs as regards Fusarium toxins inmaize and maize products 2007, Official Journal of the European UnionL255, 14-17. Published online.
6. Vanderplank J: Disease Resistance of Plants New York: Academic Press; 1968.7. Gale LR, Chen LF, Hernick CA, Takamura K, Kistler HC: Population analysis
of Fusarium graminearum from wheat fields in Eastern China.Phytopathology 2002, 92(12):1315-1322.
8. Miedaner T, Schilling AG, Geiger HH: Molecular genetic diversity andvariation for aggressiveness in populations of Fusarium graminearumand Fusarium culmorum sampled from wheat fields in differentcountries. J Phytopathol 2001, 149:641-648.
9. Talas F, Kalih R, Miedaner T: Within-field variation of Fusariumgraminearum sensu stricto isolates for aggressiveness anddeoxynivalenol production in wheat head blight. Phytopathology 2012,102(1):128-134.
10. Ward TJ, Clear RM, Rooney AP, O’Donnell K, Gaba D, Patrick S, Starkey DE,Gilbert J, Geiser DM, Nowicki TW: An adaptive evolutionary shift inFusarium head blight pathogen populations is driving the rapid spreadof more toxigenic Fusarium graminearum in North America. Fungal GenetBiol 2008, 45(4):473-484.
11. Zeller KA, Bowden RL, Leslie JF: Population differentiation andrecombination in wheat scab populations of Gibberella zeae from theUnited States. Mol Ecol 2004, 13(3):563-571.
12. Cumagun CJR, Bowden RL, Jurgenson JE, Leslie JF, Miedaner T: Geneticmapping of pathogenicity and aggressiveness of Gibberella zeae(Fusarium graminearum) towards wheat. Phytopathology 2004,94(5):520-526.
13. Cuomo CA, Güldener U, Xu JR, Trail F, Turgeon BG, Di Pietro A, Walton JD,Ma LJ, Baker SE, Rep M, Adam G, Antoniw J, Baldwin T, Calvo S, Chang YL,DeCaprio D, Gale LR, Gnerre S, Goswami RS, Hammond-Kosack K, Harris LJ,Hilburn K, Kennell JC, Kroken S, Magnuson JK, Mannhaupt G, Mauceli E,Mewes HW, Mitterbauer R, Muehlbauer G, et al: The Fusariumgraminearum genome reveals a link between localized polymorphismand pathogen specialization. Science 2007, 317(5843):1400-1402.
14. Winnenburg R, Urban M, Beacham A, Baldwin TK, Holland S, Lindeberg M,Hansen H, Rawlings C, Hammond-Kosack KE, Kohler J: PHI-base update:additions to the pathogen host interaction database. Nucleic Acids Res2008, 36:572-576.
15. Dyer RB, Plattner RD, Kendra DF, Brown DW: Fusarium graminearum TRI1 isRequired for high virulence and DON production on wheat but not forDON synthesis in vitr. J Agric Food Chem 2005, 53:9281-9287.
16. Kimura M, Tokai T, Takahashi-Ando N, Ohsato S, Fujimura M: Molecular andgenetic studies of Fusarium trichothecene biosynthesis: pathway genesand evolution. Biosci Biotechnol Biochem 2007, 71(9):2105-2123.
17. Bartels DJ, Mitchell DA, Dong X, Deschenes RJ: Erf a novel gene productthat affects the localization and palmitoylation of RAS in Saccharomycescerevisiae. Mol Cell Biol 1999, 19(10):6775-6787.
18. Chen S, Vetro JA, Chang YH: The specificity in vivo of two distinctmethionine aminopeptidases in Saccharomyces cerevisiae. Arch BiochemBiophys 2002, 408(1):87-93.
19. Yu J, Buckler ES: Genetic association mapping and genome organizationof maize. Curr Opin Biotechnol 2006, 17(2):155-160.
20. Wilson LM, Whitt SR, Ibanez AM, Rocheford TR, Goodman MM, Buckler ES:Dissection of maize kernel composition and starch production bycandidate gene association. Plant Cell 2004, 16(10):2719-2733.
21. Karugia GW, Suga H, Gale LR, Nakajima T, Tomimura K, Hyakumachi M:Population structure of Fusarium graminearum species complex from asingle Japanese wheat field sampled in two consecutive years. Plant Dis2009, 93(2):170-174.
22. Holm S: A simple sequentially rejective multiple test procedure. Scand JStat 1979, 6:65-70.
23. Magee DA, Sikora KM, Berkowicz EW, Berry DP, Howard DJ, Mullen MP,Evans RD, Spillane C, MacHugh DE: DNA sequence polymorphism in apanel of eight candidate bovine imprinted genes and their associationwith performance traits in Irish Holstein-Friesian cattle. BMC Genet 2010,11:93.
24. Proctor RH, Hohn TM, McCormick SP, Desjardins AE: TRI encodes anunusual zinc finger protein involved in regulation of trichothecenebiosynthesis in Fusarium sporotrichioides. Appl Environ Microbiol 1995,61(5):1923-1930.
25. Dummitt B, Micka WS, Chang YH: Yeast glutamine fructose 6-phosphateaminotransferase (Gfa) requires methonine aminopeptidase activity forproper function. J Biol Chem 2005, 280(14):14356-14360.
26. Li X, Chang YH: Amino terminal protein processing in Saccharomycescerevisiae is an essential function that requires two distinct methionineaminopeptidases. Proc Natl Acad Sci 1995, 92(26):12357-12361.
27. Bluhm BH, Zhao X, Flaherty JE, Xu JR, Dunkle LD: RAS regulates growthand pathogenesis in Fusarium graminearum. Mol Plant Microbe Interact2007, 20(6):627-636.
28. Reif JC, Maurer HP, Korzun V, Ebmeyer E, Miedaner T, Würschum T: Geneticarchitecture of grain yield and heading time in soft winter wheat. TheorAppl Genet 2011, 123(2):283-292.
29. Würschum T, Maurer HP, Schulz B, Möhring J, Reif JC: Genome-wideassociation mapping reveals epistasis and genetic interaction networksin sugar beet. Theor Appl Genet 2011, 123(1):109-118.
30. Peplow AW, Tag AG, Garifullina GF, Beremand MN: Identification of newgenes positively regulated by TRI1 and a regulatory network fortrichothecene mycotoxin production. Appl Environ Microbiol 2003,69(5):2731-2736.
31. Seong KY, Pasquali M, Zhou X, Song J, Hilburn K, McCormick S, Don Y,Xu JR, Kistler HC: Global gene regulation by Fusarium transcriptionfactors TRI6 and TRI10 reveals adaptations for toxin biosynthesis. MolMicrobiol 2009, 72(2):354-367.
32. Stich B, Melchinger AE, Frisch M, Maurer HP, Heckenberger M, Reif JC:Linkage disequilibrium in European elite maize germplasm investigatedwith SSRs. Theor Appl Genet 2005, 111(4):723-730.
33. Cumagun CJR, Rabenstein F, Miedaner T: Genetic variation andcovariation for aggressiveness deoxynivalenol production and fungalcolonization among progeny of Gibberella zeae in wheat. Plant Pathol2004, 53(4):446-453.
34. Meek IB, Peplow AW, Ake CJR, Phillips TD, Beremand MN: TRI encodes thecytochrome P450 monooxygenase for C-8 hydroxylation duringtrichothecene biosynthesis in Fusarium sporotrichioides and residesupstream of another new TR gene. Appl Environ Microbiol 2003,69(3):1607-1613.
35. Von der Ohe C, Gauthier V, Tamburic-Ilincic L, Brule-Babel A,Fernando WGD, Clear R, Ward TJ, Miedaner T: A comparison ofaggressiveness and deoxynivalenol production between CanadianFusarium graminearum isolates with 3-acetyl and 15-
Talas et al. BMC Genetics 2012, 13:14http://www.biomedcentral.com/1471-2156/13/14
Page 9 of 10

acetyldeoxynivalenol chemotypes in field-grown spring wheat. Eur JPlant Pathol 2010, 127:407-417.
36. Zhang H, Zhang Z, Van der Lee T, Xu J, Yang L, Yu D, Waalwijk C, Feng J:Population genetic analyses of Fusarium asiaticum populations frombarley suggest a recent shift favoring 3ADON producers in southernChina. Phytopathology 2010, 100(4):328-336.
37. Wong P, Walter M, Lee W, Mannhaupt G, Münsterkötter M, Mewes HW,Adam G, Güldener U: FGDB: Revisiting the genome annotation of theplant pathogen Fusarium graminearum. Nucleic Acids Res 2011,39(4):637-639.
38. Stram DO, Lee JW: Variance components testing in longitudinal mixedeffects model. Biometrics 1994, 50(4):1171-1177.
39. Melchinger AE, Utz HF, Schön CC: Quantitative trait locus (QTL) mappingusing different testers and independent population samples in maizereveals low power of QTL detection and larger bias in estimates of QTLeffects. Genetics 1998, 149(1):383-403.
40. Gower JC: Some distance properties of latent root and vector methodsused in multivariate analysis. Biometrika 1966, 53(3):325-338.
41. Wright S: Evolution and Genetics of Populations, Variability within and amongNatural Populations. 4 edition. Chicago: The University of Chicago Press;1978.
42. Weir BS: Genetic data analysis II. 2 edition. Sunderland: Sinauer Associates;1996.
43. Hill WG, Robertson A: Linkage disequilibrium in finite populations. TheorAppl Genet 1968, 38(2):226-231.
44. Maurer HP, Melchinger AE, Frisch M: Population genetic simulation anddata analysis with Plabsoft. Euphytica 2008, 161(1):133-139.
45. Bernardo R: Estimation of coefficient of coancestry using molecularmarkers in maize. Theor Appl Genet 1993, 85(8):1055-1062.
46. Utz HF, Melchinger AE, Schön CC: Bias and sampling error of theestimated proportion of genotypic variance explained by quantitativetrait loci determined from experimental data in maize using crossvalidation and validation with independent samples. Genetics 2000,154(4):1839-1849.
doi:10.1186/1471-2156-13-14Cite this article as: Talas et al.: Association of single nucleotidepolymorphic sites in candidate genes with aggressiveness anddeoxynivalenol production in Fusarium graminearum causing wheathead blight. BMC Genetics 2012 13:14.
Submit your next manuscript to BioMed Centraland take full advantage of:
• Convenient online submission
• Thorough peer review
• No space constraints or color figure charges
• Immediate publication on acceptance
• Inclusion in PubMed, CAS, Scopus and Google Scholar
• Research which is freely available for redistribution
Submit your manuscript at www.biomedcentral.com/submit
Talas et al. BMC Genetics 2012, 13:14http://www.biomedcentral.com/1471-2156/13/14
Page 10 of 10