association of nutrition knowledge and attitude with
TRANSCRIPT

ASSOCIATION OF NUTRITION KNOWLEDGE AND ATTITUDE WITH DIETARY
PRACTICES AND NUTRITIONAL STATUS OF FEMALE UNDERGRADUATE
STUDENTS ATTENDING UNIVERSITY COLLEGES WITHIN NAIROBI
METROPOLIS
BY
LUCY WANJA KINYUA
A DISSERTATION SUBMITTED IN PARTIAL FULFILLMENT OF THE
REQUIREMENT FOR THE DEGREE OF MASTER OF SCIENCE IN APPLIED
HUMAN NUTRITION OF THE UNIVERSITY OF NAIROBI
DEPARMENT OF FOOD SCIENCE, NUTRITION AND TECHNOLOGY
2013

i
DECLARATION
I Lucy Wanja Kinyua hereby declare that this dissertation is my original work and has not
been submitted or presented for a degree in any other university.
_______________________ ________________________
Lucy Wanja Kinyua Date
Bsc. (Foods Nutrition and Dietetics)
This dissertation has been submitted for examination with our approval as university
supervisors.
_______________________ ____________________
Prof. Jasper. K. Imungi Date
Department of Food Science, Nutrition and Technology
______________________ ____________________
Dr. Catherine. N. Kunyanga Date
Department of Food Science, Nutrition and Technology
ii
UNIVERSITY OF NAIROBI
Declaration Form for Students
DECLARATION OF ORIGINALITY FORM
This form must be completed and signed for all works submitted to the University for
examination
Name of Student Lucy Wanja Kinyua
Registration Number A56/69489/11
College College of Agriculture and Veterinary Services
Faculty/School/Institute Agriculture
Department Food Science, Nutrition and Technology
Course Name Masters Applied Human nutrition
Title of the work Association of Nutrition Knowledge and Attitude with Dietary practices and
Nutrition Status of female undergraduate students attending University Colleges within Nairobi
Metropolis
DECLARATION
1. I understand what Plagiarism is and I am aware of the University‟s policy in this regard
2. I declare that this Project is my original work and has not been submitted elsewhere for
examination, award of a degree or publication. Where other people‟s work, or my own work has been
used, this has properly been acknowledged and referenced in accordance with the University of
Nairobi‟s requirements.
3. I have not sought or used the services of any professional agencies to produce this work
4. I have not allowed, and shall not allow anyone to copy my work with the intention of passing it off
as his/her own work
5. I understand that any false claim in respect of this work shall result in disciplinary action, in
accordance with University Plagiarism Policy.
Signature ______________________
Date___________________________

iii
DEDICATION
This dissertation is dedicated to my dear parents the Late John Kinyua in memory of his great
inspiration and impartation of life values to my life and my mama Rudiah Marigu for her
prayers and unwavering support in my life too. Proverb 31:28 “Her children arise and call her
blessed”.
iv
ACKNOWLEDGEMENT
My gratitude goes to God Almighty for His gracious provision of the gift of life, hope, favour
and every resource I needed to successfully complete the course and this research in spite of
challenging moments during the course of the study.
I would like to thank the Government of Kenya through the Ministry of Public Health and
Sanitation for the scholarship award and the study opportunity granted for this course. My
sincere gratitude goes to my supervisors Prof. Jasper K. Imungi and Dr. Catherine N.
Kunyanga both of the department of Food Science, Nutrition and Technology for their
insight, guidance and amazing support during the entire period of research and in producing
this research report.
I sincerely appreciate the Administration of the participating universities particularly, Mr
B.M.Waweru, Registrar Academic University of Nairobi; Mr James Muthee, Registrar
Academic Kenya Methodist University and Mr Hesbon Nyagoa, Registrar Academic Kenya
Polytechnic University College, in facilitating access to these institutions for data collection. I
also greatly appreciate the Heads of Department and lecturers at Kenya Methodist University,
class representatives of the sampled courses at Chiromo, Main campus of the University of
Nairobi and Kenta Polytechnic University College for providing the linkage to students for
participation. I thank all the wonderful female student participants for consenting and
availing time to help with the study.
I am grateful to Ian Mbogo and Miriam Muli the research assistants, Mr Patrick Mathagu
and Mr Joel Imbira of admissions at Kenya Polytechnic University College for their
dedicated efforts and assistance during data collection period. Special thanks go to Mr.Elijah

v
Odundo of Food Security and Nutrition Analysis Unit for technical assistance, all the staff of
the Applied Human Nutrition and my classmate colleagues of 2011 for their great support
during my studies.
Last but not least, I am indebted to my family especially my husband Roy Bundi and my
special friend Hellen Mutuma , your encouragement and support during my study was timely.
God Almighty bless you all.

vi
TABLE OF CONTENTS
DECLARATION ................................................................................................................... i
DECLARATION OF ORIGINALITY FORM ...................................................................... ii
DEDICATION ..................................................................................................................... iii
ACKNOWLEDGEMENT .................................................................................................... iv
LIST OF FIGURES ............................................................................................................. ix
LIST OF TABLES ................................................................................................................ x
LIST OF ABBREVIATIONS............................................................................................... xi
OPERATIONAL DEFINITIONS ........................................................................................ xii
ABSTRACT ...................................................................................................................... xiii
CHAPTER ONE: INTRODUCTION .................................................................................... 1
1.1 BACKGROUND OF THE STUDY ............................................................................. 1
1.2 PROBLEM STATEMENT .......................................................................................... 2
1.3 JUSTIFICATION ........................................................................................................ 2
1.4 OBJECTIVES ............................................................................................................. 4
1.4.1 Main Objective ..................................................................................................... 4
1.4.2 Specific Objectives ............................................................................................... 4
1.5 RESEARCH HYPOTHESIS ....................................................................................... 4
CHAPTER TWO: LITERATURE REVIEW......................................................................... 5
2.1 INTRODUCTION ....................................................................................................... 5
2.2 NUTRITIONAL KNOWLEDGE AND FOOD CHOICES .......................................... 5
2.3 NUTRITION ATTITUDE ........................................................................................... 7
2.4 DIETARY PRACTICES ............................................................................................. 8
2.4.1 Urbanization and Dietary Habits ........................................................................... 8
2.5 DIETARY ASSESSMENT METHODS .................................................................... 10
2.6 NUTRITION STATUS ............................................................................................. 12
2.6.1 Importance of Weight Prior to conception ........................................................... 12
2.6.2 Assessment of Nutritional Status ......................................................................... 13
2.6.3 Nutrition Status of Women in Kenya .................................................................. 15
CHAPTER THREE: STUDY SETTING AND RESEARCH METHODOLOGY................ 16
3.1 STUDY SETTING .................................................................................................... 16
3.1.1 University of Nairobi Colleges ............................................................................ 16
3.1.2 Kenya Methodist University ............................................................................... 17
3.1.3 Kenya Polytechnic University College ................................................................ 17
3.2 STUDY DESIGN ...................................................................................................... 17
3.3 STUDY POPULATION ............................................................................................ 18

vii
3.4 SAMPLING .............................................................................................................. 18
3.4.1 Sample Size Determination ..................................................................................... 18
3.4.1 Inclusion Criteria ................................................................................................ 19
3.4.2 Exclusion Criteria ............................................................................................... 19
3.5 SAMPLING PROCEDURE ...................................................................................... 19
3.6 DATA COLLECTION METHODS........................................................................... 20
3.6.1 Data Collection Tools and Materials ................................................................... 20
3.6.2 Study Variables .................................................................................................. 21
3.6.3 Recruitment and Training of Research Assistants ................................................ 23
3.6.4 Pretesting of Questionnaire and Calibration of the Equipments ........................... 24
3.7 ETHICAL CONSIDERATIONS ............................................................................... 24
3.8 DATA QUALITY ASSURANCE ............................................................................. 25
3.9 DATA MANAGEMENT AND ANALYSIS ............................................................. 25
CHAPTER FOUR: RESULTS ............................................................................................ 27
4.1 SOCIO - DEMOGRAPHIC CHARACTERISTIC ..................................................... 27
4.2 NUTRITIONAL KNOWLEDGE .............................................................................. 28
4.2.1 General Nutritional Knowledge .......................................................................... 28
4.2.2 Knowledge in Macronutrient and Micronutrients. ............................................... 29
4.2.3 Knowledge of Macro nutrients and Micro nutrients by Discipline ....................... 30
4.2.4 Knowledge on Diet and Disease.......................................................................... 31
4.2.5 Source of Nutrition Knowledge by Respondents ................................................. 32
4.3 NUTRITION ATTITUDE ......................................................................................... 33
4.4 DIETARY PRACTICES ........................................................................................... 33
4.4.1 Meal Consumption Patterns ................................................................................ 33
4.4.2 Snacks Consumed ............................................................................................... 35
4.4.3 Source of Food Consumed .................................................................................. 35
4.4.4 Alcohol Consumption Pattern ............................................................................. 36
4.4.5 Nutrition Consideration in Food Choice .............................................................. 37
4.4.6 Frequency of Food Consumption ........................................................................ 38
4.5 NUTRITIONAL STATUS OF THE STUDENTS ..................................................... 40
4.6 ASSOCIATION OF NUTRITION KNOWLEDGE WITH NUTRITION STATUS... 41
4.7 ASSOCIATION BETWEEN NUTRITION KNOWLEDGE AND DIETARY
PRACTICES ................................................................................................................... 41
4.8 ASSOCIATION OF ATTITUDE AND NUTRITION STATUS ................................ 42
4.9 ATTITUDE AND DIETARY PRACTICES .............................................................. 42
CHAPTER FIVE: DISCUSSION ........................................................................................ 44
5.1 INTRODUCTION ..................................................................................................... 44

viii
5.2 NUTRITION KNOWLEDGE ................................................................................... 44
5.3 NUTRITION ATTITUDE ......................................................................................... 46
5.4 DIETARY PRACTICES ........................................................................................... 46
5.5 NUTRITIONAL STATUS ........................................................................................ 48
5.6 ASSOCIATION OF NUTRITION KNOWLEDGE WITH DIETARY PRACTICES 49
5.7 ASSOCIATION OF NUTRITION KNOWLEDGE WITH NUTRITION STATUS... 50
5.8 ASSOCIATION OF NUTRITION ATTITUDE WITH DIETARY PRACTICES AND
NUTRITION STATUS NEXUS ..................................................................................... 51
CHAPTER SIX: CONCLUSIONS AND RECOMMENDATIONS..................................... 53
6.1 CONCLUSIONS ....................................................................................................... 53
6.2 RECOMMENDATIONS ........................................................................................... 54
REFERENCES ................................................................................................................... 55
ANNEXURES .................................................................................................................... 58
Annexure 1: Consent form for the students .......................................................................... 58
Annexure 2: Students questionnaire .................................................................................... 59
Annexure 3: Research assistants training schedule .............................................................. 65
Annexure 4: Nutrition knowledge marking scheme ............................................................. 66
Annexure 5: Nutrition attitude score guide .......................................................................... 67
Annexure 6: Letter seeking authorization from universities ................................................. 69
Annexure 7: Letter of authorization University of Nairobi ................................................... 70
Annexure 8: Letter of authorization Kenya Methodist Universities ...................................... 71
Annexure 9: Letter of authorization Kenya Polytechnic University College......................... 72

ix
LIST OF FIGURES
Figure 1: Shepherds conceptual model of factors associated with food choice ....................... 9
Figure 2: Sampling procedure schema ................................................................................. 20
Figure 3: Knowledge on macro and micro-nutrients ............................................................ 30
Figure 4: Macro nutrient knowledge by course .................................................................... 31
Figure 5: Micronutrients knowledge by course .................................................................... 31
Figure 6: Diet and disease knowledge ................................................................................. 32
Figure 7: Source of nutrition information ............................................................................ 32
Figure 8: Number of meals consumed per day ..................................................................... 34
Figure 9: Meal consumption pattern .................................................................................... 34
Figure 10: Type of snacks consumed ................................................................................... 35
Figure 11: Source of meals consumed ................................................................................. 36
Figure 12: Frequency of alcohol consumption ..................................................................... 37
Figure 13: Correlation of nutrition knowledge and status ..................................................... 41

x
LIST OF TABLES
Table 1: Food consumption by age group. ........................................................................... 10
Table 2: BMI WHO classification table ............................................................................... 14
Table 3: Knowledge score classification table ..................................................................... 22
Table 4: BMI WHO classification table ............................................................................... 23
Table 5: Distribution of female students by the university and by course ............................. 27
Table 6: Distribution of the students by age ......................................................................... 28
Table 7: General nutrition knowledge of the students .......................................................... 29
Table 8: Water intake knowledge by course ........................................................................ 29
Table 9: General attitude of the students .............................................................................. 33
Table 10: Nutrition consideration by course ........................................................................ 37
Table 11: Frequency of consumption of various foods by respondents ............................... 39
Table 12: Distribution of students BMI by course................................................................ 40
Table 13: Prevalence of overweight and/or obesity by course .............................................. 40
Table 14: Association between knowledge and frequency of foods consumption ................. 42

xi
LIST OF ABBREVIATIONS
BMI Body Mass Index
CBD Central Business District
FAO Food and Agriculture Organization
FNB Food and Nutrition Board
GoK Government of Kenya
HSS Humanities and Social Science
MOMS Ministry Of Medical Services
IUNS International Union of Nutritional Science
KDHS Kenya Demographic and Health Survey
KeMU Kenya Methodist University
KPUC Kenya Polytechnic University College
NAS National Academy of Sciences
SPSS Statistical Package for Social Science
UON University of Nairobi
WHO World Health organization
X2 Chi Square

xii
OPERATIONAL DEFINITIONS
Attitude: A person‟s feeling toward aspects of nutritional object or events.
Dietary practices: Food choices, food consumption in terms of frequency and patterns of
individuals.
Lifestyle: Way of life or standard of living commonly chosen as a means of survival or
entertainment, or dictated by the environment, economy or religion.
Malnutrition: Malnutrition is any physical condition resulting either from an inappropriate
or inadequate diet, such as a diet that either provides too much or too little of necessary
nutrients or from a physical inability to absorb or metabolize nutrients.
Nutrition Knowledge: Refers to demonstrated ability to reproduce from memory facts and
principles of nutrition related to general health of an individual.
Obesity: An excessive amount of fat in the body. It describes individuals with a BMI equal
to or more than 30 kg/m2.
Over weight: Body weight above acceptable standard defined in relation to height. It is
defined by a BMI equal to or more than 25 to 29.9 kg/m2.
Under nutrition: Where an individual has deficiency in the recommended nutrients and has
BMI of less than 18.5 kg/m2.

xiii
ABSTRACT
Good nutrition is important in promoting health and is dependent on quality of food eaten.
Food choices are determined by many factors among the most important being nutrition
knowledge and attitude towards nutrition. University female undergraduate students are at an
important stage of their reproductive age and therefore good nutrition is desired for them
especially to ensure healthy birth outcome. This study was therefore designed to assess
nutritional knowledge and attitude, their associations on dietary practices and nutrition status
of the female students in university colleges within the Nairobi Metropolis. A semi-structured
and previously pretested questionnaire was used to interview 384 female undergraduate
students from three university colleges. The information collected included socio-
demographic characteristic, nutrition knowledge, nutrition attitude, dietary practices and
nutrition status. The data was analyzed using SPSS software package with the P value for
statistical significance being set at <0.05. Pearson‟s Chi Square was used to test significance
and associations between categorical variables. One way Anova was used between
categorical and continous variables while Mann Whitney U test and Bivariate correlation was
used between continuous variables.
The results showed that female undergraduate students had average level of nutritional
knowledge (54.1%) and exhibited positive attitude towards nutrition with average score of
47.1 out of a possible highest score of 60. The level of knowledge was significantly higher in
Science students than Social Science students (p=0.000) and majority of the students (57.9%)
identified school as the main source of nutrition information. On a 100 score scale the
students mean on level of knowledge in macronutrients (56.3%) is higher than in micro
nutrients knowledge (45.7%). The level of knowledge in both macro- nutrients (p= 0.004)
and micro-nutrients (p= 0.001) is significantly higher in Science students than HSS students .

xiv
Most of the students (71.6%) exhibited normal nutritional status but prevalence of overweight
and obesity was significantly higher in Social Science students compared to Science students
(p=0.002).
Generally, students exhibited non optimal dietary practices. The average number of meals
consumed in a day was three which is far below the recommended 5-6 meals inclusive of
snacks. Fast food eateries (34.2%) and high sugar and highly refined cereal snacking products
(41%) were most preferred by the students. The daily consumption of fruits (48.2%) and
vegetables (44.1%) was low.
Further findings showed that there was no significant association between students nutrition
knowledge and nutrition status (r= -0.032, p= 0.549) as well as between attitude of students
and nutrition status (r=0.03, p=0.566). The study concluded that the students possessed
average nutrition knowledge, positive attitude towards nutrition and normal nutritional status
but had non-optimal dietary practices.

1
CHAPTER ONE: INTRODUCTION
1.1 BACKGROUND OF THE STUDY
Development in nutrition science has continued to show a linkage between health and
nutrition since the 20th
century discovery on consequences of malnutrition (Gabra, 2001).
Good nutrition is essential for growth, development and maintenance of health throughout
life. Beyond negative impact malnutrition has on socio economic development, lack of
sufficient foods and quality food undermines quality of health and the wellness of the
population of all ages (Swaminathan, 1986). The nutrition status of a woman plays a key role
in her health and is likely to affect negatively birth outcome of her children. Malnutrition in
women can lead to low productivity and increase future risks of poor maternal health which
consequently increases the nation‟s health burden (KNBS and ICF Macro, 2010).
Urbanization in developing countries has brought challenges in food systems and markets. To
cope with feeding the growing urban population, food markets have attracted provision of a
wide range of convenient foods and this has affected individual‟s food choices and eating
habits (FAO, 2010). A shift towards consumption of fast and convenient foods characterized
by high sugars and fat has been on the rise. Consumption of these foods coupled with
sedentary lifestyles has been implicated in overweight, obesity and non-communicable
diseases such as diabetes, cancers and cardiovascular diseases. These conditions have
previously been associated with the developed world but currently developing and less
affluent nations have recorded increasing cases as well (FAO/WHO, 2003).

2
1.2 PROBLEM STATEMENT
Studies in epidemiology show that changes in dietary practices over the recent past years
have increased incidences of overweight, obesity, cancers, diabetes and cardiovascular
related ailments (FAO/ WHO, 2003). Global nutrition transition has shifted dietary habits
particularly in urban settings. Market systems have been infiltrated modernized convenient
food culture leading to consumption of imported and processed foods some are highly
refined, high in sugar, fats and salts. High consumption of these foods coupled with less
physical activity greatly contribute to rising lifestyle chronic diseases even among young
adults (Den Hartog et al 2006).
Poor dietary habits among the college students in Kenya have been reported as a lifestyle
challenge they face while in college. A study at Kenyatta University indicated 96.33% of first
year students exhibiting sub-optimal feeding habits. Unchecked poor dietary practices are
likely to predispose them to overweight and obesity, risk factors associated with chronic
lifestyle diseases (Wangeri et al, 2012). University nutrition education programmes have
also based their priority on students pursuing nutrition or health related courses thereby
closing out students from other courses, yet studies have shown students are not
knowledgeable on their nutrient and diet requirements (O‟Deal and Abraham, 2001) but those
with better knowledge have shown to possess normal nutrition status and positive attitude
toward nutrition (Gates and De Lucia 1998).
1.3 JUSTIFICATION
Female undergraduate students aged 19 to 25 years are among the immediate future mothers
and caregivers to children in our nation. They have special nutrition needs due to their

3
eminent reproductive and productive roles in the society Poor dietary practices may lead to
negative impact on their nutritional status predisposing them to future poor maternal health.
Study findings indicate that female university students eat with consciousness of their weight,
appearance and beauty and this is likely to influence their food choices (Stice et al, 2002).
Promotion of nutrition knowledge therefore play a key role in enhancing positive attitudes
with focus to influence healthy dietary habits and consequently improved nutritional and
health status. Burden of lifestyle diseases among young adults caused by risk factors such as
overweight, obesity and physical inactivity can be reduced by raising knowledge levels on
accurate nutrition information that focus on dietary behavior change (Worsely, 2002).
Universities and tertiary institutions present an opportunity as key avenues for promotion of
nutrition and health to a large number of students. However, Nutrition education in tertiary
institutions of learning has been limited to nutrition and health courses. The current upsurge
of nutrition and health information from sources such as advertising mass media and peer
interaction has greatly influenced public food choices sometimes negatively because some of
this information is inaccurate not scientifically authenticated. This contributes to the
increased confusion and poor dietary practices which can endanger health and wellness.
Young people particularly when image conscious, they eat food with consciousness of well-
being, desirable figure and good appearance. This perception is contributed by food
conscious society that set unrealistic ideals about body weight and favors slim bodies. In the
context of unreliable nutrition information they are likely to develop unhealthy dietary habits
such as skipping meals, intake of high energy but low nutrient dense foods and alcohol which
are known to impact negatively on health (Williams, 1986; Whitney and Rolfes, 1999).
University colleges selected contain a large female population with exposure to the same

4
urban environment influences therefore they are representative of colleges within Nairobi
Metropolis.
1.4 OBJECTIVES
1.4.1 Main Objective
The main objective of the study was to assess the nutrition knowledge, nutrition attitude and
their association with dietary practices and nutritional status of the female undergraduate
students between the ages of 19-25 years attending universities and colleges within Nairobi
metropolis.
1.4.2 Specific Objectives
1. To determine social demographic characteristic of the students.
2. To determine the nutrition knowledge of the students.
3. To determine the nutrition attitude of the students.
4. To determine the nutrition status of the students.
5. To assess the dietary practices of the students.
1.5 RESEARCH HYPOTHESIS
1. Nutrition knowledge of students is not associated with dietary practices and nutrition
status.
2. Attitude of the students is not associated with dietary practices and nutrition status.

5
CHAPTER TWO: LITERATURE REVIEW
2.1 INTRODUCTION
This chapter contains a critical review of information on nutritional knowledge, attitude,
dietary practices and nutritional status and how they associate with one another.
2.2 NUTRITIONAL KNOWLEDGE AND FOOD CHOICES
Nutrition knowledge has been shown to play an important role in influencing healthy food
habits which ensure nutrient needs throughout lifecycle are met adequately since individual
needs are determined by rate of growth. When an individual is aware on how to meet these
nutritional needs this facilitates food choices that enhance health and wellness by preventing
excess or less of intake of nutrients that could be associated with ill health (Worsely, 2002).
To secure society health, nutrition security is an important factor to consider and means more
than having adequate access to quality food and in adequate amounts but also encompasses
the need for people to understand how to utilize a healthy diet for greater benefits to their
health. Therefore nutrition education in community focus on food behavior patterns by
increasing knowledge on food value so as to improve dietary practices and consequently to
enhance nutrition status of an individual (FAO, 2010).
Nutrition education in communities is achieved through continuous extensive awareness
efforts so as to promote changes such as dietary diversification. This becomes important since
societies are experiencing shifts in dietary habits due to nutrition transition. Informal sources
such as community traditional structures are facing challenge from social marketing which
continue to be used widely. Other sources currently being used are print and electronic media,

6
peer as well as formal set ups through school curricula. The current upsurge of nutrition
information has made society more food conscious (Vijayaraghavan, 2004).
In the recent past trends toward healthier diets have increased as the society becomes more
food conscious. Dietary practices have also continued to change due the widening food
choices. Food market systems continue to be infiltrated by both healthy and unhealthy food
products. Consumers are facing dilemma in food choices in spite of current upsurge of
nutrition information however in absence of correct knowledge consumer confusion and
anxiety is likely to affect their food choices. To facilitate consumers to make healthy choices,
empowerment with right nutrition information will help to promote society health (Contento,
2007).
Food choices continue to be influenced by wide range of factors such as advertising through
social marketing, economic status and environmental concerns. The need to enhance
consumer knowledge is being reflected in the changing lifestyle particularly in urban areas as
more people continue to increasingly eat away from home. There is increased demand for
food and markets on the other hand have responded to demand for foods by providing fast
and convenient foods. This has also increased processed and imported foods which have
continued to replace fresh and culturally accepted foods. Therefore food markets and choices
are becoming complex and overcrowded. Therefore much attention should be given in
enhancing right information and clear labeling of products to address concerns by consumers
on intake of adequate nutrients and healthy choices (Contento, 2007).

7
2.3 NUTRITION ATTITUDE
Attitude has been described as a psychological determinant in food choice and consumption
among other determinants such as physiological and nutritional needs. Attitude causes
experience of emotions or may involve intellectual activities such as reasoning and purposive
behavior. Some of the known attitudes associated with food are seen when food choices are
triggered by external factors like sight rather than internal cues like hunger, dietary restraint
or health and avoidance of novel foods. Unhealthy foods that are attractively packaged are
likely to attract more purchase and health factors may not be a consideration in their choices
rather the aesthetic value (Cox and Anderson, 2004).
Attitude towards food greatly influence nutrition efforts and dietary choices that people make
and can be related to observed dietary patterns particularly when based on factors such as
aesthetic values of food or scientific benefits of food to an individual. These factors aim to
influence intention of an individual towards consumption of certain foods. Firm attitude
towards healthy dietary practices acquired through nutrition knowledge are likely to exhibit
positive healthy behavior over long term. Healthy outcome will result when positive attitudes
strongly influence beliefs about consequences of actions taken in food choices. Therefore,
positive attitude shaped by the benefits such as health may produce better practices. Some of
the practices like eating healthy regular meals and keeping weight under control have been
identified to have positive effect on ones age. Positive attitude toward healthy food choices
have been shown to be influenced by nature of environment. School set ups provide such a
conducive environment to promote positive attitude and lifestyle choices in enhancing society
health for students are viewed as change agents (Contento, 2007 and FNB, 2007).

8
2.4 DIETARY PRACTICES
One of the factors that contribute to a healthy lifestyle is good dietary practices. When
frequently consumed foods consist mainly of cereals and legumes and less of animal
products, vegetables and fruits nutrient imbalance can cause micro nutrient deficiencies. Poor
diet combinations synergized by risk factors such as inactivity can easily result to poor
health. Current shifts in diets have been observed where more energy carbonated soft drinks
together with refined grain products containing high fat and sugar are being increasingly
consumed with less consumption of whole grain products and fresh fruits and vegetables
(Schiff, 2009). Future mothers need to watch their dietary patterns not only during pregnancy
but also at least three months before conception. Studies with non pregnant women of child
bearing age have revealed the specific vitamins and minerals whose adequate intake is
essential to a healthy pregnancy (Gail, 2008). Period before conception becomes crucial for
promoting healthy nutrition practices to help build adequate maternal stores. Good nutrition
practices have been found to positively affect a woman‟s nutritional status, menstruation,
ovulation and the likelihood of conception as well as outcome of pregnancy (NAS, 1975).
Nutrition habits and lifestyle choices may influence their ability to conceive and may be
limited by malnutrition and food deprivation practices by women seeking sliming diets. For
example, young women who diet excessively or in severe case of under-nutrition may
develop amenorrhea (Whitney and Rolfes, 1999).
2.4.1 Urbanization and Dietary Habits
In urban centres of developing countries people are consuming less fresh foods and eating
more of processed and convenient foods. More foods are also eaten away from home and at
irregular times. There is usually tendency to consume foods and snacks high in fats and sugar
due to their palatability and convenience. This pattern of food consumption over a long

9
period has potential for negative health outcome of an individual. Kenya Food Pyramid
guidelines adapted from United States Department of Agriculture on healthy food
consumption indicate less consumption of such foods and more consumption of foods that are
rich in complex carbohydrates and less fat (Contento, 2007 and MOMS, 2010).
Food habits in most societies are also dependent on the specific culture of communities which
determine preparation methods and restrictions to certain foods particularly animal foods on
gender and this can contribute to adequacy on dietary intake and society health at large (Cox
and Anderson, 2004). The nutrition transition in urban has eroded traditional food practices
and replaced them with modernized food habits in our society. In urban areas traditional
foods are in short supply and expensive due to poor market systems. As a result urban people
are more receptive to foods that are easy and quick to prepare since there is not always
enough time to accommodate lengthy food preparation (Den Hartog et al, 2006). Food habits
in adults are also influenced by various factors such as attitude, cost, food availability and
accessibility. This is illustrated by the Shepherd‟s conceptual model shown in the Figure 1
Source: Cox and Anderson 2004
Figure 1: Shepherds conceptual model of factors associated with food choice
Perception of
sensory attribute
Attitude
Economic,
Social factors Psychological
factors
Psychological
effects
Food
Food
Choice

10
Other factors likely to influence food habits are socio-demographic variables such as age,
gender and social class. Young people are likely to be vulnerable to consumption of low
nutrient dense foods as opposed to high nutrient dense foods in comparison to older adults.
Such habits over a long time predispose them to risk factors of lifestyle disease. Table 1
shows proportions of consumers‟ preference for low and high nutrient and how it differs by
age groups.
Table 1: Food preference by age group.
Age(years)
16-24
25-34 35-44
Eat crisps once/day 39
27 18
Eat root Vegetables 5
or more time/week
16 20 23
Eats sweet or chocolate
once/day
39 33 24
Drinks soft drinks
once/day
46 32 19
Source: Scottish Health Survey, 1995
2.5 DIETARY ASSESSMENT METHODS
An individual dietary assessment is done using a variety of methods. The methods used are
twenty four hour recall method, use of food frequency questionnaire, use of dietary history
method and food record methods. The twenty four hour recall method provides a written list
of food intake over previous 24 hour. Details of dish, ingredients and the actual food portion
size consumed are recorded. Information can be collected over several days however the
subject burden of recalling is greater than a one day recall. A disadvantage of this method is
the possibility of the respondent forgetting information and difficulty of food portion size

11
description. However photographs and food models are used by the interviewer (Bingham,
2007).
The method using food frequency questionnaire records how often an individual eats specific
foods. This method provides food items consumed over a specific time. It consists of simple
and defined food categories and foods. It is easy to administer and obtain results and gives
fewer burdens to the subject being interviewed. The information collected highlights food
groups therefore nutrients eaten in excess or deficient can be picked out for example those in
never category indicates nutrient deficiency (Gibson, 2005).
The other commonly used method is dietary history method which provides more detailed
information on usual eating pattern. A detailed description of foods, portion sizes and
frequency of consumption is obtained using household measures such as common utensils. A
disadvantage of this method is that it requires face to face interview and consumes more time
and may be costly to carry out in resource constraint set ups (Gibson, 2005).
There are two food record methods used; estimated food records or weighed food records.
Estimated food records require the subject to record all the foods, beverages or snacks during
meal intake. Mixed dishes raw ingredients are recorded as well as the final weight of the dish
and the weight of the consumed food. Portion size of the foods is estimated using household
measures and requires conversion of volume to weights. Weighed food records require all
foods eaten by the respondents to be weighed while a duplicate portion of foods eaten away
be obtained and weighed. One of its disadvantages is that it requires literate and motivated
subjects. Both of these methods have a high respondent burden therefore under reporting is
common. Among the two methods Weighed food records is considered the most accurate
12
method of the two for the actual food portion is weighed but a risk of the subject change in
their usual intake to make the process easy may arise (Gibson, 2005).
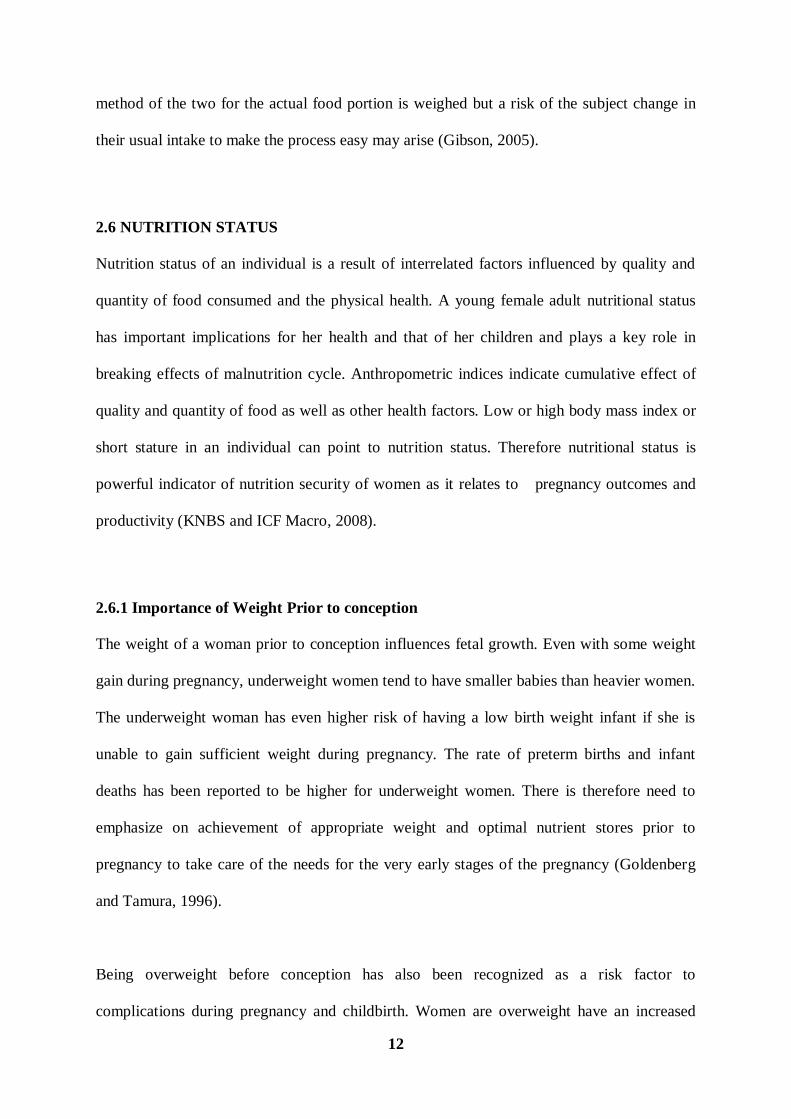
2.6 NUTRITION STATUS
Nutrition status of an individual is a result of interrelated factors influenced by quality and
quantity of food consumed and the physical health. A young female adult nutritional status
has important implications for her health and that of her children and plays a key role in
breaking effects of malnutrition cycle. Anthropometric indices indicate cumulative effect of
quality and quantity of food as well as other health factors. Low or high body mass index or
short stature in an individual can point to nutrition status. Therefore nutritional status is
powerful indicator of nutrition security of women as it relates to pregnancy outcomes and
productivity (KNBS and ICF Macro, 2008).
2.6.1 Importance of Weight Prior to conception
The weight of a woman prior to conception influences fetal growth. Even with some weight
gain during pregnancy, underweight women tend to have smaller babies than heavier women.
The underweight woman has even higher risk of having a low birth weight infant if she is
unable to gain sufficient weight during pregnancy. The rate of preterm births and infant
deaths has been reported to be higher for underweight women. There is therefore need to
emphasize on achievement of appropriate weight and optimal nutrient stores prior to
pregnancy to take care of the needs for the very early stages of the pregnancy (Goldenberg
and Tamura, 1996).
Being overweight before conception has also been recognized as a risk factor to
complications during pregnancy and childbirth. Women are overweight have an increased

13
high risk of medical complications such as hypertension in pregnancy, gestational diabetes
and post-partum infections (Goldenberg and Tamura, 1996). According to Kenya
demographic and Health Survey 2008, the prevalence of overweight or obese among the
educated women who are above secondary education was 34.1%. Some of the factors that
have been associated with overweight or obesity are increase in age, education level and
wealth (KNBS and ICF Macro, 2008).
2.6.2 Assessment of Nutritional Status
Assessment of the nutrition status evaluates an individual‟s health and helps to identify
individuals at risk and those malnourished. The main methods used for assessing nutritional
status include dietary, clinical, biochemical and anthropometric assessments. This study used
anthropometric assessment and it is therefore covered largely.
2.6.2.1 Biochemical assessment
This assessment method involves laboratory tests of body fluids and substances containing
nutrients, enzymes and metabolites to help reflect what is going on in the inside of the body
and the nutrition status of an individual. This method is more useful when coupled with other
methods. Biochemical analysis reveals more on proteins and micronutrient status (Trustwell,
2007)
2.6.2.2 Clinical assessment
This method involves physical examination of the body tissues and organs to help search for
abnormal changes that reflect nutrient deficiency or toxicity. This method requires knowledge
and skill because many signs and symptoms are non-specific however it is useful for
confirming other assessments (Whitney and Rolfes, 1999).

14
2.6.2.3 Dietary assessment
Dietary assessment method involves taking a diet history to provide a record of foods eaten
and eating behavior. Assessment is done using various tools such as food frequency checklist,
24hour recall, food record and usual intake record. Measuring devices, food models or photos
are used to help an individual identify food type and amount consumed (Bingham, 2007).
2.6.2.4 Anthropometric assessment
Anthropometric assessment is a commonly used method that uses body weight, height and
proportions to indicate under nutrition and over nutrition. Quetelet index or BMI is an
international standard that is used for adults and uses weight and height to classify nutrition
assessment (WHO, 2000). BMI is calculated as weight in kilogram per metre squared height
of a person. It is classified as:
Table 2: BMI WHO classification table
BMI (Kg/M2) Classification
<18.5 Underweight
18.5-24.99 Normal
25- 29.99 Overweight
30- 34.99 Obesity class 1
35-39.99 Obesity class 11
>40 Obesity class 111
Other anthropometric methods commonly used are waist-hip ratio, waist circumference and
skin fold thickness. Waist-to hip ratio (WHR) has been used in adults to determine central
adiposity. The ratio distinguishes fat in the lower trunk (hip and buttocks) and upper area
(abdomen and waist). It is obtained by dividing waist by hip circumference. High risk WHR

15
greater than 0.80 for females and 0.95 for males indicates central (upper body) obesity and is
considered high risk while WHR below these cut-off levels is considered low risk to chronic
diseases such as diabetes and cardio metabolic diseases (Gibson, 2005).
Skin-fold thickness estimates the size of subcutaneous fat deposits and indicates total body
fat. However skin fold measurements vary with sex, race and age as well. Measurements are
taken at the abdomen, triceps and sub- scapular sites using special calipers. Body fat equal to
or greater than 32% in women less than 40 years and 25% in men less than 50 indicates
obesity (Gibson, 2005).
2.6.3 Nutrition Status of Women in Kenya
According to Kenya National Bureau of Statistics 2010, the mean BMI for females aged 20-
29 years nationally was 22.6 with the prevalence of underweight and obesity being 10.5%,
and 4.7% while that of overweight and/or obese was 22.5%. Among those educated to
secondary school level and above, the prevalence of underweight and overweight and/or
obesity was 7.5% and 34.1% respectively. In Nairobi the prevalence of underweight and
obesity among women was 3.2% and 11.2 % respectively.

16
CHAPTER THREE: STUDY SETTING AND RESEARCH METHODOLOGY
3.1 STUDY SETTING
The study was carried out in three university colleges located in Nairobi Metropolis at the
heart of the capital city of Kenya and the largest urban center. The institutions included
University of Nairobi College of Humanities and Social Science and College of Health
Sciences, Kenya Polytechnic University College and Kenya Methodist University Nairobi
Campus.
3.1.1 University of Nairobi Colleges
University of Nairobi (UON) began in 1956 and has six colleges located within Nairobi and
its environs headed by principals. They are; College of Health Sciences, College of
Architecture and Engineering, College of Agriculture and Veterinary Sciences, College of
Biological and physical Sciences, College of Education and External studies and College of
Humanities and Social Sciences. The respondents were drawn from the Colleges of Health
Sciences and College of Humanities and Social Sciences located at Chiromo and Main
campus respectively. The college of Health Sciences offer courses in Biochemistry, Medicine
and Surgery, Medical laboratory and Technology, Pharmacy, Dental Surgery and Nursing.
The College of Humanities and Social sciences offer courses in Arts, Commerce, Laws,
Anthropology, Journalism and Media studies, Economics and Statistics. The total female
population for UON was 12,068, for College of Humanities and Social Science was 6842 and
college of Health Sciences was 1433 for module II and II at the time of study.

17
3.1.2 Kenya Methodist University
KeMU is a chartered Christian University. Nairobi campus is one of the four KeMU
campuses and the main campus is located at Meru County. Nairobi campus is situated on
Koinange Street within Central Business District. The university has two schools and two
faculties namely; School of Health Science, school of Business and management studies,
Faculty of Science and Technology and Faculty of Education and Social sciences. Nairobi
campus offers limited programmes compared to those offered at the main campus. The
undergraduate courses offered at Nairobi campus are Business Information, Microfinance,
Business administration, Computer Information Systems, Journalism and Counselling. Kenya
Methodist University had over 9000 students and a population of 2683 female undergraduate
students in Nairobi campus by the time of study.
3.1.3 Kenya Polytechnic University College
The University College began in 2007 as a constituent of UON and was upgraded to provide
degree courses in their area of specialization. There are three faculties namely; Applied
Science and Technology, Engineering and Built Environmental and Liberal and Professional
Studies. The courses are offered from the nine Schools established. At the time of study the
total of female undergraduate students was 543.
3.2 STUDY DESIGN
A cross-sectional study was carried out with both descriptive and analytical components at
UON, KeMU and KPUC from the month of July to August 2012.

18
3.3 STUDY POPULATION
The study population comprised of female undergraduate students in all university colleges in
Nairobi. The sampling frame comprised of female undergraduate students aged 19 to 25 years
at UON, KeMU and KPUC in Nairobi metropolis.
3.4 SAMPLING
3.4.1 Sample Size Determination
Sample size was determined using Fischer formula (Fischer et al, 1991) as the population
from which the sample size was drawn was more than 10,000.The strength of this formula is
that acceptable degree of accuracy is set.
n = z2pq/d
2 Where:
n = the desired sample size
z = the standard normal deviate at the required confidence level (95%) = 1.96
p = the proportion in the target population estimated to have characteristics being measured.
KDHS, 2008 national prevalence of overweight or obesity among the educated population
from secondary education and above = 34%
q =Proportion not expected to be suffering from overweight and obesity 1-p = (1-0.34 =
0.66)
d = the degree of accuracy set 0.05
Sample Size;
Therefore n = 1.962 0.34 (0.66)
(0.05)2
= 345
Considering Non response rate of 10%
Total desired sample size = the obtained sample size/ (1- Non response rate)
n = 345 / (1-0.1) = 383

19
3.4.1 Inclusion Criteria
The female undergraduate students aged 19 to 25 years old attending the three universities
who agreed to participate in the study and signed the consent form (Annexure 1).
3.4.2 Exclusion Criteria
The female undergraduate students excluded from the study were those outside the age range
and those aged 19 to 25 years who are pregnant or with known chronic diseases.
3.5 SAMPLING PROCEDURE
Nairobi metropolis was purposively selected because of its diversity and contained majority
of the university colleges. The universities purposively selected for the study included
University of Nairobi, Kenya Methodist University and Kenya Polytechnic University
College. They had the characteristics desired and they offered more than three science fields
together with humanities and social sciences. The total number of universities within the city
was eleven. Probability Proportion to size sampling was used to determine the sample size for
each University college. Courses were purposively selected and sample size for each
university was equally shared between Science, Humanities and Social sciences. Random
sampling was used to select the respondents present during classes. This was done using
pieces of paper written numbers of the total respondents required and others written „Zero‟
depending on the female students present in a particular course. University of Nairobi shared
equally the total sample size for the subsidiary campus selected. Fig 3.1 summarizes the
sampling procedure;

20
Figure 2: Sampling procedure schema
3.6 DATA COLLECTION METHODS
3.6.1 Data Collection Tools and Materials
The study applied quantitative research tool using a semi structured previously pretested
questionnaire and nutrition knowledge and attitude marking guide. The questionnaire
NAIROBI METROPOLIS PURPOSIVE
KEMU
2683
KPUC
543
UON
3005 PURPOSIVE
165 PROBABILITY
PROPORTION
TO SZE
185 33
College of
Humanities
and Social
Sciences
College of
Health
sciences
SIMPLE
RANDOM
NAIROBI CBD
Moi, Egerton, Mount Kenya University,
Zetech, UON, KPCU, KeMU, Kenyatta,
ST.Paul, Nazareen, Kenya College of
Accountancy
PURPOSIVE
HSS
93
Science
92
HSS:
Science
16:17
HSS:
Science
83:82

21
administered gathered information on socio demographic characteristic, nutritional
knowledge, nutritional attitude, dietary practices and nutrition assessment (Annexure 2). For
anthropometric measurement bathroom scales and standiometer were used to take weight and
height respectively of the respondents.
3.6.2 Study Variables
A period of two weeks was allocated to each university for data collection to ensure
convenient time of the students. Anthropometric measurements were taken using
standiometre and electronic weighing scale. Information on nutritional knowledge, attitude
and dietary practices were obtained using self administered questionnaires to respondents.
Each questionnaire was coded with a unique number to represent each university and
respondent. The questionnaire was used to collect the following information;
3.6.2.1 Socio- demographic characteristics
This comprised of information on age, course undertaken, year of study and the name of the
university the respondents attended and this provided background information of students
recruited to the study.
3.6.2.2 Nutritional knowledge
This section collected information on female student‟s general nutrition knowledge in the
area of macronutrients, micronutrients, water intake, diet and disease using a multiple choice
answers. Each question had one mark for every correct response chosen. An additional
question was incorporated to establish the main source of nutrition information. Using a
marking scheme for nutritional knowledge test (Annexure 4) the scores were rated on score
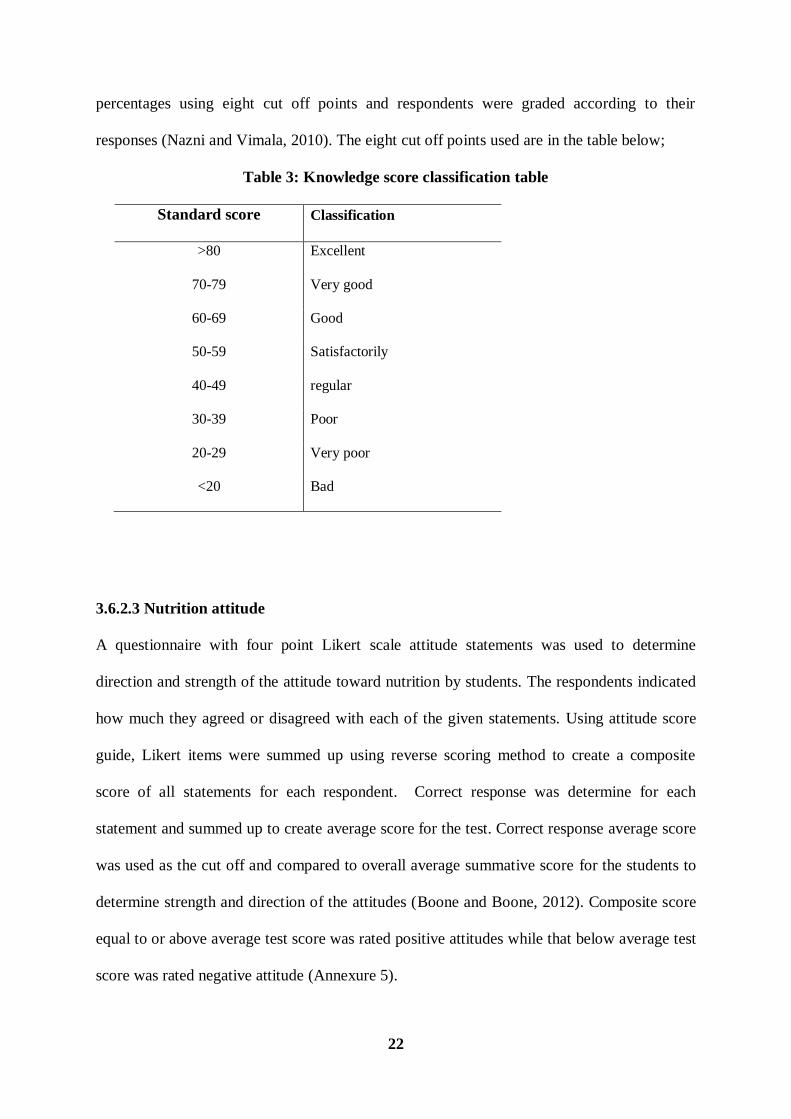
22
percentages using eight cut off points and respondents were graded according to their
responses (Nazni and Vimala, 2010). The eight cut off points used are in the table below;
Table 3: Knowledge score classification table
Standard score Classification
>80 Excellent
70-79 Very good
60-69 Good
50-59 Satisfactorily
40-49 regular
30-39 Poor
20-29 Very poor
<20 Bad
3.6.2.3 Nutrition attitude
A questionnaire with four point Likert scale attitude statements was used to determine
direction and strength of the attitude toward nutrition by students. The respondents indicated
how much they agreed or disagreed with each of the given statements. Using attitude score
guide, Likert items were summed up using reverse scoring method to create a composite
score of all statements for each respondent. Correct response was determine for each
statement and summed up to create average score for the test. Correct response average score
was used as the cut off and compared to overall average summative score for the students to
determine strength and direction of the attitudes (Boone and Boone, 2012). Composite score
equal to or above average test score was rated positive attitudes while that below average test
score was rated negative attitude (Annexure 5).

23
3.6.2.4 Nutrition status
The weight and height of the students were measured and the values used to calculate the
BMI. Evaluation of the nutrition status using BMI was based on the following WHO criteria
(WHO, 2000).
Table 4: BMI WHO classification table
BMI (Kg/M2) Classification
<18.5 Underweight
18.5-24.99 Normal
25- 29.99 Overweight
30- 34.99 Obesity class 1
35-39.99 Obesity class II
>40 Obesity class III
3.6.2.5 Dietary practices assessment
Data was collected on number of meals consumed daily, meal patterns, snacking habits,
source of meals taken while in college, alcohol intake and weekly food frequency
consumption of nine food groups among the 8-12 recommended. The evaluation for the
number of meals consumed in a day was based on (5-6) times as recommended by World
Health Organization (WHO, 2002).
3.6.3 Recruitment and Training of Research Assistants
Two research assistant were recruited for data collection and were supervised by the principal
investigator. The research assistants were recruited based on criteria that they had attained
formal education at least secondary school education, were fluent in written and spoken

24
English and Kiswahili, good communication skills, outgoing personality and teamwork
ability. The research assistants were trained for one day on various aspects of data collection
exercise in order so to ensure accuracy and competence as outlined in the training schedule in
Annexure 3. The training topics covered nature of study and its objectives, data collection
method and materials, code of conduct and work schedule in the field. They were trained on
how to accurately take measurements on weight and height, record them accurately and check
for questionnaire completeness. During the training sample questionnaire were administered
to each other (role play) and any challenge arising addressed. The lecture, role plays and
demonstration methods were used during training.
3.6.4 Pretesting of Questionnaire and Calibration of the Equipments
Before actual data collection, tools and equipments were pre-tested and validated at Moi
University town campus. Ten respondents were selected to participate in the exercise. Data
gathered in this exercise was used to evaluate validity of the tools. Modification of the tools
was done based on the pretest and questions which were not well understood corrected while
irrelevant questions were omitted. The equipments were tested for accuracy to ensure correct
readings were observed.
3.7 ETHICAL CONSIDERATIONS
A letter to conduct the study was obtained from the administration of the researcher‟s
university following the proposal approval. A research permit was also procured from the
National Council for Science and Technology while authorization to conduct research from
three selected universities was obtained from the university colleges (Annexure 7, 8 and 9).
During data collection the participants were informed of the study purpose and their consent

25
obtained. The questionnaires were self-administered and names of respondents were not
indicated to ensure confidentiality.
3.8 DATA QUALITY ASSURANCE
The research assistants were trained on data collection techniques, correct use of equipments
and accurate recording of measurements to minimize errors. Calibration of weighing scales
was carried out daily by placing a 2kg item to obtain an accurate reading. The respondents
were assured of the confidentiality of all information given to enable the respondents provide
correct information. The researcher closely supervised the data collection exercise as she was
part of the field exercise and addressed any challenges encountered. The questionnaires were
checked for completeness and proper filling of data as well as correct recording of
measurements. The principal researcher was also supervised once by the university
supervisor while carrying out data collection exercise.
3.9 DATA MANAGEMENT AND ANALYSIS
After data collection exercise, all data that was not coded was coded before data entry into
computers as variables. Anthropometric data was entered in Ms Excel to calculate BMI inices
after which it was entered in SPSS. The Statistical Package SPSS version 16.0 was used to
enter data, clean and analyze. Descriptive statistics were done to provide general
characteristic of the data. Quantitative data was explored to check for outliers. This was done
by running frequencies, means, and dispersion and cross tabulation. This was to ensure
correct information had been entered and extreme values were set at mean value by
transformation. Shapiro -Wilk test for normality was done for knowledge score, attitude score
and BMI as continuous variables to determine the type of analytical tests for hypothesis and
associations of the study. Where p-value was less than 0.05 non-parametric tests were used.

26
Using Chi square test, significant association was checked for water intake knowledge,
attitude, nutrition practice consideration and nutrition status by course were determined.
Fisher Exact test was done to test significant association where cells had less than five counts.
This was done in alcohol consumption by course and association of knowledge and frequency
of food consumption. Man Whitney u test was used to compare means of overall knowledge
score, macro and micro nutrient knowledge by course. One way Anova tests was used to test
significant differences in attitude and frequency of food consumption. Bivariate Spearman‟s
rank order correlation was done to determine significance for associations between
knowledge and nutrition status, knowledge and number of meals, attitude and nutrition status
and between attitude and number of meals. The level of statistical significance set at p< 0.05.

27
CHAPTER FOUR: RESULTS
4.1 SOCIO - DEMOGRAPHIC CHARACTERISTIC
The distribution of the respondents by university and course is shown in Table 5. Majority of
students were from University of Nairobi (UON) at 48.7 % and Kenya Methodist University
(KeMu) at (43%) while the lowest proportion was the Kenya Polytechnic University College
(KPUC) at 8.3%.
Table 5: Distribution of female students by the university and by course
University HSS Science N= 363
n = 182 n=181
UON 89 88 177
KeMU 80 76 156
KPUC 13 17 30
Total 182 181 363
The age of the students is shown in Table 6. The mean age was 21.3 (SD 1.5) years. Majority
of the students were aged 19 to 23 years, while those aged 24 and 25 years comprised 5.0%
and 2.8 % of the respondents respectively.

28
Table 6: Distribution of the students by age
Age (Years) Frequency Percent (%)
19 56 15.4
20 69 19.0
21 76 20.9
22 86 23.7
23 48 13.2
24 18 5.0
25 10 2.8
Total 363 100.0
4.2 NUTRITIONAL KNOWLEDGE
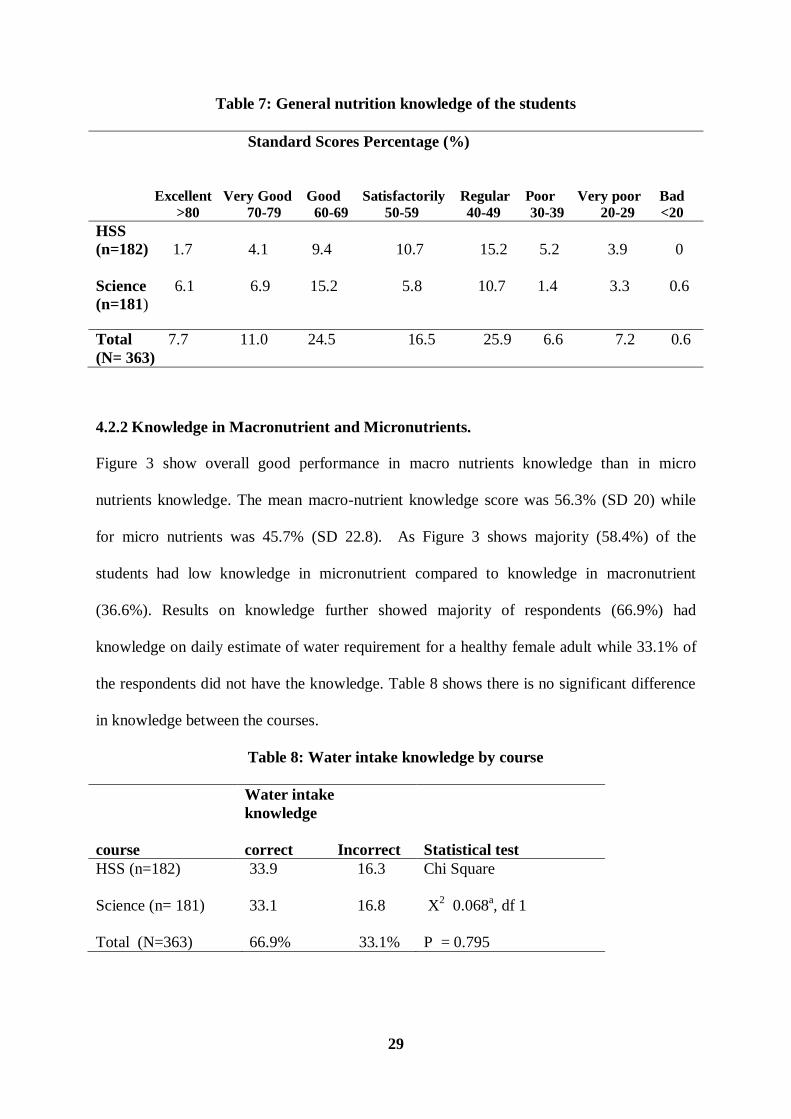
4.2.1 General Nutritional Knowledge
The results show generally that, students had a mean score of 54.1% ±16.1 with a maximum
score of 93% and minimum score of 11%. Table 7 shows the level of knowledge in nutrition
of the selected student participants and performance and by discipline (HSS and Science).
The mean knowledge score of Social Science based students (n=182) was 50.5(SD 14.4)
while Science based students (n=181) was 57.7 (SD 16.9). Using Mann- Whitney U test there
was a significant difference between the mean of the two disciplines (p=0.000).
29
Table 7: General nutrition knowledge of the students
Standard Scores Percentage (%)
Excellent Very Good Good Satisfactorily Regular Poor Very poor Bad
>80 70-79 60-69 50-59 40-49 30-39 20-29 <20
HSS
(n=182) 1.7 4.1 9.4 10.7 15.2 5.2 3.9 0
Science 6.1 6.9 15.2 5.8 10.7 1.4 3.3 0.6
(n=181)
Total 7.7 11.0 24.5 16.5 25.9 6.6 7.2 0.6
(N= 363)
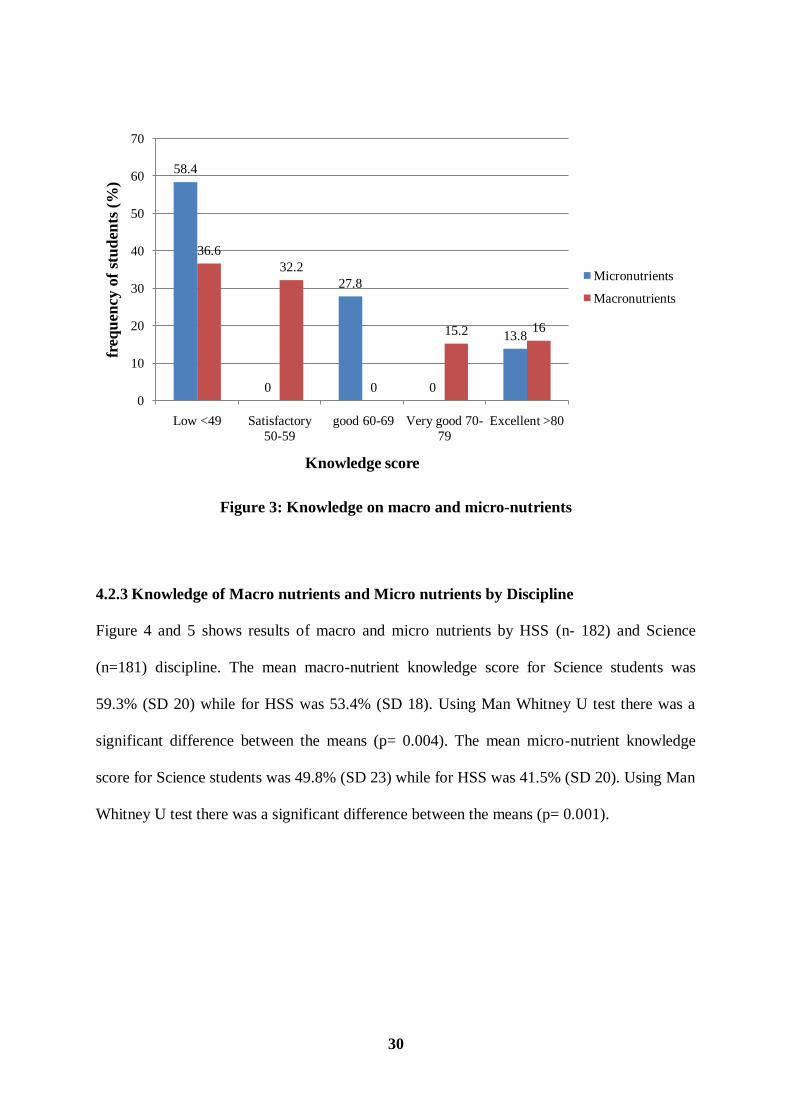
4.2.2 Knowledge in Macronutrient and Micronutrients.
Figure 3 show overall good performance in macro nutrients knowledge than in micro
nutrients knowledge. The mean macro-nutrient knowledge score was 56.3% (SD 20) while
for micro nutrients was 45.7% (SD 22.8). As Figure 3 shows majority (58.4%) of the
students had low knowledge in micronutrient compared to knowledge in macronutrient
(36.6%). Results on knowledge further showed majority of respondents (66.9%) had
knowledge on daily estimate of water requirement for a healthy female adult while 33.1% of
the respondents did not have the knowledge. Table 8 shows there is no significant difference
in knowledge between the courses.
Table 8: Water intake knowledge by course
course
Water intake
knowledge
correct Incorrect Statistical test
HSS (n=182) 33.9 16.3 Chi Square
Science (n= 181) 33.1 16.8 X2 0.068
a, df 1
Total (N=363) 66.9% 33.1% P = 0.795
30
Figure 3: Knowledge on macro and micro-nutrients
4.2.3 Knowledge of Macro nutrients and Micro nutrients by Discipline
Figure 4 and 5 shows results of macro and micro nutrients by HSS (n- 182) and Science
(n=181) discipline. The mean macro-nutrient knowledge score for Science students was
59.3% (SD 20) while for HSS was 53.4% (SD 18). Using Man Whitney U test there was a
significant difference between the means (p= 0.004). The mean micro-nutrient knowledge
score for Science students was 49.8% (SD 23) while for HSS was 41.5% (SD 20). Using Man
Whitney U test there was a significant difference between the means (p= 0.001).
58.4
0
27.8
0
13.8
36.6
32.2
0
15.2 16
0
10
20
30
40
50
60
70
Low <49 Satisfactory
50-59
good 60-69 Very good 70-
79
Excellent >80
freq
uen
cy o
f st
ud
ents
(%
)
Knowledge score
Micronutrients
Macronutrients

31
Figure 4: Macro nutrient knowledge by course
Figure 5: Micronutrients knowledge by course
4.2.4 Knowledge on Diet and Disease
Figure 6 shows results of diet and diseases knowledge. Students proportion with high
knowledge (scored 100%) were 41.6% while 42.4% had low knowledge (scored 50%) and
16% had no knowledge at all (scored 0).
0
5
10
15
20
25
30
35
40
Low Satisfactory Very good Excellent
36.6
32.2
15.2 16
21.2
16.8
6.95.2
15.4 15.4
8.310.7
Freeq
uen
cy o
f st
ud
en
ts (
%)
Knowledge Score
Macronutrients
HSS
Science
0
10
20
30
40
50
60
Low Good Excellent
58.4
27.8
13.8
33.6
11.8
4.7
24.8
16
9.1
Freq
uen
cy
of
stu
den
ts (
%)
Knowledge Score
Micronutrients
HSS
Science

32
Figure 6: Diet and disease knowledge
4.2.5 Source of Nutrition Knowledge by Respondents
Figure 7 show the source of nutrition information by the students. Majority of respondents
(57.9%) had gained nutritional knowledge from school and small proportion (1.1%) from
church. Others sources from which students gained nutrition information includes internet,
magazines, television, books, family and peers.
Figure 7: Source of nutrition information
41.6
42.4
16
High
low
none
1.1
8.8
13.5
18.5
24.5
27.8
30
57.9
0 10 20 30 40 50 60 70
Church
Peers
Family
Books
T.V
Magazines
Internet
School
Frequency of students (%)
Nu
trri
tio
n i
nfo
rm
ati
on
sou
rce

33
4.3 NUTRITION ATTITUDE
The study findings show that majority (59.8%) of the students have a positive attitude
towards nutrition practices. Out of total score of 60 the minimum score was 35 and the
maximum score was 58. Out of 47 correct response average score the overall mean score was
47.1± 4.1. The mean attitude score for Humanities and Social Sciences (n=182) was 47±4.1
while the mean for Science students (n=181) was 47.3 ±4.1. Table 9 shows results of attitude
by course using Pearsons Chi square there is no significant difference in attitude between
HSS and Science disciplines (p > 0.05).
Table 9: General attitude of the students
course
Attitude
Positive Negative Statistical test
HSS (n=182) 29.2 20.9 Chi Square
Science (n= 181) 30.6 19.3 X2 0.359
a, df 1
Total (N=363) 50.8% 40.2% P value = 0.0549
4.4 DIETARY PRACTICES
The results given in this section represent dietary practices in terms of meal consumption
patterns, types of snacks consumed, sources of meals consumed, frequency of consumption
of various foods, alcohol consumption and practice of nutrition knowledge.
4.4.1 Meal Consumption Patterns
The mean number of meals consumed by students in a day was 2.5 (SD 0.7). As shown in
Figure 8 a small proportion met the threshold of required meals (5-6) times in a day including
snacks. The results further show in Figure 9 that majority of the students consumed supper

34
(76.3%), lunch (61.4%) and breakfast (59.2%) daily while daily snacking was very low
(20.7%).
Figure 8: Number of meals consumed per day
Figure 9: Meal consumption pattern
7.4%
41.3%48.2%
2.5%0.6%
one
Two
Three
Four
Five
0
10
20
30
40
50
60
70
80
Breakfast Lunch Supper Snack
59.2
35.5
76.3
20.7
37.2
61.4
23.1
73.6
3.6 3 0.65.8
Fre
equ
ency
of
stu
den
ts(%
)
Meal type
Everyday
Sometimes
None

35
4.4.2 Snacks Consumed
Figure 10 shows the type of snacks consumed. As results show, snacks high in fats and sugar
were the most consumed by students. Biscuits (41.0%) were the most preferred followed by
french fries (chips) and crisps (37.5%). Healthy snacks such as fruits and nuts were among
the least consumed with a proportion of 6.9% and 8.3% respectively.
Figure 10: Type of snacks consumed
4.4.3 Source of Food Consumed
The results in Figure 11 show choice of eating places by students. Fast food restaurants were
the most preferred eating sites (34.2%) followed by the college cafeteria 25.1% while 22.3%
cooked for themselves and 8.8% carried packed foods from home. A few students preferred
combining college cafeteria with cooking for themselves (8.3%) and packed food from home
(0.8%).
41
37.5
27.3
16.3
14.5
11.8
11.3
10.5
8.3
6.9
6.1
0 5 10 15 20 25 30 35 40 45
Biscuits
Crisps/chips
cakes
Mandazi
Smokies
Soft drinks
Yoghurt/Milk
Chocolate / sweet
Nuts
Fruit
Samosa
Frequency of students (%)
Typ
e of
snack

36
Figure 11: Source of meals consumed
4.4.4 Alcohol Consumption Pattern
The study results show that majority of the respondents did not take alcoholic beverages
(64.2%) while a proportion of 35.8% consume alcohol. For the proportion that consumed
alcohol, majority of the students (58.5%) consumed alcoholic beverage once in a month and a
small proportion (1.5%) everyday as shown in Figure 12. Using Fisher Exact test there was
no significant difference between the HSS and Science disciplines in alcohol consumption (p
= 0.227).
34.2
25.1
22.3
8.8
8.3
0.8
0.6
0 5 10 15 20 25 30 35 40
Fast food places
College cafteria
Cook for self
Packed-home
College /cook self
College/packed home
Food kiosks
Frequency of students (%)
Mea
ls s
ou
rce

37
Figure 12: Frequency of alcohol consumption
4.4.5 Nutrition Consideration in Food Choice
Majority (56.2%) of the students agreed that they considered nutrition when choosing and
planning meals, while 43.8% did not consider nutrition. Table 10 shows results of students‟
nutrition consideration in food choices. Using Pearson‟s Chi Square test there was no
significant difference between HSS and science disciplines (p > 0.05).
Table 10: Nutrition consideration by course
course
Nutrition
consideration
Yes No Statistical test
HSS (n=182) 26.2 24.0 Chi Square
Science (n= 181) 30.0 19.8 X2 2.373
a, df 1
Total (N=363) 56.2% 43.8% P value = 0.123
1.5
22.3
58.5
17.7
Everyday
once/week
once/month
Special occasion

38
4.4.6 Frequency of Food Consumption
Food frequency results in Table 11 show students consume a variety of foods. The main
staple food most frequently consumed was rice followed by ugali. Results of cereal foods
showed frequent consumption of refined cereal products and less of whole grain products.
Fried and processed roots/tubers were the most frequently consumed. Results further showed
milk and milk products were frequently consumed but majority of students never consumed
fish and sea foods (52.3%). Majority of the students frequently consumed fruits and
vegetables but not daily, a proportion of 48.2% and 44.1% consuming them daily
respectively. Majority of students frequently consumed sugar/honey (56.7%) daily, while
tea/milo/cocoa (68%) was the most frequently consumed beverage daily.

39
Table 11: Frequency of consumption of various foods by respondents
Frequencies (%)
(N = 363)
Type of food Everyday 1- 2 times a week 3-6 times a week Never consumed
Cereals
White rice 9.6 51.0 36.4 3.0
Brown rice 0.3 8.8 3.0 87.9
Ugali (grade 1 flour) 6.9 58.1 22.3 12.7
Chapati (white) 4.7 62.8 12.9 19.6
Chapati ( brown) 2.8 24.5 4.7 68.0
Breakfast cereals 13.5 24.8 6.1 55.6
White bread 27.8 27.3 17.6 27.3
Whole bread 10.2 25.1 12.7 52.1
Cakes 6.9 54.3 13.5 25.3
Biscuits 9.9 43.8 14.9 31.4
Roots and Tubers
Cassava/yams - 18.5 - 81.5
Arrowroot/sweetpotatoes 1.1 39.1 8.3 51.5
Potato chips 6.9 51.7 20.1 21.5
Potato crisps 5.2 46.8 12.7 35.3
Mashed/baked potatoes 1.7 28.9 8.0 61.4
Milk and milk products
Fresh milk 28.9 33.9 15.7 21.5
Yoghurt 5.0 51.0 15.7 28.4
Ice cream 1.7 38.6 8.5 51.2
Meat, poultry& product
Eggs 5.2 57.3 17.4 20.4
Fish and sea food 1.7 38.8 7.2 52.3
Meats, pork,goat,lamb 12.9 47.7 20.1 19.3
Sausages 6.1 47.7 11.8 34.4
Burgers 0.3 25.1 6.9 67.8
Legumes and nuts e,g Beans,
groundnuts, legumes, lentils, peas 12.9 49.0 27.3 10.7
Fruits e.g
mangoes,avocado,pawpaw 48.2 25.6 24.0 2.2
44.1 25.9 27.5 2.5
Vegetables e.g
Kales.spinach,Cabbage
Sweets
Sugar / honey 56.7 15.4 10.5 17.4
Candies (sweets0 18.7 31.4 13.5 36.4
Chocolates 7.7 44.9 12.7 34.7
Beverage
Fruit squash 8.0 28.1 11.8 52.1
Fresh juice 10.2 48.5 15.7 25.6
Tea/milo/cocoa 68.0 12.7 11.0 8.3
Sodas 10.2 44.9 12.4 32.5

40
4.5 NUTRITIONAL STATUS OF THE STUDENTS
Height and weight measurements were carried out to determine the BMI. The results show
the students mean height was 160.1cm (SD 5.9). The lowest and highest height was 139.9cm
and 176.5cm respectively. The mean weight was 58.5 kg (SD 9.7) while the lowest and
highest was 36.6 and 97.2 kg respectively. The mean BMI was 22.9 with a low of 15.4 and
high of 37.3. Table 12 shows students BMI results and BMI distribution by discipline.
Overall 71.6% of the female students were of normal weight, 5.5% were underweight, 18.5%
overweight and 4.4% obese. Using Chi Square test there was a significant difference in
nutrition status between the courses (p<0.05). The results further show in Table 13 that Social
Science students were significantly more overweight and obese than Science students
(P<0.05).
Table 12: Distribution of students BMI by course
Course
undertaken
BMI Category
Underweight
%
Normal% Overweight
%
Obese % Total % Statistical
test
HSS (n=
182)
2.8 32.5 11.6 3.3 50.1 Chi square
X2 10.526
a,
df 3
Science
(n=181)
2.8 39.1 6.9 1.1 49.9
P=0.015
Total
(N=363)
5.5 71.6 18.5 4.4 100
Table 13: Prevalence of overweight and/or obesity by course
Course undertaken Non overweight or
obese
Overweight % Statistical test
HSS (n= 182) 35.3 14.9
Chi square
X2 9.585
a, df 1
Science (n=181) 41.9 8.0
P=0.002
Total (N=363)
77.1 % 22.9%

41
4.6 ASSOCIATION OF NUTRITION KNOWLEDGE WITH NUTRITION STATUS
Using Spearman rank order correlation, results showed the association of nutrition knowledge
and nutrition status was negative and not significant at (r = -0.032, p = 0.549) as shown in
Figure 13. Those students with high nutrition knowledge were not necessarily having good
nutrition status.
Figure 13: Correlation of nutrition knowledge and status
4.7 ASSOCIATION BETWEEN NUTRITION KNOWLEDGE AND DIETARY
PRACTICES
Results of Spearman rank order correlation between knowledge and number of meals taken
was positive relationship but not significant (r = 0.36, p = 0.495). As shown in Table 14
using Fisher Exact test a significant association of knowledge and frequency of consumption
of various foods was observed (p<0.05). These foods included arrowroot/sweet potatoes
(p=0.036), Potato crisps (p= 0.028), Sausages (p=0.025) and Tea/milo/cocoa (p=0.039).

42
Table 14: Association between knowledge and frequency of foods consumption
N= 363 (%)
Type of food Everyday
1-2
times/week
3-6
times/week
Never
consumed
Statistical
test
Arrowroot/sweet
potatoes 1.1 39.1 8.3 51.5
Fisher Exact
P=0.040
Potato crisps 5.2 46.8 12.7 35.3
Fisher Exact
P= 0.028
Sausages 6.1 47.7 11.8 34.4
Fisher Exact
P= 0.025
Tea/milo/cocoa 12.9 49.0 27.3 10.7
Fisher Exact
P= 0.039
4.8 ASSOCIATION OF ATTITUDE AND NUTRITION STATUS
The results of Spearman‟s rank order correlation between attitude and nutrition status show a
positive relationship but not significant (r = 0.03, P= 0.566). Students with positive attitude
did not necessary have good nutrition status.
4.9 ATTITUDE AND DIETARY PRACTICES
Results of Spearman‟s rank order correlation between attitude and number of meals
consumed was negative and not significant (r= -0.018 P= 0.734) therefore no relationship
between attitude and the number of meals consumed. Using one way ANOVAs significant
differences in attitude was observed in frequency consumption of a number of foods. Results
in cereals showed significant difference in attitude for brown rice (P= 0.013). Results of the
mashed/baked potatoes shows a significant difference (P= 0.003) and post hoc (LSD) test
showed attitude difference between those who never consumed and [1-2 times a week (P=

43
0.016) and 3-6 times a week (P= 0.001)]. In meats there was a significant difference in
attitude for sausages (P=0.036) and post hoc test (LSD) showed a difference in attitude
between those who consumed everyday and [1-2 times (P= 0.009), 3-6 times (P= 0.005) and
those that never consumed (P= 0.009)]. Results further showed significant difference in
vegetable consumption (P=0.019) and post hoc (LSD) tests showed difference in attitude
between those that consumed everyday and 1-2 times a week (P= 0.007).

44
CHAPTER FIVE: DISCUSSION
5.1 INTRODUCTION
This chapter presents the discussion of the study findings of Nutrition knowledge, attitude,
and its association with dietary practices and nutrition status of the students‟ participants
from the three university colleges.
5.2 NUTRITION KNOWLEDGE
This study established that female students have average level of nutrition knowledge as
opposed to high level expected by virtue of being highly educated. This is consistent with
other studies that have shown students are slightly aware of nutrition issues (Barzegari et al,
2011; Sakamaki et al, 2005). In this study however, a significant difference was observed in
level of knowledge between the Humanities and Social Science and Science students. Science
students were more knowledgeable in nutrition than Social Science students and this confirms
previous studies that showed nutrition knowledge is related to field of study and found that
fields with nutrition as a subject had higher knowledge score (Azizi et al, 2010). Therefore
the difference could be attributed to the possibility that the Science students in this study are
more likely to have had exposure of nutrition information in course of their studies unlike the
Humanities and Social Science students.
Results of the nutrition knowledge in the area of macro-nutrients and micro-nutrients shows
majority of the students are more knowledgeable in the area of macronutrients compared to
knowledge in micronutrients. This can be attributed to previously great emphasis of
macronutrients deficiencies particularly in the developing countries as a result of constant
food insecurity challenges. Micro nutrient awareness having emerged recently could be still a

45
new area of interest to most students. Diet and disease knowledge is key in prevention of risk
factors associated with disease outcomes, enhances healthy food choices and optimal dietary
practices to help lessen the burden of early onset on chronic diseases. Diet plays an important
role throughout lifecycle in promoting good health and preventing lifestyle diseases which
have been significantly linked to poor dietary habits. The low knowledge in this area by
students could be attributed less attention given by the students due to their age in the view
that since they are in life phase when lifestyle diseases are less common and a possibility that
they also physically active since lifestyle diseases are common until later stages of life
(Whitney and Rolfes, 1999).
Students have a wide source of nutrition information. However, school continues to be an
avenue through which majority of students gain nutrition knowledge. This study confirms
that students‟ main source as school. Other sources preferred by students include internet,
magazines and television shows the power of media influence to young adults and the need
for them to assume a greater role in nutrition education. This could be attributed to a growing
demand for information technology that enables shared information easy to access away from
formal classroom set ups. However, school environment continue to be an important place of
broadening knowledge that may impact society health because students are viewed as
positive change agents. These results agree with a previous study that showed school
environment as the last and important avenue through which majority of students can be
impacted with nutritional knowledge and spirals up improvement in society‟s health
(Berzegari et al, 2011).
.

46
5.3 NUTRITION ATTITUDE
Some previous study has shown that students have average score in nutrition attitude
(Sakamaki et al, 2005). In this study majority of students have above average score showing
a positive attitude towards nutrition with a higher intensity. The results in this study do not
agree with this study. This could be attributed to increased nutrition awareness and upsurge
of nutrition information through modern communication and technology sources such as
internet and magazines which students are increasingly able to access. The results of this
study show that students have access to internet, magazines and television which may have
played a positive role in their attitude by nutrition information accessed. The other attribute
could be influence from society social expectation on the females due to their gender roles as
caretakers and therefore they are more concerned with food issues (Lin et al, 2011).
5.4 DIETARY PRACTICES
Regular eating practices and healthy food choices ensure female students meet their
nutritional requirements for growth and health maintenance particularly their needs for
reproduction roles. The average number of meals consumed daily by the students (2.5± 0.7)
is far below the required five to six times in a day including snacks (WHO, 2002). Results of
breakfast intake in this study agree with results of a previous study at Lebanon University
that reported majority of students consumed regular meals and majority of females (53.3%)
took breakfast daily. In this study majority of students‟ skipped lunch and snack meals
everyday but majority took breakfast and supper. This could be attributed to other factors
such as affordability of meals as a higher proportion of students eat from fast-food restaurants
and college cafeterias. Therefore cost of foods could have limited purchase of adequate meals
subjecting students‟ to irregular meal patterns resulting to preference for breakfast and supper
while skipping lunch or snacks meals.

47
The students‟ choice of snacks reflects those high in sugar, refined products and high in fats
compared to healthy snacks. This shift shows nutrition transition associated with poor dietary
practices linked to rising risks of overweight and obesity in developing countries (WHO,
2002). Students‟ attraction to these foods could be due to their palatability, convenience, ease
of availability and affordability in many food places where students consume their meals.
This agrees with a previous study in Lebanon that showed high consumption of fried foods
by university students (Yahia et al, 2008). As people are increasingly eating away from home
fast food restaurants are becoming an important source of meals for urban dwellers. Students
preference for fast food eateries could be attributed to students‟ preference for easy
convenient eating places due to time demand on their academic workload. Fast food eating
facilities present great avenues to offer high quality meals to students including affordable
healthy snacks.
Alcohol consumption by students can negatively interfere with their academic output but
their health as well since alcohol is known to alter metabolism of nutrients and to interfere
with action of nutrients in the body. Alcohol though rich in energy (7 kilocalories per gram) it
is empty in nutrients. Majority of the students may have avoided alcohol due to its negative
association of interfering with academics while proportion that consumed could be attributed
to factors like peer pressure influence.
Nutrition knowledge becomes important when it influences healthy choices and practices.
However, knowledge does not necessary translate to practice due to other factors such as
socio economic, cultural and food availability. Students contradicted themselves in nutrition
practices in food choices linked with healthy living yet majority consider nutrition in food

48
choices. This could also be attributed to students‟ preference for cheap and convenient foods
that are easily available regardless of their low benefit to wellness.
Rice and Ugali grade 1 are common foods in Kenyan most cultures and urban areas therefore
this could attributed to students choice as main staples frequently consumed. Refined grain
products have a longer shelf life than whole grain products and mostly preferred. However
whole products supply fiber and micronutrients necessary for body functions such bowel
movements and they are also regarded as low glycemic index foods which help to control
overweight and obesity. Majority of students frequently consumed proteins sources.
However, fish and sea products were the least consumed and this could be attributed to
cultural beliefs, factors of availability and affordability. There is also low daily intake of
fruits and vegetables by students despite their vital contribution in supply of vitamins and
minerals that are crucial for body functions. This study agrees with a previous study in
Lebanon University that reported low daily intake of fruits and vegetables by female students
(25.8% and31.5%). This could be attributed to their seasonality and cost.
5.5 NUTRITIONAL STATUS
According to 2008-09 KDHS, national BMI for group 20-29 years is 22.6 while proportion
with normal status is 67.0, overweight (17.8%) and obesity is 4.4%. The results in this study
are consistent with the results of the survey. The rate of overweight and obesity in developing
countries is increasingly emerging in urban areas due to changing lifestyle such as uptake of
diets high in sugar, fats and inactivity factors linked with risk factors associated with rising
chronic diseases globally (WHO, 2002). In this study, overweight and /or obese is
significantly more in Social Science students than Science based students and this could be
attributed to significant difference in nutrition knowledge between the disciplines. Higher

49
nutritional knowledge in Science could have influenced their food choices, snacking habits
and some dietary practices which may have impacted their nutrition status positively in view
of physical stature than HSS students.
5.6 ASSOCIATION OF NUTRITION KNOWLEDGE WITH DIETARY PRACTICES
The aim of promoting nutrition knowledge is to influence society‟s health through behavior
change by fostering positive food habits and practices among individuals. Even though
studies have indicated that level of education can influence dietary practices, higher
knowledge levels do not always lead to practices especially when individuals do not know
how to apply acquired knowledge. The correlation between knowledge and numbers of meals
consumed by students is not strong and significant in this study. The threshold of three meals
and snacks enables appropriate provision of nutrients needs when a variety of foods are
consumed yet this students‟ insufficiency could be an indicator of poor eating habits. This
observed practice gap could be attributed to inadequate knowledge on the importance of
meals distribution and portion size throughout the day. Students optimal practices may be
limited by others factors too such as socio economic, peer pressure and environmental factors
such as accessibility. Students‟ finances are likely to limit adequate purchase of foods and
therefore predisposing them to skipping some meals. There is therefore need to provide
subsidized meals to all students. Peer pressure within students is also likely to diminish
healthy practices guided by nutrition information due to students‟ desire in satisfying strong
sense of belonging among the peer and are likely to prioritize other material needs that define
high social class and acceptable lifestyle at the expense of food.
Knowledge on benefits of foods or lack of it is likely also to influence the frequency
consumption of various foods. In this study frequency of consumption of arrowroot/sweet

50
potatoes is less compared to potato crisps and sausages even though there is a significant
knowledge association in all. This could be attributed to low knowledge on food value linked
to traditional orphaned foods. The low frequency consumption of sausages and potato crisps
could be attributed to growing awareness that these foods are increasingly contributing to
unhealthy benefits such as overweight and food additives associated with lifestyle diseases
when frequently consumed. Hence this study partly confirms the hypothesis that there is no
association of students‟ nutritional knowledge and dietary practices as it relates to the number
of meals consumed but rejects the hypothesis as it relates to frequency consumption of
various foods by students since statistical significance was observed (p< 0.05) .
5.7 ASSOCIATION OF NUTRITION KNOWLEDGE WITH NUTRITION STATUS
Nutrition education strategies help to raise levels of knowledge aiming at preventing
unhealthy food related lifestyles as well as promoting society‟s health. Nutrition knowledge
indirectly contributes to nutrition status when good dietary practices are translated into
practice and sustained in life. Knowledge targets to influence dietary practices by promoting
actions that lead to healthy food intake and in discouraging negative practices likely to
negatively influence nutrition status. The results of association of nutrition knowledge and
nutrition status in this study show a negative relationship that was not significant. This could
be attributed to the fact that knowledge influences lifestyle behaviour which takes a process
to completely change into practices that directly influence nutrition status. Students being in
their active stage of life may not realize the need for nutrition knowledge to guide their eating
habits and to maintain health such as normal weight so as to prevent lifestyle diseases of
latter stages of life. Healthy food choices contribute towards healthy management of body
weight and in prevention of nutrient deficits that are likely to lead to poor health. The fact
that knowledge does not always transit to practices is confirmed in this study and this could

51
be attributed to factors influencing food consumption that are not adequately addressed. This
study therefore confirms the hypothesis that there is no association of students‟ nutritional
knowledge and nutritional status (p< 0.05).
5.8 ASSOCIATION OF NUTRITION ATTITUDE WITH DIETARY PRACTICES
AND NUTRITION STATUS NEXUS
As expected university students demonstrated positive attitude towards nutrition since they
are highly educated. However the relationship between nutrition attitude and the number of
meals consumed was not significant in this study. Students‟ positive attitude towards
nutrition did not translate into practice for the correct number of meals consumed. Positive
attitude reinforces behavior change when knowledge is practical. This gap in practice could
be attributed to other factors influencing the food consumed such as food affordability, social
factors and food availability. Students‟ economic status plays a key role in enabling students
purchase foods that are affordable to them regardless of the attitude they hold concerning
foods. Students are likely to prefer cheap and convenient foods. Social factors like cultural
influence on perceptions and may lead people to prefer what is familiar to them regardless of
knowledge and attitude they hold towards food. However a significant difference in attitude
was observed in frequency of consumption of various foods and this could be attributed to
other factors like cultural influence on food, knowledge on food benefits, peer influences on
food choice and food available to students at various eating places. For example low
consumption of whole grain rice could be attributed to low knowledge on its benefit and
preparation techniques. On other hand, lack of demand by students could be attributed to
students‟ perception on its palatability and therefore preference for white rice becomes steady
(Cox and Anderson, 2004). Therefore this study partly confirms the hypothesis that there is
no association of nutrition attitude and students dietary practices as it relates to number of

52
meals consumed but rejects the hypothesis as it relates to frequency of consumption on
variety of foods by students.
In this study, association of attitude and nutrition status was positive but not significant. This
could be attributed to the fact that attitude does not directly influence nutrition status but help
to promote healthy eating habits by influencing food choices. The fact that nutrition status is
a sum total of interlinked factors attitude indirectly contributes to nutrition status but
attributes such as quality and quantity of food directly influences nutrition status over a
period of time. Food choices therefore are presumed to promote healthy lifestyle and
consequently healthy status when positive nutrition attitude is based on long term healthy
benefits of good dietary practices. This study therefore confirms the hypothesis that there is
no association between nutrition attitude and nutrition status of female undergraduate
students.

53
CHAPTER SIX: CONCLUSIONS AND RECOMMENDATIONS
6.1 CONCLUSIONS
The study has shown that university female students within Nairobi Metropolis have average
level of nutritional knowledge and students in Science discipline are more aware of nutrition
issues than students in Humanities and Social sciences.
The university students have a positive attitude towards nutrition and there is no significant
difference between the disciplines of Science and humanities and Social Science. School and
access to mass media plays a key role in enhancing positive attitude towards nutrition
practices which can help promote society health and a food conscious society.
Most of the students have normal nutrition status and the prevalence for overweight and/or
obese is slightly more in Humanities and Social Science students than in Science students.
Dietary practices of the students are not optimal. Students‟ meal patterns are inadequate and
food choices characterized by highly refined cereal products, high sugar and fat products
compared to healthier food choices. Students contradicted themselves in practices despite
exhibiting average nutritional knowledge and positive attitude towards nutrition.
The study shows no relationship of students‟ knowledge and attitude with their nutrition
status. However there is significant association of knowledge and frequency consumption of
variety of foods. There is also significant difference in attitude and frequency consumption of
some foods.

54
6.2 RECOMMENDATIONS
Based on the results of this research there is need to enhance nutrition education among the
students. Universities curriculum may provide common undergraduate nutrition courses for
all students particularly disciplines where nutrition and health is not directly or indirectly
taught. There is also need for enhancing enabling environment where students can access and
exploit sources beyond the conventional classroom set up such as internet to enable them
benefit from wide range of authenticated nutritional information.
Eating premises within Universities should be guided by nutrition principles to ensure
provision of convenient, nutritious, varied, acceptable and affordable meals for students to
discourage reliance on unhealthy convenient fast foods that expose students to future health
risks that are preventable.
Peer based support strategy should be encouraged and even formalized within universities as
young adults do not seem to realize the long term benefits of healthy dietary practices
compared to long term effects of unhealthy food choices. Peer support provides potential for
strong linkages and motivation within students‟ networks. Science students who exhibited
higher knowledge than Social science students may help disseminate and influence positive
nutrition habits within peer networks.
Further studies can be conducted on students‟ strategic nutrients intake and factors
influencing their dietary practices be investigated since they exhibited average nutritional
knowledge and strong positive attitude towards nutrition but non optimal dietary practices.

55
REFERENCES
Azizi, M., Rahmani-Nia, F., Malae, M., Khosravi, N. (2010). A study of Nutrition
Knowledge and Attitude of Elite College Athlete in Iran. Brazilian Journal of
Biometricity 4: 105-112.
Barzegari, A., Ebrahimi, M., Azizi, M. and Banjbar, K. (2011). A study of Nutrition
Knowledge, attitude and food habits of college students. World Applied Sciences Journal
15: 1012-1017.
Bingham, S. (2007). Dietary Assessment. In: Jim, M. and Stewart, T. (Eds). Essentials of
Human Nutrition. 3rd
Edition: 416-421. Oxford University Press Inc. New York.
Boone, H. and Boone, D. (2012). Analyzing Likert Data. Journal of Extenstion. Vol 50
(2).
Contento, I. (2007). Nutrition Education: Linking Research, Theory and Practice. Jones
and Bartlett publishers. Boston, Toronto, London and Singapore
Cox, N. and Anderson, S. (2004). Food Choice. In: Michael, J., Barrie, M., John, M. and
Lenore, A. (Eds) Public Health Nutrition: 146-166. Black well publishing company
Oxford, United Kingdom.
Den Hartog, A., Stavereren W. and Brouwer, I. (2006). Food habits and consumption in
developing countries. Manual for field studies. Wageningen academic publishers,
Netherlands.
FAO. (2010). Globalization of food systems and Nutrition. Agriculture and Consumer
Department, Food and Agriculture Organization, Rome, Italy.
FAO/WHO (2003). Diet, Nutrition and the Prevention of Chronic Diseases: Report of a
joint FAO/WHO Expert Consultation. WHO Technical Report Series No. 916. Geneva.
Fischer, A., Laing J., Stoeckel, J. and Townsed, J. (1991). Handbook for Family Planning
Operations Research. 2nd
Edition. Population council, New York USA.
FNB, (2007). Nutrition Standards for Foods in School: Leading the Way Toward
Healthier Youth. Virginia, A. and Ann, L.(Eds).: 1-30. The National Academies Press.
Washngton D.C.
Gabra, M. (2001). IUNS in Twenty First Century on the Shoulders of the 20th
Century
Giant of Nutrition. In: Elmadfa, I., Anklam, E. and Konig, J. (Eds). Modern aspects of
nutrition: Present knowledge and future perspectives: 15. Kasger medical and scientific
publisher, Basel, Freiburg, paris, London, NewYork, Bangalore, Bangkok, Singapore,
Tokyo and Sidney.

56
Gail, C. (2008). Community Nutrition; Applying Epidemiology to Contemporary
Practice. 2nd
Edition. Jones and Bartlettt Publisher. Boston, Toronto, London and
Singapore.
Gates, G. and De Lucia, B. (1998). Influences of lifestyle patterns on diet. Journal
American Association of nutrition, 989: 82-87.
Gibson, R. (2005). Principles of Nutrition Assessment. 2nd
Edition. Oxford university
Press. London.
Goldenber, R. and Tamura, T. (1996). Pre - Pregnancy weight and pregnancy outcome,
Journal of the American Medical Association 275: 1127-1128.
KNBS and ICF Macro, (2010). Kenya Demographic and Health Survey 2008-09.
Calverton, Maryland.
Lin, W., Chi-Ming, H.,Hsiao, Y. and Ming-hui, H. (2011). 2005-2008 Nutrition and
Health Survey in Taiwan: The nutrition knowledge, attitude and behavior of 19-64 years
old adults. Asia Pacific Journal of Clinical Nutrition 20: 309-318.
Ministry of Medical Services (2010). Kenya National Clinical Nutrition and Dietetics
Manual. 1st edition. GoK
NAS, (1975). Nutrition and fertility interrelationships; Implications for policy and action.
National Academy of Sciences, Washington D.C.
Nazni, P. and Vimala, S. (2010). Nutrition knowledge, Attitude and practices of college
sportsmen. Asian Journal of Sports Medicine. Vol 1: 93-100.
O‟Dea, A. and Abraham, S. (2001). Knowledge, beliefs, attitudes, and behaviors related
to weight control, eating disorders, and body image in Australian trainee home economics
and physical education teachers. Journal Nutrition Education, 33: 332-340
Sakamaki, R., Toyama, K., Amamoto, R., Lio, C. and Shinjuku, N. (2005). Nutritional
knowledge, Food habits and health attitude of Chinese University students. Journal of
Nutrition 4(4): 1-5.
Schiff, W. (2009). Nutrition for Healthy Living. McGraw Hill. New York.
Scottish Office Department of Health, (1997). The Scottish Health Survey 1995.The
Stationery Office, Ediburgh.
Shepherd, R. (1999). Modelling Food Choice. Conference Proceedings of the Nutrition
Society, 58: 807–812. http://journals.cambridge.Org . Accessed on 15-05-2012.
Stice, E. and Shaw, H. (2002). Role of body dissatisfaction in the onset and maintenance
of eating pathology: a synthesis of research findings. Journal of Psychosomatic Research
53:985-993.

57
Swaminathan, M. (1986). Nutrition in the Third Millennium, Countries in transition. In:
Elmadfa, I., Anklam, E. and Konig, J. (Eds). Modern aspects of nutrition: Present
knowledge and future perspectives: 22-23. Kasger medical and scientific publisher, Basel,
Freiburg, paris, London, NewYork, Bangalore, Bangkok, Singapore, Tokyo and Sidney
Trustwell, S. (2007). Assessment of Nutritional Status and Biomarkers. In: Jim, M. and
Stewart, T. (Eds). Essentials of Human Nutrition. 3rd
Edition: 429-442. Oxford University
Press Inc. New York.
Vijayaraghavan,K. (2004).Iron-deficiency Anemias. In: Gibney M., Margetts, B.,
Kearney, J. and Arab, L. (Eds). Public Health Nutrition : 234. Black well publishing
company Oxford, United Kingdom.
Wangeri, T.,Kimani, E. and Mutweleli, S. (2012). Transitional challenges facing
University first year students in Kenya public universities: A case study of Kenyatta
University. Interdisciplinary Review of Economics and Management 2:1
Whitney, E. and Rolfes, S. (1999). Understanding Nutrition. 8th
Edition. Wardsworth
Publishing Company, New York.
WHO, (2000). Obesity: Preventing and Managing the Global Epidemic. Report on WHO
Consultation. Technical Report Series No.894 WHO, Geneva.
WHO, (2002). Reducing Risks, Promoting Healthy Life. World Health Organization
Report, Geneva.
Williams, S. (1986). Essentials of Nutrition and Diet therapy 4th
Edition. Times
mirror/Mosby college publishing. St Louis, Toronto and Santa Clara.
Worsley, A. (2002). Nutrition knowledge and food consumption: Can knowledge change
food behavior. Asia Pacific Journal of Clinical Nutrition 11: 579-585.
Yahia, N., Achkar, A., Abdallah, A. and Rrizk, S. (2008). Eating habits and obesity
among Lebanese university Students. Nutrition Journal 7: 32

58
ANNEXURES
Annexure 1: Consent form for the students
Hello, my name is Lucy kinyua a Masters student in Applied Human Nutrition at the
University of Nairobi. It is my pleasure to notify you that you have been identified to
participate in this study on “Influence of Nutritional Knowledge and Attitude on Dietary
practices of the female undergraduate students aged 19-25 years in Nairobi Central
District, Kenya”.
The study aims at investigating the association of nutritional knowledge, attitude with dietary
practices and nutritional status of the female undergraduate students. The results of the study
will inform design of the nutrition education intervention strategies targeting student‟s
particularly female students‟ due to their importance in reproductive and productive roles in
the society. Your responses will be treated as confidential and for research purposes only.
You are therefore requested to append your signature a as a sign of acceptance to participate
in the study.
Sign __________________________ Date _____________________________
THANK YOU

59
Annexure 2: Students questionnaire
STUDENTS QUESTIONNAIRE
Questionnaire No.
A. General Information (State the answer in the space provided)
Date ____________________ (day/Month/Year) University Name ____________________
Campus ________________ Year of Study 1___ 2___ 3___ 4___ 5___
Course undertaken_____________________________ Age _________
Is it: 1. Art based 2. Science based (Please circle one)
B. ANTHROPOMENTRY
MEASUREMENTS 1st 2
nd Average
Height (cm)
Weight (Kg)
BMI
C. NUTRITION KNOWLEDGE (tick one answer)
1. Which one is not a function of carbohydrates in our bodies?
a) Spare protein
b) To provide energy
c) Provide fibre
d) Conversion to fats
2. Which of the following foods are energy rich foods?
a) Bread, tea, sausage
b) Rice, beans, Ugali
c) Chapati, sphagetti, potatoes
d) porridge, peas, bread
3. Which type of foods listed below provides high protein?
a) Peas, avocado, liver
b) Chicken, green grams, sausage
c) Liver, eggs, milk, fish
d) Nuts, cabbage, beans, pawpaw
4. Which one of the following gives most calories/energy when a portion is consumed?
a) 1 teaspoonful Sugar
b) 1teaspoonful Fat
c) 1 teaspoonful Honey

60
5. Recommended good fats are mainly found in?
a) Dairy products
b) Vegetable oils
c) Both (a) and (b)
d) Not sure
6. Which fat type does the nutrition experts say should be reduced in consumption?
a) Polyunsaturated
b) Saturated fats
c) Monounsaturated
d) Cis fats
7. The hardened/solid fats contain more of the following fats?
a) Monosaturated
b) Polyunsaturated
c) Saturated
d) Not sure
8. A healthy woman should consume an average of how much water per day?
a) 2.0 litres
b) 1.0 litres
c) 1.5 liters
d) Not sure
9. Which of the following vitamins require fat to be absorbed by the body?
a) Vitamin A, B6, E
b) Vitamin D, C, K
c) Vitamin A, B12 , K
d) vitamin A, D, E, K
10. The following vitamins act as antioxidants?
a) Vitamin B, C
b) Vitamin A, C, E
c) Vitamin C, B, A
d) Not sure
11. To prevent anaemia one should consume the following mineral and vitamin?
a) Calcium and Vit B2
b) Iron and Vit C
c) Boron and Vit C
d) Iron and B1
12. What disease or health problem do you think are related to a low intake of fiber?
………………………………………………………………..
13. Which mineral and vitamin is good for bone development.
a) Calcium and Vit E
b) Selenium and Vit. D
c) Calcium and Vit. D
d) Iron and Vit B

61
Questionnaire no.
14. Which of the following diseases/ conditions is not related to excess intake of sugar
and fats?
a) Obesity, Cancer
b) Diabetes, High blood pressure
c) Osteoporosis ,gout
d) Atherosclerosis, Hyperlipidemia
15. When should the fruits be consumed?
a) Before a meal
b) Anytime
c) After a meal
16. What is the source(s) of nutrition information you have gained so far?
D. NUTRITION ATTITUDE
Please indicate how much you agree or disagree with each of the following statements.
(Please Tick one answer)
Statement Strongly
Agree
Agree Disagree Strongly
Disagree
1 Female students should
consume three main meals and
one snacks in a day to maintain
good healthy state.
2 A fat woman is healthier than a
slim woman
3 Brown Sugar is a healthy
alternative to white sugar.
4 Fermented products are more
beneficial than unfermented
products.
5 Traditional vegetables are tasteless and difficult to cook.
6 Women of reproductive age
should take folate supplement 1-3 months prior to
conception to avoid neural tube
defects to the baby.
7 Oil/Fat intake is necessary for
the body to absorb Vitamin A
in foods
8 It is not easy to achieve a balanced diet as students in
Nairobi.

62
Statement Strongly
Agree
Agree Disagree Strongly
Disagree
9 Maintaining good nutrition
status as a student will have
good outcome in motherhood.
10 Fast foods are convenient healthy foods good for female
students.
11 Whole meal products are healthier alternative to refined
products.
12 As we grow older we should eat
less of protein, carbohydrates and fats while eat more of fruits
and vegetables
13 Slicing green vegetables before
washing does not wash away useful nutrients.
14 Boiling and steaming are better
cooking methods than roasting and deep frying.
15 It is healthier to take a glass of
milk than a glass of soft drink.
E. DIETARY PRACTICES
1. Where do you take your meals while in college?
2. How many main meals do you take in a day? ______________
3. How often do you consume the following meals in a week? (circle one for each
meal)
Breakfast Lunch Supper Snacks
1.Everyday 1.Everyday 1.Everyday 1.Everyday
2.Sometimes 2.Sometimes 2.Sometimes 2.Sometimes
3. None 3. None 3. None 3. None
4. Which snacks do you consume if any snacks?
5. Do you take alcoholic beverages? ( circle one) 1. Yes 2. No
If Yes how often? 1. Everyday 2. Once/ week 3. Once/month 4.Other specify

63
6. Do you think you apply the concept of balanced diet when choosing and preparing
your foods? 1. Yes 2. No
7. Please indicate the number of times in a week that you take the following foods
Foods Type Frequency per week
Everyday 1-2
times
week
3-6
times a
week
Never
consumed
1.Cereals based foods
White rice
Brown rice
Ugali (grade 1 flour)
Chapati (white)
Chapati ( brown)
Breakfast cereals
White bread
Whole bread
Cakes
Biscuits
2.Roots and Tubers
Cassava/yams
Arrowroot/sweetpotatoes
Potato chips
Potato crisps
Mashed/baked potatoes
3.Milk and milk
products
Fresh milk
yoghurt
Ice cream
4.Meat, poultry&
product
Eggs
Fish and sea food
Meats, pork,goat,lamb,
chicken
sausages
Burgers
5.Legumes and nuts
e,g Beans, groundnuts,
legumes, lentils, peas
6.Fruits e.g
mangoes,avocado,pawpaw
7.Vegetables e.g
Kales.spinach,Cabbage

64
Everyday 1-2
times
week
3-6
times a
week
Never
consumed
8. Sweets
Sugar / honey
Candies (sweets)
Chocolates
9.Beverage
Fruit squash
Fresh juice
Tea/milo/cocoa
Sodas
Thank you for your response

65
Annexure 3: Research assistants training schedule
RESEARCH ASSISTANTS TRAINING SCHEDULE
Time Topic Learning aids Learning methods
8.30 am-10.30am Nature of study and its
objectives
Handouts Lecture
BREAK
11.00am-1.00pm Data collection
Review of questionnaire
Sample questionnaire
Measuring instruments
Demonstration
Role play
LUNCH
2.00pm- 5.00pm Code of conduct during data
collection period.
Work schedule
Work Schedule Lecture

66
Annexure 4: Nutrition knowledge marking scheme
Questions Maximum marks for correct response
1 Which one is not a function of carbohydrates in our bodies?
d) Conversion to fats
1
2 Which of the following foods are energy rich foods? c) Chapati, sphagetti, potatoes
1
3 Which type of foods listed below provides high protein? c) Liver, eggs, milk, fish
1
4 Which one of the following gives most calories/energy when a portion is
consumed? b) 1teaspoonful Fat
1
5 Recommended good fats are mainly found in?
b) Vegetable oils
1
6 Which fat type does the nutrition experts say should be reduced in consumption?
b) Saturated fats
1
7 The hardened/solid fats contain more of the following fats?
a) Trans fats
1
8 A healthy adult woman should consume an average of how much water per day?
a) 2.0 litres
1
9 Which of the following vitamins require fat to be absorbed by the body?
d) vitamin A, D, E, K
1
10 The following vitamins act as antioxidants?
b)Vitamin A, C, E
1
11 To prevent anemia one should consume the following mineral and vitamin? a) Iron and Vit C
1
12 What disease or health problem do you think are related to a low intake of fiber? Constipation, piles, colon cancers, diverticulars
1
13 Which mineral and vitamin is good for bone development.
a) Calcium and Vit. D
1
14 Which of the following diseases/ conditions is not related to excess intake of sugar
and fats? c) Osteoporosis, gout
1
15 When should the fruits be consumed? b) Anytime
1
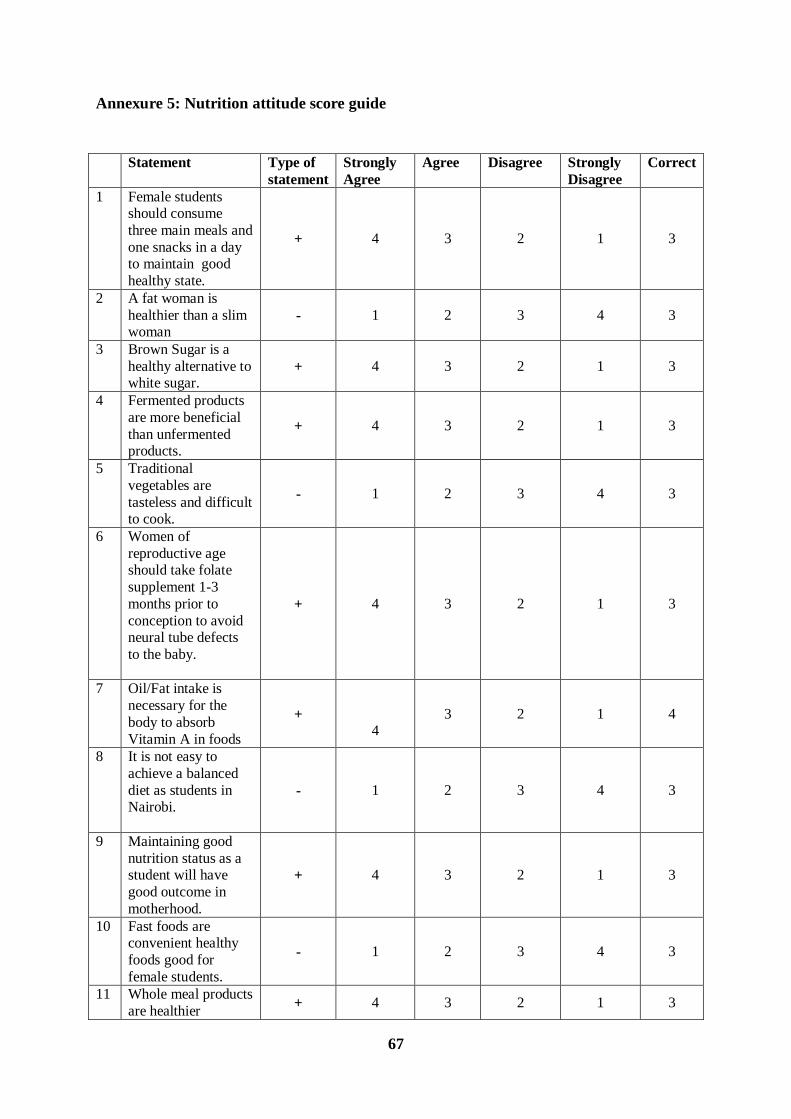
67
Annexure 5: Nutrition attitude score guide
Statement Type of
statement
Strongly
Agree
Agree Disagree Strongly
Disagree
Correct
1 Female students should consume
three main meals and
one snacks in a day to maintain good
healthy state.
+ 4 3 2 1 3
2 A fat woman is
healthier than a slim woman
- 1 2 3 4 3
3 Brown Sugar is a
healthy alternative to white sugar.
+ 4 3 2 1 3
4 Fermented products
are more beneficial
than unfermented products.
+ 4 3 2 1 3
5 Traditional
vegetables are
tasteless and difficult to cook.
- 1 2 3 4 3
6 Women of
reproductive age should take folate
supplement 1-3
months prior to
conception to avoid neural tube defects
to the baby.
+ 4 3 2 1 3
7 Oil/Fat intake is
necessary for the
body to absorb
Vitamin A in foods
+
4
3 2 1 4
8 It is not easy to
achieve a balanced
diet as students in Nairobi.
- 1 2 3 4 3
9 Maintaining good
nutrition status as a student will have
good outcome in
motherhood.
+ 4 3 2 1 3
10 Fast foods are convenient healthy
foods good for
female students.
- 1 2 3 4 3
11 Whole meal products
are healthier + 4 3 2 1 3

68
alternative to refined
products.
12 As we grow older we should eat less of
protein,
carbohydrates and fats while eat more
of fruits and
vegetables
+ 4 3 2 1 3
13 Slicing green vegetables before
washing does not
wash away useful nutrients.
- 1 2 3 4 4
14 Boiling and steaming
are better cooking
methods than roasting and deep
frying.
+ 4 3 2 1 3
15 It is healthier to take a glass of milk than a
glass of soft drink. + 4 3 2 1 3
Total 47

69
Annexure 6: Letter seeking authorization from universities
Ms. Lucy W. Kinyua
P. O. Box 12880 - 00400
Nairobi.
______________________
______________________
______________________
REF: AUTHORITY TO COLLECT RESEARCH DATA
I am a student pursuing a Master of Science degree in Applied Human Nutrition at the
Department of Food Science, Nutrition and Technology Kabete Campus of the Falculty of
Agriculture University of Nairobi.
I will be conducting a research on “Influence of Nutrition Knowledge and Attitude on
Dietary Practices and Nutritional Status of Female University Students aged 19-25 Years
in Nairobi Central Business District, Kenya” During sampling ______________University
was purposively chosen for data collection. The study targets female students using self
administered questionnaires on selected female students between July and August 2012.
The purpose of this letter is to request your authority to administer questionnaires to students.
Please find attached copies of the introductory letters from my supervisor and the head of
Applied Nutrition Programme.
Yours Faithfully,
Lucy W. Kinyua

70
Annexure 7: Letter of authorization University of Nairobi

71
Annexure 8: Letter of authorization Kenya Methodist Universities

72
Annexure 9: Letter of authorization Kenya Polytechnic University College