association of kidney function with coronary
TRANSCRIPT
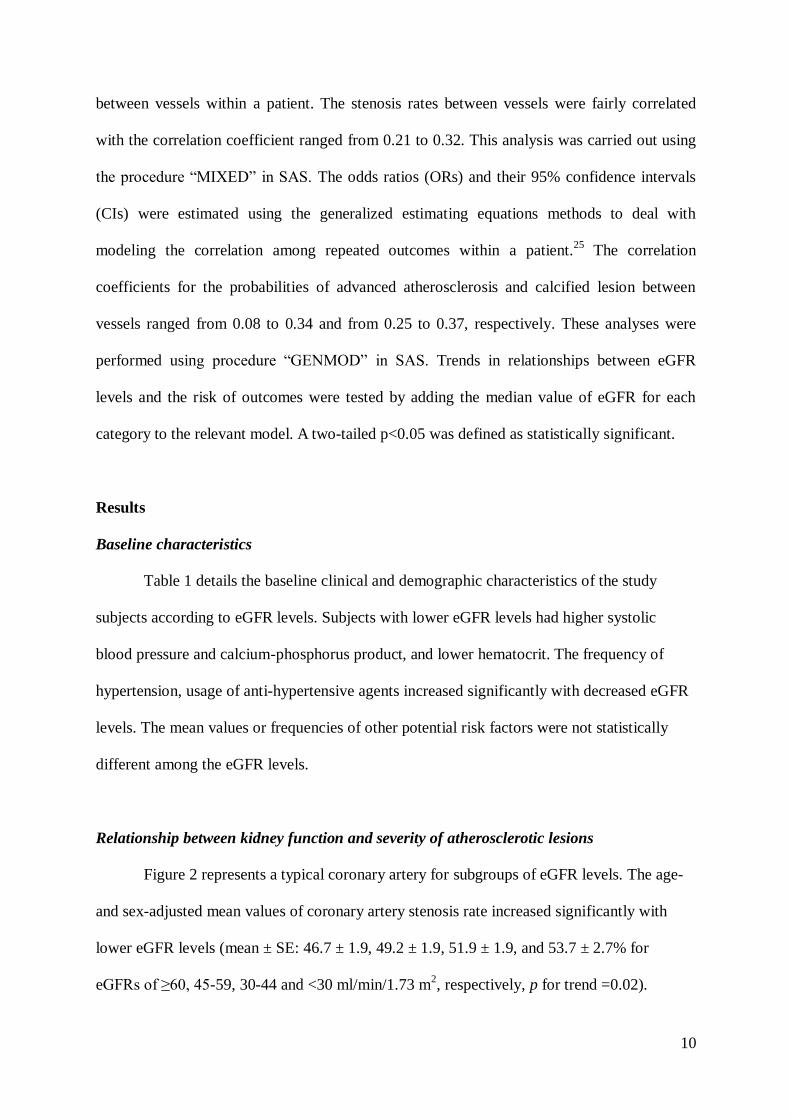
九州大学学術情報リポジトリKyushu University Institutional Repository
Association of Kidney Function With CoronaryAtherosclerosis and Calcification in AutopsySamples From Japanese Elders : The HisayamaStudy
Nakano, ToshiakiPathophysiological and Experimental Pathology, Department of Pathology, Graduate School ofMedical Sciences, Kyushu University | Department of Medicine and Clinical Science, GraduateSchool of Medical Sciences, Kyushu University
Ninomiya, ToshiharuDepartment of Environmental Medicine, Graduate School of Medical Sciences, Kyushu University
Sumiyoshi, ShinjiPathophysiological and Experimental Pathology, Department of Pathology, Graduate School ofMedical Sciences, Kyushu University
Fujii, HiroshiPathophysiological and Experimental Pathology, Department of Pathology, Graduate School ofMedical Sciences, Kyushu University
他
http://hdl.handle.net/2324/26613
出版情報:American Journal of Kidney Diseases. 55 (1), pp.21-30, 2010-01-01. National KidneyFoundationバージョン:権利関係:(C) 2009 National Kidney Foundation, Inc. Published by Elsevier Inc.
1
Association of kidney function with coronary atherosclerosis and calcification in
autopsy samples from Japanese elders: the Hisayama Study
Toshiaki Nakano, MD, PhD1,3
, Toshiharu Ninomiya, MD, PhD2, Shinji Sumiyoshi, MD,
PhD1, Hiroshi Fujii, MT
1, Yasufumi Doi, MD, PhD
2, Hideki Hirakata, MD, PhD
4, Kazuhiko
Tsuruya, MD, PhD3, Mitsuo Iida, MD, PhD
3, Yutaka Kiyohara, MD,PhD
2, Katsuo Sueishi,
MD, PhD1
1Pathophysiological and Experimental Pathology, Department of Pathology,
2Department of
Environmental Medicine and 3Department of Medicine and Clinical Science, Graduate
School of Medical Sciences, Kyushu University, Fukuoka, Japan.
4First Department of Internal Medicine, Fukuoka Red Cross Hospital, Fukuoka, Japan.
Running title: kidney function and coronary atherosclerosis
Contents:Abstract: 289 words
Text body: 2744 words (excluding title page, abstract, references, acknowledgements, tables
and figures legends)
4 figures (including 2 color figures) and 3 tables
Reprint requests and correspondence to:
Toshiaki Nakano, M.D., Ph. D.
Department of Medicine and Clinical Science,
Graduate School of Medical Sciences, Kyushu University, Fukuoka, Japan.
3-1-1 Maidashi, Higashi-ku, Fukuoka 812-8582, JAPAN

2
Phone: +81-92-642-5843 Fax: +81-92-642-5846
E-mail address: [email protected]
Authors' contributions
Toshiaki Nakano contributed to the funding, planning, sampling, writing and discussion.
Toshiharu Ninomiya contributed to the planning, analysis, writing and discussion. Shinji
Sumiyoshi, Hiroshi Fuji and Yasufumi Doi contributed to the sampling and discussion.
Hideki Hirakata, Kazuhiko Tsuruya and Mitsuo Iida contributed to the writing and discussion.
Yutaka Kiyohara and Katsuo Sueishi contributed to the funding, writing and discussion. All
authors have seen and approved the final version.
Support and financial disclosure declaration
This work was supported in part by a Grant-in-Aid (T. Nakano, Y. Kiyohara and K. Sueishi)
from the Japanese Ministry of Education, Culture, Sports, Science, and Technology, a
Grant-in-Aid for Scientific Research C (T.N., No. 20590342), A (Y.K., No. 18209024) and A
(K.S., No. 19209012), a grant from the Special Coordination Fund for Promoting Science and
a grant from the Technology and Innovative Development Project in Life Sciences from the
Ministry of Education, Culture, Sports, Science and Technology of Japan.
Financial Disclosure: None.

3
Abstract
Background: Chronic kidney disease (CKD) is associated with increased risk of coronary
heart disease. However, information regarding the histopathology of coronary atherosclerosis
in individuals with CKD remains scarce. This study investigated the relationship between
CKD and the severity of coronary atherosclerosis in population-based autopsy samples.
Study Design: Cross-sectional study.
Setting & Participants: 126 subjects randomly selected from 844 consecutive
population-based autopsy samples.
Predictor: Estimated glomerular filtration rate (eGFR), which was estimated using the
simplified prediction equation derived from the Modification of Diet in Renal Disease
(MDRD) Study.
Outcomes: The severity of atherosclerosis in three main coronary arteries, including
atherosclerotic lesions types defined by American Heart Association (AHA) classification,
stenosis rates and coronary calcified lesions.
Measurements: The relationship between CKD and the severity of coronary atherosclerosis
were evaluated by using the generalized estimating equations methods.
Results: The frequencies of advanced atherosclerotic lesions increased gradually as eGFR
decreased (33.6, 41.7, 52.3, and 52.8% for eGFRs of ≥60, 45-59, 30-44 and <30 ml/min/1.73
m2, respectively, p for trend =0.006). This relationship remained substantially unchanged
even after adjustment for potential confounding factors (odds ratio, 1.40 [95% confidential
interval, 0.76-2.55], 2.02 [0.99-4.15], and 3.02 [1.22-7.49] for eGFRs of 45-59, 30-44 and
<30 ml/min/1.73 m2, respectively). The frequencies of calcified lesions of coronary arteries
also increased gradually with lower eGFR levels (p for trend =0.02). Hypertension and
diabetes was associated with the increased risk of advanced coronary atherosclerosis and
calcification of coronary arteries in individual with reduced eGFR.

4
Limitations: Cross-sectional study, absence of data on proteinuria and the extremely high
proportion of aged people.
Conclusions: The autopsy findings presented here suggest that CKD is associated
significantly with the severity of coronary atherosclerosis. Patients with CKD should be
considered a high-risk population for advanced coronary atherosclerosis.
Key words- Chronic kidney disease, coronary atherosclerosis, population risk, coronary
artery stenosis, glomerular filtration rate, coronary disease.
Abbreviations:
AHA: American Heart Association
CKD: Chronic kidney disease
EEL: external elastic lamina
eGFR: estimated glomerular filtration rate
IEL: internal elastic lamina
MDRD: the Modification of Diet in Renal Disease

5
Introduction
Chronic kidney disease (CKD) is a significant public health problem, affecting
10-15% of the adult general population in developed countries.1-3
CKD is associated with an
increased risk of cardiovascular disease and death.4-7
A higher incidence rate of myocardial
infarction and excessive cardiac mortality has repeatedly been documented in patients with
CKD.6-10
Cardiac failure is more common in patients with advanced CKD, showing a
prevalence of approximately 40%.11
Several autopsy-based studies revealed a higher prevalence of arteriosclerotic lesions
in individuals with CKD than in those without it.12-14
Furthermore, patients with end-stage
renal disease showed more advanced atherosclerotic lesions with calcification in coronary
arteries than the general population.14
However, these studies were conducted in
hospital-based populations which are prone to underlying disease. Additionally, there are few
studies investigating the histopathological findings of coronary artery in individuals with
moderate stage of CKD.
The Hisayama study is a prospective population-based study of cardiovascular disease
risk factors in Japanese people,15
and is characterized by autopsy verification of the cause of
death in approximately 80% of deceased people.16, 17
The current study assessed the
relationship between reduced kidney function and the severity of coronary atherosclerosis in
the population-based autopsy samples.

6
Methods
Study population
The Hisayama Study was established in 1961 in the town of Hisayama, a suburban
community adjacent to Fukuoka City in a metropolitan area of Kyushu Island in southern
Japan. The population of Hisayama is approximately 7,000 and has been stable for 40 years.
Full community surveys of residents have been repeated since 1961.18
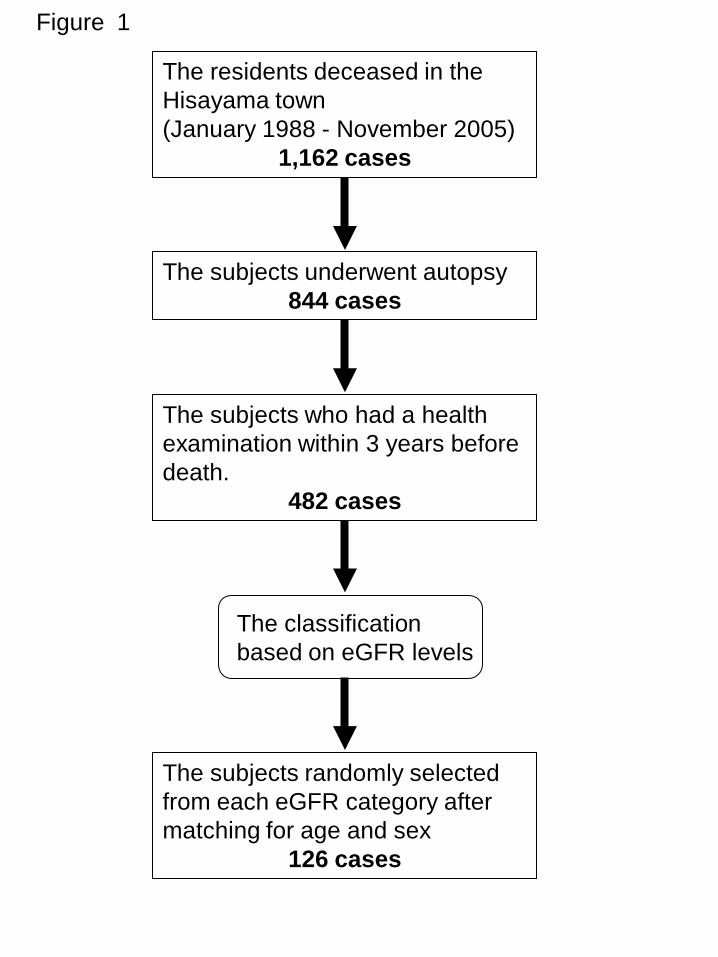
From January 1988 to
November 2005, a total of 1,162 residents of Hisayama died; of these, 844 underwent
autopsy examination. Subjects without health examination data within 3 years before death
were excluded. The remaining 482 subjects were classified into four categories based on
estimated glomerular filtration rate (eGFR): ≥ 60, 45-59, 30-44, and <30 ml/min/1.73 m2
(data from the most recent health examination). Eighteen subjects had a eGFR <30
ml/min/1.73 m2. The subjects included in this study were randomly selected using
computer-generated random number from each category of eGFR level after matching for age
at death and sex at a 1:2 ratio against subjects in the <30 ml/min/1.73 m2 category. A final
total of 126 subjects (49 men and 77 women) were enrolled in this study (figure 1). The
median period from the last health examination to death was 1.0 years (interquartlie range
[IQR] 0.0-2.0).
Risk factors
At each health examination, study participants undertook a self-administered
questionnaire covering medical history, antihypertensive treatment, smoking habits, and
alcohol intake. The completed questionnaire was checked by trained interviewers. Blood
pressures were measured three times using a standard mercury sphygmomanometer at each
examination, with mean values used for the analysis. Hypertension was defined as a systolic

7
blood pressure ≥140 mmHg and/or diastolic blood pressure ≥90 mmHg or by the use of
antihypertensive agents. Blood samples were collected after overnight fasting. Serum
creatinine concentrations were measured using the Jaffé method. Hemoglobin A1c levels
were measured by high-performance liquid chromatography (HPLC). Diabetes mellitus was
diagnosed by a hemoglobin A1c ≥6.0%. Total cholesterol, high-density lipoprotein (HDL)
cholesterol, and triglycerides were determined enzymatically. Dyslipidemia was defined by a
total cholesterol concentration ≥220 mg/dL, HDL cholesterol ≤40 mg/dL or triglycerides
≥150 mg/dL (Total cholesterol, HDL cholesterol and triglycerides in mg/dL may be converted
to mmol/L by multiplying by 0.02586, 0.02586 and 0.01129, respectively).
Definition of chronic kidney disease
eGFR was estimated using the simplified prediction equation derived from the
6-variable Modification of Diet in Renal Disease (MDRD) Study19
and given by the
following equation:
eGFR (ml/min/1.73 m2) = 170 × [serum creatinine (mg/dl)]
-0.999
× [age (years)]-0.176
× [serum urea nitrogen (mg/dl)]-0.170
× [serum albumin (g/dl)]0.318
× [0.762 if female]
eGFR levels were classified into four categories: ≥60, 45-59, 30-44, and <30 ml/min/1.73 m2,
according to the National Kidney Foundation Kidney Disease Outcomes Quality Initiative
guidelines.20
For the sensitivity analyses, eGFR was also estimated using 4-variable MDRD equation
modified with the Japanese Society of Nephrology-Chronic Kidney Disease Initiatives
coefficient (JSN-CKDI equation) as below:21
JSN-eGFR (ml/min/1.73m2) = 0.808 x 175
8
x [serum creatinine (enzymatic method [mg/dL])] -1.154
x [age (years)] -0.203
x [0.742 if female],
where the value of serum creatinine measured by Jaffe methods was converted to the values
for the enzymatic method by subtracting 0.207 mg/dl.22
:
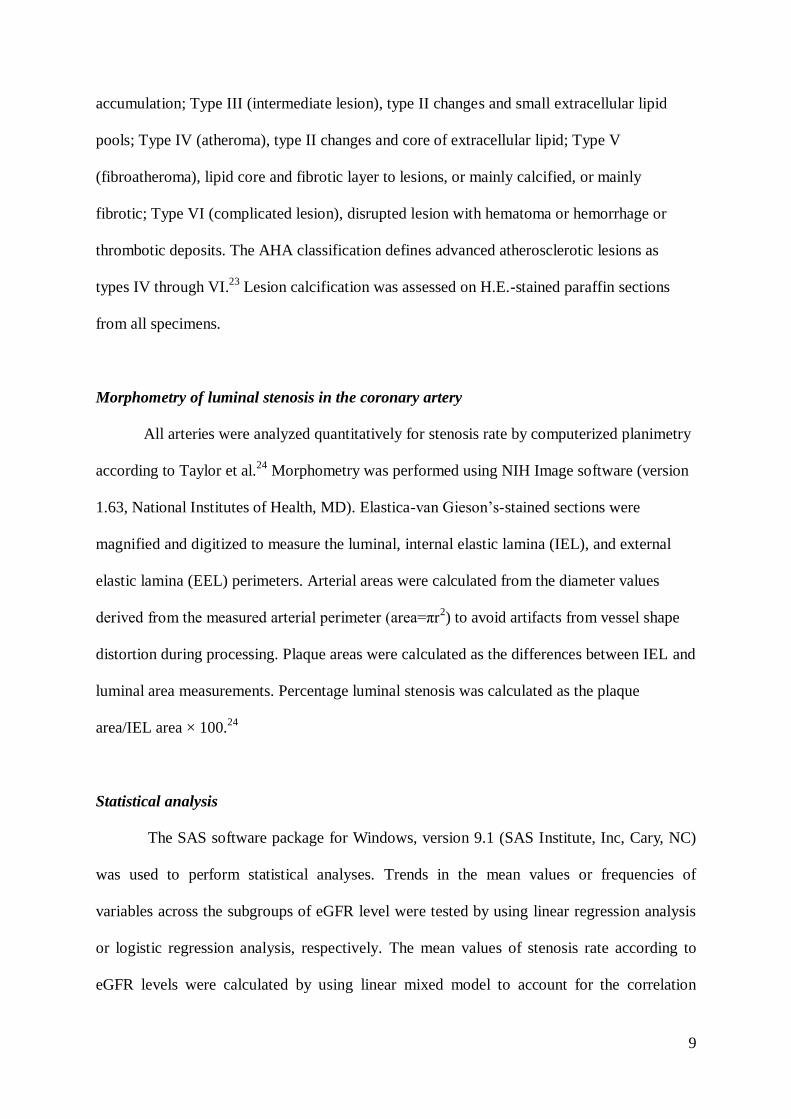
Coronary artery morphology
Heart tissue obtained at autopsy was immersed in 10% buffered formaldehyde for at
least 24 hours, making sure to include the three main coronary arteries. The right coronary
artery (segment 1), left anterior descending coronary artery (segment 6), and left circumflex
coronary artery (segment 11) were dissected free from the surface of the heart, cut
perpendicular to the long axis at 3-mm intervals, and then embedded in paraffin. The segment
of the vessel showing the most severe stenosis was selected for histological examination,
excluding areas near the branching site. We excluded 3 blocks missing to define the segments
of coronary arteries. Finally, 375 blocks were obtained and all the blocks for each subject cut
into 3-µm-thick serial sections in one sequence (1 block provided insufficient sample to
estimate the extent of arterial stenosis). Sections from each block were serially subjected to
hematoxylin and eosin (H.E.), elastica-van Gieson’s, and Masson’s trichrome stainings. The
histological examinations were made without reference to the associated clinical information
by two independent pathologists (T. Nakano and S. Sumiyoshi) (blinded assessments).
Estimation of atherosclerotic lesions
Atherosclerotic lesions found in each section were classified into six types in
accordance with the definitions proposed by the Committee on Vascular Lesions of the
Council on Atherosclerosis, AHA23
: Type I (initial lesion), intimal thickening with isolated
foam cells; Type II (fatty-streak lesion), intimal thickening with intracellular lipid
9
accumulation; Type III (intermediate lesion), type II changes and small extracellular lipid
pools; Type IV (atheroma), type II changes and core of extracellular lipid; Type V
(fibroatheroma), lipid core and fibrotic layer to lesions, or mainly calcified, or mainly
fibrotic; Type VI (complicated lesion), disrupted lesion with hematoma or hemorrhage or
thrombotic deposits. The AHA classification defines advanced atherosclerotic lesions as
types IV through VI.23
Lesion calcification was assessed on H.E.-stained paraffin sections
from all specimens.
Morphometry of luminal stenosis in the coronary artery
All arteries were analyzed quantitatively for stenosis rate by computerized planimetry
according to Taylor et al.24
Morphometry was performed using NIH Image software (version
1.63, National Institutes of Health, MD). Elastica-van Gieson’s-stained sections were
magnified and digitized to measure the luminal, internal elastic lamina (IEL), and external
elastic lamina (EEL) perimeters. Arterial areas were calculated from the diameter values
derived from the measured arterial perimeter (area=πr2) to avoid artifacts from vessel shape
distortion during processing. Plaque areas were calculated as the differences between IEL and
luminal area measurements. Percentage luminal stenosis was calculated as the plaque
area/IEL area × 100.24
Statistical analysis
The SAS software package for Windows, version 9.1 (SAS Institute, Inc, Cary, NC)
was used to perform statistical analyses. Trends in the mean values or frequencies of
variables across the subgroups of eGFR level were tested by using linear regression analysis
or logistic regression analysis, respectively. The mean values of stenosis rate according to
eGFR levels were calculated by using linear mixed model to account for the correlation
10
between vessels within a patient. The stenosis rates between vessels were fairly correlated
with the correlation coefficient ranged from 0.21 to 0.32. This analysis was carried out using
the procedure “MIXED” in SAS. The odds ratios (ORs) and their 95% confidence intervals
(CIs) were estimated using the generalized estimating equations methods to deal with
modeling the correlation among repeated outcomes within a patient.25
The correlation
coefficients for the probabilities of advanced atherosclerosis and calcified lesion between
vessels ranged from 0.08 to 0.34 and from 0.25 to 0.37, respectively. These analyses were
performed using procedure “GENMOD” in SAS. Trends in relationships between eGFR
levels and the risk of outcomes were tested by adding the median value of eGFR for each
category to the relevant model. A two-tailed p<0.05 was defined as statistically significant.
Results
Baseline characteristics
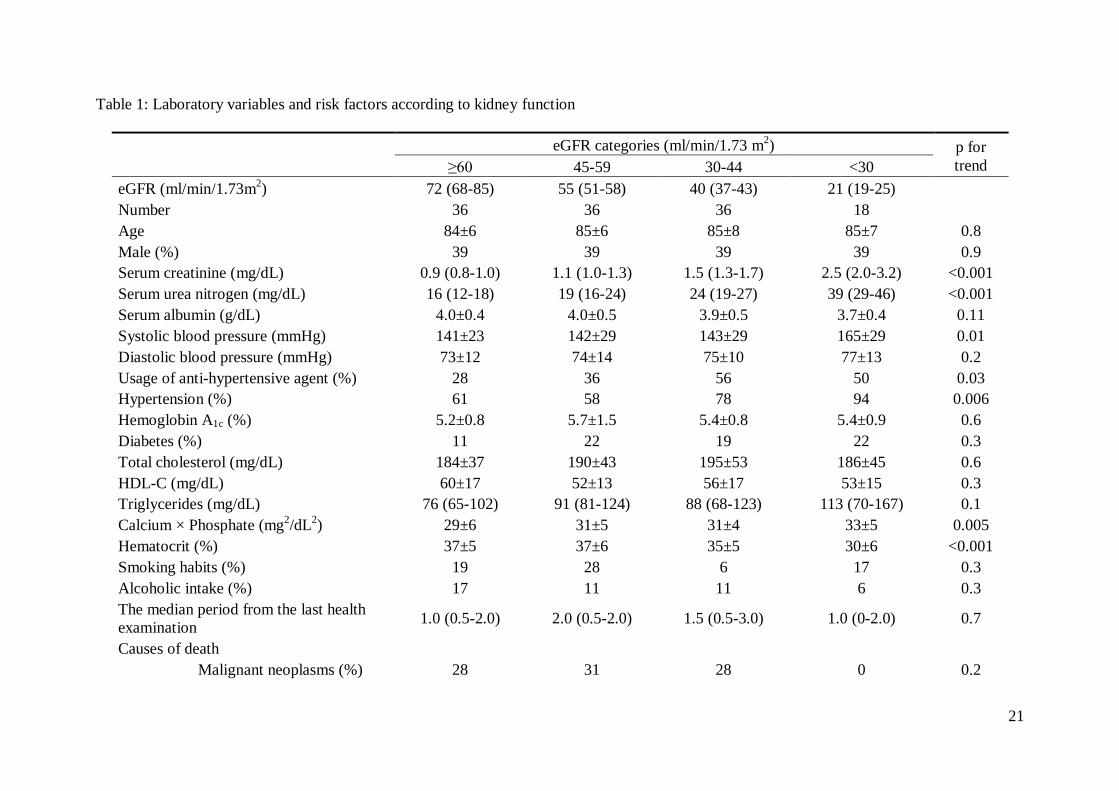
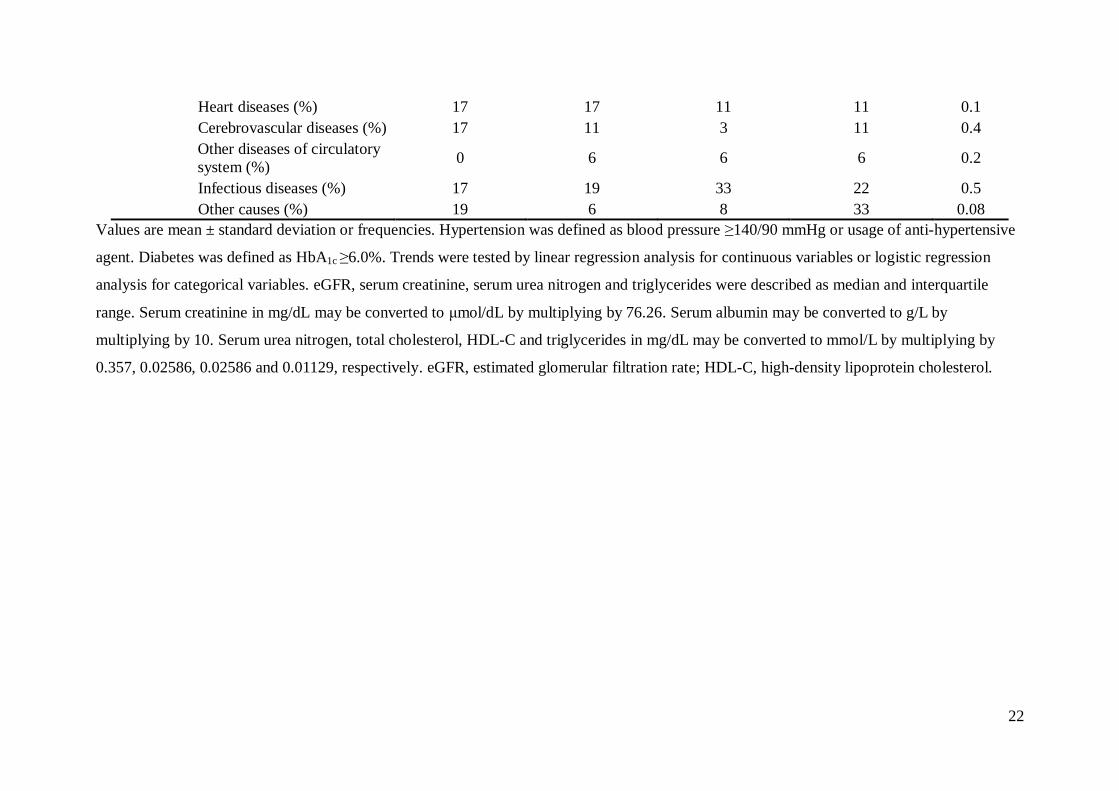
Table 1 details the baseline clinical and demographic characteristics of the study
subjects according to eGFR levels. Subjects with lower eGFR levels had higher systolic
blood pressure and calcium-phosphorus product, and lower hematocrit. The frequency of
hypertension, usage of anti-hypertensive agents increased significantly with decreased eGFR
levels. The mean values or frequencies of other potential risk factors were not statistically
different among the eGFR levels.
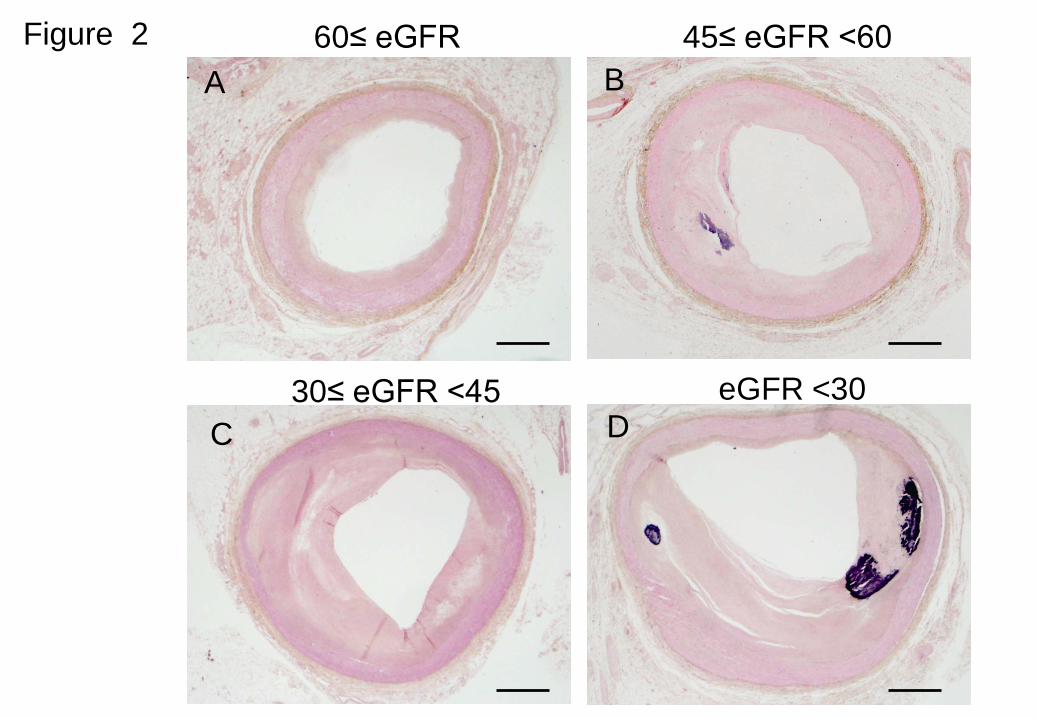
Relationship between kidney function and severity of atherosclerotic lesions
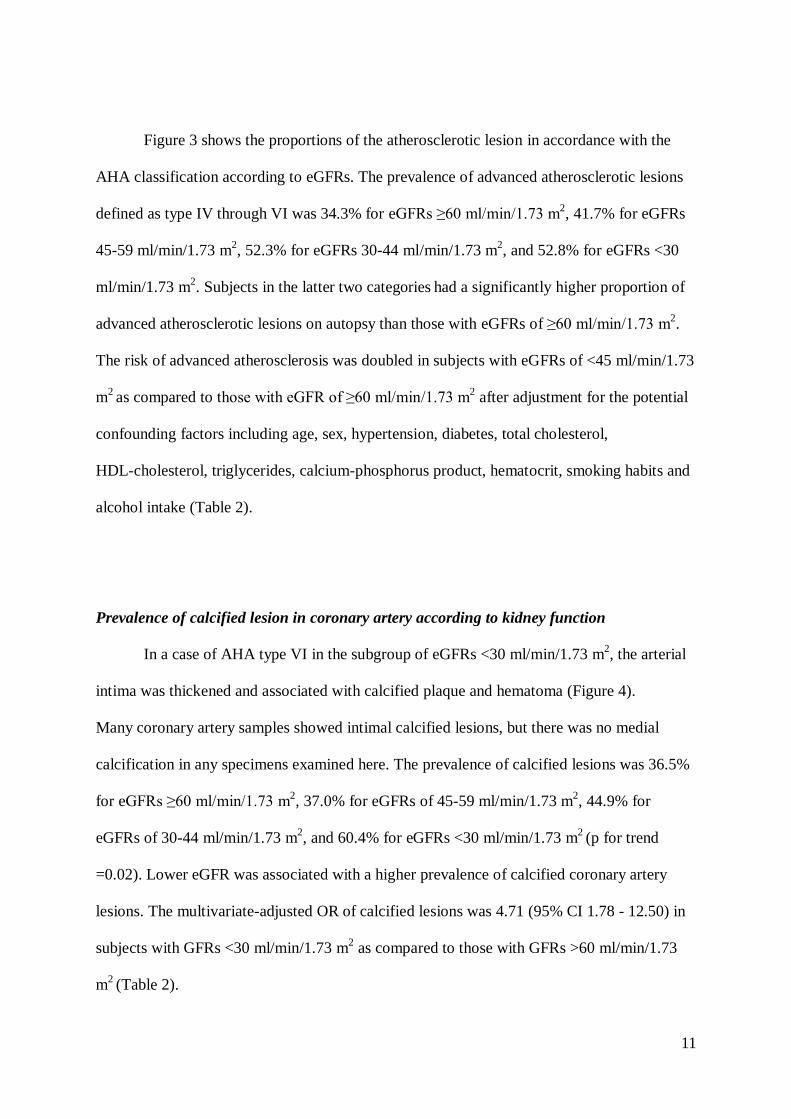
Figure 2 represents a typical coronary artery for subgroups of eGFR levels. The age-
and sex-adjusted mean values of coronary artery stenosis rate increased significantly with
lower eGFR levels (mean ± SE: 46.7 ± 1.9, 49.2 ± 1.9, 51.9 ± 1.9, and 53.7 ± 2.7% for
eGFRs of ≥60, 45-59, 30-44 and <30 ml/min/1.73 m2, respectively, p for trend =0.02).
11
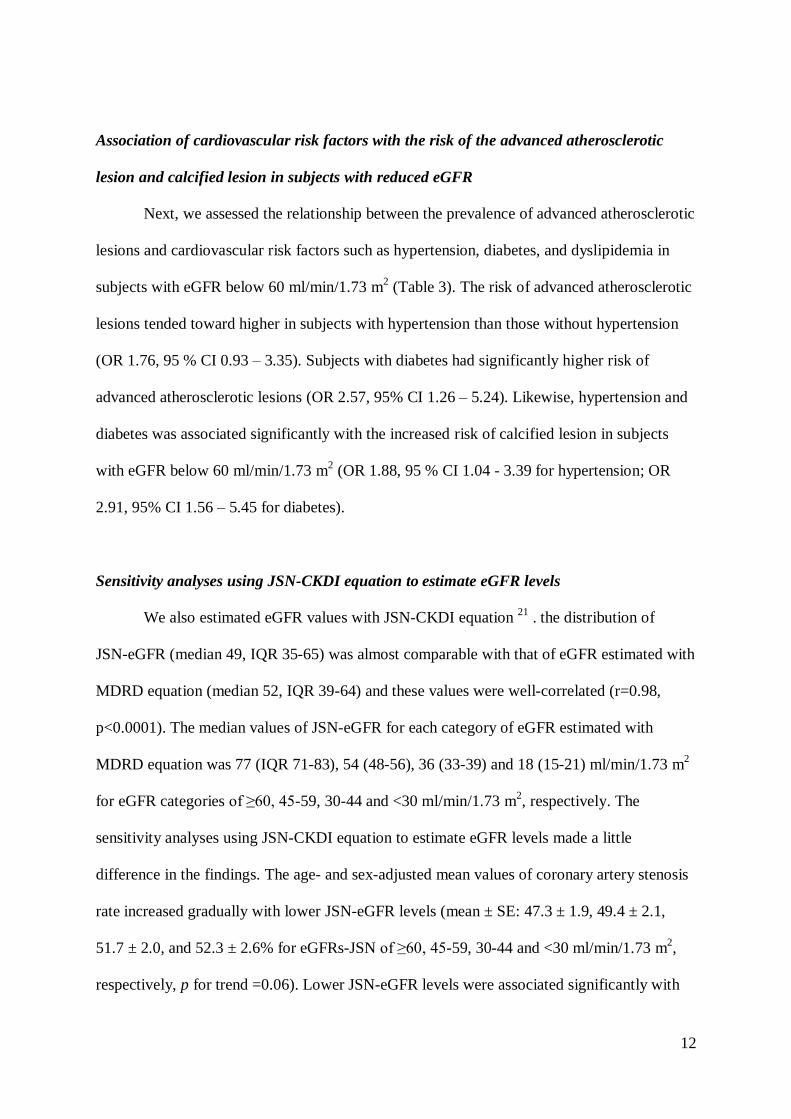
Figure 3 shows the proportions of the atherosclerotic lesion in accordance with the
AHA classification according to eGFRs. The prevalence of advanced atherosclerotic lesions
defined as type IV through VI was 34.3% for eGFRs ≥60 ml/min/1.73 m2, 41.7% for eGFRs
45-59 ml/min/1.73 m2, 52.3% for eGFRs 30-44 ml/min/1.73 m
2, and 52.8% for eGFRs <30
ml/min/1.73 m2. Subjects in the latter two categories
had a significantly higher proportion of
advanced atherosclerotic lesions on autopsy than those with eGFRs of ≥60 ml/min/1.73 m2.
The risk of advanced atherosclerosis was doubled in subjects with eGFRs of <45 ml/min/1.73
m2 as compared to those with eGFR of ≥60 ml/min/1.73 m
2 after adjustment for the potential
confounding factors including age, sex, hypertension, diabetes, total cholesterol,
HDL-cholesterol, triglycerides, calcium-phosphorus product, hematocrit, smoking habits and
alcohol intake (Table 2).
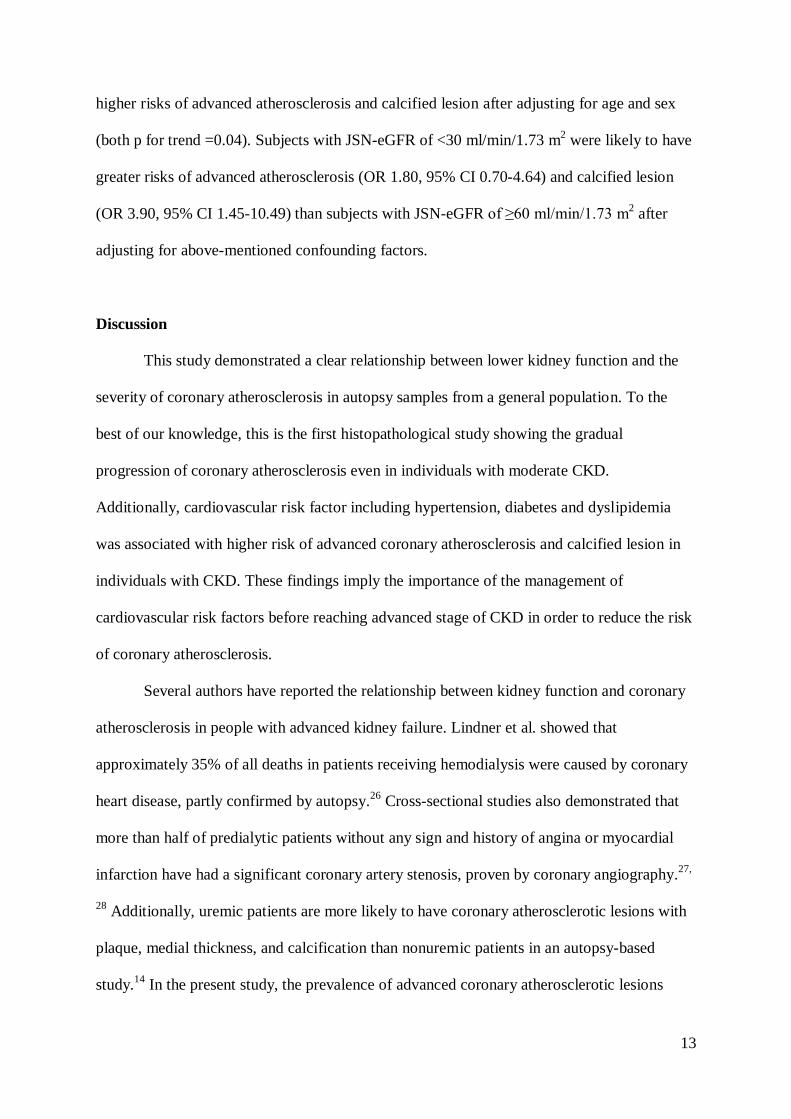
Prevalence of calcified lesion in coronary artery according to kidney function
In a case of AHA type VI in the subgroup of eGFRs <30 ml/min/1.73 m2, the arterial
intima was thickened and associated with calcified plaque and hematoma (Figure 4).
Many coronary artery samples showed intimal calcified lesions, but there was no medial
calcification in any specimens examined here. The prevalence of calcified lesions was 36.5%
for eGFRs ≥60 ml/min/1.73 m2, 37.0% for eGFRs of 45-59 ml/min/1.73 m
2, 44.9% for
eGFRs of 30-44 ml/min/1.73 m2, and 60.4% for eGFRs <30 ml/min/1.73 m
2 (p for trend
=0.02). Lower eGFR was associated with a higher prevalence of calcified coronary artery
lesions. The multivariate-adjusted OR of calcified lesions was 4.71 (95% CI 1.78 - 12.50) in
subjects with GFRs <30 ml/min/1.73 m2 as compared to those with GFRs >60 ml/min/1.73
m2 (Table 2).
12
Association of cardiovascular risk factors with the risk of the advanced atherosclerotic
lesion and calcified lesion in subjects with reduced eGFR
Next, we assessed the relationship between the prevalence of advanced atherosclerotic
lesions and cardiovascular risk factors such as hypertension, diabetes, and dyslipidemia in
subjects with eGFR below 60 ml/min/1.73 m2 (Table 3). The risk of advanced atherosclerotic
lesions tended toward higher in subjects with hypertension than those without hypertension
(OR 1.76, 95 % CI 0.93 – 3.35). Subjects with diabetes had significantly higher risk of
advanced atherosclerotic lesions (OR 2.57, 95% CI 1.26 – 5.24). Likewise, hypertension and
diabetes was associated significantly with the increased risk of calcified lesion in subjects
with eGFR below 60 ml/min/1.73 m2 (OR 1.88, 95 % CI 1.04 - 3.39 for hypertension; OR
2.91, 95% CI 1.56 – 5.45 for diabetes).
Sensitivity analyses using JSN-CKDI equation to estimate eGFR levels
We also estimated eGFR values with JSN-CKDI equation 21
. the distribution of
JSN-eGFR (median 49, IQR 35-65) was almost comparable with that of eGFR estimated with
MDRD equation (median 52, IQR 39-64) and these values were well-correlated (r=0.98,
p<0.0001). The median values of JSN-eGFR for each category of eGFR estimated with
MDRD equation was 77 (IQR 71-83), 54 (48-56), 36 (33-39) and 18 (15-21) ml/min/1.73 m2
for eGFR categories of ≥60, 45-59, 30-44 and <30 ml/min/1.73 m2, respectively. The
sensitivity analyses using JSN-CKDI equation to estimate eGFR levels made a little
difference in the findings. The age- and sex-adjusted mean values of coronary artery stenosis
rate increased gradually with lower JSN-eGFR levels (mean ± SE: 47.3 ± 1.9, 49.4 ± 2.1,
51.7 ± 2.0, and 52.3 ± 2.6% for eGFRs-JSN of ≥60, 45-59, 30-44 and <30 ml/min/1.73 m2,
respectively, p for trend =0.06). Lower JSN-eGFR levels were associated significantly with
13
higher risks of advanced atherosclerosis and calcified lesion after adjusting for age and sex
(both p for trend =0.04). Subjects with JSN-eGFR of <30 ml/min/1.73 m2 were likely to have
greater risks of advanced atherosclerosis (OR 1.80, 95% CI 0.70-4.64) and calcified lesion
(OR 3.90, 95% CI 1.45-10.49) than subjects with JSN-eGFR of ≥60 ml/min/1.73 m2 after
adjusting for above-mentioned confounding factors.
Discussion
This study demonstrated a clear relationship between lower kidney function and the
severity of coronary atherosclerosis in autopsy samples from a general population. To the
best of our knowledge, this is the first histopathological study showing the gradual
progression of coronary atherosclerosis even in individuals with moderate CKD.
Additionally, cardiovascular risk factor including hypertension, diabetes and dyslipidemia
was associated with higher risk of advanced coronary atherosclerosis and calcified lesion in
individuals with CKD. These findings imply the importance of the management of
cardiovascular risk factors before reaching advanced stage of CKD in order to reduce the risk
of coronary atherosclerosis.
Several authors have reported the relationship between kidney function and coronary
atherosclerosis in people with advanced kidney failure. Lindner et al. showed that
approximately 35% of all deaths in patients receiving hemodialysis were caused by coronary
heart disease, partly confirmed by autopsy.26
Cross-sectional studies also demonstrated that
more than half of predialytic patients without any sign and history of angina or myocardial
infarction have had a significant coronary artery stenosis, proven by coronary angiography.27,
28 Additionally, uremic patients are more likely to have coronary atherosclerotic lesions with
plaque, medial thickness, and calcification than nonuremic patients in an autopsy-based
study.14
In the present study, the prevalence of advanced coronary atherosclerotic lesions

14
increased gradually even in individuals with moderate stage of CKD. These results thus
highlighted the importance of considering kidney function status, prior to the patient reaching
advanced CKD, in trying to reduce the burden of coronary atherosclerosis in the general
population.
Several potential mechanisms can explain the association demonstrated here.
Individuals with CKD often have a higher burden of traditional cardiovascular risk factors
such as aging, elevated blood pressure, diabetes, dyslipidemia.29
Additionally, a reduced
eGFR may be associated with increased levels of novel cardiovascular disease risk factors,
such as inflammation, oxidative stress, anemia, and abnormal calcium/phosphate
metabolism.29-31
Several experimental findings from uremic Apolipoprotein E knockout mice
support these results.32-35
In the present study, the significant association between reduced
GFR and severity of coronary arteriosclerosis was still observed even after adjustment for all
the major traditional cardiovascular risk factors and some of the novel factors, including
anemia and abnormal calcium/phosphate metabolism. However, we were unable to
sufficiently assess how these other potential confounding factors influenced the study
findings. Further exploration is clearly needed to map the risk factors for coronary
atherosclerosis in individuals with CKD.
Several limitations of our study should be discussed. First, this was a cross-sectional
study, and so difficult to infer causality between CKD and risk for progression of coronary
atherosclerosis. The findings, however, suggested strongly that individuals with CKD should
be examined for progressive coronary atherosclerosis. Second, it has been well recognized
that GFR estimated using the MDRD equation leads to a certain degree of misclassification
of eGFR levels. However this limitation is unlikely to change our conclusions, because the
sensitivity analysis using the JSN-CKDI equation to estimate eGFR did not make any
material differences in the findings. Third, there was no information available regarding the

15
severity or duration of hypertension and other cardiovascular disease risk factors.
Furthermore, we have also no data available on medication usage such as lipid lowering
agents and phosphate binders. This limitation may reduce the experimental accuracy to some
extent. Finally, this study is based on autopsy and the proportion of aged people is extremely
high. Thus, these findings might not be applicable to the general living population.
Nevertheless, the information gained in this study contributes meaningfully towards better
understanding the pathogenesis of coronary atherosclerosis in individuals with CKD.
In conclusion, reduced eGFR was associated significantly with severity of coronary
atherosclerosis. The findings emphasized that individuals with CKD should be considered a
high-risk population for coronary heart disease, and that cardiovascular risk factors should be
substantially monitored in this population to prevent the progression of coronary
atherosclerosis. Further studies are needed to elucidate the precise mechanism mediating the
deterioration of atherosclerotic lesions in individuals with CKD.
Acknowledgments
The authors thank the residents of Hisayama Town for their participation in the
survey and the staff of the Division of Health and Welfare of Hisayama for their cooperation
in this study.
This work was supported in part by a Grant-in-Aid (T. Nakano, Y. Kiyohara and K.
Sueishi) from the Japanese Ministry of Education, Culture, Sports, Science, and Technology,
a Grant-in-Aid for Scientific Research C (T.N., No. 20590342), A (Y.K., No. 18209024) and
A (K.S., No. 19209012), a grant from the Special Coordination Fund for Promoting Science
and a grant from the Technology and Innovative Development Project in Life Sciences from
the Ministry of Education, Culture, Sports, Science and Technology of Japan.
Financial Disclosure: None.
16
References
1. Coresh J, Astor BC, Greene T, Eknoyan G, Levey AS. Prevalence of chronic kidney
disease and decreased kidney function in the adult US population: Third National Health and
Nutrition Examination Survey. Am J Kidney Dis. 2003;41(1):1-12.
2. Chadban SJ, Briganti EM, Kerr PG, et al. Prevalence of kidney damage in Australian
adults: The AusDiab kidney study. J Am Soc Nephrol. 2003;14(7 Suppl 2):S131-138.
3. Irie F, Iso H, Sairenchi T, et al. The relationships of proteinuria, serum creatinine,
glomerular filtration rate with cardiovascular disease mortality in Japanese general population.
Kidney Int. 2006;69(7):1264-1271.
4. Go AS, Chertow GM, Fan D, McCulloch CE, Hsu CY. Chronic kidney disease and
the risks of death, cardiovascular events, and hospitalization. N Engl J Med.
2004;351(13):1296-1305.
5. Manjunath G, Tighiouart H, Ibrahim H, et al. Level of kidney function as a risk factor
for atherosclerotic cardiovascular outcomes in the community. J Am Coll Cardiol.
2003;41(1):47-55.
6. Muntner P, He J, Hamm L, Loria C, Whelton PK. Renal insufficiency and subsequent
death resulting from cardiovascular disease in the United States. J Am Soc Nephrol.
2002;13(3):745-753.
7. Ninomiya T, Kiyohara Y, Kubo M, et al. Chronic kidney disease and cardiovascular
disease in a general Japanese population: the Hisayama Study. Kidney Int.
2005;68(1):228-236.
8. Rubenstein MH, Harrell LC, Sheynberg BV, Schunkert H, Bazari H, Palacios IF. Are
patients with renal failure good candidates for percutaneous coronary revascularization in the
new device era? Circulation. 2000;102(24):2966-2972.
17
9. Beddhu S, Allen-Brady K, Cheung AK, et al. Impact of renal failure on the risk of
myocardial infarction and death. Kidney Int. 2002;62(5):1776-1783.
10. Fried LF, Shlipak MG, Crump C, et al. Renal insufficiency as a predictor of
cardiovascular outcomes and mortality in elderly individuals. J Am Coll Cardiol.
2003;41(8):1364-1372.
11. Foley RN, Parfrey PS, Sarnak MJ. Clinical epidemiology of cardiovascular disease in
chronic renal disease. Am J Kidney Dis. 1998;32(5 Suppl 3):S112-119.
12. Ansari A, Kaupke CJ, Vaziri ND, Miller R, Barbari A. Cardiac pathology in patients
with end-stage renal disease maintained on hemodialysis. Int J Artif Organs.
1993;16(1):31-36.
13. Clyne N, Lins LE, Pehrsson SK. Occurrence and significance of heart disease in
uraemia. An autopsy study. Scand J Urol Nephrol. 1986;20(4):307-311.
14. Schwarz U, Buzello M, Ritz E, et al. Morphology of coronary atherosclerotic lesions
in patients with end-stage renal failure. Nephrol Dial Transplant. 2000;15(2):218-223.
15. Katsuki S. Epidemiological and clinicopathological study on cerebrovascular disease
in Japan. Prog Brain Res. 1966;21:64-89.
16. Ohmura T, Ueda K, Kiyohara Y, et al. Prevalence of type 2 (non-insulin-dependent)
diabetes mellitus and impaired glucose tolerance in the Japanese general population: the
Hisayama Study. Diabetologia. 1993;36(11):1198-1203.
17. Kubo M, Kiyohara Y, Kato I, et al. Risk factors for renal glomerular and vascular
changes in an autopsy-based population survey: the Hisayama study. Kidney Int.
2003;63(4):1508-1515.
18. Ueda K, Omae T, Hirota Y, Takeshita M, Hiyoshi Y. Epidemiological and
clinco-pathological study on renal diseases observed in the autopsy cases in Hisayama
population, Kyushu Island, Japan. J Chronic Dis. 1976;29(3):159-173.

18
19. Levey AS, Bosch JP, Lewis JB, Greene T, Rogers N, Roth D. A more accurate
method to estimate glomerular filtration rate from serum creatinine: a new prediction
equation. Modification of Diet in Renal Disease Study Group. Ann Intern Med.
1999;130(6):461-470.
20. K/DOQI clinical practice guidelines for chronic kidney disease: evaluation,
classification, and stratification. Am J Kidney Dis. 2002;39(2 Suppl 1):S1-266.
21. Matsuo S, Imai E, Horio M, et al. Revised Equations for Estimated GFR From Serum
Creatinine in Japan. Am J Kidney Dis. 2009 (in press).
22. Imai E, Horio M, Nitta K, et al. Estimation of glomerular filtration rate by the MDRD
study equation modified for Japanese patients with chronic kidney disease. Clin Exp Nephrol.
2007;11(1):41-50.
23. Stary HC, Chandler AB, Dinsmore RE, et al. A definition of advanced types of
atherosclerotic lesions and a histological classification of atherosclerosis. A report from the
Committee on Vascular Lesions of the Council on Arteriosclerosis, American Heart
Association. Circulation. 1995;92(5):1355-1374.
24. Taylor AJ, Burke AP, Farb A, et al. Arterial remodeling in the left coronary system:
the role of high-density lipoprotein cholesterol. J Am Coll Cardiol. 1999;34(3):760-767.
25. Zeger SL, Liang KY. Longitudinal data analysis for discrete and continuous outcomes.
Biometrics. 1986;42(1):121-130.
26. Lindner A, Charra B, Sherrard DJ, Scribner BH. Accelerated atherosclerosis in
prolonged maintenance hemodialysis. N Engl J Med. 1974;290(13):697-701.
27. Joki N, Hase H, Nakamura R, Yamaguchi T. Onset of coronary artery disease prior to
initiation of haemodialysis in patients with end-stage renal disease. Nephrol Dial Transplant.
1997;12(4):718-723.
28. Ohtake T, Kobayashi S, Moriya H, et al. High prevalence of occult coronary artery
19
stenosis in patients with chronic kidney disease at the initiation of renal replacement therapy:
an angiographic examination. J Am Soc Nephrol. 2005;16(4):1141-1148.
29. Uhlig K, Levey AS, Sarnak MJ. Traditional cardiac risk factors in individuals with
chronic kidney disease. Semin Dial. 2003;16(2):118-127.
30. Madore F. Uremia-related metabolic cardiac risk factors in chronic kidney disease.
Semin Dial. 2003;16(2):148-156.
31. Witko-Sarsat V, Friedlander M, Nguyen Khoa T, et al. Advanced oxidation protein
products as novel mediators of inflammation and monocyte activation in chronic renal failure.
J Immunol. 1998;161(5):2524-2532.
32. Buzello M, Tornig J, Faulhaber J, Ehmke H, Ritz E, Amann K. The apolipoprotein e
knockout mouse: a model documenting accelerated atherogenesis in uremia. J Am Soc
Nephrol. 2003;14(2):311-316.
33. Bro S, Bentzon JF, Falk E, Andersen CB, Olgaard K, Nielsen LB. Chronic renal
failure accelerates atherogenesis in apolipoprotein E-deficient mice. J Am Soc Nephrol.
2003;14(10):2466-2474.
34. Bro S, Moeller F, Andersen CB, Olgaard K, Nielsen LB. Increased expression of
adhesion molecules in uremic atherosclerosis in apolipoprotein-E-deficient mice. J Am Soc
Nephrol. 2004;15(6):1495-1503.
35. Massy ZA, Ivanovski O, Nguyen-Khoa T, et al. Uremia accelerates both
atherosclerosis and arterial calcification in apolipoprotein E knockout mice. J Am Soc
Nephrol. 2005;16(1):109-116.

20
Figure legends
Figure 1: Flow diagram for enrollment of the study
Figure 2: Typical arteries for each classification by glomerular filtration rate.
A through D show typical light microscopic views of coronary arteries from respective cases
with eGFRs ≥60 (A), 45-59 (B), 30-44 (C), and <30 ml/min/1.73 m2 (D). The stenosis rates
of respective arteries were 36.8%(A), 42.3% (B), 54.2%(C), and 58.9%(D). All sections were
stained with hematoxylin eosin (H.E.). Scale bars = 1.0 mm.
Figure 3: The proportions of the atherosclerotic lesion in accordance with the AHA
classification associated with kidney function.
Bar graphs indicate the percentage of atherosclerotic lesions estimated on the basis of the
AHA classifications according to eGFR levels. The percentages of advanced atherosclerosis
(AHA types IV to VI) for respective eGFR levels are shown at the right side of the graphs.
*p<0.05 vs. eGFR of ≥ 60 ml/min/1.73 m2.
Figure 4. Typical artery of AHA type VI in GFR<30 category (Masson’s trichrome
staining). Scale bars =1.0mm.
21
Table 1: Laboratory variables and risk factors according to kidney function
eGFR categories (ml/min/1.73 m2) p for
trend ≥60 45-59 30-44 <30
eGFR (ml/min/1.73m2) 72 (68-85) 55 (51-58) 40 (37-43) 21 (19-25)
Number 36 36 36 18
Age 84±6 85±6 85±8 85±7 0.8
Male (%) 39 39 39 39 0.9
Serum creatinine (mg/dL) 0.9 (0.8-1.0) 1.1 (1.0-1.3) 1.5 (1.3-1.7) 2.5 (2.0-3.2) <0.001
Serum urea nitrogen (mg/dL) 16 (12-18) 19 (16-24) 24 (19-27) 39 (29-46) <0.001
Serum albumin (g/dL) 4.0±0.4 4.0±0.5 3.9±0.5 3.7±0.4 0.11
Systolic blood pressure (mmHg) 141±23 142±29 143±29 165±29 0.01
Diastolic blood pressure (mmHg) 73±12 74±14 75±10 77±13 0.2
Usage of anti-hypertensive agent (%) 28 36 56 50 0.03
Hypertension (%) 61 58 78 94 0.006
Hemoglobin A1c (%) 5.2±0.8 5.7±1.5 5.4±0.8 5.4±0.9 0.6
Diabetes (%) 11 22 19 22 0.3
Total cholesterol (mg/dL) 184±37 190±43 195±53 186±45 0.6
HDL-C (mg/dL) 60±17 52±13 56±17 53±15 0.3
Triglycerides (mg/dL) 76 (65-102) 91 (81-124) 88 (68-123) 113 (70-167) 0.1
Calcium × Phosphate (mg2/dL
2) 29±6 31±5 31±4 33±5 0.005
Hematocrit (%) 37±5 37±6 35±5 30±6 <0.001
Smoking habits (%) 19 28 6 17 0.3
Alcoholic intake (%) 17 11 11 6 0.3
The median period from the last health
examination 1.0 (0.5-2.0) 2.0 (0.5-2.0) 1.5 (0.5-3.0) 1.0 (0-2.0) 0.7
Causes of death
Malignant neoplasms (%) 28 31 28 0 0.2
22
Heart diseases (%) 17 17 11 11 0.1
Cerebrovascular diseases (%) 17 11 3 11 0.4
Other diseases of circulatory
system (%) 0 6 6 6 0.2
Infectious diseases (%) 17 19 33 22 0.5
Other causes (%) 19 6 8 33 0.08
Values are mean ± standard deviation or frequencies. Hypertension was defined as blood pressure ≥140/90 mmHg or usage of anti-hypertensive
agent. Diabetes was defined as HbA1c ≥6.0%. Trends were tested by linear regression analysis for continuous variables or logistic regression
analysis for categorical variables. eGFR, serum creatinine, serum urea nitrogen and triglycerides were described as median and interquartile
range. Serum creatinine in mg/dL may be converted to μmol/dL by multiplying by 76.26. Serum albumin may be converted to g/L by
multiplying by 10. Serum urea nitrogen, total cholesterol, HDL-C and triglycerides in mg/dL may be converted to mmol/L by multiplying by
0.357, 0.02586, 0.02586 and 0.01129, respectively. eGFR, estimated glomerular filtration rate; HDL-C, high-density lipoprotein cholesterol.

23
Table 2: Age- and sex-matched or multivariate-adjusted odds ratios for advanced coronary atherosclerotic lesion and calcified lesion according
to kidney function.
eGFR
categories
Number of
vessels
assessed
Age-and sex-adjusted a)
Multivariate-adjusted b)
Matched
OR ( 95%CI )
p
value
p for
trend
Matched
OR ( 95%CI ) p value
p for
trend
Advanced atherosclerosis (AHA type IV-VI)
≥60 107 1.00 ( Reference )
0.006
1.00 ( Reference )
0.01 45-59 108 1.51 ( 0.80 - 2.87 ) 0.20 1.40 ( 0.76 - 2.55 ) 0.28
30-44 107 2.22 ( 1.11 - 4.43 ) 0.02 2.02 ( 0.99 - 4.15 ) 0.05
<30 53 2.38 ( 1.18 - 4.81 ) 0.02 3.02 ( 1.22 - 7.49 ) 0.02
Calcified lesion
≥60 107 1.00 ( Reference )
0.02
1.00 ( Reference )
0.009 45-59 108 1.02 ( 0.50 - 2.08 ) 0.95 0.95 ( 0.46 - 1.94 ) 0.89
30-44 107 1.43 ( 0.71 - 2.89 ) 0.32 1.43 ( 0.69 - 2.95 ) 0.34
<30 53 2.75 ( 1.19 - 6.34 ) 0.02 4.71 ( 1.78 - 12.50 ) 0.002
a) Odds ratios were adjusted for age and sex.
b) Odds ratios were adjusted for age, sex, hypertension, diabetes, total cholesterol, HDL-cholesterol, triglycerides, calcium-phosphorus product,
hematocrit, smoking habits and alcohol intake.
eGFR, estimated glomerular filtration rate; OR, odds ratio; CI, confidence interval.

24
Table 3: Association of the cardiovascular risk factors with the risk of the advanced coronary atherosclerotic lesion and calcified lesion in
subjects with reduced kidney function
Risk factor N of vessels
assessed
Frequency
of lesion OR ( 95% CI ) p
Advanced atherosclerosis (AHA type IV-VI)
Hypertension No 71 38.0% 1.00 ( reference )
Yes 197 51.8% 1.76 ( 0.93 - 3.35 ) 0.08
Diabetes No 212 43.4% 1.00 ( reference )
Yes 56 66.1% 2.57 ( 1. 26 - 5.24 ) 0.01
Dyslipidemia No 143 42.7% 1.00 ( reference )
Yes 125 54.4% 1.61 ( 0.91 - 2.86 ) 0.10
Calcified lesion
Hypertension No 71 33.8% 1.00 ( reference )
Yes 197 48.7% 1.88 ( 1.04 - 3.39 ) 0.04
Diabetes No 212 40.1% 1.00 ( reference )
Yes 56 62.5% 2.91 ( 1.56 - 5.45 ) 0.0008
Dyslipidemia No 143 42.0% 1.00 ( reference )
Yes 125 48.0% 1.25 ( 0.71 - 2.20 ) 0.45
Hypertension was defined as blood pressure ≥140/90 mmHg and/or usage of antihypertensive agent. Diabetes was defined as Hemoglobin A1c
≥6.0%. Dyslipidemia was defined as total cholesterol ≥ 220 mg/dL, HDL-Cholesterol< 40 mg/dL and/or triglycerides ≥ 150 mg/dL.
Odds ratios were adjusted for age and sex.
OR, odds ratio; CI, confidence interval.
The residents deceased in the Hisayama town (January 1988 - November 2005)
1,162 cases
The subjects underwent autopsy 844 cases
The subjects who had a health examination within 3 years before death.
482 cases
The subjects randomly selected from each eGFR category after matching for age and sex
126 cases
The classification based on eGFR levels
Figure 1
45≤ eGFR <60
30≤ eGFR <45 eGFR <30
60≤ eGFR B
C D
A Figure 2

0 20 40 60 80 100 (%)
Percentage of advanced
atherosclerosis (IV-VI)
33.6
41.7
52.3*
52.8*
Percentage of atherosclerotic lesion in accordance with AHA classification
eGFR <30
60≤ eGFR
45≤ eGFR <60
30≤ eGFR <45
type I type II type III type IV type V type VI
Figure 3

AHA type VI
Figure 4