association between mechanics and biology in vascular
TRANSCRIPT

University of South Carolina University of South Carolina
Scholar Commons Scholar Commons
Theses and Dissertations
2018
Association Between Mechanics And Biology In Vascular Graft Association Between Mechanics And Biology In Vascular Graft
Remodeling Remodeling
David Andrew Prim University of South Carolina
Follow this and additional works at: https://scholarcommons.sc.edu/etd
Part of the Biomedical Engineering and Bioengineering Commons
Recommended Citation Recommended Citation Prim, D. A.(2018). Association Between Mechanics And Biology In Vascular Graft Remodeling. (Doctoral dissertation). Retrieved from https://scholarcommons.sc.edu/etd/4645
This Open Access Dissertation is brought to you by Scholar Commons. It has been accepted for inclusion in Theses and Dissertations by an authorized administrator of Scholar Commons. For more information, please contact [email protected].
ASSOCIATION BETWEEN MECHANICS AND BIOLOGY IN VASCULAR GRAFT
REMODELING
by
David Andrew Prim
Bachelor of Science University of South Carolina, 2013
Submitted in Partial Fulfillment of the Requirements
For the Degree of Doctor of Philosophy in
Biomedical Engineering
College of Engineering and Computing
University of South Carolina
2018
Accepted by:
John F. Eberth, Major Professor
Tarek Shazly, Committee Member
Jay Potts, Committee Member
Taixing Cui, Committee Member
Cheryl L. Addy, Vice Provost and Dean of the Graduate School

ii
© Copyright by David Andrew Prim, 2018 All Rights Reserved.

iii
DEDICATION
The last five years would have been wholly different without the love and support
of my family and friends. Most importantly, I would like to thank my wife, Rosanne, for
her love, patience, understanding, and partnership; my parents, Harry and Cheryl, for their
unwavering love and support throughout my life; and my dogs, Beauregard and Wheatley,
for being a source of unbridled joy no matter the circumstances.

iv
ACKNOWLEDGEMENTS
I would like to acknowledge first my advisor and mentor, Dr. John F. Eberth, for
thoughtfully guiding my research while allowing me the freedom to make my own
decisions and pursue my own interests in and out of the lab. I also would like to thank my
committee members – Dr. Shazly, Dr. Potts, and Dr. Cui – for contributing their own candid
guidance and advice. I would like to thank my fellow graduate students Brooks Lane and
William Torres for regular conversations, commiseration, and advice. Finally, I would like
to thank everyone at the School of Medicine and College of Engineering who has
contributed advice, protocols, assistance, training, and more, when I sought their expertise.

v
ABSTRACT
Coronary artery bypass grafting (CABG) restores myocardial perfusion in patients
with severe coronary artery disease by utilizing autografts – usually at least one of the
internal thoracic artery (ITA), radial artery (RA), and great saphenous vein (GSV) – to
bypass stenosed regions of coronary arteries. While decades of research and clinical
improvements have made CABG an indispensable procedure, tens of thousands of grafts
fail each year, which is due, at least in part, to an inability of the source vessels to adapt to
the altered stimuli of the coronary circulation. In this dissertation, we first quantify and
compare the mechanical deviation experienced by ITAs, RAs, and GSVs when subjected
to coronary loads to better understand the nature and magnitude of forces stimulating
remodeling processes. Those mechanical deviations are correlated with known clinical
failure rates taken from large-cohort meta-analysis in existing literature. To better
understand the early signaling and gene expression activity of grafts subjected to these
coronary loads, we then culture ITAs, RAs, and GSVs in an ex vivo perfusion bioreactor
for up to one week, identifying differential responses across source vessels that are
associated with adaptive and maladaptive remodeling. Maladaptive remodeling processes
and eventual graft failure may be associated with the large mechanical mismatching that
results from implantation in the coronary circulation and the sudden exposure to coronary
loading. We therefore test a stepwise approach wherein gradual increases in pressure and
flow of ex vivo culture conditions over three weeks stimulate adaptive GSV remodeling
while avoiding maladaptive pathways. This adaptive culture technique could be applied to

vi
engineered grafts, such as xenografts to improve the material properties prior to
decellularization. To demonstrate the range of scaffolds that may be available from animal
donors, we evaluate the passive mechanical properties of carotid arteries from six species
of mammal. Vascular graft remodeling may also be sensitive to the intricacies of applied
pressure and flow waveforms, so we developed and validated a novel pulsatile perfusion
bioreactor capable of replicating any in vivo hemodynamic waveform. The combination of
these techniques and results furthers understanding of CABG failure and vascular
remodeling, while also providing a framework for engineering improved vascular grafts.

vii
TABLE OF CONTENTS
Dedication .......................................................................................................................... iii
Acknowledgements ............................................................................................................ iv
Abstract ................................................................................................................................v
List of Tables ................................................................................................................... viii
List of Figures .................................................................................................................... ix
Chapter 1: Introduction – Vascular Mechanobiology ..........................................................1 Chapter 2: A Mechanical Argument for the Differential Performance of Coronary Artery Grafts ...................................................................20
Chapter 3: Perfusion Tissue Culture Initiates Differential Remodeling of Porcine Internal Thoracic Arteries, Radial Arteries, and Saphenous Veins .....................................................................54
Chapter 4: Pulsatile Perfusion Bioreactor for Biomimetic Vascular Impedances ................................................................................................79
Chapter 5: Comparative Biaxial Mechanics of Mammalian Carotid Arteries ......................................................................................................115
Chapter 6: Transition from Venous to Arterial Loading Improves Saphenous Vein Remodeling for Coronary Artery Grafting .......................................................................................................142
Chapter 7: Conclusions and Future Directions ................................................................165
References ........................................................................................................................169
Appendix A: Journal Permission for Use of Manuscript .................................................205

viii
LIST OF TABLES
Table 2.1 – Vessel geometry of stress-free configuration. ................................................45 Table 2.2 – Material Parameters for LAD, ITA, RA, GSV, and LSV obtained for a four-fiber constitutive model. ............................................................46 Table 2.3 – Loads, structure, stretch, and stress for the LAD, ITA, RA, GSV, and LSV in situ or grafted under coronary loads. ...........................................47 Table 3.1 – Ex vivo culture conditions for control (In Situ) and experimental (coronary –LAD) groups for graft tissues ITA, RA, and GSV. ............................................................................................................................71 Table 3.2 – Primer sequences of 7 remodeling-associated genes and ACTB housekeeping gene ...........................................................................................72 Table 4.1 – Magnitude and phase of simultaneously recorded blood pressure and flow waveforms from the literature [1–3], which illustrates the desired steady, fundamental, and first two harmonics of the Brachial Artery (BrA), Greater Saphenous Vein (GSV), and Left Coronary Artery (LCA). ..............................................................103 Table 4.2 – Parameters of the 5-element electro-hydraulic model when bounded by practical values and the cumulative fitting error. ......................................................................................................................104 Table 5.1 – Fitted parameters for six mammalian species using the Fung-type [4] material model. ...................................................................................133 Table 5.2 – Fitted parameters for six mammalian species using the 4-fiber family HGO material model [5,6]. .................................................................134 Table 6.1 – Stress-free configuration comparison between fresh GSVs (n=8) and those cultured for 21 days (n=5) under stepwise guided remodeling. ..........................................................................................................158

ix
LIST OF FIGURES
Figure 1.1 – (A) Diagram of heart with three CABGs: GSV from aortic root to right marginal artery, left ITA with single anastomosis to LAD; and RA from aortic root to diagonal branch of LAD; (B) Diagram of heart with three CABGs: left ITA with single anastomosis to LAD, right ITA with single anastomosis to diagonal branch of LAD, and right gastroepiploic artery with single anastomosis to distal right coronary artery [7]... ........................................................................................18 Figure 1.2 – Hypothetical remodeling of GSV to restore in vivo
homeostatic values of hw and h
under coronary loading conditions
(Q = 0.52 ml/s, P = 102 mmHg): (A) scale diagram of native
GSV deformed under coronary loads, and (B) scale diagram of GSV remodeled to restore homeostatic stresses.. .......................................................................19 Figure 2.1 – Translational schematic comparing vessel locations in human and porcine anatomy and vessel wall diagrams to scale based on geometric and histological data from study. .......................................................48 Figure 2.2 – Verhoeff-Masson’s stained cross-sections of (A) proximal and (B) distal left anterior descending artery – LAD approximately 2 cm apart; (C) internal thoracic artery - ITA, (D) radial artery - RA, (E) great saphenous vein - GSV, and (F) lateral saphenous vein - LSV. ......................................................................................49 Figure 2.3 – Area fractions ϕ of elastin (black), collagen (white), and smooth muscle (gray) determined by thresholding analysis of Verhoeff – Masson’s stained cross-sections for the ITA, RA, GSV, and LSV. ..................................................................................................................50 Figure 2.4 – Representative plots at in situ conditions of (A) pressure-inner radius (B), axial force-stretch, (C) circumferential stress-stretch, and (D) axial stress-stretch for the LAD ( ), ITA ( ), RA ( ), GSV ( ), and LSV ( ) .............................................51 Figure 2.5 – Comparison of normalized differences between vessels (ITA, RA, GSV, or LSV) in situ and the LAD (Ξ, ) or between vessels in situ and that vessel grafted under uniform loads of the LAD environment (,), where subscripts

x
(ri), (c), (σθ), and (σz) represent the normalized inner radius, compliance, circumferential stress, and axial stress respectively as plotted in (A), (B), (C), and (D) respectively, while Ξ and (no subscript) are the summation of those metrics (E) .................................................52 Figure 2.6 – Relationship between the first year CABG failure rate (mean SD) and the state of the vessels in situ compared to the LAD (Ξ dashed line: ITA ; RA ; GSV ) or between the vessels in situ and that vessel grafted under uniform loads of the LAD environment ( solid line: ITA ; RA ; GSV ), where subscripts (ri), (c), (σθ), and (σz) represent the normalized inner radius, compliance, circumferential stress, and axial stress as plotted in (A), (B), (C), and (D) respectively, while and Ξ (no subscript) are the summation of those metrics (E). ..................................................53 Figure 3.1 – Parallel ex vivo pulsatile perfusion bioreactors assembled in incubator (top) with ITA sample in culture (bottom) ...................................73 Figure 3.2 – Comparison of remodeling-associated gene expression of freshly isolated (t0) LAD, ITA, RA, and GSV, where * and ^ indicate p<0.05 with respect to LAD and ITA respectively using two-tailed, two sample, Student’s t-test (n=6). No genes were significantly different between RA and GSV samples ......................................................................................................................74 Figure 3.3 – Representative phase contrast images (20x) of isolated cells harvested from the intimal, medial, and adventitial layers of LAD, ITA, RA, and GSVs after 7days in culture plates .....................................75 Figure 3.4 – BrdU positive staining of isolated cells harvested from the intimal, medial, and adventitial layers of LAD, ITA, RA, and GSVs after 7 days indicate the % of proliferating cells ......................................76 Figure 3.5 – Comparison of remodeling-associated gene expression changes in ITA, RA, and GSV samples as a result of acute (6h) and prolonged (7d) ex vivo tissue culture exposed to media perfusion approximating in situ (IS) or LAD conditions. * and ^ indicates p<0.05 with respect to 6h IS and 6h LAD respectively using two-tailed, two sample, Student’s t-test (n=3) ..........................................................................................................................77 Figure 3.6 – Representative hematoxylin and eosin (H&E) stained cross sections of ITA, RA, and GSVs before (top row) and after (middle and bottom rows) 7 days of ex vivo perfusion culture at in situ (IS; middle row) or left anterior descending (LAD; bottom row) culture conditions. All images are paired at

xi
100x (left) and 400x (right) magnifications with 0.1 mm scalebars ..................................78 Figure 4.1 – Visualization of Fourier analysis illustrating (a) the steady (purple) and composite (black) waveforms of volumetric blood flow (solid) and blood pressure (dash-dot) of the Brachial Artery (BrA). The fundamental (blue) and first two harmonics (orange; red) are shown for the (b) volumetric blood flow rate and (c) blood pressure while. The impedance (d) magnitude and (e) phase for the BrA .........................................................................105 Figure 4.2 – (a) Electro-hydraulic analog of the cardiovascular system and bench top schematic with (b) equivalent impedances ...................................106 Figure 4.3 – Parameter sensitivity of the 5-element electrohydraulic analog demonstrating impedance magnitude
(left) and phase (right). (a-b) 1 10,110R (mmHgs/ml),
(c-d) 2 0, 24R , (e-f) 0.005,0.025C (ml/mmHg),
and (g-h) 0,0.8aL (mmHgs2/ml). Default values of
1R =60 (mmHgs/ml), 2R =5 (mmHgs/ml), C =0.01 (ml/mmHg),
aL =0.33 (mmHgs2/ml), and sL =0.33 (mmHgs2/ml). Arrows
indicate the direction of increasing values of the given parameter ..................................107 Figure 4.4 – Hardware schematic for the pulsatile perfusion bioreactor .........................................................................................................................108 Figure 4.5 – Values of isolated design elements in the pulsatile perfusion bioreactor: (a) measured systemic resistance and the resistances at discrete positions of a custom designed plate (linearized) valve and (b) resistances at discrete positions of the tubing pinch valve, (c) measured systemic compliance and measured versus estimated added compliance using chamber with different preload volumes of air. (d) Measured systemic inductance and added inductances from a coil of tubing using different tubing diameters ................................................................................................109 Figure 4.6 – (a) Customized three channel peristaltic pump with (b) synchronous gearing system and timing belts that generate the fundamental (k=1) and first two harmonics (k=2, 3) of the frequency. (c) Illustration of a single roller pump head containing three rollers where the volumetric flow phase angle is set using a cam mechanism and the displaced volume adjusted by using tubing with different lumen diameters .............................................................................110 Figure 4.7 – Simultaneous brachial artery (BrA) (a) volumetric

xii
blood flow rate and (b) blood pressure for one cardiac cycle. Solid lines indicate the desired waveform and () the values recorded in our bioreactor system. (c) The impedance modulus and (d) phase for the desired (), theoretical (), and measured response (). ...................................................................................................................111 Figure 4.8 – Simultaneous (a-b) greater saphenous vein (GSV) and left anterior descending coronary artery (LCA) (c-d) volumetric blood flow rate and pressure for one cardiac cycle. Solid lines indicate the desired waveform and () the values recorded in our bioreactor system. The arrow indicates the shifted coronary artery blood pressure from the desired value ....................................................112 Figure 4.9 – Gene expression profiles for GSVs exposed to GSV, BrA, or LCA-like pulsatile media pressure and flow waveforms for 6 h. Data are reported as fold change relative to the GSV conditions. Error bars indicate ± standard error of the mean. (*) denotes differences between GSVs exposed to LCA or BrA conditions and the GSV at IS conditions. (^) Denotes differences between GSVs exposed to BrA and GSVs exposed to LCA. Statistical significance is considered at p<0.05 ...................................113 Figure 4.10 – Relative expression profiles of select vascular remodeling genes for the GSV after 6 h of in vitro culture at in situ pressure, flow and axial loading conditions represented as fold change from freshly harvested vessels. (*) Denotes significant differences between the measured gene after 6 h of culture and freshly harvested .................................................................................114 Figure 5.1 – Images of common carotid arteries. (left) Vessels mounted within the biaxial testing device at z=1.5 and
P=100 mmHg. (a) Bovine: OD = 8.82 mm, (b) porcine: OD = 4.96 mm, (c) ovine: OD = 5.49 mm, (d) leporine: OD = 2.60 mm, (e) murine-rat: OD = 1.14, and (f) murine-mouse: OD = 0.65 mm vessels shown. Scale bars are 1 mm. (right) Unloaded ring sectors of each vessel with 1 mm ruler ....................................................135 Figure 5.2 – Full range of common carotid arteries subjected to passive biaxial mechanical testing. (top) Pressure-diameter at z=1.5, (bottom) axial force-stretch on a
logarithmic scale at P=100 mmHg for Bovine, porcine, ovine, leporine, murine-rat, and murine-mouse. All values are mean (n=6) ± SEM ....................................................................................................................136 Figure 5.3 – Comparative structural and force values for common carotid arteries subjected to passive biaxial mechanical
xiii
testing at 100 mmHg and 1.5 axial stretch ratio. (a) Inner radius, (b) wall thickness, (c) area compliance, and (d) axial force from bovine, porcine, ovine, leporine, murine-rat, and murine-mouse carotid arteries. All values are mean ± standard deviation. (*) denotes statistical significance at p<0.05 between the leftmost group and the corresponding hash-mark .................................................................................................137 Figure 5.4 – Comparative stress and strain values for common carotid arteries subjected to passive biaxial mechanical testing at 100 mmHg. (a) Circumferential stress, (b) circumferential stretch, and (c) axial stress for bovine, porcine, ovine, leporine, murine-rat, and murine-mouse carotid arteries at 1.5 axial stretch ratio. Figure (d) illustrates the minimal axial stretch ratio to maintain vessels in tension at 100 mmHg. (*) denotes statistical significance at p<0.05 between the leftmost group and the corresponding hash-mark .......................................138 Figure 5.5 – Full range of stress and stretch for common carotid arteries subjected to passive biaxial mechanical testing. (top) Circumferential stress-stretch at z=1.5, and (bottom) axial
stress-stretch at 100 mmHg for bovine, porcine, ovine, leporine, murine-rat, and murine-mouse common carotid arteries fitted using the 4-fiber family HGO model. All values are mean (n=6) ± SEM .................................139 Figure 5.6 – Contour plots of total strain energy W (kPa or
kJ/m3). (a) Bovine, (b) porcine, (c) ovine, (d) leporine, (e) murine-rat,
and (f) murine-mouse models as a function of biaxial stretches θ=[1.00,1.85], z=[1.00,1.85] using the Fung-type model (dashed lines)
and 4-fiber HGO model (solid lines). Labels are provided for the 4-fiber HGO model only ..................................................................................................140 Figure 5.7 – Allometric scaling of mechanical quantities with
weight. (a) Inner radius (ri = 0.702·w0.262
, R² = 0.982), wall thickness
(h = 0.117·w0.3338
, R² = 0.968), area compliance (CA = 0.129·w0.3633
,
R² = 0.742), and axial force (F = 0.009·w0.8824
, R² = 0.900) fit to the power law allometric scaling relationship. (b) Circumferential stress, axial stress, (c) circumferential stretch, and minimum axial stretch did not scale with weight .......................................................................................................141 Figure 6.1 – Stepwise increases in pressure (P) and volumetric flow (Q) at 3 day intervals over 21 days of culture. Flow increases by 17.3% each step and pressure by 31.5%. .............................................................................................159 Figure 6.2 – Representative MTT stained rings of (A) fresh GSV, (B) viable 21 day stepwise culture, and (C) 21 day stepwise culture

xiv
with limited viability. .......................................................................................................160 Figure 6.3 - Top: H&E staining of GSV sample (A) prior to culture and (B) after 21 day stepwise remodeling culture; Bottom: TUNEL apoptosis assay with DAB conjugation and methyl green counterstain (C) prior to culture and (D) after 21 day stepwise remodeling culture. In each image, lumen marked with L and scale bar = 1mm ................................................161 Figure 6.4 – Biaxial mechanical data from inflation-extension testing of 5 vessels before and after 21 day stepwise remodeling culture: (A) pressure vs. diameter relationship at each vessel’s in vivo axial stretch ( z ), (B) circumferential stretch ( ) vs. circumferential
stress ( ) at each vessel’s in vivo axial stretch, (C) pressure vs. axial
force at each vessel’s in vivo axial stretch, (D) axial stretch vs. axial stress at 100 mmHg. Closed circles – day 0, open circles – day 21; hashed boxes around legend denote vessels that remained viable through day 21 ...............................................................................................................................162 Figure 6.5 – Biaxial mechanical data from inflation-extension testing of 2 vessels that maintained viability after 21 day stepwise remodeling culture: (A) pressure vs. diameter relationship at each vessel’s in vivo axial stretch ( z ), (B) circumferential stretch ( ) vs. circumferential
stress ( ) at each vessel’s in vivo axial stretch, (C) pressure vs. axial
force at each vessel’s in vivo axial stretch, (D) axial stretch vs. axial stress at 100 mmHg. . Closed circles – day 0, open circles – day 21 ..............................163 Figure 6.6 – Comparison of changing structural and mechanical properties before and after 21 day remodeling culture in individual samples at in vivo stretch ratio and 100 mmHg pressure. Hashed boxes denote samples that maintained viability through day 21. ........................................................................164 Figure A.1 – Permission from Journal of Mechanical Behavior of Biomedical Materials to include published manuscript in this dissertation (Chapter 2). ...................................................................................................205

1
CHAPTER 1
INTRODUCTION – VASCULAR MECHANOBIOLOGY
1.1 VASCULAR STRUCTURE AND FUNCTION
The mammalian vasculature evolved to distribute oxygenated, nutrient-rich blood
from the myocardium through the arterial tree to capillaries throughout the body, to return
deoxygenated blood through the venous system to the right atrium, and to circulate blood
through the pulmonary system for reoxygenation. Most vessels share common basic
characteristics; however, the structure of any given vessel is uniquely adapted to function
optimally in its environment, which results in general differences between arteries and
veins as well as large variation within each group [2]. Several discrete classifications are
commonly used throughout the vascular tree, starting most proximal to the left ventricle,
moving distally to capillary beds, and returning to the right atrium: elastic arteries,
muscular arteries, arterioles, capillaries, venules, and veins. While these classifications are
based on structural and functional patterns within each group, it is important to note that
variations exist across vessels within groups (e.g., carotid vs. femoral elastic arteries) and
even at different points along one vessel (e.g., proximal and distal aorta). Elastic arteries,
muscular arteries, and veins are of primary interest herein due to their importance in disease
and graft treatments, and further discussion will focus exclusively on these groups.
Blood vessels are generally considered to have three layers, or tunics: tunica intima,
tunica media, and tunica adventitia. The differences in the relative size and constituent
make-up of these layers allow for vessels to be distinguished histologically (e.g.,
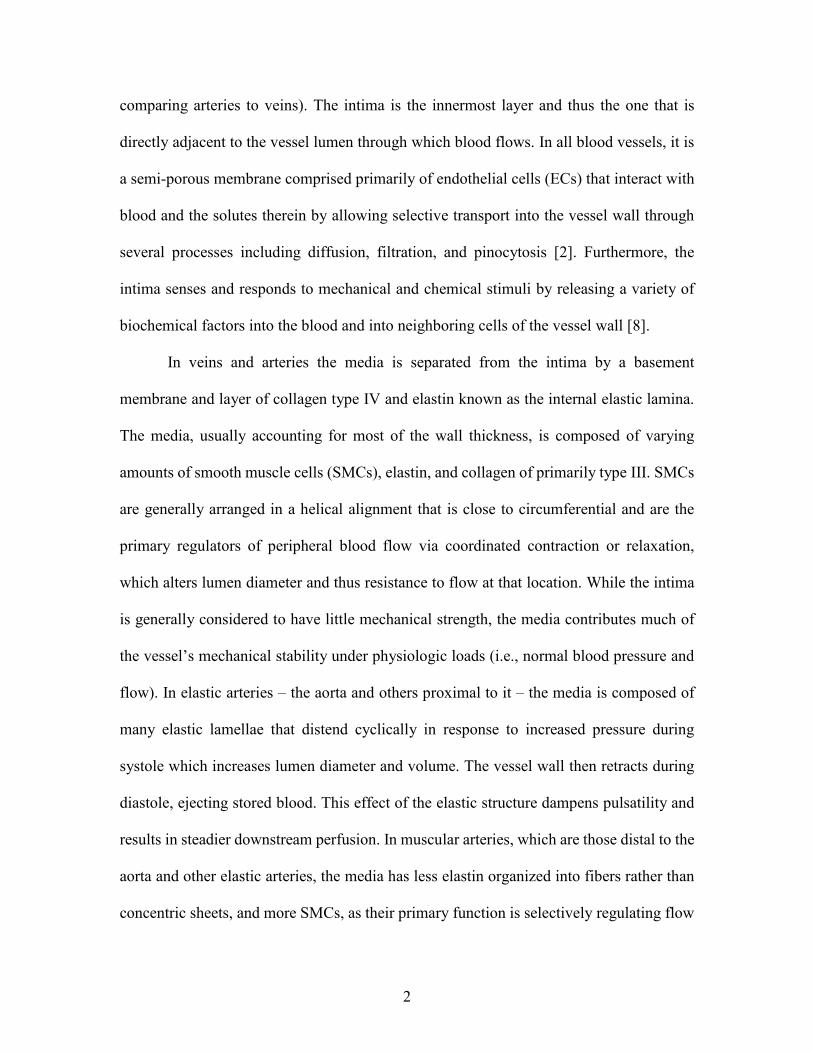
2
comparing arteries to veins). The intima is the innermost layer and thus the one that is
directly adjacent to the vessel lumen through which blood flows. In all blood vessels, it is
a semi-porous membrane comprised primarily of endothelial cells (ECs) that interact with
blood and the solutes therein by allowing selective transport into the vessel wall through
several processes including diffusion, filtration, and pinocytosis [2]. Furthermore, the
intima senses and responds to mechanical and chemical stimuli by releasing a variety of
biochemical factors into the blood and into neighboring cells of the vessel wall [8].
In veins and arteries the media is separated from the intima by a basement
membrane and layer of collagen type IV and elastin known as the internal elastic lamina.
The media, usually accounting for most of the wall thickness, is composed of varying
amounts of smooth muscle cells (SMCs), elastin, and collagen of primarily type III. SMCs
are generally arranged in a helical alignment that is close to circumferential and are the
primary regulators of peripheral blood flow via coordinated contraction or relaxation,
which alters lumen diameter and thus resistance to flow at that location. While the intima
is generally considered to have little mechanical strength, the media contributes much of
the vessel’s mechanical stability under physiologic loads (i.e., normal blood pressure and
flow). In elastic arteries – the aorta and others proximal to it – the media is composed of
many elastic lamellae that distend cyclically in response to increased pressure during
systole which increases lumen diameter and volume. The vessel wall then retracts during
diastole, ejecting stored blood. This effect of the elastic structure dampens pulsatility and
results in steadier downstream perfusion. In muscular arteries, which are those distal to the
aorta and other elastic arteries, the media has less elastin organized into fibers rather than
concentric sheets, and more SMCs, as their primary function is selectively regulating flow

3
to distal tissues. Veins generally have little to no elastin beyond an internal and external
elastic lamina as they experience exclusively steady flow, with a media composed largely
of smooth muscle cells to control blood return to the right atrium of the heart [2,8].
The adventitia is the outermost layer of the blood vessel and is responsible for both
mechanical strength and perivascular interactions. Much of the adventitia is composed of
type I collagen arranged in an undulating pattern, whereby most fibers are arranged axially
but others are circumferentially and helically aligned [8]. Fibroblasts (FBs) are the cells
most closely associated with the adventitia, and they play an important role in extracellular
matrix (ECM) protein deposition, among several other functions; however, the adventitia
is also home to many other cell types, including progenitor cells, nerve cells, macrophages,
T cells, B cells, mast cells, and dendritic cells. Phenotypic plasticity of fibroblasts and other
progenitor cells is particularly important to this work, as such differentiation further
enables remodeling as well as repopulation of damaged tissue [9]. Moreover, in larger
vessels where the intima does not provide a sufficient source of solute transport, the
adventitia is home to a microvasculature that supplies resident vascular cells known as the
vasa vasorum [8].
Broadly speaking, it is important to recognize that blood vessel structure in any
given location along the vascular tree is a result of the functional needs and stimuli applied
throughout development at that location. Furthermore, vascular properties are endowed not
only by the overall composition of cells and ECM but by their specific orientation and
distribution throughout the wall. This results in distinct structure and function for large
groups (e.g., veins, elastic arteries, muscular arteries) as well as variations within those
groups.
4
1.2 CORONARY ARTERY BYPASS GRAFTING
One of the most common – and dangerous – pathologies affecting the vasculature
is coronary artery disease (CAD), characterized by atherosclerosis of the coronary arteries
that supply the heart muscle with the oxygenated blood it needs to maintain normal
function. While other treatment options exist for early stages of CAD, severe cases are
usually treated with a vascular graft(s) to bypass the stenosed section(s) of the coronary
vasculature, which can include the right coronary artery, left main coronary artery,
circumflex artery, and left anterior descending (LAD) coronary artery. These coronary
artery bypass grafts (CABGs) were first developed in the 1960s and have since grown in
use to the point that over 400,000 procedures are performed in the U.S. each year [10,11].
The internal thoracic artery (ITA), radial artery (RA), and great saphenous vein
(GSV) are the most common conduits utilized for CABG, with the gastroepiploic and
epigastric arteries used less frequently. The left ITA, also known as the left internal
mammary or LIMA, provides a unique graft option, as it branches off the left subclavian
artery in situ and runs along the left side of the sternum just superficial to the anterior side
of the heart. When a patient requires bypass of the LAD, the left ITA can thus be used by
leaving the proximal end of the artery intact, freeing a length of the vessel, and making a
single anastomosis beyond the blockage in the LAD (Figure 1.1). This method has become
the consensus first choice bypass conduit, while the right ITA can be used to bypass a
second coronary artery in a similar fashion but is done so less frequently [12,13]. For
CABGs involving the RA, GSV, or other graft conduits, the graft tissue must be fully
excised from its in situ location and implemented in the coronary circulation with two
anastomoses (Figure 1.1 A). Usually the proximal anastomosis is made to the aortic root,
5
while the distal anastomosis is made to the coronary artery beyond the blockage; however,
in some cases surgeons use more complex configurations such as a GSV branching off of
a left ITA (i.e. “Y graft”) or an RA being used to extend a right ITA. A more thorough
discussion of the current considerations that go into graft selection can be found in [7].
Importantly, despite the vast amount of collective experience and incremental
improvements in CABGs over time, approximately 6% of patients – 24,000 people –
experience some level of graft failure within the first year alone [14]. Of these, wide
variations in first year failure rates exist between common graft tissues, with GSVs failing
most often (15.3%), ITAs least often (4.9%), and RAs in between these two (9.8%) [15].
GSVs continue to have the highest rates of failure long term, with 39% losing patency by
10 years post operation [16]. Despite the undesirable rate of failure, GSVs continue to be
an important graft conduit due to their length, appropriate caliber, superficial location, and
redundant circulation, as well as the prevalence of multi-vessel CAD necessitating grafts
beyond the first choice left ITA. Reports suggest that at least 2/3 of CABG patients receive
at least one GSV graft [17,18].
Understanding CABG failure and improving long term graft patency has long been
an important topic of clinical and basic science research. Graft failures are most often the
result of intimal hyperplasia, stenosis of the graft via cell infiltration, proliferation, and
ECM deposition between the media and intima resulting in significant lumen narrowing.
While intimal hyperplasia progression has been well characterized, specific causes and
mechanisms are not as well understood [19–21]. Clinicians and researchers generally agree
that molecular mechanisms, vascular injury, and mechanical factors all contribute to graft
failure and the differential outcomes of various graft conduits. Molecular mechanisms

6
involve the overexpression of growth factors in response to highly altered flows, immune
cell accumulation, and calcification [19,22,23]. Vascular injury can easily occur
perioperatively through mishandling of tissue during graft harvesting and preparation;
specifically, damage to ECs inhibits production of anti-thrombogenic factors, further
initiating inflammatory processes [24]. Mechanical factors leading to graft failure include
compliance mismatch at anastomoses; hemodynamic factors such as disturbed flow at
anastomoses, pulsatility in vein grafts, and altered wall shear stress; and wall structure
incapable of effectively distributing loads in the coronary circulation [15]. As discussed in
greater detail below, the ability of CABGs to adapt to the stimuli present in the coronary
circulation is imperative to their success.
1.3 VASCULAR HOMEOSTASIS AND REMODELING
150 years ago Virchow and contemporaries began to recognize the importance of
cells to effecting changes in tissues [25]. Then in the 1890s, Wolff observed that chronic
changes to the mechanical forces applied to living tissues result in structural changes in
response to the altered stimuli. These observations have been further refined and expanded
over time into the concept of mechanical homeostasis, or the idea that tissues organize
partly in response to the mechanical loads acting upon them to achieve some unknown
stress distribution, maintain this state through regular tissue turnover, and then remodel in
response to chronically altered loads to restore the original homeostatic stress state [26].
Blood vessels are no exception, responding to genetic cues and local loading conditions
through growth and development to distribute hemodynamic loads in the mature state, then
responding to chronic deviations such as endurance training, hypertension, or indeed,
grafting [8,27–29].

7
The primary forces acting on blood vessels and driving growth and remodeling are
the frictional force of flowing blood along the intima, the normal force of pressurized blood
pushing outward on the vessel wall, and axial force along the length of the vessel due to
somatic growth. To more accurately account for how forces are distributed based on an
individual vessel’s geometry and how those forces may be sensed at the cellular level,
vascular mechanics are often considered in a continuum mechanics framework, whereby
stresses describe forces acting on an oriented area. The primary stresses of interest here
are wall shear stress ( w ), circumferential stress ( ), and axial stress ( z ) [8]:
3
4w
i
Q
r
, i
o i
Pr
r r
,
2 2z
o i
F
r r
, (1.1)
where or and ir are the deformed outer and inner radius, the fluid viscosity, Q the
volumetric flow rate, P the pressure, and F the axial force. Following the theory of
mechanical homeostasis, healthy mature blood vessels exist at some homeostatic values of
hw , h
, and , hz , which we collectively refer to as the homeostatic stress state. Thus,
deviations to the homeostatic stress state initiate remodeling processes to regain original
values. While these formulae are simplified mean values of physiological stresses that do
not fully capture the mechanical deformations of the vessel wall, they do provide a general
framework to understand the remodeling processes that might be initiated in response to
chronically altered loads.
As an example of particular relevance here, we might look at the theoretical
remodeling that should occur for a great saphenous vein used a replacement graft for a left
anterior descending coronary artery (Figure 1.2). At approximate in vivo values of Q =
0.17 mL/s and P = 20 mmHg [3], representative experimental values or = 2.35 mm, ir =

8
1.98 mm, and F = 0.409 N (see Chapter 6), and assuming = 4.6 mPa∙s [30], homeostatic
stress values can approximated from (1.1) as hw = 0.13 Pa, h
= 14.2 kPa, and hz = 81.1
kPa. Subjecting the same vessel to conditions characteristic of the coronary circulation
where Q = 0.52 mL/s and P = 100 mmHg [31], representative experimental values
become or = 2.52 mm, ir = 2.18 mm, and F = 0.415 N, and grafted stress values can be
approximated as w = 0.29 Pa, = 84.9 kPa, and z = 82.2 kPa. In this hypothetical
scenario, we can see that w and are increased in the coronary circulation, while z
remains relatively unchanged. Thus, in the absence of other factors and making the
reasonable assumption that and Q are relatively constant, one can see that increasing ir
is the only way that the vessel will restore its homeostatic value of w , which would then
require or to increase at a faster rate than ir – increasing wall thickness – in order to restore
homeostatic levels of . It is worth noting that, while z would have been unchanged
between the two loading environments without remodeling, an increase in wall thickness
would then decrease z , which would create a conflict in this theoretical scenario and
potentially lead to other remodeling processes such as changing fiber orientation, reducing
axial force, or altering axial prestretch [32].
Indeed, significant evidence supports the theory of mechanical homeostasis and
adaptive remodeling. In a canine model of adaptive remodeling, Kamiya and Togawa
demonstrated that veins restore preoperative values of shear rate by increasing vessel radius
in response to increased flow in the graft environment [33], while Langille and O’Donnell
demonstrated that decreasing flow produces a compensatory decrease in diameter [34,35].
More recently, Baeyens and colleagues provide compelling physiological evidence

9
associated with molecular mechanisms to support the concept of a shear stress set point or
homeostatic value that can vary between vessels of different function [36]. Hayashi and
colleagues further show that flow-induced remodeling and restoration of homeostatic w
occurs independently of pressure in a thorough analysis of murine carotid artery
remodeling in vivo, and they similarly show that w restoration through vessel remodeling
occurs in response to lowered flow equally well as increased flow [37].
Matsumoto and Hayashi utilized a murine model to demonstrate normalization of
hoop (i.e., circumferential ) stress through wall thickening in response to hypertension
[28], and this finding has been corroborated in hypertensive veins as well [38]. More
recently, Matsumoto and colleagues show that, in an arteriovenous shunt of the common
carotid artery, rabbit carotids maintain a relatively constant hoop stress despite increased
ir in response to increased Q [39]. Fridez and colleagues show similar results of eccentric
hypertrophy, with thickness increasing while ir remains constant; however, by analyzing
temporal adaptations over 56 days, they also demonstrate that the stress-strain response
shifts such that the vessel is compliant about the higher postoperative pressures [40]. In a
study of hypertensive porcine coronary veins, Choy and colleagues show a compensatory
thickening of the vein in response to increased that is localized to regions that are not
supported by perivascular tissue, further supporting that local stresses drive local
remodeling [41].
Axial stress ( z ) homeostasis has generally been given less scrutiny than w and
by researchers. While Q and P can be selectively modulated relatively easily through
knockout models, therapeutics, and surgical procedures such as banding to evaluate

10
remodeling outcomes, F is not as easily modulated without affect other stimuli, and F
is also not intuitively associated with altered hemodynamics in the same way as the other
parameters. As part of a series on vein graft experiments in dogs, Dobrin and colleagues
overstretched end-to-end vein grafts and found that overstretching increased unstretched
length after three months and led to insignificant wall thickening without intimal
hyperplasia [42]. Qualitatively, this suggests a reduction in z from the acute grafted state
to experimental end point, but the axial stress data was not quantified. While significant
evidence supports at least partial maintenance or restoration of hw and h
, in studies where
Q and P have been altered resulting in morphometric adaptations neither z nor axial
strain were maintained [39,43]. More investigations have been undertaken in ex vivo tissue
culture experiments, whereby researchers have additional freedom to manipulate axial
loads which are discussed below [44].
In addition to remodeling resulting from the three primary stresses described above,
consideration must also be given to the cyclic stresses resulting from pulsatility in the
arterial circulation, as each of the parameters described above can vary throughout the
cardiac cycle. For example, Powell and Gosling synthesize the findings of several relevant
studies to conclude that minimizing circumferential strain via external stenting ameliorates
progression of intimal hyperplasia and medial thickening [45]. On the other hand, Eberth
and colleagues demonstrated in a series of murine banding models that increased pulsatility
has significant effects on remodeling processes and mechanical properties, even when there
is little change to mean values of flow and pressure [46,47]. For CABG to be successful,
especially those involving GSVs, grafts must adapt not only to altered mean values of
stresses and strains but also altered cyclic loads due to unique coronary hemodynamics.

11
1.4 MECHANOTRANSDUCTION IN GRAFT REMODELING
Mechanotransduction is the process by which cells sense and respond to mechanical
forces acting upon them via cell-cell junctions, ECM attachment, and internal cytoskeletal
proteins, and respond via a variety of processes including release of kinases, transcription
factors, protein synthesis and remodeling, cell differentiation, cell migration, and cell
proliferation [48–50]. Researchers have explored many pathways by which vascular cells
sense and respond to stimuli in the context of CABG and have found numerous
mechanisms implicated in the upstream signaling leading to eventual adaptive remodeling
or pathological maladaptation, with methods spanning cell culture, tissue culture, and in
vivo experimentation [51,52]. To better understand the clinical and remodeling outcomes
described above and to craft new strategies for improving grafts, one must understand the
underlying processes and stimuli affecting graft adaptation.
ECs have received the most attention with respect to mechanotransduction, as they
directly sense w , , and z , although ECs in the intima of blood vessels were long
considered to only have a passive role in preventing thrombosis until Hollis and Bolitho
discovered that vascular ECs secrete biomolecules in response to mechanical stimulation
[53]. Since then, researchers have shown many differential responses in relation to Q and
w : static versus steady flow (e.g., Malek, Greene, & Izumo, 1993; Shyy, Hsieh, Usami,
& Chien, 1994), low versus high shear [56], laminar versus turbulent flow [57], oscillatory
versus pulsatile flow [58], and steady versus pulsatile flow (e.g., Blackman, García-
Cardeña, & Gimbrone, 2002; Hsiai et al., 2003). A large body of research is also built
around the effects of cyclic stretch (and thus ) on ECs: uniaxial versus biaxial planar
stretching [61], magnitudes of uniaxial cyclic stretching [62], and combining shear stress
12
with cyclic circumferential stretch [63]. These phenomena have been synthesized and
reviewed in detail by several authors [48,64–66].
Similarly, robust data describes mechanotransduction in vascular SMCs and FBs.
Leung and colleagues found that stretching of blood vessels induces collagen deposition,
suggesting not only signaling but protein deposition within the vessel wall in response to
mechanical stimuli [67]. Leung et al.’s findings highlight an important distinction between
ECs in the intima and SMCs and FBs in the media and adventitia; mechanotransduction in
ECs primarily signals other processes through biochemical activity, while SMCs and FBs
are involved in direct ECM remodeling with a lesser role in mechanotransduction. In other
words, while the intima contributes negligible mechanical stability, medial and adventitial
homeostasis are dependent on intact EC signal transduction [68,69]. These collective
findings provide further evidence supporting both the importance of functional
endothelium in CABGs and the delicate balance necessary to signal and effect graft
adaptation without promoting maladaptation.
The effects of the intricacy of pulsatile pressure and flow waves on remodeling
outcomes must also be considered. Well characterized hemodynamic differences exist
throughout the vascular tree, particularly in the arterial circulation [70–72], and previous
research has demonstrated synthesis of vasoreactants in response to variable oscillatory
flow conditions [58]. Further, deviations from physiological hemodynamics can lead to
deleterious pathologies [73]. Preliminary evidence demonstrates a differential response to
intricacies of flow waveforms beyond the fundamental frequency. For example, Dai and
colleagues demonstrate that cultured human ECs exhibit differential gene expression and
functional characteristics following exposure to pulsatile shear stress characteristic of two

13
regions along the carotid artery [74]. Feaver and colleagues further demonstrate the
sensitivity of inflammation pathways within cultured ECs to individual harmonics of the
Fourier transform of human carotid artery flow waves [75]. As the mechanisms and
implications of this hemodynamic sensitivity have not been fully explored, further
exploration is necessary to understand the level of biomimetic replication necessary to
maintain or restore homeostasis and to elucidate the specific signaling and gene expression
mechanisms that support such processes.
1.5 EX VIVO TISSUE CULTURE
Studying vascular remodeling presents a logistical challenge, as plated cell-based
experiments inherently change the microenvironment and thus the stimuli acting on
vascular cells, while in vivo experiments in humans or animals are limited in their ability
to isolate and control individual stimuli. Vascular tissue culture poses its own unique set
of challenges but generally provides an acceptable compromise between freedom to test
and observe hypotheses while maintaining a 3D loading environment and similar
mechanical parameters. Some issues with ex vivo models of vascular remodeling in general
include loss of vasa vasorum, loss of innervation, and surgical manipulation; however, for
studying CABG adaptations these factors are the same in clinical procedures. An additional
point of consideration for ex vivo tissue culture is the absence of immune cells such as
macrophages that play a role in injury response and graft adaptation.
Many groups have utilized forms of ex vivo tissue culture to assess vascular
remodeling. Early studies focused on very short term effects – 24 hours or less – such as
endothelial permeability [76] and cholesterol content [77]; however, studies quickly moved
to longer time points, including demonstrating viability for almost one month depending

14
on the applied conditions [78]. Ex vivo culture also affords the ability to investigate gene
expression and protein synthesis in response to specific stimuli [79,80,52,81]. Ex vivo
culture has also found that both active and passive mechanical changes due to remodeling
occur as early as 3 days after chronically altered stimuli [82].
Many ex vivo culture apparatus to date have utilized some form of roller pump that
outputs nonspecific pulsatile flow [83] or dampened, mostly steady flow [84]. However,
considering the sensitivity of vascular cells to specific flow and pressure waveforms, ex
vivo tissue culture may also be affected by applied fluid dynamics from bioreactor pumps.
Several groups have described models methods to model and recreate biomimetic
waveforms [85–89], and still others have developed experimental apparatus capable of
recreating physiological flows on the benchtop [90–93]. Few bioreactors for ex vivo tissue
culture have incorporated this level of biomimetic fidelity, and such attention to detail may
well become more important as we continue to learn about the effects of hemodynamic
specificity on vascular remodeling.
1.6 CABG TISSUE CULTURE
Ex vivo tissue culture experiments relating to CABG are of particular interest to in
this dissertation. Several groups have used ex vivo tissue culture to understand vein graft
failure, utilizing the tunability of ex vivo culture systems to isolate the effects of specific
stimuli. In a series of experiments, Gusic and colleagues evaluated GSVs after 7 days under
a variety of flow conditions, finding that ramping applied pressure over 7 days leads to a
greater increase in wall thickness than acute exposure to arterial conditions and alteration
stress-strain relationships, while acute exposure to graft conditions leads to endothelial
denudation and cell death [84,94]. Another research group has published a series of

15
investigations based on 7 and 14 day human saphenous vein cultures, showing that intimal
thickening is stimulated within 7 days of ex vivo culture under arterial conditions, and
expression of MMP2, MMP9, TIMP1, and PAI-1 are all increased by arterial shear stress
[52,95,96]. In a separate research group, shorter investigations with human saphenous
veins (1-4 days) have demonstrated loss of cell density, apoptosis, and induction of
cytosine-rich protein (CRP3/MLP) that influences cell proliferation, with CRP3/MLP
being correlated with increased circumferential stretch but not wall shear stress [97,98].
Dummler and colleagues compare viability of human saphenous veins under venous and
arterial ex vivo culture conditions, finding that GSVs under venous conditions survive for
up to 14 days but die by 8 days under arterial conditions while upregulating MMP2
expression [83].
In another series of investigations, Piola, Prandi, and colleagues have perhaps taken
the broadest range of observations about the effects of CABG-like tissue culture on human
saphenous veins. In 7 day experiments, GSVs cultured under arterial conditions show wall
thinning, rearranging muscle fibers, and partial endothelial denudation [99]. Similar 7 day
experiments went on to demonstrate differential expression of remodeling-associated
genes and microRNAs, increased vasa vasorum density, and increasing presence of
progenitor cells due to coronary loading conditions. Another creative investigation
demonstrated that a trans-wall oxygen gradient mimicking grafted conditions triggers cell
proliferation in the vasa vasorum, which could be an upstream factor in restenosis [100].
To the best of our knowledge, two CABG tissue culture experiments have
incorporated recreation of physiological flow waves into their bioreactors. Voisard and
colleagues use a Windkessel model to compare the effects of arterial versus venous

16
waveforms on human GSVs, demonstrating reactive cell proliferation starting at day 4 as
well as media thinning. Recent work from Piola and colleagues also cultured human GSVs
under biomimetic coronary conditions, demonstrating medial thinning, endothelial
denudation, and apoptosis that aligned with their earlier work [101]. Further
experimentation will be necessary to determine whether accurate replication of
physiological flow and pressure waves has a differential effect from steady flow or simple
sinusoid flow patterns.
1.7 SUMMARY
Blood vessel structure, mediated by resident vascular cells, is inherently linked to
applied mechanical loads in a given circulatory environment, especially axial force and
oscillatory pressure and flow. Large, chronic alterations to those loads trigger remodeling
processes within blood vessels, which, in the case of CABGs, results in either successful
remodeling adaptation to the coronary circulation or unsuccessful, maladaptive remodeling
and eventual graft failure. In this dissertation, we aim to understand why failures occur
differentially across CABG tissues through (i) mechanical characterization and comparison
of graft vessels in their native state and under coronary loads (Chapter 2) and (ii)
observation of early biological response of graft vessels subjected to coronary loads ex
vivo to explore whether remodeling capacity is similar across graft vessels (Chapter 3). We
then aim to build upon that knowledge and build upon previous literature to improve
adaptive remodeling of graft vessels through stepwise manipulation of graft loading
conditions over an extended culture period (Chapter 6).
In most previous ex vivo tissue culture investigations, precise replication of
physiological flow and pressure waves is neglected, which may affect growth and

17
remodeling processes. To better understand the importance of biomimetic pulsatility and
facilitate graft development going forward, we design and validate a bioreactor capable of
replicating arterial fluid dynamics (Chapter 4). Future translational application of this work
may likely include guided ex vivo culture toward tissue engineering of graft vessels, with
decellularized and reseeded xenografts being one potential candidate for ex vivo culture
applications. As an example of a potential catalog of xenograft scaffolds, we mechanically
characterize carotid arteries across several mammalian species (Chapter 5). As a whole,
this dissertation seeks to better understand why CABGs fail and explore avenues for future
graft improvement through mechanical stimulation in ex vivo tissue culture.
18
1.8 FIGURES
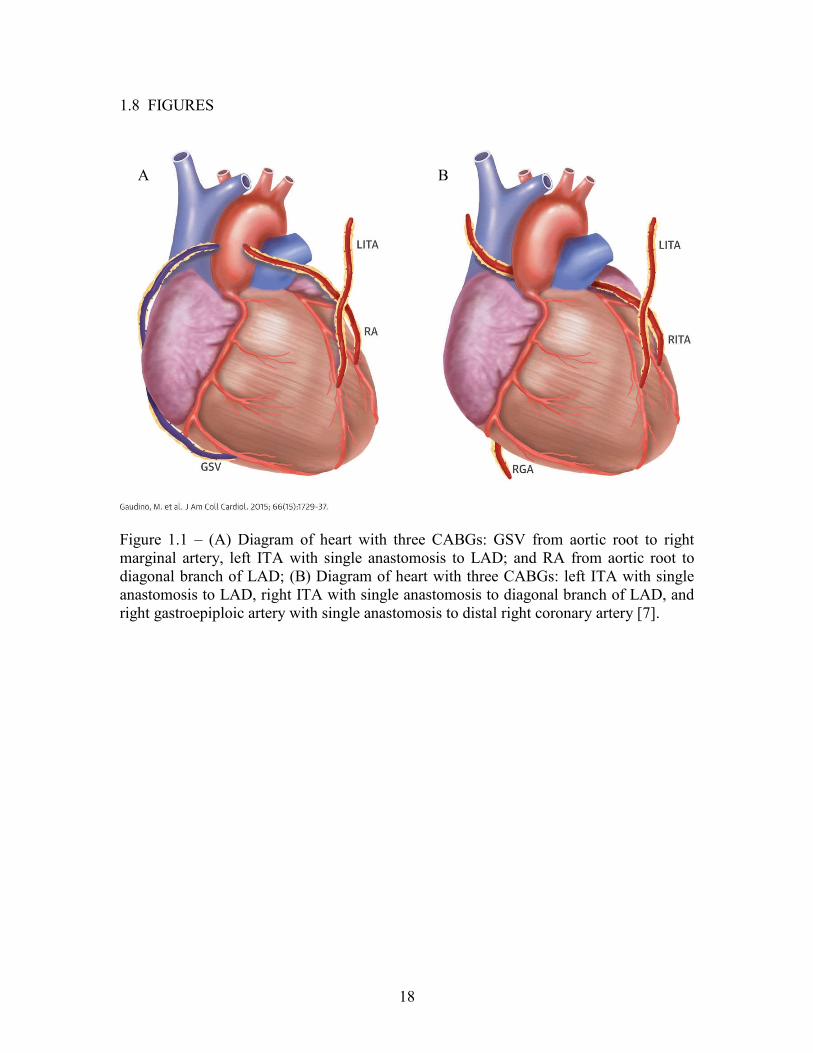
Figure 1.1 – (A) Diagram of heart with three CABGs: GSV from aortic root to right marginal artery, left ITA with single anastomosis to LAD; and RA from aortic root to diagonal branch of LAD; (B) Diagram of heart with three CABGs: left ITA with single anastomosis to LAD, right ITA with single anastomosis to diagonal branch of LAD, and right gastroepiploic artery with single anastomosis to distal right coronary artery [7].
A B

19
Figure 1.2 – Hypothetical remodeling of GSV to restore in vivo homeostatic values of hw
and h under coronary loading conditions ( Q = 0.52 ml/s, P = 102 mmHg): (A) scale
diagram of native GSV deformed under coronary loads, and (B) scale diagram of GSV remodeled to restore homeostatic stresses.

20
CHAPTER 2
A MECHANICAL ARGUMENT FOR THE DIFFERENTIAL PERFORMANCE OF
CORONARY ARTERY GRAFTS1
1 Prim, D. A., Zhou, B., Hartstone-Rose, A., Uline, M. J., Shazly, T., & Eberth, J. F. (2016). Journal of the Mechanical Behavior of Biomedical Materials, 54, 93–105. http://doi.org/10.1016/j.jmbbm.2015.09.017
Reprinted here with permission of publisher.

21
2.1 ABSTRACT
Coronary artery bypass grafting (CABG) acutely disturbs the homeostatic state of
the transplanted vessel making retention of graft patency dependent on chronic remodeling
processes. The time course and extent to which remodeling restores vessel homeostasis
will depend, in part, on the nature and magnitude of the mechanical disturbances induced
upon transplantation. In this investigation, biaxial mechanical testing and histology were
performed on the porcine left anterior descending artery (LAD) and analogs of common
autografts, including the internal thoracic artery (ITA), radial artery (RA), great saphenous
vein (GSV) and lateral saphenous vein (LSV). Experimental data were used to quantify the
parameters of a structure-based constitutive model enabling prediction of the acute vessel
mechanical response pre-transplantation and when loaded as an LAD replacement graft. A
novel metric Ξ was developed to quantify mechanical differences between each graft vessel
in situ and the LAD in situ, while a second metric Ω compares the graft vessels in situ to
their grafted state in the coronary vasculature. The relative values of these metrics among
candidate autograft sources are consistent with vessel-specific variations in CABG clinical
success rates with the ITA as the superior and GSV the inferior graft choices based on
mechanical performance. This approach can be used to evaluate other candidate tissues for
grafting or to aid in the development of synthetic and tissue engineered alternatives.
2.2 INTRODUCTION
Coronary artery grafts bypass (CABG) can restore long-term myocardial perfusion
following advanced-stage coronary artery disease [102]. Annually more than 400,000
CABG procedures are performed in the United States alone. The health care cost of these
CABG procedures is close to 200 billion USD [103,104]. Despite decades of improvements
22
to surgical techniques, approximately 6% of all CABGs fail in the first year, putting
patients with compromised cardiovascular systems at greater risk of myocardial infarction
and other pathologies [14]. Failure rates depend strongly on the source tissue. For example,
when collated from large clinical outcomes 15.3% of great saphenous veins fail in the first
year while only 4.87% of internal thoracic failures occur [105–117]. By comparison, when
used as a CABG graft, the radial artery has first year failure rates around 9.78% [105–117].
Although numerous factors contribute to the differential response, the mechanical
mismatch of the grafted vessel with the host environment likely underlies a multitude of
etiologies including ischemia, hemorrhage, dissection, inflammation, and restenosis
[42,118,119].
Grafted vascular tissue must undergo an adaptive growth and remodeling process
to retain optimal performance under the new mechanical loads imposed by the coronary
circulation including altered blood pressure, flow, and axial force [32,33,46,120,121].
These loads generate mechanical signals that are sensed by vascular endothelial, smooth
muscle, and fibroblast cells eliciting gene expression pathways that lead to microstructural
adaptations and tissue reorganization [48]. Stress provides a continuum mechanics-based
metric to assess the effects of loading on the local mechanical environment of vascular
cells, specifically intramural stresses that act in the circumferential and axial directions as
well as flow induced wall shear stresses acting on the endothelial-lined lumen [8,122].
Biaxial mechanical testing, typically inflation and extension of a tubular tissue sample, and
subsequent data processing in the framework of finite elasticity are necessary to quantify
the intramural stresses in the vessel wall [8]. Wall shear stress on the other hand, is
dependent on the flow velocity profile and exponentially related to the vessel’s radius, a

23
structural property. Compliance provides an additional structure-based measure that is
fundamental to a graft’s performance in a pulsatile environment. Collectively, these passive
mechanical responses are determined by the geometry, orientation, and composition of the
extracellular matrix proteins present in the wall [123–125].
Currently, the most common tissue sources for grafting to the left anterior
descending coronary artery (LAD) include the internal thoracic (also known as the internal
mammary) artery (ITA), radial artery (RA), and great saphenous vein (GSV)
[13,18,102,113]. The anatomical and functional location of each graft vessel (i.e., ITA,
RA, and GSV) along the vascular tree (Figure 2.1) determines the native mechanical
loading environment, which, in concert with vessel-specific properties, give rise to a
vessel-specific homeostatic state. For example, the LAD and ITA nominally experience
highly pulsatile blood flow, and as a result exhibit high mechanical compliance to dampen
pulsatility and reduce cardiac preload [2,126]. The RA is subjected to slightly lower blood
pressures but less pulsatility than the LAD and ITA, resulting in a less compliant and more
muscular structure [127,128]. The GSV and LSV are subjected to substantially lower
pressures across a more narrow range, giving rise to a venous architecture that is
structurally and compositionally different from its arterial counterpart [2,83,129–131].
Concatenate with hemodynamic loading, somatic growth influences these tissues to
experience in situ axial load [32]. This manifests as an axial extension as evidenced by an
immediate retraction upon excision to relieve the axial force. These axial loads are very
different than the neutral axial loads surgeons create during a CABG procedure [132].
The differential performance of CABG grafts have been highlighted in numerous
clinical studies that include long-term metrics such as graft patency [18,110,113],

24
reintervention rates [107], case-matching [107,133], and meta-analysis [13,18]. These
studies identified the ITA as the superior performer in terms of clinical outcomes due to its
anatomical position – descending from the subclavian and running very close to the heart
in its normal anatomical position – requiring only one site of anastomosis to achieve
coronary perfusion [102]. In many cases however, the ITA is not available and a second
source tissue needs to be selected. GSV grafts were historically the preferred choice due to
their superficial anatomical position, non-branching morphology, and comparable caliber
to coronary arteries [113,134]. Other autologous source tissue options include RAs and
GSVs, and far less commonly the right gastroepiploic artery or inferior epigastric artery
[110,112]. RAs have similar caliber and have superficial location, but RAs suffer from
susceptibility to vasospasm, calcification, intimal hyperplasia, and are relatively poor in
patients with peripheral artery disease [135].
Here we investigated if mechanical differences among autologous vascular tissue
sources, particularly under pre- and post-grafting loading conditions, correspond with
differences in clinical outcomes. To this end, we quantified the passive mechanical
response of the healthy porcine LAD and a host of candidate vessels used as LAD
replacement grafts under uniform LAD loads. Obtained mechanical data were processed
in a continuum mechanics-based framework, enabling prediction of each vessel’s
mechanical response under varied loading conditions. Vessel-specific mechanical metrics
that account for changes caused by grafting were developed and found to correlate with
reported clinical outcomes. Our findings help explain differential outcomes following
autologous grafting in the coronary artery and can be extended towards the development

25
and assessment of other grafting alternatives (i.e. alternative tissue sources and tissue
engineered materials).
2.3 MATERIALS AND METHODS
2.3.1 Tissue Acquisition and Handling
All porcine tissue was obtained fresh from a local abattoir and dissections were
performed immediately following tissue acquisition. Isolated blood vessels included the
LAD, ITA, RA, GSV, and an additional vessel, the lateral saphenous vein (LSV) (Figure
2.1). While there is no true translational equivalent to the porcine lateral saphenous vein in
humans, it is included due to its prevalence in other veterinary studies and similar caliber
to the porcine great saphenous vein. American Yorkshire pigs were used in this study and
all animals were 6 month old ± 1 week. All target vessels were dissected as a set from the
same animal (n=6), and animal weights ranged from 102-113 kg. Upon dissection each
vessel was stored in a sterile solution of 1% phosphate buffered saline (PBS) and
refrigerated until mechanical testing could be performed, which was always within 24
hours of tissue dissection.
2.3.2 Biaxial Mechanical Testing
Mechanical testing was carried out using a Bose BioDynamic 5270 biaxial
mechanical testing device. Vessels were cut to approximately 20 mm tubular sections, and
initial measurements were taken of the unloaded length, outer diameter, and wall thickness.
All measurements were made along the middle section of each vessel to avoid extreme
conditions at proximal and distal ends. Each vessel was mounted into the testing chamber
of the biaxial testing device; the chamber was filled with Krebs-Henseleit solution (37 deg
C and pH 7.4); and sodium nitroprusside (10-5 M) was flushed through the vessel and

26
device tubing at 60 mL/min to elicit the fully relaxed (passive) state of the SMCs and to
remove all air from the flow loop.
Each vessel was axially extended by approximately 40% of the unloaded length at
a displacement rate of 0.01 mm/s and pressures of 60 mmHg, 100 mmHg, and 140 mmHg.
The in vivo axial stretch ratio was then determined to be the intersection of resultant axial
force vs. displacement curves. This phenomenological observation of in vivo axial stretch
has been documented historically and in our prior work [136,137]. Each vessel then
underwent five cycles of pressurization for preconditioning, helping to ensure reproducible
results. For data collection, pressure was increased from 20 to 200 mmHg at a constant rate
of approximately 1.3 mmHg/s while pressure-outer diameter and pressure-longitudinal
force curves were recorded at an axial stretch ratio below the in vivo value. Data collection
was then carried out at the approximated in vivo stretch ratio and again above the in vivo
stretch ratio. Between tests, axial displacement was increased at a rate of 0.01 mm/s, and
the vessel was allowed to acclimate for 15 minutes at the new stretch ratio. Each test was
repeated three times [137,138].
2.3.3 Zero Stress State
A radial, stress-relieving cut was made into 1 mm thick ring sections taken from
the middle region of each vessel following mechanical testing [120]. This radial cut causes
ring sections to spring open into a sector. After allowing 30 minutes in PBS for each vessel
to equilibrate, a digital image was taken of the resultant open sector using a Nikon Coolpix
s3500 (resolution of 20 m/pixel). Image-Pro 6.0 image analysis software was used to
measure the sector thickness H , inner arc length iL , and outer arc length oL . From these
data, cross-sectional area A and opening angle Ф of the sector were calculated using
27
2
i o
AH
L L
and
2o iL L
ФH
. [2.1]
Collectively, these data enable quantification of the zero stress state for each sample.
2.3.4 Data Analysis
Vessels are assumed to be 3-D thick-walled cylindrical tubes that experience an
axisymmetric finite elastic deformation under applied pressure and longitudinal extension.
Neglecting the contribution of vascular smooth muscle cells, the passive mechanical
properties of vessels depend predominantly on the properties, amount, and spatial
arrangement of collagen and elastin in the vessel wall. Through mechanical testing, sample
luminal pressure P and axial stretch z were controlled, and response data for the
deformed outer radius or and axial force F were recorded. Under the assumption of tissue
incompressibility, the deformed inner radius ir is calculated as:
2i o
z
Ar r
. [2.2]
Likewise, the lumen area compliance is calculated as:
2ircP
. [2.3]
The average circumferential and axial z wall stresses are calculated as:
i
o i
Pr
r r
,
2 2z
o i
F
r r
. [2.4]
The mid-wall circumferential and axial z stretch ratios provide wall strain measures,
and are calculated as:

28
2 i o
i o
r r
L L
, z
l
L , [2.5]
where l and L are the deformed and undeformed vessel lengths, respectively.
2.3.5 Theoretical Framework
For inflation and extension of an axisymmetric tube, its deformation is characterized by
the right Cauchy-Green strain tensor
2 2
2, , z
dr rC diag
dR R
,
Ф
, [2.6]
where r and R are the radial coordinates of an arbitrary point within the vessel wall
before and after deformation.
Due to the incompressibility of the vessel wall
1 z
dr r
dR R , [2.7]
which after integration yields
2 2 21 o o
z
r r R R
. [2.8]
Given the zero-stress configuration, axial stretch ratio, and the deformed outer
radius, the components of the strain tensor can be completely described. A diagrammatic
representation of the zero-stress state and deformed configurations can be found in Zhou
et al. (2013) and is consistent with that of other researchers (e.g., Matsumoto and Hayashi
(1996)) [43,138].
We use an analytical form of the strain energy function, whereby stress and stretch
are related by the energy stored in the vessel wall as it is distended [29,139]. This strain
energy function was first described by Holzapfel and colleagues [5,8]:

29
2
222 2 2 2 2 21
0 2
1 4 2
3 exp sin cos 1 14 2
c k
e z z k k z k
k k
bW b b
b
[2.9]
The constitutive model of equation [2.9] is a microstructural motivated strain-energy
function. The first collection of terms and material constant 0b describe the isotropic, neo-
Hookean contribution of an elastin-dominated, non-collagenous extracellular matrix
[5,140–142]. The second term describes the anisotropic contribution of four collagen fiber
families, where subscript k denotes a particular family of fibers oriented at a mean angle
of k with respect to the longitudinal axis with material constants 1kb and 2kb . As shown,
the four-fiber family model with 8 independent parameters gives an excellent
representation of biaxial mechanical data without being over parameterized [143]. In this
model, the contributions of passive smooth muscle cells to the overall mechanics have been
neglected. Considering the circumferential or diagonally oriented smooth muscle cell
orientation [144], the effect is difficult to isolate from the dominant anisotropic collagenous
structure [145]. In this model 1 = 90 deg represents circumferentially oriented fibers, and
2 = 0 deg represents axially oriented fibers. Additionally, 3 4 represents
diagonally oriented fibers, with the value for obtained from the model. Accordingly,
the stress-like and dimensionless parameters for these fiber families are equivalent so that
31 41b b and 32 42b b respectively. is the area fraction of e elastin or c collagen
compared to the total tissue as determined through histological analysis.
Any deformed configuration characterized by the deformed outer radius and axial
stretch ratio is realized by imposing pressure, and axial force, from a given inner arc length,

30
outer arc length, and opening angle in the zero-stress state and strain energy function W
so that
o
i
r
r
W drP
r
, 2
o
i
r
z
zr
W WF rdr
. [2.10]
Using data obtained through our mechanical testing and zero-stress state
measurements, the material constants of the constitutive model were found for each vessel.
The material parameters associated with the constitutive model were determined via non-
linear regression of equation [2.10] which was implemented in Matlab 2010b (Mathworks.
Inc) using the lsqnonlin subroutine. The lower and upper limits of the parameters were
prescribed as 0b and 1kb ∈ [0, 105], 2kb ∈ [0, 10], and ∈ [0°, 90°]. The constitutive
model was then used to predict the deformed configurations, stretch ratios, and average
transmural stresses under prescribed, in situ and coronary, loading conditions.
The in situ and grafted loads include both transmural pressure and axial force. The
value of in situ pressure for the LAD, ITA, RA, GSV, and LSV was taken from the
literature (Table 2.3) and represents a rough estimate of the mean value throughout the
cardiac cycle [83,126,127,129]. For example, a pressure of 100 mmHg was selected as a
loading condition for the LAD. In situ force, on the other hand, was determined as a result
of biaxial testing. The grafted coronary loads for the ITA, RA, GSV, and LSV were the
values of the pressure and axial force of the LAD.
2.3.6 Histological Analysis
Upon completion of mechanical testing, sections of each vessel were fixed in 4% fresh
paraformaldehyde, followed by embedding in paraffin wax. Sections approximately 5 µm
thick were stained with a combination of Verhoeff’s elastic and Masson’s trichrome stain

31
[146]. All vessels were sectioned and stained together to prevent batch-to-batch variations.
Images were obtained using a Nikon E600 microscope with CCD camera and computer
interface with Q Capture (QImaging). Each tested tissue was imaged at 4-6 different
locations and the best representative image was selected for each tissue to be used for
thresholding analysis. Mean and standard deviations for each group were therefore found
from a sample size of n=6. Area fractions occupied by black, blue, and red pixels were
quantified using ImageJ software (NIH) with the “Threshold_Colour” plugin, which serves
to estimate fractions of elastin, collagen, and smooth muscle in each vessel, respectively
[147]. In an effort to maintain consistency across samples, unstained pixels were not
considered, and threshold values were fixed. Black pixels were quantified using a bandpass
filter from Brightness 0 – 83; blue pixels were quantified using a bandpass filter from
Brightness 83 – 255 and Hue 33 – 230; and red pixels were quantified using a bandpass
filter from Brightness 83 – 255 and bandstop filter from Hue 33 – 230. Thus, the sum of
these areas was approximately 100% for each sample, and the contribution of other
constituents (e.g., ground substance) was assumed to be negligible.
2.3.7 Comparison of Native and Grafted States
The normalized difference between each vessel (i.e., ITA, RA, GSV, LSV) in situ
( IS ) and the left anterior descending artery ( LAD ) in situ for inner radius, compliance,
circumferential stress, and axial stress are described by
2
IS LAD
i i
ri IS LAD
i i
r r
r r
,
2
IS LAD
c IS LAD
c c
c c
,
2
IS LAD
IS LAD
,
2
IS LAD
z
z IS LAD
z
zz
. [2.11]
32
Likewise, the normalized difference between ( IS ) and that same vessel used as a
replacement graft for the LAD for end-to-end anastomosis under coronary loading
conditions (G ) is calculated in a similar manner to [2.11] by
2
IS G
i i
ri IS G
i i
r r
r r
,
2
IS G
c IS G
c c
c c
,
2
IS G
IS G
,
2
IS
z
z IS
z
G
z
G
z
. [2.12]
Summing the above expressions generates three overall mechanical remodeling utility
scores
ri c z and ri c z . [2.13]
Here values closest to zero indicate the smallest differences.
2.3.8 Statistics
Statistical analysis was performed with a two-tailed paired t-test and one-way or
two-way ANOVA using GraphPad Prism 3.02 (San Diego, CA, USA). Dunnet’s post-hoc
test was used for multiple comparisons to the control. Statistical significance was taken at
a level of p < 0.05.
2.4 RESULTS
2.4.1 Blood Vessel Histology
The microstructure of the vessels used in our comparative analysis varies
considerably in spatial organization between anatomical locations, a feature reflective of
its functional and native environment (Figure 2.2, Figure 2.3). Of note, the proximal LAD
(Figure 2.2A) and ITA (Figure 2.2C) show numerous circumferentially oriented elastic
lamellae in the media, whereas elastin is only somewhat evident in the media of the distal
LAD (Figure 2.2B). Elastin is present exclusively as internal and external elastic laminas
in each of the RA, GSV, and LSV vessels (Figure 2.2D, E, and F, respectively). Despite

33
these apparent differences, the only statistical significance in overall elastin content of any
graft vessel and the LAD ( e =0.14 ± 0.12) was for the ITA ( e =0.30 ± 0.08) (Figure 2.3)
while the collagen and smooth muscle fractions of the RA ( c =0.15 ± 0.07; smc =0.80 ±
0.10) and GSV ( c =0.18 ± 0.08; smc =0.74 ± 0.08), were found to be statistically different
than the LAD ( c =0.34 ± 0.06; smc =0.52 ± 0.06).
2.4.2 Zero Stress State and Material Parameters
Table 2.1 shows the measurements obtained for the stress-free configuration of
each vessel following biaxial testing. In the nearly zero stress state, the opening angle,
responsible for homogenizing the circumferential stress through the vessel wall, was not
found to be statistically different for any of the potential graft vessels and the LAD. There
was however, statistical significance between the stress-free wall thickness of the ITA ( H
= 0.55 ± 0.06 mm) and LAD ( H = 0.88 ± 0.11 mm). The RA and GSV were also found to
be different from the LAD in terms of both inner (LAD = 10.4 ± 1.45; RA = 4.65 ± 1.21;
GSV = 6.06 ± 1.74 mm) and outer (LAD = 13.8 ± 1.53; RA = 8.70 ± 1.63; GSV = 9.84 ±
2.32 mm) arc lengths. Based on these biaxial testing data and stress-free measurements,
the material parameters for the constitutive model were calculated and are shown in Table
2.2. Parameter 11b , representing the stress-like parameter in the exponential form for
circumferentially oriented fibers, is significantly lower for the LSV than other vessels.
Parameter 21b is significantly different between the RA and LAD; this represents the stress-
like parameter in exponential form for axially oriented fibers. The parameter for diagonally
oriented fibers – 31b – is significantly different between the RA and LAD.

34
2.4.3 In Situ Structural and Mechanical Values
A representative sample of the measured pressure-inner radius relationship at in
situ conditions for each vessel shows similar behavior amongst the ITA, RA, GSV, and
LSV (Figure 2.4A) while the LAD has a consistently larger lumen radius than the potential
graft vessels. The GSV (IS
ir =0.70 0.39 mm) and LSV (IS
ir =1.54 0.73 mm) in situ radii
(Table 2.3) were found to be different from the LAD (IS
ir =2.29 0.38 mm). In situ area
compliance can be interpreted from the tangential slope of Figure 2.4A and is shown in
Table 2.3. Compliance values however, were not found to have statistical significance.
When comparing the axial force-axial distension at in situ pressures, the LAD fell within
the group of tested blood vessels (Figure 2.4B) and the only statistically different in situ
axial force from the LAD ( ISF =0.4 ) was the LSV ( ISF =0.16). The in
situ circumferential stretches were statistically significant between the GSV (IS =0.93±
0.09) and LSV (IS =1.12± 0.14) compared to the LAD (
IS =1.31 ± 0.26) while axial
stretches were not.
When circumferential stress-stretch is plotted (Figure 2.4C) an overall increasingly
stiffer behavior is demonstrated at higher stretches especially for the ITA and LAD. Note
that all data in Figure 2.4C is shown at the in situ axial stretch which is measured from the
unloaded state therefore axial stretches less than 1 are possible. Dramatic differences in the
in situ circumferential stresses were observed for the RA (IS =14.3± 3.1 kPa), GSV (
IS
=3.66± 0.67 kPa), and LSV (IS =7.40± 3.36 kPa) compared to the LAD (
IS =66.7 ±
39.3 kPa). The in situ axial stresses are much closer amongst the tissues than the

35
circumferential stresses and were only statistical significance for the LSV (ISz =28.6 ±
24.5 kPa) compared to the LAD (ISz =51.3 ± 10.4 kPa) (Figure 2.4D; Table 2.3).
Collectively, the differences in structural and mechanical properties were normalized and
plotted for all vessels at in situ states compared to the LAD as indicated by Ξ in Figure 2.5.
Using this approach, the ITA ( =0.90 ± 0.34) is the best overall match to the LAD
followed by the RA ( =3.61 ± 0.44), LSV ( =3.84 ± 0.69), and GSV ( =4.44 ± 1.47).
2.4.4 Grafted Structural and Mechanical Values
Using a uniform prescribed mean pressure of 100 mmHg and the axial force
measured for the LAD of 0.4 N to approximate coronary loading conditions for the graft
tissue, deformed inner radius and compliance, circumferential stress and axial stress were
calculated for the graft conditions of the coronary environment (Table 2.3). When
comparing an autograft tissue in its in situ environment to that of the coronary environment
we found statistical significance for the inner radius of the RA (IS
ir =0.9 G
ir =0.92
0.12 mm), GSV (IS
ir =0.70 0.39; G
ir =1.10 0.28 mm) and LSV (IS
ir =1.54 0.73; G
ir
=1.91 0.67 mm). The LSV ( ISc =0.89 0.61; Gc =0.23 0.04 10-6m2/kPa) also had a
significant change in compliance. Despite the apparent increases in grafted axial stress
shown in Table 2.3, statistical significance was only found in the circumferential direction.
Specifically, the RA (IS =14.3 ± 3.1;
G =17.2 ± 4.00 kPa), GSV (
IS =3.66 ± 0.67;
G = 22.8 ± 5.71 kPa), and LSV (
IS =7.40 ± 3.36;
G = 49.4 ± 15.1 kPa) all experience
increased circumferential stress. The overall differences in structural and mechanical
properties were normalized and plotted for all vessels at in situ states compared to the
grafted environment as indicated by Ω in Figure 2.5. Using this approach, the ITA (Ω=0.28

36
± 0.20) is the best overall match to the LAD followed by the RA (Ω=1.00 ± 0.20), GSV
(Ω=3.66 ± 1.19), and LSV (Ω=3.74 ± 0.62).
2.5 DISCUSSION
Landmark clinical studies have identified the existence of a performance
differential for autologous vascular grafts based on anatomical tissue source location
[12,13,107,113,116,133,135,148–150]. Although clinical outcomes are inarguably the key
determinant for CABG graft selection, the mechanisms of differential performance are not
well explicated. Our data, and that of classic literature, shows that vascular tissues from
functionally different origins have unique histoarchitecture [151]. This histoarchitecture
determines the inherent mechanical behavior dictating how a tissue responds to the altered
loading environment of the coronary vasculature (Figure 2.4). While remodeling is
nominally an adaptive process that restores homeostasis, the mechanical, compositional,
and geometrical incongruities between the grafted and adjacent tissues can lead to
deleterious outcomes that compromise lumen patency. In fact, a plot of the normalized
difference in mechanical properties metrics – and Ξ – versus first year CABG failure
rate (Figure 2.6) suggests a positive relationship between graft failure rate and mechanical
deviations. Further, our important findings suggest that a range of unique mechanical
conditions exist for each of these tissues in situ and for their graft environment.
Collectively, this information will help guide surgeons towards optimal tissue sources for
bypass grafting, some of which are yet to be realized, and provide a basis for alternate
therapeutic approaches such as tissue engineering [14,112].
2.5.1 Structural and Mechanical Parameters and Vessel Selection

37
Although a multitude of logistical and practical criteria are used for surgical CABG
vessel selection, matched inner radii in the in situ state has provided a historical foundation
to initiate candidate vessels for transplantation. This fortunate selection criterion
conveniently provides a common basis for comparison between grafts in situ and can be
easily assessed using ultrasound. Under the increased pressure loading of the grafted
environment however, the inner radii are modified from their in situ condition and is most
evident for the GSV that experiences an increase in radius from 0.70 ± 0.39 to 1.10 ± 0.28
mm as indicated by Ω = 0.54 ± 0.44. These subtle differences may have a dramatic effect
on wall shear stress, a known stimulus for remolding and intimal hyperplasia of venous
grafts [42]. For instance, shear stress w under steady Poiseuille flow has an exponential
dependence on inner radius so that
3
4w
i
Q
r
, [2.14]
where Q is the mean volumetric flow rate and the dynamic viscosity of blood [2]. It
should be noted that the GSV graft will also experience an increase in Q upon
implantation from roughly 0.14 ml/s in the greater saphenous vein environment to 0.52
ml/s in the coronary vasculature making the wall shear stress change less dramatic [3,31].
Whereas comparable radii are important regulators of steady perfusion and shear stress, the
pulsatile perfusion environment is dependent upon vascular compliance. Compliance is a
contributing factor for anastomotic intimal hyperplasia, and the change in compliance from
the in situ to the grafted environment is indicative of the nonlinear pressure-radius
relationship [152]. The latter emphasizes the importance of accurate structure-based strain
energy function as presented in [2.9]. It is not surprising that the ITA has a similar

38
compliance to that of the LAD considering their comparable microstructure and
physiologic loading conditions.
Through mechanotransductive pathways intramural stresses apply physical signals
to resident vascular cells [122]. The stress distribution throughout the wall of the blood
vessel also has important implications in health and disease with large opening angles
shifting the circumferential stress distribution from the intima towards the adventitia [153].
Veselý et al., (2015) found that the optimal opening angle in the human great saphenous
vein for uniform stress distribution is around 40 degrees [154]. In smaller pig studies than
ours the opening angles were found to be considerably higher than our study [155]. This
phenomenon does depend on the species and likely other taxonomic ranks [156]. Overall,
we did not find statistical significance between opening angles of our tissues. It is
surprising, however, to see that the magnitude of mean circumferential stress differed so
dramatically between graft tissues in situ and that the RA, GSV, and LSV had much higher
stresses in the axial direction. Although the passive state of the smooth muscle cells
contributes to a lower in situ stress than would be achieved with basal tone, an 18-fold
difference exists between GSV (3.66 ± 0.67 kPa) and ITA (67.1 ± 14.7 kPa) so that Ξ=1.79
± 0.04. The veins would also experience the greatest increase in circumferential stress upon
grafting (GSV = 18.9 kPa, Ω = 1.44 ± 0.08; LSV = 42.0 kPa, Ω = 1.49 ± 0.09). In situ and
grafted saphenous vein circumferential stresses (IS =3.66± 0.67;
G ≈ 22.8 ± 5.71 kPa),
were close to the mean values of the human counterpart at a 40 degree fiber angle (IS ≈
6; G ≈ 22 kPa) [154]. Enigmatically, the axial stresses were much higher than
circumferential stresses which is known to play a fundamental role in compensatory
adaptation by blood vessels [32]. Since axial prestretch is reduced with aging and disease

39
conditions, our tissue, taken from mature but young pigs, is likely at a higher stretch than
those used for grafting [32,154]. A likely contributing factor is the somatic growth and
axial extension during development of these source tissues (i.e., extremities of the leg and
arm). Moreover, the tested invariant force-pressure relationship that holds for arteries may
need to be evaluated more extensively for venous structures [136]. It is interesting
enforcing volume preservation and axial extension could be used to decrease inner radius
and increase compliance and circumferential stress. While application of axial distension
to CABGs might increase the difficulty of the procedures and put stress on the suture
interface, it is worth further examination if it has the potential to reduce the incidence of
graft failure in the vessels.
2.5.2 Framework for Evaluation of Candidate Vessels and Clinical Significance
In this work we have initiated two competing hypotheses that underlie the
mechanical analysis of vessels used for the CABG procedure that likely contribute to
differential outcomes: 1) Ξ, a comparison of a graft vessel in situ to the LAD in situ, or 2)
, comparisons of a graft vessel in situ to that same vessel under conditions of the LAD.
The latter presents a uniform loading condition to facilitate comparisons between these
unique tissues. These subtle distinctions could have profound effects on how graft vessels
are evaluated for candidacy in the future. Using both approaches the ITA was found to be
the best mechanical choice followed by the RA. The results are less clear however, for the
GSV and LSV raising the question, is it better for a graft to be more like the coronary artery
(Ξ 0) or more like its native condition (0)? Unfortunately, the question does not have
an immediate and clear answer. For example, it is tempting to assign a linear relationship
to Figure 2.6 yet these clinical observations are limited to only three data points and could

40
also be fit to an exponential or polynomial, whereby the behavior of that nonlinear fit for
Ξ and would appear to be reversed. We do know however, that the normalized
contribution of each of the individual parameters that make up Ξ (i.e., ri , c , , z ),
is more evenly distributed than where and z contribute to 62-86% of the overall
value. It is also provocative to consider a case where both Ξ and intersect the origin in
Figure 2.6. This would represent an idealized scenario where the coronary artery is used
as a CABG graft resulting in zero first year failures. This is an unlikely, if not impossible
scenario since the underlying cause of clinical failures are not isolated to mechanical
reasons, yet it may provide insight into the importance of these two metrics. The high
slopes of the linear fits used in Figure 2.6 suggest inner radius and axial stress as major
contributors to clinical failure rates. The latter observation is profound since surgical
guidelines for the CABG procedure recommend against applying axial loads. The answer
to these questions and more will undoubtedly improve as clinical reports for other vessels
(e.g., gastroepiploic or inferior epigastric artery) becomes available and are matched to
mechanical data.
An important distinction between our in vitro study that considers vessels as
replacement tissues for the LAD and the actual CABG procedure lies in how axial loads
are applied. Current surgical guidelines for the CABG procedure advise against using
excessive graft lengths to prevent kinking while tensile forces should be minimized to
improve suture retention [132]. This configuration puts vessels into neutral axial loading
prior to reperfusion. Upon reperfusion however, small axial forces will be generated and
can lead to bending and buckling. Still these stresses are far lower than those observed in
situ resulting in a transplantation stress difference (Table 2.3). Khonsari points out
41
“Saphenous vein grafts tend to shrink over time … shrinkage may cause tension on the
anastomosis and predispose the graft to premature failure.” This observation is indicative
of our stress-mediated growth and remodeling hypothesis described in the introduction
aimed at restoration of in situ axial stresses. Regardless, the analysis described herein
simplifies a complicated clinical procedure that involves bending and buckling instabilities
that do not lend well to analytical approaches implemented within the framework of
continuum mechanics.
In future investigations, the methods described here will be utilized in conjunction
with a perfusion bioreactor to evaluate and control the vascular remodeling process and
determine the dominance of the utility scores Ξ or . Many theoretical studies have been
proposed using stress-based growth and remodeling process for CABG for venous grafts
and the current study has established the initial conditions for those future investigations
which will determine the adaptability of the candidate tissues to new environments
[157,158]. We hypothesize that adaptability is dependent upon cellular function and the
current state of the extra cellular matrix. In these future investigations, the grafted
conditions applied by the ex vivo culture device will provide a prolonged remodeling
stimulus, which we expect will lead to growth and remodeling within the cultured vessels.
However, it is not clear whether vessels will continue to seek their initial homeostatic stress
state indefinitely, take on a stress objective of a coronary artery, or a hybrid of both
conditions. Furthermore, we will utilize a predictive mathematical approach of the
remodeling required to regain homeostasis and compare to experimental vascular cultures.
While this investigation is focused on analyzing autologous CABG vessels, the
outlined procedure is a universal approach that could be applied to other non-coronary

42
grafting such as treatments for peripheral vascular disease. Beyond autologous grafts, the
above methodology can give a more rigorous mechanical analysis of tissue engineered
blood vessels (TEBVs) than is commonly presented. Generally, the mechanical data
presented for TEBVs include uniaxial tensile tests, burst pressure, suture retention strength,
and compliance, but these metrics do little to describe the functionality of the vessels in
vivo [126,159,160]. Although the conditions most conducive to tissue growth will need to
be identified, utilization of the current methods for mature vascular grafts could aid
researchers in developing more functional TEBVs with quiescent properties [161]. If the
aforementioned grafts are to be used for grafting applications such as CABG where
mechanical compatibility is paramount, it will be important to elucidate how the vessels
develop a homeostatic state as it is influenced by biaxial loading. Moreover, ex vivo
investigations under controlled mechanical stimuli could potentially allow researchers to
define the homeostatic stress state for TEBVs. This would facilitate the creation of artificial
grafts compatible with any mechanical loading conditions and thus any anatomical
location.
2.5.3 Limitations
We hold that this investigation represents a meaningful contribution to the
collective knowledge of vascular mechanics, but we acknowledge that there are limitations
to the study that merit further consideration. First and foremost, we assume that uniform
loading of the grafted replacement vessels is equivalent to that of a native LAD artery. This
implies that we are considering an end-to-end anastomosed graft replacing a section of the
LAD rather than following the surgical guidelines for a CABG procedure. Furthermore,
grafted conditions were assumed to be 100 mmHg at an axial force of 0.4 N, approximately

43
representing the mean values experienced by the LAD. This does not account for the
constant variation in stresses and strains caused by hemodynamic pulsatility and
contraction of the myocardium. We also point out that all vessels were harvested taken
from healthy, young pigs and that these vessels which would likely experience altered
mechanics in disease and aging [162,163].
Of further note, histological differences exist between the proximal (Figure 2.2A)
and distal (Figure 2.2B) sections of the LAD coronary artery due to the significant
structural variations along its length. Based on our previous assumption of vessels
organizing to homogenize stress at their homeostatic state, this change in histology would
indicate that the loading environment changes significantly along the length of the LAD.
As such, the optimal structure of a CABG graft of the LAD would vary according to where
along its length it is being grafted. Moreover, the peripheral vessels of a quadraped are a
less direct analogy to the human than the coronary vessels. Nowhere is this truer than for
the LSV, a tissue that does not exist in the human but has applicability in veterinary
medicine and laboratory studies (Figure 2.1). Moreover, the zero-stress state measurements
were performed following mechanical testing therefor the supra-physiological loading
conditions could potentially have an effect on opening angle measurements. This is likely
a small contribution but one that should be considered in future work. Lastly, this
investigation focused on the passive mechanics of the potential graft tissue. In highly
muscular blood vessels such as the RA, GSV, or LSV, the stress state depends on smooth
muscle activation and likely contributes to the low native circumferential stress values
predicted in Table 2.3. An additional term could be added to account for active smooth
muscle behavior [144,164].

44
2.6 CONCLUSION
Mechanical loading is an important factor driving vascular growth and remodeling
in autologous grafting of mature blood vessels. Differences in structural and mechanical
characteristics, as demonstrated by our novel metrics Ξ and , provide a reference to the
extent that remodeling must occur in the grafted environment and provides supportive
evidence for the differential performance of CABG grafts. The results of the current study
are consistent with vessel-specific variations in clinical success rates and provides the
groundwork for engineering a better CABG graft. Further investigation and
experimentation is necessary to determine if these metrics can be manipulated, acutely or
chronically on native tissues, to improve CABG outcomes.
2.7 ACKNOWLEDGEMENTS
The authors would like to acknowledge the imaging and histological assistance of
Dr. Robert Price and Benny Davidson, dissection assistance of Brooks Lane and Carissa
Leischner, image collection and processing assistance of Liam McNamara, and
Caughman’s Meat’n Place.
2.8 FUNDING
This research was supported by NIH INBRE grant for South Carolina
(P20GM103499) and through a provost sponsored graduate scholarship from BMEN.

45
2.9 TABLES
Table 2.1 Vessel geometry of stress-free configuration.
Outer arc-
length (o
L )
[mm]
Inner arc-length
(i
L ) [mm] Opening angle
( ) [◦]
Stress-Free Thickness
( H ) [mm]
LAD 13.8 ± 1.53 10.4 ± 1.45 70.1 ± 12.5 0.88 ± 0.11
ITA 13.4 ± 0.9 10.8 ± 0.86 44.9 ± 18.2 0.55 ± 0.06*
RA 8.70 ± 1.63* 4.65 ± 1.21* 45.2 ± 26.4 0.87 ± 0.06
GSV 9.84± 2.32* 6.06 ± 1.74* 51.5 ± 25.0 0.84 ± 0.05
LSV 12.0 ± 4.26 8.65 ± 4.35 67.8 ± 22.2 0.87 ± 0.15

46
Table 2.2 – Material Parameters for LAD, ITA, RA, GSV, and LSV obtained for a four-fiber constitutive model.
0
b [kPa] 11
b [kPa] 12
b 21
b [kPa] 22
b 31
b [kPa] 32
b [°] Residual
LAD 3.47 ± 2.83 18.7 ± 12.7 1.81 ± 2.92 1.96 ± 1.88 3.15 ± 2.08 7.51 ± 10.8 3.98 ± 1.4 40.5 ± 10.0 0.73 ± 0.34
ITA 17.5 ± 17.0 17.2 ± 5.74 0.34 ± 0.11 4.52 ± 3.70 3.38± 2.42 22.7± 30.6 4.05 ± 2.26 34.1 ± 13.2 0.52 ± 0.15
RA 5.17 ± 8.16 7.98 ± 11.3 0.64 ± 0.78 17.8± 10.8* 4.19 ± 2.02 17.8± 27.6* 3.73 ± 2.82 35.3 ± 4.98 0.52 ± 0.12
GSV 4.40 ± 5.85 6.95 ± 4.98 1.75 ± 2.93 14.0 ± 10.6 3.93± 3.16 24.5 ± 33.6 4.46 ± 2.55 37.7 ± 14.3 0.74 ± 0.23
LSV 5.53 ± 8.25 4.75± 4.03* 0.63 ± 0.62 0.91 ± 1.31 2.83± 3.09 2.62 ± 3.23 4.02 ± 2.97 42 ± 14.91 0.43 ± 0.23

47
Table 2.3 – Loads, structure, stretch, and stress for the LAD, ITA, RA, GSV, and LSV in situ or grafted under coronary loads.
P (mmHg)
F (N)
ir
(mm)
c
(10-6m2/kPa) z
(kPa)
z
(kPa)
LAD 100 0.4 2.29 0.38 0.32 0.11 1.31 ± 0.26 1.33 ± 0.02 66.7 ± 39.3 51.3 ± 10.4
In Situ Loads In Situ Structure In Situ Stretch In Situ Stress
ITA 100 0.35 1.98 0.13 0.39 0.13 1.17 ± 0.11 1.22 ± 0.07 67.1 ± 14.7 64.4 ± 17.2
RA 80 0.33 0.9 0.15 0.09 0.04 1.16 ± 0.23 1.17 ± 0.07 14.3± 3.12§ 65.1 ± 34.2
GSV 20 0.26 0.700.39§ 0.17 0.12 0.93± 0.09§ 1.24 ± 0.10 3.66± 0.67§ 46.1 ± 44.7
LSV 20 0.16§ 1.540.73§ 0.89 0.61 1.12± 0.14§ 1.34 ± 0.17 7.40± 3.36§ 28.6± 24.5§
Grafted Loads Grafted Structure Grafted Stretch Grafted Stress
ITA 100 0.4 1.97 0.13 0.38 0.13 1.17 ± 0.11 1.24 ± 0.07 67.9 ± 15.6 75.7 ± 14.3
RA 100 0.4 0.92 0.12* 0.10 0.06 1.17 ± 0.17 1.21± 0.05* 17.2± 4.00* 79.3 ± 20.1
GSV 100 0.4 1.10 0.28* 0.15 0.05 1.12± 0.14* 1.25 ± 0.09 22.8± 5.71* 93.5 ± 39.7
LSV 100 0.4* 1.91 0.67* 0.23 0.04* 1.35 ± 0.16 1.34 ± 0.19 49.4± 15.1* 74.2 ± 24.7

48
2.10 FIGURES
Figure 2.1 – Translational schematic comparing vessel locations in human and porcine anatomy and vessel wall diagrams to scale based on geometric and histological data from study.

49
Figure 2.2 – Verhoeff-Masson’s stained cross-sections of (A) proximal and (B) distal left anterior descending artery - LAD approximately 2 cm apart; (C) internal thoracic artery - ITA, (D) radial artery - RA, (E) great saphenous vein - GSV, and (F) lateral saphenous vein - LSV.

50
Figure 2.3 – Area fractions ϕ of elastin (black), collagen (white), and smooth muscle (gray) determined by thresholding analysis of Verhoeff – Masson’s stained cross-sections for the ITA, RA, GSV, and LSV.

51
Figure 2.4 – Representative plots at in situ conditions of (A) pressure-inner radius (B), axial force-stretch, (C) circumferential stress-stretch, and (D) axial stress-stretch for the LAD ( ), ITA ( ), RA ( ), GSV ( ), and LSV ( ).

52
Figure 2.5 – Comparison of normalized differences between vessels (ITA, RA, GSV, or LSV) in situ and the LAD (Ξ, ) or between vessels in situ and that vessel grafted under uniform loads of the LAD environment (,), where subscripts (ri), (c), (σθ), and (σz) represent the normalized inner radius, compliance, circumferential stress, and axial stress respectively as plotted in (A), (B), (C), and (D) respectively, while Ξ and (no subscript) are the summation of those metrics (E).

53
Figure 2.6 – Relationship between the first year CABG failure rate (mean SD) and the state of the vessels in situ compared to the LAD (Ξ dashed line: ITA ; RA ; GSV ) or between the vessels in situ and that vessel grafted under uniform loads of the LAD environment ( solid line: ITA ; RA ; GSV ), where subscripts (ri), (c), (σθ), and (σz) represent the normalized inner radius, compliance, circumferential stress, and axial stress as plotted in (A), (B), (C), and (D) respectively, while and Ξ (no subscript) are the summation of those metrics (E).
A
B
C
D
E
54
CHAPTER 3
PERFUSION TISSUE CULTURE INITIATES DIFFERENTIAL REMODELING OF
INTERNAL THORACIC ARTERIES, RADIAL ARTERIES, AND SAPHENOUS VEINS 2
2Prim, D. A., Menon, V., Hasanian, S., Carter, L., Shazly, T., Potts, J. D., & Eberth, J. F.
Submitted to Journal of Vascular Research, 1/17/2018
55
3.1 ABSTRACT
Adaptive remodeling processes are essential to the maintenance and viability of
coronary artery bypass grafts where clinical outcomes depend strongly on the tissue source.
In this investigation, we utilized an ex vivo perfusion bioreactor to culture porcine analogs
of common human bypass grafts: the internal thoracic artery (ITA), the radial artery (RA),
and the great saphenous vein (GSV), and evaluated samples acutely (6 hours) and
chronically (7 days) under in situ or coronary-like perfusion conditions. Although
morphologically similar, primary cells harvested from ITAs illustrated lower intimal and
medial, but not adventitial, cell proliferation rates compared to RAs or GSVs. Basal gene
expression levels were similar between all vessels with only COL3A1, SERPINE1, FN1
and TGFB1 differentially expressed prior to culture; however, over half of all genes were
affected nominally by the culturing process. When exposed to coronary-like conditions,
RAs and GSVs experienced pathological remodeling not present in ITAs or when vessels
were studied under their in situ conditions. Many of the remodeling genes perturbed at 6
hours were restored after 7 days (COL3A1, FN1, MMP2, TIMP1) while others (SERPINE1,
TGFB1, VCAM1) were not. Findings elucidate potential mechanisms of graft failure and
highlight strategies to encourage healthy ex vivo pre-graft conditioning.
3.2 INTRODUCTION
Coronary artery bypass grafts (CABGs) experience wide variations in failure rates
depending on the source tissue used for the graft, with approximately 6% of 400,000
procedures per year experiencing some sort of failure in the first 12 months [11,14].
Although vascular cell activity is vital to healthy remodeling, graft failure is often the result
of intimal hyperplasia, whereby a complex remodeling cascade of smooth muscle cell

56
(SMC) differentiation, migration, and proliferation; extracellular matrix (ECM) protein
deposition; and infiltration of circulating inflammatory and progenitor cells lead to the
formation of an abnormal tissue layer between the intima and internal elastic lamina. This
process eventually causes graft narrowing, restenosis, and occlusion resulting in surgical
reintervention [22,165,166]. An intuitive approach to improving clinical outcomes would
therefore be to stimulate the inherent healthy processes in a graft tissue while attenuating
maladaptive remodeling.
Throughout development, mechanosensitive vascular cells dictate the growth and
organization of blood vessels in response to hemodynamic loads. The resulting mature
vascular tissues are optimized with respect to their specific loading conditions
[120,167,168]. While the number of CABG failures remains unacceptably high, for the
majority of current CABGs to be successful one of the following must be true: (i) vessels
can function effectively in loading conditions for which they may not be developmentally
optimized or (ii) vessels adapt to chronic changes to their environment. Others have
reported long-term compensatory changes in grafts that are successful [52,169], supporting
the validity of (ii). This adaptation hypothesis assumes that vascular cells within graft
vessels sense and respond to chronically altered mechanical loads, which has been
theoretically accepted for decades and corroborated in a wide-range of experiments
[29,32,46,47,170–173]. Separately, evidence suggests that vascular cells in discrete
vessels, arising from different embryological origins, do not function uniformly and
respond differently to stimuli [174,175]. Thus, it is plausible that inherent differences
between CABG vessels could affect their ability to successfully adapt to grafting.

57
To assess remodeling capability at a reasonable time scale, we can evaluate
expression of genes associated with vascular remodeling as a proxy for eventual growth
and remodeling outcomes. Type III Collagen (COL3A1 gene), for example, is associated
with structural fibers contributing to the mechanical strength of the vessel wall as well as
a component of the basement membranes. COL3A1 deposition and remodeling is also
associated with graft restenosis and intimal hyperplasia [176,177]. Matrix metallopeptidase
II (MMP2 gene) degrades several types of collagen, and it is inhibited by tissue inhibitors
of metallopeptidases (TIMP1 gene), both of which are known to exhibit altered expression
in response to blood flow and pressure; therefore, altered expression of either of these genes
could be an indicator of active vascular remodeling [52,83]. Fibronectin 1 (FN1 gene) is
an ECM component that has been shown to be activated by cyclic stretch and play roles in
SMC phenotype modulation, proliferation, and cell adhesion [178]. Plasminogen activator
inhibitor type 1 (SERPINE1 gene) is expressed by endothelial cells (ECs) and SMCs in
response to both altered cyclic strain and flow and plays influencing fibrinolytic balance,
regulates ECM proteolysis, and can inhibit matrix degradation by inhibiting MMPs [179].
Vascular cell adhesion molecule type 1 (VCAM1 gene) is an endothelial marker that
responds to flow and is implicated in inflammatory processes as a precursor to neointima
formation [180]. Transforming growth factor beta 1 (TGFB1 gene) is implicated in
numerous cardiovascular processes, specifically cell growth, proliferation, differentiation,
and apoptosis, and its expression has been shown to change in response to altered cyclic
strain [181,182].
In this investigation, we measured and compared the early remodeling response of
three common CABG tissues – the internal thoracic artery (ITA), radial artery (RA), and
58
great saphenous vein (GSV) – to coronary loading conditions by culturing samples in an
ex vivo perfusion bioreactor. We hypothesized that inherent differences exist in each
vessel’s response to altered stimuli and thus their ability to remodel in response to CABG.
Further understanding of differential remodeling can then be used to guide future
investigations into graft preconditioning optimization strategies.
3.3 MATERIALS AND METHODS
3.3.1 Tissue Harvesting and Preparation
The left anterior descending coronary artery, internal thoracic artery, radial artery,
and great saphenous vein samples were dissected from freshly slaughtered American
Yorkshire sows (approx. 200kg, 3 years old) at a local abattoir. All tissue used in this study
were acquired from animals designated for human consumption and therefore did not fall
under IACUC protocol. Prior to any experimental manipulation, fresh samples (time 0, t0)
were briefly rinsed in sterile Moscona’s saline solution then snap frozen on dry ice. All
other samples were excised then transported in tubes containing sterile Moscona’s saline
solution supplemented with 20 U/mL heparin, 1% penicillin/streptomycin, 1%
amphotericin-B, and 1% gentamycin. Upon arrival at the laboratory, vessels were cleaned
of excess perivascular and adventitial tissue, branches ligated with sterile 6-0 silk suture,
and samples mounted to custom made barbed glass cannulas within custom-made lidded
glass bioreactor baths (Adams & Chittenden Scientific Glass, Berkeley, CA). For 7 day
experiments, tissue sections adjacent to mounted samples were fixed in 4%
paraformaldehyde for later comparison to cultured samples.
3.3.2 Cell Isolation and Proliferation for Plated Studies
59
To isolate intimal cells, one end of each vessel was occluded with sterile 3-0 silk
suture. The lumen was then filled with 0.15% w/v collagenase II solution in serum-free
DMEM (Worthington Biochemical, Lakewood, NJ), followed by clamping of the open end
of the vessel and incubation for 8 minutes at 37 C. After incubation, the collagenase
solution within each vessel was decanted into 15mL centrifuge tubes, and DMEM
supplemented with 10% FBS rinsed through the lumen into a centrifuge tube to further
dislodge intimal cells. A cut was then made along the length of the vessel so that the lumen
could be gently scraped with a cell scraper to isolate any remaining intimal cells. These
contents were centrifuged for 8 minutes at 800 rpm, resuspended in DMEM supplemented
with 5% FBS, and plated for culture in dishes with collagen-coated coverslips. Endothelial
cell populations were confirmed at day 7 using immunofluorescent images of platelet
endothelial adhesion molecule 1 (CD31/PECAM1) phalloidin, and 4',6-diamidino-2-
phenylindole (DAPI) (All antibodies: Abcam Inc, Cambridge MA) on the Zeiss LSM 510
confocal microscope (Carl Zeiss Microscopy GmbH, Jena, Germany).
Following intima removal, denuded vessels were placed in fresh tubes containing
collagenase II solution (as described above) and incubated for 10 minutes at 37 C with
mechanical agitation. After incubation, samples were removed from tubes, and the
loosened adventitia removed with forceps and returned to tubes of collagenase solution.
DMEM supplemented with 10% FBS was added to the tubes containing adventitia and
collagenase solution, and tubes were centrifuged for 8 minutes at 800 rpm, followed by
resuspension in fresh DMEM with 10% FBS and plated for culture with collagen-coated
coverslips. Smooth muscle populations were confirmed with confocal microscopy at day

60
7 using immunofluorescent images of fluorescently labeled Alpha Smooth Muscle Actin
(α-SMA) antibodies and DAPI on the Zeiss LSM 510 confocal microscope
After adventitia removal, the remaining tissues were placed in fresh tubes of
collagenase solution and incubated with agitation for 30 minutes at 37 C. Samples were
then cut into small pieces (1-2 mm2), returned to tubes containing collagenase solution, and
incubated further at 37 C for 4 hours with agitation. Following incubation, DMEM with
10% FBS was added, and samples were centrifuged for 8 min at 800 rpm, resuspended in
fresh DMEM with 10% FBS, and plated for culture with collagen-coated coverslips.
Fibroblast populations were confirmed with confocal microscopy at day 7 using
immunofluorescent images of Fibroblast-Specific Protein 1 (FSP1/S100A4) and DAPI on
the Zeiss LSM 510 confocal microscope.
Cell cultures were assessed qualitatively using an inverted phase contrast
microscope with CCD camera. Proliferation was quantitated using the Roche 5-Bromo-2’-
deoxy-uridine (BrdU) Labeling and Detection Kit I according to the manufacturer’s
instructions (Roche Diagnostics GmbH, Mannheim, Germany). Briefly, after 7 days of
culture, 3 uL BrdU per mL medium was added to plates containing coated coverslips for
3h. After labeling, coverslips were rinsed thrice in PBS and fixed in Ethanol/Glycine
fixative solution at -20 C for 30 minutes, then rinsed thrice more in PBS. For staining,
coverslips were covered with 100 uL anti-BrdU diluted 1:10 with Incubation Buffer (both
from Roche kit, above) and incubated for 1 hour at 37 C, followed by 3 rinses for 10
minutes each in PBS. Next, coverslips were covered with fluorescein-labeled anti-mouse
IgG diluted 1:10 in PBS and incubated for 1 hour in the dark at 25 C, followed by 3 rinses
of 10 minutes each in PBS and staining with DAPI diluted 1:5000 in PBS and incubation

61
for 1 hour in the dark at room temperature. After rinsing, coverslips were mounted using a
1:1 PBS/Glycerol mounting medium and imaged using the Zeiss LSM 510 confocal
microscope (Carl Zeiss Microscopy GmbH, Jena, Germany).
3.3.3 Ex Vivo Vessel Culture
The ex vivo bioreactor used for this investigation was designed so that most wetted
parts could be easily autoclaved and contained in an incubator when assembled (Figure 1).
Flow was generated via a Cole-Parmer Masterflex L/S Easy-Load II roller pump head
(model 77201-60) attached to a Cole-Parmer Masterflex L/S roller pump (model 7552-02),
and output was controlled by a Cole-Parmer Masterflex Wash-Down Modular Controller
(model 7552-71) (Cole-Parmer, Vernon Hills, IL). Pressure was adjusted via a tubing pinch
valve downstream of the vessel and measured by an Omega digital pressure gauge (model
DPG8001) (Omega, Norwalk, CT) located upstream of the sample offset. All tubing
consisted of 0.64 cm inner diameter Masterflex PharMed BPT (Cole-Parmer, Vernon Hills
IL). Temperature in the incubator was maintained at 37o C, and CO2 concentration was
maintained at 5%.
ITAs, RAs, and GSVs were cultured in the ex vivo perfusion bioreactor with
DMEM supplemented with 10% fetal bovine serum, 1% penicillin/streptomycin, 1%
amphotericin-B, and 1% streptomycin for six hours (6h) or seven days (7d) under in situ
(IS) or coronary-like (LAD) media perfusion pressure and flow conditions (Table 3.1). For
7d cultures, all media (150 ml), was replaced at day 4. Endothelial and smooth muscle cell
viability was confirmed at day 4 using phenylephrine HCl (10-5 M) and carbamylcholine
chloride (10-5 M) to elicit smooth muscle-dependent contraction and endothelial-dependent
relaxation, respectively. At the end of each culture, sections were cut from the middle of
62
each sample, snap frozen on dry ice, and stored at -80o C for gene expression analysis or
cut and fixed in 4% paraformaldehyde for histological analysis.
3.3.4 Gene Expression Analysis
Total RNA was isolated from snap frozen tissue samples using the Qiagen RNeasy
Fibrous Tissue Mini Kit (Qiagen, Hilden, Germany) including a homogenization step using
the Qiagen TissueRuptor (Qiagen, Hilden, Germany). Concentrations of isolated RNA was
quantified using the Implen Nanophotometer Pearl (Implen, Munich, Germany). All RNA
samples had A260/A280 and A260/A230 ratios > 1.9. 500ng. RNA was converted to cDNA
using an iScript cDNA Synthesis Kit (Bio-Rad, Hercules, CA). Relative gene expression
within diluted cDNA samples (5x in RNase-free H2O) was then quantified via real-time
PCR on a Bio-Rad CFX Connect Real-Time System (Bio-Rad, Hercules, CA) using Fast
SYBR Green Master Mix (Applied Biosystems, Foster City, CA). Seven genes associated
with vascular remodeling were selected for analysis as mentioned and beta-actin (ACTB)
used a housekeeping gene (Table 3.2). Samples (n=3) were run in triplicate, and all plate
configurations run three times. Fluorescence threshold (300 RFU) was set the same for
each plate to enable comparison across different plates. Relative gene expression was
calculated using the Pfaffl method [183]. Melt curve analysis was performed for each real-
time PCR run.
3.3.5 Histological Analysis
Paraformaldehyde fixed samples were embedded in paraffin, sectioned with a
microtome at 5 µm thick, and stained with hematoxylin/eosin. Digital images of stained
slides were acquired on a Nikon E600 microscope (Nikon Instruments, Melville, NY) using
QCapture imaging software (QImaging, Surrey, BC).

63
3.3.6 Statistical Analysis
Data are reported as the mean ± SEM of all measurements for a given experimental
group. All cultured groups have sample size n=3; for t0 samples n=6. Two-tailed, two
sample, Student’s T-tests assuming unequal variance were conducted at α = 0.05 between
reference samples (see Gene Expression Analysis above) and experimental groups.
3.4 RESULTS
3.4.1 Basal Gene Expression
To provide a baseline comparison of healthy gene expression, genes associated with
remodeling were compared between freshly isolated LAD, ITA, RA, and GSV samples
(n=6) immediately after animal sacrifice (Figure 3.2). Overall, basal gene activity was
similar across the four vessel types, with certain notable differences. COL3A1 (p=0.030)
was the only gene found to be statistically lower when comparing basal gene expression of
ITAs to LADs. Basal gene expression of FN1 (p=0.049) however, was found to be
significantly higher in the RA than the LAD while SERPINE1 was lower in the RA than
either the LAD (p=0.002) or ITA (p=0.031). SERPINE1 (p=0.021) and TGFB1 (p<0.001)
were both lower in the GSV compared to the LAD.
3.4.2 Comparison of Primary Vascular Cells
Cell populations were successfully isolated from intimal, medial, and adventitial
layers of LAD, ITA, RA, and GSV samples. Confocal microscopy qualitatively suggests
intimal populations consisting of mostly endothelial cells, medial populations consisting
of mostly smooth muscle cells, and adventitial populations consisting of mostly fibroblasts.
Intimal populations appeared qualitatively similar across vessel types and with
characteristics similar to disorganized endothelial cells (Figure 3.3). Medial populations

64
appeared to consist primarily of spindle-shaped SMCs in ITA samples; however, LAD,
RA, and GSV samples appear to have significant populations of non-spindle shaped cells
as well. Initial adventitial population sizes varied widely across vessels due to the amount
of tissue available and the perivascular environment of each vessel. Once in culture, cells
from all vessels appeared similar, exhibiting classic stellate fibroblast morphology.
BrdU uptake suggested variable proliferation rates across both layers and vessel
types at 7 d. RA and GSV intimal populations proliferate at higher rates (131 of 213 and
46 of 67 observed cells, respectively) than LAD and ITA (141 of 396 and 66 of 410,
respectively). Proliferation rates appeared relatively similar for medial cells of observed
LAD, RA, and GSV samples (89 of 202, 27 of 48, and 108 of 214, respectively), but ITA
samples exhibited a lower proportion of proliferating cells (60 of 215). In observed
adventitial samples, LAD and ITA cells almost all exhibit BrdU uptake (28 of 29 and 85
of 86, respectively), while RA and GSV cells have much lower proportions (18 of 62 and
44 of 113, respectively).
3.4.3 Effects of CABG Loading Conditions on Gene Expression
To assess the early remodeling effects of mechanical stimuli characteristic of the
coronary environment, gene expression activity was compared between ITAs, RAs, and
GSVs cultured under in situ or LAD conditions and measured after 6 h and 7 d of perfusion
culture (Figure 3.5). Collectively 66.7±9.91% of genes tested after 6 h and 52.4±7.27% of
genes after 7 d were disturbed by IS culture when compared to acutely measured gene
expression.
Four total ITA genes were affected by short and long-term LAD culture conditions
when compared the IS culture conditions. The ITA had significantly higher COL3A1

65
(p<0.001) and significantly lower SERPINE1 (p=0.004) and TGFB1 (p=0.025) gene
expression at 6 h LAD. SERPINE1 (p<0.001) and TGFB1 (p=0.021) remained low after 7
d LAD culture while a significant increase in TIMP1 (p=0.027) gene expression occurred
at this alter time point.
Six total RA genes were affected by short and long-term LAD culture conditions.
The RA had significantly higher COL3A1 (p<0.001) and lower FN1 (p<0.001), SERPINE1
(p=0.016), TGFB1 (p<0.001), and TIMP1 (p=0.004) at 6 h LAD culture conditions. After
7 d LAD culture, COL3A1 returned to basal levels while SERPINE1 (p=0.005) and TGFB1
(p<0.001) decreased further with significant increases in FN1 (p<0.001) and MMP2
(p=0.006) observed.
Five total GSV genes were affected by LAD culture conditions compared to IS.
FN1 (p=0.005), MMP2 (p=0.035), and TIMP1 (p=0.033) were all decreased at 6 h LAD
compared to 6 h IS. After 7 d LAD culture FN1 (p=0.020) gene expression actually
increased compared to 6h LAD but was still less than that of 6 h IS (p=0.001).
3.4.4 Effect of Ex Vivo Culture on Histology
ITA, RA, and GSVs at day 0 were histologically distinct (Figure 3.6, top). Most
notably was the presence of approximately 15 elastic lamellae present in the ITA samples
and a thinner medial layer that are obvious even in an H&E stain. In contrast, RAs and
GSVs contain a thick muscular media with well-organized cell nuclei, often folding in
histological sections. In RAs and GSVs a single internal elastic lamina was prominent.
Despite differences in gene expression, IS cultured vessels were morphologically similar
when comparing between acute to 7 d time points for any given vessel (Figure 3.6, middle).
The only notable difference was an apparent decrease in endothelial cell continuity.
66
Overall, the ITA histology appeared insensitive to IS versus LAD culture conditions. RA
and GSVs cultured under LAD conditions for 7 days however, showed marked changes in
cell and tissue morphology compared to day 0 or 7d IS. Namely, endothelial layers were
sparse of nuclei while a gradient in medial cells was apparent with the inner most cells
necrotic or pyknotic and the outermost appearing otherwise healthy.
3.5 DISCUSSION
This investigation sought to understand the early remodeling processes occurring
in CABG tissues after implantation using tissue perfusion as a tool to evaluate whether the
three most common CABG tissues have inherently different abilities to undergo adaptive
remodeling. To that end, primary vascular cells were isolated from LAD, ITA, RA, and
GSV samples, and an ex vivo perfusion bioreactor utilized to culture porcine samples under
in situ pressure and flow conditions and conditions representative of the coronary
vasculature. Cell cultures demonstrate variable rates of mitotic activity across vessel types
and layers. 6 h cultures were utilized to elucidate the acute response of graft tissues after
CABG, and 7 d cultures were utilized to elucidate remodeling responses as vessels start to
adapt to chronic mechanical changes. Gene expression of seven genes associated with
vascular remodeling were evaluated as a proxy for activated remodeling pathways and
downstream remodeling outcomes while histological staining provided qualitative
evidence of morphological changes due to ex vivo culture conditions.
Our previous work quantified the homeostatic mechanics of the LAD, ITA, RA,
and GSV under their in situ loading environment and demonstrated the amount of
mechanical deviation caused by implantation in the coronary circulation to be different for
candidate graft vessels [15]. Several other groups have published investigations involving

67
ex vivo culture relating to CABG [52,83,97,98,100,184,185]. These tissue-level culture
studies allow for specific mechanical loading conditions and natural interactions between
cell-types that are not possible in flat-plate culture studies. Most tissue cultures studies
however, have focused almost exclusively on saphenous veins due to the implication of
vein grafts in many CABG failures, and each investigation focused on different aspects of
graft remodeling: viability/apoptosis [97], shear stress versus pressure [52], cell
proliferation [185], morphometry [99], and oxygenation [100]. However, none have
focused on the differential remodeling ability of ITAs, RAs, and GSVs. Whereas GSVs
have a historical precedence in CABG grafting, ITAs are the standard-of-care and the RA,
an option for second and third bypass graft procedures [113].
The degree towards which coronary-like culture conditions drive pathological
remodeling in both the RA and GSV was surprising. Specifically, RAs and GSVs, (to a
lesser extent ITAs), exposed to coronary-culture conditions, but not IS conditions,
experience a considerable loss of endothelium and limited apoptosis of cells in the inner
layer of the media. These vessels would likely reendothelialize rapidly in vivo and mural
cells repopulate [186]; however, such processes could be the difference between healthy
and pathological remodeling. A functioning endothelium plays a critical role in SMC
phenotype modulation and the denudation process is known to cause intimal hyperplasia,
adventitial cell proliferation, fibrosis, and constrictive remodeling [187]. Our work
supports the theory that many cells of transplanted tissues are lost soon after transplantation
and repopulated with host-derived cells [186,188,189]. In contrast, the outer layers of the
media retained a normal looking histology remarkably similar to vessels prior to culture.
68
This observation has important implications with adventitial fibroblasts and progenitor
cells playing critical roles in remodeling of vascular grafts [190].
We anticipated that ITA, RA, and GSVs exposed to LAD pressure and flow
conditions would experience an acute, pathological deviation in the expression of many of
our genes compared to their matched IS culture conditions followed by an eventual
restoration of basal levels as tissues restore homeostasis. This effect was observed for
Col3A1 and FN1 genes for all vessels and to a lesser extent MMP2 (ITA and GSV only)
and TIMP1 (RA and GSV only). In contrast, SERPINE1 and TGFB1 continued a path of
decreased expression at 7 d while VCAM1 only increased. Such findings suggest that
homeostasis was still not observed at this time point and such behavior is consistent with
prior in vivo remodeling studies that indicate 2-3 weeks are necessary for gross changes in
tissue structure [47]. VCAM1 and SERPINE1 are both genes expressed predominantly by
endothelial cells and thus pathological conditions are likely given the scarcity of ECs in
cultures of RA and GSVs under LAD flow conditions. Despite this, sufficient
concentrations of RNA were procured from pre- and post-culture cell populations for data
analysis. Comparisons between IS and LAD cultures of RA and GSVs also support the
approach that long-term ex vivo conditioning in a bioreactor should use a stepwise or
ramping approach to transition from in situ to coronary like media dynamics [84,94]. This
approach has been shown to generate stable solutions and prevent maladaptation in
computational simulations of vein remodeling [191].
For the most part, gene expression profiles were similar across vessels when
measured immediately after sacrifice with COL3A1 found to be the only gene differentially
expressed by the ITA compared to the LAD while, SERPINE1, FN1 (RA only), and TGFB1

69
(GSV only) were found to be different in the RA and GSVs compared to the LAD. These
powerful finding provides important information regarding basal gene expression from
different source tissues irrespective of tissue culture. We further expected that because RA
and GSVs experience increased levels of pressure and flow in LAD cultures, they would
result in similarly regulated gene profiles. Such behavior however, was observed for most
genes except COL3A1. In contrast, the ITA IS conditions were most like those of the LAD
thus it was supportive to observe modest changes in gene expression at 6 h of LAD culture
for this tissue.
In theory, this experimental design should allow for clear identification of early
remodeling pathways stimulated by CABG as the bioreactor was designed to perfuse
vascular tissue with pressure and flow levels equivalent to the coronary circulation or any
other desired loading conditions. However, vessels were unavoidably exposed to random
variables, which could confound the results of this investigation. To account for these
variables, control cultures were performed under in situ loading conditions for each vessel.
If environmental stimuli were unchanged for these control groups compared to their basal
in situ state (i.e., t0 results), then we would not have seen differences in gene expression
or histology for these groups. Unsurprisingly that was not the case with 52.4±7.27% of
genes different after 7 d of IS culture conditions compared to their basal (freshly harvested)
expression levels. This could be due to a number of factors: substitution of blood for culture
medium, lack of perivascular tissue, incomplete inflammatory response, or insufficient
replication of physiological hemodynamic waveforms. As it stands, attention should be
focused on the differential responses as a result of culture under coronary versus in situ
loading conditions rather than in reference to the freshly harvested tissues.

70
The results of this investigation indicate that primary intimal, medial, and
adventitial cells from selected source tissues exhibit similar morphology but vary in the
rates of proliferation when isolated and cultured under the same conditions for 7 d. When
tissues were cultured in an ex vivo perfusion bioreactor, molecular pathways associated
with vascular remodeling were activated as early as 6 h after implantation in a new
environment, and those pathways were sensitive to the specific medial perfusion dynamics
to which the vessel was exposed. Some effects appear to be at least partially the result of
ex vivo culture, but responses occurring differentially between IS and LAD cultures were
the result of chronic deviation from homeostasis. Moreover, some but not all of these
remodeling-associated pathways were differentially activated across our three graft vessel-
types, which, together with differing observed rates of cell proliferation, suggest the
possibility of differential propensity for vascular remodeling and adaption when used for
CABG. It was therefore intuitive that significantly different outcomes occur for these
vessels when used clinically for CABG. In situ, each vessel has a unique homeostatic state
of stress and these vessels experiences different changes in loading due to grafting [15].
Thus, using a continuum mechanics framework and prolonged tissue culture (3 weeks), our
future investigations seek to isolate the inherent remodeling capacity of potential graft
vessels from the mechanical deviation to which they were subjected.
3.6 ACKNOWLEDGEMENTS
The authors would like to acknowledge the experimental contributions of summer
medical student Nicole Carey to the current work. This work was supported by the National
Institutes of Health (NIH) P20GM103444 and R21EB022131 grants.

71
3.7 TABLES
Table 3.1 – Ex vivo culture conditions for control (In Situ) and experimental (coronary –LAD) groups for graft tissues ITA, RA, and GSV.
In Situ Coronary
P (mmHg) Q (mL/s) P (mmHg) Q (mL/s)
LAD 102 0.52 1.33
102 0.52 1.33 ITA 100 0.76 1.22
RA 94 0.19 1.17
GSV 15 0.17 1.24

72
Table 3.2 – Primer sequences of 7 remodeling-associated genes and ACTB housekeeping gene.
Sequence (5' → 3')
COL3A1 For GCGGTGACAAAGGTGAAACC
Rev GGCTACCTACTGCACCTTGG
FN1 For TGGGGATACCTGGAGCAAGA
Rev GCCTCTCACACTTCCACTCC
SERPINE1 For CCTAACCAGGCGGACTTCTC
Rev CATGCGGGCTGAGACGATAA
VCAM1 For CGCTGGTCATGAATCCCGTT
Rev ATCTCTGGGTCCTTGGGGAA
MMP2 For CCTGATCTGGACCCCGAAAC
Rev TATCCATCTCCGTGCTCCCA
TGFB1 For CTAATGGTGGAAAGCGGCAA
Rev CCCGAGAGAGCAATACAGGTT
TIMP1 For CACCTGCAGTTTTGTGGCTC
Rev GGGATGGATGTGCAGGGAAA
ACTB For AGGCCAACCGTGAGAAGATG
Rev CCCATCCCCAGAGTCCATGA

73
3.8 FIGURES
Figure 3.1 – Parallel ex vivo pulsatile perfusion bioreactors assembled in incubator (top) with ITA sample in culture (bottom).

74
Figure 3.2 – Comparison of remodeling-associated gene expression of freshly isolated (t0) LAD, ITA, RA, and GSV, where * and ^ indicate p<0.05 with respect to LAD and ITA respectively using two-tailed, two sample, Student’s t-test (n=6). No genes were significantly different between RA and GSV samples.

75
Figure 3.3 – Representative phase contrast images (20x) of isolated cells harvested from the intimal, medial, and adventitial layers of LAD, ITA, RA, and GSVs after 7days in culture plates.

76
Figure 3.4 – BrdU positive staining of isolated cells harvested from the intimal, medial, and adventitial layers of LAD, ITA, RA, and GSVs after 7 days indicate the % of proliferating cells.

77
Figure 3.5 – Comparison of remodeling-associated gene expression changes in ITA, RA, and GSV samples as a result of acute (6h) and prolonged (7d) ex vivo tissue culture exposed to media perfusion approximating in situ (IS) or LAD conditions. * and ^ indicates p<0.05 with respect to 6h IS and 6h LAD respectively using two-tailed, two sample, Student’s t-test (n=3).

78
Figure 3.6 – Representative hematoxylin and eosin (H&E) stained cross sections of ITA, RA, and GSVs before (top row) and after (middle and bottom rows) 7 days of ex vivo perfusion culture at in situ (IS; middle row) or left anterior descending (LAD; bottom row) culture conditions. All images are paired at 100x (left) and 400x (right) magnifications with 0.1 mm scalebars.
79
CHAPTER 4
PULSATILE PERFUSION BIOREACTOR FOR BIOMIMETIC VASCULAR
IMPEDANCES3
3 Prim, D. A., Potts, J. D., & Eberth, J. F. Submitted to ASME Journal of Medical Devices, 1/7/2018

80
4.1 ABSTRACT
Intricate patterns of blood pressure and flow are generated by the cyclic contraction
and relaxation of the heart and the coordinated opening and closing of valves. These
pulsatile waves are augmented by the resistance, compliance, and inertance properties of
the vasculature resulting in unique hemodynamic characteristics present at distinct
anatomically locations. In vivo the hemodynamically generated loads, transduced as
physical signals into resident vascular cells, are crucial to the maintenance and preservation
of healthy physiology. Failure to recreate biomimetic loading in vitro however, can lead to
pathological gene expression and aberrant remodeling. As a generalized approach to
improve native and engineered blood vessels, we have designed, built, and tested a pulsatile
perfusion bioreactor based on the concept of biomimetic impedances. Here the elements of
an incubator-based culture system were formulaically designed to match the vascular
impedance of a brachial artery using a 5-element electrohydraulic analog that incorporates
both inherent (systemic) and added elements. Using freshly harvested saphenous veins, the
relative expression of seven known mechanically sensitive remodeling genes were
analyzed using quantitative polymerase chain reaction (qPCR) after 6 h exposure to
different arterial or venous-like waveforms. While most genes were sensitive to differences
between venous and arterial conditions only Plasminogen Activator Inhibitor (PAI1) was
differentially expressed across distinct arterial-like waveforms. Our analytical and
experimental results provide a framework towards the design of hemodynamic-mimetic
vascular culture systems.
4.2 INTRODUCTION
Pulsatile hemodynamics are a hallmark of the mammalian cardiovascular system,

81
and a palpable pressure was once considered to be the most fundamental sign of life
[192,193]. Pulsatile waves of blood pressure and flow initiate at the heart and travel a
circuitous path of compliant and muscular blood vessels so that at each anatomical location
[194], and amongst different mammalian species [72], local hemodynamic waveforms are
distinct [71]. Hemodynamics influence numerous gene expression pathways resulting in
extra cellular matrix turnover and assorted cell-fate processes that are fundamental to a
healthy physiology [58,67,195,196]. As a result, inter- and intra-species comparisons of
blood vessel histology demonstrate a dramatic variation in composition that enables
optimum functionality in their in situ environment [15,124,193]. Perturbations from this
homeostatic environment therefore initiate adaptive remodeling responses.
Cyclic pressure induces periodic loading of vascular smooth muscle and fibroblast
cells while periodic and oscillatory flow stimulates luminal-lined endothelial cells [8,47].
Normal physiological hemodynamics encourages basal gene expression and protein
turnover while pathological hemodynamics can result in serious vascular disease
conditions such as atherosclerosis, hemorrhage, dissection, and aneurysm formation [73].
Thus, recreation of biomimetic levels of dynamic pressure and flow in the culture media
of an in vitro system are crucial to sustaining a healthy and functional tissue and enabling
desirable tissue engineering outcomes. The extent towards which the precise culture media
dynamics must be recreated is currently unknown but such knowledge could be used to
guide the simplicity of any culture device system.
An ever growing body of evidence suggests that tissue culture can be used as a
means to experimentally isolate and test native blood vessels, improve engineered grafts,
perform high throughput drug testing, and drive stem cell differentiation

82
[44,84,96,99,185,197–201]. Paramount to the success of these experiments are the precise
regulation of the culture media fluid dynamics and the preservation of a sterile but
physiological environment [202]. The latter is aided by a minimalist approach to the
hardware design while the former requires a sound theoretical framework with a priori
knowledge of native conditions. The electro-hydraulic analogy pioneered by William
Henry Preece, provides a convenient methodology enabling a seamless translation of
culture media fluid dynamics into electrical circuits [86,88]. Here the voltage, current,
resistance, capacitance, and inductance are represented as pressure, volumetric flow rate,
hydraulic resistance, compliance, and inertance respectively. Impedances, which are
commonplace in AC circuit analysis, can then be used to represent the opposition of a
hydraulic circuit to fluid flow [192]. The simplicity of this analogy, and the abundance of
analytical techniques developed for AC circuit analysis makes it well suited for the
practicality of an incubator system physically represented by pumps, valves, compliance
chambers, tubing, and culture media.
While many existing vascular perfusion devices are capable of achieving targeted
hemodynamics for a given blood vessel, a general framework for diverse applications and
numerous mammalian species is presented here that includes the phasic relationship
between blood pressure and flow [44,84,96,99,185,197–201]. Simultaneously recorded
brachial artery blood pressure and volumetric flow waveforms were digitized from the
classic literature [1–3] and represented as mathematical equations using a Fourier series
analysis [85,87,203–205]. The waveforms, initially in the time-domain, were recreated in
the frequency domain as impedance magnitudes and phase angles and then used to match
a 5-element electrohydraulic analog for an incubator-based hydraulic circuit configuration.

83
Realistically constrained parameters were then found that provide a basis for the culture
system component design in order to match in vivo impedances [86,87,204]. As an input
to the system pulsatile volumetric flow was generated using a custom designed, gear-
driven, roller pump with each channel providing a phase of volumetric flow that was
quantified from the Fourier analysis.
Drawing from the design of biomimetic impedance matching systems [89,92], we
used elements created from common biologically-compatible and sterilizable tissue culture
materials. Freshly harvested porcine great saphenous veins (GSV) were exposed to brachial
artery (BrA), GSV, or left coronary artery-like (LCA) pressure and flow waveforms created
using a unique pump configuration with design elements specific for each targeted vascular
impedance. Since measurable macroscopic level remodeling (e.g., protein content) involve
long-term processes that follow pre-programmed gene expression, we studied select genes
after 6h of exposure to different media pressure and flow conditions. This approach
permitted comparisons of perturbed media dynamics that could be isolated from the acute
effects of surgical procedures. Seven genes expressed by endothelial, smooth muscle,
and/or fibroblast cells that are widely accepted to be mechanosensitive and implicated in
early vascular remodeling were studied: collagen III (Col 3), matrix metalloprotease II
(MMP 2), tissue inhibitor of matrix metalloprotease I (TIMP 1), vascular cell adhesion
molecule 1 (VCAM 1), fibronectin I (FN 1), plasminogen activation inhibitor I (PAI 1),
and transforming growth factor beta I (TGF 1) [176,177,182,206]. Overall results from
these studies provide feedback towards the utility of our design.
4.3 METHODS
4.3.1 Fourier Analysis of In Vivo Hemodynamics
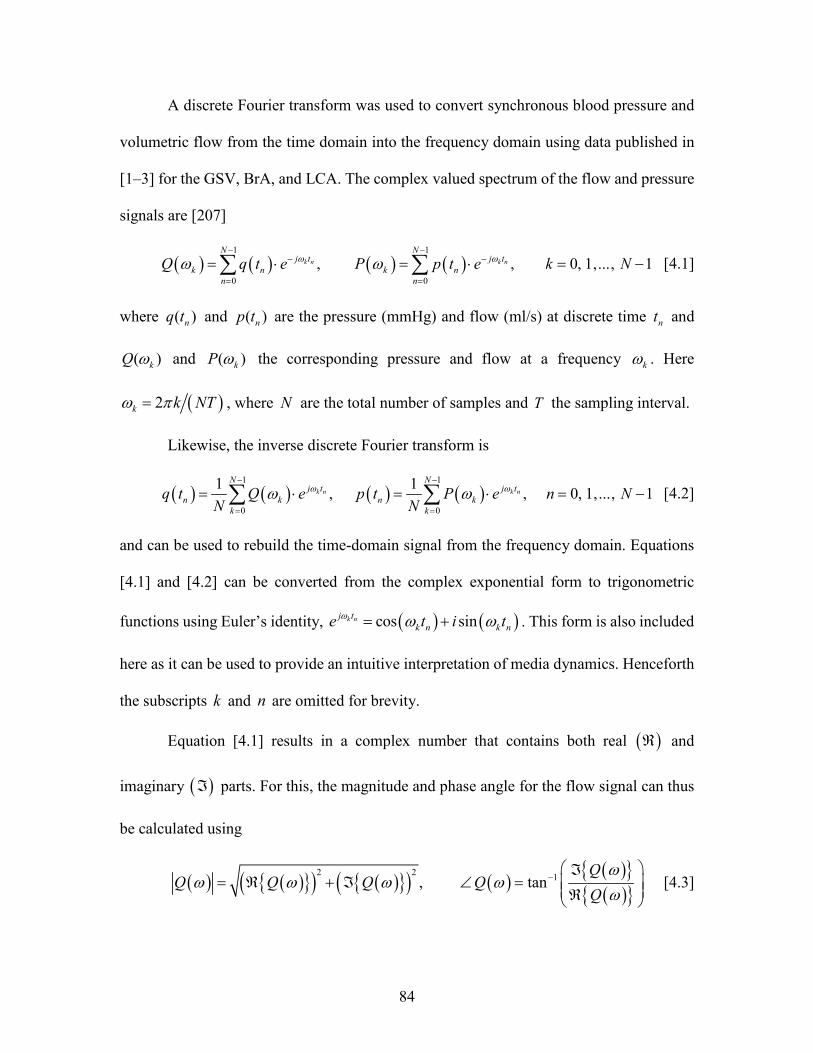
84
A discrete Fourier transform was used to convert synchronous blood pressure and
volumetric flow from the time domain into the frequency domain using data published in
[1–3] for the GSV, BrA, and LCA. The complex valued spectrum of the flow and pressure
signals are [207]
1 1
0 0
, , 0, 1,..., 1k n k n
N Nj t j t
k n k nn n
Q q t e P p t e k N
[4.1]
where ( )nq t and ( )np t are the pressure (mmHg) and flow (ml/s) at discrete time nt and
( )kQ and ( )kP the corresponding pressure and flow at a frequency k . Here
2k k NT , where N are the total number of samples and T the sampling interval.
Likewise, the inverse discrete Fourier transform is
1 1
0 0
1 1, , 0, 1,..., 1k n k n
N Nj t j t
n k n kk k
q t Q e p t P e n NN N
[4.2]
and can be used to rebuild the time-domain signal from the frequency domain. Equations
[4.1] and [4.2] can be converted from the complex exponential form to trigonometric
functions using Euler’s identity, cos sink nj tk n k ne t i t . This form is also included
here as it can be used to provide an intuitive interpretation of media dynamics. Henceforth
the subscripts k and n are omitted for brevity.
Equation [4.1] results in a complex number that contains both real and
imaginary parts. For this, the magnitude and phase angle for the flow signal can thus
be calculated using
2 21, tan
QQ Q Q Q
Q
[4.3]

85
and likewise calculated in a similar manner for P and P .
4.3.2 Vascular Impedances
Vascular impedance in the vascular system is defined as the measure of the
opposition to pulsatile flow when a pulsatile pressure is applied. Stated succinctly it is the
ratio of the complex quantities
Z P Q [4.4]
so that the impedance modulus (mmHg-s/ml) and phase (rad) are found via
,P
Z Z P QQ
[4.5]
In our design [4.5] provides the desired impedance magnitude and phase.
4.3.3 Selection and Evaluation of an Electrohydraulic Analogy
The individual elements of an impedance circuit include resistors, capacitors, and
inductors of the form
1
, ,R C L
jZ R Z Z j L
j C C
[4.6]
with R (mmHgs/ml) is the resistance, C (ml/mmHg) the capacitance or compliance and
L (mmHgs2 /ml) the inductance or inertance. From [4.6] it is clear that the capacitor and
inductor are dependent on frequency while the resistive elements are not. This dependency
helps in the calibration of the individual elements.
Plotting the impedance magnitude and phase of a human brachial artery provides a
guideline for the general behavior of the desired system. Qualitatively it can be observed
that the magnitude of impedance decreases while the phase initially decreases and then
approaches zero (Figure 4.1). Although numerous models have been proposed that can
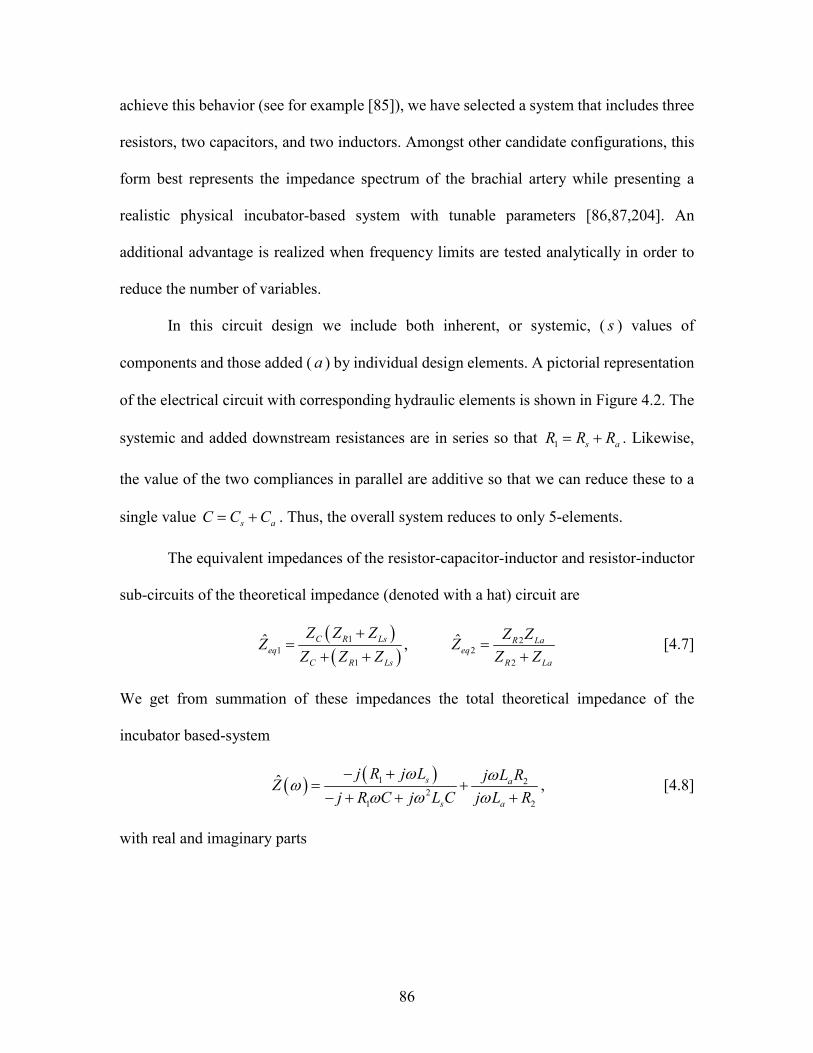
86
achieve this behavior (see for example [85]), we have selected a system that includes three
resistors, two capacitors, and two inductors. Amongst other candidate configurations, this
form best represents the impedance spectrum of the brachial artery while presenting a
realistic physical incubator-based system with tunable parameters [86,87,204]. An
additional advantage is realized when frequency limits are tested analytically in order to
reduce the number of variables.
In this circuit design we include both inherent, or systemic, ( s ) values of
components and those added ( a ) by individual design elements. A pictorial representation
of the electrical circuit with corresponding hydraulic elements is shown in Figure 4.2. The
systemic and added downstream resistances are in series so that 1 s aR R R . Likewise,
the value of the two compliances in parallel are additive so that we can reduce these to a
single value s aC C C . Thus, the overall system reduces to only 5-elements.
The equivalent impedances of the resistor-capacitor-inductor and resistor-inductor
sub-circuits of the theoretical impedance (denoted with a hat) circuit are
1 21 2
1 2
ˆ ˆ,C R Ls R Laeq eq
C R Ls R La
Z Z Z Z ZZ Z
Z Z Z Z Z
[4.7]
We get from summation of these impedances the total theoretical impedance of the
incubator based-system
1 2
21 2
ˆ s a
s a
Zj R j L j L R
j R C j L C j L R
, [4.8]
with real and imaginary parts
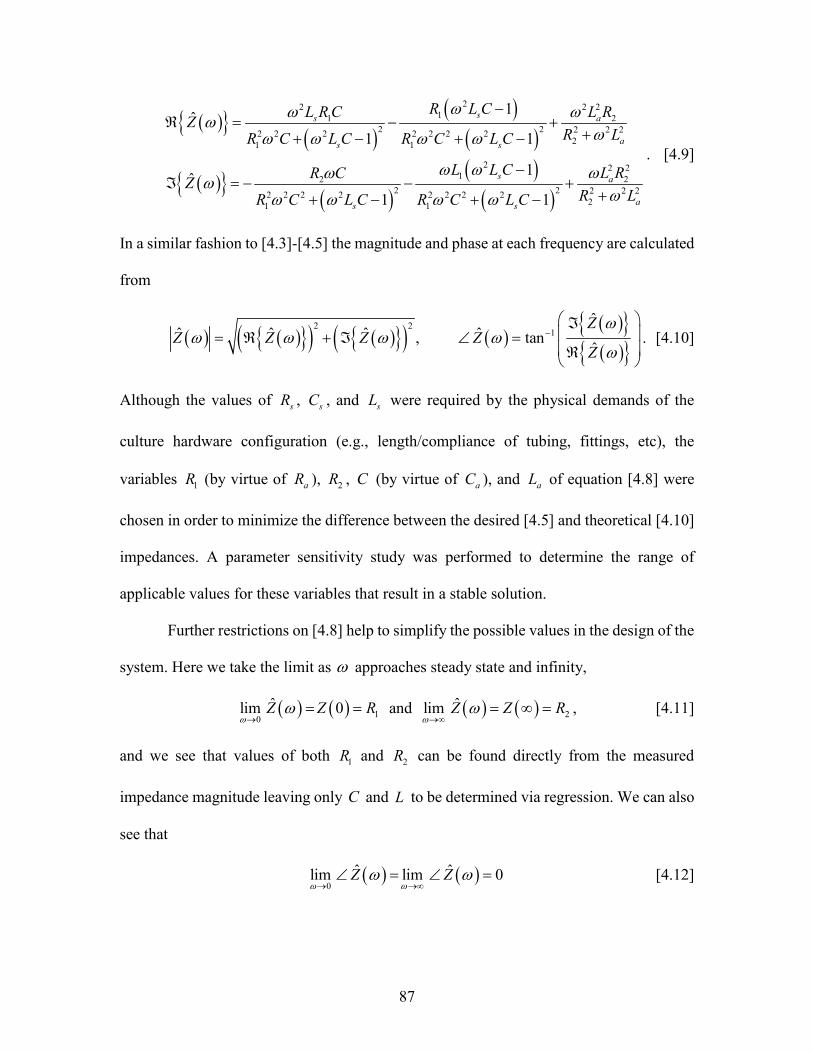
87
22 2 211 2
2 2 2 2 22 2 2 2 2 2 221 1
2 2 21 22
2 2 2 2 22 2 2 2 2 2 2 221 1
1ˆ
1 1
1ˆ
1 1
ss a
as s
s a
as s
R L CL R C L RZ
R LR C L C R C L C
L L C L RR CZ
R LR C L C R C L C
. [4.9]
In a similar fashion to [4.3]-[4.5] the magnitude and phase at each frequency are calculated
from
2 21
ˆˆ ˆ ˆ ˆ, tan
ˆ
ZZ Z Z Z
Z
. [4.10]
Although the values of sR , sC , and sL were required by the physical demands of the
culture hardware configuration (e.g., length/compliance of tubing, fittings, etc), the
variables 1R (by virtue of aR ), 2R , C (by virtue of aC ), and aL of equation [4.8] were
chosen in order to minimize the difference between the desired [4.5] and theoretical [4.10]
impedances. A parameter sensitivity study was performed to determine the range of
applicable values for these variables that result in a stable solution.
Further restrictions on [4.8] help to simplify the possible values in the design of the
system. Here we take the limit as approaches steady state and infinity,
10
ˆlim 0Z Z R
and 2ˆlim Z Z R
, [4.11]
and we see that values of both 1R and 2R can be found directly from the measured
impedance magnitude leaving only C and L to be determined via regression. We can also
see that
0
ˆ ˆlim lim 0Z Z
[4.12]

88
Although [4.12] does not provide any further information towards the value of the design
elements, it does suggest that the desired impedance phase (Figure 4.1) can match that
illustrated by the 5-element electro-hydraulic analogy (Figure 2 and Figure 3).
A weighted residual sum of squares error between the magnitude and phase of the
desired and theoretical impedances results in the fitting of the remaining two parameters (
C and L ) [85],
2 2
2 21
ˆ ˆN k k k k
k kk
Z Z Z Z
ZZ
[4.13]
The least-squared minimization is performed in MATLAB where upper and lower bounds
were based on the theoretically optimal or realistic physical system suited for prolonged
tissue culture as illustrated in the following section.
4.3.4 Calibration and Implementation of the Physical System
The physical system is schematically illustrated in Figure 4.4. Resistance is defined
as the pressure drop Rp across an element at a given volumetric flow rate Rq ,
R
R
pR
q
[4.14]
The values of the systemic and added resistances of our device were measured in isolation
and calculated from [4.14] (Figure 4.5 a-b) noting that 0sR , 0aR , and 2 0R . Except
where otherwise noted, our design used 0.64 cm inner diameter Masterflex PharMed BPT
tubing (Cole-Parmer, Vernon Hills IL) and biologically inert tube fittings. Using a
Poiseuille relation that assumes a circular cross-sectional area, the steady, laminar flow
resistance can be approximated by
89
4
8 R
R
Rr
[4.15]
with R the length of the resistive element, , the dynamic viscosity of the media, and Rr
the inner radius of the resistor. For the most part, equation [4.15] provided guidance only
in the gross design of the system while the accuracy of the equation depends on how closely
the physical conditions match the set of assumptions. Maintaining laminar flow, for
example, is important to the linearity of R but as a pinch valve closes, the Reynolds
number increases towards turbulence thresholds. To overcome this, a custom designed,
elongated “plate” (linearized) valve was created to uniformly compress a greater length of
tubing (roughly 60 cm) so that resistance can be increased to a while maintaining laminar
flow. The results of this custom design are illustrated in Figure 4.5a for the added resistor
aR . In contrast, a standard adjustable tubing pinch valve (Cole-Parmer, Vernon Hills IL)
was used for 2R since its contributions to the total circuit were small. The flow-resistance
relationship for a standard pinch valve is also illustrated in Figure 4.5b.
Similarly, the compliance is related to the flow and the pressure gradient via
C C
C C
q dVC
dp dt dp , [4.16]
where dV is the change in volume of the compliant element for a given change in pressure.
Two compliances in parallel form the total compliance, where 0sC due to the elasticity
of the PharMed tubing. Furthermore 0 a aC V p where aV is the volume of air in
the compliance chamber. The relationship between the value of the added compliance and
the volume of air initially in the compliance chamber can be calculated from the ideal gas
law under isothermal conditions. The compliance chamber consisted of a 60 ml Luer lock

90
syringe (Becton Dickinson Co., Franklin Lakes, NJ) preloaded with a volume of air that
was held in position using standard adjustable lab-stand grips.
From a momentum balance on an element of fluid, the inertance describes the
property of a fluid that impedes changes in flowrate so that
2
L L
L L
pL
dq dt r
, [4.17]
where is the density of the fluid, L the length of the inductor, and Lr the inner radius.
In our initial system 0sL and 0aL (Figure 4.5d) illustrating the importance of including
systemic inductances in the overall design. The added inductance aL was created using a
0.64 cm inner diameter coil of tubing up to 155 cm long.
A 0.32 ml/rev stainless steel gear pump (Micropump Inc., Vancouver WA) with 0-
5V DC speed controlled electromagnetic drive provided steady flow of culture media up
to 30 ml/s. A custom fabricated pulsatile pump consisting of a Masterflex L/S 600 RPM
digital drive was connected to a Masterflex Easy Load pump heads with 3 stainless steel
rollers each (Cole-Parmer, Vernon Hills IL) generate flow through a pulse circuit (Figure
4.4). Two additional roller pump heads were connected via 0.2” pitch trapezoidal tooth
urethane timing belts (McMaster-Carr, Atlanta GA) and timing belt pulleys with 20, 30,
and 40 teeth. The first pulley-gear set resulted in a 2:1 driving-to-driven gear ratio and the
second gear set a 3:2 ratio thereby generating frequencies that include the fundamental,
first, and second harmonics (Figure 4.6). With three rollers per pump head, the digital pump
drive frequency was set to 1/3 the fundamental frequency. Ignoring edge effects and
assuming a negligible tube thickness, the pulse volume from the roller pump and
resultant volumetric flow rate magnitude were calculated from
91
2
, 24
tt
dQ
, [4.18]
where td is the tubing inner diameter and t the length between rollers (2 cm). Assorted
diameters of Masterflex PharMed BPT tubing were used in the roller pump heads to meet
the volumetric flow requirements. A camming mechanism, once disengaged, allowed for
detensioning of the timing belt permitting free rotation of the harmonic channels. The
harmonic channel phases were then set by aligning a single roller of that channel with a
roller of the fundamental frequency and advancing, or retarding, the phase to match the
desired phase angle. Using this approach phase angles were found to be ±10% of the
desired value.
4.3.5 Data Acquisitions
Volumetric flow and pressure were measured using an Atrato 710 series ultrasonic
liquid flow meter (Titan Enterprises, Sherborne UK) with 0.18 sec integration window and
a PX309 stainless steel amplified pressure transducer (Omega Engineering Inc., Norwalk
CT) respectively. Both flow and pressure values were digitized using a NI-DAQ USB 6009
data acquisition system (National Instruments; Austin TX) and recorded using a LabView-
based program at a sampling rate of 125 Hz.
4.3.6 Tissue Procurement and Media Perfusion
Great saphenous veins (GSVs) were harvested from freshly slaughtered 200kg, 3
years-old American Yorkshire Pigs at the local abattoir. All animals used in this study were
sacrificed for the primary purpose of food consumption and were not subject to Animal
Care and Use Committee (IACUC) approval. Tissues were then transported in sterile
Moscona’s saline solution to the lab where they were immediately attached to the large
glass cannula of the bioreactor using sterilized braided silk suture. Dulbecco’s Modified

92
Eagle Media (ThermoFisher Scientific, Waltham MA) with phenyl red was supplemented
with 10% fetal bovine serum, 1% penicillin/streptomycin, 1% amphotericin-B, and 1%
gentamicin. The bioreactor and media were then maintained at a constant 37 deg C and gas
exchange performed at filtered ports. All vascular perfusion experiments were performed
for 6 h.
4.3.7 Gene Expression Analysis
Expression of mRNA for seven remodeling-associated genes relative to -actin (F:
AGGCCAACCGTGAGAAGATG, R: CCCATCCCCAGAGTCCATGA) were quantified
through quantitative real-time polymerase chain reaction (qPCR): Col 3 (F:
GCGGTGACAAAGGTGAAACC, R: GGCTACCTACTGCACCTTGG), FN 1 (F:
TGGGGATACCTGGAGCAAGA, R: GCCTCTCACACTTCCACTCC), PAI 1 (F:
CCTAACCAGGCGGACTTCTC, R: CATGCGGGCTGAGACGATAA), VCAM 1 (F:
CGCTGGTCATGAATCCCGTT, R: ATCTCTGGGTCCTTGGGGAA), MMP 2 (F:
CCTGATCTGGACCCCGAAAC, R: TATCCATCTCCGTGCTCCCA), TGF 1 (F:
CTAATGGTGGAAAGCGGCAA, R: CCCGAGAGAGCAATACAGGTT), TIMP 1 (F:
CACCTGCAGTTTTGTGGCTC, R: GGGATGGATGTGCAGGGAAA). Vessels were
snap frozen on dry ice and stored at -80 C either immediately after dissection or at the
completion of ex vivo culture. Frozen tissues were homogenized using a Qiagen
TissueRuptor (Qiagen, Hilden, Germany), immediately followed by total mRNA isolation
with a Qiagen RNeasy Fibrous Tissue Mini Kit (Qiagen, Hilden, Germany). After total
mRNA quantification using an Implen Nanophotometer Pearl (Implen, Munich, Germany),
500ng mRNA was converted to cDNA via an iScript cDNA Synthesis Kit (Bio-Rad,
Hercules, CA). qPCR assays were then run using the genes listed above on a Bio-Rad CFX

93
Connect Real-Time System (Bio-Rad, Hercules, CA) using Fast SYBR Green Master Mix
(Applied Biosystems, Foster City, CA). Wells within plates were triplicated, each plate
configuration was run three times, and threshold values were set at a consistent value of
300 RFU. Relative gene expression was calculated using the ΔΔCT method with GSV flow
conditions being the reference samples. All cDNA samples were validated by end-point
PCR using PuReTaq Ready-To-Go PCR beads (GE Healthcare, Buckinghamshire, UK)
and gel electrophoresis.
4.3.8 Statistical Analysis of Gene Expression
For each combination of gene and experimental condition (e.g., GSV Col 3),
reported data represent an average of n=27 data points (n=3 samples, n=3 plates, n=3
wells/plate) except for outliers, which were discarded, for both the gene of interest and -
actin. Error bars reflect the standard error of the mean for all included data points. Two-
tailed Student’s t-tests (p < 0.05) were conducted both between GSV-BrA and GSV-LCA
samples.
4.4 RESULTS
The BrA pressure and flow waveforms were digitized using the ImageJ (NIH)
“Figure Calibration” plugin and the MATLAB Fast Fourier Transform (FFT) command
used to identify the magnitude and phase for the steady, fundamental, and harmonics of the
periodic signals (Table 4.1). Figure 4.1 iillustrates the time and frequency domain
relationships between pressure and flow in a BrA. The BrA has an impedance magnitude
that decreases with frequency and, by virtue of the negative phase angle at low frequencies,
flow leads the pressure. LCA and GSV pressure and flow waveforms were also digitized
in a similar manner to the BrA.

94
The decreasing impedance magnitude and negative phase angle of the BrA
provided guidance for the form of the elector-hydraulic analogy and bench-top impedance
configuration. Here, a 5-element model was found to best represent both the BrA
impedance and a realistic incubator-based setup (Figure 4.2). Comparisons to other model
configurations are otherwise omitted for brevity. The form of this configuration enables a
direct calculation of 1R and 2R (equation [4.11]), leaving only C and L to be estimated
via regression. However, to determine the breadth of application for this model, a
parameter sensitivity study was also performed as illustrated in Figure 4.3.
The physical system, first represented by the electrohydraulic analogy (Figure 4.2),
is realized diagrammatically in Figure 4.4. The nominal system resistance was slightly
nonlinear (i.e., a line with nonzero slope in the R vs. q plot) with a maximum value of 6.7
mmHg·s/ml for the range of volumetric flows tested during calibration (triangles – Figure
4.5a). The value of R was comparatively low so that the majority of the desired resistance
was still generated by the valve and not systemically. The plate (linearized) valve
demonstrated a nearly linear resistance that increases with decreasing orifice area (Figure
4.5a). In contrast, the standard pinch valve demonstrates an extensive nonlinearity with
decreasing orifice area (Figure 4.5b). The valve’s rotational position , was used as a
qualitative descriptor that relates to the orifice area but this exact relationship was not
solved directly.
The systemic compliance was found to be constant at sC =0.0059 ml/mmHg up to
300 mmHg for the nominal length of tubing, =144 cm (Figure 4.5c) and increases to sC
=0.010 ml/mmHg when the tubing length was doubled (data not shown). Thus system
compliance has a nearly linear relationship with the length of tubing. Likewise, the
95
compliance chamber was capable of generating tunable compliance levels up to aC =0.07
ml/mmHg for volumes up to 60 ml. The experimentally measured values generated by the
compliance chamber (around a 100 mmHg operating point) were similar to those
determined using the ideal gas law. Further, the average system inductance was found to
be sL =0.363±0.103 mmHg·s2/ml for frequencies ranging from 4.73 to 15.8 rad/s. This
experimental value was similar to the theoretical value ( sL =0.336 mmHg·s2/ml) for the
systemic length and diameter of tubing ( L =144 cm, Lr =0.32 cm). We note that compliant
tubing was used in the estimation of inductances thus the true value may be augmented in
a rigid tubing system. Added inertance was achieved through the selection of inertance
tubing diameter at lengths up to 155 cm. Furthermore, the pulsatile pump (Figure 4.6) was
able to generate fundamental and harmonic frequencies of pulse generation with little drift
over the duration of experimentation. Small errors in flow occurred when the difference
between the desired and actual tubing diameters were large. Still, volumetric flow rates
were near the desired values (Figure 4.7 and Figure 4.8).
All systemic values of the electro-hydraulic analogy, sR , sC , sL , were fixed in the
regression model of impedance matching while the added values, aR , 2R , aC , aL , were
bound only by the physical limitations of the system as described in the methods section
(Table 4.2). These restrictions were necessary to create a practical device aimed at long-
term perfusion culture of living tissue. The resulting error between the desired impedance
and the theoretical and measured impedance magnitude and phase are illustrated in Figure
4.7 c,d. The error between the desired and theoretical impedances were low in the BrA
(RSS=0.012), negligible in the GsV, but high in the LCA (RSS=0.884). The high error was
due to the initial positive phase of the impedance function for which the 5-element circuit
96
was not capable of recreating. That notwithstanding, the circuit recreated well the shape of
the pressure waveform once shifted by roughly 0.2 seconds.
Gene expression profiles for freshly isolated GSVs exposed to GSV, LCA, or BrA
waveforms for 6 h are illustrated in Figure 4.9. Compared to vessels exposed to GSV-like
waveforms, those experiencing BrA conditions had statistically significant expression of
all measured genes (p<0.02), except VCAM 1. In contrast, differences were only found in
MMP 2 (p=0.036), FN 1 (p=0.001), and TIMP 1 (p=0.033) gene expression when
comparing vessels exposed to GSV waveforms to those experiencing LCA-like
waveforms. PAI 1 was the only gene that was found to be differentially expressed by
vessels exposed to BrA-like conditions compared to LCA conditions (p=0.008). However,
PAI 1 (p=0.002), VCAM 1 (p<0.001), and TGFB 1 (p=0.002) were all found to be
statistically significant when comparing acute gene expression levels of freshly isolated
tissues to those exposed to in situ loading conditions in the bioreactor (Figure 4.10).
Although all samples tested here were studied after 6 h for the purposes of isolating the
effects of specific waveforms, perfused vessels have been maintained in our culture system
for up to 3 weeks with viability assed using vasoreactants and metabolic assays (data not
shown).
4.5 DISCUSSION
Hemodynamic studies of the last 45 years have provided a wealth of information
that can be used as a target for the design of modern vascular tissue culture systems. In our
present work, a Fourier series representation of simultaneously recorded brachial artery
blood pressure and flow waveforms from the classic study of Gault and colleagues was
used to guide the design of an in vitro culture system [1]. From this data the desired
97
impedance magnitude and phase were estimated in the frequency domain and a 5-element
electro-hydraulic analogy consisting of resistors, capacitors, and inductors implemented
[85]. The chosen configuration represents the data well while serving as a guide towards
the design of implementable hardware elements. Our semi-distributed elemental design
considers separately the inherent, but significant, contribution of the systemic properties of
our culture hardware to the total hydraulic circuit from those desired properties contributed
by the added elements. The remaining coefficients of the electro-hydraulic model were
then found by minimizing the error between the desired and theoretic impedances. Thus, a
biomimetic impedance matching system was developed that takes into consideration real-
world hardware configurations. The physical system was built using tissue-culture ready
components, and the capacity of this device to recreate physiological waveforms evaluated.
As proof of concept, qPCR was performed on freshly harvested saphenous vein segments
under the brachial artery conditions and compared to coronary-like, and venous (in situ)
media dynamics for 6 h. The relative gene expression for each of these cases were then
analyzed and compared for the arterial or venous waveforms.
Vascular impedance is a convenient tool in the analysis of in vivo hemodynamics
[192]. The design of a number of pulsatile bioreactors have included resistive, capacitive,
and inductive elements in the hydraulic analogy; however, few systems have translated the
electro-hydraulic impedance approach into in vitro systems [44,84,96,99,185,197–201].
The work of Kung and Taylor provided a framework for the recreation of the vascular
hemodynamics using customized impedance modules in a bench top system [92]. The
advantage to their, and thus our, approach is that the analysis can be performed in the
frequency domain, facilitating subsequent delineation of the phasic relationships towards
98
the waveforms desired to effect tissue remodeling. Moreover, the design elements can be
bounded within physically obtainable values while incorporating the inherent contribution
of systemic elements. Ours however, is the first study of its kind to test gene expression
using the impedance matching approach for a brachial artery and to compare vessels
exposed to multiple vascular waveforms. This approach permits future investigations to
isolate and delineate specific media pressure and flow wave components to ascertain what
is fundamental in the design of vascular perfusion studies. Another advantage is the
scalability of our system in terms of both size and cardiac frequency. The capacity to
include higher biomimetics from species with accelerated heart rates (e.g., rodent models)
is readily adaptable into our design approach thus providing an opportunity to study
numerous transgenic models of vascular disease while isolating conditions of interest.
Fundamental to the design of our perfusion bioreactor was the seamless transition
from the theoretical to physical hardware while maintaining a sterile environment. In
general, we sought the fewest possible elements and for those elements to be maintained
in the simplest configuration. Clearly a tradeoff exists between the complexity of a culture
system and its ability to recreate in vivo conditions. Through the electrohydraulic analogy,
2, 3, and 4 elemental systems, of varying configurations, were also simulated in order to
find the best configuration to represent in vivo and in vitro data. An interested reader can
refer to Yoshigi et al. for a general description of these models [85]. However, to mimic
the desired impedance spectrum while recreating a reasonable incubator-based
configuration, the 5-element electrohydraulic analogy described herein was the best fit and
a parameter sensitivity study performed around a stable equilibrium point. In fact, our
hardware was readily capable of matching the desired BrA and GSV waveforms. On the

99
other hand, the desired values of LCA waveforms were positive in phase at the fundamental
frequency (Figure 4.8c-d). Such behavior is not capable of being replicated with the current
setup. Instead we recreated the pressure and flow waveforms that were out of phase with
their desired waveforms for the LCA, but precise in both shape and magnitude.
The unique pulsatile pump in our culture system consists of discrete channels of
roller heads so that pulsatility can be gradually added without risking contamination (e.g.,
transitioning from a venous to arterial-like fluid dynamics). The pump design was
motivated by a literal interpretation of the Fourier series approach to hemodynamic
waveform analysis whereby volumetric flow can be broken down into individual sinusoids.
In similar fashion, all resistances were adjustable without exposing the culture media to
contamination. Still certain nominal, or “system” properties were created through the
connectivity of such a culture system. In many models, such properties would be lumped
together. However, we found that distributing the inherent system parameters from the
added ones enabled a more realistic approach to the overall system design while allowing
for calibration and refinement of these individual elements. In terms of both compliance
and inductance the nominal values of these parameters were significant and could not be
neglected in the overall design. For example, the system compliance that results from
elasticity of the tubing was so high ( sC =0.005 ml/mmHg) that no additional compliance
from the compliance chamber was needed. Retrospectively the compliance of the system
could be reduced by selection of more rigid tubing and is a consideration of future work.
The measured system inertance was also large ( sL =0.363±0.103 mmHg·s2/ml) even after
tubing diameters were increased to keep this value low. Thus the 5-element design that
included systemic values of inductance and compliance were instrumental in the

100
experimental outcome.
The GSV was chosen as a conduit to study gene expression due to its prevalence in
coronary and peripheral artery bypass grafting. Although this vessel has similar inner
diameters to the coronary and brachial arteries, the pressure and flow was significantly
higher in the arterial system while little to no pulsatility present in the saphenous vein under
in situ conditions. At similar diameters, the higher flow conditions would proportionally
increase luminal shear stress. In fact, we observed an acute vasomotor response, in terms
of caliber reduction, when vessels were mounted to our system but prior to the initiation of
flow. From the contemporary literature, one would expect altered expression of many
mechanically sensitive genes when comparing arterial to venous pressure and flow
conditions. In fact, almost all of the genes studied were differentially expressed using
arterial-like waveforms when compared to venous ones. Interestingly, only PAI 1 was
affected when comparing GSVs exposed to LCA conditions compared to GSVs exposed
to BrA waveforms. PA I 1 has been implicated in a variety of remodeling processes
[177,206,208] and been shown to increase in response to elevated shear stress and pressure
[52,96]. Since the BrA and LCA waveforms were similar, it is not surprising to note that
PAI 1, expressed by both endothelial and smooth muscle cells, was the only differentially
expressed gene within arterial waveforms.
It was observed, however that when comparing the gene expression of freshly
isolated GSVs to those under replicated in situ conditions in 6 h of culture, PAI 1 was the
most dramatically affected gene followed by VCAM 1 and TGFβ 1. Various other genes
appeared to be different without reaching statistical significance. Collectively this data
suggests that gene expression was nominally affected by the culturing processes. The

101
extent towards which such a condition significantly influences the results remains to be
discovered. However, it is important to consider that all of the other gene expression
analyses were performed on tissues exposed to similar conditions except altered media
fluid dynamics. Although not the subject of the current manuscript, ongoing long-term
studies (>3 wks) will be able to report on the resultant protein composition of these studies.
Viability of those cultures have been successfully confirmed through administration of
endothelial and smooth muscle dependent vasoreactants and a colorimetric metabolic
activity assay. Our studies at 6h were sufficiently long so that the effects of dissection and
excision under static conditions would be ameliorated by the culture but short enough so
that histological morphological changes did not occur.
The contributions of each harmonic of pressure and flow to the overall waveform
diminish at higher harmonics with 95% of the energy contained in the first 5 harmonics
[209]. While it is clear and widely accepted that pressure and flow exert some effect over
blood vessel morphology, the prevailing challenge is determining what extent the subtler
characteristics such as higher harmonics, pressure-flow phase differences, and rate of
change in these quantities drive remodeling behavior. While this study provides some
guidance into the underlying requirements in the design of vascular bioreactors, for the
time being significant evidence points, at the least, towards an inclusion of the fundamental
frequency components of pressure and flow pulsatility during in vitro culture. There exists
a need for careful experimentation where these subtle influences can be discovered.
4.6 ACKNOWLEDGMENTS
The authors would like to acknowledge the contributions of undergraduate
researcher Shahd Hasanian for her assistance with the gene expression studies. This

102
research was supported by NIH grant R21EB022131 (JFE)

103
4.7 TABLES
Table 4.1 – Magnitude and phase of simultaneously recorded blood pressure and flow waveforms from the literature [1–3], which illustrates the desired steady, fundamental, and first two harmonics of the Brachial Artery (BrA), Greater Saphenous Vein (GSV), and Left Coronary Artery (LCA).
k
(rad/s)
P
(mmHg)
P
(rad)
Q
(ml/s)
Q
(rad)
BrA (Human)
0 0 90.1 0 1.68 0 1 6.21 19.9 -1.52 0.74 -0.91 2 12.4 13.6 -2.26 0.62 -1.07 3 18.6 6.26 -3.05 0.56 -1.84
GSV (Human)
0 - 15.0 - 0.17 - 1 - - - - - 2 - - - - - 3 - - - - -
LCA (Human)
0 0 101 0 0.94 0 1 8.94 16.1 2.64 0.43 3.04 2 17.9 5.66 -0.18 0.18 0.12 3 26.8 5.65 -2.97 0.17 -2.05
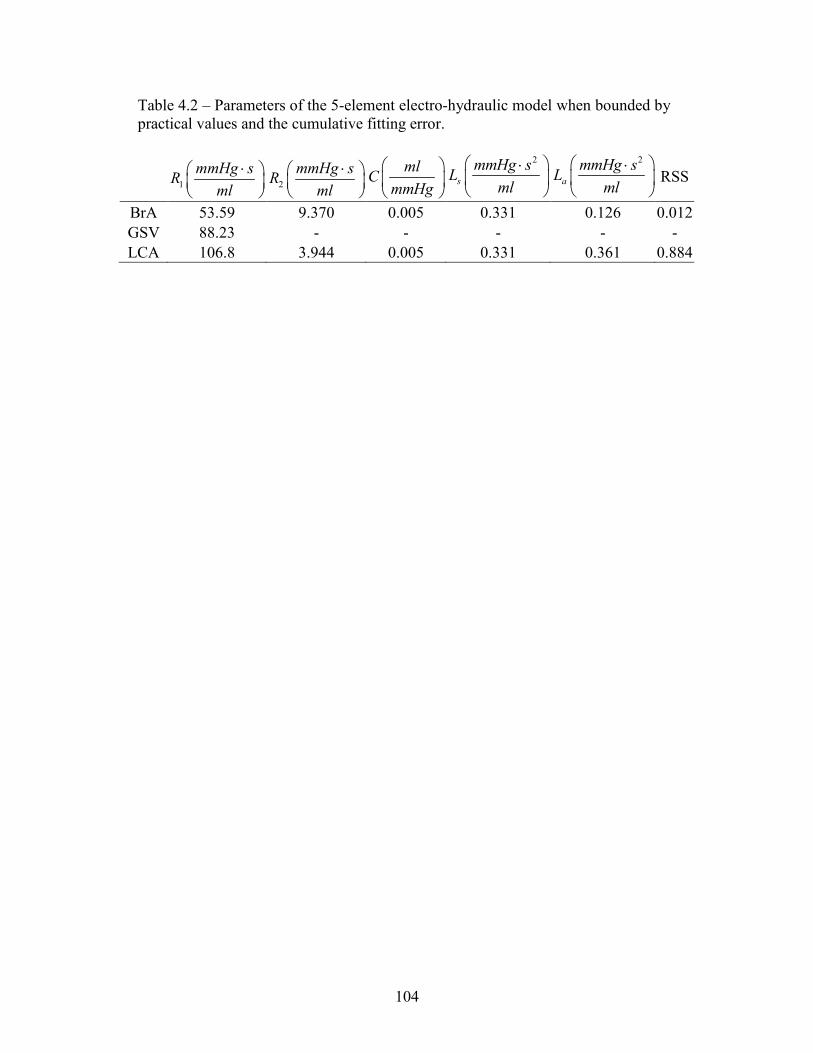
104
Table 4.2 – Parameters of the 5-element electro-hydraulic model when bounded by practical values and the cumulative fitting error.
1
mmHg sR
ml
2
mmHg sR
ml
mlC
mmHg
2
s
mmHg sL
ml
2
a
mmHg sL
ml
RSS
BrA 53.59 9.370 0.005 0.331 0.126 0.012 GSV 88.23 - - - - - LCA 106.8 3.944 0.005 0.331 0.361 0.884
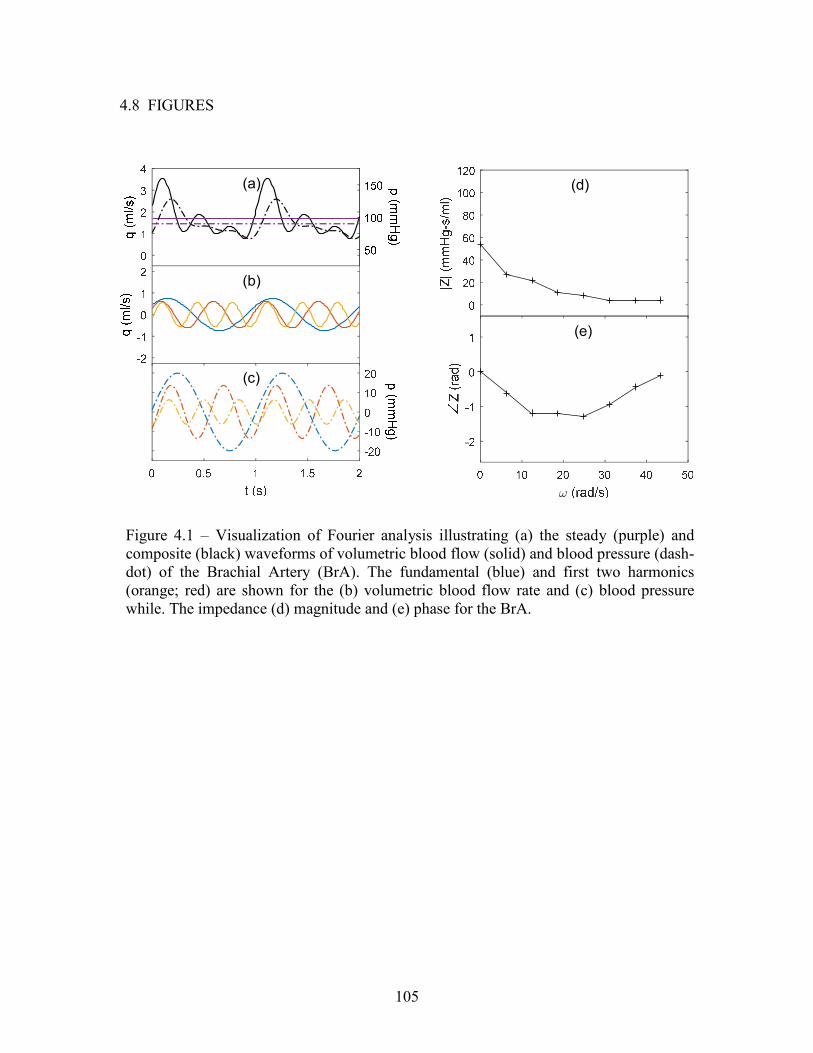
105
4.8 FIGURES
Figure 4.1 – Visualization of Fourier analysis illustrating (a) the steady (purple) and composite (black) waveforms of volumetric blood flow (solid) and blood pressure (dash-dot) of the Brachial Artery (BrA). The fundamental (blue) and first two harmonics (orange; red) are shown for the (b) volumetric blood flow rate and (c) blood pressure while. The impedance (d) magnitude and (e) phase for the BrA.
(a)
(b)
(c)
(d)
(e)

106
Figure 4.2 – (a) Electro-hydraulic analog of the cardiovascular system and bench top schematic with (b) equivalent impedances.

107
Figure 4.3 – . Parameter sensitivity of the 5-element electrohydraulic analog
demonstrating impedance magnitude (left) and phase (right). (a-b) 1 10,110R
(mmHgs/ml), (c-d) 2 0, 24R , (e-f) 0.005,0.025C (ml/mmHg), and (g-h)
0,0.8aL (mmHgs2/ml). Default values of 1R =60 (mmHgs/ml), 2R =5
(mmHgs/ml), C =0.01 (ml/mmHg), aL =0.33 (mmHgs2/ml), and sL =0.33
(mmHgs2/ml). Arrows indicate the direction of increasing values of the given parameter.
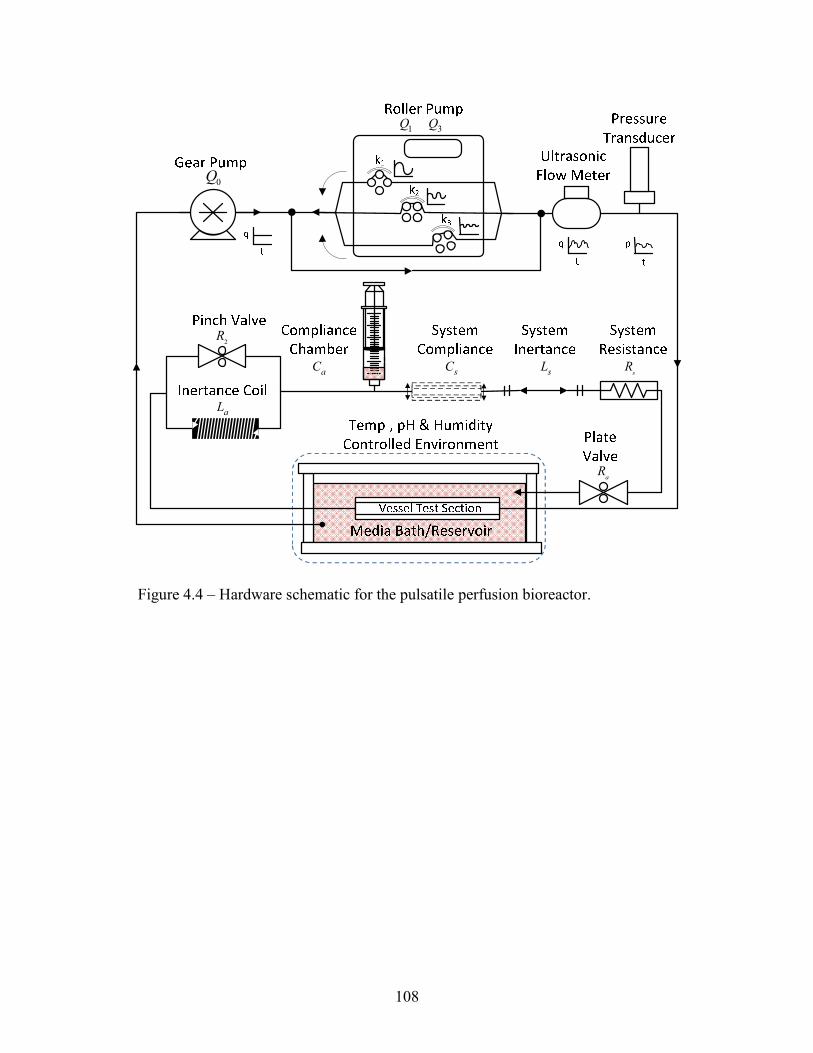
108
Figure 4.4 – Hardware schematic for the pulsatile perfusion bioreactor.
0Q
1 3Q Q
aR
2R
aC sC sL
aL
sR

109
Figure 4.5 – Values of isolated design elements in the pulsatile perfusion bioreactor: (a) measured systemic resistance and the resistances at discrete positions of a custom designed plate (linearized) valve and (b) resistances at discrete positions of the tubing pinch valve, (c) measured systemic compliance and measured versus estimated added compliance using chamber with different preload volumes of air. (d) Measured systemic inductance and added inductances from a coil of tubing using different tubing diameters.
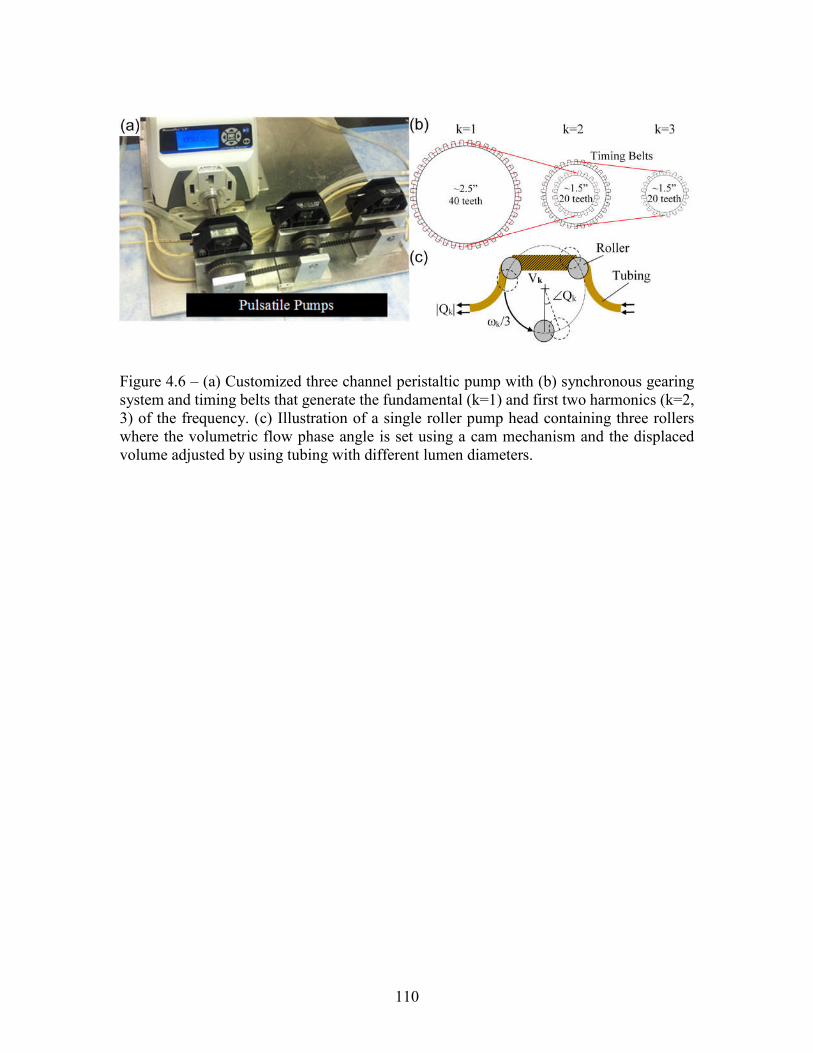
110
Figure 4.6 – (a) Customized three channel peristaltic pump with (b) synchronous gearing system and timing belts that generate the fundamental (k=1) and first two harmonics (k=2, 3) of the frequency. (c) Illustration of a single roller pump head containing three rollers where the volumetric flow phase angle is set using a cam mechanism and the displaced volume adjusted by using tubing with different lumen diameters.

111
Figure 4.7 – Simultaneous brachial artery (BrA) (a) volumetric blood flow rate and (b) blood pressure for one cardiac cycle. Solid lines indicate the desired waveform and () the values recorded in our bioreactor system. (c) The impedance modulus and (d) phase for the desired (), theoretical (), and measured response ().

112
Figure 4.8 – Simultaneous (a-b) greater saphenous vein (GSV) and left anterior descending coronary artery (LCA) (c-d) volumetric blood flow rate and pressure for one cardiac cycle. Solid lines indicate the desired waveform and () the values recorded in our bioreactor system. The arrow indicates the shifted coronary artery blood pressure from the desired value.

113
Figure 4.9 – Gene expression profiles for GSVs exposed to GSV, BrA, or LCA-like pulsatile media pressure and flow waveforms for 6 h. Data are reported as fold change relative to the GSV conditions. Error bars indicate ± standard error of the mean. (*) denotes differences between GSVs exposed to LCA or BrA conditions and the GSV at IS conditions. (^) Denotes differences between GSVs exposed to BrA and GSVs exposed to LCA. Statistical significance is considered at p<0.05.

114
Figure 4.10 – Relative expression profiles of select vascular remodeling genes for the GSV after 6 h of in vitro culture at in situ pressure, flow and axial loading conditions represented as fold change from freshly harvested vessels. (*) Denotes significant differences between the measured gene after 6 h of culture and freshly harvested
115
CHAPTER 5
COMPARATIVE BIAXIAL MECHANICS OF MAMMALIAN CAROTID ARTERIES4
4 Prim, D. A., Mohamed, M. A., Lane, B. A., Poblete, K., Wierzbicki, M. A., Lessner, S. M., Shazly, T., Eberth, J. F.. Submitted to PLoS ONE, 12/22/2017

116
5.1 ABSTRACT
The prevalence of diverse animal models as surrogates for human vascular
pathologies necessitate a comprehensive understanding of the differences that exist
between species. Comparative passive mechanics are presented here for the common
carotid arteries taken from bovine, porcine, ovine, leporine, murine-rat, and murine-mouse
specimens. Data is generated using a scalable biaxial mechanical testing device following
consistent protocols and fit to two common constitutive models of arterial behavior: the
phenomenological Fung-type exponential and the structurally-motivated 4-fiber
Holzapfel-Gasser-Ogden (HGO) model. Both models fit experimental data well across all
examined species. The structural mechanical response of carotids under equivalent loading,
quantified by the deformed inner radius, deformed wall thickness, lumen area compliance
and axial force, varies significantly among species but generally follows allometric scaling.
Conversely, descriptors of the local mechanical response within the deformed arterial wall,
including mean circumferential stress, mid-wall circumferential stretch, and mean axial
stress, are relatively consistent across species. Taken together, our results provide baseline
structural and mechanical information for carotid arteries across a broad range of common
animal models.
5.2 INTRODUCTION
In humans and all other mammals, common carotid arteries (CCAs) supply
oxygenated blood to critical cognitive and masticatory structures. Atherosclerosis of the
CCAs, otherwise known as carotid artery disease, begins as an asymptomatic pathology
and can lead to stenosis, plaque embolism, and ischemic stroke [210]. Of approximately
800,000 strokes in the U.S. each year as many as 15% can be attributed to carotid artery

117
disease [211,212]. According to a recent clinical investigation, over 30% of asymptomatic
patients age 40-54 exhibit subclinical CCA atherosclerosis [213], suggesting a very large
aging population at future risk of stroke and motivating further study into disease
progression, diagnosis, and treatment.
Mechanical changes in carotid arteries can occur as a result of surgical intervention,
device implantation, local and systemic disease progression, and tissue remodeling in
response to altered hemodynamic stimuli. For example, carotid arteries from patients with
dyslipidemia and type II diabetes were shown to be stiffer than paired noninjured arteries
[214], which is commonly acknowledged as a predictor of increased risk of mortality [215].
Carotid artery stenting and carotid endarterectomy on the other hand, are the two most
common interventions for severe carotid artery disease [216]. In either case understanding
the baseline CCA mechanics can be fundamental to characterizing both healthy remodeling
and undesirable pathologies [217,218].
Quantification of passive arterial mechanical properties requires freshly excised
tissue tested in a biaxial configuration, with diverse mammalian tissue used in many
preliminary investigations to test hypotheses that would be impractical, if not impossible,
to test on human tissue [15,28,46,139,218–221]. For the case of studies involving CCA
mechanics, it may be prudent to select an animal model with specific baseline values of
structural or mechanical properties under physiological loading that may scale with
mammalian weight. It is likely that some, but not all, CCA properties follow allometric
scaling laws among mammals, but such relationships have not yet been established [222–
225].

118
In this study, we investigate and compare the passive biaxial mechanical properties
of CCAs freshly harvested from bovine, porcine, ovine, leporine, and two murine animals,
the laboratory rat and the laboratory mouse. A unique yet modular biaxial testing device is
used to measure the passive mechanical properties through inflation-extension testing
using similar protocols and procedures for each vessel. All experimental data is then fit to
two widely accepted constitutive models: the phenomenological Fung-exponential, and the
structurally motivated 4-fiber family Holzapfel-Gasser-Ogden (HGO) model [4,5]. Once
identified, model parameters can be implemented into diverse boundary value problems
and computational models. Obtained results therefor provide a catalog of information that
can be used to guide the selection of animal models for future CCA studies.
5.3 MATERIALS AND METHODS
5.3.1 Vessel Isolation and Preparation
Male bovine (Angus cow; 500 kg), porcine (American Yorkshire pig; 108 kg),
ovine (Suffolk-Rambouillet sheep; 35.1 kg), and leporine (New Zealand White rabbit; 4.03
kg) carotid specimens (n=6; each) were obtained from local abattoirs at roughly 18, 6, 10,
and 3 months old respectively. Specimens from bovine, porcine, and ovine animals were
designated for consumption and considered to be mature at the time of slaughter. Murine-
rat (Sprague-Dawley rat; 0.49 kg) and murine-mouse (C57BL/6J mouse; 0.028 kg) were
laboratory animals sacrificed at 8 and 3 months of age respectively and were subject to
Animal Care and Use Committee (IACUC) approval at the University of Houston and the
University of South Carolina.
Vessels were harvested immediately after slaughter/sacrifice and transported in
sterile Moscona’s saline solution at 4 C to the laboratory where perivascular and loose

119
adventitial tissue was removed from each sample. The perivascular tissue was notably more
difficult to remove from the larger vessels. To minimize edge effects, vessels were trimmed
so that the length was at least 10-times greater than the diameter but fit within the 25cm
long tissue bath of the biaxial testing device at 2-times its unloaded length. Vessels were
then secured to appropriately-sized barbed fittings, syringe needles, or glass cannulas
(mouse only) with braided silk suture. Prior to and throughout testing, Krebs-Henseleit
solution at pH 7.4 and containing 10-5 M sodium nitroprusside was perfused through, and
around, the sample and then continuously circulated in the adventitial bath in order to
guarantee a fully relaxed smooth muscle state. Once mounted within the test chamber
samples were maintained at 37.2 oC using a 15W submersion heater within the adventitial
bath.
5.3.2 Biaxial Mechanical Testing
All mechanical testing was performed on a modular, custom-designed, biaxial
mechanical testing device with LabView-based data acquisition (National Instruments;
Austin TX). Reference [226] provides much of the general layout of a similar testing
apparatus with hardware in that publication specific to the mouse carotid arteries and ours
designed to accommodate larger specimens. Other differences in hardware or configuration
are described here. Luminal inflation was initiated with a feedback controlled syringe pump
(World Precision Instruments; Sarasota, FL) and pressure measured using an amplified 0-
300 mmHg USB pressure transducer (Omega Engineering, Norwalk, CT). To
accommodate large variations in vessel size, the objective lenses for a CMOS Monochrome
1280x1024 USB camera (Edmund Optics; Barrington, NJ) were selected to yield 580
pixels/mm, 287 pixels/mm, 144 pixels/mm, or 52.0 pixels/mm. Likewise force transducers

120
(Omega Engineering) capable of measuring up to 0.1 N, 1.1 N, or 44 N were interchanged
once a preliminary force range was determined for each species. The force transducer was
connected to the blood vessel using a pivoting L-shaped arm allowing the transducer to be
isolated from the liquid media. Stepper motor micrometer-driven translation stages
(Thorlabs; Newton, NJ) were also chosen with 10 mm, 25 mm, or 100 mm of travel to
provide adequate axial extensions. Each piece of hardware was extensively calibrated prior
to data collection.
Initial measurements were made of the unloaded length and diameter with the
specimen mounted in the biaxial testing device, but prior to pressurization or axial
extension. To ensure repeatable loading curves, all vessels underwent three cycles of
preconditioning of inflation/deflation pressurization from 0-160 mmHg (1 mmHg/s) at
1.50±10% axial extension ratio. Following preconditioning, vessels were axially extended
to 1.5 and pressurized step-wise from 0-160 mmHg in 10 mmHg increments. A 10 second
equilibrium period was allowed at each step then diameter measurements were collected
via the calibrated CMOS camera (Figure 5.1, left) and axial force measurements recorded.
Next, luminal pressure was adjusted to 100 mmHg, and the axial stretch z set so that
vessels experienced a very small tensile force. This stretch was recorded as minz . Then
vessels were extended axially in stretch increments corresponding to a 0.05 increase in
extension ratio while recording outer diameter and axial force at each step following a 10
second equilibrium period.
5.3.3 Data Analysis
Vessels were removed from the device and centrally located ring sections cut from
the samples. Images of rings were collected using a microscope mounted DSLR camera

121
(Canon USA, Long Island NY) and the magnification set to maximize the field of view
using the millimeter scale of a ruler (Figure 5.1, right). The unloaded inner and outer
circumference of each section were quantified using ImageJ software (NIH), and the inner
iR and outer oR radii calculated. From this, the cross-sectional tissue area was calculated
via
2 2o iA R R [5.1]
Unlike prior work (see [15,227]), we chose not to induce a stress relieving cut.
Although straightforward with large vessels, prior experience with mouse carotid arteries
suggested that the stress relieving cut would introduce considerable error (laboratory
observations).
Through real time measurements of outer diameter and assuming vessel
incompressibility, the deformed inner radius ir is calculated from
2i o
z
Ar r
, [5.2]
where 2or OD is the deformed outer radius and z the axial stretch ratio. The lumen
area compliance is then calculated from
2
iA
rC
P
, [5.3]
where P is the transmural pressure. For consistency, P is measured around 100 mmHg
and ir the change in radius about this point. Mean circumferential and axial stresses are
calculated as
iPr
h ,
2
2 2
iz
o i
F P r
r r
, [5.4]

122
with F , the axial force, and o ih r r the wall thickness. The pressure contribution on the
right-hand-side of equation [5.4] is consistent with a force balance of a pressurized, closed
tube [137].
The circumferential, axial, and radial stretches are calculated by
i o
i o
r r
R R
, z
l
L ,
1 r
z
, [5.5]
where we note the radial stretch is found via incompressibility and circumferential stretch
represents the mid-wall value.
5.3.4 Theoretical Framework
All vessels are modeled within a continuum mechanics framework. Here the radial,
circumferential, and axial Cauchy stresses can be found via
2 Wp
E
, 2z z
zz
Wp
E
, 2
r r
rr
Wp
E
, [5.6]
where p is the Lagrange multiplier used to enforce incompressibility and rrE , E , and
zzE , are components of the Green strain tensor and relate to the stretch ratios by:
211
2E , 21
12
zz zE , 211
2rr rE , [5.7]
assuming r z , then 0r , and from the right hand side of [5.6],
2r rrp W E [5.8]
Thus, a two-dimensional approximation of [5.6] is found such that
2 2r
rr
W W
E E
, 2 2z z r
zz rr
W W
E E
. [5.9]

123
For this investigation we consider two popular forms of W . First, we utilize a
formulation of the phenomenological Fung-type exponential model described by Chuong
and Fung [4]. In the absence of shear terms, the equation for strain energy is
0 1QW c e , 2 2 21 2 3 4 5 62 2 2rr zz rr zz rr zzQ c E c E c E c E E c E E c E E , [5.10]
where 0c is a stress-like material parameter and ic , 1 6i are non-dimensional
parameters. To ensure convexity 0ic and 21 2 4c c c , 2
2 3 5c c c , and 21 3 6c c c [5,228].
Next, we utilize a structurally motivated model initially proposed by Holzapfel,
Gasser, and Ogden (HGO), and later modified to include additional fiber families [5,6].
This particular model separates the isotropic from the anisotropic contribution to the strain
energy
21,2 2 22,2 2
1,2,3,4 2,
13 exp 1 1
2 4
k
z k kkz k
ccW c
c
[5.11]
Here a total of four fiber families 1, 2,3, 4k are considered with
2 2 2 2sin cosk k z k the stretch of the thk fiber family, and k is the angle that
family makes with respect to the longitudinal axis. c is a material parameter for the
isotropic contribution, and 1,kc and 2,kc material parameters for the anisotropic
contributions. We assume that 1 =90 deg represents circumferentially oriented fibers and
2 =0 deg represents those that are oriented axially. We further consider two of the families
to be symmetric and helically arranged so that 3 4 , 13 14c c , and 2,3 2,4c c
[5,15,139].
Equations [5.4] and [5.9] yield expression for the modeled pressure and force,
namely

124
2 2r
i r
h W WP
r E E
, 2 2 22 i z r i
z r
W WF h r h P r
E E
, [5.12]
from which the only unknown values are the material parameters in each strain energy
function. These best-fit values are found by minimizing an objective function between the
experimentally ( exp ) measured and modeled ( mod ) pressure and force. An objective
function is then postulated of the form
2 2
1
mod exp mod expN
exp expn i i
P P F Fe
P F
[5.13]
which was found to best fit to biaxial data at both high and low loads [142,145]. Here the
over-bar denotes the mean value. A multivariate regression analysis is performed on this
objective function using MATLAB (MathWorks; Natick, MA).
5.3.5 Statistical Analysis
Figures demonstrating continuous data (Figures 5.2 and 5.5) are expressed as the
mean ± the standard error of the mean while discrete data (Figures 5.3 and 5.4) are
presented as the mean ± the standard deviation. Paired comparisons were performed using
two-tailed student t-tests with a value of p < 0.05 considered to be significant.
5.4 RESULTS
Data is displayed for bovine, porcine, ovine, leporine, murine-rat, and murine-
mouse groups in the order of decreasing body weight with values representing the mean of
n=6 samples. Most measured structural quantities are shown to increase with animal
weight. Notably, ovine carotids present axial force, outer diameter, and wall thickness
values that break the pattern of scaling, as ovine specimens have lower body mass than
porcine specimens. Leporine lumen area compliance was also found to be less than that of
125
the murine-mouse. The pressure-outer diameter graph shows similar patterns within
physiological ranges across the six species tested (Figure 5.2, top). Notable differences
include the murine carotid samples that have a concave pattern at pressures below 80mmHg
but transitions to a convex relationship at higher pressures, while porcine, ovine, leporine,
and bovine samples display a convex relationship at all tested pressures.
When compared at 100 mmHg and 1.5 axial stretch ratios (Figure 5.3) the inner
radius and wall thickness, of bovine ( ir =3.35±0.30 mm, p<0.001; h =1.06±0.14 mm,
p<0.001), porcine ( ir =2.24±0.31 mm, p<0.001; h =0.37±0.10 mm, p<0.001), and ovine
( ir =2.15±0.42 mm, p<0.004; h =0.48±0.17 mm, p<0.016) arteries were significantly
different than those of leporine ( ir =1.08±0.16 mm; h =0.22±0.07 mm), murine-rat ( ir
=0.484±0.070 mm; h =0.087±0.031 mm), or murine-mouse ( ir =0.290±0.070 mm; h
=0.035±0.001 mm). Despite a high standard deviation in lumen area compliance,
differences were still significant for bovine ( AC =1.5x10⁻³ ± 8.1x10⁻⁴ mm2/mmHg,
p<0.004) compared to leporine ( AC =6.1x10⁻⁵ ± 3.9x10⁻⁵ mm2/mmHg; p=0.022), murine-
rat ( AC =3.2x10⁻⁴ ± 1.3x10⁻⁴ mm2/mmHg, p=0.040), or murine-mouse ( AC =2.6x10⁻⁵ ±
1.9x10⁻⁵ mm2/mmHg, p=0.021). Significant area compliance differences were also found
between porcine ( AC =6.8x10⁻⁴ ± 5.6x10⁻⁴ mm2/mmHg) and murine-mouse (p=0.047), and
between the leporine and murine-rat ( AC =3.2x10⁻⁴ ± 1.3x10⁻⁴ mm2/mmHg, p=0.004).
Average values of axial force and axial stretch also display similar, but highly nonlinear
relationships across species that are more evident on a non-logarithmic scale. The axial
force for the bovine specimens ( F =4,890 ± 3,132 mN, p<0.019) was different than porcine
( F =213.1 ± 179.8 mN), ovine ( F =576.3 ± 276.7 mN), leporine ( F =6.430 ± 3.73 mN),

126
murine-rat ( F =3.610 ± 2.62 mN) or murine-mouse ( F =0.804 ± 0.414 mN). The porcine
and ovine specimens were also different from the leporine and murine specimens
(p<0.049).
While vessel geometry varies widely between species, the stress and stretch metrics
facilitate comparisons that are independent of length scale (Figure 5.4 and Figure 5.5).
Circumferential stress was found to be lower in the bovine ( =42.9±6.88 kPa) than
porcine ( =86.8±31.4 kPa, p=0.025), leporine ( =74.0±25.7, p=0.041), and murine-
mouse ( =111±34.1 kPa, p=0.015) counterparts while ovine specimens =57.6±13.5
kPa, p=0.032) had significantly lower circumferential stress only in comparison to murine-
mouse (p=0.032). Likewise, bovine axial stress ( z =184 ± 42.2 kPa) was higher than in
porcine ( z =74.1 ± 27.4 kPa, p=0.049), leporine ( z =32.4 ± 9.56 kPa, p=0.031), and
murine-rat ( z =54.3 ± 34.3 kPa, p=0.029) arteries, while the porcine (p=0.009) and
murine-mouse (p=0.005) groups were lower than the leporine group. The porcine
circumferential and minimum axial stretches ( =1.49 ± 0.16; ,minz =1.29 ± 0.06) were
found to be lower than leporine ( =1.93 ± 0.25, p=0.044; ,minz =1.43 ± 0.02, p=0.039)
and murine-mouse ( =1.81 ± 0.22, p=0.030; ,minz =1.37 ± 0.02, p=0.039) while the
minimum ovine axial stretch ratios ( ,minz =1.40 ± 0.03, p=0.009) were also lower than in
the porcine specimens. The minimum axial stretch ratio was also found to be lower in the
bovine ( ,minz =1.30 ± 0.10, p=0.030) and the murine-mouse ( ,minz =1.37 ± 0.02, p=0.032)
compared to the leporine.
Biaxial mechanical data from all six species fit well to each of the two constitutive
models (Tables 5.1 and 5.2). The 4-fiber family HGO model had a lower average error

127
across all species (RMSE=0.16±0.08) than the phenomenological Fung-type model
(RMSE=0.23±0.09). A plot of the strain energy for both models can be seen in Figure 5.6
for θ = [1.00,1.85], z = [1.00,1.85]. For each species, both models with the reported
parameters are convex but demonstrate slightly different responses in terms of strain
energy.
5.5 DISCUSSION
The current work reports on the biaxial mechanical properties of common carotid
arteries from 6 distinct but common mammalian species. Due to the long, unbranched, and
paired anatomy, CCAs, especially canine models, are well studied in the literature.
Although collectively many datasets are available from a wide-variety of sources,
challenges in scalability have previously been a limitation on such a wide range of being
reported in a single published work. An exception to this is the experimentation performed
by RH Cox (1978) who studied the mechanics of the canine, leporine, and murine-rat
carotid arteries [225]. That investigation demonstrated similar outer diameter and
circumferential stress to ours but no axial forces were reported. Cox, as in our study,
reported a concave pattern in the pressure-diameter curves at low levels of pressure in the
smaller animals but not in the larger ones. Similar patterns and diameter ranges were also
reported in the work of Weizsäcker et al. (1983) who investigated biaxial properties of
murine-rat carotid arteries [229]. Chuong and Fung (1983), and later Takamizawa (2015),
experimented on leporine arteries and fit their results to constitutive models [4,230].
Although deformed inner radii in that study is similar to our current work and that of
Weizsäcker et al., our reported axial forces are lower in the leporine and murine-rat models.
This could be attributed to variations in an animal’s genetic background or age [47,231].

128
Despite the abundance of canine data, and to a lesser extent porcine, (e.g.,
[225,227]), there are surprisingly few biaxial tests of bovine carotid mechanics. Von
Maltzahn (1984) conveniently performed biaxial testing on carotids samples at the same
pressures and axial extensions used in our study. Although the diameters were slightly
larger than those reported here, axial forces were lower [232]. These differences may be
due to the breed and/or the age of animal, but that specific information was not reported in
their work. To our knowledge, Blondel and colleagues (2001) present the only published
biaxial mechanics data to date on sheep (ovine) carotid arteries [233]. Their animals and
corresponding structural parameters appear to be slightly larger than those presented here,
and again, the axial force and stress data were not reported. Nevertheless, other comparable
mechanical parameters appear to be consistent with the ovine results reported herein. The
lack of information for bovine and ovine models is surprising considering the growing
importance of these animals to the field of decellularized vascular grafts and implant
models [234,235]. Of further note, all vessels appear to be less stiff than the limited
existing data on human biaxial CCA mechanics [236,237].
An abundance of biaxial data from control, surgically altered, and genetically
modified murine-mouse models have been reported in our prior work [29,47,137,142,221].
Of note, the carotid arteries studied in the current investigation are comparable in
mechanical properties to many of the controls of those prior studies. One notable exception
is that the axial stretch ratio is lower here and actually represents a sub-physiological level
for the murine-mouse. In fact, it is likely that the leporine and both murine models are
compared at sub-physiological levels of axial extension while the bovine models are at
supra-physiological levels. Since axial extension affects virtually all our quantified metrics

129
(see for example, equations [5.2], [5.5] , and [5.12]), this condition would help to explain
the high measured force (and axial stress) in bovine specimens. To eliminate additional
confounding variables however, we chose to compare these species at a common axial
stretch ratio while recording the minimum axial stretch required to achieve tension while
pressurized. An axial stretch of 1.5 appeared to be the most common reference point from
the literature for diverse mammalian species [227,229,230,238].
Allometric scaling is applied to the results (Figure 5.7, see [239]) using a power
law equation [240] of the form
ay k w [5.14]
that relates the dependent variable y to the independent variable w (in this case animal
weight) using a coefficient k and scaling exponent a . When plotted against body weight,
the inner radius (R2=0.982), wall thickness (R2=0968), area compliance (R2=0.742), and
axial force (R2=0.900) were all well represented by [5.14]. In contrast, no obvious scaling
existed for the circumferential and axial stresses and stretches. These values however, were
closely grouped amongst many of the animals tested. Likewise, Wolinsky and Glagov
compared aortas from diverse mammalian species to demonstrate that lamellar units – a
major contributor of mechanical properties in arteries – remain relatively consistent across
species. These authors observed ranges in deformed outer diameter from 1.2 to 23.0 mm
and body weight from 0.028 to 200 kg; despite this, aortas across all species exhibit medial
lamellar units of similar size (0.006 to 0.018 mm) that experience similar tension per
lamellar unit (1,090 to 3,010 dynes/cm) [239]. Moreover, the endothelial, smooth muscle,
and fibroblasts cells which serve as both sensor and effector in the assembly of wall
constituents, remains the same size even in a vessel wall that can be 15-fold larger. We

130
also consider that proteins (e.g., collagen and elastin) can vary in fractional mass but their
structure is preserved across species. While this investigation focuses primarily on
biomechanical analysis, future work would benefit from more thorough comparison of
CCA microstructure across species to complement the mechanical comparison herein. Still,
a priori knowledge of scalable (e.g., geometric) versus non-scalable (e.g., stress/stretch)
metrics are important in guiding the selection of animal models and their anticipated
biological response.
Both of the chosen constitutive models effectively captured the biaxial data from
all six species. While the Fung-type exponential model exhibited a reasonable fit for these
data, only one of the fitted variables is a stress-like parameter. Moreover, the constraints
placed on the formulation to ensure a convex solution are considerable [5,241]. Despite
this, a historical precedent exists for using this model, including the reference citation –
Chuong and Fung – that describes experiments using the leporine animal model, one of our
six mammalian species; therefore, it is a logical benchmark for comparison [4].
Nevertheless, the 4-fiber HGO model exhibited a better fit and has added utility in being a
structurally motivated model where parameters have a more direct physical interpretation.
However, the inherent value of both models lies in their ease of translation into other
studies.
Comparing the biaxial mechanical properties of CCAs across mammalian species
supports two discrete research directions. First, animal studies are a critical tool in
elucidating disease progression, evaluating novel treatment options, and developing
implantable devices for a wide range of diseases, including carotid artery disease. As
discussed previously, the mechanical properties of the vasculature are subject to change as

131
a result of both disease and treatment, and quantifying these changes requires a thorough
characterization of baseline mechanical properties. Therefore, this investigation provides
preliminary mechanical data that can be used to guide the selection of animal models for
carotid artery research and to provide comparative data from healthy vessels to compare
with treatments and disease states.
Next, as demand continues to increase for vascular grafts as treatment options for
severe cardiovascular disease, significant research has begun to explore options beyond
traditional autologous grafts. Artificially engineered vascular grafts have proven difficult
to adequately match necessary material properties while maintaining long-term patency
[242], so recent efforts have explored the use of decellularized blood vessels as a scaffold
for vascular graft procedures [243–247]. Since decellularization nominally ameliorates
immunogenicity by removing all cellular material, leaving only the ECM components
responsible for passive mechanical properties, graft options need not be limited to human
vessels. The most pressing need for improved graft options lies in small-diameter artery
grafts, so decellularized conduit arteries of smaller mammals represent a potential avenue
of research for graft options in humans. In theory, given basic information about a graft
destination – e.g., pressure, deformed inner radius, and compliance – a clinician could
reference a catalog of mechanically characterized non-human vessels, such as the
investigation herein, to identify the most mechanically compatible scaffold for that
particular situation.
While we support the scientific merit of this investigation, we must also
acknowledge certain limitations. First, we chose not to quantify residual strains via opening
angles of fresh cross-sectional slices. Residual strains are known to normalize the

132
transmural stress distribution in a given vessel but can be difficult to measure reliably at
smaller length scales. Further, due to the range of tissues used herein, animal ages could
not be standardized to a single relative maturity in each species; however, within a given
species, all tested samples came from adult specimens of approximately equal age and size.
Furthermore, due to large variations in measured variables across species (e.g., axial force,
vessel diameter), several hardware configurations were required to maintain fidelity of the
collected data. Nevertheless, testing was consistent within a given species, all hardware
was calibrated prior to testing, and protocols were consistent regardless of species or
hardware.
5.6 ACKNOWLEDGEMENTS
The authors would like to acknowledge the contributions of undergraduate researcher
Hannah Gore.

133
5.7 TABLES
Table 5.1 – Fitted parameters for six mammalian species using the Fung-type [4] material model.
c0(kPa) c1 c2 c3 c4 c5 c6
Error RMSE
Bovine avg 10.7 2.79 1.10 1.95 0.89 0.37 0.08 0.28
std 22.7 2.04 0.15 0.62 0.28 0.34 0.16 0.04
Porcine avg 25.7 1.68 1.43 1.00 0.78 0.52 0.87 0.23
std 19.5 0.80 0.85 0.01 0.37 0.44 0.21 0.13
Ovine avg 20.9 1.87 1.09 1.63 0.61 0.19 0.15 0.17
std 28.5 0.83 0.17 0.46 0.53 0.23 0.33 0.03
Leporine avg 5.98 1.00 1.01 1.00 2.E-05 0.17 0.99 0.30
std 2.16 6.E-03 5.E-03 4.E-04 0.48 0.21 0.44 0.10
Murine-rat
avg 2.30 12.27 1.00 1.00 0.85 0.35 0.83 0.32
std 3.61 15.39 3.E-04 2.E-04 0.21 0.48 0.31 0.14
Murine-mouse
avg 2.98 11.0 1.10 1.08 0.88 0.48 0.48 0.34
std 5.09 18.9 0.26 0.15 0.33 0.38 0.50 0.17
avg 0.23
std 0.09

134
Table 5.2 – Fitted parameters for six mammalian species using the 4-fiber family HGO material model [5,6].
ca
(kPa) c1,1
(kPa) c1,2 c2,1
(kPa) c2,2 c3,1 =
c4,1(kPa) c3,2 = c4,2
α3 = -α4 (deg)
Error RMSE
Bovine avg 3.44 5.81 0.52 1.03 0.86 7.59 0.86 27.6 0.23
std 6.65 12.9 0.78 2.24 1.00 17.0 0.57 18.1 0.08
Porcine avg 14.6 0.76 3.83 0.77 0.37 2.40 3.19 52.6 0.20
std 13.0 0.75 3.76 0.71 0.29 3.46 4.83 20.5 0.11
Ovine avg 9.92 0.26 3.91 1.29 0.98 0.80 2.11 47.4 0.22
std 7.56 0.46 6.28 1.30 0.77 0.75 1.46 8.4 0.06
Leporine avg 6.77 0.11 0.57 0.52 0.34 2.13 0.26 39.1 0.09
std 6.04 0.12 0.38 0.65 0.58 1.49 0.53 30.0 0.05
Murine-rat
avg 9.48 2.58 1.14 0.63 0.68 5.87 0.32 42.4 0.18
std 8.97 4.25 1.16 1.03 0.78 8.95 0.30 31.8 0.15
Murine-mouse
avg 8.49 1.16 0.62 1.11 0.44 2.56 1.16 46.0 0.19
std 6.33 2.19 0.62 1.01 0.14 3.79 1.12 13.4 0.12
avg 0.16
std 0.08

135
5.8 FIGURES
Figure 5.1 – Images of common carotid arteries. (left) Vessels mounted within the biaxial testing device at z=1.5 and P=100 mmHg. (a) Bovine: OD = 8.82 mm,
(b) porcine: OD = 4.96 mm, (c) ovine: OD = 5.49 mm, (d) leporine: OD = 2.60 mm, (e) murine-rat: OD = 1.14, and (f) murine-mouse: OD = 0.65 mm vessels shown. Scale bars are 1 mm. (right) Unloaded ring sectors of each vessel with 1 mm ruler.

136
Figure 5.2 – Full range of common carotid arteries subjected to passive biaxial mechanical testing. (top) Pressure-diameter at z=1.5, (bottom) axial force-stretch on a logarithmic
scale at P=100 mmHg for Bovine, porcine, ovine, leporine, murine-rat, and murine-mouse. All values are mean (n=6) ± SEM.

137
Figure 5.3 – Comparative structural and force values for common carotid arteries subjected to passive biaxial mechanical testing at 100 mmHg and 1.5 axial stretch ratio. (a) Inner radius, (b) wall thickness, (c) area compliance, and (d) axial force from bovine, porcine, ovine, leporine, murine-rat, and murine-mouse carotid arteries. All values are mean ± standard deviation. (*) denotes statistical significance at p<0.05 between the leftmost group and the corresponding hash-mark.
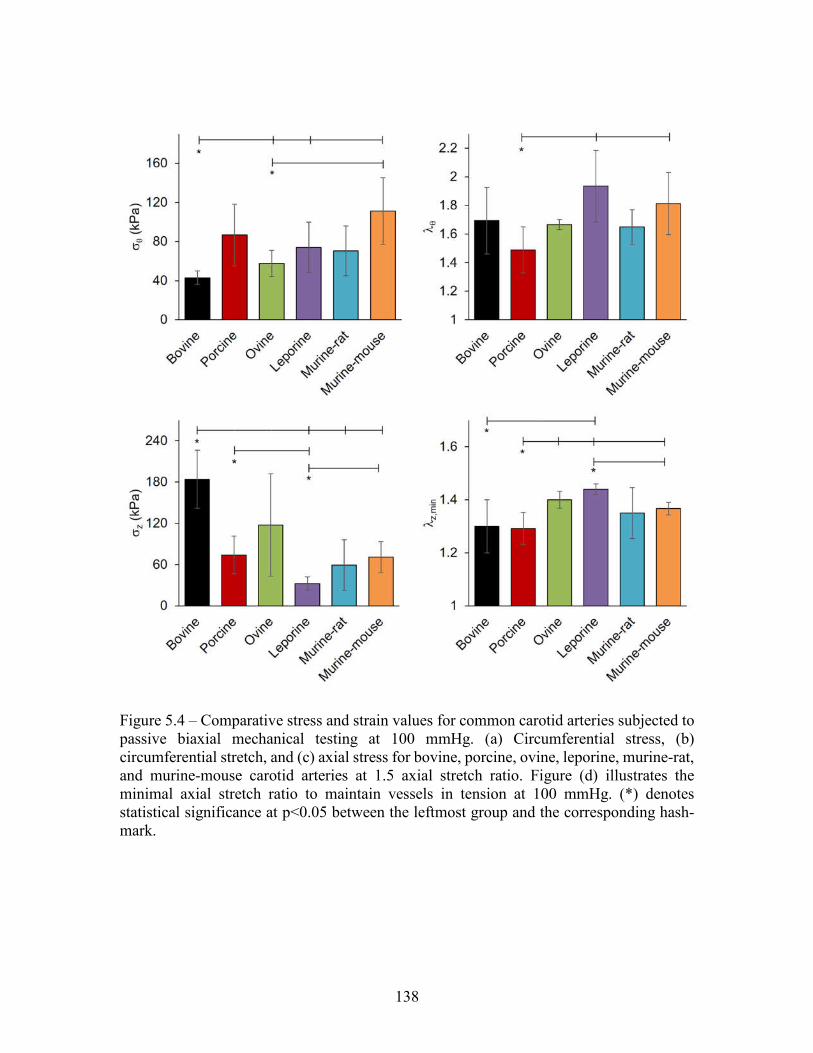
138
Figure 5.4 – Comparative stress and strain values for common carotid arteries subjected to passive biaxial mechanical testing at 100 mmHg. (a) Circumferential stress, (b) circumferential stretch, and (c) axial stress for bovine, porcine, ovine, leporine, murine-rat, and murine-mouse carotid arteries at 1.5 axial stretch ratio. Figure (d) illustrates the minimal axial stretch ratio to maintain vessels in tension at 100 mmHg. (*) denotes statistical significance at p<0.05 between the leftmost group and the corresponding hash-mark.

139
Figure 5.5 – Full range of stress and stretch for common carotid arteries subjected to passive biaxial mechanical testing. (top) Circumferential stress-stretch at z=1.5, and
(bottom) axial stress-stretch at 100 mmHg for bovine, porcine, ovine, leporine, murine-rat, and murine-mouse common carotid arteries fitted using the 4-fiber family HGO model. All values are mean (n=6) ± SEM.

140
Figure 5.6 – Contour plots of total strain energy W (kPa or kJ/m3).
(a) Bovine, (b) porcine, (c) ovine, (d) leporine, (e) murine-rat, and (f) murine-mouse models as a function of biaxial stretches θ=[1.00,1.85], z=[1.00,1.85] using the Fung-type model (dashed
lines) and 4-fiber HGO model (solid lines). Labels are provided for the 4-fiber HGO model only.

141
Figure 5.7 – Allometric scaling of mechanical quantities with weight. (a) Inner radius
(ri = 0.702·w0.262
, R² = 0.982), wall thickness (h = 0.117·w0.3338
, R² = 0.968), area
compliance (CA = 0.129·w0.3633
, R² = 0.742), and axial force (F = 0.009·w0.8824
, R² =
0.900) fit to the power law allometric scaling relationship. (b) Circumferential stress, axial stress, (c) circumferential stretch, and minimum axial stretch did not scale with weight.

142
CHAPTER 6
TRANSITION FROM VENOUS TO ARTERIAL LOADING IMPROVES SAPHENOUS
VEIN REMODELING FOR CORONARY ARTERY GRAFTING5
5 Prim, D. A., & Eberth, J. F. To be submitted to Tissue Engineering Part A.

143
6.1 ABSTRACT
When exposed to chronically altered mechanical stimuli, such as those resulting
from coronary artery bypass grafting (CABG), remodeling process are activated that
include cellular proliferation, migration, and differentiation and extracellular matrix
protein deposition, degradation, and reorganization. These remodeling processes may be
guided by an innate programming of resident vascular cell to regain some homeostatic
state. Great saphenous veins (GSVs), one of the most common CABG conduits, fail more
often than arterial conduits while also experiencing larger deviations from their
homeostatic stress state, and an inability to effectively remodel in response to acute
mechanical mismatch in the coronary circulation is thought to be a primary cause
underlying pathologies leading to graft failure. These CABG failures often exhibit
maladaptive remodeling, whereby nominally adaptive remodeling processes effect
structural changes that result in the pathological occlusion of the graft lumen, called intimal
hyperplasia, instead of restoration of mechanical homeostasis. We hypothesize that
prolonged gradual transition from native GSV to CABG conditions might facilitate
adaptive remodeling while preventing deleterious pathologies associated with acute
changes to the mechanical loading environment. To test this hypothesis, we use an ex vivo
perfusion bioreactor to guide remodeling of GSVs using stepwise incremental increases in
pressure and volumetric flow every 3 days over the course of 21 day cultures. This
approach will improve overall adaptation to the coronary environment by allowing for
partial restoration of homeostatic stress states at each time point. Biaxial mechanical
testing, gene expression, and histology are used to evaluate graft adaptation over the culture
period. Preliminary results suggest this technique is capable of stimulating desirable
144
remodeling outcomes including increased inner radius and wall thickness, which lowers
wall shear and circumferential stress towards native values.
6.2 INTRODUCTION
Stenosis and eventual failure of coronary artery bypass grafts (CABGs) generally
follows a well characterized pattern of cell infiltration, proliferation, and ECM deposition
that forms a new layer between the intima and media, narrowing the lumen and obstructing
perfusion of the myocardium [248]. This process, known as intimal hyperplasia, is a
primary cause of the 6% of CABGs that fail within the first year [14]. Moreover,
multivessel disease and a lack of suitable autologous candidates leads to frequent use of
great saphenous veins (GSVs) for CABG that fail at significantly higher rates in the near,
mid and long term [13,14,16]. While this phenomenon is hardly controversial, researchers
continue to work towards methods of remediation with little clinical success [247,249].
Experts widely accept that mechanical incompatibility plays a significant role in
vein graft failure [250]. A classical and generally accepted theory in vascular mechanics
contends that blood vessels are structured to optimally distribute loads in their local
hemodynamic environment [120]. Resident vascular cells seek to maintain this
configuration of optimal loading, which can be referred to as the homeostatic stress state.
When changes to the local mechanical environment cause sustained deviation from this
homeostatic stress state, vascular cells enact remodeling processes to restore homeostasis
[8]. Indeed, previous investigations have demonstrated the capacity of vessels to restore
homeostatic values of stress following perturbations to both wall shear [33,36] and
circumferential stress [28,40] due to changes in blood flow and pressure respectively.

145
The use of GSVs for CABG results in transplantation from a relatively steady, low
pressure, low flow environment to higher pressure, higher flow, and higher pulsatility of
the coronary circulation. The acute mechanical deviations between autologous grafts and
the coronary circulation can be very large, including increased circumferential stress, axial
stress, and wall shear stress [15], which may be beyond the capacity of adaptive
remodeling. Others have proposed a gradual approach to guiding the vein to artery
adaptation, whereby the difference between native in situ loads and desired grafted loads
would be divided into smaller steps or a continuous gradual increase [251]. Thus, each step
would perturb the vessel’s mechanical homeostasis enough to initiate remodeling but not
so much that maladaptive remodeling or vessel injury is triggered. The vessel to be grafted
would then be allowed to regain homeostasis before the next step change, and this process
repeated until the graft vessel is at mechanical homeostasis at target loads [251]. Similarly,
a constrained mixture model of vascular growth and remodeling has been proposed, with
which simulations predict gradual loading would increase a vein’s likelihood of successful
adaptation [191].
In this investigation, we build upon our previous ex vivo culture experiments and
apparatus to assess the effects of stepwise transition from venous to arterial hemodynamics
on adaptive remodeling using a pulsatile perfusion bioreactor. As an approximation for
circumferential stress and wall shear stress, pressure and flow are gradually increased at 3
day intervals over the course of 21 day cultures. We hypothesize that vessels experiencing
gradual transition to coronary loading conditions, and in the absence of a systemic
inflammatory system, should demonstrate adaptive growth and remodeling to be more
mechanically suited to the coronary circulation, while avoiding intimal hyperplasia and

146
maladaptive remodeling. This adaptive remodeling, in theory, should include increased
deformed inner radius, increased wall thickness, and increased compliance at arterial
pressures without the thickened intima and denuded endothelium characteristic of early
intimal hyperplasia.
6.3 MATERIALS AND METHODS
6.3.1 Tissue Harvesting and Preparation
GSVs were isolated from freshly slaughtered American Yorkshire sows (200 ± 20
kg; 36 ± 6 mo old) at a local abattoir and stored for transport on ice in Moscona’s saline
solution supplemented with 20 U/mL heparin, 1% penicillin/streptomycin, 1%
amphotericin-B, and 1% gentamycin. All tissue used in this investigation originated from
animals raised for consumption. As such, this investigation does not fall under IACUC
protocol.
Under sterile conditions in a biological hood, excess perivascular tissue was
removed with forceps and spring scissors, and branches were ligated with sterile 6-0 silk
suture. For each vessel, one section approximately 40 mm in length was mounted to custom
barbed glass cannulae within a glass bioreactor (Adams & Chittenden Scientific Glass,
Berkeley, CA) and the sample was extended to 1.4x its unstretched (suture-to-suture)
length to approximate in situ axial stretch, with this stretch ratio determined from
preliminary mechanical testing of GSVs prior to culture. A second section 10-mm in length
was mounted to barbed female luer lock fittings for day 0 biaxial mechanical testing.
6.3.2 Ex Vivo Vessel Culture
Detailed description of the bioreactor can be found in Chapter 3. Briefly, the glass
vessel chamber was incorporated into a flow loop containing a roller pump, pressure

147
transducer, downstream resistor, and media reservoir, all contained within a sterile
incubator at 37 C and 5% CO2. Culture medium in the vessel chamber (150 mL) and
reservoir/flow loop (300mL) was DMEM supplemented with 10% fetal bovine serum, 1%
penicillin/streptomycin, 1% amphotericin-B, and 1% gentamycin, which was replaced
every 7 days. GSVs were cultured for 21 days under either in situ loading conditions (Q =
0.17 mL/s; P = 15 mmHg) or stepwise loading from in situ to coronary loading conditions
(Q = 0.52 mL/s; P = 102 mmHg). For each 3 day interval (21 days, 7 total), flow and
pressure were calculated to achieve an equal percent increase at each step ( Q = 17.3%
and P = 31.5%) (Figure 6.1).
At the end of each culture, one section (15 mm) was cut from the middle of the
sample and mounted to female barbed luer lock fittings for biaxial mechanical testing; one
section (1 mm) was cut for tissue viability assessment; and one section (3 mm) was cut and
immediately snap frozen on dry ice for gene expression analysis.
6.3.3 Biaxial Mechanical Testing
Biaxial inflation-extension testing was performed on sections of each sample vessel
before (day 0: d0) and after (day 21: d21) culture under stepwise or venous perfusion, in
similar fashion to our previous work using a customized Bose BioDynamic 5270 device
[15,138]. Samples were secured to female barbed luer lock fittings using 3-0 braided silk
suture, and unstretched suture-to-suture length was recorded. Samples were then mounted
in the testing chamber of the device, taking care to avoid twisting or overstretching of the
sample, and length of the axial control arms was adjusted to the previously recorded
unstretched value. Axial force and luminal pressure gauges were tared after mounting but
before data acquisition. The testing chamber and flow loop were filled with PBS

148
supplemented with 10-5 M sodium nitroprusside warmed to 37 C to ensure complete SMC
relaxation.
After clearing all air bubbles from the flow loop, pressure was increased from 0-
200 mmHg at increasing axial stretch ratios while taking note of the corresponding axial
force values, and the axial stretch ratio at which axial force remained constant through
pressurization was noted as the approximate in vivo stretch. Axial extension and
pressurization and preconditioning protocols were performed prior to collecting data. For
these, pressure was set to 100 mmHg, and samples were extended at 0.05 mm/s to the
previously noted in vivo stretch ratio plus 10 percent for 8 cycles. Next axial displacement
was set at the approximate in vivo ratio, and pressure was increased from 0-200 mmHg at
1 mmHg/s for 8 cycles. To calculate a more accurate in vivo stretch ratio, in consecutive
trials vessels were pressurized to 60, 100, and 140 mmHg, axial stretch was increased from
1 to the approximate in vivo value plus 10%, and axial force was recorded throughout.
When plotted together with axial extension versus axial force, the point at which the three
curves intersected was assumed to be the true in vivo axial stretch ratio [136,137].
For data collection, samples were tested at three axial stretch ratios: the in vivo
value, ~10% above in vivo, and ~10% below in vivo. At each stretch ratio, pressure was
increased from 0-200 mmHg at 1 mmHg/s, and pressure, outer diameter, and axial force
were recorded at 20 mmHg increments. This was repeated for 3 trials at each of the 3 stretch
ratios.
6.3.4 Zero Stress Configuration
Following mechanical testing, ring sections 1 mm thick were cut from the center of
tested samples, placed in a shallow dish of PBS, and images were collected using a DSLR

149
camera (Canon USA, Long Island, NY) mounted to a dissecting microscope (Carl Zeiss
Microscopy GmbH, Jena, Germany) using an adapter lens (Micro Tech Lab, Graz,
Austria). A radial stress-relieving cut was made in each ring, and the cut sectors were
allowed to equilibrate for 20 minutes before images were collected of the stress-free
configuration. ImageJ (NIH) was used to measure inner arc length iL , outer arc length oL
, cross sectional area A , and opening angle . From these data, stress-free thickness H
could be calculated using
2
i o
AH
L L
. [6.1]
6.3.5 Viability and Histological Analysis
At the termination of 21 day cultures, 1 mm ring sections were cut from perfused
samples and incubated in 0.5 mg/ml methylthiazol tetrazolium (MTT; Sigma-Aldrich,
Munich, Germany) in sterile Moscona’s saline at 37 C for 1 hour. Images were collected
using the microscope-mounted DSLR described above. Yellow MTT solution is reduced
to an insoluble purple formazan product in the presence of metabolically active and viable
cells, so relative tissue viability was quantified via threshold analysis of purple pixels to
total cross-section area in ImageJ (National Institutes of Health).
Following biaxial mechanical testing at d0 and d21, sections were fixed in 4%
paraformaldehyde. Fixed samples were embedded in paraffin, sectioned at 5 µm with a
microtome and stained with hematoxylin/eosin. To assess apoptotic cells in the vessel wall
via TUNEL staining, the In Situ Apoptosis Detection Kit (DAB) (Abcam, Cambridge, MA)
was used in accordance the manufacturer’s directions. A Nikon E600 microscope (Nikon
Instruments, Melville, NY) with CCD camera and QCapture imaging software (QImaging,
Surrey, BC) was used to collect digital images of stained slides.

150
ImageJ threshold analysis (NIH) of digital images was used to quantify the relative
prevalence of apoptotic nuclei in TUNEL stained sections as a ratio of brown TUNEL
positives regions to all nuclei stained blue with methyl green. Apoptotic nuclei were
identified using the Threshold_Colour plugin as all brown regions greater than 20 pix2
(hue: bandstop 126-211, saturation: bandpass 25-255, brightness: bandpass 0-220), and
healthy nuclei were identified as all blue regions greater than 20 pix2 (hue: bandpass 126-
211, saturation: bandpass 25-255, brightness: bandpass 0-220) [147].
6.3.6 Data Analysis
We assume that vessels experience axisymmetric finite elastic deformation due to
applied pressure and longitudinal extension and are 3-D thick-walled cylindrical tubes. By
deactivating smooth muscle activity with sodium nitroprusside, we consider only the
passive mechanical properties of the vessels resulting from extracellular matrix
components – primarily collagen and elastin. Assuming tissue incompressibility, we
calculate deformed inner radius ir as
2i o
z
Ar r
, [6.2]
where outer radius or is measured and axial stretch z is prescribed through biaxial testing.
Using this data, mean circumferential and axial z wall stresses are calculated as
i
o i
Pr
r r
,
2 2z
o i
F
r r
, [6.3]
where luminal pressure P is prescribed and axial force F is measured during testing.
Mean circumferential and axial z stretch ratios are used as metrics of strain and are
calculated as
151
2
i o
i o
r r
L L
, z
l
L , [6.4]
where l is the deformed length of the vessel segment and L the undeformed. Lumen area
compliance was calculated as
2
iA
rC
P
, [6.5]
where ir and P are the change in deformed inner radius and pressure about approximate
in vivo coronary pressure of 100 mmHg.
Ongoing work will quantify the changes across samples before and after culture
through continuum mechanics analysis using a structure-based constitutive model.
6.4 RESULTS
As preliminary data leading to a desired sample size of six successful cultures, five
GSVs were cultured to completion at 21 days following stepwise increases in pressure and
volumetric flow (Figure 6.1). Of these five vessels, two (S2, S7) demonstrate substantial
viability through MTT assay and vasoreactivity, while three (S5, S6, S8) demonstrate
limited viability (Figure 6.2). Similar results are found for H&E and TUNEL staining
(Figure 6.3). Samples that remained viable throughout the duration of testing show little
histological difference in the media and adventitia (Figure 6.3 A-B), but cultured samples
do show endothelial loss ranging from partial to complete denudation as well as disruption
of the internal elastic lamina (Figure 6.3B). In the same viable sample, 6.79% of nuclei
stain are positive for TUNEL staining at day 0 versus 21.04% positive at day 21 (Figure
6.3 C-D). Ongoing experiments will also include control samples cultured under
unchanged venous flow and pressure for 21 days, but none have been completed
successfully at this time.

152
Geometric measurements of zero stress configuration suggest increases in all
metrics from day 0 to day 21: inner arc iL , outer arc oL , opening angle OA , cross sectional
area A , and wall thickness H . However, these increases are not significant owing to large
variations, especially in the cultured group (Table 6.1). Increased iL and oL suggest
increases in inner and outer diameter in the closed configuration, which is borne out in the
pressure diameter relationships between day 0 and day 21 (Figure 6.4). As the sample sizes
increase, we hope to reach statistical significance in this metric.
Biaxial inflation-extension data is presented for all paired cultures (Figure 6.4) and
for the two paired cultures demonstrating the best viability (Figure 6.5). Some qualitative
differences appear between cultured and uncultured vessels when all samples are
compared; however, no clear patterns are immediately apparent. For the vessels identified
as viable at 21 days, circumferential and axial stress versus stretch curves show a noticeable
shift, with vessels experiencing less circumferential deformation and also lower values of
stress at similar applied pressure values, suggesting both a thickening and stiffening of the
vessel wall. Axially, calculated “in vivo” stretch ratios increase after stepwise culture,
meaning unstretched length decreases (Figure 6.5 D). Concurrently, axial force values
generated at in vivo stretches increases dramatically (Figure 6.5 C).
To facilitate comparison under similar conditions, structural and mechanical values
were plotted for each sample before and after culture under 100 mmHg applied pressure
and calculated in vivo axial stretch (Figure 6.6). Notably, several metrics show opposite
temporal patterns for the samples that did (S2, S7) and did not (S5, S6, S8) maintain
viability through day 21. Deformed wall thickness ( h ) nearly doubles from day 0 to day
21 for viable samples, while not changing or decreasing in non-viable samples. Similarly,

153
axial force ( F ) and axial stress ( z ) increase dramatically in viable samples but decrease
or remain relatively unchanged in non-viable samples. Conversely, circumferential stress
( ) and circumferential stretch ( ) decrease significantly in viable samples but remain
unchanged or increases in non-viable samples. Deformed inner radius ( ir ) and lumen area
compliance ( AC ) do not show a clear pattern between viable and non-viable cultures from
day 0 to day 21; samples S2 follows a similar pattern to nonviable cultures, with ir slightly
increasing and AC decreasing. Conversely sample S7 shows a large decrease in ir and large
increase in AC .
6.5 DISCUSSION
In this investigation, we build upon previous observational studies of ex vivo
CABG perfusion in an attempt to guide adaptive remodeling through stepwise increases in
mean media pressure and volumetric flow rate from native GSV to grafted LAD
hemodynamic-replicated values over 21 day cultures. The primary indicator of success
herein is restoration of native homeostatic stress values while maintaining viable tissue
through 21 days of culture. We have previously quantified the amount of mechanical
deviation between GSVs in their native conditions and under acute coronary loads
representative of standard grafting procedures, specifically quantifying differences in
deformed inner radius, compliance, circumferential stress, and axial stress between venous
and arterial conditions [15]. Not surprisingly, each of these metrics show large deviations
between native and grafted loading conditions, which were quantified by the normalized
metrics and . Thus when applied to the present study, reductions in post-culture and
compared to fresh GSVs or controls would suggest remodeling towards adaptation to the

154
coronary circulation. Secondary analyses that support mechanical changes include
quantification of apoptosis, expression of remodeling-associated genes, and histological
changes in vessels
These experiments are ongoing, so the results included herein should be considered
preliminary and inconclusive at this time. Of 8 attempts to date, 5 samples were cultured
for 21 days and subjected to mechanical testing at the culmination of the experiment. Of
those 5 samples, 2 indicated largely viable tissue at day 21, while the other 3 indicated
significantly less viability through the use of the MTT assay. This viability also correlated
with significant remodeling towards restoration of homeostatic stress levels as quantified
by increased ir and h , leading to reduction in w and under coronary loads when
compared to uncultured vessels. In the present data, no significant changes are seen in
opening angle because of ex vivo culture. Nonetheless, ongoing studies will continue to
evaluate whether patterns arise, as decreases in opening angle suggest outward remodeling
which would be a positive indicator of success, while increases in opening angle suggests
inward remodeling that may be considered maladaptive.
Ongoing experiments and future investigations should seek to understand and
improve upon the differential viability across cultures. Intuitively, diminished viability –
even if it is eventually restored – mitigates vessels’ ability to restore mechanical
homeostasis, as resident vascular cells are the mediators of remodeling processes. Potential
factors that could affect viability may include injury from dissection and experimental
setup, inappropriate gas or nutrient exchange, and bioreactor contamination. Each must be
addressed to improve experimental results and enable further translational applications.

155
In this investigation we focus on a single experimental approach to guided
remodeling using increments of equal percentage increase in luminal pressure and
volumetric flow at 3 day intervals over 21 days of culture. While collagen generally has a
half-life of weeks to months in quiescent tissues, some have found evidence of much higher
rates in cardiovascular and other tissues [47,252,253]. Further, in vivo experiments have
shown wall thickening over 80% within 21 days [254], so it is reasonable to suspect
significant structural remodeling even if homeostasis is not fully regained under coronary
conditions. While we believe this investigation represents a useful starting point and proof
of concept for guided remodeling in ex vivo culture, one could imagine virtually infinite
permutations of time intervals, step size, and individual adjustment of pressure and flow
rate.
Further, while flow rate and pressure directly correlate to w and , we do not
calculate stresses in real time, requiring a direct measure of inner diameter. The most
widely accepted view of mechanical homeostasis and remodeling is that stresses correlate
most closely with tissue homeostasis and deviations in stresses from homeostasis drive
remodeling [255]. While we can directly estimate stresses ( w and ) from applied loads
(Q and P ) at the beginning of the study, if we assume that remodeling occurs over the
course of the 21 day cultures, then we cannot calculate stresses in real time and thus do not
know whether samples have restored homeostatic stress values. Conversely, some believe
that structural remodeling occurs over weeks as opposed to days; if that hypothesis is true
then morphological changes may be limited enough through 21 days to make reasonable
stress approximations. Thus, another potential improvement on this study design may be
to add hardware to measure inner radius in culture, use those values to calculate stresses in
156
real time, and base step timing and magnitude on restoration of homeostasis versus set time
points, which has been theorized previously [251].
If the ongoing results of this study validate ex vivo conditioning of GSVs towards
desired mechanical outcomes for CABG, this technique can be adapted for other graft
tissues and procedures such as a modulated arteriovenous fistulae and peripheral artery
bypass. Hypothetically, the methods described herein could be applied to any graft loading
environment. Given any source tissue and its native loading conditions (i.e., P and Q )
and loading conditions in the targeted graft environment, the source tissue could be
conditioned in a gradual manner until homeostasis is reached under the target loading
conditions. Success in this area would expand the number of vessels that could be used as
grafts, as theoretically any viable blood vessel could be adapted to any loading environment
given sufficient ex vivo conditioning. Additionally, vascular grafts could be utilized for
previously “ungraftable” situations where no autologous source vessel has been available
that matches the target graft environment.
Similar techniques could be utilized as a tool in developing tissue engineered
vascular grafts by stimulating seeded cells to organize themselves and extracellular matrix
towards desired mechanical properties. Many tissue engineered blood vessel designs have
been proposed that involve cells seeded to both biological and artificial scaffolds
[126,247,256–258], and our technique for ex vivo vascular conditioning could be applied
to any of these designs to ensure that the graft is ideally suited to the mechanical loads of
its target environment. One application of particular interest involves the combination of
ex vivo conditioning with decellularized scaffolds seeded with human vascular cells. In
this case, a scaffold could be obtained from an animal model, allowing for a nearly
157
unlimited supply and selection of geometries and native mechanical properties based on
the eventual graft location. After decellularization, scaffolds could be seeded with cells
from the patient requiring surgery and cultured under loading conditions that exactly match
the patient’s circulation until the cells remodel the scaffold sufficiently to reach
homeostasis before implantation. Although we are yet to test this technique, based on
preliminary results and others’ investigations, we believe this type of application has the
potential to drive significant changes to the field of vascular grafting.
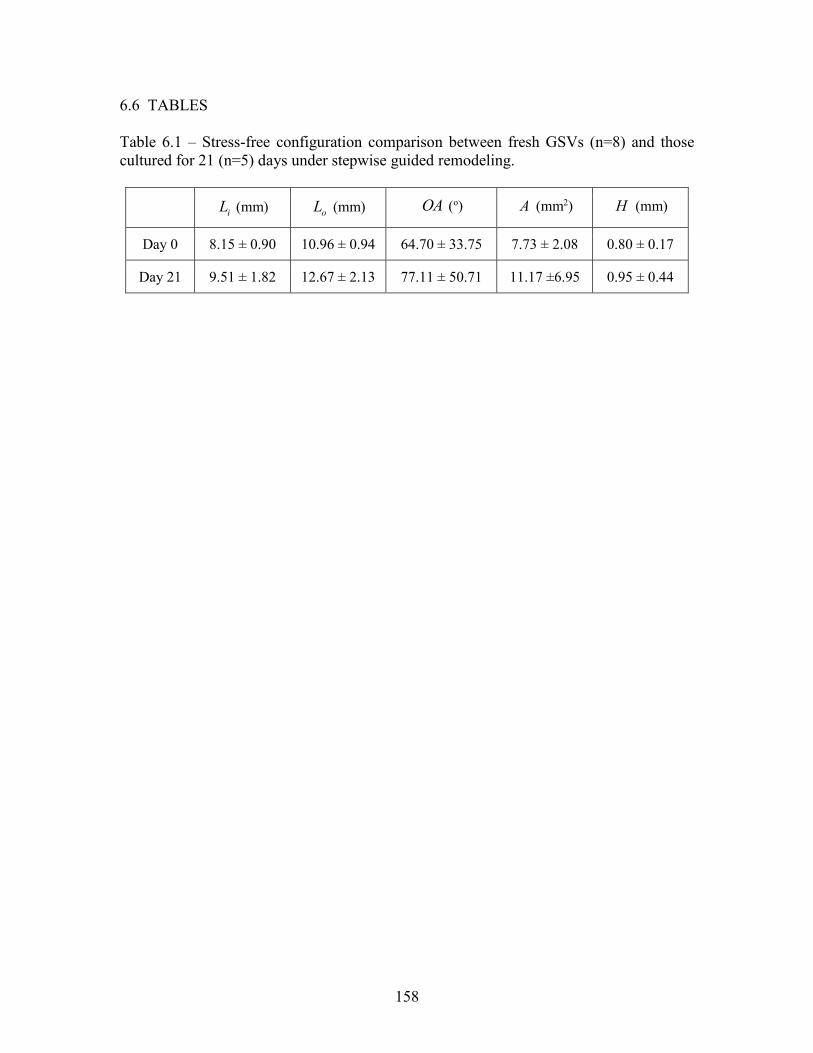
158
6.6 TABLES
Table 6.1 – Stress-free configuration comparison between fresh GSVs (n=8) and those cultured for 21 (n=5) days under stepwise guided remodeling.
iL (mm) oL (mm) OA (o) A (mm2) H (mm)
Day 0 8.15 ± 0.90 10.96 ± 0.94 64.70 ± 33.75 7.73 ± 2.08 0.80 ± 0.17
Day 21 9.51 ± 1.82 12.67 ± 2.13 77.11 ± 50.71 11.17 ±6.95 0.95 ± 0.44

159
6.7 FIGURES
Figure 6.1 – Stepwise increases in pressure (P) and volumetric flow (Q) at 3 day intervals over 21 days of culture. Flow increases by 17.3% each step and pressure by 31.5%
0
0.1
0.2
0.3
0.4
0.5
0.6
0
20
40
60
80
100
120
0 3 6 9 12 15 18 21
Flo
w (
mL
/s)
Pre
ssur
e (m
mH
g)
Day
P Q

160
Figure 6.2 – Representative MTT stained rings of (A) fresh GSV, (B) viable 21 day stepwise culture, and (C) 21 day stepwise culture with limited viability.
A B
C

161
Figure 6.3 – Top: H&E staining of GSV sample (A) prior to culture and (B) after 21 day stepwise remodeling culture; Bottom: TUNEL apoptosis assay with DAB conjugation and methyl green counterstain (C) prior to culture and (D) after 21 day stepwise remodeling culture. In each image, lumen marked with L and scale bar = 1mm.

162
Figure 6.4 – Biaxial mechanical data from inflation-extension testing of 5 vessels before
and after 21 day stepwise remodeling culture: (A) pressure vs. diameter relationship at each
vessel’s in vivo axial stretch ( z ), (B) circumferential stretch ( ) vs. circumferential
stress ( ) at each vessel’s in vivo axial stretch, (C) pressure vs. axial force at each vessel’s
in vivo axial stretch, (D) axial stretch vs. axial stress at 100 mmHg. Closed circles – day 0,
open circles – day 21; hashed boxes around legend denote vessels that remained viable
through day 21.
A B
C D

163
Figure 6.5 Biaxial mechanical data from inflation-extension testing of 2 vessels that maintained viability after 21 day stepwise remodeling culture: (A) pressure vs. diameter relationship at each vessel’s in vivo axial stretch ( z ), (B) circumferential stretch ( ) vs.
circumferential stress ( ) at each vessel’s in vivo axial stretch, (C) pressure vs. axial force
at each vessel’s in vivo axial stretch, (D) axial stretch vs. axial stress at 100 mmHg. . Closed circles – day 0, open circles – day 21
A B
C D

164
Figure 6.6 – Comparison of changing structural and mechanical properties before and after 21 day remodeling culture in individual samples at in vivo stretch ratio and 100 mmHg pressure. Hashed boxes denote samples that maintained viability through day 21.
165
CHAPTER 7
CONCLUSIONS AND FUTURE DIRECTIONS
Vascular mechanics and remodeling are an important yet under-investigated aspect of
coronary artery bypass grafting. Blood vessels, like other tissues, sense and respond to the
mechanical and biochemical stimuli imposed upon them through growth and development,
which guides the mature structure of the vessel. This creates a relationship between
structure and function whereby blood vessels at any location in the vascular tree are
uniquely suited to mechanical loads and physiological demands of that particular
microenvironment. Thus, the vessel exists at homeostasis with its mechanical environment.
When the local mechanical environment is disturbed, resident vascular smooth muscle cells
sense these changes through cell-cell and cell-matrix junctions and respond by contracting
or relaxing to alter vessel tone and redistribute the altered loads. When mechanical
disturbances persist for days, weeks, and months, these and other resident vascular cells
respond by enacting remodeling process to alter the geometry and composition of the vessel
to restore its homeostatic state and function effectively in the new loading environment.
Clinicians have long speculated that differences in local mechanics between source
tissues and their grafted environment could be a factor in graft efficacy, as early
observations – later confirmed through experimentation – often showed differences in
important graft characteristics like compliance, inner radius, and vessel histology, which
correlate with decreased patency in many grafts. In Chapter 2 of this dissertation, we
quantified the passive biaxial mechanics of one coronary artery – the LAD – and three

166
common CABG vessels – the ITA, RA, and GSV. By utilizing a continuum mechanics
approach, we directly compared the mechanical properties of each tissue under native and
grafted conditions and findings suggested that the magnitude of mechanical deviation from
the native to grafted state of important graft parameters – circumferential stress, axial
stress, compliance, and deformed inner radius – directly correlates with observed clinical
failure rates across these vessels.
As grafting inherently disturbs the local mechanical environment of source tissues,
remodeling processes must act to restore homeostasis and maximize functionality of grafts
in their new environment. Overall processes that can result from remodeling – diameter
changes, wall thickening, protein deposition, etc. – are relatively well established, but it is
unclear whether discrete individual vessels and resident vascular cells therein are equally
capable of adaptive remodeling. Thus, in Chapter 3 we compared the cells of the ITA, RA,
and GSV, as well as the overall tissue response ex vivo to coronary loading to find that
differences exist in cell proliferation and tissue level gene expression across source tissues.
Chapter 6 builds upon these findings by seeking to stimulate adaptive remodeling in the
GSV through prolonged ex vivo tissue culture, and preliminary results suggest an ability
to promote remodeling and improved compatibility with the coronary circulation without
triggering maladaptive processes.
An often-overlooked aspect of ex vivo vascular culture has been the sensitivity of
resident vascular cells to hemodynamics with respect to remodeling. Others have
demonstrated cellular sensitivity to harmonic frequencies beyond the primary pulse
pressure, but very few investigations have taken this into account for ex vivo tissue culture.
In Chapter 4, we designed and validated a novel perfusion bioreactor capable of recreating

167
physiological flows across different vessels and species. From this work, we noticed that
the cultured vessels, in this case GSVs, were sensitive to arterial waveforms. We also
noticed that tissues were highly sensitive to the culture process alone. In ongoing work in
our lab and future investigations, this bioreactor is being used to determine if accurate
hemodynamic replication is necessary to guide adaptive remodeling. Further, we are
currently using this biomimetic perfusion bioreactor in concert with next generation
sequencing to evaluate the biochemical pathways that are sensitive to hemodynamic
intricacies. This approach should inform improved experimental design by knowing to
what extent physiological flow and pressure waves should be replicated to effect desired
remodeling outcomes. By understanding the molecular pathways that are sensitive to
specific aspects of flow and pressure waves, we can identify therapeutic targets to enhance
desired remodeling outcomes and inhibit maladaptive pathways.
Traditional CABG procedures – and other small diameter graft applications – are
constrained by the limited availability of suitable autologous conduits, with GSVs being
the most used but not necessarily most effective source, while tissue engineered vascular
grafts to date have not demonstrated sufficient efficacy in small diameter applications. As
more people require more grafts – multiple CABGs, peripheral artery bypass, etc. – reliable
engineered options would be a valuable tool to clinicians. An ongoing area of research in
our lab and others involves the use of decellularized animal tissues as a xenograft scaffold
that could then be seeded and treated to function as a vascular graft in man. In the process
of decellularization, biological antigens are removed, opening the possibility of using non-
human decellularized vessels as scaffolds to be seeded with human cells. In this scenario,
a donor scaffold could be selected across multiple vessel types from multiple species based
168
on patient-specific geometry and desired mechanical properties. In Chapter 5, we evaluate
the passive biaxial mechanical properties of carotid arteries across six species of mammals
to show that some but not all mechanical properties scale allometrically and provide a
framework for a future catalog of decellularized graft scaffolds. The implications for the
current research project are that the biophysical properties of these grafts could actually be
enhanced prior to implantation. For example, a decellularized scaffold from any desired
source could be seeded with progenitor or mature vascular cells and cultured under the
exact mechanical and hemodynamic environment for which it is intended, allowing the
cells to remodel the scaffold as necessary to reach homeostasis prior to implantation and,
in theory, requiring little to no adaptation once grafted.
Future investigations can synthesize the knowledge generated herein with respect
to autologous graft tissues to better design and characterize engineered blood vessels.
Cardiovascular disease continues to be a leading cause of mortality and morbidity in the
developed world, reducing the quality of life for millions of people and resulting in billions
of dollars in direct and indirect monetary burden. Healthy vasculature is imperative to the
optimal function of every tissue in the body, and hopefully the knowledge presented in this
dissertation will be used to create better vascular grafts that restore health to those in need.

169
REFERENCES
1. Gault JH, Ross J, Mason DT. Patterns of brachial arterial blood flow in conscious
human subjects with and without cardiac dysfunction. Circulation. Am Heart Assoc;
1966;34: 833–848.
2. Berne RM, Levy MN. Cardiovascular physiology [Internet]. Mosby; 2001.
Available: http://books.google.com/books?id=CNlqAAAAMAAJ
3. Abraham P, Leftheriotis G, Desvaux B, Saumet M, Saumet L, Saumet JL. Diameter
and blood velocity changes in the saphenous vein during thermal stress. Eur J Appl
Physiol Occup Physiol. 1994/01/01. 1994;69: 305–308.
4. Chuong CJ, Fung YC. Three-dimensional stress distribution in arteries. J Biomech
Eng. American Society of Mechanical Engineers; 1983;105: 268–274.
5. Holzapfel GA, Gasser TC, Ogden RW. A new constitutive framework for arterial
wall mechanics and a comparative study of material models. J Elast. Kluwer
Academic Publishers; 2000;61: 1–48. doi:10.1023/A:1010835316564
6. Baek S, Gleason RL, Rajagopal KR, Humphrey JD. Theory of small on large:
potential utility in computations of fluid–solid interactions in arteries . Comput
Methods Appl Mech Eng. 2007;196: 3070–3078.
7. Gaudino M, Taggart D, Suma H, Puskas JD, Crea F, Massetti M. The Choice of
Conduits in Coronary Artery Bypass Surgery. J Am Coll Cardiol. Journal of the
American College of Cardiology; 2015;66: 1729–1737.
doi:10.1016/j.jacc.2015.08.395

170
8. Humphrey JD. Cardiovascular Solid Mechanics: Cells, Tissues, and Organs
[Internet]. Springer; 2002. doi:10.1007/978-0-387-21576-1
9. Majesky MW. Adventitia and perivascular cells. Arterioscler Thromb Vasc Biol.
American Heart Association, Inc.; 2015;35: e31-5.
doi:10.1161/ATVBAHA.115.306088
10. Mueller RL, Rosengart TK, Isom OW. The History of Surgery for Ischemic Heart
Disease. Ann Thorac Surg. Elsevier; 1997;63: 869–878. doi:10.1016/S0003-
4975(96)01375-6
11. Benjamin EJ, Blaha MJ, Chiuve SE, Cushman M, Das SR, Deo R, et al. Heart
Disease and Stroke Statistics—2017 Update: A Report From the American Heart
Association. Circulation. 2017;135: e146 LP-e603. Available:
http://circ.ahajournals.org/content/135/10/e146.abstract
12. Al-Sabti HA, Al Kindi A, Al-Rasadi K, Banerjee Y, Al-Hashmi K, Al-Hinai A.
Saphenous vein graft vs. radial artery graft searching for the best second coronary
artery bypass graft. J Saudi Hear Assoc. 2013/11/08. 2013;25: 247–254.
doi:10.1016/j.jsha.2013.06.001
13. Benedetto U, Raja SG, Albanese A, Amrani M, Biondi-Zoccai G, Frati G. Searching
for the second best graft for coronary artery bypass surgery: a network meta-analysis
of randomized controlled trials. Eur J Cardiothorac Surg. 2014/03/30. 2015;47: 59–
65. doi:10.1093/ejcts/ezu111
14. Carey JS, Danielsen B, Milliken J, Li Z, Stabile BE. Narrowing the gap: Early and
intermediate outcomes after percutaneous coronary intervention and coronary artery
bypass graft procedures in California, 1997 to 2006. J Thorac Cardiovasc Surg.
171
Elsevier; 2009;138: 1100–1107. doi:10.1016/j.jtcvs.2009.03.069
15. Prim DA, Zhou B, Hartstone-Rose A, Uline MJ, Shazly T, Eberth JF. A mechanical
argument for the differential performance of coronary artery grafts. J Mech Behav
Biomed Mater. 2016;54: 93–105. doi:10.1016/j.jmbbm.2015.09.017
16. Goldman S, Zadina K, Moritz T, Ovitt T, Sethi G, Copeland JG, et al. Long-term
patency of saphenous vein and left internal mammary artery grafts after coronary
artery bypass surgery: Results from a Department of Veterans Affairs Cooperative
Study. J Am Coll Cardiol. Elsevier; 2004;44: 2149–2156.
doi:10.1016/J.JACC.2004.08.064
17. Samano N, Geijer H, Liden M, Fremes S, Bodin L, Souza D. The no-touch
saphenous vein for coronary artery bypass grafting maintains a patency, after 16
years, comparable to the left internal thoracic artery: A randomized trial. J Thorac
Cardiovasc Surg. Elsevier; 2015;150: 880–888. doi:10.1016/j.jtcvs.2015.07.027
18. Athanasiou T, Saso S, Rao C, Vecht J, Grapsa J, Dunning J, et al. Radial artery
versus saphenous vein conduits for coronary artery bypass surgery: forty years of
competition--which conduit offers better patency? A systematic review and meta-
analysis. Eur J Cardiothorac Surg. 2010/12/21. 2011;40: 208–220.
doi:10.1016/j.ejcts.2010.11.012
19. Davies MG, Hagen PO. Pathobiology of intimal hyperplasia. Br J Surg. 1994/09/01.
1994;81: 1254–1269.
20. Tennant M, Dilley RJ, McGeachie JK, Prendergast FJ. Histogenesis of arterial
intimal hyperplasia and atherosclerosis. Aust N Z J Surg. 1990;60: 79–85.
21. Ruengsakulrach P, Sinclair R, Komeda M, Raman J, Gordon I, Buxton B.

172
Comparative Histopathology of Radial Artery Versus Internal Thoracic Artery and
Risk Factors for Development of Intimal Hyperplasia and Atherosclerosis.
Circulation. 1999;100: II-139-Ii-144. doi:10.1161/01.CIR.100.suppl_2.II-139
22. Davies MG, Hagen PO. Reprinted article “Pathophysiology of vein graft failure: a
review.” Eur J Vasc Endovasc Surg. 2011;42 Suppl 1: S19-29.
doi:10.1016/j.ejvs.2011.06.013
23. de Vries MR, Quax PHA. Inflammation in Vein Graft Disease. Front Cardiovasc
Med. Frontiers; 2018;5: 3. doi:10.3389/fcvm.2018.00003
24. Osgood MJ, Hocking KM, Voskresensky I V., Li FD, Komalavilas P, Cheung-Flynn
J, et al. Surgical vein graft preparation promotes cellular dysfunction, oxidative
stress, and intimal hyperplasia in human saphenous vein. Journal of Vascular
Surgery. 2014. doi:10.1016/j.jvs.2013.06.004
25. Ludwig R, Virchow K. Cellular pathology [Internet]. John Churchill; 1860.
Available: https://books.google.com/books?id=nmEGHJy9uswC&hl=en
26. Cannon WB. ORGANIZATION FOR PHYSIOLOGICAL HOMEOSTASIS.
Physiol Rev. 1929;9: 399–431. doi:10.1152/physrev.1929.9.3.399
27. Prior BM, Lloyd PG, Yang HT, Terjung RL. Exercise-induced vascular remodeling.
Exerc Sport Sci Rev. 2003;31: 26–33. doi:10.1097/00003677-200301000-00006
28. Matsumoto T, Hayashi K. Mechanical and dimensional adaptation of rat aorta to
hypertension. J Biomech Eng. 1994/08/01. 1994;116: 278–283.
doi:10.1115/1.2895731
29. Eberth JF, Cardamone L, Humphrey JD. Evolving biaxial mechanical properties of
mouse carotid arteries in hypertension. J Biomech. 2011/08/20. Elsevier; 2011;44:

173
2532–2537. doi:10.1016/j.jbiomech.2011.07.018
30. Rosenson RS, McCormick A, Uretz EF. Distribution of blood viscosity values and
biochemical correlates in healthy adults. Clin Chem. 1996;42. Available:
http://clinchem.aaccjnls.org/content/42/8/1189.short
31. de Bruyne B, Bartunek J, Sys SU, Pijls NHJ, Heyndrickx GR, Wijns W.
Simultaneous Coronary Pressure and Flow Velocity Measurements in Humans
Feasibility, Reproducibility, and Hemodynamic Dependence of Coronary Flow
Velocity Reserve, Hyperemic Flow Versus Pressure Slope Index, and Fractional
Flow Reserve. Circulation. 1996;94: 1842–1849.
32. Humphrey JD, Eberth JF, Dye WW, Gleason RL. Fundamental role of axial stress
in compensatory adaptations by arteries. J Biomech. 2008/12/17. 2009;42: 1–8.
doi:10.1016/j.jbiomech.2008.11.011
33. Kamiya A, Togawa T. Adaptive regulation of wall shear stress to flow change in the
canine carotid artery. Am J Physiol. 1980/07/01. 1980;239: H14-21.
34. Langille BL, O’Donnell F. Reductions in arterial diameter produced by chronic
decreases in blood flow are endothelium-dependent. Science (80- ). 1986;231: 405–
407. doi:10.1126/science.3941904
35. Langille BL. Arterial remodeling: relation to hemodynamics. Can J Physiol
Pharmacol. Canada; 1996;74: 834–841.
36. Baeyens N, Nicoli S, Coon BG, Ross TD, Van den Dries K, Han J, et al. Vascular
remodeling is governed by a VEGFR3-dependent fluid shear stress set point. Elife.
eLife Sciences Publications Limited; 2015;4: e04645. doi:10.7554/eLife.04645
37. Hayashi K, Kakoi D, Makino A. Remodeling of the arterial wall: Response to
174
restoration of normal blood flow after flow reduction. Biorheology. IOS Press;
2018;54: 95–108. doi:10.3233/BIR-17146
38. Hayashi K, Mori K, Miyazaki H. Biomechanical response of femoral vein to chronic
elevation of blood pressure in rabbits. Am J Physiol Heart Circ Physiol. 2003;284:
H511-8. doi:10.1152/ajpheart.00620.2002
39. Matsumoto T, Okumura E, Shirono T, Sho E, Masuda H, Sato M. Flow-induced
changes in dimensions and mechanical properties of rabbit common carotid arteries.
JSME Int Journal, Ser C Mech Syst Mach Elem Manuf. 2006;48.
doi:10.1299/jsmec.48.477
40. Fridez P, Zulliger M, Bobard F, Montorzi G, Miyazaki H, Hayashi K, et al.
Geometrical, functional, and histomorphometric adaptation of rat carotid artery in
induced hypertension. J Biomech. Elsevier; 2003;36: 671–680. doi:10.1016/S0021-
9290(02)00445-1
41. Choy JS, Dang Q, Molloi S, Kassab GS. Nonuniformity of axial and circumferential
remodeling of large coronary veins in response to ligation. Am J Physiol Circ
Physiol. American Physiological Society; 2006;290: H1558–H1565.
doi:10.1152/ajpheart.00928.2005
42. Dobrin PB, Littooy FN, Endean ED. Mechanical factors predisposing to intimal
hyperplasia and medial thickening in autogenous vein grafts. Surgery. 1989;105:
393–400.
43. Matsumoto T, Hayashi K. Stress and Strain Distribution in Hypertensive and
Normotensive Rat Aorta Considering Residual Strain. J Biomech Eng. ASME;
1996;118: 62–73.

175
44. Gleason RL, Wilson E, Humphrey JD. Biaxial biomechanical adaptations of mouse
carotid arteries cultured at altered axial extension. J Biomech. 2007;40: 766–776.
doi:http://dx.doi.org/10.1016/j.jbiomech.2006.03.018
45. Powell JT, Gosling M. Molecular and cellular changes in vein grafts: influence of
pulsatile stretch. Curr Opin Cardiol. 1998/11/21. 1998;13: 453–458.
46. Eberth JF, Gresham VC, Reddy AK, Popovic N, Wilson E, Humphrey JD.
Importance of pulsatility in hypertensive carotid artery growth and remodeling. J
Hypertens. 2009/07/09. 2009;27: 2010–2021. doi:10.1097/HJH.0b013e32832e8dc8
47. Eberth JF, Popovic N, Gresham VC, Wilson E, Humphrey JD. Time course of
carotid artery growth and remodeling in response to altered pulsatility. Am J Physiol
Hear Circ Physiol. 2010/09/21. 2010;299: H1875-83.
doi:10.1152/ajpheart.00872.2009
48. Chien S. Mechanotransduction and endothelial cell homeostasis: the wisdom of the
cell. Am J Physiol Hear Circ Physiol. 2007;292: H1209–H1224.
doi:10.1152/ajpheart.01047.2006
49. Humphrey JD, Dufresne ER, Schwartz M a. Mechanotransduction and extracellular
matrix homeostasis. Nat Rev Mol Cell Biol. 2014;15: 802–812.
doi:10.1038/nrm3896
50. Jalali S, del Pozo MA, Chen K-D, Miao H, Li Y-S, Schwartz MA, et al. Integrin-
mediated mechanotransduction requires its dynamic interaction with specific
extracellular matrix (ECM) ligands. Proc Natl Acad Sci. 2001;98: 1042–1046.
doi:10.1073/pnas.98.3.1042
51. Desart KM, Butler K, O’Malley KA, Jiang Z, Berceli SA. Time and flow-dependent
176
changes in the p27(kip1) gene network drive maladaptive vascular remodeling.
Journal of Vascular Surgery. Elsevier; 2015. p. 1296–1302.e2.
doi:10.1016/j.jvs.2014.05.015
52. Berard X, Déglise S, Alonso F, Saucy F, Meda P, Bordenave L, et al. Role of
hemodynamic forces in the ex vivo arterialization of human saphenous veins. J Vasc
Surg. 2013;57: 1371–1382. doi:http://dx.doi.org/10.1016/j.jvs.2012.09.041
53. Bolitho GA, Hollis TM. Aortic Histomine Syntesis in Experimental Neurogenic
Hypertension. Exp Biol Med. 1975;148: 1189–1192. doi:10.3181/00379727-148-
38714
54. Shyy YJ, Hsieh HJ, Usami S, Chien S. Fluid shear stress induces a biphasic response
of human monocyte chemotactic protein 1 gene expression in vascular endothelium.
Proc Natl Acad Sci. 1994;91.
55. Malek AM, Greene AL, Izumo S. Regulation of endothelin 1 gene by fluid shear
stress is transcriptionally mediated and independent of protein kinase C and cAMP.
Proc Natl Acad Sci. 1993;90: 5999–6003. Available:
http://www.pnas.org/content/90/13/5999.abstract
56. Dewey CF, Bussolari SR, Gimbrone MA, Davies PF. The dynamic response of
vascular endothelial cells to fluid shear stress. J Biomech Eng. 1981;103: 177–85.
Available: http://www.ncbi.nlm.nih.gov/pubmed/7278196
57. Davies PF, Remuzzi A, Gordon EJ, Dewey Jr. CF, Gimbrone Jr. MA. Turbulent
fluid shear stress induces vascular endothelial cell turnover in vitro. Proc Natl Acad
Sci U S A. 1986;83: 2114–2117. doi:10.1073/pnas.83.7.2114
58. Ziegler T, Bouzourene K, Harrison VJ, Brunner HR, Hayoz D. Influence of
177
Oscillatory and Unidirectional Flow Environments on the Expression of Endothelin
and Nitric Oxide Synthase in Cultured Endothelial Cells. Arterioscler Thromb Vasc
Biol. 1998;18: 686–692. doi:10.1161/01.atv.18.5.686
59. Hsiai TK, Cho SK, Wong PK, Ing M, Salazar A, Sevanian A, et al. Monocyte
recruitment to endothelial cells in response to oscillatory shear stress. FASEB J. NIH
Public Access; 2003;17: 1648–57. doi:10.1096/fj.02-1064com
60. Blackman BR, García-Cardeña G, Gimbrone MA. A new in vitro model to evaluate
differential responses of endothelial cells to simulated arterial shear stress
waveforms. J Biomech Eng. 2002;124: 397–407. Available:
http://www.ncbi.nlm.nih.gov/pubmed/12188206
61. Kaunas R, Usami S, Chien S. Regulation of stretch-induced JNK activation by stress
fiber orientation. Cell Signal. 2006;18: 1924–31. doi:10.1016/j.cellsig.2006.02.008
62. Kaunas R, Nguyen P, Usami S, Chien S. Cooperative effects of Rho and mechanical
stretch on stress fiber organization. Proc Natl Acad Sci U S A. 2005;102: 15895–
900. doi:10.1073/pnas.0506041102
63. Zhao S, Suciu A, Ziegler T, Moore JE, Bürki E, Meister JJ, et al. Synergistic effects
of fluid shear stress and cyclic circumferential stretch on vascular endothelial cell
morphology and cytoskeleton. Arterioscler Thromb Vasc Biol. American Heart
Association, Inc.; 1995;15: 1781–6. doi:10.1161/01.ATV.15.10.1781
64. Li YS, Haga JH, Chien S. Molecular basis of the effects of shear stress on vascular
endothelial cells. J Biomech. 2005;38: 1949–1971.
doi:10.1016/j.jbiomech.2004.09.030
65. Tarbell JM, Shi ZD, Dunn J, Jo H. Fluid Mechanics, Arterial Disease, and Gene

178
Expression. Annu Rev Fluid Mech. 2014;46: 591–614. doi:10.1146/annurev-fluid-
010313-141309
66. Davies PF, Barbee KA, Volin M V, Robotewskyj A, Chen J, Joseph L, et al.
SPATIAL RELATIONSHIPS IN EARLY SIGNALING EVENTS OF FLOW-
MEDIATED ENDOTHELIAL MECHANOTRANSDUCTION. Annu Rev Physiol.
1997;59: 527–549. doi:doi:10.1146/annurev.physiol.59.1.527
67. Leung DYM, Glagov S, Mathews MB. Cyclic stretching stimulates synthesis of
matrix components by arterial smooth muscle cells in vitro. Science (80- ).
1976;191: 475–477. doi:10.1126/science.128820
68. Tozzi CA, Christiansen DL, Poiani GJ, Riley DJ. Excess collagen in hypertensive
pulmonary arteries decreases vascular distensibility. Am J Respir Crit Care Med.
1994;149: 1317–1326. doi:10.1164/ajrccm.149.5.8173773
69. Scott D, Tan Y, Shandas R, Stenmark KR, Tan W. High Pulsatility Flow Stimulates
Smooth Muscle Cell Hypertrophy and Contractile Protein Expression. AJP Lung
Cell Mol Physiol. 2012; 70–81. doi:10.1152/ajplung.00342.2012
70. Mills CJ, Gabe IT, Gault JH, Mason DT, Ross J, Braunwald E, et al. Pressure-flow
relationships and vascular impedance in man. Cardiovasc Res. 1970;4: 405 LP-417.
Available: http://cardiovascres.oxfordjournals.org/content/4/4/405.abstract
71. London GM, Guerin AP. Influence of arterial pulse and reflected waves on blood
pressure and cardiac function. Am Hear J. 1999/09/01. 1999;138: 220–224.
doi:a100205 [pii]
72. O’rourke MF. Vascular impedance in studies of arterial and cardiac function.
Physiol Rev. Am Physiological Soc; 1982;62: 570–623.

179
73. Ku DN. Blood Flow in Arteries. Annu Rev Fluid Mech. 1997;29: 399–434.
doi:10.1146/annurev.fluid.29.1.399
74. Dai G, Kaazempur-Mofrad MR, Natarajan S, Zhang Y, Vaughn S, Blackman BR,
et al. Distinct endothelial phenotypes evoked by arterial waveforms derived from
atherosclerosis-susceptible and -resistant regions of human vasculature. Proc Natl
Acad Sci. 2004;101: 14871–14876. doi:10.1073/pnas.0406073101
75. Feaver RE, Gelfand BD, Blackman BR. Human haemodynamic frequency
harmonics regulate the inflammatory phenotype of vascular endothelial cells. Nat
Commun. 2013;4: 1525. doi:10.1038/ncomms2530
76. Herman IM, Brant AM, Warty VS, Bonaccorso J, Klein EC, Kormos RL, et al.
Hemodynamics and the vascular endothelial cytoskeleton. J Cell Biol. Rockefeller
University Press; 1987;105: 291–302. doi:10.1083/JCB.105.1.291
77. Berceli SA, Borovetz HS, Sheppeck RA, Moosa HH, Warty VS, Armany MA, et al.
Mechanisms of vein graft atherosclerosis: LDL metabolism and endothelial actin
reorganization. J Vasc Surg. Elsevier; 1991;13: 336–347. doi:10.1016/0741-
5214(91)90227-L
78. Clerin V, Gusic RJ, O’Brien J, Kirshbom PM, Myung RJ, Gaynor JW, et al.
Mechanical environment, donor age, and presence of endothelium interact to
modulate porcine artery viability ex vivo. Ann Biomed Eng. 2002/12/28. 2002;30:
1117–1127.
79. Bardy N, Merval R, Benessiano J, Samuel JL, Tedgui A. Pressure and angiotensin
II synergistically induce aortic fibronectin expression in organ culture model of
rabbit aorta. Evidence for a pressure-induced tissue renin-angiotensin system. Circ

180
Res. American Heart Association, Inc.; 1996;79: 70–8. doi:10.1161/01.RES.79.1.70
80. Montorzi G, Silacci P, Zulliger M, Stergiopulos N. Functional, mechanical and
geometrical adaptation of the arterial wall of a non-axisymmetric artery in vitro. J
Hypertens. 2004;22: 339–47. Available:
http://www.ncbi.nlm.nih.gov/pubmed/15076192
81. Prandi F, Piola M, Soncini M, Colussi C, D’Alessandra Y, Penza E, et al. Adventitial
Vessel Growth and Progenitor Cells Activation in an Ex Vivo Culture System
Mimicking Human Saphenous Vein Wall Strain after Coronary Artery Bypass
Grafting. Madeddu P, editor. PLoS One. Public Library of Science; 2015;10:
e0117409. doi:10.1371/journal.pone.0117409
82. Han HC, Marita S, Ku DN. Changes of opening angle in hypertensive and
hypotensive arteries in 3-day organ culture. J Biomech. 2006;39: 2410–2418.
doi:10.1016/j.jbiomech.2005.08.003
83. Dummler S, Eichhorn S, Tesche C, Schreiber U, Voss B, Deutsch MA, et al.
Pulsatile ex vivo perfusion of human saphenous vein grafts under controlled
pressure conditions increases MMP-2 expression. Biomed Eng Online. 2011;10: 62.
doi:10.1186/1475-925X-10-62
84. Gusic RJ, Myung R, Petko M, Gaynor JW, Gooch KJ. Shear stress and pressure
modulate saphenous vein remodeling ex vivo. J Biomech. 2005;38: 1760–1769.
doi:10.1016/j.jbiomech.2004.10.030
85. Yoshigi M, Keller BB. Characterization of embryonic aortic impedance with
lumped parameter models. Am Physiol Soc. 1997;273: H19–H27.
86. Yoshigi M, Knott GD, Keller BB. Lumped parameter estimation for the embryonic

181
chick vascular system: a time-domain approach using MLAB. Comput Methods
Programs Biomed. Elsevier; 2000;63: 29–41.
87. Stergiopulos N, Westerhof BE, Westerhof N. Total arterial inertance as the fourth
element of the windkessel model. Am J Physiol Circ Physiol. Am Physiological Soc;
1999;276: H81–H88.
88. Westerhof N, Elzinga G, Sipkema P. An artificial arterial system for pumping hearts.
J Appl Physiol. 1971/11/01. 1971;31: 776–781.
89. Westerhof N, Lankhaar JW, Westerhof BE. The arterial Windkessel. Med Biol Eng
Comput. 2008/06/11. 2009;47: 131–141. doi:10.1007/s11517-008-0359-2
90. Eriksson A, Persson HW, Lindström K. A computer-controlled arbitrary flow wave
form generator for physiological studies. Rev Sci Instrum. American Institute of
Physics; 1999;71: 235. doi:10.1063/1.1150189
91. Tsai W, Savaş Ö. Flow pumping system for physiological waveforms. Med Biol
Eng Comput. Springer-Verlag; 2010;48: 197–201. doi:10.1007/s11517-009-0573-6
92. Kung EO, Taylor CA. Development of a Physical Windkessel Module to Re-Create
In Vivo Vascular Flow Impedance for In Vitro Experiments. Cardiovasc Eng
Technol. 2011;2: 2–14. doi:10.1007/s13239-010-0030-6
93. Pahlevan NM, Gharib M. In-vitro investigation of a potential wave pumping effect
in human aorta. J Biomech. Elsevier; 2013;46: 2122–9.
doi:10.1016/j.jbiomech.2013.07.006
94. Gusic RJ, Petko M, Myung R, Gaynor JW, Gooch KJ. Mechanical properties of
native and ex vivo remodeled porcine saphenous veins. J Biomech. 2005;38: 1770–
1779. doi:10.1016/j.jbiomech.2005.04.002

182
95. Paroz A, Probst H, Saucy F, Mazzolai L, Rizzo E, Ris H-B, et al. Comparison of
morphological and functional alterations of human saphenous veins after seven and
fourteen days of ex vivo perfusion. Eur Surg Res. Karger Publishers; 2004;36: 274–
81. doi:10.1159/000079912
96. Saucy F, Probst H, Alonso F, Berard X, Deglise S, Dunoyer-Geindre S, et al. Ex
vivo pulsatile perfusion of human saphenous veins induces intimal hyperplasia and
increased levels of the plasminogen activator inhibitor 1. Eur Surg Res. 2010/08/28.
2010;45: 50–59. doi:10.1159/000318602
97. Miyakawa AA, Dallan LAO, Lacchini S, Borin TF, Krieger JE. Human saphenous
vein organ culture under controlled hemodynamic conditions. Clinics (Sao Paulo).
2008;63: 683–8. Available: http://www.ncbi.nlm.nih.gov/pubmed/18925330
98. Campos LC, Miyakawa AA, Barauna VG, Cardoso L, Borin TF, Dallan LA, et al.
Induction of CRP3/MLP expression during vein arterialization is dependent on
stretch rather than shear stress. Cardiovasc Res. 2009;83: 140–147.
doi:10.1093/cvr/cvp108
99. Piola M, Prandi F, Bono N, Soncini M, Penza E, Agrifoglio M, et al. A compact and
automated ex vivo vessel culture system for the pulsatile pressure conditioning of
human saphenous veins. J Tissue Eng Regen Med. 2013; n/a-n/a.
doi:10.1002/term.1798
100. Piola M, Prandi F, Fiore GB, Agrifoglio M, Polvani G, Pesce M, et al. Human
Saphenous Vein Response to Trans-wall Oxygen Gradients in a Novel Ex Vivo
Conditioning Platform. Ann Biomed Eng. 2016;44: 1449–1461.
doi:10.1007/s10439-015-1434-0

183
101. Piola M, Ruiter M, Vismara R, Mastrullo V, Agrifoglio M, Zanobini M, et al. Full
Mimicking of Coronary Hemodynamics for Ex-Vivo Stimulation of Human
Saphenous Veins. Ann Biomed Eng. Springer US; 2017;45: 884–897.
doi:10.1007/s10439-016-1747-7
102. Sabik JF, Bansilal S, Lytle BW. Chapter 65. Coronary Bypass Surgery. In: Fuster
V, Walsh RA, Harrington RA, editors. Hurst’s The Heart, 13e. New York, NY: The
McGraw-Hill Companies; 2011. Available:
http://mhmedical.com/content.aspx?aid=7822960
103. Lloyd-Jones D, Adams RJ, Brown TM, Carnethon M, Dai S, De Simone G, et al.
Heart Disease and Stroke Statistics—2010 Update: A Report From the American
Heart Association. Circulation. 2009/12/19. 2010;121: e46–e215.
doi:10.1161/circulationaha.109.192667
104. US Department of Health and Human Services. National Hospital Discharge Survey
2010. 2013.
105. Calafiore AM, Di Giammarco G, Teodori G, D’Annunzio E, Vitolla G, Fino C, et
al. Radial artery and inferior epigastric artery in composite grafts: Improved
midterm angiographic results. Ann Thorac Surg. 1995;60: 517–524.
doi:10.1016/0003-4975(95)00479-5
106. Cao C, Manganas C, Horton M, Bannon P, Munkholm-Larsen S, Ang SC, et al.
Angiographic outcomes of radial artery versus saphenous vein in coronary artery
bypass graft surgery: A meta-analysis of randomized controlled trials. J Thorac
Cardiovasc Surg. 2013;146: 255–261.
107. Cohen G, Tamariz MG, Sever JY, Liaghati N, Guru V, Christakis GT, et al. The

184
radial artery versus the saphenous vein graft in contemporary CABG: a case-
matched study. Ann Thorac Surg. 2001/02/24. 2001;71: 180–186.
doi:10.1016/S0003-4975(00)02285-2
108. Desai ND, Cohen EA, Naylor CD, Fremes SE. A randomized comparison of radial-
artery and saphenous-vein coronary bypass grafts. N Engl J Med. 2004/11/27.
2004;351: 2302–2309. doi:10.1056/NEJMoa040982
109. Fiore AC, Naunheim KS, Dean P, Kaiser GC, Pennington DG, Willman VL, et al.
Results of internal thoracic artery grafting over 15 years: single versus double grafts.
Ann Thorac Surg. 1990;49: 202–209.
110. Fitzgibbon GM, Kafka HP, Leach AJ, Keon WJ, Hooper GD, Burton JR. Coronary
bypass graft fate and patient outcome: Angiographic follow-up of 5,065 grafts
related to survival and reoperation in 1,388 patients during 25 years. J Am Coll
Cardiol. 1996;28: 616–626. doi:10.1016/0735-1097(96)00206-9
111. Goldman S, Sethi GK, Holman W, Thai H, McFalls E, Ward HB, et al. Radial artery
grafts vs saphenous vein grafts in coronary artery bypass surgery: a randomized trial.
Jama. 2011/01/13. 2011;305: 167–174. doi:10.1001/jama.2010.1976
112. Hess CN, Lopes RD, Gibson CM, Hager R, Wojdyla DM, Englum BR, et al.
Saphenous Vein Graft Failure After Coronary Artery Bypass Surgery: Insights From
PREVENT IV. Circulation. 2014;130: 1445–1451.
doi:10.1161/circulationaha.113.008193
113. Loop FD, Lytle BW, Cosgrove DM, Stewart RW, Goormastic M, Williams GW, et
al. Influence of the Internal-Mammary-Artery Graft on 10-Year Survival and Other
Cardiac Events. N Engl J Med. 1986;314: 1–6.

185
doi:10.1056/NEJM198601023140101
114. Maniar HS, Sundt TM, Barner HB, Prasad SM, Peterson L, Absi T, et al. Effect of
target stenosis and location on radial artery graft patency. J Thorac Cardiovasc Surg.
2002;123: 45–52. doi:10.1067/mtc.2002.118686
115. Royse AG, Royse CF, Tatoulis J, Grigg LE, Shah P, Hunt D, et al. Postoperative
radial artery angiography for coronary artery bypass surgery. Eur J Cardio-Thoracic
Surg. 2000;17: 294–304. doi:10.1016/s1010-7940(99)00364-4
116. Sabik 3rd JF, Lytle BW, Blackstone EH, Houghtaling PL, Cosgrove DM.
Comparison of saphenous vein and internal thoracic artery graft patency by coronary
system. Ann Thorac Surg. 2005/02/01. 2005;79: 544–551.
doi:10.1016/j.athoracsur.2004.07.047
117. Zacharias A, Habib RH, Schwann TA, Riordan CJ, Durham SJ, Shah A. Improved
Survival With Radial Artery Versus Vein Conduits in Coronary Bypass Surgery
With Left Internal Thoracic Artery to Left Anterior Descending Artery Grafting.
Circulation. 2004;109: 1489–1496. Available:
http://circ.ahajournals.org/content/109/12/1489.abstract
118. Bassiouny HS, White S, Glagov S, Choi E, Giddens DP, Zarins CK. Anastomotic
intimal hyperplasia: Mechanical injury or flow induced. J Vasc Surg. 1992;15: 708–
717. doi:10.1016/0741-5214(92)90019-5
119. Hofer M, Rappitsch G, Perktold K, Trubel W, Schima H. Numerical study of wall
mechanics and fluid dynamics in end-to-side anastomoses and correlation to intimal
hyperplasia. J Biomech. Elsevier; 1996;29: 1297–1308. doi:10.1016/0021-
9290(96)00036-X

186
120. Fung YC. What are the residual stresses doing in our blood vessels? Ann Biomed
Eng. 1991/01/01. 1991;19: 237–249. doi:10.1007/BF02584301
121. Rachev A, Stergiopulos N, Meister JJ. A Model for Geometric and Mechanical
Adaptation of Arteries to Sustained Hypertension. J Biomech Eng. 1998;120: 9–17.
doi:10.1115/1.2834313
122. Zwolak RM, Adams MC, Clowes AW. Kinetics of vein graft hyperplasia:
association with tangential stress. J Vasc Surg. 1987/01/01. 1987;5: 126–136.
123. Bank AJ, Wang H, Holte JE, Mullen K, Shammas R, Kubo SH. Contribution of
Collagen, Elastin, and Smooth Muscle to In Vivo Human Brachial Artery Wall
Stress and Elastic Modulus. Circulation. 1996;94: 3263–3270.
doi:10.1161/01.cir.94.12.3263
124. Cox RH. Passive mechanics and connective tissue composition of canine arteries.
Am J Physiol. 1978;234: H533–H541.
125. Roach MR, Burton AC. The reason for the shape of the distensibility curves of
arteries. Can J Biochem Physiol. 1957/08/01. 1957;35: 681–690. doi:10.1139/o57-
080
126. Konig G, McAllister TN, Dusserre N, Garrido SA, Iyican C, Marini A, et al.
Mechanical properties of completely autologous human tissue engineered blood
vessels compared to human saphenous vein and mammary artery. Biomaterials.
THE BOULEVARD, LANGFORD LANE, KIDLINGTON, OXFORD OX5 1GB,
OXON, ENGLAND: ELSEVIER SCI LTD; 2009;30: 1542–1550.
doi:10.1016/j.biomaterials.2008.11.011
127. Chamiot-Clerc P, Copie X, Renaud J-F, Safar M, Girerd X. Comparative reactivity
187
and mechanical properties of human isolated internal mammary and radial arteries.
Cardiovasc Res. 1998;37: 811–819. doi:10.1016/S0008-6363(97)00267-8
128. Zambanini A, Cunningham SL, Parker KH, Khir AW, Thom SAM, Hughes AD.
Wave-energy patterns in carotid, brachial, and radial arteries: a noninvasive
approach using wave-intensity analysis. Am J Physiol Circ Physiol. 2005;289:
H270–H276.
129. Canham PB, Finlay HM, Boughner DR. Contrasting structure of the saphenous vein
and internal mammary artery used as coronary bypass vessels. Cardiovasc Res.
1997/06/01. 1997;34: 557–567. doi:10.1016/S0008-6363(97)00056-4
130. Dobrin PB, Schwarcz TH, Mrkvicka R. Longitudinal retractive force in pressurized
dog and human arteries. J Surg Res. 1990;48: 116–120.
131. Stick C, Hiedl U, Witzleb E. Venous pressure in the saphenous vein near the ankle
during changes in posture and exercise at different ambient temperatures. Eur J Appl
Physiol Occup Physiol. 1993/01/01. 1993;66: 434–438.
132. Khonsari S, Sintek C, Ardehali A. Cardiac Surgery: Safeguards and Pitfalls in
Operative Technique. Wolters Kluwer Health/Lippincott Williams & Wilkins; 2008.
133. Benedetto U, Codispoti M. Age cutoff for the loss of survival benefit from use of
radial artery in coronary artery bypass grafting. J Thorac Cardiovasc Surg.
2013/09/17. 2013;146: 1075–1078. doi:10.1016/j.jtcvs.2013.07.025
134. Effler DB, Favaloro RG, Groves LK. Coronary artery surgery utilizing saphenous
vein graft techniques. Clinical experience with 224 operations. J Thorac Cardiovasc
Surg. 1970;59: 147.
135. Cheng A, Slaughter MS. How I choose conduits and configure grafts for my

188
patients-rationales and practices. Ann Cardiothorac Surg. 2013;2: 527–532.
doi:10.3978/j.issn.2225-319X.2013.07.17
136. Van Loon P. Length-force and volume-pressure relationships of arteries.
Biorheology. 1976;14: 181–201.
137. Eberth JF, Taucer AI, Wilson E, Humphrey JD. Mechanics of carotid arteries in a
mouse model of Marfan Syndrome. Ann Biomed Eng. 2009/04/08. 2009;37: 1093–
1104. doi:10.1007/s10439-009-9686-1
138. Zhou B, Wolf L, Rachev A, Shazly T. A structure-motivated model of the passive
mechanical response of the primary porcine renal artery. J Mech Med Biol. World
Scientific Publishing Co.; 2013;14: 1450033. doi:10.1142/S021951941450033X
139. Zhou B, Wolf L, Rachev A, Shazly T. A structure-motivated model of the passive
mechanical response of the primary porcine renal artery. J Mech Med Biol. 2014;14:
18. doi:10.1142/s021951941450033x
140. Gundiah N, B Ratcliffe M, A Pruitt L. Determination of strain energy function for
arterial elastin: Experiments using histology and mechanical tests. J Biomech.
2007;40: 586–594. doi:10.1016/j.jbiomech.2006.02.004
141. Zulliger M a., Fridez P, Hayashi K, Stergiopulos N. A strain energy function for
arteries accounting for wall composition and structure. J Biomech. 2004;37: 989–
1000. doi:10.1016/j.jbiomech.2003.11.026
142. Bersi MR, Ferruzzi J, Eberth JF, Gleason Jr. RL, Humphrey JD. Consistent
Biomechanical Phenotyping of Common Carotid Arteries from Seven Genetic,
Pharmacological, and Surgical Mouse Models. Ann Biomed Eng. Springer US;
2014;42: 1207–1223. doi:10.1007/s10439-014-0988-6

189
143. Zeinali-Davarani S, Choi J, Baek S. On parameter estimation for biaxial mechanical
behavior of arteries. J Biomech. Elsevier; 2009;42: 524–530.
144. Cheng J, Stoilov I, Mecham R, Wagenseil J. A fiber-based constitutive model
predicts changes in amount and organization of matrix proteins with development
and disease in the mouse aorta. Biomech Model Mechanobiol. Springer-Verlag;
2013;12: 497–510. doi:10.1007/s10237-012-0420-9
145. Ferruzzi J, Bersi MR, Humphrey JD. Biomechanical phenotyping of central arteries
in health and disease: Advantages of and methods for murine models. Ann Biomed
Eng. 2013;41. doi:10.1007/s10439-013-0799-1
146. O’Connor WN, Valle S. A combination Verhoeff’s elastic and Masson’s trichrome
stain for routine histology. Stain Technol. 1982/07/01. 1982;57: 207–210.
doi:10.3109/10520298209066710
147. Landini G. Advanced shape analysis with ImageJ. Proceedings of the Second
ImageJ User and Developer Conference. Luxembourg; 2008. pp. 116–121.
Available: http://www.mecourse.com/landinig/software/software.html
148. Parissis H, Ramesh BC, Al-Alao B. Which is the best graft for the right coronary
artery? Asian Cardiovasc Thorac Ann. 2014/03/04. 2014;
doi:10.1177/0218492314523766
149. Raja SG, Haider Z, Ahmad M, Zaman H. Saphenous vein grafts: to use or not to
use? Hear Lung Circ. 2004;13: 150–156. doi:10.1016/j.hlc.2004.03.013
150. Schwann TA, Tranbaugh RF, Dimitrova KR, Engoren MC, Kabour A, Hoffman
DM, et al. Time-varying survival benefit of radial artery versus vein grafting: a
multiinstitutional analysis. Ann Thorac Surg. 2013/12/24. 2014;97: 1328–34;

190
discussion 1334. doi:10.1016/j.athoracsur.2013.09.096
151. Cox JL, Chiasson DA, Gotlieb AI. Stranger in a Strange Land: The Pathogenesis of
Saphenous Vein Graph Stenosis With Emphasis on Structural and Functional
Differences Between Veins and Arteries. Prog Cardiovasc Dis. 1991;34: 45–68.
152. Ballyk PD, Walsh C, Butany J, Ojha M. Compliance mismatch may promote graft–
artery intimal hyperplasia by altering suture-line stresses. J Biomech. 1997;31: 229–
237.
153. Wang C, Guo X, Kassab GS. A new observation on the stress distribution in the
coronary artery wall. J Biomech Eng. 2009;131: 111011.
154. Veselý J, Horný L, Chlup H, Adámek T, Krajíček M, Žitný R. Constitutive modeling
of human saphenous veins at overloading pressures. J Mech Behav Biomed Mater.
2015;45: 101–108. doi:http://dx.doi.org/10.1016/j.jmbbm.2015.01.023
155. Guo X, Kassab GS. Distribution of stress and strain along the porcine aorta and
coronary arterial tree. Am J Physiol Circ Physiol. 2004;286: H2361–H2368.
156. Rachev A, Greenwald SE. Residual strains in conduit arteries. J Biomech. 2003;36:
661–670.
157. Hwang M, Berceli SA, Garbey M, Kim NH, Tran-Son-Tay R. The dynamics of vein
graft remodeling induced by hemodynamic forces: a mathematical model. Biomech
Model Mechanobiol. 2011/06/22. 2012;11: 411–423. doi:10.1007/s10237-011-
0321-3
158. Ramachandra AB, Sankaran S, Humphrey JD, Marsden AL. Computational
simulation of the adaptive capacity of vein grafts in response to increased pressure.
2014;
191
159. Shazly T, Rachev A, Lessner S, Argraves WS, Ferdous J, Zhou B, et al. On the
Uniaxial Ring Test of Tissue Engineered Constructs. Exp Mech. 2015;55: 41–51.
doi:10.1007/s11340-014-9910-2
160. Twal WO, Klatt SC, Harikrishnan K, Gerges E, Cooley MA, Trusk TC, et al.
Cellularized microcarriers as adhesive building blocks for fabrication of tubular
tissue constructs. Ann Biomed Eng. 2013/08/15. 2014;42: 1470–1481.
doi:10.1007/s10439-013-0883-6
161. McFetridge PS, Chaudhuri JB. Design of Vascular Graft Bioreactors. In: Chaudhuri
JB, Al-Rubeai M, editors. Bioreactors for Tissue Engineering: Principles, Design,
and Operation. Netherlands: Springer; 2005. pp. 269–283.
162. Horny L, Adamek T, Gultova E, Zitny R, Vesely J, Chlup H, et al. Correlations
between age, prestrain, diameter and atherosclerosis in the male abdominal aorta. J
Mech Behav Biomed Mater. 2011;4: 2128–2132.
doi:http://dx.doi.org/10.1016/j.jmbbm.2011.07.011
163. Kamenskiy A V, Pipinos II, Dzenis YA, Phillips NY, Desyatova AS, Kitson J, et al.
Effects of age on the physiological and mechanical characteristics of human
femoropopliteal arteries. Acta Biomater. 2015;11: 304–313.
doi:http://dx.doi.org/10.1016/j.actbio.2014.09.050
164. Baek S, Valentín A, Humphrey JD. Biochemomechanics of Cerebral Vasospasm
and its Resolution: II. Constitutive Relations and Model Simulations. Ann Biomed
Eng. Springer US; 2007;35: 1498–1509. doi:10.1007/s10439-007-9322-x
165. Harskamp RE, Lopes RD, Baisden CE, de Winter RJ, Alexander JH. Saphenous
vein graft failure after coronary artery bypass surgery: pathophysiology,

192
management, and future directions. Ann Surg. 2013;257: 824–833.
doi:10.1097/SLA.0b013e318288c38d
166. Owens CD, Gasper WJ, Rahman AS, Conte MS. Vein graft failure. J Vasc Surg.
Elsevier; 2015;61: 203–216. doi:10.1016/j.jvs.2013.08.019
167. Rachev A, Greenwald S, Shazly T. Are geometrical and structural variations along
the length of the aorta governed by a principle of “optimal mechanical operation”?
J Biomech Eng. 2013/06/01. 2013;135: 81006. doi:10.1115/1.4024664
168. Jones EA V, le Noble F, Eichmann A. What determines blood vessel structure?
Genetic prespecification vs. hemodynamics. Physiology. 2006;21: 388–95.
doi:10.1152/physiol.00020.2006
169. Kudo FA, Muto A, Maloney SP, Pimiento JM, Bergaya S, Fitzgerald TN, et al.
Venous Identity Is Lost but Arterial Identity Is Not Gained During Vein Graft
Adaptation. Arterioscler Thromb Vasc Biol. 2007;27: 1562–1571.
doi:10.1161/atvbaha.107.143032
170. Chiu JJ, Chien S. Effects of disturbed flow on vascular endothelium:
pathophysiological basis and clinical perspectives. Physiol Rev. 2011;91: 327–387.
doi:10.1152/physrev.00047.2009
171. Chiu J-J, Usami S, Chien S. Vascular endothelial responses to altered shear stress:
Pathologic implications for atherosclerosis. Ann Med. 2009;41: 19–28.
doi:doi:10.1080/07853890802186921
172. Haga JH, Li YS, Chien S. Molecular basis of the effects of mechanical stretch on
vascular smooth muscle cells. J Biomech. 2007;40: 947–960.
doi:10.1016/j.jbiomech.2006.04.011

193
173. Wilson E, Mai Q, Sudhir K, Weiss RH, Ives HE. Mechanical strain induces growth
of vascular smooth muscle cells via autocrine action of PDGF. J Cell Biol. 1993;123:
741–747. doi:10.1083/jcb.123.3.741
174. Majesky MW. Developmental basis of vascular smooth muscle diversity. Arter
Thromb Vasc Biol. 2007;27: 1248–1258. doi:10.1161/ATVBAHA.107.141069
175. Awgulewitsch A, Majesky MW. Interpreting inflammation: smooth muscle
positional identity and nuclear factor-kappaB signaling. Arter Thromb Vasc Biol.
2013;33: 1113–1115. doi:10.1161/ATVBAHA.113.301407
176. Intengan HD, Schiffrin EL. Vascular Remodeling in Hypertension. Hypertension.
2001;38: 581–587. doi:10.1161/hy09t1.096249
177. Galis ZS, Khatri JJ. Matrix metalloproteinases in vascular remodeling and
atherogenesis: the good, the bad, and the ugly. Circ Res. 2002;90: 251–262.
doi:10.1161/hh0302.105345
178. Tamura K, Chen YE, Lopez-Ilasaca M, Daviet L, Tamura N, Ishigami T, et al.
Molecular mechanism of fibronectin gene activation by cyclic stretch in vascular
smooth muscle cells. J Biol Chem. 2000;275: 34619–34627.
doi:10.1074/jbc.M004421200
179. Feng Y, Yang JH, Huang H, Kennedy SP, Turi TG, Thompson JF, et al.
Transcriptional Profile of Mechanically Induced Genes in Human Vascular Smooth
Muscle Cells. Circ Res. 1999;85: 1118–1123. doi:10.1161/01.res.85.12.1118
180. Sorescu GP, Sykes M, Weiss D, Platt MO, Saha A, Hwang J, et al. Bone
morphogenic protein 4 produced in endothelial cells by oscillatory shear stress
stimulates an inflammatory response. J Biol Chem. 2003;278: 31128–31135.

194
doi:10.1074/jbc.M300703200
181. O’Callaghan CJ, Williams B. Mechanical Strain-Induced Extracellular Matrix
Production by Human Vascular Smooth Muscle Cells : Role of TGF- 1.
Hypertension. 2000;36: 319–324. doi:10.1161/01.hyp.36.3.319
182. Azhar M, Schultz JEJ, Grupp I, Dorn GW, Meneton P, Molin DGM, et al.
Transforming growth factor beta in cardiovascular development and function.
Cytokine Growth Factor Rev. Elsevier; 2003;14: 391–407.
183. Pfaffl MW. A new mathematical model for relative quantification in real-time RT–
PCR. Nucleic Acids Res. Oxford, UK: Oxford University Press; 2001;29: e45–e45.
Available: http://www.ncbi.nlm.nih.gov/pmc/articles/PMC55695/
184. Deglise S, Martin D, Probst H, Saucy F, Hayoz D, Waeber G, et al. Increased
connexin43 expression in human saphenous veins in culture is associated with
intimal hyperplasia. J Vasc Surg. 2005;41: 1043–1052.
doi:10.1016/j.jvs.2005.02.036
185. Voisard R, Ramiz E, Baur R, Gastrock-Balitsch I, Siebeneich H, Frank O, et al.
Pulsed perfusion in a venous human organ culture model with a Windkessel function
(pulsed perfusion venous HOC-model). Med Sci Monit. 2010/10/29. 2010;16:
Cr523-9.
186. Hu Y, Davison F, Zhang Z, Xu Q. Endothelial Replacement and Angiogenesis in
Arteriosclerotic Lesions of Allografts Are Contributed by Circulating Progenitor
Cells. Circulation. 2003;108: 3122 LP-3127.
187. Lindner V. Balloon Denudation of Blood Vessels BT - Methods in Endothelial Cell
Biology. In: Augustin HG, editor. Berlin, Heidelberg: Springer Berlin Heidelberg;

195
2004. pp. 187–195. doi:10.1007/978-3-642-18725-4_18
188. Hu Y, Mayr M, Metzler B, Erdel M, Davison F, Xu Q. Both Donor and Recipient
Origins of Smooth Muscle Cells in Vein Graft Atherosclerotic Lesions. Circ Res.
2002;91: e13 LP-e20.
189. Zhang L, Freedman NJ, Brian L, Peppel K. Graft-Extrinsic Cells Predominate in
Vein Graft Arterialization. Arterioscler Thromb Vasc Biol. 2004;24: 470 LP-476.
190. Leach DF, Nagarkatti M, Nagarkatti P, Cui T. Functional states of resident vascular
stem cells and vascular remodeling. Front Biol (Beijing). 2015;10: 387–397.
doi:10.1007/s11515-015-1375-x
191. Ramachandra AB, Humphrey JD, Marsden AL. Gradual loading ameliorates
maladaptation in computational simulations of vein graft growth and remodelling. J
R Soc Interface. The Royal Society; 2017;14. doi:10.1098/rsif.2016.0995
192. McDonald DA. Blood flow in arteries. 2nd ed. London: Edward Arnold; 1974.
193. Faury G. Function-structure relationship of elastic arteries in evolution: from
microfibrils to elastin and elastic fibres. Pathol Biol. 2001/06/29. 2001;49: 310–325.
doi:S0369-8114(01)00147-X [pii]
194. Mills CJ, Gabe IT, Gault JH, Mason DT, Ross Jr. J, Braunwald E, et al. Blood
velocity and pressure wave-forms in the major arteries in man. Clin Sci. 1970;38:
10P.
195. Wilson E, Sudhir K, Ives HE. Mechanical strain of rat vascular smooth muscle cells
is sensed by specific extracellular matrix/integrin interactions. J Clin Invest.
1995;96: 2364–72. doi:10.1172/JCI118293
196. Helmlinger G, Geiger R V, Schreck S, Nerem RM. Effects of pulsatile flow on
196
cultured vascular endothelial cell morphology. J Biomech Eng. 1991;113: 123–131.
197. Matsumoto T, Okumura E, Miura Y, Sato M. Mechanical and dimensional
adaptation of rabbit carotid artery cultured in vitro. Med Biol Eng Comput. 1999;37:
252–256. doi:10.1007/BF02513295
198. Muluk SC, Vorp DA, Severyn DA, Gleixner S, Johnson PC, Webster MW.
Enhancement of tissue factor expression by vein segments exposed to coronary
arterial hemodynamics. J Vasc Surg. 1998;27: 521–527. doi:10.1016/S0741-
5214(98)70327-1
199. Piola M, Ruiter M, Vismara R, Mastrullo V, Agrifoglio M, Zanobini M, et al. Full
Mimicking of Coronary Hemodynamics for Ex-Vivo Stimulation of Human
Saphenous Veins. Ann Biomed Eng. 2017;45: 884–897. doi:10.1007/s10439-016-
1747-7
200. Stegemann JP, Nerem RM. Phenotype Modulation in Vascular Tissue Engineering
Using Biochemical and Mechanical Stimulation. Ann Biomed Eng. 2003;31: 391–
402. doi:10.1114/1.1558031
201. Yamada KM, Cukierman E. Modeling tissue morphogenesis and cancer in 3D. Cell.
2007;130: 601–10. doi:10.1016/j.cell.2007.08.006
202. Freshney RI. Culture of animal cells: a manual of basic technique and specialized
applications. 6th ed. Hoboken, N.J.: Wiley-Blackwell; 2010.
203. Patel DJ, Defreitas FM, Fry DL. Hydraulic input impedance to aorta and pulmonary
artery in dogs. J Appl Physiol. 1963;18: 134–40.
204. Grant BJ, Paradowski LJ. Characterization of pulmonary arterial input impedance
with lumped parameter models. Am J Physiol. 1987;252: H585–H593.

197
205. Jager GN, Westerhof N, Noordergraaf A. Oscillatory Flow Impedance in Electrical
Analog of Arterial System: Representation of Sleeve Effect and Non-Newtonian
Properties of Blood. Circ Res. 1965;16: 121–133. doi:10.1161/01.RES.16.2.121
206. Newby AC, Zaltsman AB. Molecular mechanisms in intimal hyperplasia. J Pathol.
2000;190: 300–309.
207. Smith JO. Mathematics of the discrete Fourier transform (DFT): with audio
applications. Julius Smith; 2007.
208. Lijnen HR, Silence J, Lemmens G, Frederix L, Collen D. Regulation of gelatinase
activity in mice with targeted inactivation of components of the
plasminogen/plasmin system. Thromb Haemost. Schattauer GmbH; 1998;79: 1171–
1176.
209. Milnor WR. Hemodynamics. 2nd ed. Baltimore: Williams & Wilkins; 1989.
210. Meschia JF, Klaas JP, Brown RD, Brott TG. Evaluation and Management of
Atherosclerotic Carotid Stenosis. Mayo Clin Proc. Mayo Foundation for Medical
Education and Research; 2017;92: 1144–1157. doi:10.1016/j.mayocp.2017.02.020
211. Go AS, Mozaffarian D, Roger VL, Benjamin EJ, Berry JD, Blaha MJ, et al. Heart
Disease and Stroke Statistics—2014 Update: A Report From the American Heart
Association. Circulation. 2014;129: e28–e292.
doi:10.1161/01.cir.0000441139.02102.80
212. Flaherty ML, Kissela B, Khoury JC, Alwell K, Moomaw CJ, Woo D, et al. Carotid
Artery Stenosis as a Cause of Stroke. Neuroepidemiology. 2013;40: 36–41.
doi:10.1159/000341410
213. Fernández-Friera L, Peñalvo JL, Fernández-Ortiz A, Ibañez B, López-Melgar B,

198
Laclaustra M, et al. Prevalence, vascular distribution, and multiterritorial extent of
subclinical atherosclerosis in a middle-aged cohort the PESA (Progression of Early
Subclinical Atherosclerosis) study. Circulation. 2015;131: 2104–2113.
doi:10.1161/CIRCULATIONAHA.114.014310
214. Paini A, Boutouyrie P, Calvet D, Zidi M, Agabiti-Rosei E, Laurent S. Multiaxial
mechanical characteristics of carotid plaque. Stroke. Am Heart Assoc; 2007;38:
117–123.
215. Safar ME, Blacher J, Mourad JJ, London GM. Stiffness of carotid artery wall
material and blood pressure in humans. Stroke. Am Heart Assoc; 2000;31: 782–790.
216. Brott TG, Hobson RW, Howard G, Roubin GS, Clark WM, Brooks W, et al. Stenting
versus endarterectomy for treatment of carotid-artery stenosis. N Engl J Med. Mass
Medical Soc; 2010;363: 11–23.
217. Rolland PH, Mekkaoui C, Vidal V, Berry JL, Moore JE, Moreno M, et al.
Compliance matching stent placement in the carotid artery of the swine promotes
optimal blood flow and attenuates restenosis. Eur J Vasc Endovasc Surg. Elsevier;
2004;28: 431–438.
218. Rolland PH, Charifi A-B, Verrier C, Bodard H, Friggi A, Piquet P, et al.
Hemodynamics and wall mechanics after stent placement in swine iliac arteries:
comparative results from six stent designs. Radiology. Radiological Society of
North America; 1999;213: 229–246.
219. Takamizawa K. Biaxial Contractile Mechanics of Common Carotid Arteries of
Rabbit. J Biomech Eng. 2014;137: 5–7. doi:10.1115/1.4028988
220. Zhou B, Alshareef M, Prim DA, Collins M, Kempner M, Hartstone-Rose A, et al.
199
The perivascular environment along the vertebral artery governs segment-specific
structural and mechanical properties. Acta Biomater. 2016;45: 286–295.
doi:10.1016/j.actbio.2016.09.004
221. Cardamone L, Valentin A, Eberth JF, Humphrey JD. Origin of axial prestretch and
residual stress in arteries. Biomech Model Mechanobiol. 2009/01/06. 2009;8: 431–
446. doi:10.1007/s10237-008-0146-x
222. Holt JP, Rhode EA, Holt WW, Kines H. Geometric similarity of aorta, venae cavae,
and certain of their branches in mammals. Am J Physiol. 1981;241: R100-4.
223. Weinberg PD, Ross Ethier C. Twenty-fold difference in hemodynamic wall shear
stress between murine and human aortas. J Biomech. 2007;40: 1594–8.
doi:10.1016/j.jbiomech.2006.07.020
224. Levine HJ. Editorial - Rest Heart Rate and Life Expectancy. J Am Coll Cardiol.
1997;30: 1104–1106.
225. Cox RH. Comparison of carotid artery mechanics in the rat, rabbit, and dog. Am J
Physiol. 1978;234: H280-8.
226. Gleason RL, Gray SP, Wilson E, Humphrey JD. A multiaxial computer-controlled
organ culture and biomechanical device for mouse carotid arteries. J Biomech Eng.
2005/03/31. 2004;126: 787–795.
227. Zhou B, Prim DA, Romito EJ, McNamara LP, Spinale FG, Shazly T, et al.
Contractile Smooth Muscle and Active Stress Generation in Porcine Common
Carotids. J Biomech Eng. American Society of Mechanical Engineers; 2017;140:
14501. doi:10.1115/1.4037949
228. Hu J-J, Baek S, Humphrey JD. Stress–strain behavior of the passive basilar artery

200
in normotension and hypertension. J Biomech. Elsevier; 2007;40: 2559–2563.
229. Weizsäcker HW, Lambert H, Pascale K. Analysis of the passive mechanical
properties of rat carotid arteries. J Biomech. 1983;16: 703–715.
doi:https://doi.org/10.1016/0021-9290(83)90080-5
230. Takamizawa K. Biaxial Contractile Mechanics of Common Carotid Arteries of
Rabbit. J Biomech Eng. 2015;137: 31010. doi:10.1115/1.4028988
231. Kohn JC, Lampi MC, Reinhart-King CA. Age-related vascular stiffening: Causes
and consequences. Front Genet. 2015;6: 1–17. doi:10.3389/fgene.2015.00112
232. von Maltzahn WW, Warriyar RG, Keitzer WF. Experimental measurements of
elastic properties of media and adventitia of bovine carotid arteries. J Biomech.
1984;17: 839–847. doi:https://doi.org/10.1016/0021-9290(84)90142-8
233. Blondel WCPM, Didelon J, Maurice G, Carteaux J-P, Xiong Wang, Stolz J-F.
Investigation of 3-D mechanical properties of blood vessels using a new in vitro
tests system: results on sheep common carotid arteries. IEEE Trans Biomed Eng.
2001;48: 442–451. doi:10.1109/10.915710
234. Daugs A, Hutzler B, Meinke M, Schmitz C, Lehmann N, Markhoff A, et al.
Detergent-Based Decellularization of Bovine Carotid Arteries for Vascular Tissue
Engineering. Ann Biomed Eng. Springer; 2017;45: 2683–2692.
235. Schmidt CE, Baier JM. Acellular vascular tissues: natural biomaterials for tissue
repair and tissue engineering. Biomaterials. 2000;21: 2215–2231.
doi:https://doi.org/10.1016/S0142-9612(00)00148-4
236. Sommer G, Holzapfel GA. 3D constitutive modeling of the biaxial mechanical
response of intact and layer-dissected human carotid arteries. J Mech Behav Biomed

201
Mater. Elsevier Ltd; 2012;5: 116–128. doi:10.1016/j.jmbbm.2011.08.013
237. Masson I, Boutouyrie P, Laurent S, Humphrey JD, Zidi M. Characterization of
arterial wall mechanical behavior and stresses from human clinical data. J Biomech.
2008;41: 2618–2627. doi:10.1016/j.jbiomech.2008.06.022
238. von Maltzahn W-W, Besdo D, Wiemer W. Elastic properties of arteries: A nonlinear
two-layer cylindrical model. J Biomech. 1981;14: 389–397. doi:10.1016/0021-
9290(81)90056-7
239. Wolinsky H, Glagov S. A Lamellar Unit of Aortic Medial Structure and Function in
Mammals. Circ Res. 1967;20: 99 LP-111.
240. West GB, Brown JH, Enquist BJ. A general model for the origin of allometric
scaling laws in biology. Science (80- ). American Association for the Advancement
of Science; 1997;276: 122–126.
241. Fung YC. The mechanical properties of living tissues. New York:Springer–Verlag.
Springer New York; 1993.
242. Benrashid E, McCoy CC, Youngwirth LM, Kim J, Manson RJ, Otto JC, et al. Tissue
engineered vascular grafts: Origins, development, and current strategies for clinical
application. METHODS. 525 B ST, STE 1900, SAN DIEGO, CA 92101-4495 USA:
ACADEMIC PRESS INC ELSEVIER SCIENCE; 2016;99: 13–19.
doi:10.1016/j.ymeth.2015.07.014
243. Dahl SLM, Koh J, Prabhakar V, Niklason LE. Decellularized native and engineered
arterial scaffolds for transplantation. Cell Transplant. 2003;12: 659–666.
doi:10.3727/000000003108747136
244. Lawson J, Dahl S, Prichard H, Manson R, Gage S, Kypson A, et al. VS5 Human
202
Tissue-Engineered Grafts for Hemodialysis: Development, Preclinical Data, and
Early Investigational Human Implant Experience. J Vasc Surg. 2014;59: 32S–33S.
doi:http://dx.doi.org/10.1016/j.jvs.2014.03.077
245. Niklason LE, Gao J, Abbott WM, Hirschi KK, Houser S, Marini R, et al. Functional
Arteries Grown in Vitro. Science (80- ). American Association for the Advancement
of Science; 1999;284: 489–493. doi:10.1126/science.284.5413.489
246. Sheridan WS, Duffy GP, Murphy BP. Mechanical characterization of a customized
decellularized scaffold for vascular tissue engineering. J Mech Behav Biomed
Mater. 2012;8: 58–70. doi:10.1016/j.jmbbm.2011.12.003
247. Dolan EB, Gunning GM, Davis TA, Cooney G, Eufrasio T, Murphy BP. The
development and mechanical characterisation of a novel reinforced venous conduit
that mimics the mechanical properties of an arterial wall. J Mech Behav Biomed
Mater. PO BOX 211, 1000 AE AMSTERDAM, NETHERLANDS: ELSEVIER
SCIENCE BV; 2017;71: 23–31. doi:10.1016/j.jmbbm.2017.02.012
248. de Vries MR, Simons KH, Jukema JW, Braun J, Quax PHA. Vein graft failure: from
pathophysiology to clinical outcomes. Nat Rev Cardiol. 2016;13: 451–470.
doi:10.1038/nrcardio.2016.76
249. Shuhaiber JH, Evans AN, Massad MG, Geha AS. Mechanisms and future directions
for prevention of vein graft failure in coronary bypass surgery. Eur J Cardiothorac
Surg. 2002/09/03. 2002;22: 387–396.
250. Gooch KJ, Firstenberg MS, Shrefler BS, Scandling BW. Biomechanics and
Mechanobiology of Saphenous Vein Grafts. J Biomech Eng. American Society of
Mechanical Engineers; 2018;140: 20804. doi:10.1115/1.4038705

203
251. Kassab GS, Navia JA. Biomechanical considerations in the design of graft: the
homeostasis hypothesis. Annu Rev Biomed Eng. 2006/07/13. 2006;8: 499–535.
doi:10.1146/annurev.bioeng.8.010506.105023
252. Sodek J, Ferrier JM. Collagen remodelling in rat periodontal tissues: compensation
for precursor reutilization confirms rapid turnover of collagen. Coll Relat Res.
Elsevier; 1988;8: 11–21.
253. McAnulty RJ, Laurent GJ. Collagen synthesis and degradation in vivo. Evidence for
rapid rates of collagen turnover with extensive degradation of newly synthesized
collagen in tissues of the adult rat. Coll Relat Res. Elsevier; 1987;7: 93–104.
254. Langleben D, Szarek JL, Coflesky JT, Jones RC, Reid LM, Evans JN. Altered artery
mechanics and structure in monocrotaline pulmonary hypertension. J Appl Physiol.
Am Physiological Soc; 1988;65: 2326–2331.
255. Cyron CJ, Humphrey JD. Growth and remodeling of load-bearing biological soft
tissues. Meccanica. Springer Netherlands; 2017;52: 645–664. doi:10.1007/s11012-
016-0472-5
256. Sakaguchi K, Shimizu T, Horaguchi S, Sekine H, Yamato M, Umezu M, et al. In
Vitro Engineering of Vascularized Tissue Surrogates. Sci Rep. Nature Publishing
Group; 2013;3: 1316. doi:10.1038/srep01316
257. Jeong SI, Kwon JH, Lim JI, Cho SW, Jung Y, Sung WJ, et al. Mechano-active tissue
engineering of vascular smooth muscle using pulsatile perfusion bioreactors and
elastic PLCL scaffolds. Biomaterials. 2005;26: 1405–1411.
doi:10.1016/j.biomaterials.2004.04.036

204
258. Huang AH, Niklason LE. Engineering of arteries in vitro. Cell Mol Life Sci.
2014;71: 2103–2118. doi:10.1007/s00018-013-1546-3

205
APPENDIX A
JOURNAL PERMISSION FOR USE OF MANUSCRIPT
Figure A.1 – Permission from Journal of Mechanical Behavior of Biomedical Materials to include published manuscript in this dissertation (Chapter 2).