associating the mesoscale fiber organization of the tongue ...associating the mesoscale fiber...
TRANSCRIPT

ARTICLE IN PRESS
0021-9290/$ - se
doi:10.1016/j.jb
�CorrespondMassachusetts
bridge, MA 021
E-mail addr
Journal of Biomechanics 41 (2008) 1782–1789
www.elsevier.com/locate/jbiomech
www.JBiomech.com
Associating the mesoscale fiber organization of the tongue with localstrain rate during swallowing
Samuel M. Feltona,b, Terry A. Gaigea,b, Thomas Bennera,b, Ruopeng Wanga,b, TimothyG. Reesea,b, Van J. Wedeena,b, Richard J. Gilberta,b,�
aDepartment of Mechanical Engineering, Massachusetts Institute of Technology, 77 Massachusetts Avenue, Cambridge, MA 02139, USAbAthinoula A. Martinos Center for Biomedical Imaging, Massachusetts General Hospital, Charlestown, MA, USA
Accepted 17 January 2008
Abstract
The tongue is an intricately configured muscular organ that undergoes a stereotypical set of deformations during the course of normal
human swallowing. In order to demonstrate quantitatively the relationship between 3D aligned lingual fiber organization and mechanics
during swallowing, the tissue’s myoarchitecture and strain rate were imaged before and during the propulsive phase of a 3.0ml water
bolus swallow. Mesoscale fiber organization was imaged with high-resolution diffusion tensor imaging (DTI) and multi-voxel myofiber
tracts generated along maximum diffusion vectors. Tissue compression/expansion was obtained via lingual pressure-gated phase-contrast
(PC) MRI, a method which determines local strain rate as a function of the phase shift occurring along an applied gradient vector. The
co-alignment of myofiber tract direction and the localized principal strain rate vectors was obtained by translating the strain rate tensor
into the reference frame with the primary axis parallel to the maximum diffusion vector using Mohr’s circle, resulting in the generation of
fiber-aligned strain rate (FASR). DTI tractography displayed the complete fiber anatomy of the tongue, consisting of a core region of
orthogonally aligned fibers encased within a longitudinal sheath, which merge with the externally connected styloglossus, hyoglossus, and
genioglossus fibers. FASR images obtained in the mid-sagittal plane demonstrated that bolus propulsion was associated with prominent
compressive strain aligned with the genioglossus muscle combined with expansive strain aligned with the verticalis and geniohyoid
muscles. These data demonstrate that lingual deformation during swallowing involves complex interactions involving intrinsic and
extrinsic muscles, whose contractility is directed by the alignment of mesoscale fiber tracts.
r 2008 Published by Elsevier Ltd.
Keywords: MRI; Phase contrast; DTI; Tractography; Muscle imaging; Strain
1. Introduction
Associating microscopic fiber organization with tissuedeformation is a challenging task in tissues where theconstituting myofibers express complex geometries. Themammalian tongue is an apt model for such studies since itsmyoarchitecture is comprised by an intricate 3D network ofintrinsic and extrinsic muscles (Sonntag, 1925; Wedeenet al., 2001; Napadow et al., 2001) (Fig. 1). Lingual intrinsicmusculature consists of a core region of orthogonally
e front matter r 2008 Published by Elsevier Ltd.
iomech.2008.01.030
ing author at: Department of Mechanical Engineering,
Institute of Technology, 77 Massachusetts Avenue, Cam-
39, USA. Tel.: +1 617 620 2032; fax: +1781 622 5090.
ess: [email protected] (R.J. Gilbert).
aligned fibers, contained within a sheath-like tract oflongitudinally oriented fibers. These intrinsic fibers mergewith extrinsic muscles that modify shape and position froma superior (palatoglossus), posterior (styloglossus), andinferior direction (genioglossus and hyoglossus). Duringswallowing, the tongue undergoes a characteristic set ofdeformations, dictated largely by its hydrostatic properties(Smith, 1986; Smith and Kier, 1989; Napadow et al., 1999a,2002; Gilbert et al., 2007), which serve to shape the ingestedbolus (early accommodation), transfer the bolus from theanterior to the posterior oral cavity (late accommodation),and then transfer the configured bolus into the pharynx(propulsion) (Napadow et al., 1999b).NMR methods have been developed depicting mesoscale
representations of 3D fiber organization and mechanics.
ARTICLE IN PRESS
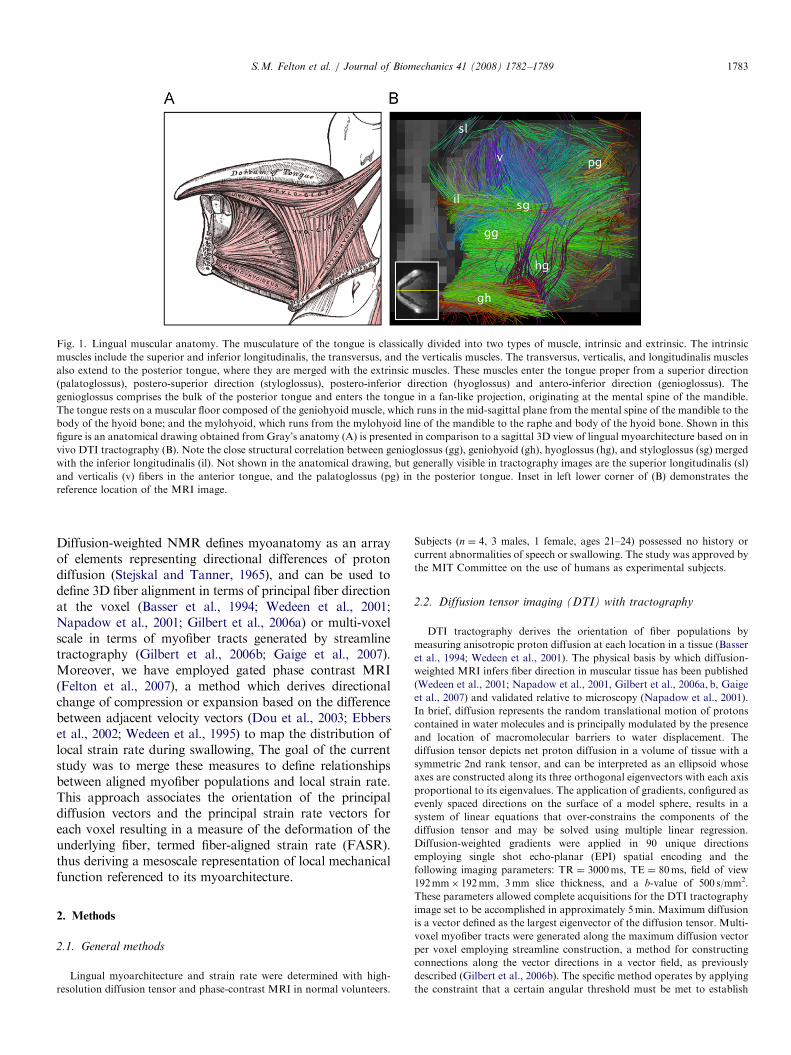
Fig. 1. Lingual muscular anatomy. The musculature of the tongue is classically divided into two types of muscle, intrinsic and extrinsic. The intrinsic
muscles include the superior and inferior longitudinalis, the transversus, and the verticalis muscles. The transversus, verticalis, and longitudinalis muscles
also extend to the posterior tongue, where they are merged with the extrinsic muscles. These muscles enter the tongue proper from a superior direction
(palatoglossus), postero-superior direction (styloglossus), postero-inferior direction (hyoglossus) and antero-inferior direction (genioglossus). The
genioglossus comprises the bulk of the posterior tongue and enters the tongue in a fan-like projection, originating at the mental spine of the mandible.
The tongue rests on a muscular floor composed of the geniohyoid muscle, which runs in the mid-sagittal plane from the mental spine of the mandible to the
body of the hyoid bone; and the mylohyoid, which runs from the mylohyoid line of the mandible to the raphe and body of the hyoid bone. Shown in this
figure is an anatomical drawing obtained from Gray’s anatomy (A) is presented in comparison to a sagittal 3D view of lingual myoarchitecture based on in
vivo DTI tractography (B). Note the close structural correlation between genioglossus (gg), geniohyoid (gh), hyoglossus (hg), and styloglossus (sg) merged
with the inferior longitudinalis (il). Not shown in the anatomical drawing, but generally visible in tractography images are the superior longitudinalis (sl)
and verticalis (v) fibers in the anterior tongue, and the palatoglossus (pg) in the posterior tongue. Inset in left lower corner of (B) demonstrates the
reference location of the MRI image.
S.M. Felton et al. / Journal of Biomechanics 41 (2008) 1782–1789 1783
Diffusion-weighted NMR defines myoanatomy as an arrayof elements representing directional differences of protondiffusion (Stejskal and Tanner, 1965), and can be used todefine 3D fiber alignment in terms of principal fiber directionat the voxel (Basser et al., 1994; Wedeen et al., 2001;Napadow et al., 2001; Gilbert et al., 2006a) or multi-voxelscale in terms of myofiber tracts generated by streamlinetractography (Gilbert et al., 2006b; Gaige et al., 2007).Moreover, we have employed gated phase contrast MRI(Felton et al., 2007), a method which derives directionalchange of compression or expansion based on the differencebetween adjacent velocity vectors (Dou et al., 2003; Ebberset al., 2002; Wedeen et al., 1995) to map the distribution oflocal strain rate during swallowing, The goal of the currentstudy was to merge these measures to define relationshipsbetween aligned myofiber populations and local strain rate.This approach associates the orientation of the principaldiffusion vectors and the principal strain rate vectors foreach voxel resulting in a measure of the deformation of theunderlying fiber, termed fiber-aligned strain rate (FASR).thus deriving a mesoscale representation of local mechanicalfunction referenced to its myoarchitecture.
2. Methods
2.1. General methods
Lingual myoarchitecture and strain rate were determined with high-
resolution diffusion tensor and phase-contrast MRI in normal volunteers.
Subjects (n ¼ 4, 3 males, 1 female, ages 21–24) possessed no history or
current abnormalities of speech or swallowing. The study was approved by
the MIT Committee on the use of humans as experimental subjects.
2.2. Diffusion tensor imaging (DTI) with tractography
DTI tractography derives the orientation of fiber populations by
measuring anisotropic proton diffusion at each location in a tissue (Basser
et al., 1994; Wedeen et al., 2001). The physical basis by which diffusion-
weighted MRI infers fiber direction in muscular tissue has been published
(Wedeen et al., 2001; Napadow et al., 2001, Gilbert et al., 2006a, b, Gaige
et al., 2007) and validated relative to microscopy (Napadow et al., 2001).
In brief, diffusion represents the random translational motion of protons
contained in water molecules and is principally modulated by the presence
and location of macromolecular barriers to water displacement. The
diffusion tensor depicts net proton diffusion in a volume of tissue with a
symmetric 2nd rank tensor, and can be interpreted as an ellipsoid whose
axes are constructed along its three orthogonal eigenvectors with each axis
proportional to its eigenvalues. The application of gradients, configured as
evenly spaced directions on the surface of a model sphere, results in a
system of linear equations that over-constrains the components of the
diffusion tensor and may be solved using multiple linear regression.
Diffusion-weighted gradients were applied in 90 unique directions
employing single shot echo-planar (EPI) spatial encoding and the
following imaging parameters: TR ¼ 3000ms, TE ¼ 80ms, field of view
192mm� 192mm, 3mm slice thickness, and a b-value of 500 s/mm2.
These parameters allowed complete acquisitions for the DTI tractography
image set to be accomplished in approximately 5min. Maximum diffusion
is a vector defined as the largest eigenvector of the diffusion tensor. Multi-
voxel myofiber tracts were generated along the maximum diffusion vector
per voxel employing streamline construction, a method for constructing
connections along the vector directions in a vector field, as previously
described (Gilbert et al., 2006b). The specific method operates by applying
the constraint that a certain angular threshold must be met to establish

ARTICLE IN PRESSS.M. Felton et al. / Journal of Biomechanics 41 (2008) 1782–17891784
intervoxel connectivity, and thus constitute the myofiber tract. In the
current work, if the angular difference between a given streamline and the
maximum diffusion vector of an adjacent voxel is less than 7351,
intervoxel myofiber tract continuity is established.
2.3. Phase-contrast MRI (PC MRI)
The general methods for deriving strain rate from PC MRI have been
previously published and validated (Felton et al., 2007; Dou et al., 2003;
Ebbers et al., 2002; Wedeen et al., 1995). PC MRI determines the local
(single voxel) velocity function by applying a phase gradient followed by a
canceling (decoding) phase gradient, then deriving local motion by the
phase shift exhibited by the resulting MR images along the gradient
vector. During PC MRI, velocity encoding is applied in four quadrilateral
directions: (x, y, z), (�x,�y, z), (x,�y,�z), (�x, y,�z) and strain rate
determined by the difference in velocities between adjacent voxels. Strains
can be linearly approximated by the strain tensor, given by a 3� 3 matrix.
Individual PC images were determined to have a signal-to-noise ratio
(SNR) of 48.5. Specific imaging parameters included: echo time 54ms,
repetition time 274ms, and VENC 0.67 cm/s/cycle. One acquisition was
performed in each slice per swallow. Data was acquired using two custom-
built surface coils, approximately 150mm2 in area, placed on each cheek
and secured to the skin with adhesive tape. Lagrangian strain was
calculated with an unsupervised and objective algorithm developed in
Mathematica. Strain rate was calculated by
q�ap
qt¼ðqa=qpÞVENC
L�ap ¼
qua
qp(1)
where L is the voxel length, VENC is the velocity encoding number, p
represents any principal vector x, y, or z, and ua is the material
displacement along vector a. The relation between the four equilateral
gradient vectors, a, b, c, and d, and the two principal vectors, x and y, are
represented by
q�xp
qt¼
q�ap
qt�
q�bp
qtþ
q�cp
qt�
q�dp
qt
� � ffiffiffi3p
4(2)
q�yp
qt¼
q�ap
qt�
q�bp
qtþ
q�cp
qt�
q�dp
qt
� � ffiffiffi3p
4(3)
The orthogonal dimensions are then translated into principal strain
vectors with no shear strain. In order to represent the local strain rate
tensor for each voxel, the principal strain rates for the tissue contained in
each voxel were rendered as 2D icons. For this study, strain rate was
represented graphically using rhombi with their long dimension parallel to
a strain rate eigenvector and the length proportional to its magnitude. The
width of each rhombus was arbitrarily set proportional to the length for
the purpose of visualization. For each voxel, two orthogonally aligned
rhombi were generated representing the strain rate tensor eigenvectors, or
principal strain rate vectors, of that voxel. A blue rhombus indicates a
positive principal strain rate, consistent with expansion, and a red
rhombus indicates a negative principal strain rate, consistent with
compression. Each rhombus was overlayed in the correct position on
the magnitude images of the tongue during the propulsive image sequence.
Fig. 2. Derivation of fiber-aligned strain rate (FASR). FASR is defined as
the axial strain rate within the reference plane parallel to the maximum
diffusion vector. First, the strain rate tensor is measured within the x–y
reference plane. qexx/qt and eyy/qt are the axial strain rates along the x and
y axes, and qexy/qt is the shear strain rate. It is then transformed via
Mohr’s circle onto the diffusion-parallel reference plane, and the resulting
axial strain rate parallel to the maximum diffusion vector is identified as
the FASR. qey0y0/qt is the other axial strain rate in that reference plane,
perpendicular to the maximum diffusion vector, and qex0y0/qt is the
accompanying shear strain rate. FASR is a vector with units s�1.
2.4. Geometric relationship between aligned strain rate and
myofiber tract orientation
An objective algorithm was applied to determine FASR. Each voxel
contains one maximum diffusion vector and one strain rate tensor. The
strain rate tensor is transformed onto the reference plane with x-axis
parallel to the diffusion vector.
ffFASR ¼ ffbd ¼ yd (4)
FASR�� �� ¼ q�x0x0
qt¼ðq�xx=qtÞ þ ðq�yy=qtÞ
2
þ cosð2yd Þðq�xx=qtÞ � ðq�yy=qtÞ
2
þ sinð2yd Þðq�xy=qtÞ � ðq�yx=qtÞ
2(5)
FASR is so defined as a local vector with units per second, parallel to its
associated diffusion vector, and with magnitude equal to the axial strain
rate of the parallel axis within that reference frame (Fig. 2). Fibers are
portrayed as red (those exhibiting principal compression) or blue (those
exhibiting principal expansion) with hue proportional to the magnitude of
the local FASR. Mean FASR was determined for four separate subjects.
The data represent the average of approximately 20 data sets at six time
points (480 swallows), and were graphed for the most prominent mid-line
structures, the fan-like projecting fibers of the genioglossus throughout the
body of the tongue and the vertically projecting fibers of the verticalis in
the anterior tongue. Statistical comparisons were made employing the
student’s t-test of the mean FASR patterns existing in each anatomical
region at each time point. Error bars were determined by propagating the
deviation of 1D phase-contrast data (Appendix A).
2.5. Experimental protocol
DTI tractography and PC MRI were obtained in the same subjects in
separate imaging sessions employing the techniques described above. Data
was acquired using a 1.5T. Siemens Avanto whole-body scanner equipped
with two custom-built surface coils, approximately 150mm2 in area,
placed on each cheek and gently secured with tape. For the acquisition of
phase-contrast data, subjects administered 3ml of water to themselves via
a tube connected to a water bladder via a 3ml syringe. Four swallows were
measured for a complete data set, and each time point comprised five
averaged data sets. Six time points (0, 100, 200, 300, 400, and 500ms after
gating) were sampled, for a total of 120 swallows. The temporal sequence
of phase-contrast data relative to specific time points within the swallow
was obtained through the use of lingual pressure gated system, which has
been previously validated (Felton et al., 2007). At the onset of the
propulsive phase of swallowing, the tip of the tongue involuntarily applies
pressure to the hard palate (Nicosia and Robbins, 2001), which is

ARTICLE IN PRESSS.M. Felton et al. / Journal of Biomechanics 41 (2008) 1782–1789 1785
measured with a bulb sensor (Iowa Oral Performance Instrument, Blaise
Medical) (Lazarus et al., 2000). The peak pressure resulting from tongue
pressure against the bulb was recorded and a 5V output signal triggered
when a threshold pressure (approximately 0.35PSI) was achieved. Time
points indicated in this manuscript indicate the temporal position in the
swallow following the application of the pressure driven trigger pulse.
3. Results
DTI tractography images were generated by determiningthe maximum diffusion vector per voxel in the mid-sagittalthen connecting these vectors based on angular similarity(o351). Fig. 3 displays the tongue at rest in the absence ofdiffusion weighting (A), as a 3D DTI tractography image(B), and as a 2D rendering of the mid-sagittal componentof (B) with a water bolus present. Voxel scale strain ratewas determined during swallowing by phase contrast MRIand represented in Lagrangian units of s�1 for six timepoints, each image representing sampling over 80msoverlaid on the corresponding averaged magnitude images(Fig. 4). The initial application of the tongue to the hardpalate (A) is associated with an oblique compressionradiating from the bolus to the lower left and lower right,consistent with compression of the palatoglossus andverticalis, along with expansion oriented in the superiorand posterior directions, consistent with orthogonalexpansion of the palatoglossus tissue or retraction inducedby posterior compression of the styloglossus. A prominentoblique compression was observed (consistent with con-traction of the genioglossus) at 300ms (D) and 400ms (E)with commensurate orthogonal expansion. At 500ms (F),the tongue exhibited prominent expansion in the distribu-tions of the genioglossus, hyoglossus, and the verticalis,coinciding pharyngeal bolus delivery.
To display voxel strain rate tensors in a multi-voxelformat, tractography was applied to the principal strainrate vectors resulting in the creation of strain rate tracts,which were then overlaid on their corresponding magni-
Fig. 3. DTI tractography of the human tongue. DTI tractography images wer
associating these vectors on the basis of angular similarity. Depicted are a sagi
(A), 3D DTI tractography image of the tongue without the bolus present (B), a
component (6mm thick, two slices) of the set of maximum diffusion vectors. Th
strain rate tensor for each subject in this manuscript. These images display prin
an anterior-to–posterior fan-like structure (genioglossus, gg) and a set of fibers
longitudinally aligned tracts, blue indicates vertically aligned tracts, and red i
asterisk represents the approximate location of the water bolus in (C).
tude images at the same six time points depicted in Fig. 5.At 0ms (A) strain rate tracts extend from the bolusobliquely to the anterior of the tongue, and inferior, alongthe general path of the verticalis and palatoglossus,respectively. In addition, there are orthogonal expansiontracts throughout the tongue. Notably, at 300ms (D),obliquely aligned strain rate tracts originate in the anterior-inferior portion of the tongue where the mandibularattachment of the genioglossus is located, and fan out inthe posterior and superior directions. There are additionalcompressive tracts consistent with geniohyoid (anteriorinferior, obliquely aligned), the hyoglossus (posteriorinferior, obliquely aligned) and palatoglossus (posteriorsuperior, vertically aligned). Compressive tracts alignedwith the genioglossus, geniohyoid, and hyoglossus wereobserved at 400ms (E), including those aligned with thegenioglossus, geniohyoid, and hyoglossus. The imageobtained at 500ms (F) shows generalized expansive tractbehavior through most of the tongue body.Fig. 6 displays an arbitrary voxel studied through the
process of combining DTI and PC MRI data to calculateFASR, whereas FASR is displayed in Fig. 7 for a singlesubject during a swallow. The fibers are portrayed as red(compression) or blue (expansion) with hue proportional tomagnitude. At 0ms (A), compression can be seen in tractsconsistent with the verticalis and the palatoglossus, as wellas radially aligned expansion. The images obtained at 100(B) and 200 (C) ms show similar strain rate events, but inslowly decreasing magnitude. At 300ms (D) compressionin the apparent distribution of the genioglossus andpalatoglossus occurs along with expansion in the distribu-tion of the geniohyoid and verticalis. And 400ms (E)additionally demonstrates bulk longitudinal shortening ofthe tongue with initial bolus exposure to the pharynx. Also500ms (F) shows expansion throughout the tracts, alongwith isolated voxels of compression in the verticalis and thegenioglossus. Mean FASR was determined for the fan-like
e generated by determining the maximum diffusion vector per voxel then
ttal view of the human tongue at rest in the absence of diffusion weighting
nd a 2D rendering (C) of the 3D data set obtained by deriving the sagittal
e latter represents the explicit structural template used for relating the local
cipally a vertically aligned set of fibers in the anterior tongue (verticalis, v),
connecting the mandible and the hyoid (geniohyoid, gh). Green indicates
ndicates transversely aligned tracts (not shown in the current figure). The

ARTICLE IN PRESS
Fig. 4. Strain rate patterns exhibited by the tongue during bolus propulsion. Strain rate tensors were derived in a sagittal image slice using PC MRI for a
set of voxels comprising the tongue during the propulsive phase of a 3.0ml water bolus swallow. Each image was compiled by averaging two simultaneous
slices, comprising five sets of strain rate data each, acquired from 20 swallows total. Principal strain rates within each voxel are shown graphically as
rhombi with a long axis parallel to the principal strain rate vector, length and hue proportional to the magnitude of the strain rate, and color indicating
expansion (blue) or compression (red). For each voxel, two orthogonally aligned rhombi are representative for the primary and secondary strain rate.
Shown in this figure is a sequence of six images obtained from a single subject at (A) 0, (B) 100, (C) 200, (D) 300, (E) 400, and (F) 500ms from the
application of the gating pulse. The most prominent events included an obliquely aligned compression (consistent with genioglossus contraction) and
orthogonal expansion at approximately 300 and 400ms followed by expansion in the distributions of the genioglossus, hyoglossus, and the verticalis,
coinciding with the deformative pattern occurring during bolus displacement to the oropharynx. The strain rate icon displayed for scale in the lower left of
each image represents 0.33 s�1. The asterisk represents the approximate location of the water bolus at the indicated time point. The designation b shown in
(A) indicates the position of the pressure-sensing bulb. The lower left image is a T1-weighted MRI image, and indicates the region of the head included in
the phase contrast measurement.
Fig. 5. Strain rate tractography of the tongue during bolus propulsion. Strain rate tensors were derived in a sagittal image slice using PC MRI for a set of
voxels comprising the tongue during 3.0 water bolus swallows as described in the legend for Fig. 3. Adjacent and similarly aligned (angle difference less
than 351) principal strain rate vectors were associated via tractography, representing a mesoscale rending of the mechanical events occurring within the
tongue during the indicated phase of swallowing. The asterisk represents the approximate location of the water bolus at the indicated time point.
S.M. Felton et al. / Journal of Biomechanics 41 (2008) 1782–17891786

ARTICLE IN PRESS
Fig. 6. Demonstration of fiber-aligned strain rate (FASR) for a single voxel. FASR was derived from the relationship between the principal diffusion and
strain rate tracts, and displayed in the case of an individual voxel: (A) maximum diffusion vectors of the two-midsagittal slices derived from DTI, (B)
display of the same voxel following the application of tractography, (C) strain rate tensor defining two orthogonal principal strain rate vectors, (D)
generation of FASR vectors based on the axial strain rate parallel to the maximum diffusion vector within the reference plane with primary axis parallel to
the diffusion vector, and (E) tractography rendering of the FASR.
Fig. 7. Fiber-aligned strain rate (FASR) within the human tongue during propulsion. FASR representation of the local mechanical events occurring
within the mid-sagittal plane of the tongue during water bolus swallows for single subject as described in the legend for Fig. 3. The hue of these tracts
represents the magnitude of the co-located strain rate tensors and their alignment with the diffusion vectors. Each image was compiled by averaging two
simultaneous slices, comprising five sets of strain rate data each, acquired from 20 swallows total. We demonstrate significant compression in the
distribution of the genioglossus and expansion in the distribution of the geniohyoid and verticalis at 300ms followed by prominent expansions throughout
the tissue leading to net reconfiguration of the tongue during bolus delivery. The asterisk represents the approximate location of the water bolus at the
indicated time point.
S.M. Felton et al. / Journal of Biomechanics 41 (2008) 1782–1789 1787
projecting fibers consistent with the genioglossus and thevertically projecting fibers consistent with the verticalis anddepicted in Fig. 8. A distinct pattern was demonstratedwhereby initial expansion of the genioglossus (approxi-mately 0.09 s�1) converted significantly (po0.05) to com-pression (approximately �0.13 s�1) maximally at 300ms,and initial compression of the verticalis (approximately�0.09 s�1) converted to prominent expansion (approxi-mately 0.07 s�1) maximally at 400ms. This time pointcoincided with initial displacement posterior of the bolusand opening of the oropharynx.
4. Discussion
Resolving the structural underpinnings of local deforma-tion requires a method to quantitatively associate 3D fiberorientation with the local strain rate function. We havepreviously employed diffusion-weighted MRI methods,which define fiber organization as an array of elementsrepresenting directional differences of molecular displace-ment (Wedeen et al., 2001; Napadow et al., 2001; Gilbertet al., 2006a; Gaige et al., 2007), to image lingualmyoarchitecture. The association of diffusion derived vector

ARTICLE IN PRESS
Fig. 8. Region-specific FASR within the tongue during liquid bolus propulsion. The average FASR within the fiber groups consistent with the superior
genioglossus (A) and the verticalis (B) were graphed over the six time points during the water bolus swallow. Each data point represents the combined
FASR data obtained from each voxel in the region at each time point, and is comprised of five complete data sets from each of four subjects (total of 20
complete data sets). The fibers consistent with the genioglossus display maximum expansion at 0ms varying to maximum compression 300ms, whereas the
fiber consistent with the verticalis display maximum compression at 0ms and reach a maximum expansion at 400ms.
S.M. Felton et al. / Journal of Biomechanics 41 (2008) 1782–17891788
fields with similar alignment from voxel to voxel was used toderive a multi-voxel, fiber-like construct hypothesized tocomprise a structural template for fiber shortening (Gilbertet al., 2006b). In order to resolve the spatially and temporallycomplex mechanical events occurring during human swal-lowing, we adapted PC MRI methods (Dou et al., 2003;Ebbers et al., 2002; Wedeen et al., 1995) to derive strain ratefor the deforming tongue (Felton et al., 2007). These resultsdemonstrated that the propulsive phase of swallowinginvolves a stereotypical set of compressive and expansivestrain rate events resulting from contractions of the intrinsicand extrinsic muscle fibers. We propose herein a method,which relates the direction and magnitude of the diffusionweighted and phase-contrast vectors to yield a metric, termedFASR, in which strain rate parallel to the underlyingdiffusion vector is obtained. The FASR vector representsthe elongation or shortening of the underlying fiber. FASRmay indicate either active strain, that deformation which iscaused by contraction (or relaxation) of the co-aligned fibers,or passive strain, which is caused by external forces acting onthe local tissue.
The current results allow us to extend previous conceptsof lingual mechanical function during swallowing bydelineating the contribution of specific myofiber tracts.The FASR data reveals that bolus formation and propul-sion is the result of synchronized contraction amongseveral lingual fiber populations, notably: (1) Formationof the bolus occurs within the first 200ms after the gatingpulse, and is associated with compression of the verticalisand palatoglossus and expansion in the distribution of thegenioglossus. (2) The bolus is displaced to the pharynx at300–400ms after the gating pulse due to compression inthe distribution of the genioglossus along with expansion inthe verticalis and palatoglossus. (3) At 500ms, there isexpansion along all fiber tracts, with isolated voxels ofcompression, indicative of the passing of the bolus and re-establishment of a relaxed state. These results confirm the
relevance of synergies involving intrinsic and extrinsicmuscles in the generation of physiological deformationsduring bolus propulsion (Napadow et al., 1999b, 2002).Such muscular synergy may have functional significancesince it allows the species to adapt during swallowing tovarying bolus conditions, such as volume or bolusconsistency, by modulating the activity of various extrinsicand intrinsic fibers (Thexton and Hiiemae, 1997; Thextonand McGarrick, 1994; Hiiemae and Palmer, 1999) andhyoid displacement (Thexton et al., 2007). Given theneeds of species to carry out rapid and forceful lingualreconfiguration during bolus propulsion, one may postu-late mechanical synergisms involving the genioglossushyoglossus, styloglossus and inferior longitudalis combinedwith a stiffening effect of lingual core compression.The depiction of FASR as myofiber tracts allows us to
consider the extent to which such diffusion generatedmyofiber tracts serve as a structural template for localdeformation. This question has particular importance inthe case of the tongue, where the existence of intrinsic–extrinsic overlap complicates the delineation of structure–function relationships. The demonstration of higher FASRvalues in the apparent distribution of known muscle fiberpopulations asserts the prominence of these muscles in theindicated deformations. For example, based on the currentanalysis, it can be argued that contraction of thegenioglossus throughout its distribution in combinationwith relaxation in the distribution of the verticalis andpalatoglossus contributes principally to the reconfigurationof the tongue during propulsion. The assignment of aspecific structure–function association in the currentsystem is based in on the presence of strain rate in thedistribution of a DTI tractography-delineated set ofmyofiber tracts. We propose that this method provides abasis by which fiber orientation and local deformation canbe determined in any such tissue possessing variablyaligned muscle fiber populations.

ARTICLE IN PRESSS.M. Felton et al. / Journal of Biomechanics 41 (2008) 1782–1789 1789
Since the present method does not unambiguouslymonitor single fiber motor activity in vivo, it is impossibleto prove muscle fiber contraction solely from the presenceof aligned compression. Moreover, it should be acknowl-edged that our method associates strain rate data obtainedduring motion with aligned with DTI tractography dataobtained when the tongue is motionless, It is reasonable topresume that some variation of tissue myoarchitecture willresult from the tissue deformation itself. The extent thatthis effect may confer error on aligned strain rate was notaddressed in the current study. The present study wasconfined to the assessment of mid-sagittal mechanics forsimplification, although cross-planar strain rate events inalso possible given the hydrostatic nature of lingual tissue.Nonetheless, the delineation of strain rate aligned with itsmyoarchitecture portrayed in this study demonstrates thatlingual shape changes during bolus propulsion involve theclosely integrated mechanical actions of intrinsic andextrinsic muscles, whose contractility is oriented by thetissue’s underlying fiber organization.
Conflict of interest statement
Each author certifies that he has no conflict of interestwith any data or material presented in the currentmanuscript.
Appendix A. Supplementary materials
Supplementary data associated with this article can befound in the online version at doi:10.1016/j.jbiomech.2008.01.030.
References
Basser, P.J., Mattiello, J., LeBihan, D., 1994. MR diffusion tensor
spectroscopy and imaging. Biophysics Journal 66, 259–267.
Dou, J., Tseng, W.Y., Reese, T.G., Wedeen, V.J., 2003. Combined
diffusion and strain MRI reveals structure and function of human
myocardial laminar sheets in vivo. Magnetic Resonance Method 50
(1), 107–113.
Ebbers, T., Wigstrom, L., Bolger, A.F., Wranne, B., Karlsson, M., 2002.
Noninvasive measurement of time-varying three-dimensional relative
pressure fields within the human heart. Journal of Biomechanical
Engineering 124 (3), 288–293.
Felton, S.M., Gaige, T.A., Reese, T.G., Wedeen, V.J., Gilbert, R.J., 2007.
Mechanical basis for lingual deformation during the propulsive phase
of swallowing as determined by phase-contrast magnetic resonance
imaging. Journal of Applied Physiology 103 (1), 255–265.
Gaige, T.A., Benner, T., Wang, R., Wedeen, V.J., Gilbert, R.J., 2007.
Three dimensional myoarchitecture of the human tongue determined
in vivo by high resolution diffusion tensor imaging with tractography.
Journal of Magnetic Resonance Imaging 26 (3), 654–661.
Gilbert, R.J., Magnusson, L.H., Napadow, V.J., Benner, T., Wang, R.,
Wedeen, V.J., 2006a. Mapping complex myoarchitecture in the bovine
tongue with diffusion spectrum magnetic resonance imaging. Biophy-
sics Journal 91 (3), 1014–1022.
Gilbert, R.J., Wedeen, V.J., Magnusson, L.H., Benner, T., Wang, R., Dai,
G., Napadow, V.J., Roche, K.K., 2006b. Three-dimensional myoarch-
itecture of the bovine tongue demonstrated by diffusion spectrum
magnetic resonance imaging with tractography. The Anatomical
Record Part A: Discoveries in Molecular, Cellular, and Evolutionary
Biology 288 (11), 1173–1182.
Gilbert, R.J., Napadow, V.J., Gaige, T.A., Wedeen, V.J., 2007.
Anatomical basis of lingual hydrostatic deformation. Journal of
Experimental Biology 210 (23), 4069–4082.
Hiiemae, K.M., Palmer, J.B., 1999. Food transport and bolus formation
during complete feeding sequences on foods of different initial
consistency. Dysphagia 14, 31–42.
Lazarus, C.L., Logemann, J.A., Pauloski, B.R., Rademaker, A.W.,
Larson, C.R., Mittal, B.B., Pierce, M., 2000. Swallowing and tongue
function following treatment for oral and oropharyngeal cancer.
Journal of Speech Language Hearing Research 43 (4), 1011–1023.
Napadow, V.J., Chen, Q., Wedeen, V.J., Gilbert, R.J., 1999a. Intramural
mechanics of the human tongue in association with physiological
deformations. Journal Biomechanics 32, 1–12.
Napadow, V.J., Chen, Q., Wedeen, V.J., Gilbert, R.J., 1999b. Biomecha-
nical basis for lingual tissue deformation during swallowing. American
Journal Physiology 40, G695–G701.
Napadow, V.J., Chen, Q., Mai, V., So, P.T.C., Gilbert, R.J., 2001.
Quantitative analysis of 3D resolved fiber architecture in hetero-
geneous skeletal muscle using NMR and optical imaging methods.
Biophysics Journal 80, 2968–2975.
Napadow, V.J., Kamm, R.D., Gilbert, R.J., 2002. Biomechanical model
of sagittal bending for the human tongue. Journal of Biomechanical
Engineering 124, 547–556.
Nicosia, M.A., Robbins, J.A., 2001. The fluid mechanics of bolus
ejection from the oral cavity. Journal of Biomechanics 34 (12),
1537–1544.
Smith, K.K., 1986. Morphology and function of the tongue and hyoid
apparatus in Varanus (Varanidae, Lacertilia). Journal of Morphology
187, 261–287.
Smith, K.K., Kier, W.M., 1989. Trunks, tongues, and tentacles: moving
with skeletons of muscle. American Scientist 77, 29–35.
Sonntag, C.F., 1925. The comparative anatomy of the tongues of
mammalia. XII. Summary, classification, and physiology. Journal of
Zoological Proceedings of the Zoological Society London 21, 701–762.
Stejskal, E., Tanner, J., 1965. Use of spin echoes in a pulsed magnetic field
gradient to study anisotropic restricted diffusion and flow. Journal of
Chemical Physics 43, 3597–3603.
Thexton, A., Hiiemae, K.M., 1997. The effect of food consistency upon
jaw movement in the macaque: a cineradiographic study. Journal of
Dental Research 76, 552–560.
Thexton, A.J., McGarrick, J.D., 1994. The electromyographic activities of
jaw and hyoid musculature in different ingestive behaviors in the cat.
Archivs of Oral Biology 39, 599–612.
Thexton, A., Crompton, A.W., German, R.Z., 2007. Electromyographic
activity during the reflex pharyngeal swallow in the pig: Doty and
Bosma (1956) revisited. Journal of Applied Physiology 102 (2),
587–600.
Wedeen, V.J., Weisskoff, R.M., Reese, T.G., Beache, G.M., Poncelet,
B.P., Rosen, B.R., Dinsmore, R.E., 1995. Motionless movies of
myocardial strain-rates using stimulated echoes. Magnetic Resonance
Method 33 (3), 401–408.
Wedeen, V.J., Reese, T.G., Napadow, V.J., Gilbert, R.J., 2001.
Demonstration of primary and secondary fiber architecture of the
bovine tongue by diffusion tensor magnetic resonance imaging.
Biophysics Journal 80, 1024–1028.