assoc. prof. frances hoyle uwa school of agriculture and
TRANSCRIPT
Soil Quality: Challenges & OpportunitiesAssoc. Prof. Frances Hoyle UWA School of Agriculture and Environment
Soil – A valuable asset
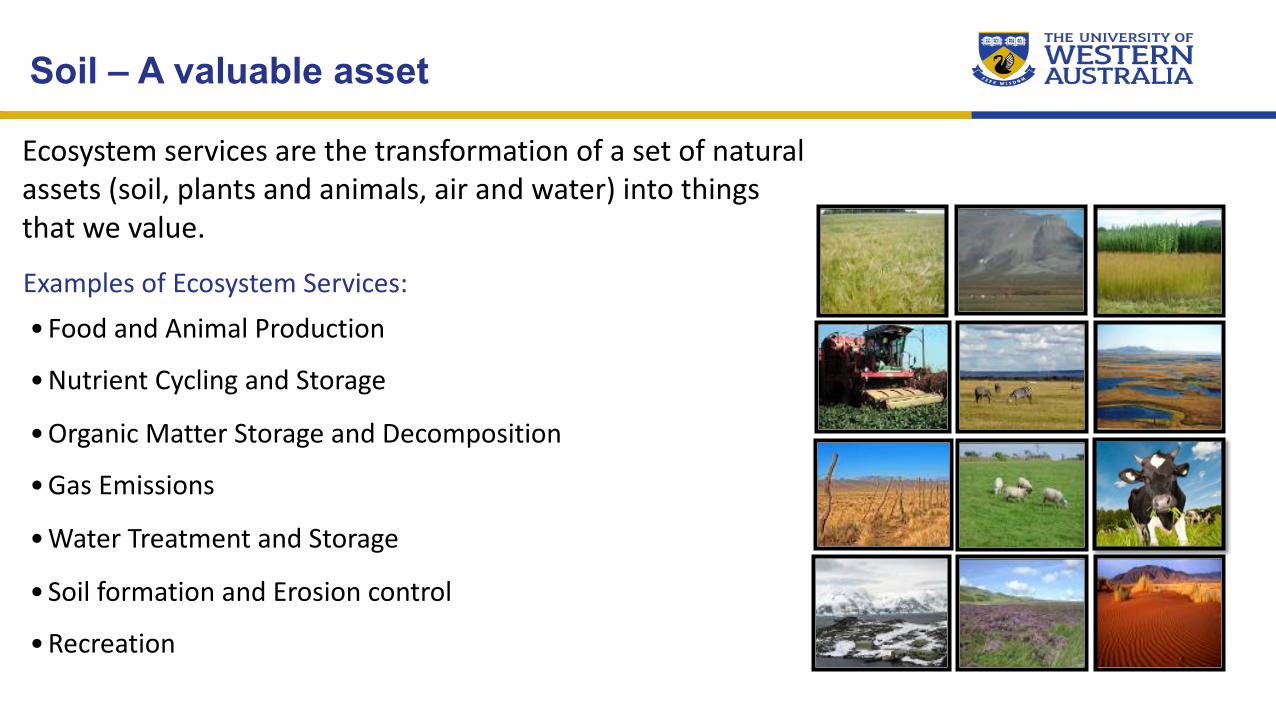
Ecosystem services are the transformation of a set of natural assets (soil, plants and animals, air and water) into things that we value.
Examples of Ecosystem Services:• Food and Animal Production
• Nutrient Cycling and Storage
• Organic Matter Storage and Decomposition
• Gas Emissions
• Water Treatment and Storage
• Soil formation and Erosion control
• Recreation
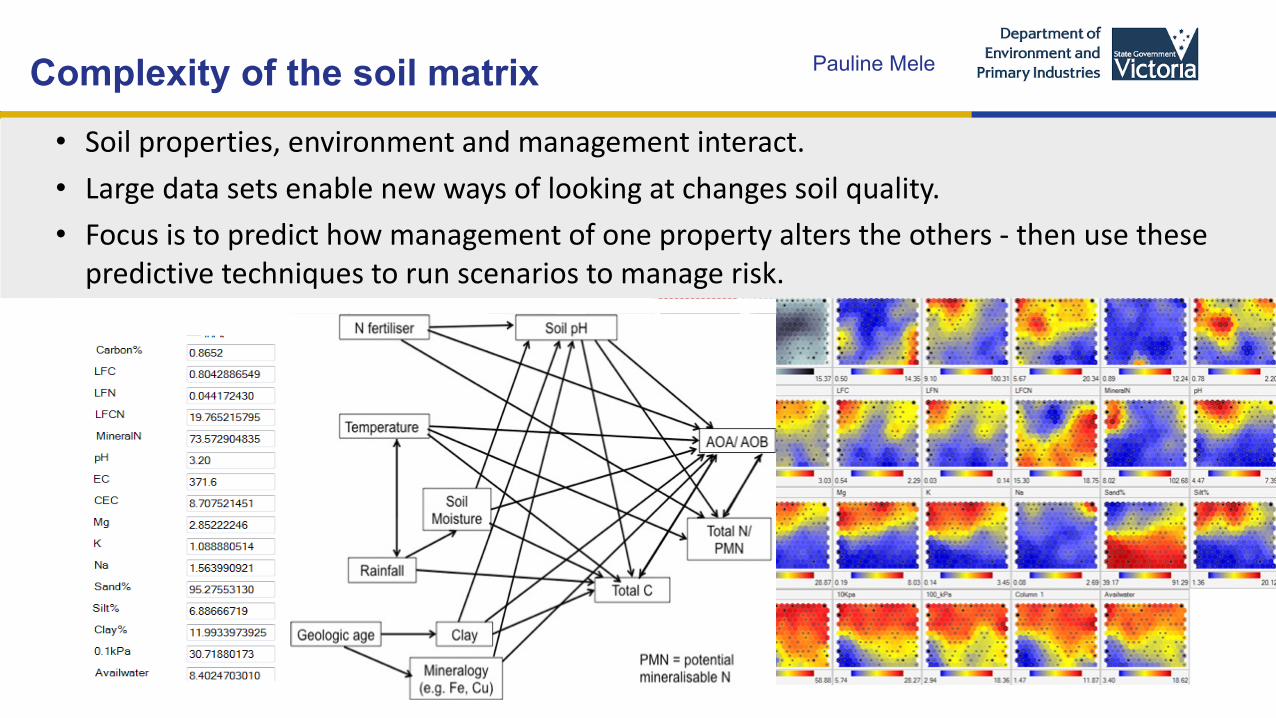
Complexity of the soil matrix• Soil properties, environment and management interact.• Large data sets enable new ways of looking at changes soil quality. • Focus is to predict how management of one property alters the others - then use these
predictive techniques to run scenarios to manage risk.
Pauline Mele
0%
20%
40%
60%
80%
100%
Tota
l Car
bon
Soil
N s
uppl
y
Dis
ease
pH (0
-10)
pH (1
0-20
)
pH (2
0-30
)
Elec
rical
Con
duct
ivity
Wat
er R
epel
lenc
y
Bulk
Den
sity
RedAmberGreen
Biology PhysicsChemistry
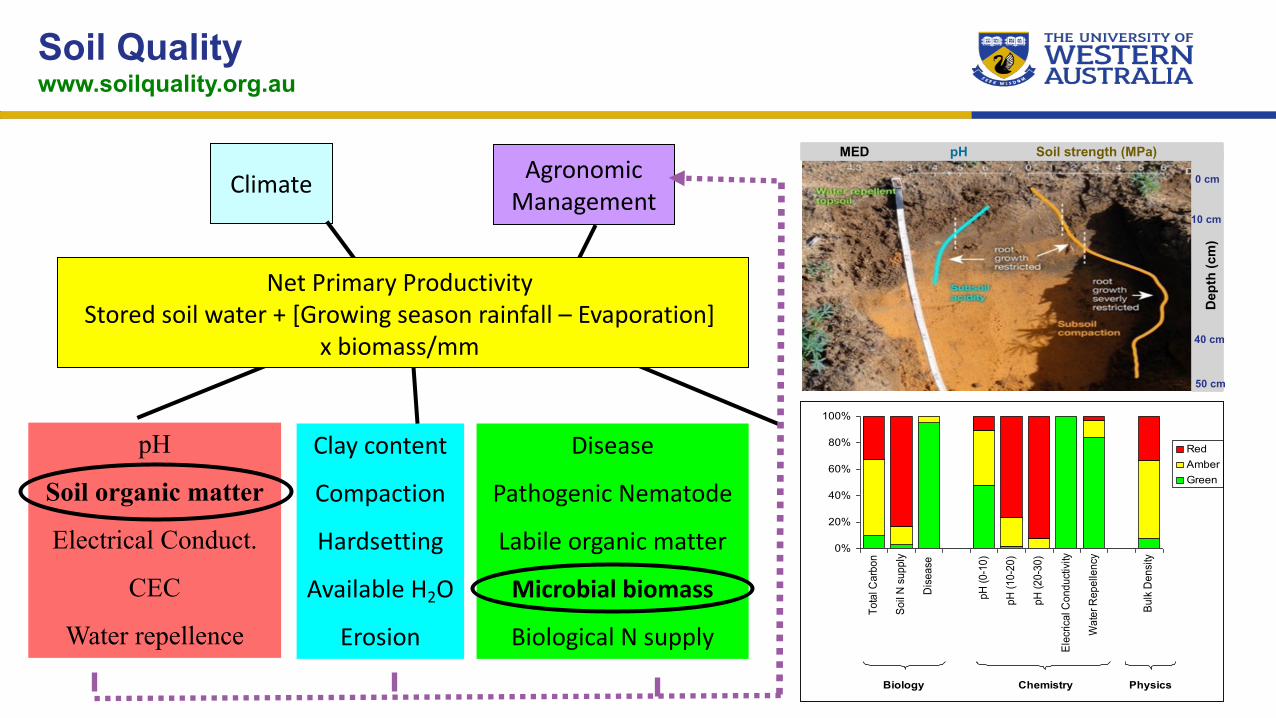
pH
Soil organic matter
Electrical Conduct.
CEC
Water repellence
Clay content
Compaction
Hardsetting
Available H2O
Erosion
Climate AgronomicManagement
Disease
Pathogenic Nematode
Labile organic matter
Microbial biomass
Biological N supply
Soil Qualitywww.soilquality.org.au
MED pH Soil strength (MPa)
Dep
th (c
m)
0 cm
10 cm
40 cm
50 cm
Net Primary ProductivityStored soil water + [Growing season rainfall – Evaporation]
x biomass/mm

Soil organic carbon fractions & ‘permanence’
Particulate
Soluble & suspended
Humus & ResistantMinerals & microbial biomass
Images: J Baldock CSIRO
Fresh residues, living organisms
Older residues, physically protected
Protected humus, charcoal
Humus (HOC)(< 53 µm)
Resistant (ROC)(Dominated by charcoal)
Particulate (POC) (2mm - 53 µm)

Organic matter fractions change on different time scales
- Labile fraction not a constant % of total OM- Early indicator of SOM status and trends- Responds to management
0123456
0 5 10 15 20 25Total C (t/ha)
Labi
le C
(t/h
a)
5%
50%
0123456
0 5 10 15 20 25Total C (t/ha)
Labi
le C
(t/h
a)
5%
50%
Hoyle et al. (2011) Book Chapter
Higher nutrient turnover
Slower carbon turnover
Hoyle and Murphy (2007)
Treatment SOC (%)
POC (mg kg soil)
Residue burnt 1.2 139Residue retained 1.3 182
NS *** (31%)

- Changing a wheat–fallow rotation to permanent pasture altered SOC fractions over 75 years (Roth-C simulation)
- Management influences allocation to particulate and humus fractions of SOC- Losses to soil organic carbon are rapid; rebuilding SOC is slower
Hoyle, Baldock, Murphy (2011) Book Chapter
Organic matter fractions change on different time scalesSo
il O
rgan
ic C
arbo
n (g
C k
g-1
soil)

Carbon Storage in Soil
Satellite image of the WA agricultural area – sampling sites
Adapted from Ingram & Fernandez 2001

R² = 0.73
R² = 0.96
0
5
10
15
20
0 10 20 30 40 50
g fr
actio
n C
kg-
1so
il
Clay content (%)
> 50 µm≤ 50 µm
Creamer et al. (2016) SBB
Clay content defines potential SOC
POCHOC
y = 0.64Ln(x) + 1.17R2 = 0.92
0.0
0.5
1.0
1.5
2.0
2.5
3.0
3.5
Clay content (%)
SO
C (
%)
3-5 30-3510-15 20-25 40-5235-4025-3015-205-10(25) (34)(13)(27)(65) (7)(11)(15)(23)
Influence of clay content on SOC in a 10-hectare area under cereal-legume rotation
SOC
(%; 0
-10
cm)
Clay Content (%)Hoyle, Baldock & Murphy (2011) Book Chapter

P Poulton, Rothamsted Research, UK.
Building SOC
• A natural equilibrium exists for the retention and loss of organic matter, with significant seasonal variability
• In low cation sandy soil a lower proportion of organic inputs are protected and retained• Maintaining soil organic carbon requires continued inputs
P Grace, Australia (2006).
Silty clay loam Soil with less clay
% in
put r
etai
ned
CEC (meq/100 g)0.5
1.0
2.0
3.0
Soil
orga
nic
carb
on (%
)
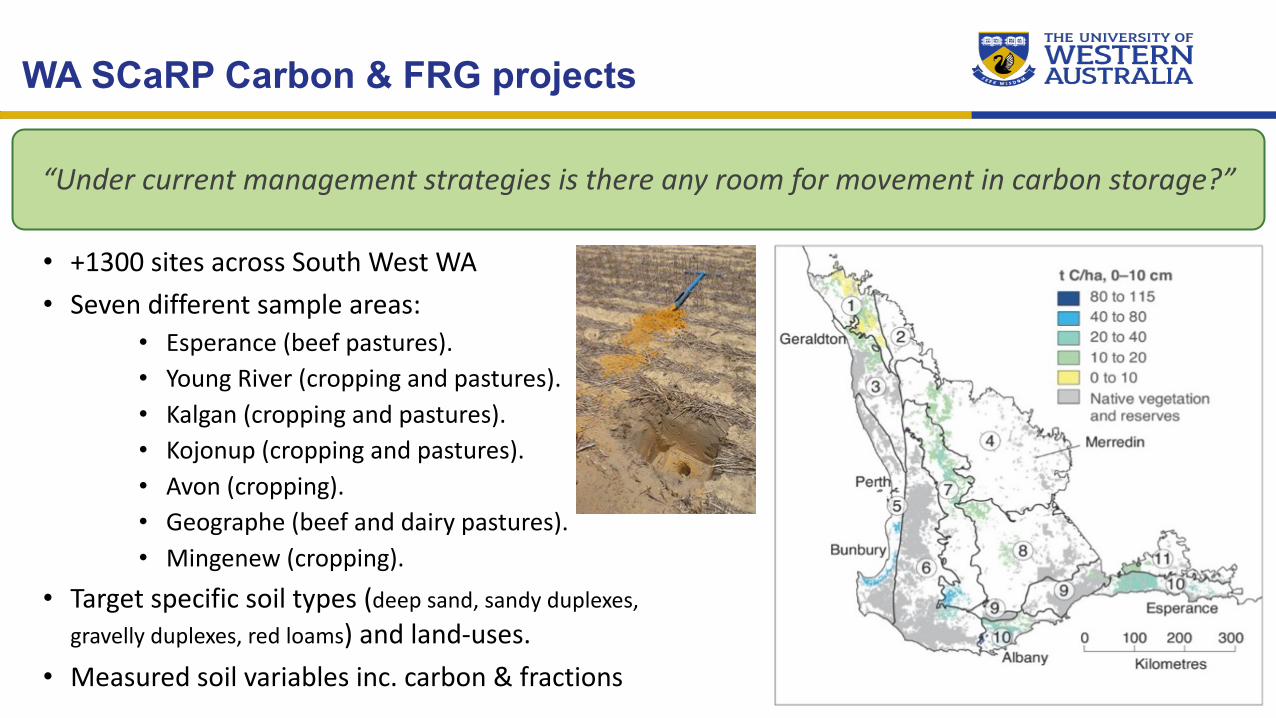
WA SCaRP Carbon & FRG projects
• +1300 sites across South West WA• Seven different sample areas:
• Esperance (beef pastures).• Young River (cropping and pastures).• Kalgan (cropping and pastures).• Kojonup (cropping and pastures).• Avon (cropping).• Geographe (beef and dairy pastures).• Mingenew (cropping).
• Target specific soil types (deep sand, sandy duplexes, gravelly duplexes, red loams) and land-uses.
• Measured soil variables inc. carbon & fractions
“Under current management strategies is there any room for movement in carbon storage?”
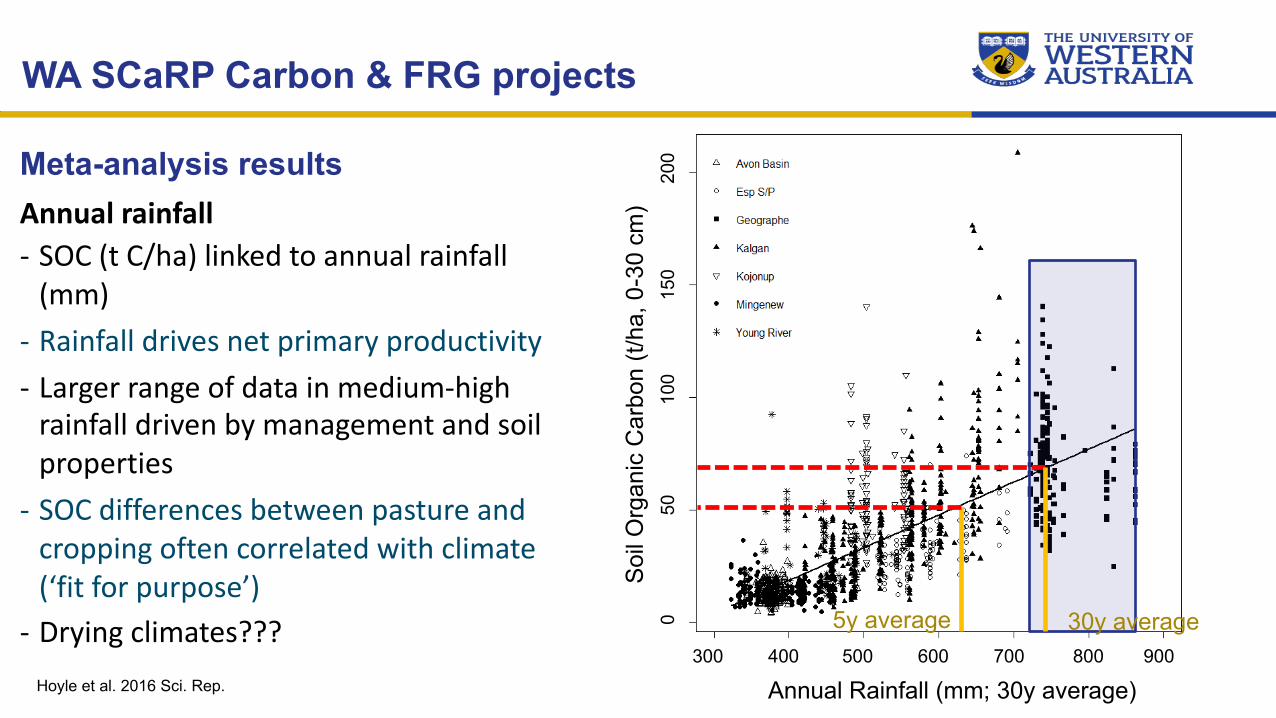
Annual rainfall- SOC (t C/ha) linked to annual rainfall
(mm)- Rainfall drives net primary productivity- Larger range of data in medium-high
rainfall driven by management and soil properties
- SOC differences between pasture and cropping often correlated with climate (‘fit for purpose’)
- Drying climates??? Hoyle et al. 2016 Sci. Rep. Annual average rainfall (mm)
300 400 500 600 700 800 900So
il or
gani
c ca
rbon
(t C
/ha,
0-
30cm
)0
5010
015
020
0Meta-analysis results
Soil
Org
anic
Car
bon
(t/ha
, 0-3
0 cm
)
Annual Rainfall (mm; 30y average)
WA SCaRP Carbon & FRG projects
30y average5y average

TemperatureChange point regression analysis
- When average daily temperature is >17°C, there is a significant decrease in SOC
- Represents critical limit for SOC storage potential for different climatic regions in WA????
- Linked to net primary productivity and decomposition rates
Annual average daily temperature (30y; °C)So
il or
gani
c ca
rbon
(t C
/ha,
0-3
0cm
)
Hoyle et al. 2016 Sci. Rep.
Soil
Org
anic
Car
bon
(t/ha
, 0-3
0 cm
)Avg. Annual Daily Temperature (30y; °C)15 16 17 18 19 20 21
050
100
150
200Meta-analysis results
WA SCaRP Carbon & FRG projects

• SOC influenced by the interaction between temperature and rainfall
Bubble size = rain
Griffin DPIRD (Source TERN, ASRIS)
Climate influence
Soil
Org
anic
Car
bon
(%)
0
1
2
3
4
5
6
7
15 20 25 30 35 40
Maximum Temperature (30y; °C)

• Greatest separation in mean actual SOC stocks occurred when grouped by land use: • SOC stocks (0-30 cm) ranged from 3 t C ha-1 to 231 t C ha-1
• Wide range variability
Continuous crop = 25 t C ha-1
Mixed farming = 36 t C ha-1
Beef production: Annual pasture = 70 t C ha-1
Beef production: Perennial pasture = 61 t C ha-1
Dairy (Fodder removal): Annual pasture = 93 t C ha-1
Dairy (Irrigated): Annual pasture = 92 t C ha-1
Dairy (Grazed feed out): Annual pasture = 101 t C ha-1
Management influence

UWA Big data (SOC)e.g. Measuring, modelling and managing soil carbon
Hoyle F.C., O’Leary R.A. and Murphy D.V. (2016)
Primary drivers of SOC in WA (79%) - Depth- Climate (Rainfall,
Temperature)- Soil type - Rotation- Soil pH
Soil and agronomic variables (e.g. stock, fertiliser) also have a significant though smaller influence on SOC.
TOCrelative
importanceARain30yr 0.287Rotation10yr 0.188AVPD30yr 0.182ATemp30yr 0.144Skg_Last5 0.075Stock.presabs 0.059Supergroup2 0.049Pkg_Last5 0.008pH_ca 0.007Nkg_Last5 0.001Kkg_Last5 0.000

Study 2: Albany Sand PlainFour paddock management systems:
• Continuous cropping.• Mixed cropping.• Annual pastures.• Perennial pastures.
Three soil types:• Deep Sand.• Sandy Duplex.• Loamy Duplex.
Other features:• Tight rainfall gradient.• Water repellence.

What does this suggest?• Perennial > annual pasture > cropping
systems.• 0-0.1 m soil layer contained 63% of measured
SOC within the top 0.3 m of the soil.
CC=continuous croppingMC= mixed cropping (B/C/P)AP= annual pasturePP=perennial pasture
Albany Sand Plain – Measured
What does this suggest?• Pasture systems dominate high rainfall – nearer
potential SOC but wider range in values.• Cropping systems – NPP constraints such as
waterlogging; inputs; low pH; water repellence?
& ModelledSo
il O
rgan
ic C
arbo
n St
ock
(t C
/ha)
Soil
Org
anic
Car
bon
Stoc
k (t
C/h
a; 0
-30
cm)
So why is it so hard to do??
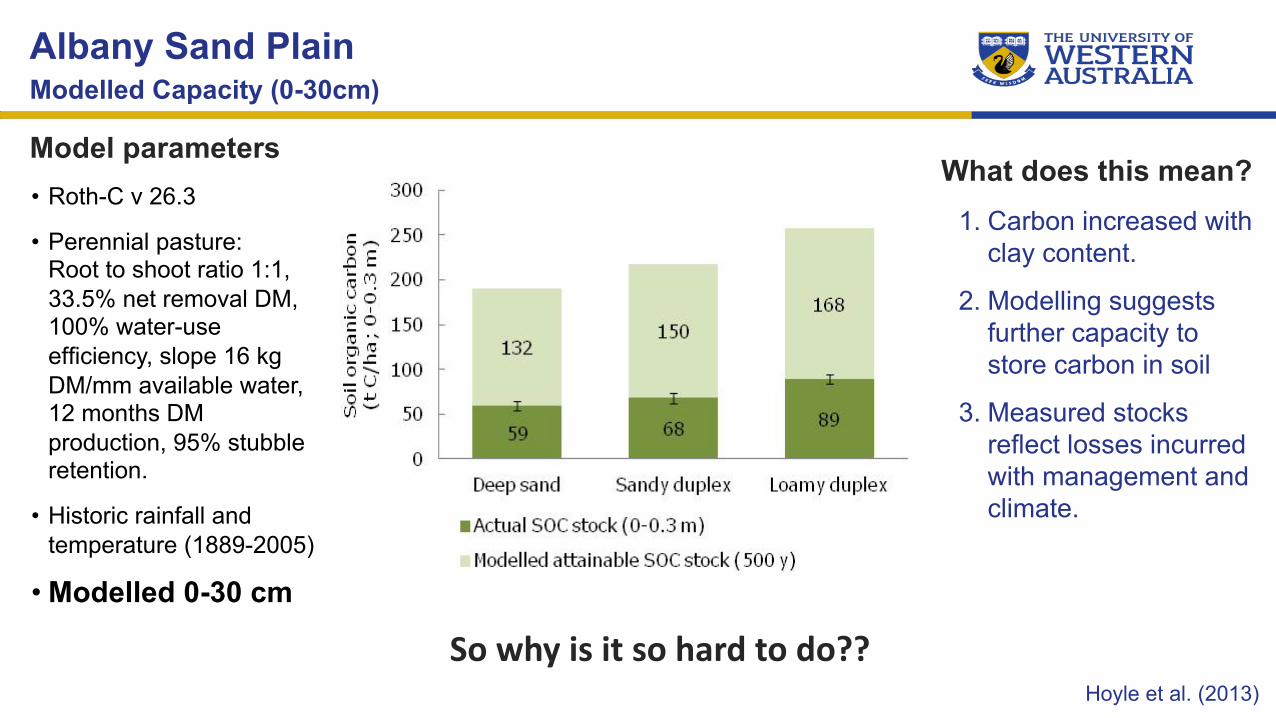
Modelled Capacity (0-30cm)
What does this mean?1. Carbon increased with
clay content.
2. Modelling suggests further capacity to store carbon in soil
3. Measured stocks reflect losses incurred with management and climate.
Albany Sand Plain
Model parameters• Roth-C v 26.3
• Perennial pasture:Root to shoot ratio 1:1, 33.5% net removal DM, 100% water-use efficiency, slope 16 kg DM/mm available water, 12 months DM production, 95% stubble retention.
• Historic rainfall and temperature (1889-2005)
• Modelled 0-30 cm
Hoyle et al. (2013)
Pere
nnia
l Pas
ture
Con
tinuo
us C
rop
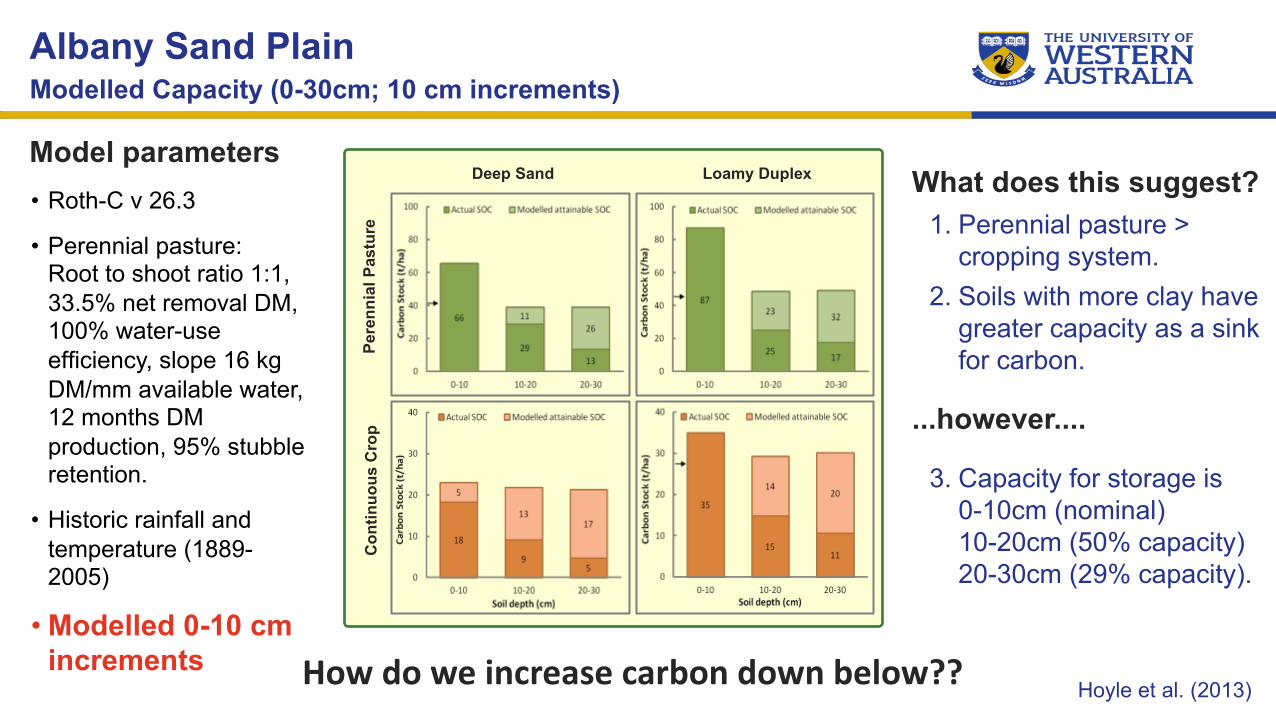
Deep Sand Loamy Duplex What does this suggest?1. Perennial pasture >
cropping system.2. Soils with more clay have
greater capacity as a sink for carbon.
...however....
3. Capacity for storage is 0-10cm (nominal)10-20cm (50% capacity) 20-30cm (29% capacity).
How do we increase carbon down below??
Modelled Capacity (0-30cm; 10 cm increments)Albany Sand Plain
Model parameters• Roth-C v 26.3
• Perennial pasture:Root to shoot ratio 1:1, 33.5% net removal DM, 100% water-use efficiency, slope 16 kg DM/mm available water, 12 months DM production, 95% stubble retention.
• Historic rainfall and temperature (1889-2005)
• Modelled 0-10 cm increments
Hoyle et al. (2013)

Soil organic matter0.1 – 10%
Living 15%
Microorganisms75-90%
Mycorrhizae
Denitrifiers
N fixation
Decomposers
Microbial activity
Nutrient Cycling EnzymesAggregate
stabilisation
Diversity
e.g. bacteria and fungi
Resilience
Roots 5-15% Fauna 5-10%
What are the living components of SOM?
Contaminantdegradation

Challenges: Building microbial biomass
Microbial biomass is the living component of soil organic matterMeasured by weight microorganisms are the power-house of the soil.Responsible for residue decomposition and nutrient release.
What is the microbial biomass?
Illustration supplied by Professor Phil Brookes, Rothamsted Research, UK
For a dryland agricultural soil:• Microbial biomass = 12 sheep/ha• 60% located in the surface soil• Mass declines with soil depth• They contain 50-100 kg N/ha • 100-200 kg of N/ha can be released
seasonally as they die/grow• They contain and release S & P

Developing messages arising from GRDC's investment in soil biology
soilquality.org.au
Experiment:Soil samples (0-10 cm) were collected from 1987 monitoring sites in Western Australia.
• pHCa from 3.5 to 8.0• Total organic carbon 0.2 to 9.8% • Microbial biomass 12 to 796 mg C/kg
What regulates microbial survival and growth (microbial biomass) in soil?
Challenges: Building microbial biomass
Soil moisture, access to food, physical/chemical habitat
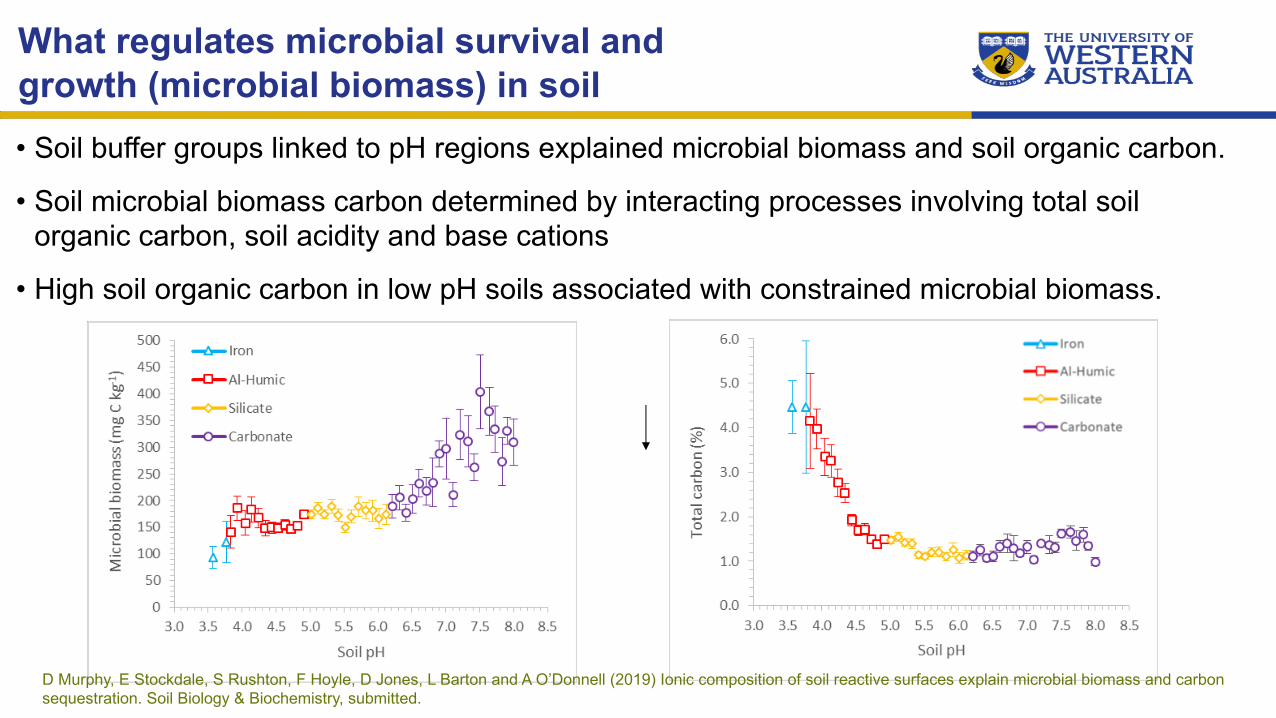
D Murphy, E Stockdale, S Rushton, F Hoyle, D Jones, L Barton and A O’Donnell (2019) Ionic composition of soil reactive surfaces explain microbial biomass and carbon sequestration. Soil Biology & Biochemistry, submitted.
• Soil buffer groups linked to pH regions explained microbial biomass and soil organic carbon.
• Soil microbial biomass carbon determined by interacting processes involving total soil organic carbon, soil acidity and base cations
• High soil organic carbon in low pH soils associated with constrained microbial biomass.
What regulates microbial survival and growth (microbial biomass) in soil
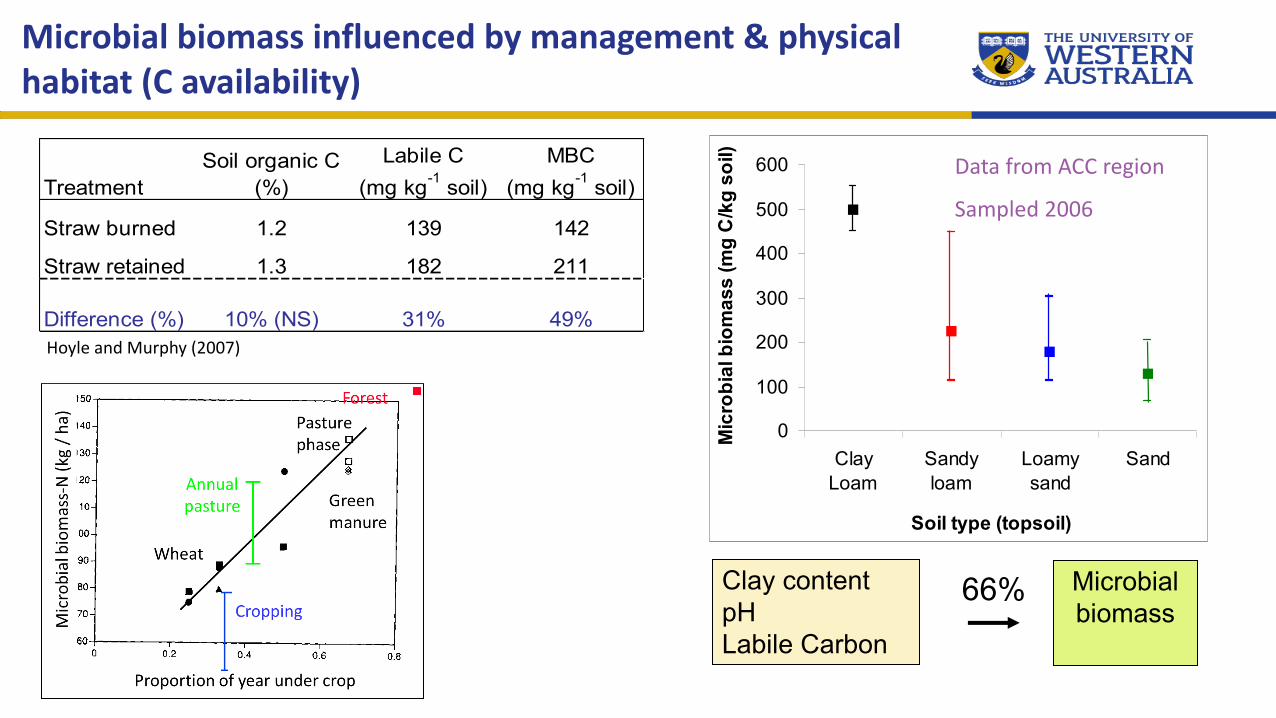
TreatmentSoil organic C
(%)Labile C
(mg kg-1 soil)MBC
(mg kg-1 soil)
Straw burned 1.2 139 142
Straw retained 1.3 182 211
Difference (%) 10% (NS) 31% 49%Hoyle and Murphy (2007)
Microbial biomass influenced by management & physical habitat (C availability)
0
100
200
300
400
500
600
ClayLoam
Sandyloam
Loamysand
Sand
Soil type (topsoil)
Mic
robi
al b
iom
ass
(mg
C/k
g so
il) Data from ACC region
Sampled 2006
66% Microbial biomass
Clay contentpHLabile Carbon

• Carbon storage capacity limited in sandy soils. Majority of ‘new’ carbon within the particulate fraction (permanence??)
• Topsoils theoretically ‘full’ in terms of C storage.- Lower layers have capacity to store more- Management solutions need to focus on getting carbon into soil at depth.- Measurable change is often decadal
• A limitation is converting rainfall into plant biomass. Improving water use efficiency by plants (e.g. removal of sub-soil constraints that restrict plant root growth) would increase potential C in soil - though large external additions needed for big changes.
• Primary SOC drivers = depth, climate, soil type, rotation and pH
• Increasing net primary productivity within cooler environments (<17°C) may increase SOC storage.
• Improved management = average change -5 to 0.25 t C/ha/y - often still showed absolute declines in SOC stock over time
Summary

• The top 10 cm soil contains ~60% of the SOC (0-30 cm).
• Soils already contain billions of microbes which only colonise a small fraction (less than 1%) of the soil surface area.
• Most surfaces in soil are not favourable to microbial growth and survival.
• Soil pH buffer groups can be used to explain microbial biomass and soil organic carbon sequestration in WA agricultural soils.
• Increasing proportion of year receiving organic inputs and maintaining residues will increase the number of biologically ‘active’ days.
• Challenge: Soil organic carbon and microbial biomass carbon are differentially regulated by soil buffer groups. Managing for one is not always at the benefit of the other.
Summary

Summary - Dairy
• SOC content already high in many instances – potential for storing additional less
• Climates getting hotter and drier are likely to see a loss in organic matter build up.
• ‘Permanence’ of carbon in soil for newly acquired carbon remains an issue.
• Carbon is highly variable – sampling and measurement cost high.
• Target degraded paddocks.
• Choose deep rooting species where viable.
• Increase water use efficiency
• Delivering organic inputs to depth
• Increase proportion of year (or area) with actively growing plants where viable
• Protect your topsoil….
WIN –Resource
WIN –Production/profit
WIN –Soil function

FREE TO DOWNLOADFROM iBooks
JUST SEARCH‘SOIL QUALITY’
Hoyle F.C., Baldock J.A. and Murphy D.V. (2011). Soil organic carbon – Role in rainfed farming systems with particular reference to Australian conditions. In: Rainfed Farming Systems (P. Tow, I. Cooper, I. Partridge and C. Birch; Eds.). Springer International.

Acknowledgements
Daniel Murphy, Yichao Rui, Rebecca O’Leary, Courtney Creamer, Emily Cooledge, Anna Ray, Davey Jones, Steve Rushton, Elizabeth Stockdale, Yoshi Sawada, Emilia Horn, Manjula Premaratne