assignment zandro
TRANSCRIPT

8/3/2019 Assignment Zandro
http://slidepdf.com/reader/full/assignment-zandro 1/25
SOUTHERN PHILIPPINES AGRI-BUSINESS & MARINE & AQUATIC SCHOOL OF TECHNOLOGY
(SPASMAST)-COLLEGE OF AGRICULTURAL SCIENCES (CAS), MATTI, DIGOS CITY
ASSIGNMENT ON FORECASTING & INVENTORY
Submitted by:
OLIVER M. PRIETO1ST Year MABM
Submitted to:
ZANDRO P. IBAÑEZ, MBA

8/3/2019 Assignment Zandro
http://slidepdf.com/reader/full/assignment-zandro 2/25
MODULE 3
BUSINESS FORECASTING
Definition of Forecasting
A planning tool that helps management to cope uncertainty of the future, basically rely on data
from the past & present.
The use of historic data to determined the direction of future trends. Use by companies to
determined how to allocate their budgets for an upcoming period of time.
Importance of Forecasting
Forecasting is an integral part of business management and a self-assessment tool for the
company/business. Without a solid idea of what future sales are going to be we cant manage inventory
or cash flow or plan for growth. The purpose of forecasting is to provide information that can use to
make intelligent business decisions and provides an important benchmark for firms which have a long
term perspective of operations. A sales forecast reports, graphs and analyzes the pulse of the business.
It can make the difference between just surviving and highly successful in business. It is a vital
cornerstone of a business/companys budget thus, the future direction of a certain business/companymay rely/rest on the accuracy of forecasting.
Forecasting processes realize important benefits such as:
. Enhance cash flow
. Knowing when and how much to buy/purchase
. In-depth knowledge of customers and the products they order
. The ability to plan for production and capacity
. The ability to identify the pattern or trend of sales
. Determine the value of a business above the value of its current assets
. Ability to determine the expected return on investment
The combination of these benefits may result in:
. Increased in revenue/Maximizing profit
. Increased customer retention/Maximizing customer service
. Decreased cost/Minimizing inventory investment
. Increased efficiency/Maximizing efficiency of purchasing and production

8/3/2019 Assignment Zandro
http://slidepdf.com/reader/full/assignment-zandro 3/25
Different Forecasting Techniques
1. Forecasting by Extension of Past History
This method of forecasting technique uses data from the past as a beginning point and as the
basis for future patterns it is also known as Time Series Method.
2. Forecasting by the Use of Exponential Smoothing
This method uses a single weighing factor called alpha (a). Alpha stands for the probability that
the same actual sale will take place.
3. Forecasting by Trend Projection
This is a mathematical method which first trend line to a set of past observations projecting theline into the future.
4. Judgmental Forecasting
This method uses individual or experts to ask for their opinion and personal judgment, in which
case primarily rely on human judgment to interpret available data and make projection in the future.

8/3/2019 Assignment Zandro
http://slidepdf.com/reader/full/assignment-zandro 4/25
FORECASTING TECHNIQUES
COMPARISON AND CONTRAST
Forecasting by Extension of Past History
> this method uses the 3 types of average forecast the Unweighted Average Forecast, which is use
previous data to find the average of the said data. Weighted Average Forecast, this type of forecast
giving weight to most recent data. Moving Average Forecast, averages that are updated as new data.
> this method make forecast based purely on historical patterns in the data.
> most quantitative forecasting methods try to explain patterns in historical data as a means of using
those patterns to forecast future patterns.
> dont tend to work well when theres either a trend in the data or seasonal effects.
> simple, cheap to run and relatively easy to interpret.
> can be quite accurate particularly over the short term.
Forecasting by the Use of Exponential Smoothing
> more importance is place on the most recent data than on historical data.
> if there is a trend in the data itll use the recent observation to make up the bulk of the forecast and
the forecast is more likely to reflect the trend.
Forecasting by Trend Projection
> gathering first of the past data, before any forecast could be undertaken.
> this method uses trend equation formula Y=a+bx
Judgmental Forecasting
> this method of forecasting uses experts or group of expert e.g. Delphi Technique asking for their
opinions, predictions, judgment and projections base on the data they interpret.

8/3/2019 Assignment Zandro
http://slidepdf.com/reader/full/assignment-zandro 5/25
EXERCISES/PROBLEM SOLVING
1. Suppose that the Perpetual Help College of Rizal had the following record of its growth of enrollment
from1997-2004
Year Enrollment Year Enrollment
1997 1,200 2001 3,000
1998 1,500 2002 5,800
1999 2,000 2003 6,000
2000 2,500 2004 7,000
a. Forecast the 2005 enrollment using 5 year weighted average forecast.
WAF= 2500+3000(2)+5800(3)+6000(4)+7000(5)1+2+3+4+5
= 2500+6000+17400+24000+35000
15
= 84900
15
= 5660 is a weighted average forecast for 2005
b. Forecast the 2005enrollment using the Trend Projection
Year Enrollment (y) Time (x)
1997 1,200 0
1998 1,500 1
1999 2,000 2
2000 2,500 3
2001 3,000 4
2002 5,800 5
2003 6,000 6
2004 7,000 7
b=xy-nxyx-nx
a=y-b x

8/3/2019 Assignment Zandro
http://slidepdf.com/reader/full/assignment-zandro 6/25
xy=1200(0)+1500(1)+2000(2)+2500(3)+3000(4)+5800(5)+6000(6)+7000(7)
xy= 139,000
x= 3.5, y= 3625,n= 8
x= 0+1+2+3+4+5+6+7
x= 140
b= 139,000-8(3.5)3625140-8(3.5)
b= 892.66
a= 3625-892.86(3.5)
a= 500
Trend Equation y=bx+a
y= 892.86x+500
x=8
y= 892.86(8)+500
y= 7643 2005 enrollment
c. Forecast the 2005 enrollment using exponential smoothing forecast if alpha was .6 andprevious forecast for 2004 was 5500.
a= .6 @ year 2004 enrollment was 5500
y= 1200+1500+2000+2500+3000+5800+6000+55008
y= 3437.5
x= 3.5
a= y-bx
.6= 3437.5-b 3.5
b= 981.97
x= 8
y= 981.97(8)+500

8/3/2019 Assignment Zandro
http://slidepdf.com/reader/full/assignment-zandro 7/25
y= 7643 2005 enrollmentd. Use 2-year weighed moving average forecast from 1999 to 2005.
Year Enrollment 2-year weighed Average Moving Forecast
1997 1,200
1998 1,500
1999 2,000 (1200+1500x2)÷3=1400
2000 2,500 (1500+2000x2)÷3=1833.33
2001 3,000 (2000+2500x2)÷3=2333.33
2002 5,800 (2500+3000x2)÷3=2833.33
2003 6,000 (3000+5800x2)÷3=4866.67
2004 7,000 (5800+6000x2)÷3=5933.33
2005 (6000+7000x2)÷3=6666.67
2. Suppose that the value of one dollar compared to the peso grew as follows:
Year Value of $ 1 in Peso Year Value of $ 1 in Peso
1998 P 7.50 2002 P 18.00
1999 7.50 2003 25.50
2000 8.00 2004 20.00
2001 14.00
a. Forecast the value of one dollar in 2005 using a 3year weighted average.
WA= 18+25.50 (2)+20(3) = 18+51+60 =21.5 the value of dollar in the year 2005 1+2+3 6
b. Show moving 2-year weighed moving average forecast from 2000 to 2005.
Year Value 2-year weighed Average Moving Forecast
1998 P 7.50
1999 7.50
2000 8.00 (7.50+7.50x2)÷3=10
2001 14.00 (7.50+8.00x2)÷3=10.33
2002 18.00 (8.00+14.00x2)÷3=14.662003 25.50 (14.00+18.00x2)÷3=21.33
2004 20.00 (18.00+25.50x2)÷3=29
(25.50+20.00x2)÷3=30.33
8/3/2019 Assignment Zandro
http://slidepdf.com/reader/full/assignment-zandro 8/25
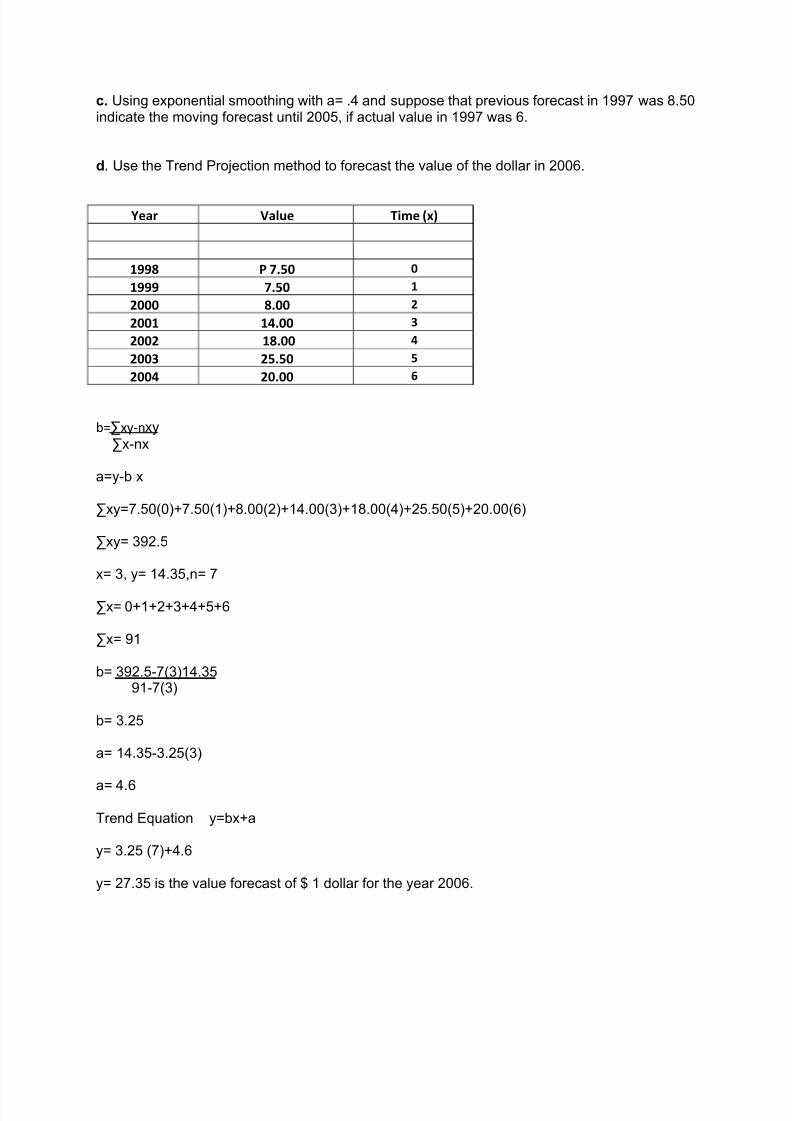
c. Using exponential smoothing with a= .4 and suppose that previous forecast in 1997 was 8.50indicate the moving forecast until 2005, if actual value in 1997 was 6.
d. Use the Trend Projection method to forecast the value of the dollar in 2006.
Year Value Time (x)
1998 P 7.50 0
1999 7.50 1
2000 8.00 2
2001 14.00 3
2002 18.00 4
2003 25.50 5
2004 20.00 6
b=xy-nxyx-nx
a=y-b x
xy=7.50(0)+7.50(1)+8.00(2)+14.00(3)+18.00(4)+25.50(5)+20.00(6)
xy= 392.5
x= 3, y= 14.35,n= 7
x= 0+1+2+3+4+5+6
x= 91
b= 392.5-7(3)14.35 91-7(3)
b= 3.25
a= 14.35-3.25(3)
a= 4.6
Trend Equation y=bx+a
y= 3.25 (7)+4.6
y= 27.35 is the value forecast of $ 1 dollar for the year 2006.

8/3/2019 Assignment Zandro
http://slidepdf.com/reader/full/assignment-zandro 9/25
3. Aling Elong had the following sales in her small sari-sari store for the past 5 weeks: P 2,500,P3,000, P 2,000, P 3,400 and P 2,800. Forecast her sales for the sixth week using 5 weeksweighted average.
F= 2500+3000(2)+2000(3)+3400(4)+2800(5)
1+2+3+4+5
F= 42100
15
F= 2806.66 is the sale forecast for the sixth week.
REFERENCES
SUSAN WARD (Guide on Sales Forecasting)INVESTOPEDIA (Forecasting)THE MARLLORYS (Business Forecasting, Published Feb. 4, 2011)NEIL MASON (Forecasting Techniques, Published July 25, 2006)

8/3/2019 Assignment Zandro
http://slidepdf.com/reader/full/assignment-zandro 10/25
MODULE 4
INVENTORY
Definition of Inventory
A complete list of items such as property, goods in stock or the contents of a building.
A detailed, itemized list, report, or record of things in ones possession, especially a periodic
survey of all goods and materials in stock.
A current assets, a stock or store of goods.
What to Inventory?
(A) Raw materials and purchased parts
(B) Partially completed goods
(C) Finished-goods inventories or merchandise
(D) Replacement parts, tools, and suppliers
(E) Goods-in-transit to warehouses or Goods In progress
Functions of Inventory
1. To meet anticipated customer demand . These inventories are referred to as anticipation stocks
because they are held to satisfy planned or expected demand.
2. To smooth production requirements. Firms that experience seasonal patterns in demand often
build up inventories during off-season to meet overly high requirements during certain seasonal
periods. Companies that process fresh fruits and vegetable deal with seasonal inventories
3. To decouple operations. The buffers permit other operations to continue temporarily while the
problem is resolved. Firms have used buffers of raw materials to insulate production from
disruptions in deliveries from suppliers, and finished goods inventory to buffer sales operations
from manufacturing disruptions.
4. To protect against stock-outs. Delayed deliveries and unexpected increases in demand increase
the risk of shortages. The risk of shortages can be reduced by holding safety stocks, which are
stocks in excess of anticipated demand.5. To take advantage of order cycles. Inventory storage enables a firm to buy and produce in
economic lot sizes without having to try to match purchases or production with demand
requirements in short run.
6. To hedge against price increase. The ability to store extra goods also allows a firm to take
advantage of price discounts for large orders.
7. To permit operations. Production operations take a certain amount of time means that there
will generally be some work-in-process inventory.

8/3/2019 Assignment Zandro
http://slidepdf.com/reader/full/assignment-zandro 11/25
Requirements for Effective Inventory Management
To be effective, management must have the following:
1. A system to keep track of the inventory on the hand on order.
2. A reliable forecast of demand that includes an indication of possible forecast error.3. Knowledge of lead times and lead time variability.
4. Reasonable estimates of inventory holding costs, ordering costs, and shortage costs.
5. A classification system for inventory items.
Inventory Counting Systems
1) Periodic System
This is a physical count of items in inventory is made at periodic intervals (e.g. weekly, monthly) inorder to decide how much to order of each item. Major users: Supermarkets, discounts stores, and
department stores.
Advantage
Orders for many items occur at the same time, which can result in economies in processing and
shipping orders
Disadvantages
a) Lack of control between reviews.
b) The need to protect against shortages between review periods by carrying extra stock.
c) The need to make a decision on order quantities at each review
2) Perpetual Inventory System (also known as a continual system)
This keeps track of removals from inventory on a continuous basis, so the system can provide
information on the current level of inventory for each item.
Advantages
1. The control provided by the continuous monitoring of inventory withdrawals.
2. The fixed-order quantity; management can identify an economic order size.
Disadvantage
1. The added cost of record keeping.

8/3/2019 Assignment Zandro
http://slidepdf.com/reader/full/assignment-zandro 12/25
Two-bin-system method
Is two containers of inventory; reorder when the first is empty. The advantage of this system is that
there is no need to record each withdrawal from inventory; the disadvantage is that the reorder
card may not be turned in for a variety of reasons.
Tracking System
Universal Product Code (UPC) bar code printed on a label that has information about the item to
which it is attached. Bar coding represents an important development for other sectors of business
besides retailing. In manufacturing, bar codes attached to parts, subassemblies, and finished goods
greatly facilitate counting and monitoring activities.
Inventory Cost (Three Basic Costs)
1. Holding or Carrying Cost is the costs to carry an item in inventory for a length of timeusually a year. Cost includes interest, insurance, taxes, depreciation, obsolescence,
deterioration, spoilage, pilferage, breakage, etc.
2. Ordering Cost is cost of ordering and receiving inventory. These include determining how
much is needed, preparing invoices, inspecting goods upon arrival for quality and quantity,
and moving the goods to temporary storage.
3. Storage Cost is cost resulting when demand exceeds the supply of inventory on hand. These
costs can include the opportunity cost of not making a sale, loss of customer goodwill, latecharges, and similar costs
ECONOMIC ORDER QUANTITY MODELS
Economic Order Quantity (EOQ) is the order size that minimizes total cost. EOQ models identify the
optimal order quantity in terms of minimizing the sum of certain annual costs that vary with order
size.
Three (3) Order Size
1. The economic order quantity model.
2. The economic order quantity model with non instantaneous delivery.
3. The quantity discount model.

8/3/2019 Assignment Zandro
http://slidepdf.com/reader/full/assignment-zandro 13/25
Inventory Cycles begins with the receipt of an order of Q units, which are withdrawn at instant rate
over time. When the quantity on the hand is just sufficient to satisfy demand during lead time, an
order for Q units is submitted to the supplier.
Developing EOQ Mathematical Model
Assumption of the Basic EOQ Model
1. Only one product is involved.
2. Annual demand requirements are known.
3. Demand is spread evenly throughout the year so that the demand rate is reasonably
constant.
4. Lead time does not vary.5. Each order is received in a single delivery.
6. There are quantity discounts.
Order QuantityOrder Quantity
Annual CostAnnual Cost
Holding CostHolding Cost
EOQ ModelH olding Cost( H) or carrying cost relate
to having items in storage. Cost
includes interest, insurance, tax,
depreciation Obsolesce, deterioration,
spoilage, breakage. Warehouse cost (heat, light, security and rent.
In EOQ Model Holding Cost is Express

8/3/2019 Assignment Zandro
http://slidepdf.com/reader/full/assignment-zandro 14/25
Order QuantityOrder Quantity
Annual CostAnnual Cost
Holding CostHolding Cost
Order (Setup) CostOrder (Setup) Cost
EOQ Model
Order QuantityOrder Quantity
Annual CostAnnual Cost
Holding CostHolding Cost
Total Cost CurveTotal Cost Curve
Order (Setup) CostOrder (Setup) Cost
OptimalOptimal
Order Quantity (Q*)Order Quantity (Q*)
EOQ Model
Optimal Quantity =
Annual Holding Cost = H Q
.2
Annual Carrying Cost = S Q
D.
Total annual Inventory Cost= H Q
.2
+ S Q
D.
Length Of order Cycle = .
D
Q
Ordering Costs are the costs of
ordering and receiving inventory.
They are the cost that varies with the
actual placement of an order such as
shipping cost, preparing invoices,inspecting goods upon arrivals.
The ordering Cost express as Fixed
By merging the two Graphs we can
notice that the minimum Inventory
Cost is at the intersection point.
Total Cost =
Holding Cost + Ordering Cost
H
S D EOQvv
!2

8/3/2019 Assignment Zandro
http://slidepdf.com/reader/full/assignment-zandro 15/25
EXAMPLE OF ORDERING COST FACTORS
y Processing and inspecting incoming inventory
y Developing and sending purchase ordersy Bill paying
y Inventory inquiries
y Utilities, phone bills, and so on, for the purchasing department
y Salaries and wages for the purchasing department employees
y Supplies such as forms and paper for the purchasing department
EXAMPLES OF CARRYING COST FACTORS
y Cost of capital
y Taxes
y Insurance
y Spoilage
y Theft
y Obsolescence
y Supplies such as forms and paper for the warehouse
y Utilities and building costs for the warehouse
y Salaries and wages for warehouse employees
Determinants of Reorder point quantity(when we have to reorder?)
a) Rate of demandb) The lead timec) The extent of demandd) The degree of stock out risk acceptable to management
ROP (Reorder Point) = Daily Demand X Lead Time
ROP = d x L

8/3/2019 Assignment Zandro
http://slidepdf.com/reader/full/assignment-zandro 16/25
Example
SaveMart needs 1000 coffee makers per year. The cost of each coffee maker is $78. Ordering cost is
$100 per order. Carrying cost is $20 of per unit cost. Lead time is 5 days. SaveMart is open 360 days/yr.
(A) What is EOQ Model?
(B) How many times per year does the store reorder?
(C) What is the length of order cycle?
(D) What is the total annual cost if the EOQ quantity is ordered?
Answer
(A) H Q
H
S D EOQ .
210
100100022!
vv
!
vv
! = 100 units
(B) Number of orders = .
Q
D= .
100
1000= 10 times
(C) Cycle Length = . D
Q= .1000
100= 0.1 per year = 0.1 x 360 days/year = 36 days
(D) Total Annual Inventory Cost = H Q
.2
+ S Q
D. = 100
100
100020.
2
100 x x =2000
EOQ with Non instantaneous Replenishment (EPQ)

8/3/2019 Assignment Zandro
http://slidepdf.com/reader/full/assignment-zandro 17/25
When a firm is both a producer and a user or deliveries are spread over time, inventories tend to build
up gradually instead of instantaneously. If usage production (or delivery) rates are equal, there will be
no inventory buildup since all output will be used immediately and the issue of lot size doesnt come up.
In the more typical case, the production or delivery rate exceeds the usage rate. In the production case,
production occurs over only a portion of each cycle because the production rate is greater than the
usage rate, and usage occurs over the entire cycle.
The economic Production Quantity =u p
p
H
DS
.2
Total Inventory cost = Carrying cost + setup cost
S Q
D H
I TC ..
2max
min !
Cycle Time =u
Q p
time between beginning of range
Run time = p
Q pproduction phase of the cycle
Average inventory2max I
I average !
The maximum inventory level = ).( u p p
Q p
Where
P is Production or Delivery Rate
U is usage rate

8/3/2019 Assignment Zandro
http://slidepdf.com/reader/full/assignment-zandro 18/25
Example
A toy manufacturer uses 48,000 rubber wheels per year for its popular dump truck. The firm makes its
own wheels, which it can produce at a rate of 800 per day. The toy trucks are assembled uniformly over
entire year. Carrying cost is $ 1 per wheel a year. Setup cost of production run of wheels is $45. The firm
operates 240 days per year. Determine the:-
a) Optimal Run Size.
b) Minimum total annual cost for carrying and setup.
c) Cycle time for the optimum run size.
d) Run time.
Answer
D = 48,000 wheels per year
S= $ 45
H= $ 1 per wheel per year
P = 800 wheels per day
U = 48,000 wheel per 240 days or 200 wheels per day
a) Q p =u p
p
H
DS
.2
=200800
800.
1
45)48000(2
=2400 wheels
b) S Q
D H
I TC ..
2max
min ! so we first must find Imax
The maximum inventory level = ).( u p p
Q p = wheel 1800)200800.(
800
2400!
So S Q
D H
I TC ..
2max
min ! = 1800)45(200
4800)1(
2
1800!
c) Cycle Time = d aysu
Q p12
200
2400!!

8/3/2019 Assignment Zandro
http://slidepdf.com/reader/full/assignment-zandro 19/25
d) Run time = d ays p
Q p3
800
2400!!
EOQ with Quantity Discount
Quantity Discounts are price reductions for large orders offered to customers to induce them to buy in
large quantities. If quantity discounts are offered, the customer must weigh the potential benefits of
reduced purchase price and fewer orders that will result from buying in large quantities against the
increase in carrying costs caused by higher average inventories
TC = carrying cost + Ordering cost + Purchasing Cost
TC = ...2
P DS Q
D H
Q Where: P = Unit price
EXAMPLE
The maintenance department of a large hospital uses about 180 cases of liquid cleanser annually.
Ordering costs are $25, carrying costs are $5 per case a year, and the new schedule indicates that orders
of less than 45 cases will cost $2.0 per case, 45 to 69 will cost $1.7 per case, and more than 70 cases will
cost $1.4 per case. Determine the optimal order quantity and total cost.
unit H
S D EOQ 43
5
2518022!
vv
!
vv
!
Total Cost = H Q
.2
+ S Q
D. = 15.29843225
43
1805.
2
43! x x x
If we order 45 unit we may get discount the price will be reduced from $2 to $1.7 and the total
annual cost will be:-
Total Annual Cost = H Q
.2
+ S Q
D. = 5.5181807.125
45
1805.
2
45! x x x
If we order 70 unit we may get further reduction as the price will be reduced from $1.7 to $1.4
the annual cost in this case would be :-

8/3/2019 Assignment Zandro
http://slidepdf.com/reader/full/assignment-zandro 20/25
Total Annual Cost = H Q
.2
+ S Q
D. = 3.4911804.125
70
1805.
2
70! x x x
We can note that at some range from 45 to 70 units annual cost will be appropriate even the EOQ state
other range due to discount effect.
Definition of Inventory Management
Provides information to efficiently manage the flow of materials effectively utilize people and
equipment coordinate internal activities and communicate with customers. Inventory managementdoes not make decisions or manage operations, they provide the information to managers who make
more accurate and timely decisions to manage their operations.
Inventory Management, must be tie together the following objectives to ensure that there is continuity
between functions:
> Companys Strategic Goals
> Sales Forecasting
> Sales and Operations Planning
> Production and Materials Requirements Planning
> Inventory Reduction
Objectives of Inventory Management
To make sure the firms cash flow are managed efficiently. Efficient management of inventory
should ultimately result in the maximization of the profit. Inventory should be turned over as quickly as
possible, avoiding stock-outs it might result in closing down the production line or lead to a loss of sale.

8/3/2019 Assignment Zandro
http://slidepdf.com/reader/full/assignment-zandro 21/25
It implies that which the management should try to pursue the financial objective of turning inventory
as quick as possible, it should at the same time ensure sufficient inventories to satisfy production and
sales demands. In other words the manager has to reconcile these two conflicting requirements. Stated
differently, the objective, the objective of inventory management consists of two counter balancing
involves cost, such that the smaller the inventory, the lower the cost to the firm. But inventories also
provide benefits to the extent that it facilitates the smooth functioning of the firm. The larger the
inventory, the better it is from this view point. Obviously the manager should aim at a level of
inventory, which will reconcile these conflicting elements. That is to say, an optimum level of inventory
should be determined on the basis of the trade-off between cost and benefits associated with the level
of inventory. We can say that the profit and loss of a company largely depends on its inventory
management system. If the company properly controls its inventory management system, it will be
profitable.Otherwise it will be cause of being loss.
The objectives of Inventory management summarize as follows:
1. Maximizing Customer Services=Increased in Customer Retention
2. Maximizing Efficiency of Purchasing and Production=Increased in Efficiency
3. Minimizing Inventory Investment=Decreased in Cost
4. Maximizing Profit=Increased in Revenue
Common Inventory Management Problems
1. Unqualified employees in charge of inventory. Too many companies put people in charge of
their inventory distribution who either dont have enough experience, are neglectful in their job,
or dont have adequate training. No matter what kind of system is used, companies need to pay
closer attention in overseeing their inventory management and making sure employees receive
proper training.
2. Using a measure of performance for their business that is too narrow. All too often companies
will evaluate how well their business is doing. The processes they use are not wide enough and
do not encompass all the aspects and factors in the company. Many areas get overlooked and
can lead to either inventory shortages or inventory stockpiling.
3. A flawed or unrealistic business plan for a business for the future. To predict how well a
company may do in the future, you have to collect enough data and accurately analyze it. The
downfall of many companies starting out is that they give an unrealistic assessment of a
companys growth. This affects inventory management because if a company predicts more
growth than they actually experience, it can lead to an overstock of inventory. The opposite is
true if forecasters do not predict enough growth and are left with not enough inventory.

8/3/2019 Assignment Zandro
http://slidepdf.com/reader/full/assignment-zandro 22/25
4. Not identifying shortages ahead of time. It happens all the time. A business needs a number of
products or materials but discover that they do not have enough in stock and must re-order.
Waiting for the shipment to come in can slow down the supply chain process. Not having
enough product in stock to meet customer demand can lead to bad customer relations. A
supervisor in charge of inventory management should look over their inventory on a regular
basis to make sure enough product is in stock.
5. Bottlenecks and weak points can interfere with on-time product delivery. This means that if
too many orders come in for outgoing shipments and do not get handled in an efficient manner,
they can build up, or bottleneck. This slows down deliveries. The same is true for any weak
points in an inventory management system. Weak points slow down the system and can stop it
altogether.
6. Falling victim to the bullwhip effect. This is an over-reaction by a company to changes in the
market. As the demand of a market changes, a company may panic and order an overstock of
inventory, thinking the new market conditions will move the inventory. Instead, the market
stabilizes and the business is now left with a surplus of products that just sit in the warehouse,taking up space and not making money.
7. Too much distressed stock in inventory. Distressed stock is products or materials in inventory
that has or will soon pass the point where it can be sold at the normal price before it expires.
This happens all the time in grocery stores. As a particular food product nears its expiration
date, the business will discount the item in order to move it quickly before it expires.
8. Excessive inventory in stock and unable to move it quickly enough. This is probably the most
common problem for most businesses. Cash-flow comes from moving inventory. If a company
buys an amount of product for their inventory and they do not move it, the company ends up
losing money.
9. Computer assessment of inventory items for sale is inaccurate. Nothing is more frustrating
than going to a business that says it has a product but it turns out that they do not. The
quantities are off and the actual items are not available. Too many people assume that the
computer records are infallible. But the records have to be entered by a person and if the
person responsible does not keep accurate records, it can turn into a real headache. Inaccurate
inventory records can easily result in loss of money and strained customer service.
10. Computer inventory systems are too complicated. There are many inventory software
programs available for business use. The problem is that many of these programs are not user-
friendly. Computer software developers do not take into account that most of the people who
will actually be using these systems are not tech savvy. A company does not always have the
time and money to invest in training of personnel to use software effectively.
11. Items in-stock get misplaced. Even if the computer accurately shows the item as in stock, it may
have been misplaced somewhere at the warehouse, or in the wrong location within a store. This
can lead to a decrease in profits due to lost sales and higher inventory costs because the item
must be re-ordered. Plus, the company must spend the time for employees to track down the
misplaced item.

8/3/2019 Assignment Zandro
http://slidepdf.com/reader/full/assignment-zandro 23/25
12. Not keeping up with the rising price of raw materials. This falls more into the accounting end of
inventory management. By not keeping current with the rising price of raw materials, a
company will lose profits because they are not adjusting the price of their finished products.
Finished items in inventory must be relative to the cost of raw goods.
How to Avoid Inventory Problems
Plan sales. In order to effectively manage your inventory, you need to know what you expect to sell.
For larger retailers that are stocking many SKU's, sophisticated sales forecasting software may make
sense. For many small retailers, however, developing a simple spreadsheet from your POS sales
history, by month by key category, is most cost effective. Start with last years sales histories, and
make adjustments for unusual events, such as weather, out of stocks, one-time promotions, etc. Then
factor in the appropriate sales increase or decrease percentage, based on a reading of the sales
potential for the category for the upcoming season. Finally, for larger categories, it may make sense
to break the sales plan down by sub-categories, styles or vendors.
Plan inventories. It makes little sense to bring in more inventory at any given time than you need to
set your displays, support your planned sales until the next delivery, and provide a safety stock in the
event of an unexpected sales spike or a late vendor delivery. Buying inventory too far in advance is
one of the surest ways to find yourself over-stocked down the road. For many small retailers, the best
way to plan inventories is to plan to have enough on hand at month end to support the next two or
three months sales.
Plan inventory receipts. If you've planned sales by month, and ending inventories by month, it's easy
to calculate how much inventory to bring in each month. You need to bring in enough to cover that
month's sales plan and ending inventory, less the prior months ending inventory. In this way, a buyer
can know in March, when preparing for the fall season, for example, how much inventory to plan on
bringing in each month of the season.
Plan markdowns. Planning markdowns goes hand in hand with planning inventories. If you plan the
date of the first seasonal markdown before the season even begins, you can plan the inventory you
want to have on hand at that point in time, and thus your markdown percentage, as well as your
markdown sales before your second markdown, as well as all subsequent markdowns.
Plan dynamically.Once you've completed your preseason planning, don't put it in a drawer never to
be seen again. Use that plan as a dynamic tool to track the progress of the season. As each week goes
by, and sales trends begin to develop, adjust future sales plans accordingly, and adjust inventory
plans for those updated sales plans. If sales are exceeding plan, you want to be sure you have the

8/3/2019 Assignment Zandro
http://slidepdf.com/reader/full/assignment-zandro 24/25
inventory to keep the momentum going. Conversely, if sales are coming up short of plan, the sooner
you adjust your inventory plans, and thus your scheduled receipts, the less likely you are to end up
with excess inventory that needs to be marked down at season's end.
The root cause of many inventory problems faced by small retailers is the lack of adequate preseasonsales and inventory planning. It may seem that there's never enough time for such planning, as if it's a
luxury that just can' t be afforded, but in reality, it's a critical necessity, a vital investment in the future
health of any small retailer.
Benefits of Inventory
Facts
Business owners usually create internal policies and procedures for inventory planning and control.
Managers and employees must follow these policies and procedures when handling the companys
inventory. Policies and procedures outline who can order inventory, how inventory flows through the
company, accounting policies for valuing inventory and procedures to deal with obsolete goods.
Inventory planning and control has several benefits for companies who derive the majority of their
revenue sales from inventory.
Better Cash Flow
Inventory planning and control can help companies manage cash flow. Small businesses do not have
large capital balances for purchasing copious amounts of inventory. Business owners implement policies
and procedures to limit the amount of money spent on inventory. Cash flow improvements also come
from purchasing the lowest cost inventory available in the business environment. Not only does low-
cost inventory save the company money, but it also allows companies to develop a cost advantage in the
economic market.
Higher Profits
Business owners can use inventory planning and control to generate higher profits. Purchasing the right
type of inventory to meet consumer demand often leads to higher business profits. Companies who sell
through their entire inventory multiple times each year also increases business profits. Inventory
planning and control procedures can also limit the amount of obsolete inventory in the company.
Obsolete inventory must be disposed of and written off by the company. Writing off obsolete inventory
creates a loss on the income statement.
Limits Abuse
Inventory policies and procedures prevent employee abuse of inventory. Loose work environments can
allow employees to steal inventory items for personal use. Stolen inventory results in a financial loss for
the company. Employees can also use a companys inventory items in the workplace for personal
reasons. Previously used inventory may be unsellable depending on the companys operating industry.
Proper employee behavior is a significant factor relating to inventory cash flow and profitability.

8/3/2019 Assignment Zandro
http://slidepdf.com/reader/full/assignment-zandro 25/25
Considerations
Business owners should consider implementing business technology to help manage inventory. Business
and accounting software provides business owners with electronic methods to order, receive, manage
and sell inventory. Technology usually helps business owners spend less time on inventory planning andcontrol functions. Spending less time on these back office functions allows business owners to remain at
the forefront of business sales in increasing their companys profitability.
REFERENCES
Indian Institute of Materials Management In pursuit of excellence in supply managementSuper Admin Published 24 August 2008International University (Management Science 2 ABI-301Ted Hurlbut 2004 (Productivity on Inventory Management)Doug Brilee (Inventory Management)