assignment 2 - media strategies and planning
TRANSCRIPT
0
Media Plan
Rachel Schmidt N00469892 April 7, 2016
Prepared for: Kathryn Saunders
AMM 5009 – Media Strategies and Planning
1
TABLE OF CONTENTS
Market Overview ....................................................................................................................................... 2 Purchase Behavior & Consumption Chart .............................................................................................. 3 Demographics ........................................................................................................................................... 4
Summary ................................................................................................................................................ 4 Demographics: Sex ............................................................................................................................... 5 Demographics: Age .............................................................................................................................. 6 Demographics: Language ................................................................................................................... 6 Demographics: Income ........................................................................................................................ 7 Demographics: Education .................................................................................................................... 8 Demographics: Employment status ................................................................................................... 10 Demographics: Vocation ................................................................................................................... 11 Demographics: Martial status ............................................................................................................ 12 Demographics: Children .................................................................................................................... 13
BDI / MDI ................................................................................................................................................... 14 Market Size ............................................................................................................................................... 15 Seasonality & Timing ............................................................................................................................... 16 Reach / Frequency / Continuity / Recency ......................................................................................... 17 Creative .................................................................................................................................................... 18 Media Selection ...................................................................................................................................... 19 Media Execution ..................................................................................................................................... 24 Achievement of Reach/Frequency/Continuity/Recency .................................................................. 30 Blocking Chart ......................................................................................................................................... 31 Budget Summary ..................................................................................................................................... 32 Regional Breakdown ............................................................................................................................... 33 Quarterly Breakdown .............................................................................................................................. 34 Cost Details .............................................................................................................................................. 35 References ............................................................................................................................................... 45

2
MARKET OVERVIEW
Air France is known as one of the world’s major passenger airlines. Air France is a subsidiary of Air-France-KLM Group1, serving 36 destinations in France and carrying passengers daily to 93 countries. In 2013, Air France-KLM carried 77.5 million passengers world wide2., Air France brings French style services, wine choices and premium food to air travel. Their flights to Paris have convenient connections to other European destinations as well as travelling to 231 international destinations3. The main destinations Air France flies to are London, Paris and Amsterdam. As more individuals travel every year, France has become a destination hot spot. France is the world’s leading tourist destination, with 83 million tourists. In 2014, tourism accounted for 7% of Frances overall GDP4. As spring is one of the slower periods to book travel from Canada to Europe, Air France is having a seat sale from April-May and June-October 2016. As seat sales have demonstrated the ability to generate sales depending on the price of the seats, Air France’s aim is to fill all the seats on scheduled flights during the seat sale. In order to accomplish this objective, Air France will significantly increase advertising efforts for the seat sale in order to aggressively promote the price of seats and communicate the number of flights and how often they fly from Toronto to Paris. In order to communicate the sale, advertising must drive awareness of the seat sale leading to individuals visiting AirFrance.ca as well as ticket sales.
1 Air France. (2014). The Company. Air France. 2 Air France. (2014). The Company – Passengers. Air France 3 Ibid 4 France Diplomatie. (October, 2013). France, The World’s Leading Tourist Destination. France Diplomatie.

3
PURCHASE BEHAVIOR & CONSUMPTION CHART Recommendation: It is recommended that Air France target the medium-heavy user group with their advertisements for their seat sales. The user group accounts for individuals who have traveled outside Canada (have taken vacation trips in the past 12 months – Overnight), 2 or more times. This is recommended as this group represents 94.1% of all users. Light users do not account for a large percentage of sales (only 5.9% of total purchases) and therefore should not be targeted at all although they are often reached.
Client: Air France Total Adult 18+ Base Population: 28,361.0 M Rationale: Air France should target Medium users as they account for 53% of the total purchases as well as heavy users, who account account for 41.1% of the total number of individuals who have traveled outside of Canada (have taken vacation trips), overnight in the past 12 months. The medium-heavy user group (2+ purchases) are an ideal group as they purchase flights the most often and are already repeat customers. Medium-heavy users combined account for 14.5 airline tickets on average yearly, whereas light users account for an average of 0.5 purchases yearly. It is important to target users who are repeat customers as they have the ability to use word-of-mouth as free advertising for Air France to generate new users that could potentially become medium-to-heavy purchasers of flights. Therefore, medium/heavy – 2+ purchase users are the target market.
Category % Population (000) % Purchasers Individual
Purchases Total # of
Purchases (000)
% Purchases (total
purchases) Any 39.8 100 - 38,946 100
Light (1) 16.2 40.74 0.5 2,297.50 5.9 Medium
(2-6) 18.2 45.74 4 20,636 53
Heavy (7+) 5.4 13.52 10.5 16,012.50 41.1

4
DEMOGRAPHICS
SUMMARY The target market for Air France’s seat sale are medium-heavy users between the ages of 35-64, who are either male or female with a skew towards females. Air France should target both English and French speaking Canadians with a slight skew towards English speaking Canadians. They should target individuals with a household income of $75,000 plus. Air France should target consumers who have a University or non-University certificate, individual’s who have a bachelor’s degree or individual with a post graduate degree or higher. Air France should also target individuals with any vocation (from professionals to primary workers). Air France should target these types of vocations and consumers should have full-time employment. They should target individuals who are either married or living together with no children. For Air France’s seat sale to succeed, they must ensure their advertising efforts reach their target market effectively.

5
DEMOGRAPHICS: SEX Recommendation: Target male and female consumers with a slight skew towards females.
Category Total Population (000)
Total Population (%)
Total Medium-Heavy User Group
Total Medium-Heavy User Group
(%) Index
Male 13,941 49.16 3,221 48.19 98
Female 14,420 50.84 3,463 51.81 102
Rationale: Males make up 49.16% of the Canadian population and females make up 50.84%. Both female and male are almost equal within the total medium-heavy user group. Males make up 48.19% of the total medium-heavy user group, whereas females make up 51.81% of the total medium-heavy user group. The female category index of 102 shows that females were 2% more likely to take vacation trips outside Canada in the past 12 months. Therefore, Air France’s advertisements should be slightly skewed towards a female demographic.
48%52%
USER GROUP - SEX
Male
Female
6
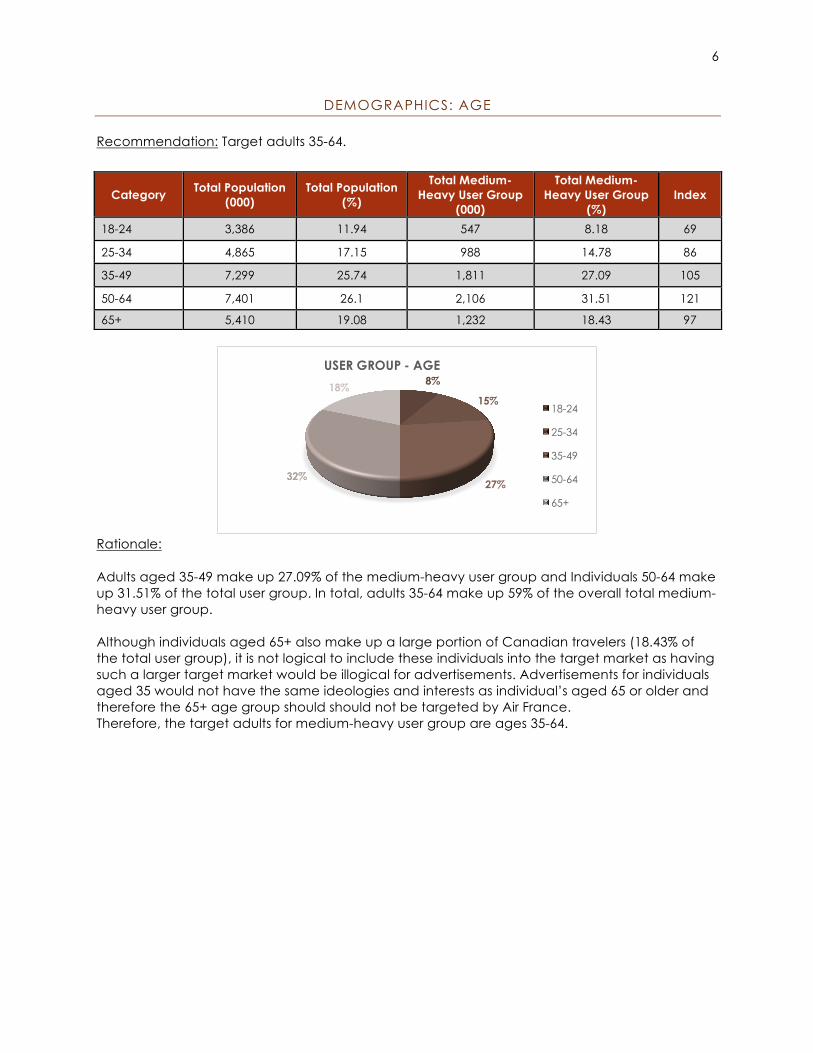
DEMOGRAPHICS: AGE Recommendation: Target adults 35-64.
Rationale: Adults aged 35-49 make up 27.09% of the medium-heavy user group and Individuals 50-64 make up 31.51% of the total user group. In total, adults 35-64 make up 59% of the overall total medium-heavy user group. Although individuals aged 65+ also make up a large portion of Canadian travelers (18.43% of the total user group), it is not logical to include these individuals into the target market as having such a larger target market would be illogical for advertisements. Advertisements for individuals aged 35 would not have the same ideologies and interests as individual’s aged 65 or older and therefore the 65+ age group should should not be targeted by Air France. Therefore, the target adults for medium-heavy user group are ages 35-64.
8%
15%
27%32%
18%
USER GROUP - AGE
18-24
25-34
35-49
50-64
65+
Category Total Population (000)
Total Population (%)
Total Medium-Heavy User Group
(000)
Total Medium-Heavy User Group
(%) Index
18-24 3,386 11.94 547 8.18 69
25-34 4,865 17.15 988 14.78 86
35-49 7,299 25.74 1,811 27.09 105
50-64 7,401 26.1 2,106 31.51 121
65+ 5,410 19.08 1,232 18.43 97
7
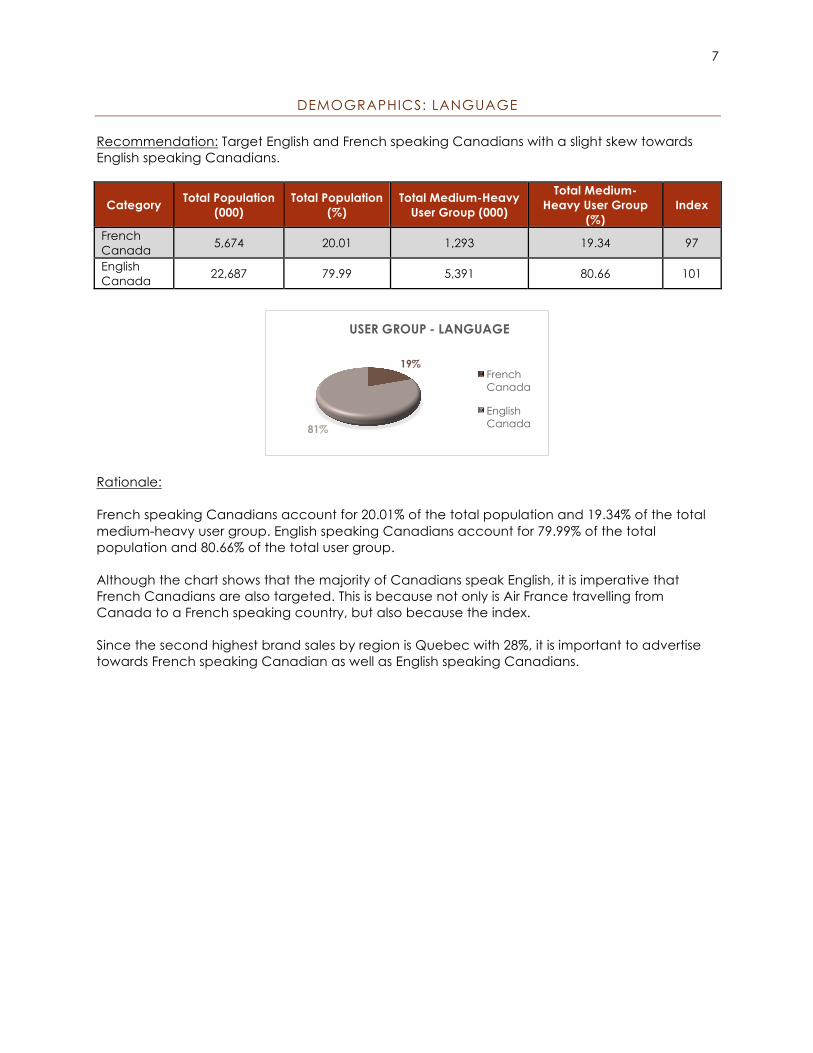
DEMOGRAPHICS: LANGUAGE Recommendation: Target English and French speaking Canadians with a slight skew towards English speaking Canadians.
Category Total Population (000)
Total Population (%)
Total Medium-Heavy User Group (000)
Total Medium-Heavy User Group
(%) Index
French Canada 5,674 20.01 1,293 19.34 97
English Canada 22,687 79.99 5,391 80.66 101
Rationale: French speaking Canadians account for 20.01% of the total population and 19.34% of the total medium-heavy user group. English speaking Canadians account for 79.99% of the total population and 80.66% of the total user group. Although the chart shows that the majority of Canadians speak English, it is imperative that French Canadians are also targeted. This is because not only is Air France travelling from Canada to a French speaking country, but also because the index. Since the second highest brand sales by region is Quebec with 28%, it is important to advertise towards French speaking Canadian as well as English speaking Canadians.
19%
81%
USER GROUP - LANGUAGE
French Canada
English Canada
8
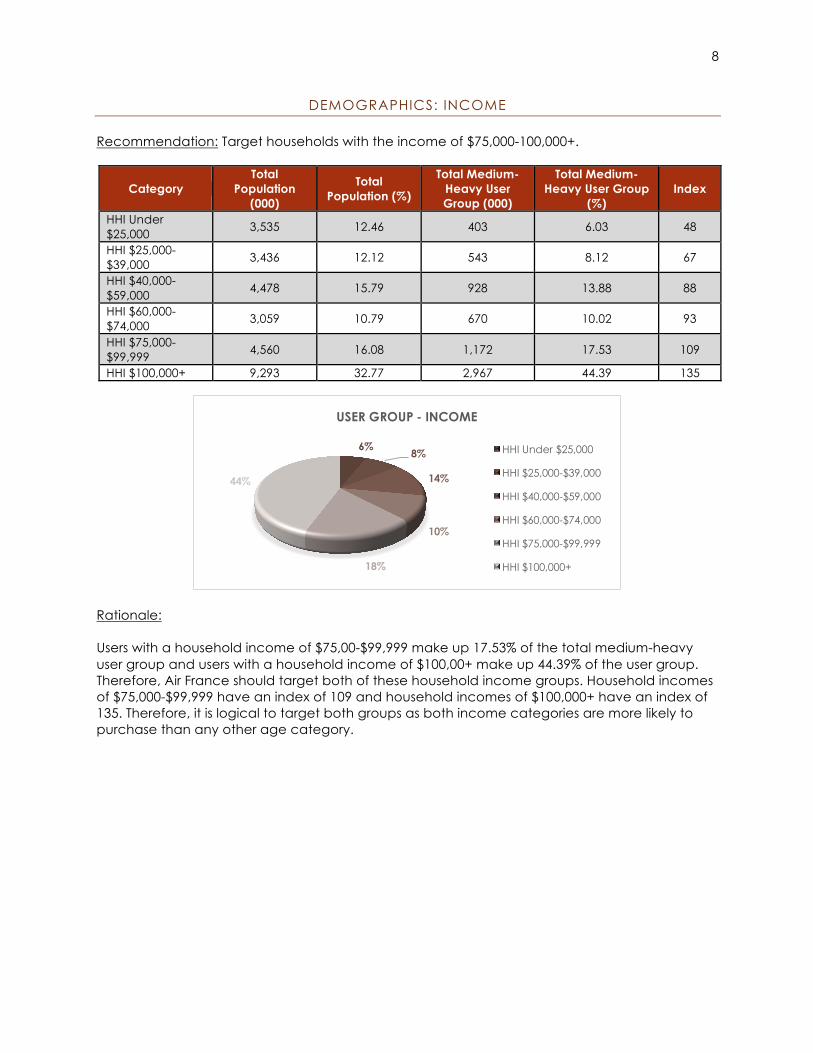
DEMOGRAPHICS: INCOME Recommendation: Target households with the income of $75,000-100,000+.
Category Total
Population (000)
Total Population (%)
Total Medium-Heavy User Group (000)
Total Medium-Heavy User Group
(%) Index
HHI Under $25,000 3,535 12.46 403 6.03 48
HHI $25,000-$39,000 3,436 12.12 543 8.12 67
HHI $40,000-$59,000 4,478 15.79 928 13.88 88
HHI $60,000-$74,000 3,059 10.79 670 10.02 93
HHI $75,000-$99,999 4,560 16.08 1,172 17.53 109
HHI $100,000+ 9,293 32.77 2,967 44.39 135
Rationale: Users with a household income of $75,00-$99,999 make up 17.53% of the total medium-heavy user group and users with a household income of $100,00+ make up 44.39% of the user group. Therefore, Air France should target both of these household income groups. Household incomes of $75,000-$99,999 have an index of 109 and household incomes of $100,000+ have an index of 135. Therefore, it is logical to target both groups as both income categories are more likely to purchase than any other age category.
6% 8%
14%
10%
18%
44%
USER GROUP - INCOME
HHI Under $25,000
HHI $25,000-$39,000
HHI $40,000-$59,000
HHI $60,000-$74,000
HHI $75,000-$99,999
HHI $100,000+

9
DEMOGRAPHICS: EDUCATION Recommendation: Target individuals who have a university / other non-university certificate, individuals with a bachelor degree, and individuals with a post graduate degree or higher.
Category Total
Population (000)
Total Population
(%)
Total Medium-Heavy User Group
(000)
Total Medium-
Heavy User Group (%)
Index
No Certificate or Diploma 3,772 13.3 551 8.24 62 Secondary/High School Graduate 7,261 25.6 1,411 21.11 82
Trade Certificate/Diploma 3,362 11.85 731 10.94 92 University/Other Non-University Cert. 6,594 23.25 1,688 25.25 109
Bachelors Degree 4,732 16.68 1,445 21.62 130 Post Graduate+ Degree 2,639 9.31 858 12.84 138
Rationale: Air France should target individuals within the medium-heavy user group with a university/other non-university certificate because they make up 25.25% of the total user group. Individuals with a bachelor degree make up 21.62% and post graduate degrees make up 12.84%. Therefore, the total target group with a university education makes up 59.51% of the total medium-heavy user group. It is interesting to note that although only 12.84% of the medium-heavy user group have a post graduate degree or higher, they only account for 9.31% of the total population. This means that because they account for such a small percentage of the total population, the index should also be taken into account. The post graduate+ degree category has an index of 138 and therefore, these individuals were 38% more likely to purchase vacation trips in the last 12 months and are more likely to purchase than any other education category, although they only account for 12.84% of the medium-heavy user group.
8%21%
11%25%
22%
13%
USER GROUP - EDUCATION No Certificate or Diploma
Secondary/High School GraduateTrade Certificate/Diploma
University/Other Non-University Cert.Bachelors Degree
Post Graduate+ Degree
10
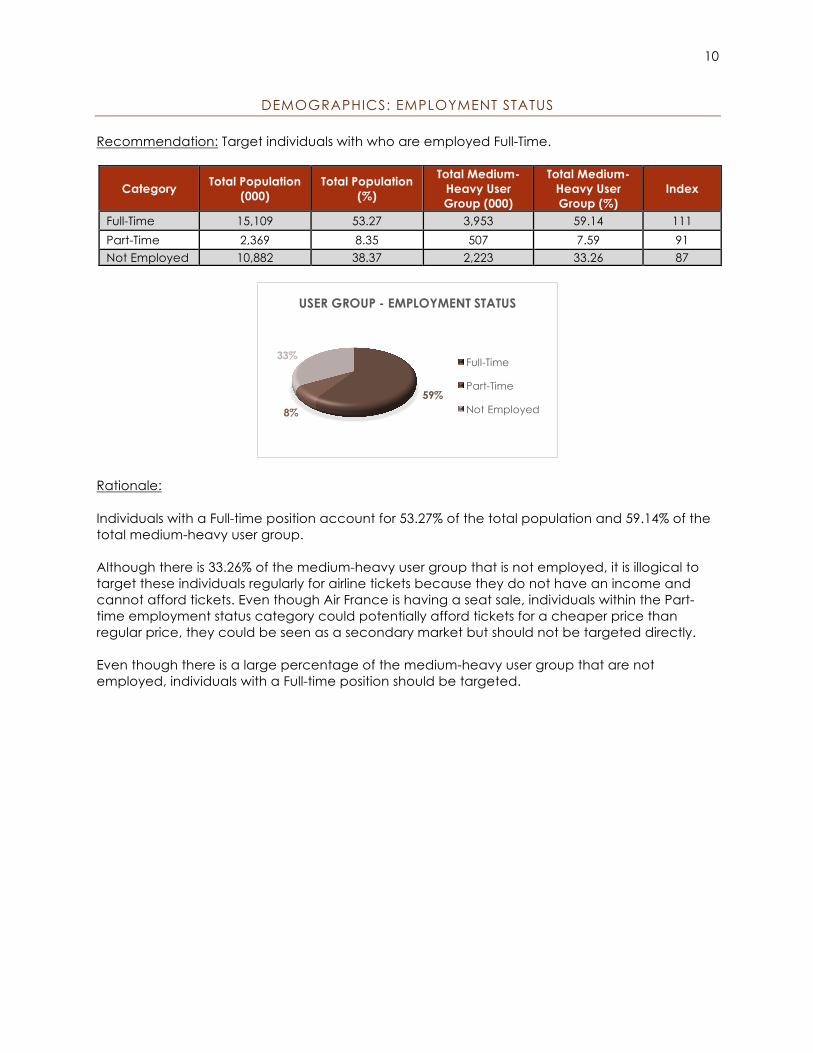
DEMOGRAPHICS: EMPLOYMENT STATUS Recommendation: Target individuals with who are employed Full-Time.
Category Total Population (000)
Total Population (%)
Total Medium-Heavy User Group (000)
Total Medium-Heavy User Group (%)
Index
Full-Time 15,109 53.27 3,953 59.14 111 Part-Time 2,369 8.35 507 7.59 91 Not Employed 10,882 38.37 2,223 33.26 87
Rationale: Individuals with a Full-time position account for 53.27% of the total population and 59.14% of the total medium-heavy user group. Although there is 33.26% of the medium-heavy user group that is not employed, it is illogical to target these individuals regularly for airline tickets because they do not have an income and cannot afford tickets. Even though Air France is having a seat sale, individuals within the Part-time employment status category could potentially afford tickets for a cheaper price than regular price, they could be seen as a secondary market but should not be targeted directly. Even though there is a large percentage of the medium-heavy user group that are not employed, individuals with a Full-time position should be targeted.
59%8%
33%
USER GROUP - EMPLOYMENT STATUS
Full-Time
Part-Time
Not Employed
11
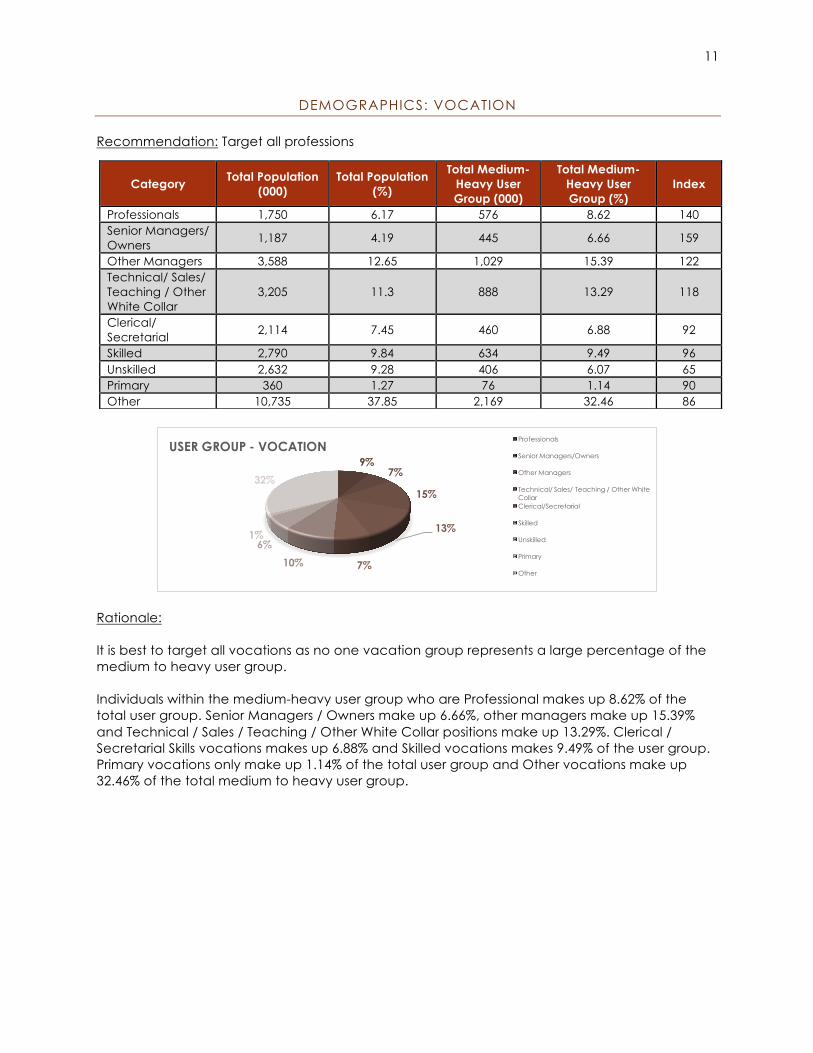
DEMOGRAPHICS: VOCATION Recommendation: Target all professions
Rationale: It is best to target all vocations as no one vacation group represents a large percentage of the medium to heavy user group. Individuals within the medium-heavy user group who are Professional makes up 8.62% of the total user group. Senior Managers / Owners make up 6.66%, other managers make up 15.39% and Technical / Sales / Teaching / Other White Collar positions make up 13.29%. Clerical / Secretarial Skills vocations makes up 6.88% and Skilled vocations makes 9.49% of the user group. Primary vocations only make up 1.14% of the total user group and Other vocations make up 32.46% of the total medium to heavy user group.
9%7%
15%
13%
7%10%6%
1%
32%
USER GROUP - VOCATIONProfessionals
Senior Managers/Owners
Other Managers
Technical/ Sales/ Teaching / Other White CollarClerical/Secretarial
Skilled
Unskilled
Primary
Other
Category Total Population (000)
Total Population (%)
Total Medium-Heavy User Group (000)
Total Medium-Heavy User Group (%)
Index
Professionals 1,750 6.17 576 8.62 140 Senior Managers/ Owners 1,187 4.19 445 6.66 159
Other Managers 3,588 12.65 1,029 15.39 122 Technical/ Sales/ Teaching / Other White Collar
3,205 11.3 888 13.29 118
Clerical/ Secretarial 2,114 7.45 460 6.88 92
Skilled 2,790 9.84 634 9.49 96 Unskilled 2,632 9.28 406 6.07 65 Primary 360 1.27 76 1.14 90 Other 10,735 37.85 2,169 32.46 86
12
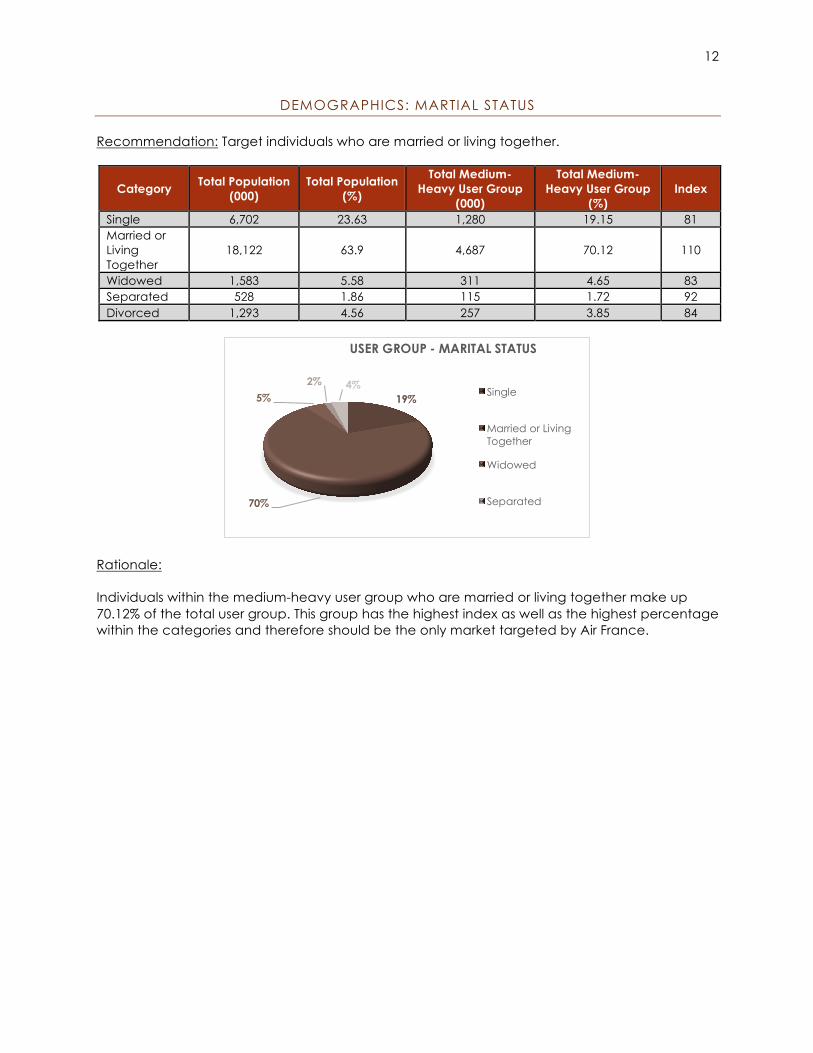
DEMOGRAPHICS: MARTIAL STATUS Recommendation: Target individuals who are married or living together.
Category Total Population (000)
Total Population (%)
Total Medium-Heavy User Group
(000)
Total Medium-Heavy User Group
(%) Index
Single 6,702 23.63 1,280 19.15 81 Married or Living Together
18,122 63.9 4,687 70.12 110
Widowed 1,583 5.58 311 4.65 83 Separated 528 1.86 115 1.72 92 Divorced 1,293 4.56 257 3.85 84
Rationale: Individuals within the medium-heavy user group who are married or living together make up 70.12% of the total user group. This group has the highest index as well as the highest percentage within the categories and therefore should be the only market targeted by Air France.
19%
70%
5%2% 4%
USER GROUP - MARITAL STATUS
Single
Married or Living Together
Widowed
Separated

13
DEMOGRAPHICS: CHILDREN Recommendation: Target individuals who do not have children greater than 18 in the household.
Category Total
Population (000)
Total Population (%)
Total Medium-Heavy User Group
(000)
Total Medium-Heavy User Group
(%) Index
Household Composition Presence of Children Under 18
9,636 33.98 2,107 31.52 93
No Children 18,725 66 4,577 68.48 103
Rationale: Individuals within the total medium-heavy user group who do not have children make up 68.48% of the total user group and 66% of the total population. Therefore, Air France should target only individuals who do not have children for their seat sale. Although the household with children under 18 should not be dismissed completely, Air France should first target households without children for this advertising campaign
32%
68%
USER GROUP - CHILDREN
Household Composition Presence of Children Under 18
No Children

14
BDI / MDI
Region Population (000)
Population (% of Total)
Brand Sales (%)
Brand Development
Index (%)
Market (Category Sales) (%)
Market Development Index (MDI)
Atlantic 1,941 6.84 4 58 4.74 69 Quebec 6,665 23.5 28 119 21.23 90 Ontario 10,907 38.46 40 104 41.48 108 Prairies 5,069 17.87 19 106 18.72 105 British Columbia 3,778 13.32 8 60 13.83 104
Implications: Atlantic: The brand is not doing well compared to the market development. It is recommended that Air France increase spending or allocate funds from another region such as Quebec to increase the BDI for this region. Quebec: Air France’s brand is doing very well in this market. Compared to the market development, the brand is doing better. It is recommended that Air France decrease spending or allocate funds to other regions. Ontario: Air France’s brand is doing very well within this region. The Brand development index is similar to the market development index. It is recommended that the budget be maintained in this region or a slight increase in budget for this region, possibly allocating a small amount of funds from Quebec. Prairies: The brand is doing well in this region, and although the market index is slightly higher than the brand, it is recommended that no change occur. British Columbia: This region is extremely under over developed by the brand. It is recommended Air France increase spending in British Columbia or allocate funds to other regions such as Quebec.
15
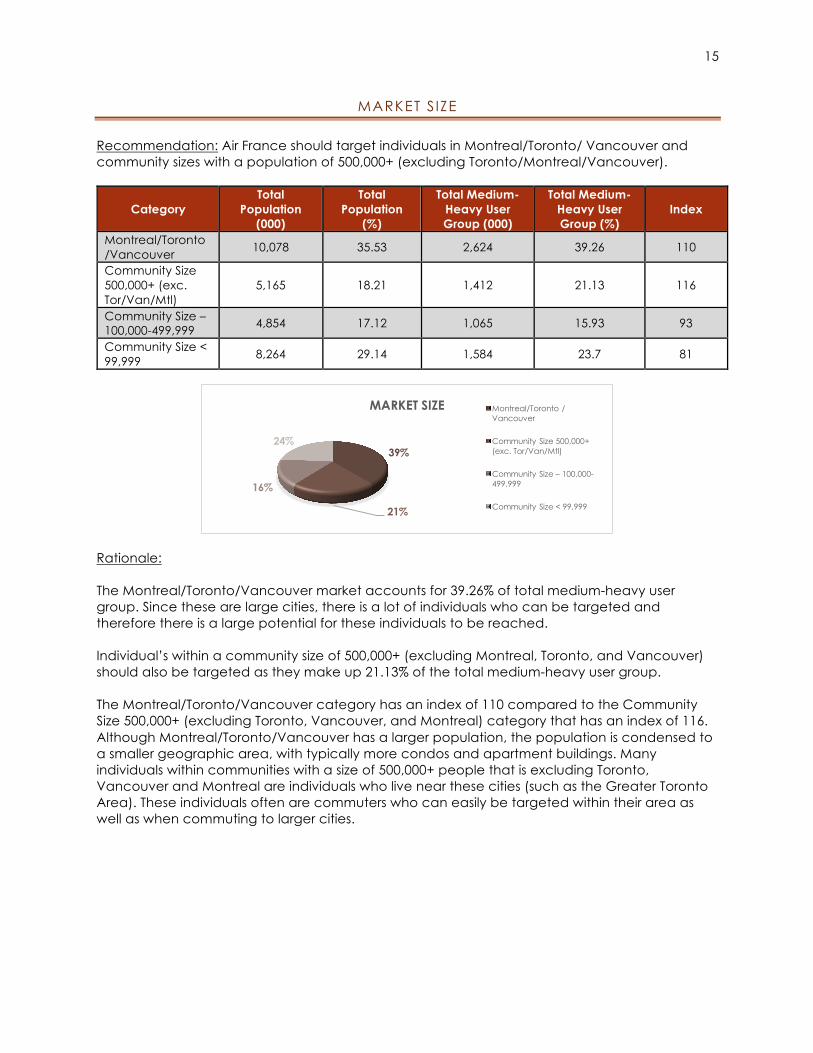
MARKET S IZE Recommendation: Air France should target individuals in Montreal/Toronto/ Vancouver and community sizes with a population of 500,000+ (excluding Toronto/Montreal/Vancouver).
Category Total
Population (000)
Total Population
(%)
Total Medium-Heavy User Group (000)
Total Medium-Heavy User Group (%)
Index
Montreal/Toronto /Vancouver 10,078 35.53 2,624 39.26 110
Community Size 500,000+ (exc. Tor/Van/Mtl)
5,165 18.21 1,412 21.13 116
Community Size – 100,000-499,999 4,854 17.12 1,065 15.93 93
Community Size < 99,999 8,264 29.14 1,584 23.7 81
Rationale: The Montreal/Toronto/Vancouver market accounts for 39.26% of total medium-heavy user group. Since these are large cities, there is a lot of individuals who can be targeted and therefore there is a large potential for these individuals to be reached. Individual’s within a community size of 500,000+ (excluding Montreal, Toronto, and Vancouver) should also be targeted as they make up 21.13% of the total medium-heavy user group. The Montreal/Toronto/Vancouver category has an index of 110 compared to the Community Size 500,000+ (excluding Toronto, Vancouver, and Montreal) category that has an index of 116. Although Montreal/Toronto/Vancouver has a larger population, the population is condensed to a smaller geographic area, with typically more condos and apartment buildings. Many individuals within communities with a size of 500,000+ people that is excluding Toronto, Vancouver and Montreal are individuals who live near these cities (such as the Greater Toronto Area). These individuals often are commuters who can easily be targeted within their area as well as when commuting to larger cities.
39%
21%
16%
24%
MARKET SIZE Montreal/Toronto / Vancouver
Community Size 500,000+ (exc. Tor/Van/Mtl)
Community Size – 100,000-499,999
Community Size < 99,999

16
SEASONALITY & T IMING Recommendation: Air France should advertise their seat sale more heavily during the first and second quarter, while focusing also on the first quarter leading up to the months that the seat sale will occur within.
Quarter Months Recommended % Allocation of Media Budget
Q1 JFM 1.1 Q2 AMJ 47.9 Q3 JAS 42.5 Q4 OND 8.5
Rationale: Because there is currently no data available, the data above is the most logical percentage of Air France’s budget that should be used for advertising over the fiscal year in order to effectively promote their seat sale. Within the first quarter, 1.1% of Air France’s budget should be used in order to promote the upcoming seat sale in the second, third and first month of the fourth quarter. Within the first quarter, it is expected that most individuals will retain the message with a budget like this in order for Air France to effectively receive customers purchasing tickets within the second and third quarter. However, because they consumers are unable to find out any details about the flight times, days and prices, it is illogical to spend a high amount of the budget within the first quarter Since the second quarter is the beginning of the seat sale (starting in April) it is imperative that Air France use the highest amount of their budget at that time. Allocating 47.9% of their budget to this quarter reinforces the message of the seat sale and drives individuals towards the Air France website. Aggressive advertising is essential during this period as it is the most likely way to drive individuals to the site. The third quarter, 42.5% of the advertising budget should be used. This again reinforces throughout the seat sale dates Air Frances message and again brings people towards the site and therefore towards purchasing tickets. Within the fourth quarter, 8.5% of the advertising budget should be used to reinforce the last month of the seat sale. After this time, advertising messages do not need to be as strong as the seat sale is over. The main use of advertising in the fourth quarter is to remind people to continue to fly with Air France and look out for future promotions Air France may have.

17
REACH / FREQUENCY / CONTINUITY / RECENCY Recommendation: Air France should use continuity advertisements in the first quarter. Throughout both the second and third quarter, they should focus on reach, to get as many consumers to see the seat sale as it is in progress. Finally, in the fourth quarter.
QUARTER REACH/FREQUENCY/CONTINUITY/RECENCY JFM Recency AMJ Reach JAS Reach OND Frequency
Rationale: Air France’s seat sale occurs between April-May and June-October. Based on this information, it is important to advertise around each of the seat sales. Air France’s first seat sale occurs over April, May and June, which is throughout the entire second quarter. Based on this information, it is recommended that within the first quarter recency is used. The scheduling of consistent advertising within the first quarter means that individuals with be exposed to Air France’s advertising message, they will become aware of the seat sale, and continue to recall the information about Air France’s seat sale into the second quarter. Within the second quarter, Reach should be used in order to reach as many individuals and expose as many individuals to the message as possible. Since the seat sale will occur over the entire second quarter, Air France must ensure they reach as many individuals as possible in order to get the information about the seat sale across to as much of the target market as possible. Reach should also be used within the third quarter as the seat sale will continue starting in the second quarter and throughout the third quarter. Once again it is imperative for Air France to reach as many potential customers as possible and ensure that they are reaching their target market with their message. The first month of the fourth quarter (October), is the last month of Air Frances seat sale. Therefore, it is important to use recency advertising in order to reinforce the message of the seat sale and have consumers recall the message for later seat sales or promotions by Air France.
18
CREATIVE Recommendation: Overall, it is recommended that Air France use media formats that create awareness of the seat sale and reach large portions of the medium-heavy user group. Advertisements with visual stimulation as well as the ability to reach high amounts of the target market are the most effective forms of media for Air France’s seat sale. Rationale: It is important for Air France to choose a medium that individuals are attracted to and that can make a connection to consumers. It is important that Air France attract individuals who like to fly and individuals who like to travel as they are more likely to want to take advantage of a seat sale. The advertisements must be able to reach large amounts of the target user group. Since visual media allows for brightly colored advertisements, individuals will be attracted to ads that are bright, colorful, and show off locations that Air France will be flying to. These visual forms of media can resonate in the minds of consumers for long periods of time and lead to individuals using word-of-mouth in order to talk to other potential consumers about the advertisement for the seat sale that they saw. Multiple media formats must able to able to be effective when used to meet continuity, reach and frequency goals.

19
MEDIA SELECTION
Recommendation: It is recommended for Air France to use Television as the primary medium and Magazines as a secondary medium and Outdoor as a tertiary medium for their media plan for the campaign period of April-May and June-October.

20
PRIMARY MEDIUM – TELEVISION
Recommendation: It is recommended Air France use Television as its primary medium to reach the target user group.
Television Quintile
Quintile Category
Total Population
(000) Total Population
(%) Total Medium Heavy
Users (000) Total User Group (%) Index
Q1 Heavy 5675 20.01 1030 15.41 77
Q2 Medium Heavy 5850 20.63 1465 21.92 106
Q3 Medium 5483 19.33 1505 22.52 116
Q4 Medium Light 5814 20.5 1512 22 110
Q5 Light 5539 19.53 1172 17.53 90 Rationale: Medium to heavy users of travel outside of Canada – vacation trips in the last 12 months (overnight), are medium television viewers. With a total user group percentage of 22.52% and an index of 116, these individuals are more likely to be medium viewers of television compared to the total Canadian population. Collectively, the medium quintile of 22.52%, the medium heavy quintile of 21.92% and the heavy quintile of 15.41% make up 59.85% of the total medium to heavy user group. According to PMB, medium to heavy users are living in all markets and communities where television is easily accessible and easy to reach these markets. Based also upon the demographic of adults aged 35-64, who have a household income of $75,000 plus, television shows and advertisements are easy to reach this market. Therefore, television should be the primary medium to reach the medium to heavy user group.
21
SECONDARY MEDIUM – MAGAZINE
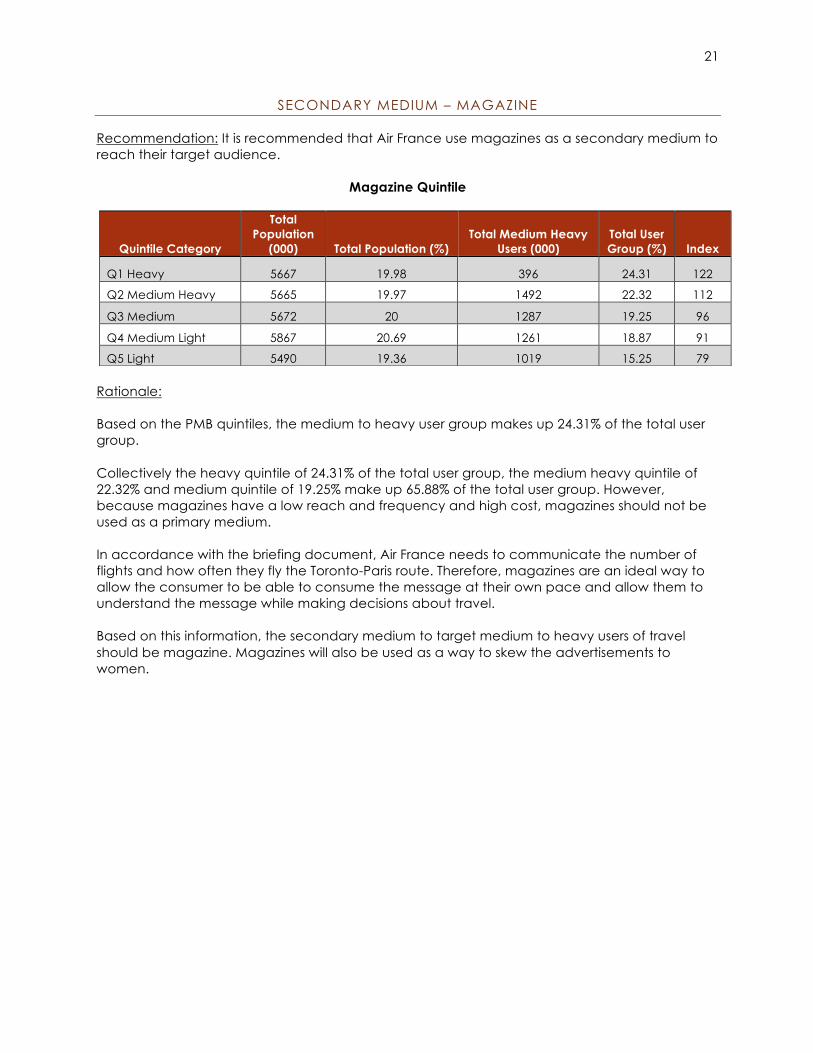
Recommendation: It is recommended that Air France use magazines as a secondary medium to reach their target audience.
Magazine Quintile
Rationale: Based on the PMB quintiles, the medium to heavy user group makes up 24.31% of the total user group. Collectively the heavy quintile of 24.31% of the total user group, the medium heavy quintile of 22.32% and medium quintile of 19.25% make up 65.88% of the total user group. However, because magazines have a low reach and frequency and high cost, magazines should not be used as a primary medium. In accordance with the briefing document, Air France needs to communicate the number of flights and how often they fly the Toronto-Paris route. Therefore, magazines are an ideal way to allow the consumer to be able to consume the message at their own pace and allow them to understand the message while making decisions about travel. Based on this information, the secondary medium to target medium to heavy users of travel should be magazine. Magazines will also be used as a way to skew the advertisements to women.
Quintile Category
Total Population
(000) Total Population (%) Total Medium Heavy
Users (000) Total User Group (%) Index
Q1 Heavy 5667 19.98 396 24.31 122
Q2 Medium Heavy 5665 19.97 1492 22.32 112
Q3 Medium 5672 20 1287 19.25 96
Q4 Medium Light 5867 20.69 1261 18.87 91
Q5 Light 5490 19.36 1019 15.25 79

22
TERTIARY MEDIUM – OUTDOOR
Recommendation: It is recommended as a tertiary medium that Air France use Outdoor media in order to reach their target market. Rationale: According to PMB, the target user group are individuals who live in regions with 500,000+ individuals. Since outdoor media is a great way to reach individual’s either commuting to work or individuals who drive within the city. Therefore, the target audience can easily be exposed to advertising messages with the use of outdoor media.

23
OTHER MEDIA CONSIDERED BUT REJECTED
The following media were considered for Air France’s media plan, however, due to various reasons they were not chosen. The user group does actively use all the other media considered but not chosen, however based of suitability of each medium for Air France’s seat sale as well as budget limitations, the following media were not chosen. Newspaper The newspaper medium was considered for Air France’s seat sale campaign. The media briefing document states that competitor’s activity has been newspapers as well as magazines. However, based on the quintiles for magazines, for the medium-heavy user group, 41.64% of the user group are light consumers of newspapers, 4.88% are medium-light and 21.44% are medium users of magazine. Altogether, 67.96% of the medium-heavy user group of travel outside Canada within the last 12 months are medium to light users of newspapers. Although print media can have more target audiences, create a strong engagement with readers and has a great recall, because of declining readership of newspapers, lack of quality of reproduction and the lead time for print media, it is not recommended that Air France continue with competitor activity and advertise their seat sale within the newspaper medium. Radio Although radio was also considered for Air Frances seat sale, due to budget limitations and the imperativeness of television as a primary medium, radio was not chosen. Radio was also not chosen due to lack of visual impact for the campaign. Often times, individuals need to be able to see information such as prices and dates of flights. Therefore, print, television, and outdoor (visual forms of media) are better for individuals to see the necessary information.
24
MEDIA EXECUTION
PRIMARY MEDIUM – TELEVISION
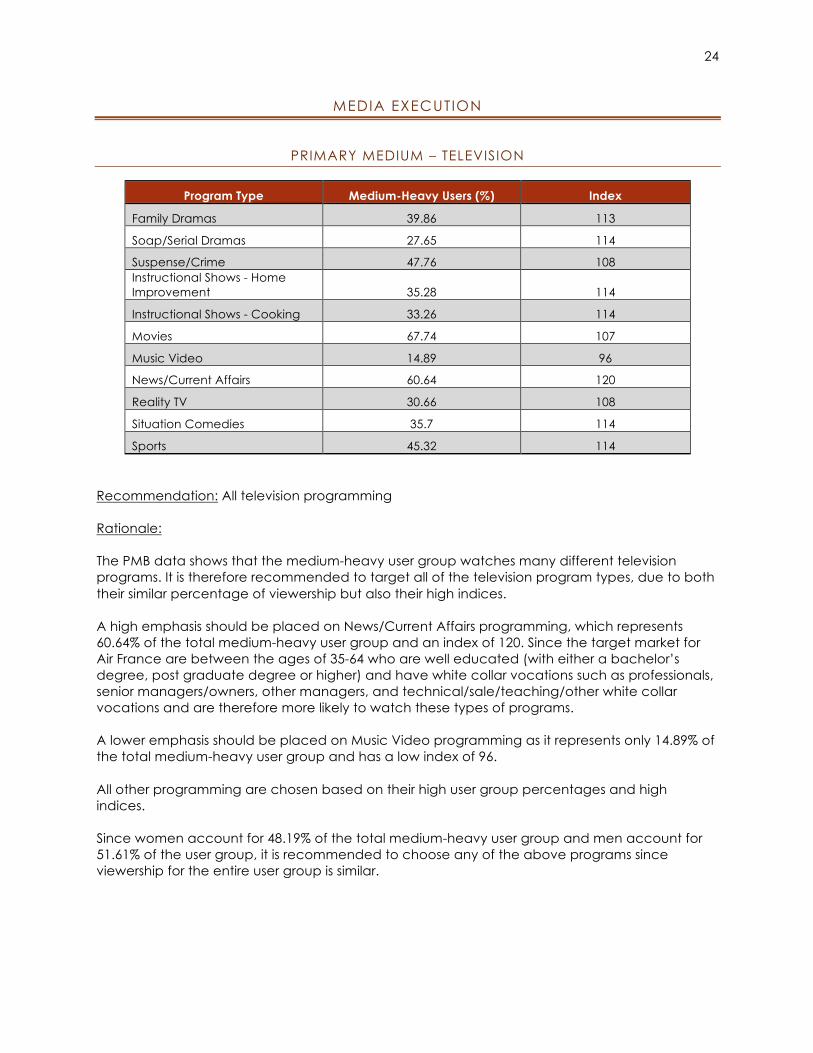
Program Type Medium-Heavy Users (%) Index
Family Dramas 39.86 113
Soap/Serial Dramas 27.65 114
Suspense/Crime 47.76 108 Instructional Shows - Home Improvement 35.28 114
Instructional Shows - Cooking 33.26 114
Movies 67.74 107
Music Video 14.89 96
News/Current Affairs 60.64 120
Reality TV 30.66 108
Situation Comedies 35.7 114
Sports 45.32 114 Recommendation: All television programming Rationale: The PMB data shows that the medium-heavy user group watches many different television programs. It is therefore recommended to target all of the television program types, due to both their similar percentage of viewership but also their high indices. A high emphasis should be placed on News/Current Affairs programming, which represents 60.64% of the total medium-heavy user group and an index of 120. Since the target market for Air France are between the ages of 35-64 who are well educated (with either a bachelor’s degree, post graduate degree or higher) and have white collar vocations such as professionals, senior managers/owners, other managers, and technical/sale/teaching/other white collar vocations and are therefore more likely to watch these types of programs. A lower emphasis should be placed on Music Video programming as it represents only 14.89% of the total medium-heavy user group and has a low index of 96. All other programming are chosen based on their high user group percentages and high indices.
Since women account for 48.19% of the total medium-heavy user group and men account for 51.61% of the user group, it is recommended to choose any of the above programs since viewership for the entire user group is similar.

25
SECONDARY MEDIUM – MAGAZINE
Program Type Medium-Heavy Users ( %) Index
Canadian Living 12.37 119
Canadian Health & Lifestyle 4.38 96
Chatelaine 10.47 125
Chatelaine (FR) 2.56 102
Coup de pouce 4.05 117
Flare 2.89 109
LOULOU 1.3 95
Maclean's 7.65 126
Reader's Digest 13.94 110
Report on Business Magazine 4.4 145
Selection du Reader's Digest 2.14 103
Financial Post Magazine 2.6 134 Recommendation: Chatelaine (EN), Chatelaine (FR), Report on Business, Coup de Pouce, & Maclean’s Magazine. Rationale: Since it is recommended to target both English and French speaking Canadians, it is important to include both English and French magazine publications. Chatelaine (EN) was chosen as a magazine type as it makes up 10.47% of the medium-heavy user group and has a high index of 125. These magazines can also be used to slightly skew the readership to target more females as they account for just over half of the total medium-heavy user group. Chatelaine (FR) was chosen based on it’s ability to reach the French demographic and had a higher index than other French magazines such as Selection du Reader’s Digest. Report on Business was chosen based on it’s extremely high index of 145. As well, individuals who read Report on Business are often business individuals – who hold white collar jobs, similar to those of the target medium-heavy user group. Coup de Pouce was chosen as it has a high index of 117 and a high distribution in Quebec. Maclean’s Magazine was chosen because of its high index 126. Also the fact that it’s content and target market for readers are similar to the medium-heavy user group demographic. Although Canadian Living was considered and costed, other publications had a higher index and lower cost, and therefore were considered more appropriate for targeting the medium-heavy user group. Financial Post Magazine was also considered, however, because it has not supplied CardOnline with it’s circulation, Report on Business and Maclean’s Magazine were more suitable for Air France’s campaign.

26
TERTIARY MEDIUM – OUTDOOR
Rationale: According to PMB, the Montreal/Toronto/Vancouver market account for 39,26% of the medium-heavy users group. Individuals who live in community’s sizes with 500,000+ individuals account for 21.13% of the medium-heavy user group. In total, 52.39% of the medium-heavy user group live in markets with 500,000+ individuals. Therefore, outdoor media is an excellent way to reach both commuters going in and out of the city but also individuals within the user group who reside within cities such as Montreal/Toronto/Vancouver. Not all areas with high populations are available for billboard purchases. Such as the east coast of Canada, the only area available for purchasing billboards is Halifax, an area with a population below 500,000. However, Halifax does have an airport and individuals from all of Canada come to tour areas surrounding Halifax around the summer months. As well, Saskatoon is only available for purchase, however, a higher amount of billboards in the Saskatoon area can create recall for individuals within the surrounding area. Therefore, although some areas do have lower than a population of 500,000, these areas are also areas where individuals from the regions surrounding it will come to visit. Therefore, outdoor media placed within city centers and within areas with populations of 500,000+ as well as areas that are only available for purchase in certain areas such as Halifax for the east coast and Saskatoon for Saskatchewan are recommended for Air France’s seat sale.
27
Scheduling Patterns/Market List/Advertisement Size & Duration
Television Schedule Since television is costly, television will only be used in the second Quarter, when Air France’s campaign begins. Television commercials will be run 0:30 throughout the national campaign. Higher weights will be used for the beginning of the campaign as well as in Toronto as Canada’s busiest (Pearson) is in Toronto. Because this is a new product, the schedule will run as a new product introduction, high weights for the initial launch period will provide the campaign will an aggressive strategy and then a sustaining period until the end of the campaign. Throughout the first part of the seat sale that will run from April-May, Television will run at 110 GRP in All regions with the exception of Toronto, which will run at 120 GRP’s. The first flight will run until the second week in June at which time there will be 2-week hiatus. Since the first hiatus will be in the beginning of the second part of the seat sale, seasonal schedule will be used as it allows in the third quarter for higher weights than the fourth quarter, and will account for individuals travelling around the summer months. The campaign will run with 100 GRP’s for four weeks before a second hiatus of four weeks. Although this is during the middle of the campaign, other media will be used to account for the lack of television. The end of the third quarter will maintain the 100 GRP’s and will run for seven weeks nationally. Within the forth quarter, television will run at a lower weight of 80 GRP’s nationally. This is to account for the back-to-work period within the fall. As the campaign ends in October, television will be lower weights for less amount of time. Some regions will extend the television campaign for 4 weeks (such as Quebec and BC) in order to increase their brand sales in that region. Market Pattern According to PMB, the medium-heavy user group of travel outside of Canada in the past 12 months overnight live in market sizes of 500,000+. This will ensure that all markets are exposed to television. Having equal rating points within the markets will ensure all markets are exposed equally to the advertising message with emphasis on the largest Canadian city of Toronto. Advertisement Size & Duration According to the Media Brief, the media is required to drive awareness of the seat sale leading to site visits at AirFrance.ca and ticket sales. Therefore, television can be used to bring about ad recall and give a call for action using visual and auditory media to drive the target market to AirFrance’s website.

28
Scheduling Patterns/Market List/Advertisement Size & Duration Cont.
Magazines Schedule Magazines will be release starting in the first quarter. They will be used to create awareness before the campaign has begun. Because a lot of individuals don’t open magazines right away, this also gives time for individuals who delay readership. The first quarter ads will be 4th Cover, 4 color ad in Report on Business and a Full Page, 4 Color ad in Chatelaine (FR). Within the second quarter, the majority of magazine ads will be run. Every other month Chatelaine (EN) will flight a Full Page, 4 Color ad. This will ensure that individuals are exposed at least once every other month and can help for ad recall for Chatelaine. Report on business will also run in May of the second quarter on the 4th Cover, 4 Color. Coup de pouce will run every other month with Double Page Spreads, catching the eye of French readers. Maclean’s will run one ad during the second quarter as a 3 2/3 h/2 col ad. Chatelaine (FR) will also run a Full Page, 4 Color ad to assist in the increase of French readers. In the third quarter, there will be less magazines run as it is the middle of the campaign. Chatelaine (EN) will run 1 Full Page, 4 Color, Report on Business will run 1 4th Cover, 4 Color, Coup de Pouce will run 1 Double Page Spread, Maclean’s will run 2 3 2/3 h/2 col ads and Chatelaine (FR) will run 1 Full Page, 4 color ad. Finally, within the fourth quarter no magazines will be ran. This is because the campaign is only within one month of the fourth quarter and enough magazines have run with large ad sizes that should be eye catching to readers and therefore create ad recall when paired with Television and Outdoor. Market Pattern According to PMB, the medium-heavy user group of travel outside of Canada in the past 12 months overnight live in market sizes of 500,000+. The media choices will ensure that all markets are exposed to television, magazines and out of home advertisements. Advertisement Size & Duration Since the media used needs to drive sales as well as individuals to the Air France website, a visual medium such as magazines will allow users to absorb the message and return to the message if necessary. The overall large sizes of the advertisement will also be eye catching so that individuals are able to clearly see the message.
29
Scheduling Patterns/Market List/Advertisement Size & Duration Cont.
Outdoor Out of home media will run in three markets. Two of these markets will have populations of under 500,000. According to PMB, 39.63% of the target market live in communities will 499,999 individuals or less. Because there is a decent percentage of the population who live in smaller communities, it is accepted to have billboard in these areas as discussed in the market pattern. Halifax will have 8 weeks of billboards at 25 GRP’s within the first quarter. Saskatoon will have 8 weeks also within the first quarter at 50 GRP’s and Edmonton will have 8 weeks of 25 GRP’s within the first quarter. Within the second quarter, Halifax will have 8 weeks’ flight with a 3-week hiatus in between each 4 weeks of the scheduling. The hiatus is for cost measures as well as the fact that it is in a smaller region. Saskatoon will also have the same flight as Halifax with 50 GRP’s as cost for the region are lower. Edmonton will have 4 weeks of 25 GRP’s within the third quarter around back to school when individuals without kids like to travel. Finally only Halifax will have out of home ads during the forth quarter as cost permitted 25 GRP’s for the region in the last quarter. This will be used to increase brand sales in the region. Market Pattern The reason for advertising in smaller and larger markets s because of location of the billboards. Since these locations do not have large cities around them that have populations over 500,000, billboard that are necessary in order to increase the brand sales have to be in smaller markets. Advertisement Size & Duration Horizontal ads will run from the start of the campaign to the second last week of the campaign.
30
ACHIEVEMENT OF REACH/FREQUENCY/CONTINUITY/RECENCY
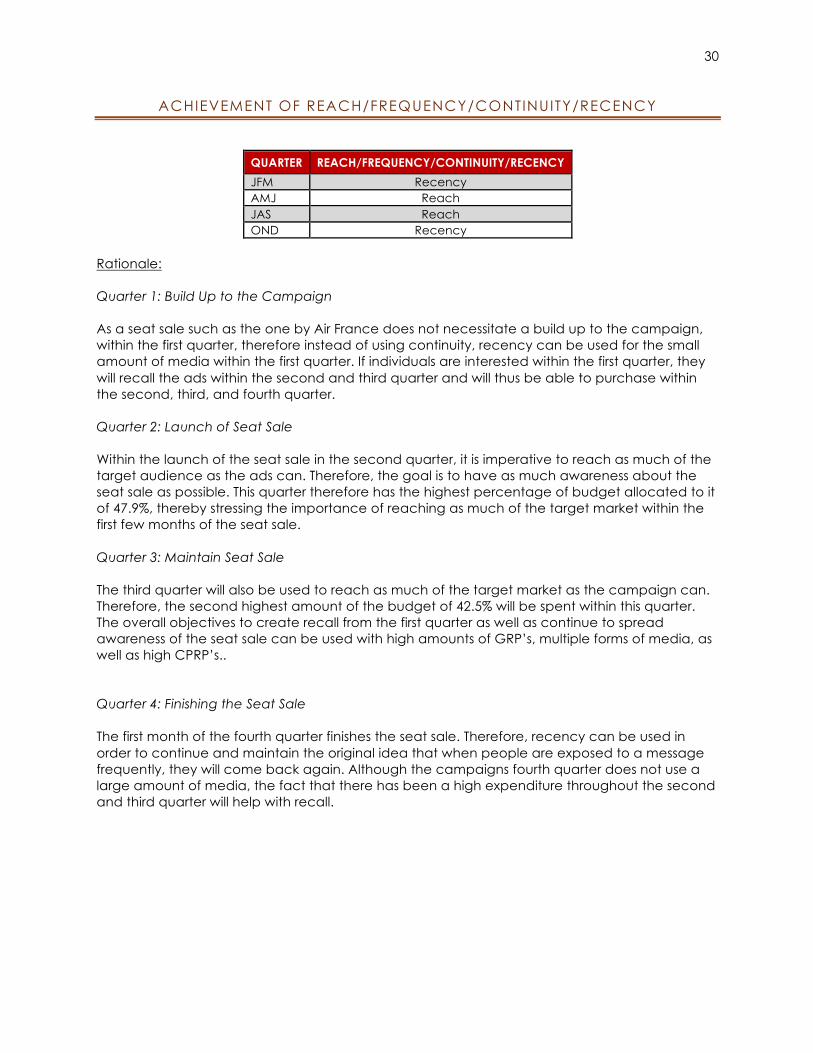
QUARTER REACH/FREQUENCY/CONTINUITY/RECENCY JFM Recency AMJ Reach JAS Reach OND Recency
Rationale: Quarter 1: Build Up to the Campaign As a seat sale such as the one by Air France does not necessitate a build up to the campaign, within the first quarter, therefore instead of using continuity, recency can be used for the small amount of media within the first quarter. If individuals are interested within the first quarter, they will recall the ads within the second and third quarter and will thus be able to purchase within the second, third, and fourth quarter. Quarter 2: Launch of Seat Sale Within the launch of the seat sale in the second quarter, it is imperative to reach as much of the target audience as the ads can. Therefore, the goal is to have as much awareness about the seat sale as possible. This quarter therefore has the highest percentage of budget allocated to it of 47.9%, thereby stressing the importance of reaching as much of the target market within the first few months of the seat sale. Quarter 3: Maintain Seat Sale The third quarter will also be used to reach as much of the target market as the campaign can. Therefore, the second highest amount of the budget of 42.5% will be spent within this quarter. The overall objectives to create recall from the first quarter as well as continue to spread awareness of the seat sale can be used with high amounts of GRP’s, multiple forms of media, as well as high CPRP’s.. Quarter 4: Finishing the Seat Sale The first month of the fourth quarter finishes the seat sale. Therefore, recency can be used in order to continue and maintain the original idea that when people are exposed to a message frequently, they will come back again. Although the campaigns fourth quarter does not use a large amount of media, the fact that there has been a high expenditure throughout the second and third quarter will help with recall.

31
BLOCKING CHART
32
BUDGET SUMMARY
Expenditure by Medium
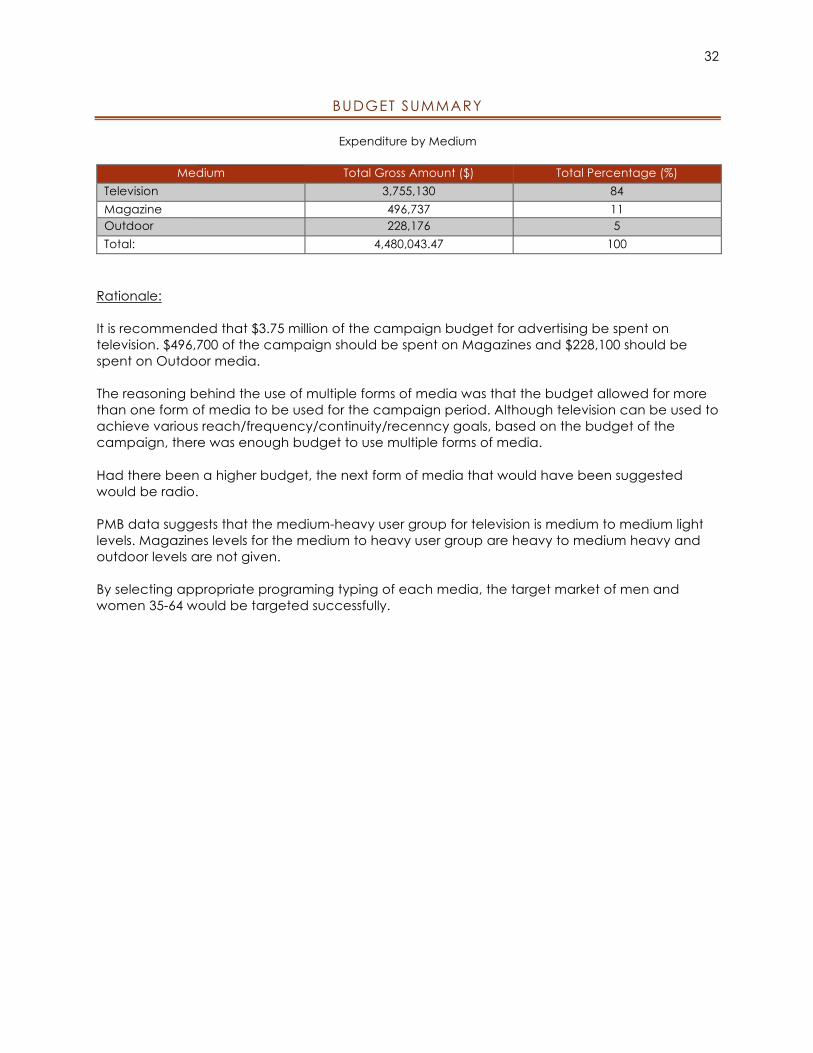
Medium Total Gross Amount ($) Total Percentage (%) Television 3,755,130 84 Magazine 496,737 11 Outdoor 228,176 5 Total: 4,480,043.47 100
Rationale: It is recommended that $3.75 million of the campaign budget for advertising be spent on television. $496,700 of the campaign should be spent on Magazines and $228,100 should be spent on Outdoor media. The reasoning behind the use of multiple forms of media was that the budget allowed for more than one form of media to be used for the campaign period. Although television can be used to achieve various reach/frequency/continuity/recenncy goals, based on the budget of the campaign, there was enough budget to use multiple forms of media. Had there been a higher budget, the next form of media that would have been suggested would be radio. PMB data suggests that the medium-heavy user group for television is medium to medium light levels. Magazines levels for the medium to heavy user group are heavy to medium heavy and outdoor levels are not given. By selecting appropriate programing typing of each media, the target market of men and women 35-64 would be targeted successfully.
33
REGIONAL BREAKDOWN
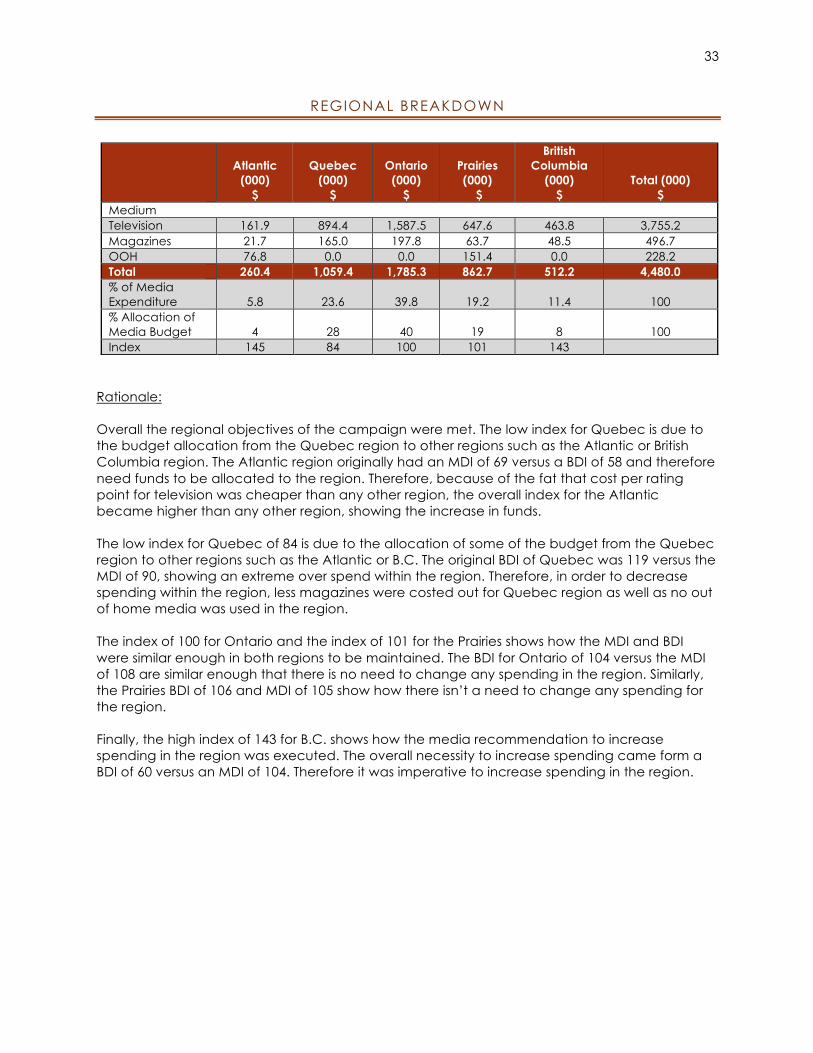
Rationale: Overall the regional objectives of the campaign were met. The low index for Quebec is due to the budget allocation from the Quebec region to other regions such as the Atlantic or British Columbia region. The Atlantic region originally had an MDI of 69 versus a BDI of 58 and therefore need funds to be allocated to the region. Therefore, because of the fat that cost per rating point for television was cheaper than any other region, the overall index for the Atlantic became higher than any other region, showing the increase in funds. The low index for Quebec of 84 is due to the allocation of some of the budget from the Quebec region to other regions such as the Atlantic or B.C. The original BDI of Quebec was 119 versus the MDI of 90, showing an extreme over spend within the region. Therefore, in order to decrease spending within the region, less magazines were costed out for Quebec region as well as no out of home media was used in the region. The index of 100 for Ontario and the index of 101 for the Prairies shows how the MDI and BDI were similar enough in both regions to be maintained. The BDI for Ontario of 104 versus the MDI of 108 are similar enough that there is no need to change any spending in the region. Similarly, the Prairies BDI of 106 and MDI of 105 show how there isn’t a need to change any spending for the region. Finally, the high index of 143 for B.C. shows how the media recommendation to increase spending in the region was executed. The overall necessity to increase spending came form a BDI of 60 versus an MDI of 104. Therefore it was imperative to increase spending in the region.
Atlantic (000)
$
Quebec (000)
$
Ontario (000)
$
Prairies (000)
$
British Columbia
(000) $
Total (000) $
Medium Television 161.9 894.4 1,587.5 647.6 463.8 3,755.2 Magazines 21.7 165.0 197.8 63.7 48.5 496.7 OOH 76.8 0.0 0.0 151.4 0.0 228.2 Total 260.4 1,059.4 1,785.3 862.7 512.2 4,480.0 % of Media Expenditure 5.8 23.6 39.8 19.2 11.4 100 % Allocation of Media Budget 4 28 40 19 8 100 Index 145 84 100 101 143
34
QUARTERLY BREAKDOWN
Q1 (000)
$
Q2 (000)
$
Q3 (000)
$
Q4 (000)
$ Total Medium Television 0.0 1,772.7 1,615.0 367.4 3,755.1 Magazines 49.1 251.5 196.1 0.0 496.7 OOH 0.00 121.76 91.06 15.35 228.2
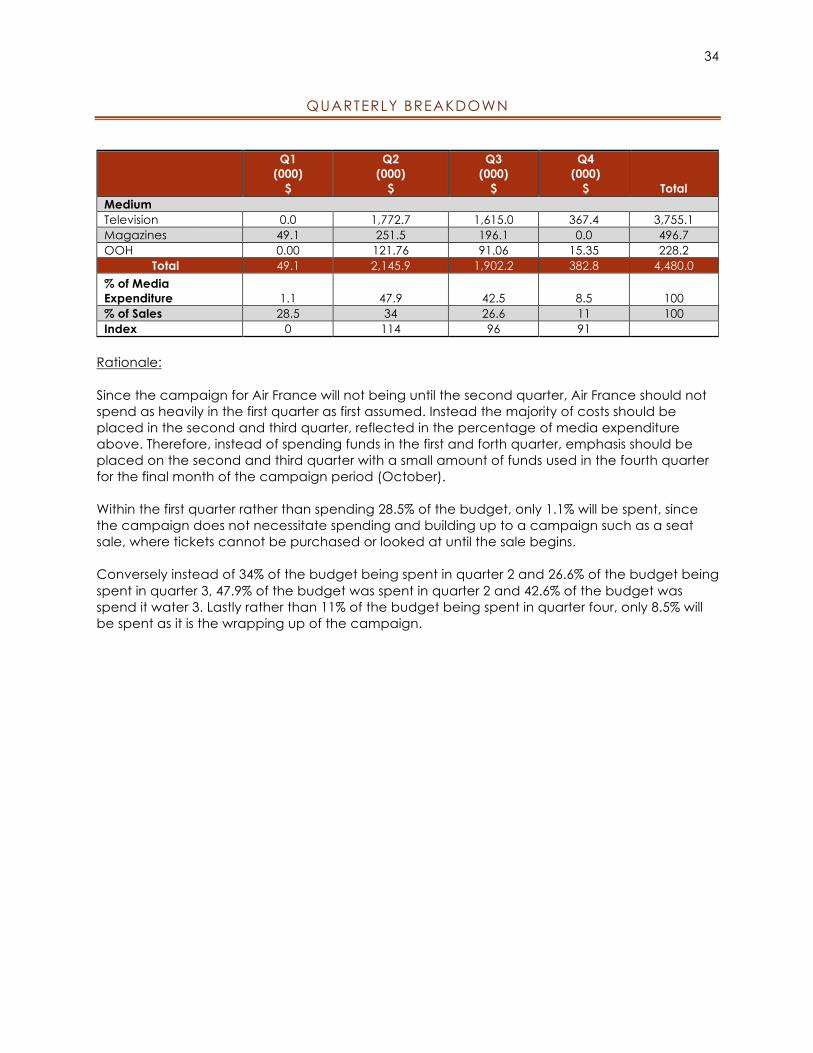
Total 49.1 2,145.9 1,902.2 382.8 4,480.0 % of Media Expenditure 1.1 47.9 42.5 8.5 100 % of Sales 28.5 34 26.6 11 100 Index 0 114 96 91
Rationale: Since the campaign for Air France will not being until the second quarter, Air France should not spend as heavily in the first quarter as first assumed. Instead the majority of costs should be placed in the second and third quarter, reflected in the percentage of media expenditure above. Therefore, instead of spending funds in the first and forth quarter, emphasis should be placed on the second and third quarter with a small amount of funds used in the fourth quarter for the final month of the campaign period (October). Within the first quarter rather than spending 28.5% of the budget, only 1.1% will be spent, since the campaign does not necessitate spending and building up to a campaign such as a seat sale, where tickets cannot be purchased or looked at until the sale begins. Conversely instead of 34% of the budget being spent in quarter 2 and 26.6% of the budget being spent in quarter 3, 47.9% of the budget was spent in quarter 2 and 42.6% of the budget was spend it water 3. Lastly rather than 11% of the budget being spent in quarter four, only 8.5% will be spent as it is the wrapping up of the campaign.

35
COST DETAILS
TELEVISION – QUARTER 1
Television: Quarter 1 Markets Adults CPRP
(unmod.) Weekly Ratings Weekly Cost # Weeks Total Cost
Halifax $27.00 $- $- Saint John/Moncton $22.00 $- $- St. John's $14.00 $- $-
Total Atlantic $63.00 $- $- $- $-
Montreal French $156.00 $- $- Montreal English $104.00 $- $- Quebec City $40.00 $- $- Sherbrooke $24.00 $- $- Trois Rivieres $14.00 $- $- Chicoutimi/Jonquiere $10.00 $- $-
Total Quebec $348.00 $- $- $- $-
Toronto/Hamilton $320.00 $- $- Ottawa English $95.00 $- $- Ottawa French $12.00 $- $- Kitchener/London $120.00 $- $- Sudbury/Timmins/North Bay
$24.00 $- $-
Peterborough/Kingston $24.00 $- $-
Barrie $9.00 $- $- Total Ontario $604.00 $- $-
$- $- Winnipeg $48.00 $- $- Regina $19.00 $- $- Saskatoon $25.00 $- $-
Total Man/Sask $92.00 $- $- $- $-
Calgary $80.00 $- $- Edmonton $80.00 $- $-
Total Alberta $160.00 $- $- $- $-
Vancouver/Victoria $175.00 $- $- Total British Columbia $175.00 $- $-
$- $- Total $1,442.00 $- $-

36
TELEVISION – QUARTER 2
Television: Quarter 2 Markets Adults CPRP
(unmod.) Weekly Ratings Weekly Cost # Weeks Total Cost
Halifax $27.00 110 $2,970.00 11 $32,670.00 Saint John/Moncton $22.00 110 $2,420.00 11 $26,620.00 St. John's $14.00 110 $1,540.00 11 $16,940.00
Total Atlantic $63.00 110 $6,930.00 11 $76,230.00
Montreal French $156.00 110 $17,160.00 11 $188,760.00 Montreal English $104.00 110 $11,440.00 11 $125,840.00 Quebec City $40.00 110 $4,400.00 11 $48,400.00 Sherbrooke $24.00 110 $2,640.00 11 $29,040.00 Trois Rivieres $14.00 110 $1,540.00 11 $16,940.00 Chicoutimi/Jonquiere $10.00 110 $1,100.00 11 $12,100.00
Total Quebec $348.00 110 $38,280.00 11 $421,080.00
Toronto/Hamilton $320.00 120 $38,400.00 11 $422,400.00 Ottawa English $95.00 110 $10,450.00 11 $114,950.00 Ottawa French $12.00 110 $1,320.00 11 $14,520.00 Kitchener/London $120.00 110 $13,200.00 11 $145,200.00 Sudbury/Timmins/North Bay
$24.00 110 $2,640.00 11 $29,040.00
Peterborough/Kingston $24.00 110 $2,640.00 11 $29,040.00 Barrie $9.00 110 $990.00 11 $10,890.00
Total Ontario $604.00 110 $66,440.00 11 $766,040.00
Winnipeg $48.00 100 $4,800.00 11 $52,800.00 Regina $19.00 100 $1,900.00 11 $20,900.00 Saskatoon $25.00 110 $2,750.00 11 $30,250.00
Total Man/Sask $92.00 110 $10,120.00 11 $103,950.00
Calgary $80.00 110 $8,800.00 11 $96,800.00 Edmonton $80.00 110 $8,800.00 11 $96,800.00
Total Alberta $160.00 110 $17,600.00 11 $193,600.00
Vancouver/Victoria $175.00 110 $19,250.00 11 $211,750.00 Total British Columbia $175.00 110 $19,250.00 11 $211,750.00
Total $1,442.00 $319,770.00 11 $1,772,650.00

37
TELEVISION – QUARTER 3 (JULY-AUGUST)
Television: Quarter 3 (July-August ONLY)
Markets Adults CPRP
(unmod.)
Summer CPRP mod.
Weekly Ratings
Weekly Cost
# Weeks
Total Cost
Halifax $27.00 $32.40 100 $3,240.00 6 $19,440.00 Saint John/Moncton $22.00 $26.40 100 $2,640.00 6 $15,840.00
St. John's $14.00 $16.80 100 $1,680.00 6 $10,080.00 Total Atlantic $63.00 $75.60 100 $7,560.00 6 $45,360.00
Montreal French $156.00 $187.20 100 $18,720.00 6 $112,320.00 Montreal English $104.00 $124.80 100 $12,480.00 6 $74,880.00 Quebec City $40.00 $48.00 100 $4,800.00 6 $28,800.00 Sherbrooke $24.00 $28.80 100 $2,880.00 6 $17,280.00 Trois Rivieres $14.00 $16.80 100 $1,680.00 6 $10,080.00 Chicoutimi/Jonquiere $10.00 $12.00 100 $1,200.00 6 $7,200.00
Total Quebec $348.00 $417.60 100 $41,760.00 6 $250,560.00
Toronto/Hamilton $320.00 $384.00 100 $38,400.00 6 $230,400.00 Ottawa English $95.00 $114.00 100 $11,400.00 6 $68,400.00 Ottawa French $12.00 $14.40 100 $1,440.00 6 $8,640.00 Kitchener/London $120.00 $144.00 100 $14,400.00 6 $86,400.00 Sudbury/Timmins/North Bay
$24.00 $28.80 100 $2,880.00 6 $17,280.00
Peterborough/Kingston $24.00 $28.80 100 $2,880.00 6 $17,280.00 Barrie $9.00 $10.80 100 $1,080.00 6 $6,480.00
Total Ontario $604.00 $724.80 100 $72,480.00 6 $434,880.00
Winnipeg $48.00 $57.60 100 $5,760.00 6 $34,560.00 Regina $19.00 $22.80 100 $2,280.00 6 $13,680.00 Saskatoon $25.00 $30.00 100 $3,000.00 6 $18,000.00
Total Man/Sask $92.00 $110.40 100 $11,040.00 6 $66,240.00
Calgary $80.00 $96.00 100 $9,600.00 6 $57,600.00 Edmonton $80.00 $96.00 100 $9,600.00 6 $57,600.00
Total Alberta $160.00 $192.00 100 $19,200.00 6 $115,200.00
Vancouver/Victoria $175.00 $210.00 100 $21,000.00 6 $126,000.00 Total British Columbia $175.00 $210.00 100 $21,000.00 6 $126,000.00
Total $1,442.00 $3,460.80 100 $346,080.00 6 $1,038,240.00
38
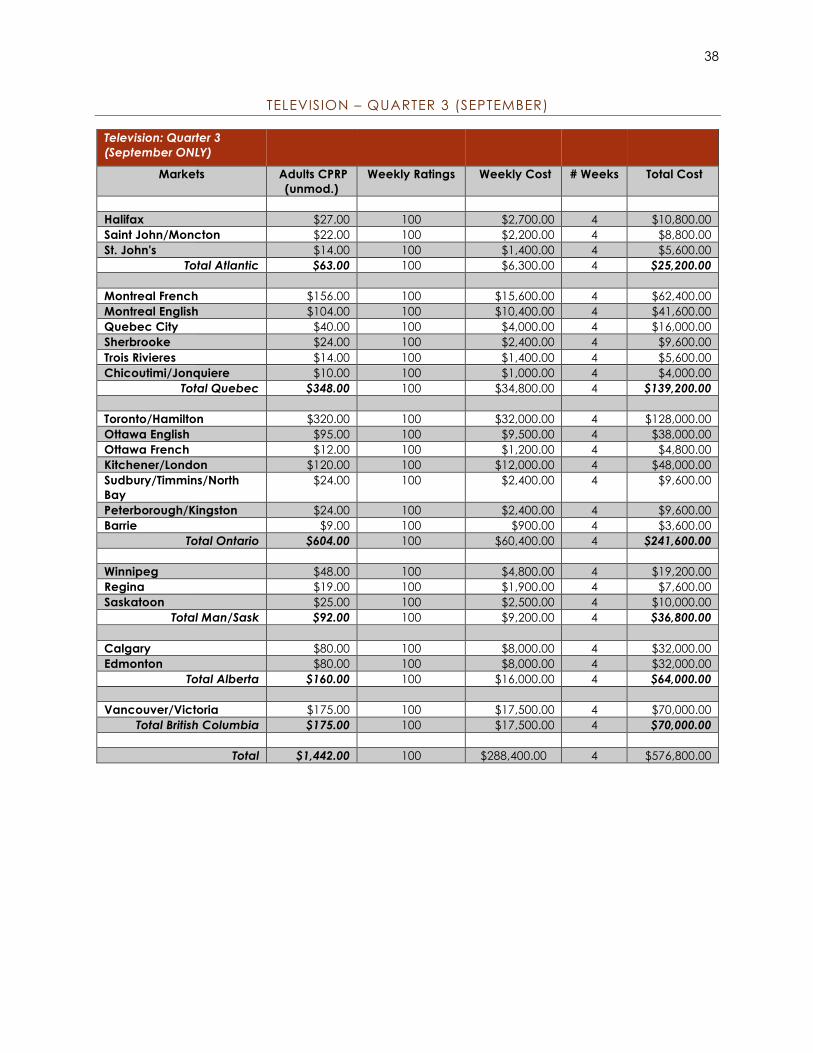
TELEVISION – QUARTER 3 (SEPTEMBER)
Television: Quarter 3 (September ONLY)
Markets Adults CPRP (unmod.)
Weekly Ratings Weekly Cost # Weeks Total Cost
Halifax $27.00 100 $2,700.00 4 $10,800.00 Saint John/Moncton $22.00 100 $2,200.00 4 $8,800.00 St. John's $14.00 100 $1,400.00 4 $5,600.00
Total Atlantic $63.00 100 $6,300.00 4 $25,200.00
Montreal French $156.00 100 $15,600.00 4 $62,400.00 Montreal English $104.00 100 $10,400.00 4 $41,600.00 Quebec City $40.00 100 $4,000.00 4 $16,000.00 Sherbrooke $24.00 100 $2,400.00 4 $9,600.00 Trois Rivieres $14.00 100 $1,400.00 4 $5,600.00 Chicoutimi/Jonquiere $10.00 100 $1,000.00 4 $4,000.00
Total Quebec $348.00 100 $34,800.00 4 $139,200.00
Toronto/Hamilton $320.00 100 $32,000.00 4 $128,000.00 Ottawa English $95.00 100 $9,500.00 4 $38,000.00 Ottawa French $12.00 100 $1,200.00 4 $4,800.00 Kitchener/London $120.00 100 $12,000.00 4 $48,000.00 Sudbury/Timmins/North Bay
$24.00 100 $2,400.00 4 $9,600.00
Peterborough/Kingston $24.00 100 $2,400.00 4 $9,600.00 Barrie $9.00 100 $900.00 4 $3,600.00
Total Ontario $604.00 100 $60,400.00 4 $241,600.00
Winnipeg $48.00 100 $4,800.00 4 $19,200.00 Regina $19.00 100 $1,900.00 4 $7,600.00 Saskatoon $25.00 100 $2,500.00 4 $10,000.00
Total Man/Sask $92.00 100 $9,200.00 4 $36,800.00
Calgary $80.00 100 $8,000.00 4 $32,000.00 Edmonton $80.00 100 $8,000.00 4 $32,000.00
Total Alberta $160.00 100 $16,000.00 4 $64,000.00
Vancouver/Victoria $175.00 100 $17,500.00 4 $70,000.00 Total British Columbia $175.00 100 $17,500.00 4 $70,000.00
Total $1,442.00 100 $288,400.00 4 $576,800.00

39
TELEVISION – QUARTER 4
Television: Quarter 4 Markets Adults CPRP
(unmod.) Weekly Ratings Weekly Cost # Weeks Total Cost
Halifax $27.00 80 $2,160.00 3 $6,480.00 Saint John/Moncton $22.00 80 $1,760.00 3 $5,280.00 St. John's $14.00 80 $1,120.00 3 $3,360.00
Total Atlantic $63.00 80 $5,040.00 3 $15,120.00
Montreal French $156.00 80 $12,480.00 3 $37,440.00 Montreal English $104.00 80 $8,320.00 3 $24,960.00 Quebec City $40.00 80 $3,200.00 3 $9,600.00 Sherbrooke $24.00 80 $1,920.00 3 $5,760.00 Trois Rivieres $14.00 80 $1,120.00 3 $3,360.00 Chicoutimi/Jonquiere $10.00 80 $800.00 3 $2,400.00
Total Quebec $348.00 80 $27,840.00 3 $83,520.00
Toronto/Hamilton $320.00 80 $25,600.00 3 $76,800.00 Ottawa English $95.00 80 $7,600.00 3 $22,800.00 Ottawa French $12.00 80 $960.00 3 $2,880.00 Kitchener/London $120.00 80 $9,600.00 3 $28,800.00 Sudbury/Timmins/North Bay
$24.00 80 $1,920.00 3 $5,760.00
Peterborough/Kingston $24.00 80 $1,920.00 3 $5,760.00 Barrie $9.00 80 $720.00 3 $2,160.00
Total Ontario $604.00 80 $48,320.00 3 $144,960.00
Winnipeg $48.00 80 $3,840.00 4 $15,360.00 Regina $19.00 80 $1,520.00 4 $6,080.00 Saskatoon $25.00 80 $2,000.00 4 $8,000.00
Total Man/Sask $92.00 80 $7,360.00 4 $29,440.00
Calgary $80.00 80 $6,400.00 3 $19,200.00 Edmonton $80.00 80 $6,400.00 3 $19,200.00
Total Alberta $160.00 80 $12,800.00 3 $38,400.00
Vancouver/Victoria $175.00 80 $14,000.00 4 $56,000.00 Total British Columbia $175.00 80 $14,000.00 4 $56,000.00
Total $1,442.00 80 $230,720.00 $367,440.00

40
CPRP MAGAZINE
Publication Unit Size Cost/Insertion $ # of Insertions
Total Gross Cost ($)
Report on Business 4th Cover, 3 ti, 4 Colour 31,329 3 93,987 Chatelaine Full Page, 4 Colour 51,830 3 155,490 Coup de Pouce DPS, 3 ti, 4 Colour 34080 3 102,240 Maclean's 3 2/3 h/2 col 30560 3 91,680 Chatelaine (FR) Full Page 4 Colour 17780 3 53,340
Total 496,737
41
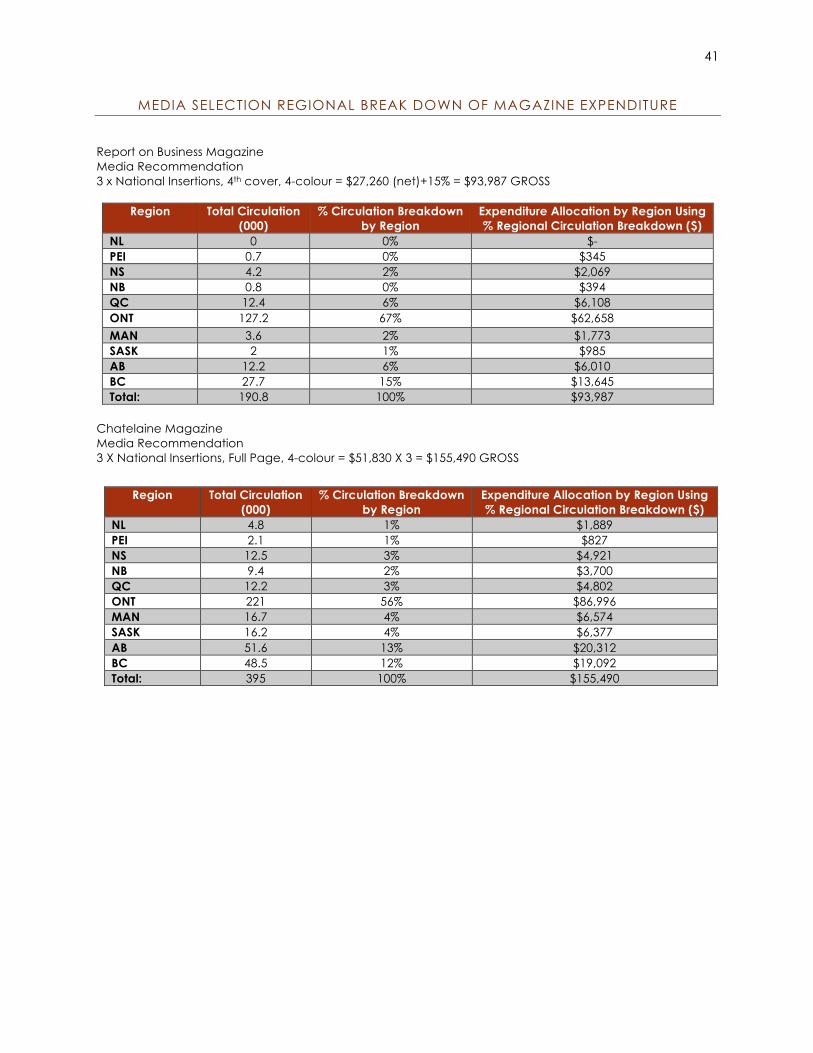
MEDIA SELECTION REGIONAL BREAK DOWN OF MAGAZINE EXPENDITURE
Report on Business Magazine Media Recommendation 3 x National Insertions, 4th cover, 4-colour = $27,260 (net)+15% = $93,987 GROSS
Region Total Circulation (000)
% Circulation Breakdown by Region
Expenditure Allocation by Region Using % Regional Circulation Breakdown ($)
NL 0 0% $- PEI 0.7 0% $345 NS 4.2 2% $2,069 NB 0.8 0% $394 QC 12.4 6% $6,108 ONT 127.2 67% $62,658 MAN 3.6 2% $1,773 SASK 2 1% $985 AB 12.2 6% $6,010 BC 27.7 15% $13,645 Total: 190.8 100% $93,987
Chatelaine Magazine Media Recommendation 3 X National Insertions, Full Page, 4-colour = $51,830 X 3 = $155,490 GROSS
Region Total Circulation (000)
% Circulation Breakdown by Region
Expenditure Allocation by Region Using % Regional Circulation Breakdown ($)
NL 4.8 1% $1,889 PEI 2.1 1% $827 NS 12.5 3% $4,921 NB 9.4 2% $3,700 QC 12.2 3% $4,802 ONT 221 56% $86,996 MAN 16.7 4% $6,574 SASK 16.2 4% $6,377 AB 51.6 13% $20,312 BC 48.5 12% $19,092 Total: 395 100% $155,490

42
MEDIA SELECTION REGIONAL BREAK DOWN OF MAGAZINE EXPENDITURE CONT.
Coup de Pouce Magazine Media Recommendation 3 X National Insertions, DPS, 4-colour = $34,080 X 3 = $102,230 GROSS
Region Total Circulation
(000)
% Circulation Breakdown by Region
Expenditure Allocation by Region Using % Regional Circulation
Breakdown NL 0.013 0% $7 PEI 0.02 0% $11 NS 0.065 0% $36 NB 1.6 1% $891 QC 176.8 96% $98,401 ONT 4.7 3% $2,616 MAN 0.07 0% $39 SASK 0.03 0% $17 AB 0.2 0% $111 BC 0.2 0% $111 Total: 183.698 100% $102,240
Maclean’s Magazine Media Recommendation 3 X National Insertions, 3 2/3, h/2 Col = $30,560 x 3 = $91,680 GROSS
Region Total Circulation
(000)
% Circulation Breakdown by Region
Expenditure Allocation by Region Using % Regional Circulation
Breakdown NL 2.7 1% $1,031 PEI 1.3 1% $496 NS 6.9 3% $2,635 NB 4.8 2% $1,833 QC 12.3 5% $4,697 ONT 115.6 48% $44,141 MAN 11.3 5% $4,315 SASK 10.9 5% $4,162 AB 33.7 14% $12,868 BC 40.6 17% $15,503 Total: 240.1 100% $91,680
43
MEDIA SELECTION REGIONAL BREAK DOWN OF MAGAZINE EXPENDITURE CONT.
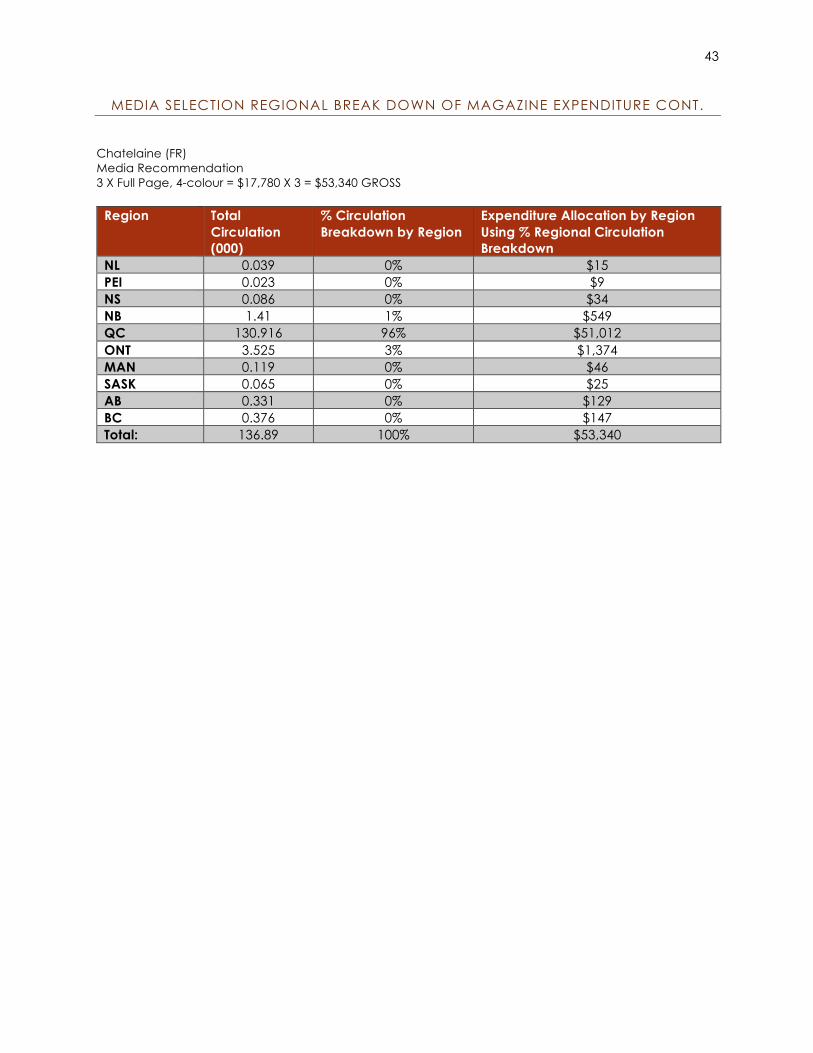
Chatelaine (FR) Media Recommendation 3 X Full Page, 4-colour = $17,780 X 3 = $53,340 GROSS
Region Total Circulation (000)
% Circulation Breakdown by Region
Expenditure Allocation by Region Using % Regional Circulation Breakdown
NL 0.039 0% $15 PEI 0.023 0% $9 NS 0.086 0% $34 NB 1.41 1% $549 QC 130.916 96% $51,012 ONT 3.525 3% $1,374 MAN 0.119 0% $46 SASK 0.065 0% $25 AB 0.331 0% $129 BC 0.376 0% $147 Total: 136.89 100% $53,340
44
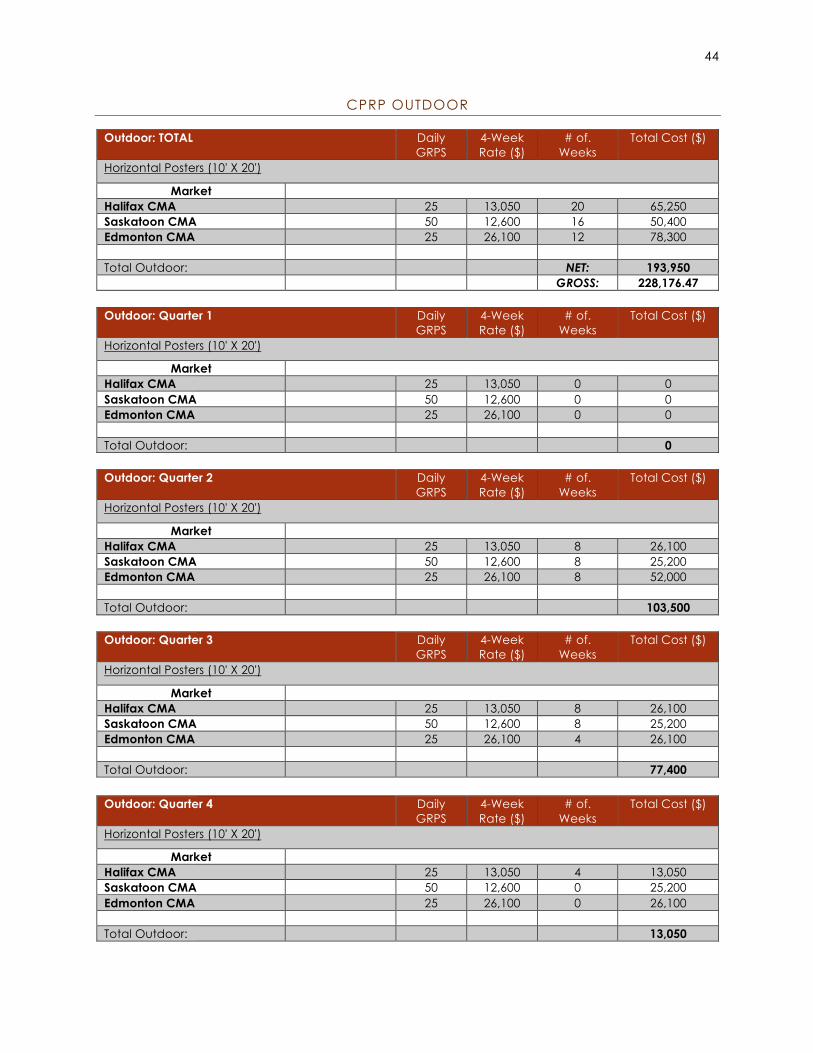
CPRP OUTDOOR
Outdoor: TOTAL Daily GRPS
4-Week Rate ($)
# of. Weeks
Total Cost ($)
Horizontal Posters (10' X 20')
Market Halifax CMA 25 13,050 20 65,250 Saskatoon CMA 50 12,600 16 50,400 Edmonton CMA 25 26,100 12 78,300
Total Outdoor: NET: 193,950 GROSS: 228,176.47
Outdoor: Quarter 1 Daily
GRPS 4-Week Rate ($)
# of. Weeks
Total Cost ($)
Horizontal Posters (10' X 20')
Market Halifax CMA 25 13,050 0 0 Saskatoon CMA 50 12,600 0 0 Edmonton CMA 25 26,100 0 0
Total Outdoor: 0
Outdoor: Quarter 2 Daily
GRPS 4-Week Rate ($)
# of. Weeks
Total Cost ($)
Horizontal Posters (10' X 20')
Market Halifax CMA 25 13,050 8 26,100 Saskatoon CMA 50 12,600 8 25,200 Edmonton CMA 25 26,100 8 52,000
Total Outdoor: 103,500
Outdoor: Quarter 3 Daily
GRPS 4-Week Rate ($)
# of. Weeks
Total Cost ($)
Horizontal Posters (10' X 20')
Market Halifax CMA 25 13,050 8 26,100 Saskatoon CMA 50 12,600 8 25,200 Edmonton CMA 25 26,100 4 26,100
Total Outdoor: 77,400
Outdoor: Quarter 4 Daily
GRPS 4-Week Rate ($)
# of. Weeks
Total Cost ($)
Horizontal Posters (10' X 20')
Market Halifax CMA 25 13,050 4 13,050 Saskatoon CMA 50 12,600 0 25,200 Edmonton CMA 25 26,100 0 26,100
Total Outdoor: 13,050

45
REFERENCES Air France. (2014). The Company. Air France. Retrieved on: February 18, 2016 from
http://corporate.airfrance.com/en/the-company/
Air France. (2014). The Company – Passengers. Air France. Retrieved on: February 18, 2016 from http://corporate.airfrance.com/en/the-company/passenger/
France Diplomatie. (October, 2013). France, The World’s Leading Tourist Destination.
France Diplomatie. Retrieved on: February 1, 2016 from http://www.diplomatie.gouv.fr/en/french-foreign-policy/economic-diplomacy foreign-trade/facts-about-france/one-figure-one-fact/article/france-the-world s-leading-tourist
Print Measurement Bureau. Travel Outside Canada – Vacation Trip Past 12 Months –
Overnight. Print Measurement Bureau.