assets, debt and the drawdown of housing equity by an ... debt and the drawdown of housing equity by...
TRANSCRIPT

Assets, debt and the drawdown of housing equity by an ageing population
authored by
Rachel Ong, Marietta Haffner, Gavin Wood, Therese Jefferson and Siobhan Austen
for the
Australian Housing and Urban Research Institute
at Curtin University at RMIT University
May 2013
AHURI Positioning Papers No. 153
ISSN: 1834-9250
ISBN: 978-1-922075-30-7

i
Authors Ong, Rachel Curtin University
Haffner, Marietta Delft University of Technology
RMIT University
Cambridge University
Wood, Gavin RMIT University
Jefferson, Therese Curtin University
Austen, Siobhan Curtin University
Title Assets, debt and the drawdown of housing equity by an ageing
population
ISBN 978-1-922075-30-7
Format PDF
Key words ageing, downsizing, housing equity withdrawal
Editor Anne Badenhorst AHURI National Office
Publisher Australian Housing and Urban Research Institute
Melbourne, Australia
Series AHURI Positioning Paper, no. 153
ISSN 1834-9250
Preferred citation Ong, R, Haffner, M, Wood, G, Jefferson, T and Austen, S (2013)
Assets, debt and the drawdown of housing equity by an ageing
population, AHURI Positioning Paper No.153. Melbourne: Australian
Housing and Urban Research Institute.

ii
ACKNOWLEDGEMENTS
This material was produced with funding from the Australian Government and the
Australian states and territory governments. AHURI Limited gratefully acknowledges
the financial and other support it has received from these governments, without which
this work would not have been possible.
AHURI comprises a network of universities clustered into Research Centres across
Australia. Research Centre contributions—both financial and in-kind—have made the
completion of this report possible.
DISCLAIMER
AHURI Limited is an independent, non-political body which has supported this project
as part of its programme of research into housing and urban development, which it
hopes will be of value to policy-makers, researchers, industry and communities. The
opinions in this publication reflect the views of the authors and do not necessarily
reflect those of AHURI Limited, its Board or its funding organisations. No responsibility
is accepted by AHURI Limited or its Board or its funders for the accuracy or omission
of any statement, opinion, advice or information in this publication.
This paper uses unit record data from the Household, Income and Labour Dynamics
in Australia (HILDA) Survey. The HILDA Project was initiated and is funded by the
Australian Government Department of Families, Housing, Community Services, and
Indigenous Affairs (FaHCSIA) and is managed by the Melbourne Institute of Applied
Economic and Social Research (MIAESR). The findings and views reported in this
paper, however, are those of the authors and should not be attributed to either
FaHCSIA or the MIAESR.
AHURI POSITIONING PAPER SERIES
AHURI Positioning Papers is a refereed series presenting the preliminary findings of
original research to a diverse readership of policy makers, researchers and
practitioners.
PEER REVIEW STATEMENT
An objective assessment of all reports published in the AHURI Positioning Paper
Series by carefully selected experts in the field ensures that material of the highest
quality is published. The AHURI Positioning Paper Series employs a double-blind
peer review of the full report, with strict anonymity observed between authors and
referees.

iii
CONTENTS
LIST OF TABLES ....................................................................................................... VI
LIST OF FIGURES .....................................................................................................VII
ACRONYMS ..............................................................................................................VIII
EXECUTIVE SUMMARY .............................................................................................. 1
1 INTRODUCTION .................................................................................................... 4
1.1 Aims and structure of the Positioning Paper ........................................................... 4
1.2 The ageing of Australia’s population ....................................................................... 4
1.3 The shift towards housing asset based welfare ...................................................... 6
1.3.1 Retreat of the welfare state ......................................................................... 6
1.3.2 Expansion of housing asset based welfare ................................................. 6
2 CONCEPTUALISING HOUSING EQUITY WITHDRAWAL .................................... 9
2.1 Theoretical framework ............................................................................................ 9
2.2 A typology for defining housing equity withdrawal ................................................ 10
2.2.1 Sale of the home ....................................................................................... 11
2.2.2 In situ mortgage equity withdrawal ............................................................ 12
2.3 Comparisons of alternative HEW mechanisms ..................................................... 16
2.3.1 Key characteristics of alternative HEW mechanisms ................................. 16
2.3.2 Costs of alternative HEW mechanisms ..................................................... 19
2.3.3 Risks of alternative HEW mechanisms ...................................................... 21
2.4 Summary .............................................................................................................. 22
3 HOUSING EQUITY WITHDRAWAL: A CROSS-COUNTRY COMPARISON ....... 23
3.1 Selection of countries ........................................................................................... 23
3.2 Australia ............................................................................................................... 30
3.2.1 MEW products .......................................................................................... 30
3.2.2 Sale of the home ....................................................................................... 32
3.2.3 Uses of HEW ............................................................................................ 33
3.3 United Kingdom .................................................................................................... 34
3.3.1 MEW products .......................................................................................... 35
3.3.2 Sale of the home ....................................................................................... 36
3.3.3 Uses of HEW ............................................................................................ 37
3.4 United States........................................................................................................ 39
3.4.1 MEW products .......................................................................................... 39
3.4.2 Sale of the home ....................................................................................... 41
3.4.3 Uses of HEW ............................................................................................ 42
3.5 Netherlands .......................................................................................................... 43
3.5.1 MEW products .......................................................................................... 43
3.5.2 Sale of the home ....................................................................................... 43
3.5.3 Uses of HEW ............................................................................................ 44
3.6 Finland ................................................................................................................. 44
3.6.1 MEW products .......................................................................................... 44

iv
3.6.2 Sale of the home ....................................................................................... 45
3.6.3 Uses of HEW ............................................................................................ 45
3.7 Germany .............................................................................................................. 46
3.7.1 MEW products .......................................................................................... 46
3.7.2 Sale of the home ....................................................................................... 47
3.7.3 Uses of HEW ............................................................................................ 47
3.8 Institutional settings influencing the use of HEW .................................................. 48
3.8.1 Degree of mortgage market development ................................................. 48
3.8.2 Housing markets ....................................................................................... 48
3.8.3 Taxation settings ....................................................................................... 49
3.8.4 Regulatory frameworks ............................................................................. 50
3.8.5 The generosity of public pension systems ................................................. 50
3.8.6 The welfare role of housing wealth ............................................................ 51
3.8.7 Implications for HEW in Australia .............................................................. 52
4 THE ASSET AND DEBT PROFILE OF OLDER AUSTRALIANS ........................ 54
4.1 Method ................................................................................................................. 55
4.1.1 Data .......................................................................................................... 55
4.1.2 Measurement of assets and debts ............................................................ 55
4.1.3 Sample design .......................................................................................... 56
4.2 Snapshots of older Australians’ asset and debt portfolios ..................................... 57
4.3 The mortgage debt of older homeowners ............................................................. 63
4.4 How do asset and debt portfolios change as ageing occurs? ............................... 67
4.4.1 Change in portfolio composition as ageing occurs .................................... 68
4.4.2 Are older Australians drawing down their superannuation wealth to pay off mortgage debts in retirement? .................................................................. 70
4.5 Summary .............................................................................................................. 73
5 CONCLUDING COMMENTS AND FUTURE RESEARCH DIRECTIONS ............ 74
5.1 Concluding comments .......................................................................................... 74
5.2 Future research directions .................................................................................... 75
5.2.1 Research question 1: To what extent are older Australians tapping into their housing equity via alternative mechanisms, and what are they using HEW for? .................................................................................................. 76
5.2.2 Research question 2: What are the costs and risks of using HEW in later life, and how do these vary across the older population according to socio-economic groups and across scenarios relating to tax-benefit settings and asset price changes? ................................................................................ 76
5.2.3 Research question 3: How do older Australians perceive the different mechanisms for HEW and how do these perceptions influence decisions about the use of HEW? ............................................................................. 77
5.2.4 Research question 4: What financial products can be introduced to mitigate the risks associated with HEW in older age? ............................... 78
REFERENCES ........................................................................................................... 79
APPENDICES ............................................................................................................. 89
Appendix 1: Measuring income unit assets and debts ................................................. 89

v
Appendix 2: Supplementary tables on the assets and debts of older Australians ........ 90

vi
LIST OF TABLES
Table 1: Comparisons of the characteristics of alternative HEW mechanisms ........... 17
Table 2: Comparisons of the financial costs of alternative HEW mechanisms ........... 20
Table 3: Risks directly associated with alternative HEW mechanisms that are borne by
equity extractors engaging in HEW .................................................................... 21
Table 4: Transaction tax on acquisition of dwelling and capital gains tax on sale of
dwelling in six countries under study, latest year available a ............................... 29
Table 5: Statistics on the Australian reverse mortgage market, 2005–11 .................. 31
Table 6: Asset and debts of older Australians aged over 45 years, 2002–10 ............ 59
Table 7: Asset and debts of older Australians, by age band, 2010 ............................ 61
Table 8: Asset and debts of older Australians, by income unit type, 2010 a ............... 62
Table 9: Incidence of MEW among homeowners, by age band, 2001–10, per cent... 67
Table 10: Percentage point change in share of key assets and debts in older
Australians’ portfolios between 2002 and 2010, by age band in 2002 ................ 69
Table 11: Change in real value of assets and debts of older homeowners before and
after becoming eligible to access their superannuation wealth between wave t
and t+4, $’000s .................................................................................................. 72
Table 12: Change in mortgage debt and superannuation lump sum withdrawal
between t-1 and t, homeowners with a mortgage at time t-1 .............................. 73
Table A1: Algorithm for the measurement of wealth and debt for income units residing
in multi-income unit households ......................................................................... 89
Table A2: Asset and debts of older Australians, by age band, 2002 and 2006 .......... 90
Table A3: Asset and debts of older Australians, by income unit type, 2002 and 2006 92

vii
LIST OF FIGURES
Figure 1: Housing equity withdrawal mechamisms—a typology ................................ 15
Figure 2: Home ownership rates, most recent year available a b ................................ 24
Figure 3: Share of outstanding mortgage loans in GDP, 2010 a b c ............................. 26
Figure 4: Real house price index of the six countries under study, 1970 to most recent
quarter available ................................................................................................ 28
Figure 5: House price index, Australian capital cities, March 2002 to September
2012 a ................................................................................................................ 60
Figure 6: Percentage of homeowners with a mortgage debt, 1982–2009 .................. 64
Figure 7: Mean LVR of homeowners with a mortgage debt, 1990–2009 a ................. 65
Figure 8: Percentage of homeowners with a mortgage debt, 2001–10 ...................... 66
Figure 9: Mean LVR of homeowners with a mortgage debt, 2001–10 ....................... 66

viii
ACRONYMS
ABS Australian Bureau of Statistics
AHEAD Asset and Health Dynamics among the Oldest Old
ASIC Australian Securities and Investments Commission
AUD Australian dollars
BHPS British Household Panel Survey
CFPB Consumer Financial Protection Bureau
CGT Capital gains tax
COTAWA Council on the Ageing Western Australia
CPI Consumer Price Index
DNB Dutch National Bank or De Nederlandsche Bank
ERC Equity Release Council
ERS Equity release scheme
EU European Union
EU-SILC European Union Statistics on Income and Living Conditions
FHA Federal Housing Administration
FSA Financial Services Authority
GDP Gross Domestic Product
GFC Global financial crisis
HECM Home Equity Conversion Mortgage program
HELOC Home equity line of credit
HES Household Expenditure Survey
HEW Housing equity withdrawal
HILDA Household, Income and Labour Dynamics in Australia
HUD Department for Housing and Urban Development
IMF International Monetary Fund
LIS Luxembourg Income Study
LVRs Loan-to-value ratios
MEW Mortgage equity withdrawal
NAR National Association of Realtors
OECD Organisation for Economic Co-operation and Development
PSID Panel Survey of Income Dynamics
SAM Shared appreciation mortgage
SEP Sociaal Economisch Panel
SEQUAL Senior Australians Equity Release Association of Lenders
SHARE Survey of Health, Ageing and Retirement in Europe

ix
SHIP Safe Home Income Plans
SIPP Survey of Income and Program Participation
UK United Kingdom
US United States

1
EXECUTIVE SUMMARY
This Positioning Paper is the first output of a project that aims to uncover the uses,
financial costs and risks of housing equity withdrawal (HEW) via alternative
mechanisms by older Australians. By HEW, we are specifically referring to any
mechanism that homeowners use in order to convert some or all of the illiquid equity
held in their primary homes into income, regardless of whether that equity is being
taken out as a lump sum or in regular payments. The findings of the project will
provide a comprehensive evidence base for policies and programs aimed at
maximising the availability and quality of information to support Australians in their
decision-making over the management of housing wealth in later life. This Positioning
Paper presents background material that will inform the project’s research aim.
The ageing of the population is a global demographic transition that is creating
seismic shifts in the age structure of populations worldwide, and Australia is no
exception. Indeed, fiscal pressures associated with population ageing and concurrent
globalisation trends have prompted governments worldwide to consider a range of
strategies designed to extend self-provision in old age. Tax preferences and asset test
concessions have traditionally favoured accumulation of wealth in the primary home
and this approach was given added impetus by a decade-long period of sustained
house price appreciation prior to the GFC. It is therefore not surprising that the
primary home has come under scrutiny from governments worldwide as a key store of
wealth that can potentially perform a pension role in retirement. Moreover, attitudinal
change may also be apparent among baby boomers as growing desires for
independence, flexibility and lifestyle choices in later life are increasingly driving
decision-making surrounding the use of housing in old age.
However, the move towards housing asset based welfare is predicated on the
assumption that investment in ‘bricks and mortar’ will yield significant returns as house
prices continue to increase indefinitely. In contrast, recent economic events have
highlighted the potential riskiness of housing as a vehicle to fund retirement.
Furthermore, while a number of financial instruments currently exist to enable HEW,
the tax-benefit consequences of HEW in later life are complicated and poorly
understood. This can result in ill-informed decisions about the use of HEW
mechanisms to support consumption in retirement. The poor supports for decision-
making about HEW have implications for policy because, potentially, they expose
many older Australians to financial vulnerability in retirement, which in turn has
ramifications for the viability of the income support system.
In this Positioning Paper, we outline a typology that provides a broad conceptual
framework for systematically describing and comparing alternative HEW mechanisms.
Traditionally equity withdrawal required sale of the home. However, financial
deregulation and rising house prices in the 1980s and 1990s has been accompanied
by innovations that allow in situ mortgage equity withdrawal (MEW). Broadly speaking,
a key cost associated with the sale method of withdrawing housing equity is affected
by the levying of taxes when properties are sold and bought, such as capital gains tax
and conveyance tax on the purchase of property. On the other hand, in situ MEW
appears to be susceptible to more forms of risks than the sale mode. These risks
include interest rate risk, house price risk and negative equity risk.
We also present the results of a selective international survey focusing on HEW
mechanisms that are available in six developed countries: Australia, United Kingdom,
United States, Netherlands, Finland and Germany. By comparing developments in
HEW in Australia against other countries, we are able to evaluate the extent to which

2
the institutional environment in Australia support or discourage the use of HEW by
older Australians as opposed to countries with different institutional settings.
The research reported in this Positioning Paper uncovers three key features of HEW
by older homeowners in Australia. First, wealth stored in the primary home remains
the most dominant asset in the portfolios of most older persons in Australia. The
global financial crisis (GFC) has not reversed the housing bias in portfolios. Older
single women and all those aged over 65 years are particularly reliant on housing
assets. Their wealth is concentrated in the primary home and superannuation
balances are relatively low. Nevertheless retired home owners typically aged over 65
years appear to view housing wealth as precautionary savings that are only rolled out
in extreme circumstances. The literature suggests that this reluctance is also evident
among retired homeowners in countries such as the Netherlands, Finland and
Germany.
Second, based on our cross-country comparisons, we find that Australia’s institutional
settings appear to be more conducive for HEW than in other countries. It has an
extremely well-developed mortgage market which was not significantly affected by the
GFC. On the other hand, the take up of equity release products by the older
population in the US and UK did decline as a result of the GFC. In addition, Australia’s
relatively large private rental sector makes selling up and renting a more realistic
option than in countries with smaller private rental markets (e.g. the UK), should
homeowners be forced to sell their homes to access large amounts of housing equity
for emergency needs. Australia’s public pension system is also less generous than
pension systems available in countries such as Finland and Germany, and the
significant house price appreciation experienced in Australia, together with capital
gains tax exemption on the sale of the primary home, over the last few decades has
fuelled incentives to cash out capital gains, as opposed to, say, Germany where
house prices have not appreciated. The new mortgage products that have emerged
since financial deregulation have helped by transforming housing wealth into a liquid
asset such that borrowers can draw down their housing equity as and when they
choose. For working age Australian homeowners there is now convincing evidence
that HEW is being used to fund everyday consumption needs.
This leads us to the third key finding, which relates to the implications of HEW for the
robustness of housing wealth as an asset base in old age. Government policies (e.g.
tax expenditures and concessionary asset tests) that encourage accumulation of
wealth in the primary home are a cornerstone of Australian social policy. These
policies are prefaced on the assumption that homeowners will own their homes
outright in old age, hence lower incomes in retirement will be matched by low housing
costs, and retirees can therefore get by on smaller pensions. However, homeowners
that use HEW to meet spending needs earlier in their life cycle will eat into housing
wealth. Our statistical analysis confirms that more and more older Australians are
approaching retirement with outstanding mortgage debt, a trend that (on early
indications) has not been reversed by the GFC. The analysis further suggests that
some may be paying off their mortgage debt using lump sum superannuation payouts
that become accessible on reaching the preservation age. Those who do not will
presumably continue making regular mortgage repayments after they retire. These
scenarios imply increasing pressure on the age pension system, as superannuation
funds and pensions are drained to repay mortgage debts that are still outstanding as
retirement approaches. Since the 1990s housing’s role as a pillar supporting
retirement incomes policy has weakened as baby boomers use their housing wealth
to bring forward superannuation balances and smooth consumption during their
working lives. There is a second important trend that has relevance. The edges of
home ownership are now more fluid as growing numbers of Australians churn back

3
and forth between owning and renting, or even permanently fall off the ‘home
ownership ladder’. First transitions into ownership are no longer the secure foothold
they once were, and this is particularly evident among the casualties of relationship
breakdown. Those on the edges of home ownership confront a particularly uncertain
future housing career that threatens their security in retirement.
The research reported in this Positioning Paper has provided important material to
inform the key research aim of this project. The next stage of the project will build on
the preliminary evidence in this Positioning Paper by directly addressing the project’s
key research questions via a mixed methods framework that uses a web of inter-
related quantitative and qualitative methodologies to triangulate findings.

4
1 INTRODUCTION
1.1 Aims and structure of the Positioning Paper
This Positioning Paper is the first output of a project that aims to uncover the uses,
financial costs and risks of housing equity withdrawal (HEW) via alternative
mechanisms by older Australians. By HEW, we are specifically referring to any
mechanism that home owners use in order to convert some or all of the illiquid equity
held in their primary homes into income, regardless of whether that equity is being
taken out as a lump sum or in regular payments. The findings of the project will
provide a comprehensive evidence base for policies and programs aimed at
maximising the availability and quality of information to support Australians in their
decision-making over the use of housing wealth in later life.
The project has a number of key research questions related to its aim:
1. To what extent are older Australians tapping into their housing equity via alternative mechanisms, and what are they using HEW for?
2. What are the costs and risks of using HEW in later life, and how do these vary across the older population according to socio-economic groups and across scenarios relating to tax-benefit settings and asset price changes?
3. How do older Australians perceive the different mechanisms for HEW and how do these perceptions influence decisions about the use of HEW?
4. What financial products can be introduced to mitigate the risks associated with HEW in older age?
This Positioning Paper presents background material that will inform the key research
questions of this project.
The rest of this chapter will describe the general policy context of the research topic,
with a view to highlighting the policy significance of our key research questions.
An extensive review of the international academic and policy literature encompasses
Chapters 2 and 3. We begin by elaborating on the theoretical framework underpinning
research into the role of housing equity in an ageing population, and explore how
HEW has been conceptualised in the existing literature. This information is then used
to arrive at a typology which provides the framework for systematically describing and
comparing various HEW mechanisms in relation to their characteristics, and
associated costs and risks in Chapter 2. Chapter 3 extends the review by establishing
what is known about the uses and risks of HEW in various developed countries,
including Australia.
Chapter 4 presents descriptive statistics that profile the asset and debt portfolios of
older Australians, and assess the importance of housing assets and debts within the
portfolios of Australia’s ageing population. It highlights potential risks associated with
the dominant role played by housing in asset and debt portfolios.
In the concluding chapter, we draw together key themes that have emerged from the
preceding chapters and identify knowledge gaps and policy concerns. The Positioning
Paper will conclude with an outline of the methodology we propose to implement
during the next stage of the project.
1.2 The ageing of Australia’s population
The ageing of the population is a global demographic transition that is creating
seismic shifts in the age structure of populations worldwide, and Australia is no

5
exception. This phenomenon is the product of sizable long-run declines in the fertility
rate as well as a lengthening of life expectancies.
During the last century, Australia experienced two extended periods of decline in
fertility rates. Over the period 1907–34, the total fertility rate fell from around 4.0
babies per woman to 2.1 by the time the Depression era hit in the early 1930s. After
the Depression had passed, women’s willingness to bear children increased; this
continued through the Second World War, reaching a new peak of 3.5 babies per
woman at the beginning of the 1960s. However, during the bulk of the 60s, 70s and
80s, changing social attitudes about the optimum family size, increased female labour
force participation and the availability of contraception drove another round of decline
in fertility rates. By 2001, the total fertility rate had plummeted to 1.73 babies per
woman. Though the fertility rate has climbed slightly in recent years (in 2010 it was
1.89 babies per woman), it is currently at a historical low, and certainly beneath the
replacement fertility level of 2.1 babies per woman (ABS 2012b).1
Since the beginning of the 20th century, Australians’ life expectancy at birth has
increased by more than 20 years. This has been largely due to general improvements
in living conditions, including improvements in food and water quality, sewerage
systems and health education, increasing pervasiveness of infection controls and
public awareness of the importance of preventative measures, as well as
developments in medical technology that have lowered mortality rates and improved
life expectancies. During the first decade of the 20th century, the average life
expectancy at birth was about 55.2 years for boys and 58.8 years for girls. By 2007–
09, this has risen to around 79.3 years for boys, and 83.4 years for girls. Indeed, while
a man (woman) aged 65 years old at the beginning of the 20th century could only
expect to live for another 11.3 (12.9) years, a 65-year-old man (woman) in 2009 can
expect to live for another 18.7 (21.8) years (ABS 2011a).
Migration is a third key factor that can affect the age structure of the population.
Population increases reflect both natural increase and net overseas migration trends.
Australia has experienced relatively stable natural increase over the last two decades.
However, net overseas migration has exhibited greater volatility, fluctuating from a
relatively low contribution of 17 per cent to population growth in 1992–93 when
Australia was experiencing an economic recession, to a high contribution of 66 per
cent in 2008–09 when demand for skilled migrants was peaking and supported by an
expansionist immigration policy.
It is noteworthy that in 2010, the median age of overseas-born Australian residents
was 44.7 years old, significantly higher than the Australian-born median of 33.4 years.
The underlying reason is that large numbers of migrants entered Australia under post-
Second World War assisted passage programs; these migrants have of course aged
and now make up a significant segment of Australia’s ageing population (ABS 2011b).
As Hugo (2003) rightly notes, the high fertility rates and immigration levels of the post-
war years have produced an enormous cohort of baby boomers who will be ageing
over the coming decades. The swelling numbers of ageing boomers will no doubt
influence every domain of Australian public policy as they increasingly dominate
changing trends in needs, attitudes and preferences. Indeed, population ageing is
already beginning to pose significant policy challenges for governments in Australia
and other developed countries.
1 Replacement fertility level is the number of babies a woman would need to give birth to over her
reproductive life to replace both herself and her partner (ABS 2012b).

6
1.3 The shift towards housing asset based welfare
1.3.1 Retreat of the welfare state
The capacity of a nation to fund rising spending needs associated with ageing will be
hampered as the proportion of working age adults in the population shrinks. This has
already resulted in growing pressure on government budgets to meet age-related
payments and services, a burden that will only intensify in coming years as the rate of
population ageing accelerates, and threaten the sustainability of balanced government
budgets.
In 2009–10, 26 per cent of Australian government spending was directed towards
health, age-related pensions and aged care services. This is projected to double to
around half of total government spending over the next 40 years. In its 2010
intergenerational report, the Australian government (2010, p.46) forecasts spending
on what it calls ‘demographically sensitive’ areas will climb from 22.4 per cent of GDP
in 2015–16 to 27.1 per cent of GDP by 2049–50, unless measures are implemented
to curb the growth in spending in these areas.2 The result will be a budget deficit
amounting to 2.75 per cent of GDP in 40 years’ time (Australian Government 2010).
The demographic transitions occurring as a result of population ageing are not the
only trends driving a shift towards fiscal austerity in the current century. As Wood and
Ong (2012) point out, the removal of trade barriers, advances in technology and
deregulation of financial markets have paved the way for globalisation, which is
marked by increasing international integration of national economies world-wide.
Many countries, especially those in developed regions, have reaped significant
economic benefits arising from gains associated with globalisation, including more
efficient allocation of resources and improved competition in markets. However, the
downside is that government sovereignty over domestic economic and social policies
have weakened, and indeed the need to maintain internationally competitive tax rates
may have tightened fiscal constraints (Wood & Ong 2012).
1.3.2 Expansion of housing asset based welfare
For the majority of older Australians, the primary home represents their most
significant asset (see Section 4.2 for details). Fiscal pressures associated with
population ageing and concurrent globalisation trends have prompted governments
worldwide to consider a range of strategies designed to extend self-provision in old
age. The compulsory superannuation guarantee, introduced in the early 1990s in
Australia, was one such measure.3 More recently, financial incentives have been
introduced to reward those who continue working beyond the age pension eligibility
age. Furthermore, tax preferences and asset test concessions have traditionally
favoured accumulation of wealth in the primary home and this approach was given
added impetus by a decade-long period of sustained house price appreciation prior to
the global financial crisis (GFC). It is therefore not surprising that the primary home
has come under scrutiny from governments worldwide as a key store of wealth that
can potentially perform a pension role in retirement (Doling & Ronald 2010).
2 Demographically sensitive spending areas include health, aged care, age-related pensions and
education (Australian Government 2010, p.153). 3 Currently, under the superannuation guarantee legislation, employees aged between 18 and 69 years
old and earning at least $450 in monthly gross earnings are entitled to superannuation guarantee contributions from an employer. Employees aged under 18 years must earn at least $450 in monthly gross earnings and work more than 30 hours per week to be entitled to superannuation guarantee contributions. Employer contributions are equivalent to a minimum of 9 per cent of the employee’s ordinary time earnings, capped at a maximum contribution base (Australian Taxation Office 2012).

7
The pressure on older Australians to increasingly provide for themselves in retirement
by tapping into their housing wealth is evidenced by new policy recommendations that
have dominated discussions surrounding the funding of aged care in Australia.
Indeed, a recent inquiry conducted by the Productivity Commission into the aged care
sector argues that ‘many older Australians with low income have substantial wealth,
which gives them the capacity to meet their lifetime accommodation costs and to
make a modest contribution to the costs of their care’ (Productivity Commission 2011,
p.xxvi).
Moreover, young Australian families now seem prepared to draw down their housing
wealth to meet the acute spending needs that accompany the earlier years of
household formation. This pattern threatens the assumption that future Australians will
enter old age with ample amounts of housing wealth. High divorce rates, delayed
transitions into marriage and rising rates of non-marital cohabitation are eroding
commitment to the traditional family model that has been so conducive to the
achievement of high rates of home ownership (Wood & Ong 2012).
Attitudinal change may also be apparent among baby boomers. Olsberg and Winters’
(2005) study on the future housing intentions of 7000 older Australians aged 50 years
and over confirm that older Australians’ growing desire for independence, flexibility
and lifestyle choices are increasingly driving decision-making surrounding the use of
housing in old age. As a result, traditional values that have typically prioritised family
obligations and underpinned bequest motives are being eroded in favour of the
construction of more self-centred lifestyles.
Purposeful moves by governments to encourage use of the family home to fund
retirement needs, as well as increasing willingness to draw down housing wealth over
their lifetime, has been assisted by deregulation in the financial sector. The
liberalisation of housing finance has facilitated the development of new mortgage
products that allow homeowners to tap into the (traditionally) illiquid wealth held in
their home, and convert housing equity into an income stream that allows them to
boost consumption in retirement. A key consequence is that widespread in situ equity
borrowing has emerged, effectively turning housing wealth into a de facto asset base
for welfare.
At a macro level, this represents a seemingly common-sense solution to the
increasing fiscal pressures associated with population ageing. However, the move
towards housing asset based welfare is predicated on the assumption that investment
in ‘bricks and mortar’ will yield significant returns as house prices continue to increase
indefinitely. In contrast, recent economic events have highlighted the potential
riskiness of housing as a vehicle to fund retirement. Housing wealth is also a unique
asset because the risks associated with future house price movements cannot be
hedged (Shiller 2003). These risks are augmented by life shocks in later life that can
significantly erode housing wealth (Wood et al. 2010a; Smith & Searle 2010). Smith
(2012) notes that as pathways from housing wealth to consumption have emerged via
the introduction of new mortgage products, housing risk has in fact escalated,
exposing significant numbers of homeowners to investment and credit risks and
threatening the overall stability of the home ownership sector. Indeed, as Wood and
Ong (2012) report, 1.65 million episodes of home ownership were terminated by a
move into rental housing over the period 2001–09. This represents a move out of
owner occupation by 20 per cent of Australian homeowners over this period, a figure
that dwarves the 10 per cent of homeowners who cycled out of home ownership in the

8
United Kingdom (UK), a country with similarly developed mortgage markets and high
home ownership rates as Australia.4
Furthermore, Flatau and Wood (2000) argued that the benefits of HEW may be limited
by tax and the impact on means-tested benefits in Australia. While a number of
financial instruments currently exist to enable HEW, the tax-benefit consequences of
HEW in later life are complicated and poorly understood. This can result in ill-informed
decisions about the use of HEW mechanisms to support consumption in retirement.
Indeed, Olsberg and Winters’ (2005) observe a disjuncture between, on the one hand,
a willingness of older Australians to engage in HEW and, on the other hand, evidence
of poor financial planning and lack of literacy regarding government benefits. Bridge et
al. (2010) also highlight a need for more detailed evaluations of the impact of taxation
on reverse mortgages to inform household decision-making on HEW. The poor
supports for decision-making about HEW have implications for policy because,
potentially, they expose many older Australians to financial vulnerability in retirement,
which in turn has ramifications for the viability of the income support system.
Against this backdrop of policy concerns, our project aims to uncover the financial
costs and risks of alternative HEW mechanisms, and makes recommendations about
financial products that can mitigate risks associated with the drawdown of housing
equity by older Australians. The findings of the project will provide insights into
decision-making by Australians surrounding the use of housing equity as they age,
and provide an evidence base to inform government regulation of HEW and their
interventions to assist Australians with the management of their housing wealth in
later life.
4 These estimates have been calculated from the Household, Income and Labour Dynamics in Australia
(HILDA) Survey and the British Household Panel Survey (BHPS). The UK estimates have been calculated over a slightly shorter time period 2001–08.

9
2 CONCEPTUALISING HOUSING EQUITY WITHDRAWAL
This chapter draws from the international literature to inform the conceptualisation of
HEW by older Australians. By HEW, we are specifically referring to any mechanism
that home owners use in order to convert some or all of the illiquid equity held in their
primary homes into income, regardless of whether that equity is being taken out as a
lump sum or in regular payments. It is worth noting that there are many variants of the
terminology used to describe the conversion of housing equity into income by home
owners in the literature. For example, Reifner et al. (2007a, p.1) use the term ‘equity
release’ to describe ‘both the process and the products that allow homeowners to
secure substantial lump sums or regular income payments by realising part of the
value of their homes, while being able to continue to live in it’. Sometimes the terms
‘conversion’, ‘extraction’ or ‘mobilisation’ (p.3) may be used. Smith and Searle (2008)
and Ong et al. (2013) use HEW as an umbrella term for a range of methods through
which the equity in the home can be converted into income. In our study, we use the
term HEW broadly in a similar way to Smith and Searle (2008) and Ong et al. (2013).
HEW is later used interchangeably with the term ‘equity release’ in this Positioning
Paper in our cross-country comparisons in Chapter 3, where Reifner et al. (2007a, b)
is a major source of reference for our literature review.
We begin by elaborating on the broad theoretical frameworks that underpin research
into the role of housing equity in an ageing population in Section 2.1. Section 2.2
explores how HEW has been conceptualised in the existing literature and
recommends a typology which provides the framework for systematically describing
and comparing various HEW mechanisms. These comparisons are fleshed out in
Section 2.3, where we focus on differences in characteristics of the HEW
mechanisms, including any costs and risks associated with the use of HEW.
2.1 Theoretical framework
Analysis of wealth accumulation and divestment has traditionally been grounded in
the life cycle theory of consumption (see, e.g. Modigliani & Brumberg 1954; Hurd
1990; Davies & Shorrocks 2000). The life cycle theory hypothesises that households
will engage in consumption smoothing over the life cycle based on expected lifetime
or permanent income. Hence it is predicted that household wealth acts as a buffer
between consumption and income, that is, households will engage in wealth
accumulation during the earlier part of their life course when income exceeds
consumption, and draw down their wealth when income falls below levels required to
fulfil consumption needs in later life. In its simplest form, the life cycle theory suggests
that an individual will exhaust all of his or her wealth by the end of the life cycle. The
theory thus predicts that homeowners will cash in their housing equity to fund
consumption in later life. Indeed, in recent years, there has been mounting interest in
the specific role of housing wealth as a buffer to smooth income fluctuations. In a life
cycle model where no uncertainty or moving costs exist, a rational homeowner will
progressively engage in HEW after passing the peak of life cycle earnings until s/he
possesses zero housing equity upon death (Skinner 1996).
Haffner (2008) notes, however, that in reality, the hypothesis is complicated by such
factors as capital market imperfections, uncertainties regarding life expectancies and
bequest motives. As regards capital market imperfections, Skinner (1996, p.242)
points out that housing wealth is only a ‘sideshow’ if moving costs are high or financial
markets do not offer products that facilitate HEW. Under these scenarios,

10
homeowners are unlikely to tap into their housing equity by moving or withdrawing
housing equity in situ even if house prices appreciate significantly.
Bequest motives offer an alternative explanation for the reluctance of homeowners to
draw down on their housing equity in later life.5 However, various studies have cast
doubt on the importance of bequest motives in wealth accumulation and divestment
decisions. For example, Hancock et al. (2002) highlighted that bequest motives
seldom constitute the most important reason driving savings behaviour. Hamnett
(1999) goes further by arguing that, at least in the UK, the expectation that
homeowners would resist engaging in HEW in order to bequeath their housing wealth
to their beneficiaries was not supported by existing data. In Australia, Olsberg and
Winters (2005) report a noticeable shift in the values of older Australians, in that they
are increasingly prepared to tap into their housing equity to fund lifestyle choices in
retirement. This trend has coincided with a weakening of bequest motives among
older Australians. Wood and Nygaard (2010) further point out that transfers to children
are more likely to occur before one’s retirement for children’s education expenses, or
for their first transition into home ownership.
The evidence increasingly suggests a growing preparedness on the part of those
approaching retirement to engage in HEW via the use of flexible mortgage products
that have increased the fungibility of housing wealth and now allow homeowners to
draw down on housing equity frequently in a relatively less costly manner than
compared to the past. Smith (2004) notes that in the UK, a larger proportion of British
homeowners aged 45–64 years are now willing to tap into their housing equity during
retirement than those aged 65–80 years old. Similarly, as Section 4.3 will show, those
newer cohorts of Australian homeowners aged 45–64 years appear to be prepared to
carry more mortgage debt into retirement than ever before.
Given these developments, many studies are drawing on the precautionary savings
model, which postulates that household wealth plays an insurance role with respect to
unexpected financial expenditures as well as other unanticipated adverse events
occurring during the life course, such as marital breakdown and ill health (Skinner
1996; Wood & Nygaard 2010). Indeed, multiple empirical studies found that
homeowners are more likely to engage in HEW when they suffer from adverse life
shocks, which can be financial or non-financial in nature (Skinner 1996; Benito 2007;
Parkinson et al. 2009).
2.2 A typology for defining housing equity withdrawal
Housing equity withdrawal (HEW) is an umbrella concept that can encompass a
variety of channels through which equity stored in the owner-occupied home is
converted from its illiquid form into cash (Klyuev & Mills 2006, republished in 2007 and
2010). This cash can be used for a variety of purposes, including consumption,
investment or savings, and gifts. Housing asset-rich but income-poor owner-occupiers
may find HEW an attractive way of using their housing equity to supplement incomes
(Ong 2008). However, the consequence of engaging in HEW is that it does reduce the
amount of housing equity held by property owners.
Traditionally equity withdrawal required either sale of the home, or if a move was
undesirable, refinancing which meant taking out a new larger mortgage. Both
channels are costly and time consuming methods of equity extraction. However,
financial deregulation and rising house prices in the 1980s and 1990s was
accompanied by new innovations that allow in situ mortgage equity withdrawal
5 This theory does of course predict that homeowners without children will progressively cash in on their
housing equity, in line with the proposition put forward by the traditional life cycle model (Wood & Nygaard 2010).

11
(MEW). The homeowner can now use flexible mortgage products that allow the
release of housing equity by simply adding to existing mortgage balances using the
home as collateral (Smith & Searle 2008). There is no costly application process;
these products turn housing wealth into an ‘ATM’ with borrowers drawing down or
adding to their housing equity as and when they choose.
In this section, we outline a typology for defining HEW, aided by a graphical
representation in Figure 1. We begin by distinguishing between two key forms of HEW
based on whether the equity withdrawal is made possible through a sale of the
primary home, or through an in situ withdrawal. There are typically two parties in a
HEW transaction—the equity extractor and the provider of cash. Under the sale
model, the equity extractor is the homeowner who sells his or her home to withdraw
housing equity, while the provider of cash is simply the party that purchases the sold
property. Under the in situ MEW model, the equity extractor is the homeowner who
adds to the mortgage loan while remaining in situ; here the homeowner extracts
equity by functioning as a borrower, while the cash provider is the lending institution
that originates the mortgage loan.
It is noteworthy that certain HEW products, such as reverse mortgages, are generally
only available to homeowners aged around 60 years and over. However, the ABS
(1995) classifies those aged 45 years and over as having passed their prime working
years. It is reasonable to therefore infer that asset accumulation and divestment
decisions will become more critical from age 45 onwards. Furthermore, as mentioned
in Section 1.2, the ageing of the baby boomers will no doubt influence every domain
of Australian public policy as they increasingly dominate changing trends in needs,
attitudes and preferences. These baby boomers are currently concentrated in the 45–
64 years age group.6 Hence, we will also incorporate discussions on products that are
more widely available to the general population and therefore accessible by baby
boomers, such as home equity lines of credit (HELOCs).
2.2.1 Sale of the home
Sell and move
When a home is sold, the equity stored in the home, defined as the sale price of the
home less the debt owed against it, is released. The sale of one’s home is typically
followed by a move into another dwelling. This ‘sell and move’ model permits
withdrawal of housing equity in one of three ways. First, a homeowner may trade
down into a less expensive dwelling and choose to hold less equity in the new home.
A move to a less expensive dwelling is also called downsizing.
A more complicated scenario ensues when the sale of the old home is followed by the
purchase of a more expensive dwelling. HEW could still occur if over-mortgaging
takes place, that is the homeowner takes out a larger loan on the more expensive
home such that the homeowner holds less housing equity after the move.
Finally, the ‘sell and ‘move’ transaction can also occur via an exit from owner
occupation into rental housing.
To distinguish between these three ‘sell and move’ options, consider the following
hypothetical example of a homeowner who sells his or her primary home, valued at
$400 000. Suppose the debt secured against this home at the point of sale is
$150 000. The equity held in this home is therefore $250 000, the difference between
the value of the home and the debt secured against it.
6 Baby boomers are usually defined as those born during the post-war years of 1946–65 (ABS 1999).

12
Suppose this homeowner buys a house at the lower price of $320 000 and secures
the same mortgage debt ($150 000) against the purchased home. Housing equity
after the move is thus $170 000, which is less than the pre-move equity of $250 000.
The amount of equity withdrawn via trading down or downsizing is then $80 000.
Now assume that this homeowner buys a house for $430 000 which is more
expensive than the old home. Suppose a mortgage debt of $200 000 is secured
against the purchased home, that is s/he takes out a debt that is greater than the debt
secured against the old home. The net amount of equity withdrawn via over-
mortgaging is therefore $20 000, as post-move housing equity ($230 000) is $20 000
less than pre-move housing equity ($250 000).
The last option, exit into the rental sector, is much simpler with equity withdrawn equal
to the amount held at sale ($250 000).
Sell and stay
Housing equity withdrawal (HEW) via sale of one’s home can also occur via a ‘sell
and stay’ model, under which the seller receives funds from the cash provider which
amount to less than the market value of the dwelling, but is granted the right to
continue living in the dwelling after the sale has occurred (ASIC 2005; VEH 2012).
‘Sell and stay’ options are typically executed through home reversion schemes. The
Australian Securities and Investments Commission (ASIC 2005) notes that there are
at least two main types of products that fall under the home reversion scheme in
Australia—sale and leaseback and sale and mortgage (ASIC 2005).
Under the sale and lease back model, the title of the property passes to the cash
provider upon sale of the property, who in turn leases the property back to the seller
after the sale.7 Under the sale and mortgage model, the owner-occupier sells a
percentage of the property to the cash provider. However, the title of the property is
retained by the owner-occupier, who gives the provider a mortgage (in the sense of
collateral) over the property which implies that permission of the cash provider must
be sought in relation to all financial transactions pertaining to the property (ASIC
2005).
The boundaries between products are not always clear-cut, and indeed, products with
the same name may differ in characteristics across countries. Another variant of the
‘sell and stay’ model, under which the property title does not pass fully to the cash
provider upon sale, involves selling part of the dwelling or selling it incrementally.
These mechanisms are generally known as staircasing down in shared equity
schemes, implying that the original owner begins renting increasingly bigger portions
of the dwelling as time passes (Monk & Whitehead 2010). These options will be
omitted from our discussion from this point onwards, because in principle they
function to allow the purchaser to build up housing equity incrementally, rather than to
assist the party that sells the dwelling incrementally to withdraw housing equity.
2.2.2 In situ mortgage equity withdrawal
Compared to the traditional sale model discussed in Section 2.2.1, in situ MEW is a
relatively new style of HEW made possible by widespread financial deregulation and
considerable mortgage production innovation that took place in the 1980s and 1990s.
7 Note, however, that Reifner et al. (2007a) do not classify the sale and lease back model as a type of
home reversion scheme. Instead, they distinguish between a home reversion and sale and lease back model by stating that the former is classified as one of the ‘products within the range of private pension schemes’ (p.3), while the latter is not, and explaining that rental payments are not necessarily part of the contract under a home reversion scheme, while it would be a key component of a sale and lease back contract.

13
Their emergence or rather their success was helped along by soaring house prices
between the mid-1990s and mid-2000s, and historically low interest rates over the
same period.
Stay and not sell
The more conventional forms of MEW involve refinancing an existing loan to withdraw
more equity than the existing loan permits, or simply taking out an additional loan, for
example a second mortgage, against the primary home. Generally, repayment of
these loans begins as soon as the loan is established, usually in the form of regular
repayments over the loan tenure.
More recently, flexible mortgages have grown in popularity in countries with well-
developed mortgage markets, such as Australia and UK. Broadly speaking, a flexible
mortgage is a secured loan that can be repaid in varying instalments while at the
same time allowing the homeowner-borrower to access his or her housing equity up to
some agreed limit. During the term of the loan, flexible mortgages offer the borrower
five key facilities; early repayment of the loan is possible through overpayments and
lump sum injections, while HEW is facilitated via lump sum extractions,
underpayments or taking payment holidays (Smith et al. 2002). An example of a
flexible mortgage product is offset mortgages, available in Australia and the UK,
whereby transaction balances are simply offset against a homeowner-borrower’s
mortgage debt (Klyuev & Mills 2006, republished in 2007 and 2010). Similarly,
products such as HELOCs allow homeowners to use a line of credit to borrow funds
up to some specified credit limit, using the primary home as collateral.
Hence, in essence, a flexible mortgage operates like an overdraft facility that allows
the borrower to add to his or her mortgage without having to undergo any costly
application process (typically attached to refinancing or additional loan applications)
as long as the borrower remains below a pre-agreed credit limit. The implication is
that current cohorts of older homeowners are much more likely to have relatively easy
access to HEW than past cohorts, and indeed we find in Section 4.3 that recent
cohorts of Australian homeowners aged 45–64 years are much more likely to be
carrying mortgage burdens into old age than ever before.
Several types of deferred loans are also available, which essentially allow for MEW to
occur by deferring the loan repayment till a later date. For example, under a rollup
loan, less interest is paid and/or less capital repayment takes place than normally
would be the case. The deferred interest and capital repayments are added to the
outstanding mortgage loan balance, hence increasing the loan amount and in effect
allowing the homeowner to tap into their housing equity. If the specified date of
repayment is not linked to the sale of the property, then in principle it constitutes a
‘stay and not sell’ option. Similarly, an interest-only loan effectively allows
homeowners to withdraw equity from the home by avoiding the need to make capital
repayments for a specified loan period.
Stay and sell
An increasingly common MEW product targeted at homeowners aged 60 years and
over is reverse or lifetime mortgages (see e.g. Reifner et al. 2007b; Schneider 2009b;
The Wriglesworth Consultancy 2011). This product allows borrowers to draw on loans
for which repayment is not required until the house is sold, with the sale proceeds
channeled towards repayment of the loan. The reverse mortgage lender provides
funds to the homeowner borrower in the form of a regular income stream or in lump
sums during the term of the loan, and unlike a conventional mortgage, no repayments
are made until the borrower dies or the house is sold at the end of the loan term. The
outstanding loan balance at the end of the loan term typically comprises the original

14
loan amount plus the interest accrued over the life of the loan. The viability of reverse
mortgages rests on house prices appreciating sufficiently to offset the outstanding
loan balance at the end of the loan tenure (Ong 2008, 2010).
As mentioned previously, deferred loans such as rollup loans essentially allow for
MEW to occur by deferring the loan repayment to a future time period. Sometimes,
repayment of a deferred loan can be tied to the sale of the property which acts as a
collateral for the loan. In such a situation, a deferred loan would fall under a ‘stay and
sell’ option.
In addition, shared appreciation mortgages (SAMs) can be used to reduce the interest
that a homeowner-borrower is required to pay, in return for the homeowner-borrower
sharing the property’s capital gains with the mortgage lender (ASIC 2005). Hence,
when the house is sold, some of the equity released will be diverted to the SAM
provider instead of to the homeowner.
A typology of these housing equity withdrawal mechanisms is illustrated in the
following Figure 1:

15
Figure 1: Housing equity withdrawal mechamisms—a typology
Reverse or
lifetime mortgage
Deferred
mortgage
Refinancing,
additional loan,
flexible mortgage,
e.g. offset mortgage,
HELOCs
Stay and sell Stay and not sell
In situ mortgage equity withdrawal (MEW)
Property title does
not pass to cash
provider upon sale,
e.g. sale and
mortgage
Property title
passes to cash
provider upon sale,
e.g. sale and lease
back
Sell and stay
Buy by over-
mortgaging
Rent
Buy by
trading down
/ downsizing
Sell and move
Housing equity withdrawal (HEW)
Sale of home

16
2.3 Comparisons of alternative HEW mechanisms
2.3.1 Key characteristics of alternative HEW mechanisms
Table 1 summarises the key characteristics of different HEW mechanisms. It is clear
that sale of the home does occur at some point if equity is to be withdrawn under the
sale option. Those who opt to ‘sell and move’ or ‘sell and stay’ must transfer their
ownership rights at the beginning of the contractual relationship which initiates the
HEW process. As mentioned previously, however, some products such as sale and
mortgage allow the seller to retain partial rights over the property. Under reverse
mortgages (and certain types of deferred mortgage loans), sale of the home also
occurs, though the transfer is usually deferred until the end of the loan term. Hence,
these types of mortgage can be regarded as a form of ‘stay and sell’ model, as the
loans are conditional on the house being sold at the end of the loan term to repay the
loan. These forms of HEW contrast with the use of ‘stay and not sell’ options, which
include additional loans, refinancing and flexible mortgages, where no sale of the
property need occur.
Equity extractors who use in situ channels retain the right to remain in the home, and
in general they retain legal ownership status over their home as well. In contrast,
withdrawing equity via selling the home results in the loss of all or some legal rights
over the property, though the ‘sell and stay’ options (home reversion or sale and lease
back schemes) do allow the seller to remain in the home.
Legal ownership rights are tied to responsibilities to maintain the property. This
implies that in situ MEW borrowers will remain responsible for the maintenance of the
home. This contrasts with the sale model, where the sale of the home occurs at the
beginning of the contractual relationship. Under this model, while the occupant may
remain in the dwelling under the ‘sell and stay’ model, s/he will not remain owner of
the house and therefore generally does not bear responsibility for ensuring that the
house is maintained at an appropriate standard. It should be noted that specific
contractual clauses may stipulate that the occupant is expected to take reasonable
care of the property, though even under this scenario, the occupant’s incentive to
maintain the property at an appropriate standard will be lower after the sale.
The proportion of equity that can be extracted varies with each HEW mechanism. It is
not surprising to find that homeowners are typically able to withdraw up to 100 per
cent of their equity via the traditional models such as selling and downsizing or
moving into the rental sector. However, less can be withdrawn under the ‘sell and
stay’ model. ASIC (2005) notes that the amount withdrawn via home reversion would
be typically between 35 per cent and 60 per cent of the market value of the home. In
situ MEW can only be operationalised through mortgage products; the existence of
lenders’ risks and loan servicing fees imply that lenders will not typically allow the
homeowner-borrowers to withdraw up to 100 per cent of their equity. For example, the
maximum loan advance that lenders are typically willing to make to Australian reverse
mortgage borrowers range from 15 per cent to 40 per cent of housing equity,
increasing with the age of the borrower (Hickey et al. 2007). While equity amounts
generally must be withdrawn as lump sums when the home is sold, mortgage
products offer more flexibility because borrowers may request that funds be released
as lump sums or small amounts in a regular income stream or under a line of credit
arrangement.

17
Table 1: Comparisons of the characteristics of alternative HEW mechanisms
Key characteristics Sale of the home In situ MEW
Sell and movea Sell and stay Stay and not sell Stay and sell
Buy and trading down
Buy and over-mortgage
Rent
Key parties
Equity extractor Seller of home Seller of home Seller of home Seller of home In situ homeowner-borrower
In situ homeowner-borrower
Provider of cash Buyer of home Buyer of home Buyer of home Insurance company or other providers such as a reversion company
Lending institution, e.g. bank, mortgage lender or broker
Lending institution, e.g. bank, mortgage lender or broker
Timing
Timing of sale of the home from which equity is withdrawn
Beginning of contractual relationship which initiates the HEW process
Beginning of con-tractual relation-ship which initiates the HEW process
Beginning of contractual relationship which initiates the HEW process
Beginning of contractual relationship which initiates the HEW process
Not applicable End of contractual relationship which facilitates the HEW process
Repayment of mortgage
Not applicable Not applicable Not applicable Not applicable During occupation phase
At the end of the loan tenure from sale proceeds
Equity extractors’ rights and responsibilities in regard to the home from which equity is withdrawn
Remain in dwelling?
No No No Yes Yes Yes
Retain rights over the home?
No
No
No No, if the property title passes fully to the cash provider. However, if the title does not pass fully to the cash provider, some property rights are retained
Yes Yes

18
Key characteristics Sale of the home In situ MEW
Sell and movea Sell and stay Stay and not sell Stay and sell
Buy and trading down
Buy and over-mortgage
Rent
Responsible for maintenance?
No No No No, the provider of cash is ultimately responsible, unless contractual clauses stipulate that this is the responsibility of the occupant
Yes Yes
Equity characteristics of HEW
Amount of equity withdrawn (before application of taxes or other costs
100% Typically less than 100% due to over-mortgaging
100% Typically less than 100% Typically less than 100%
Typically less than 100%
Form in which cash is provided
Lump sum Lump sum Lump sum Regular stream or lump sum Regular stream, lump sum or line of credit
Regular stream, lump sum or line of credit
Note:
a. The primary purpose of the table is to provide details of each HEW mechanism that is directly relevant to the process of HEW (not after it). Hence, the table does not provide details on the rights and responsibilities that the equity extractor will obtain after s/he moves into a new dwelling.
Source: Own elaboration based on ASIC (2005), Bridge et al. (2010), CFPB (2012), Fornero et al. (2011), Reifner et al. (2007a, b), Smith and Searle (2008), Vorms (2009)

19
2.3.2 Costs of alternative HEW mechanisms
Costs borne by equity extractors vary for different forms of HEW, as Table 2 shows.
Mortgage products generally have servicing fees attached to them. However, those
who opt for the traditional sale model will typically incur moving costs, as well as lump
sum taxes. These taxes may operate as a barrier to equity withdrawal (Reifner et al.
2007a; see also Angelini & Laferrère 2011).
As indicated in Table 2, the equity extractor may incur Capital Gains Tax (CGT) upon
sale of the old home. If CGT is applicable, it will affect the amount of equity available
for withdrawal under the sale model. As CGT can often be deferred if the sales
proceeds of the old house are reinvested in a new dwelling, it will be payable on the
final sale of a house by the same consumer (Oxley & Haffner 2010; Yates 2012).
Thus, if the option of selling to move into the rental sector or home reversion is
exercised, CGT is payable. It is worth mentioning that CGT can also be incurred when
a property is sold at the end of a reverse mortgage or deferred loan (though this
occurs at the end of the HEW period rather than at the point that HEW starts). The
broad consequence is that the equity extractor will have to pay the tax directly out of
the sales proceeds leaving less equity available for other purposes.
If the equity extractor were to purchase a new home by trading down or over-
mortgaging, s/he would face transaction taxes upon purchase of the new dwelling
(e.g. stamp duty in Australia). Hence, some of the equity extracted from the old
dwelling will be used to meet these transaction taxes. Even under a ‘sell and stay’
scenario, a transaction tax may affect the amount of equity that can be extracted
indirectly, as the provider of the funds will have to pay the transaction tax.
However, it is important to note that the applicability of these taxes may differ across
jurisdictions. For example, the sale of the primary home is exempt from CGT in
Australia. Hence, the issue of taxation is discussed further in Chapter 3, when cross-
country comparisons are made. Last but not least, it must be kept in mind that other
taxes may apply. For example, in countries such as the Netherlands, personal income
tax is levied annually on the return (imputed interest income or dividend) from the
sales proceeds saved or invested, while equity is not taxed as long as it is embodied
in the principal home (Haffner 2002). Similarly, regular payments drawn from housing
equity may be regarded as income in some instances and therefore incur income tax
(Reifner et al. 2007a).

20
Table 2: Comparisons of the financial costs of alternative HEW mechanisms
Key characteristics Sale of the home In situ MEW
Sell and movea Sell and stay Stay and not sell Stay and sell
Buy and trading down
Buy and over-mortgage
Rent
Loan servicing fees Not applicable Not applicable Not applicable Not applicable Yes Yes
Moving costs Yes Yes Yes Not applicable Not applicable Applicable on sale at the end of the loan tenure
Taxes incurred by equity extractor
CGT on sale. The equity extractor will typically incur transaction or conveyance tax upon purchase of the new dwelling as part of the HEW process.
CGT on sale. The equity extractor will typically incur transaction or conveyance tax upon purchase of the new dwelling as part of the HEW process.
CGT on sale CGT on sale Not applicable CGT on sale at the end of loan tenure
Taxes incurred by cash provider
Transaction or conveyance tax on purchase of property
Transaction or conveyance tax on purchase of property
Transaction or conveyance tax on purchase of property
Transaction or conveyance tax on purchase of property
Not applicable Not applicable
Note:
a. The primary purpose of the table is to provide details of each HEW mechanism that is directly relevant to the process of HEW (not after it). Hence, the table does not provide details on the rights and responsibilities that the equity extractor will obtain after s/he moves into a new dwelling.
Source: Own elaboration based on ASIC (2005), Bridge et al. (2010), CFPB (2012), Fornero et al. (2011), Reifner et al. (2007a, b), Smith and Searle (2008), Vorms (2009)

21
2.3.3 Risks of alternative HEW mechanisms
In housing and mortgage markets, homeowners are exposed to various sources of
risk. In this section, we restrict our attention to risks that are directly associated with
HEW, in particular, interest rate risk, house price risk and negative equity risk, as
summarised in Table 3.
Firstly, mortgage loan borrowers may be vulnerable to interest rate risk. An increase
in the interest rate might affect the borrower’s ability to make loan repayments. If the
interest rate is fixed, borrowers may find themselves paying too much for a loan
during periods when interest rates are falling. When homeowners engage in in situ
MEW or over-mortgaging, they are increasing the amount of loan secured against
their home, hence increasing their exposure to interest rate risk.
Secondly, while it is true that all homeowners are exposed to some degree of house
price risk; unexpected fluctuations in dwelling price can result in abnormal capital
losses (or gains) (Reifner et al. 2007a). However, in recent years, homeowners have
become increasingly exposed to house price risk, given the volatility experienced in
housing markets worldwide. Engaging in MEW at a time of housing market volatility
can expose equity extractors to greater levels of house price risk, leaving them with a
smaller amount of equity at the end of their loan than expected compared with those
who choose to avoid MEW in a capricious financial environment. Moreover, an owner-
occupier can end up holding negative equity if house prices should fall below the
outstanding mortgage debt secured against the home (Reifner et al. 2007a). Thus,
exposure to negative equity risk increases when one engages in MEW.
Table 3: Risks directly associated with alternative HEW mechanisms that are borne by
equity extractors engaging in HEW
Key risks
Sale of the home In situ MEW
Sell and movea
Sell and stay Stay and not sell
Stay and sell
Buy by trading down
Buy and over-
mortgage
Rent
Interest rate risk
No, with respect to the sold dwelling
No, with respect to the sold dwelling
No No, the risk is passed on to the provider of cash
Yes Yes
House price risk
No, with respect to the sold dwelling
No, with respect to the sold dwelling
No No, the risk is passed on to the provider of cash
Yes Yes
Negative equity risk
No, with respect to the sold dwelling
No, with respect to the sold dwelling
No No, the risk is passed on to the provider of cash
Yes Yes, unless the borrower is protected by a no negative equity guarantee
Note:
a. This table does not account for risks incurred with respect to the new dwelling and possibly the new loan by those who trade down or over-mortgage. If a new dwelling is purchased, it will be subject to house price risk. Furthermore, if a mortgage is taken out on the new dwelling, negative equity and interest rate risks will be present. Only in the case of renting will the equity extractor be protected from all these risks.
Source: Own elaboration

22
2.4 Summary
This chapter has drawn from the international literature to describe the broad
theoretical frameworks that underpin research into HEW in an ageing population. A
typology has been developed, which provides a broad conceptual framework for
systematically describing and comparing various HEW mechanisms. We have
distinguished between two key forms of HEW based on whether the equity withdrawal
is made possible through a sale of the primary home, or through in situ MEW.
Broadly speaking, the sale method of withdrawing housing equity is affected by the
levying of taxes when properties are sold and bought, such as CGT and conveyance
tax on the purchase of property. On the other hand, in situ MEW appears to be
susceptible to more forms of risks than the ‘sell and move’ mode. These risks include
interest rate risk, house price risk and negative equity risk. It is worth highlighting that
the risks attached to the ‘sell and stay’ model appear to be minimal, but home
reversion products are not offered widely in many countries (see Sections 3.2 to 3.7)
and in some instances, may result in a lack of tenure security for the occupier (see,
e.g. sale and lease back products in the UK as described in Section 3.3).
This chapter has provided broad generalisations in relation to the characteristics,
costs and risks of alternative forms of HEW. This has been necessary in order to
conceptualise HEW and develop a typology according to key themes that have
emerged in the literature in relation to the different styles of HEW. However, the
pervasiveness and effectiveness of alternative styles of HEW will vary across
countries as they will be dictated to some extent by differences in institutional settings.
For example, ‘sell and move’ options may be affected by the size and quality of the
rental sector in a country. Hence, the next section will report findings from a series of
country-specific reviews that will highlight the influence of divergent institutional
settings on HEW by older homeowners.

23
3 HOUSING EQUITY WITHDRAWAL: A CROSS-COUNTRY COMPARISON
This chapter presents the results of a selective international survey focusing on HEW
mechanisms that are available in six developed countries: Australia, UK, United
States (US), Netherlands, Finland and Germany. The purpose of reviewing countries
other than Australia is two-fold. First, by comparing developments in HEW in Australia
against other countries, we are able to evaluate the extent to which the institutional
environment in Australia supports or discourages the use of HEW by older Australians
as opposed to countries with different institutional settings. Secondly, the international
review will form an essential base upon which we can canvass products or schemes
that may mitigate the risks of HEW to address our fourth research question in the next
stage of our research.
3.1 Selection of countries
The selection of countries was based on three criteria. The first criterion is based on a
country’s home ownership rate; the rationale being that owner-occupation in a country
has to be prevalent in order for the population to develop distinct attitudes and views
towards the use of housing equity in retirement (Haffner 2008). Figure 2 shows the
home ownership rates of 27 countries in the European Union (EU), Australia and the
US. Most countries have relatively high rates of home ownership that exceed 50 per
cent. Germany’s home ownership rate is noticeably lower, at a little above 40 per
cent.

24
Figure 2: Home ownership rates, most recent year available a b
Notes:
a. The countries that are reviewed in our study have been depicted using red bars.
b. Schwartz and Seabrooke (2008) also provide home ownership rates for OECD countries. Their estimates are comparable to the ones reported in this figure.
Sources: EMF (2010); Australian home ownership rate from Oxley et al. (2010)
The second criterion is based on the maturity and depth of mortgage markets in each
country. We expect that the existence of well-developed mortgage markets is
necessary in order for MEW to flourish. On the other hand, in countries with less
developed mortgage markets, HEW via sale of the primary home might be more
prevalent given limited mortgage products that facilitate MEW without the homeowner
having to move. The size of a country’s mortgage market in relation to its GDP can be
used as a general proxy for the extent of development of mortgage markets in the
country, that is the more developed a country’s mortgage market, the bigger its
expected share of GDP. Figure 3 lists the share of outstanding mortgage loans as a
proportion of GDP for a range of countries in the EU, as well as Australia and the US.
As shown in the figure, the Netherlands, Australia, UK, US, Ireland, Sweden and
Denmark all have mortgage shares that exceed 75 per cent of GDP, and have
noticeably higher mortgage shares than the EU-27 average of 52 per cent. Mortgage
shares in the Netherlands and Denmark exceed 100 per cent of GDP, while Germany
can be found at the other end of the spectrum, if only the Western countries are taken
into consideration.
40 50 60 70 80 90 100
Australia
US
EU-27
UK
Sweden
Spain
Slovenia
Slovakia
Romania
Portugal
Poland
Netherlands
Malta
Luxembourg
Lithuania
Latvia
Italy
Ireland
Hungary
Greece
Germany
France
Finland
Estonia
Denmark
Czech Republic
Cyprus
Bulgaria
Belgium
Austria
Homeownership rate

25
Other measures indicating the extent of mortgage markets are available in the
literature. For example, Tsatsaronis and Zhu (2004) point out five aspects of the
mortgage market that can affect its development. Firstly, the study argues that in
countries where mortgage contracts are largely based on variable interest rates,
borrowers may have more flexibility to take on bigger mortgage loans while keeping
interest repayments relatively low if interest rates are declining. Secondly, the
availability of developed MEW mechanisms is an indicator of a well-developed
mortgage market. Thirdly, higher loan-to-value ratios (LVRs) reflect greater ability by
banks to lend using housing as collateral. Fourthly, countries where property valuation
methods are based largely on market values rather than historical values are better
able to keep up with changing market trends. Finally, the presence of mortgage-
backed securities also point to a relatively well-developed mortgage market.
Chiuri and Jappelli (2010) have subsequently developed an index of mortgage market
regulation based on the five criteria specified by Tsatsaronis and Zhu (2004) as a
proxy for limited mortgage market development for a range of countries, which include
Austria, Belgium, Canada, Denmark, Finland, France, Germany, Ireland, Italy,
Luxembourg, Netherlands, Sweden, UK and US. The index ranges from 0.1
(representing a well-developed mortgage market) to 0.9 (representing very limited
mortgage market development). As shown in Table 4 of Chiuri and Jappelli (2010),
Australia and the UK were assigned an index of 0.1, and therefore classified (along
with Ireland) as featuring the most developed mortgage markets among all the
countries studied. The US was assigned an index of 0.3, which also indicated that it
had a relatively well-developed mortgage market. In the intermediate range, Finland
and Netherlands were assigned an index of 0.5. At the upper end, Germany’s index
was 0.7, representing increasingly limited mortgage market development.8
The picture provided by Figure 3 appears to be largely supported by these indexes.
As shown in the figure, Australia and the UK have the high outstanding mortgage debt
to GDP share of over 80 per cent; at the same time they rank as having the most well-
developed mortgage markets according to Chiuri and Jappelli’s (2010) indexes. This
is followed by US, which has a debt to GDP share of over 70 per cent while being
assigned the next lowest index of mortgage market regulation by Chiuri and Jappelli
(2010). Finland and Germany have the lowest debt to GDP share of 40–50 per cent
among the six countries reviewed, and indeed they are also classified has having
relatively limited mortgage market development according to Chiuri and Jappelli
(2010).
Interestingly, however, while the Netherlands have a mortgage debt to GDP share
exceeding 100 per cent, they are classified as a relatively limited mortgage market by
Chiuri and Jappelli (2010). The indexes have been constructed based on somewhat
older 2001–03 data reported in Tsatsaronis and Zhu (2004), during which the
Netherlands mortgage market predominantly offered fixed rate mortgages and
relatively low average LVRs of 75 per cent. A more up-to-date index by the
International Monetary Fund (IMF 2008) ranks the Netherlands third in terms of the
extent of mortgage market development, after the US (0.98) and Denmark (0.82) but
before Australia (0.69). This index is constructed somewhat differently from Chiuri and
Jappelli (2010). For instance, the IMF (2008) index takes into account fee-free
prepayment of loans relevant for refinancing, but not fixed or variable interest rates.
The IMF index is also based on more recent data for the period 2003–06, during
which the Netherlands had an LVR of 90 per cent, the highest among all the countries
considered by the IMF. These inconsistencies indicate that the method by which the
8 Austria, Belgium and Italy were all assigned an index of 0.9, representing even more limited mortgage
market development.

26
index is constructed, as well as the time period of the underlying data, can influence
country rankings. Nonetheless, it is obvious that LVRs in the Netherlands have
climbed in recent years, and by 2010 the mortgage market in the Netherlands has
exceeded 100 per cent of GDP.
Figure 3: Share of outstanding mortgage loans in GDP, 2010 a b c
Notes:
a. The countries that are reviewed in our study have been depicted using red bars.
b. The amount of outstanding mortgage loans for the Netherlands is overestimated as the savings options connected to endowment loans are not included.
c. The mortgage shares for Australia are for the year 2009. Schwartz and Seabrooke (2008) estimate the residential mortgage shares for Australia to be over 300 per cent of GDP, rather than the 90 per cent reported in this figure. Estimates for other countries are more similar across Schwartz and Seabrooke (2008) and our study. Nonetheless, the estimates from both concur in the sense that they show that Australia has one of the highest outstanding mortgage debt as a share of GDP among developed countries.
Sources: EMF (2010); Australian mortgage shares from IMF (2011)
These criteria suggest that Australia, UK, US and the Netherlands should be included
in the group of countries that are reviewed. All have relatively high rates of home
ownership (>60%) and large mortgage markets compared to other EU countries
(>75% of GDP). Furthermore, Australia functions as the home country for this study,
and the US is the country where reverse mortgage schemes started in the 1980s. The
UK is a European liberal welfare state with a developed mortgage market where at the
same time a significant amount of MEW has taken place (Reifner et al. 2007a, b).
0 10 20 30 40 50 60 70 80 90 100 110
Australia
US
EU-27
UK
Sweden
Spain
Slovenia
Slovakia
Romania
Portugal
Poland
Netherlands
Malta
Luxembourg
Lithuania
Latvia
Italy
Ireland
Hungary
Greece
Germany
France
Finland
Estonia
Denmark
Czech Republic
Cyprus
Bulgaria
Belgium
Austria
Outstanding mortgage debt as a percent of GDP

27
Overall, the literature contains ample evidence pointing to a proliferation of in situ
MEW in these three countries. For example, Greenspan and Kennedy (2007) estimate
that in the US, in situ MEW accounted for 80 per cent of the rise in home mortgage
debt from 1990 to the mid-2000s. Ong et al. (2013) confirm that in situ MEW is by far
the most frequent form of equity withdrawal in both Australia and the UK, accounting
for 90 per cent of HEW transactions in both countries over the period 2001–08. The
Netherlands has the biggest mortgage market relative to GDP (IMF 2008) offering a
variety of mortgage lending options (see, e.g. Klyuev & Mills 2006, republished in
2007 and 2010). Moreover, it has an increasing home ownership rate, especially since
the 1990s (Dol & Haffner 2010) and has been closing in on the 60 per cent share that
has been easily attained in Australia, US and UK.
Our third criterion is based on the need to achieve diversity in the selection of
countries. We therefore include Finland and Germany as the last two countries in our
study. Home ownership is the major form of housing tenure in Finland (almost 60%)
as in the Anglo-Saxon countries, but its mortgage market is much smaller. This could
be due to the extent of regulation; Finland’s financial markets are more regulated than
other countries, and typically feature low LVRs, short average loan terms and the
absence of fee-free prepayment of mortgage loan (IMF 2008). The inclusion of
Finland will allow us to examine whether the sale of the home is a more popular form
of HEW than in situ MEW when a country has less developed mortgage markets.
Germany is an interesting contrast because it has the smallest share of home
ownership (complemented by a well-functioning rental market), and a relatively small
and regulated mortgage market that is comparable to Finland’s. Hence, Germany
makes for an interesting case study to address the question of whether German
homeowners are more willing than in other countries to sell up and move into the
rental sector in order to release housing equity when needed.9
A key advantage of incorporating countries with divergent institutional settings is that
the influence of institutional context on decisions surrounding the use of housing
equity in later life can be uncovered. Figure 4, which displays the long-run growth in
real house prices during the last 40 years, illustrates this point effectively. Real house
prices have soared in countries such as Australia and the UK, but more moderately so
in the US, Netherlands and Finland. However, real house prices have in fact declined
somewhat in Germany over the long-run, starting the period with the highest real
house prices, but ending it with the lowest. Australia and Germany, therefore present
two interesting contrasts when assessing the extent and forms of HEW, as well as
attitudes to its uses in later life.
9 Ong et al. (2013) finds that in countries with high homeownership rates and well-developed mortgage
markets, such as Australia and the UK, the willingness of homeowners to sell up and rent in order to withdraw housing equity is very low compared to their willingness to engage in MEW.

28
Figure 4: Real house price index of the six countries under study, 1970 to most recent
quarter available
Source: OECD Economics Department house price database; for a description of sources see Girouard et al. (2006)
Furthermore, a comparison of the CGT and transaction taxes in Table 4 across the six
countries reveals some interesting institutional differences. As discussed previously,
the extent of taxation applied on transactions involved in HEW will affect the overall
cost of HEW. In the six countries under study, Table 4 shows that a transaction tax is
applied in all countries. CGT is payable in the UK and Finland, if the dwelling is sold
relatively quickly after acquisition. It is also payable in the US, but with an exclusion
up to a certain amount for the primary residence. On the other hand, the sale of the
primary home is CGT-exempt in Australia and it is not taxed in the Netherlands.
0
20
40
60
80
100
120
140
160
180
20019
70:2
19
71:3
19
72:4
19
74:1
19
75:2
19
76:3
19
77:4
19
79:1
19
80:2
19
81:3
19
82:4
19
84:1
19
85:2
19
86:3
19
87:4
19
89:1
19
90:2
19
91:3
19
92:4
19
94:1
19
95:2
19
96:3
19
97:4
19
99:1
20
00:2
20
01:3
20
02:4
20
04:1
20
05:2
20
06:3
20
07:4
20
09:1
US Germany UK Australia Finland Netherlands
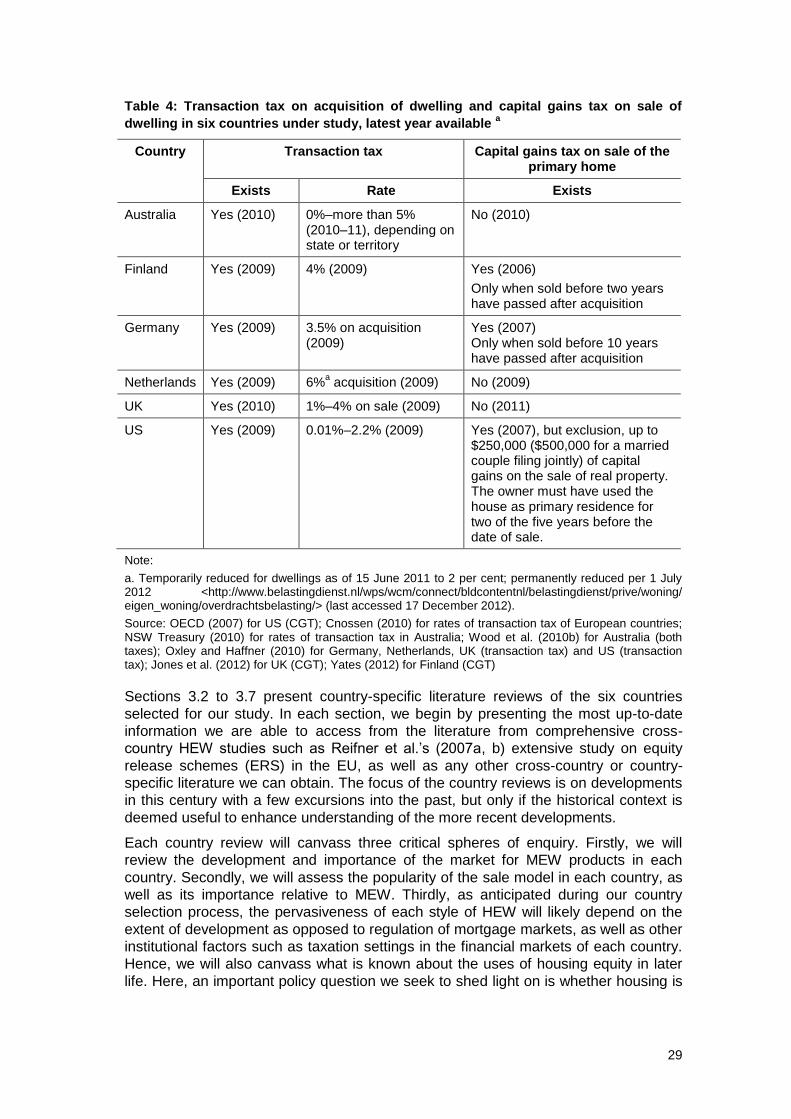
29
Table 4: Transaction tax on acquisition of dwelling and capital gains tax on sale of
dwelling in six countries under study, latest year available a
Country Transaction tax Capital gains tax on sale of the primary home
Exists Rate Exists
Australia Yes (2010) 0%–more than 5% (2010–11), depending on state or territory
No (2010)
Finland
Yes (2009) 4% (2009) Yes (2006)
Only when sold before two years have passed after acquisition
Germany
Yes (2009) 3.5% on acquisition (2009)
Yes (2007) Only when sold before 10 years have passed after acquisition
Netherlands Yes (2009) 6%a acquisition (2009) No (2009)
UK Yes (2010) 1%–4% on sale (2009) No (2011)
US Yes (2009) 0.01%–2.2% (2009) Yes (2007), but exclusion, up to $250,000 ($500,000 for a married couple filing jointly) of capital gains on the sale of real property. The owner must have used the house as primary residence for two of the five years before the date of sale.
Note:
a. Temporarily reduced for dwellings as of 15 June 2011 to 2 per cent; permanently reduced per 1 July 2012 <http://www.belastingdienst.nl/wps/wcm/connect/bldcontentnl/belastingdienst/prive/woning/ eigen_woning/overdrachtsbelasting/> (last accessed 17 December 2012).
Source: OECD (2007) for US (CGT); Cnossen (2010) for rates of transaction tax of European countries; NSW Treasury (2010) for rates of transaction tax in Australia; Wood et al. (2010b) for Australia (both taxes); Oxley and Haffner (2010) for Germany, Netherlands, UK (transaction tax) and US (transaction tax); Jones et al. (2012) for UK (CGT); Yates (2012) for Finland (CGT)
Sections 3.2 to 3.7 present country-specific literature reviews of the six countries
selected for our study. In each section, we begin by presenting the most up-to-date
information we are able to access from the literature from comprehensive cross-
country HEW studies such as Reifner et al.’s (2007a, b) extensive study on equity
release schemes (ERS) in the EU, as well as any other cross-country or country-
specific literature we can obtain. The focus of the country reviews is on developments
in this century with a few excursions into the past, but only if the historical context is
deemed useful to enhance understanding of the more recent developments.
Each country review will canvass three critical spheres of enquiry. Firstly, we will
review the development and importance of the market for MEW products in each
country. Secondly, we will assess the popularity of the sale model in each country, as
well as its importance relative to MEW. Thirdly, as anticipated during our country
selection process, the pervasiveness of each style of HEW will likely depend on the
extent of development as opposed to regulation of mortgage markets, as well as other
institutional factors such as taxation settings in the financial markets of each country.
Hence, we will also canvass what is known about the uses of housing equity in later
life. Here, an important policy question we seek to shed light on is whether housing is

30
increasingly being relied upon as an asset base for welfare and, if so, the extent to
which its role is influenced by the generosity of pension regimes in each country.
As much as possible, our focus will be on MEW and sale methods of HEW by older
homeowners. For example, Reifner et al. (2007a, b) will be drawn upon heavily in our
review of HEW markets in the four European countries. Reifner et al. (2007a, p.I)
define an ERS as one that is a financial service, a source of liquidity for the future that
entitles the equity extractor to remain in occupation of the home, and generates
income in retirement. The study specifies that these ERS are restricted to products
such as reverse or lifetime mortgages and home reversion schemes which are
specifically targeted at those who are typically in later stages of the life course.
However, in some instances we have referred to the MEW and sale methods in terms
of its use by the general population, where information specific to older homeowners
has been unattainable. As mentioned in Section 2.2, we are interested in HEW by a
broad group of homeowners aged 45 years and over. However, the definition of ‘older’
will vary from study to study in the existing literature. Where possible, we have tried to
define the age group referred to in each study.
3.2 Australia
3.2.1 MEW products
According to Schwartz et al. (2006, republished in 2010), the most common method of
HEW is to increase the level of debt secured against a property one already owns, an
unsurprising observation given well-developed mortgage markets in Australia. Indeed,
as mentioned in Section 3.1, multiple sources confirm that Australia is the most highly-
developed mortgage market (along with the UK) compared to other countries included
in the study.
With respect to forms of MEW typically used by older Australians, the literature tends
to put an emphasis on reverse mortgages (see, e.g. ASIC 2005; Bridge et al. 2010,
2011). During 1993–96, the Australian government subsidised a pilot home equity
conversion scheme, but this was discontinued because of its low take-up (Dolan et al.
2005). It was only in the 2000s that the market for reverse mortgages started taking
off, a relatively late start compared to other well-developed mortgage markets such as
the UK and the US.
Reverse mortgages are currently supplied by a selected number of banks. Bridge et
al.’s (2010) study on reverse mortgages reported that there were seven Senior
Australians Equity Release Association of Lenders (SEQUAL) accredited lenders who
provided five reverse mortgage products in 2008. ASIC (2007) notes that the
maximum loan available is age-dependent, but usually constitutes 45 per cent or 50
per cent of property value. The payment options include lump sums, regular
payments, or lines of credit and lenders’ typically no negative equity guarantees. All
these characteristics are consistent with the broad features of reverse mortgages
described in Section 2.3. In addition, according to annual research conducted by
Deloitte for SEQUAL, the majority of reverse mortgage products in Australia (85% in
2010) are typically characterised by variable rate loans.10 Deloitte Touche Tohmatsu
and SEQUAL further note that almost all reverse mortgages are taken out in the form
of lump sum payments (95% in 2010). Furthermore, additional draw downs are
possible, as flexible product options such as lines of credit now allow homeowner-
10
Since 2008, fixed rate loans are no longer available on new reverse mortgage loans in Australia.

31
borrowers to make discretionary income draws against their reverse mortgage loans
(Deloitte Touche Tohmatsu & SEQUAL 2011, 2012).11
In 2011, 50 per cent of reverse mortgage customers were couples aged 70–75 years
old (Deloitte Touche Tohmatsu & SEQUAL 2012). The second group of homeowners
most likely to use reverse mortgages are single women (Deloitte Touche Tohmatsu &
SEQUAL 2011).
Contrary to the US where the recent GFC stalled the rapid growth in reverse
mortgages that were occurring in the early 2000s, the Australian reverse mortgage
market has grown steadily through the GFC years. Between 2005 and 2011, the
number of outstanding reverse mortgage loans more than doubled to a total of
42 400. At the same time, the average size of each loan also grew from $51 100 in
2005 to over $78 200 in 2011. The interactions of these two trends meant that, by the
end of 2011, the outstanding market size was about 3.3 billion Australian dollars
(AUD), a tripling of the figure reported at the end of 2005. It would appear that older
Australian homeowners’ appetite for HEW through reverse mortgages was not
dampened by the GFC in any significant way. However, the level of reverse mortgage
settlements of AUD$520 million that occurred during the peak of the house price
boom in 2006 has not been achieved since.
Table 5: Statistics on the Australian reverse mortgage market, 2005–11
Dec-05 Dec-06 Dec-07 Dec-08 Dec-09 Dec-10 Dec-11
Outstanding market size (AUD)
0.9 billion
1.5 billion
2.0 billion
2.5 billion
2.7 billion
3.0 billion
3.3 billion
Number of loans 16,584 27,898 33,741 37,530 38,788 41,600 42,410
Average loan size (AUD)
51,148 54,233 60,000 66,150 69,896 72,474 78,249
Volume of new lending (AUD)
315 million
520 million
466 million
321 million
264 million
322 million
317 million
Source: Deloitte Touche Tohmatsu and SEQUAL (2011, 2012)
In regard to the future of the reverse mortgage market in Australia, existing studies
seem to agree that there is potential for further expansion of the market. Bridge et al.
(2010, p.1) noted that ‘(t)he reverse mortgage market in Australia is well established
and is expanding. There is, however, potential for further expansion: both in terms of
the size of the market and of interest from consumers, and in terms of what the loans
are used for’. Earlier surveys, such as Dolan et al. (2005), linked the potential of the
market to the retirement of the baby boomer generation, which is occurring at a
greater scale now than ever before (see also Olsberg & Winters 2005).
Other MEW products do not seem to have received as much attention in the literature
that has studied the role of housing equity in ageing populations. Apart from reverse
mortgages, the SEQUAL website also makes mention of another MEW product called
accommodation bond loans targeted at older homeowners aged 70 years and over.
These are loans with a term of three or five years secured against one’s housing
equity in order to meet the cost of entry into a residential care facility.12 Recently, the
Productivity Commission (2011) proposed a similar scheme, a government-backed
Australian Aged Care Home Credit scheme, under which homeowner-borrowers can
11
Additional draw downs amounted to around 4.1 per cent of outstanding loans in 2011 (Deloitte Touche Tohmatsu & SEQUAL 2012). 12
For more information from SEQUAL, see <http://www.sequal.com.au/content/view/19/36/ #Accommodation%20Bond%20Loan>.

32
make flexible draws against their housing equity to meet aged care co-contributions or
accommodation costs up to a specified limit. In principle, these MEW options are not
necessarily an in situ form of equity withdrawal, as the homeowner-borrower will
typically move into a residential aged care facility. However, these products are
designed to afford some protection to those remaining in the home, such as one’s
spouse (who may also be one of the homeowners) or dependent child with a
disability.
Although reverse mortgages, accommodation bond loans and the propose¬d Aged
Care Home Credit scheme are all targeted at elderly homeowners, other forms of
MEW have been available for over two decades, which are not age-dependent. In
particular, MEW products were already on offer in Australian markets in the form of
flexible mortgages since the 1980s (Moloney & Bor 2003). These flexible mortgages
were originally intended for the purposes of stimulating accelerated mortgage
repayments from homeowners to save on mortgage interest payments. In 1986,
Citibank launched its Mortgage Power product, which Moloney and Bor (2003)
describe as the first line of credit product to be introduced in Australia. However, as
described in Section 2.2.2, flexible mortgages also allow for HEW. In more recent
times, the role of flexible mortgages has changed somewhat, as they are now
increasingly being used by Australian homeowners as a style of in situ MEW by
allowing for overdrafts to be drawn against one’s housing equity in a relatively
costless manner (Klyuev & Mills 2006, republished in 2007 and 2010; see Section
2.2.2 for the description of flexible mortgage loans). Smith et al. (2002) note that
flexible mortgages are commonly used in Australia, with one-third of homeowner-
borrowers13 holding a current account mortgage, a form of offset mortgage whereby a
single account is provided for all transactions so that transaction balances are simply
offset against a homeowner-borrower’s mortgage debt.
3.2.2 Sale of the home
According to SEQUAL, home reversion products that allow older homeowners to sell
off part of their housing equity while remaining in their home are relatively new in
Australia. As of December 2012, home reversion products were only available in
Sydney and Melbourne for homeowners aged 60 and over.14
With regard to selling and moving (as opposed to selling and staying in the primary
home via the use of home reversion), Australian homeowners generally exhibit less
mobility than tenants, and the tendency to move does decline as one ages (Clark
2011). However, there is growing evidence that newer cohorts of older Australians are
increasingly open to the prospect of moving house. Olsberg and Winters (2005)
interviewed 7000 Australians aged 50 years and over during 2004–05, and found that
38 per cent of those aged 50–59 years had moved in the last five years. The
incidence of moves declines to around 33 per cent in the group aged 60–74 years. It
drops further to 25 per cent among the group aged 75 years and over.15 Furthermore,
Olsberg and Winters (2005) reports some interesting statistics on the incidence of
downsizing among older homeowners. The study’s findings indicate that only around
one in 10 homeowners aged 50 years and over will extract housing equity by
downsizing, though outright owners are significantly more likely to downsize than
mortgagors. Twelve per cent of outright owners interviewed (versus around 5% of
mortgagors) had downsized to release funds to supplement income in the last five
years.
13
This figure includes loans taken out by all homeowners. 14
This information was taken from <http://www.sequal.com.au/content/view/18/35/> (last accessed 4
December 2012). 15
The majority of the respondents are homeowners. The sample contains around 600 non-homeowners.

33
There are multiple institutional factors that can affect the propensity to sell and move.
Chiuri and Jappelli’s (2010) Luxembourg Income Study (LIS) analyses patterns of
home ownership among those aged over 50 years in various countries, including the
six countries reviewed in this study. Chiuri and Jappelli (2010) propose that the extent
of housing wealth decumulation (as proxied by changes in ownership rates) is
generally negatively correlated with the extent of mortgage market development.
Hence, for this hypothesis to hold true, countries such as Australia and the UK should
exhibit lower rates of moves out of the ownership sector than other countries with
more highly regulated mortgage markets. The study finds that homeowners aged 75–
80 years are indeed less likely to move into renting than countries such as Germany
and Finland, where mortgage markets are noticeably more regulated. However, the
propensity of wealth decumulation by homeowners aged 75–80 via moves into renting
is still greater in Australia than other equally developed mortgage markets such as the
UK, indicating that other institutional factors may be at play.
Finally, it should be noted that even though in situ MEW is more commonly used to
withdraw housing equity than other forms of HEW, Schwartz et al. (2006, republished
in 2010) points out that the average amount withdrawn per transaction is much higher
when the equity withdrawal involves a sale of the primary home, than when in situ
MEW is used. According to the study, in 2004, more than 4 per cent of households
withdrew an average of almost AUD$160 000 (median of around AUD$83 000) via
property transactions. In comparison, while the propensity of in situ MEW was higher
at 7.3 per cent, the average amount withdrawn via MEW was AUD$35 000 (median of
AUD$20 000). While these estimates are for all Australian homeowner households,
Schwartz et al. (2006, republished in 2010) notes that the sale of the primary home
tends to be associated with HEW among older households, while younger households
are more likely to have injected equity when selling a primary home by trading up into
a more expensive home.
3.2.3 Uses of HEW
The Reserve Bank of Australia (2003) estimates that aggregate HEW exceeded
housing equity injection in the late 1990s. By 2002, net HEW16 had amounted to about
3.5 per cent of household disposable income. A couple of years later the percentage
peaked at more than 5 per cent, before the trend reversed (Schwartz et al. 2006,
republished in 2010). Using a different method, Klyuev and Mills (2006, republished in
2007 and 2010) estimated that the amount of HEW was around 15 per cent of
disposable income in 2001 to 2005. Ong et al. (2013) reports similar findings; the
study found that HEW contributed to 13–15 per cent of gross household income in
any one year during the period 2001–08, and note that this represents a sizable
addition to the financial resources of Australia’s personal sector.17
Some studies have specifically attempted to uncover the uses of HEW in mid-to-late
life in Australia. For example, Bridge et al.’s (2010) reverse mortgage study conducted
focus groups comprised of 16 people and nine interviews by phone. The participants
were aged 61–93 years old. ASIC (2007) also conducted in-depth interviews with 29
reverse mortgage borrowers aged 60–85 years. While these sample sizes are not
representative of the older home-owning population in Australia, it does give some
insights into the range of uses of housing equity by older homeowners.
These studies found that some reverse mortgage borrowers were relying on the
equity withdrawn as an asset base for welfare. Bridge et al.’s (2010) study found that
the borrowers were using HEW to fund what they considered everyday necessities
16
Net HEW is the difference between gross equity withdrawals and gross equity injections. 17
These estimates are for all homeowners.

34
(e.g. topping up the pension or superannuation income, replacing the car, purchase of
small capital items, health care). Similarly, ASIC (2007) reported that 10 (out of 29)
borrowers wanted to supplement their income via the reverse mortgage loans. Debt
consolidation was another commonly cited reason, especially where borrowers had
accumulated significant credit card debt (Bridge et al. 2010). Deloitte Touche
Tohmatsu and SEQUAL (2012) also confirmed that reverse mortgage borrowers were
mainly using the funds for repaying debts (16%) and supplementing retirement
income (15%). Some respondents in the Bridge et al. (2010) study also confirmed that
housing equity plays an insurance role with respect to unexpected financial
expenditures as well as other unanticipated adverse events occurring during the life
course, reporting that they had reserved funds from reverse mortgages to use for ‘a
rainy day’ (p.79). Focusing on those homeowners who downsized, Olsberg and
Winters (2005) found that 43 (11) per cent of outright owners (mortgagors) who
downsized had done so in order to ‘release money to live on’ (pp.38–39).
On the other hand, Bridge et al. (2010) also found that some of their study
respondents were using the equity withdrawn via reverse mortgages for lifestyle
consumption purposes, such as holidays.
A third group were using the withdrawn equity via reverse mortgages to facilitate
intergenerational transfers. ASIC (2007) noted that some reverse mortgage borrowers
were using the funds released to provide financial assistance to their relatives and for
payment of aged care accommodation bonds for their parents. According to a survey
of mortgage brokers by Bridge et al. (2010), a reasonably common strategic use of
the funds released via HEW among reverse mortgage borrowers was to provide
financial assistance to their children. However, Olsberg and Winters (2005) found that
only about 5 (2) per cent of outright owners (mortgagors) in their study would
downsize to release funds to financially assist their children or other family
members.18
It is also obvious from the studies that some of the funds withdrawn were being used
to improve or maintain the housing stock. ASIC (2007) and Bridge et al. (2010) both
reported that home maintenance or renovations were often cited as uses of the
housing equity withdrawn via reverse mortgages. Deloitte Touche Tohmatsu and
SEQUAL (2012) found that 18 per cent of equity release customers used their funds
for home improvements, and that this was one of the top three uses of equity release.
It is difficult to ascertain from the existing studies which expenses dominate the use of
funds from HEW by older homeowners. However, it is clear that a sizeable proportion
of reverse mortgage borrowers and those who downsize do rely on the funds as an
asset base for welfare.
3.3 United Kingdom
It is widely accepted that the UK has the most developed housing equity release
market in Europe. As noted by Reifner et al. (2007b, p.3): ‘The UK, has by far the
most sophisticated ERS market, based on any of the possible criteria that can be
used to measure so called development of the market: size of business, number of
providers, number of years for which products exist, level of consumer awareness
with ERS, or quantity of literature, material and analysis describing the market. A
number of countries, but the UK especially, is already demonstrating the market-
driven process of product innovation when circumstances present an opportunity’.
18
It is possible that the disparity between Bridge et al.’s (2010) and Olsberg and Winters (2005) findings are related to the different styles of HEW investigated in the two studies.

35
3.3.1 MEW products
MEW products have been available in the UK for up to 30 years (ASIC 2005). During
this time, the types of products on offer have changed significantly. In the early
beginnings, Home Income Plans19 and SAMs were the dominant products. However,
these have since made room for other forms of MEW and currently lifetime or reverse
mortgages constitute the most frequently offered MEW product in the UK (Reifner et
al. 2007b).
With an aggregate value of £560 million, lifetime mortgages dominate the sales
(market share of 98%) in the UK equity release market. These are considered safe
products because since 1991, they have been regulated under the Safe Home
Income Plans’20 (SHIP) code of conduct. SHIP has now been superseded by the
Equity Release Council as an industry association for the equity release sector.
However, it remains part of the Equity Release Council (ERC) in the form of the SHIP
Standards Board, which sets the code of conduct for ensuring that lifetime mortgages
and home reversion products for consumers aged 55 years and over are safe and
reliable.21 Rozario (2012, p.12) notes that ‘SHIP’s code of conduct meant that
consumers could be sure when they released equity from their homes, if they used a
product from a SHIP member, that they would be able to live in their homes for the
rest of their lives or until they moved into long-term care, and that they would never be
left owing more than the value of their home’. However, apart from lifetime mortgages,
interest-only mortgages and further advances also exist to facilitate HEW (Reifner et
al. 2007b; Reinold 2011).
There has been a definite move towards more flexible products in UK’s mortgage
markets over the years. These days, products which feature an overall borrowing
facility that borrowers can choose when to draw down are the most popular product in
the UK (Reifner et al. 2007b; see also Klyuev & Mill 2006, republished in 2007 and
2010). An example of a flexible mortgage product available in the UK is offset
mortgages, whereby transaction balances are simply offset against a homeowner-
borrower’s mortgage debt (Klyuev & Mills 2006, republished in 2007 and 2010).
Flexible mortgages were introduced in the UK in the early 1980s, and have generated
considerable interest since the mid-1990s. Smith et al. (2002) conducted interviews
with 486 flexible mortgage borrowers in Leeds, Birmingham, Guilford and Bristol in
2001. Fifty-one per cent of the respondents felt that the main feature of flexible
mortgages that attracted them to the product was the possibility of early repayment. A
lower, though not insignificant, proportion (19%) thought that borrowing against the
house for other things was attractive. Interestingly though, almost all of respondents
had never exploited the option of underpayments or payment holidays, and 75 per
cent had never withdrawn a lump sum. In total almost half of the respondents (48%)
never used any of the flexible options that their mortgage offered. This can be partly
attributed to the short time that the mortgage has been held.22 Another potential
19
Reifner et al. (2007b, p.9) characterise the Home Income Plans of the 1980s as ‘unsafe’: ‘interest rates were not fixed, stock exchange performance changed direction, home prices fell, and because funds released were used for investment on the stock exchange, many people lost their homes’. 20
SHIP has been superseded by the Equity Release Council as an industry association for the equity release sector. However, it has been incorporated as part of the Equity Release Council in the form of the SHIP Standards Board, which sets the code of conduct for ensuring that lifetime mortgages and home reversion products for consumers aged 55 years and over are safe and reliable <http://www.equityreleasecouncil.com/ship-standards/> (last accessed 10 December 2012). 21
For more details, refer to <http://www.equityreleasecouncil.com/ship-standards/> (last accessed 10 December 2012). 22
Eighty-four per cent of those who have never used a key flexible facility, compared with 76 per cent of all interviewees, had held their mortgage for two years or less at the time of the interview.

36
explanation is suggested by the survey evidence—the ‘slack in’ financial position of
the borrower (p.47). Higher income groups (with more savings) were most likely to
have used a key facility. Nonetheless, Smith (2005) found that households with at
least one flexible feature in their mortgage products are more likely to engage in HEW
than the typical mortgage holder. While the product is available to all age groups, a
significant proportion (30%) of the flexible mortgage borrowers interviewed by Smith
et al. (2002) were aged 45 years and over.
MEW became popular in the UK in the 1980s, but lost ground when house prices fell
in the early 1990s and credit conditions tightened (Earley 2001). According to a report
released by the Equity Release Council, an industry body which ensures that life
mortgages and home reversion products offered to homeowners aged 55 years and
over are safe and reliable, HEW by older homeowners grew strongly between 199123
and 2007, but fell post-GFC. The number of consumers holding lifetime mortgages
and home reversion products offered by SHIP’s members grew from 570 to more than
29 000 at its peak in 2007. Over this period, the amount of equity released from
homes increased sharply from £29 million in 1992 to £1.2 billion in 2007. Interestingly,
while the amount of equity released through home reversion products (£19 million)
exceeded the amount released from lifetime mortgages (£10 million) in 1991, by 2007,
lifetime mortgages had exceeded home reversion as the more dominant style of
HEW, accounting for £1.1 billion in equity released compared to the £83 million
released via home reversion. After the GFC, the extent of borrowing via lifetime
mortgages declined. In 2011, the amount of equity released via lifetime mortgages
was £560 million (The Wriglesworth Consultancy 2011).
Existing studies generally agree that MEW is now a commonly used form of HEW
among the UK homeowner population. Smith and Searle (2008), drawing on quarterly
figures from the Bank of England, shows on a net basis, equity injections were
occurring in the early 1990s. However, by the final quarter of 2003 the trend had
reversed, and the level of MEW had peaked at 8.9 per cent of disposable income. And
by mid-2004, net MEW had exceeded 6 per cent of the disposable income of UK
borrowers for nine consecutive quarters. A micro-economic study of MEW borrowers
over the period 2001–05 confirms that ‘equity borrowing was a common tactic. The
sums involved were not trivial, were not limited to older cohorts, or the province simply
of the rich’ (Parkinson et al. 2009). Focusing on older homeowners, the Wriglesworth
Consultancy (2011, p.5) note that ‘with the UK’s over-55s currently sitting on … 1.9
trillion … worth of housing equity, the market [which is dominated by borrowing via
lifetime mortgages] is sure to grow in the future’.
3.3.2 Sale of the home
Reifner et al. (2007b, p.6) identify two forms of HEW that fall under the sale model in
the UK; the home reversion scheme and the sale and lease back plan (see Section
2.2.1 for a general description of the two products).
In the UK, most home reversion plans offer a single cash lump sum to the occupier at
the start of the contract (which can in turn be used to buy an annuity).24 Two of the 12
home reversion products studied by Reifner et al. (2007b) offer an ‘impaired health
option’ (p.7), under which the terms will be enhanced as a result of a medical
condition that shortens life expectancy. This is a unique feature not available under
lifetime mortgages.
23
SHIP, the Equity Release Council’s predecessor, was first established in 1991. 24
Only life insurance companies are authorised to offer home reversion products with monthly payments.

37
The amount of equity released through home reversion by older homeowners aged 55
years and over quadrupled from £19 million to £83 million between 1991 and 2007.
However, after the GFC, the extent of borrowing via home reversion declined and in
2011, the amount of equity released via home reversion was £12 million (The
Wriglesworth Consultancy 2011). While home reversion was the more dominant style
of HEW in terms of the market share it occupied in 1991, by 2007 lifetime mortgages
had exceeded it as the main form of HEW. In 2011, home reversion products made up
only 2 per cent of the market share in the equity release sector for older homeowners
aged 55 years and over, as compared to the 98 per cent share attributed to lifetime
mortgages (The Wriglesworth Consultancy 2011).
The sale and lease back product is a ‘sell and stay’ option that includes rental
payments as part of the plan. Such a plan can be used by the elderly, but it is not
necessarily restricted to them. In the UK, these types of products lack regulation,
contrary to other ERS, but they may also lack security of tenure. Reifner et al. (2007b,
p.7) note that ‘[a]s opposed to the regulated equity release products that give
consumers the right to live in their homes for life, sale and rent back arrangements
involve a company buying an owner’s home for significantly less than the market
value, and then allowing that person to continue living in the property, but only by
paying full market rent and often with only an assured short hold tenancy agreement.
There are thus no guarantees that the consumer will be able to stay in the property
long term’. Unfortunately, as Reifner et al. (2007b) notes, there is a lack of reliable
data on the size of the sale and lease back industry in the UK.
Chiuri and Jappelli’s (2010) index of mortgage market regulation ranks the UK and
Australia as having the most well-developed mortgage markets of all the countries
studied. Hence, one would expect that UK older homeowners would be much less
likely to decumulate housing wealth (by move into renting) than those in countries
where the mortgage market is more regulated (and thus less developed). Indeed, in
accordance with expectations, Chiuri and Jappelli (2010) find that British homeowners
aged 75–80 years are the least likely to move into renting among homeowners aged
75 to 80 from all the countries under consideration in their study. Banks et al. (2007,
p.34) confirms this finding for the UK, arguing that ‘housing consumption [the number
of rooms] appears to decline with age in the US, even after controlling for the other
demographic and work transitions associated with age that would normally produce
such a decline. No such fall in housing consumption is found in Britain, largely
because British households are much more likely to stay in their original residence’.
Nonetheless, statistics from the Bank of England indicate that the sum of equity
withdrawn from last time sales and trading down constitute a significant share of the
total value of housing equity withdrawn in the UK, though HEW via sale of the home
did decline noticeably post-GFC (Reinold 2011). In line with this, Elsinga and Doling
(2012) and Tatsiramos (2006) conclude that UK elderly homeowners move more often
than German homeowners (see also Section 3.7.2).
3.3.3 Uses of HEW
On a macro level, the amount of housing equity withdrawn by British homeowners
exceeded the amount injected throughout the 1980s, that is, on a net basis HEW was
taking place. During the early and mid-1990s, a reduction in HEW occurred in line with
falling house prices. However, HEW increased again from the late 1990s as house
prices started to rise. By 2002, net HEW was estimated to be around 6 per cent of
household disposable income. Cross-country comparisons between the UK and US
show that the British had been withdrawing housing equity on a larger scale25 than US
25
Scale is measured by net HEW as a proportion of household disposable income.

38
households from the early 1980s to early 2000s. Furthermore, HEW had been
exceeding housing equity injection in the UK throughout the 1980s, long before this
pattern emerged in Australia in the late 1990s (Reserve Bank of Australia 2003).
Klyuev and Mills (2006, republished in 2007 and 2010) confirm these trends, further
reporting that net HEW amounted to more than 10 per cent of disposable income from
2001 to 2005. However, more recent figures from the Bank of England show that on a
net basis, households have been injecting rather than withdrawing equity again from
2008 till 2012.26
Various studies have sought to uncover the uses of HEW by homeowners in the UK in
recent years. Several of these studies have increasingly converged on the conclusion
that housing wealth is increasingly being used as an asset base for welfare to fund
pressing spending needs and act as a buffer against adverse life events.
Smith and Searle (2008) investigated the flow of housing wealth to other things via
MEW using various British surveys, and found that a significant two-thirds to three-
quarters of all MEW borrowers spent some of the equity withdrawn on home repairs,
improvements or extensions. However, the study observes funds released from
housing equity via MEW (and especially via flexible mortgages) are increasingly being
diverted away from reinvestment into the housing sector towards non-housing
expenditures. For example, the study found that around two-thirds of MEW borrowers
in the BHPS spent their released housing equity on home improvements in 1991, but
this proportion had fallen to 44 per cent by 2003. On the other hand, spending of
housing equity on non-housing items rose during that period. Importantly, the study
highlights the fact that no evidence could be found, which could firmly support the
proposition that funds from MEW were being spent on durable goods and holidays.
The study hypothesised that as housing wealth becomes more fungible, it will
increasingly be used to fund welfare and subsistence needs. In situ equity borrowing
behaviours as examined by Parkinson et al. (2009) also suggest that MEW is being
used to fund pressing spending needs and to cope with adverse life events such as
marital separations or an anticipation of financial worsening by homeowners. Indeed,
Smith et al.’s (2009) study later found that significant numbers of mortgagors who had
withdrawn equity via MEW had used some of the funds to smooth income fluctuations,
consolidate debts, provide financial assistance to children and parents and as a buffer
against adverse life events.
With respect to other forms of HEW, Ong et al.’s (2013) BHPS study found that in the
UK, those who withdraw housing equity by selling up and moving into the rental sector
have incomes that are substantially lower than those who withdraw equity via trading
on or MEW, and somewhat below the incomes of those who inject equity. The study
observed that selling the primary home and moving into the rental tenure is a way of
coping by households facing financial stress.
Even though the above-mentioned studies have not typically focused on older
homeowners, Rowlingson (2005) does report an increased willingness among older
people to rely on their assets to fund spending needs. Furthermore, Ong et al. (2013)
found evidence that HEW via selling up and renting is disproportionately engaged in
by those aged 75 years and over, widowed or separated. The study also notes that
those who withdraw housing equity by trading on are typically aged 65 years and
over, widowed, separated or not in the labour market. Jones et al. (2012) conducted
interviews with 30 homeowner households in York in three age groups (25–35, 45–55,
and 65 years and over) in 2009, and found that respondents were generally unwilling
to withdraw equity to supplement their incomes. Homeowners aged 65 and over cited 26
For more details, refer to http://www.bankofengland.co.uk/statistics/Pages/hew/2012/jun/default.aspx; (last accessed 17 December 2012).

39
uncertainties about life expectancies and bequest motives as reasons for their
reluctance to engage in HEW. However, older homeowners did acknowledge that they
viewed their homes as a source of security in case of emergencies.
3.4 United States
3.4.1 MEW products
According to ASIC (2005), the most widely used MEW product in the US among older
homeowners is most likely the reverse mortgage.27 Traditionally, home equity loans
and HELOCs have also been used to withdraw home equity, though older
homeowners generally find these more difficult to qualify for than reverse mortgages
as they require regular mortgage payments during the life of the loan (CFPB 2012).
Reverse mortgages were introduced in the United States in 1961 (Wicke 2008; see
also Schneider 2009a). The US was one of the first countries (together with the UK)
where this style of mortgage was offered. In 1987, they were formally introduced by
Congress to facilitate the financing of consumption in old age. Nowadays over 90 per
cent of all reverse mortgages are based on the Federal Home-Equity-Conversion-
Mortgage (HECM) Program (see Bishop & Shan 2008; Gotman 2011). Those reverse
mortgage products not covered by the HECM program are known collectively as
proprietary reverse mortgages (CFPB 2012). Their market share has steadily declined
since the introduction of HECMs, and proprietary reverse mortgages are practically
non-existent in the US nowadays.
The Federal Housing Administration (FHA)28 of the Department for Housing and
Urban Development (HUD) is responsible for accrediting financial institutions
providing the HECM reverse mortgages. This arrangement implies that the
government has some influence on the reverse mortgage market, and has also taken
on some responsibilities as a guarantor. For example, the Federal government
guarantees the fulfilment of the reverse mortgage contract towards the homeowner in
the event that the lending financial institution encounters bankruptcy. On the other
hand, it also covers the lender for negative equity risk, should the loan amount
surpass the value of the dwelling which serves as collateral, as the consumer only
owes the maximum of the value of the house (non-recourse clause). The right to
transfer the loan contract to HUD thus allows for the following: first, to receive back
the ‘extra‘ payments that surpass the dwelling value; second, to be repaid the loan
amount in case of negative equity and the loan has not been transferred to HUD. The
system is paid for by the fees that homeowners pay.29
There are eligibility requirements that borrowers must meet in order to qualify for a
reverse mortgage. These include having a minimum age of 62, living in the principal
dwelling, being (almost) an outright owner, and visiting an information meeting
27
ASIC (2005) states that SAMs are also used in the US. However, Caplin et al. (2008, p.6) state that ‘tax barriers effectively prevent the development of SAM markets in the United States’. This started in the 1970s when equity sharing was introduced on the market. One of the barriers consists of income tax on non-payment of interest as if they were income received. Statistics about the total market of HEW have not been found. 28
The last annual financial status report to Congress in November of 2012 reports that FHA comes to a negative economic value of $16.3 billion as a result of mortgages originated before 2009 <http://portal.hud.gov/hudportal/HUD?src=/press/press_releases_media_advisories/2012/HUDNo.12-171l> (last accessed 11 December 2012). FHA has more tasks than the HECM program. 29
This is called the assignment option in the FHA insurance program. Lenders have to pay the initial and the monthly mortgage insurance premiums to HUD in exchange for the protection. Loan assignment to HUD can happen when the loan balance reaches 98 per cent of the maximum claim amount (Bishop & Shan 2008).

40
organised by an independent HECM-advisor (Wicke 2008; Bishop & Shan 2008).30
There are also requirements concerning the home and household income.
During the loan term (and as explained in Section 2.3.1), the homeowner retains
ownership of the house with all the accompanying rights and obligations this entails. If
the owner does not fulfil ‘normal’ duties with respect to the property, like carrying out
repairs, insuring the house or paying property taxes, the lender has the right to
repossess the property. However, if the property value falls below the loan value, it is
the lender, not the borrower, who bears the collateral risk (De Roon et al. 2010).31
Payments from reverse mortgages can be made in the form of tenure, term or line of
credit payments. Under the tenure (term) option, monthly payments are made
indefinitely until the homeowner leaves the house (until the end of a fixed period). The
tenure payment plan is also called a ‘reverse annuity mortgage’ because of its
resemblance to an annuity product (Bishop & Shan 2008, p.12). A line of credit
involves more flexible or unscheduled lump sum payments to a maximum value that is
equivalent to the amount of loan secured against the property. A line of credit option
can be combined with a tenure or term option into a modified tenure or term payment
option respectively.32 A homeowner can choose to take out the payment in a lump
sum as well, although this is not a formal option that is also mentioned in the statistics
(CFPB 2012).
The lines of credit appear to have been the most popular form of payment, as more
than 90 per cent of loans taken out in the form of lines of credit in 2009 and 2010 (IBM
Global Business Services 2010; CFPB 2012). However, the Consumer Finance
Protection Bureau (CFPB 2012, p.27) reports that given today’s markets are
increasingly focused on predictability,33 adjustable rate mortgages with line of credit or
monthly payment plans are no longer available, making way for fixed interest rate
mortgages with lump-sum disbursement: ‘today the fixed-rate HECM is only available
with a lump-sum disbursement option, and is structured as a closed-end loan in which
borrowers are not permitted to borrow additional funds at a future date.’34
Even though the HECM program is federally insured it took a long time for MEW
products to become popular. However, in the last decade, the take-up of HECMs has
increased steeply. The take-up of new loans spiked from less than 10 000 in 2001 to
over 100 000 in 2007, peaking at over 110 000 in 2009.35
This development went hand in hand with the increase of household debt; over the
period 2002–07, total household debt in the US doubled, rising dramatically in
absolute and relative terms compared to the 25 years before. Mian and Sufi (2011),
using a representative dataset of a national consumer credit bureau agency,
concluded that house price appreciation during this period resulted in an increase of
borrowing 25 cents for every dollar gain in home equity from 2002 to 2006.
Furthermore, they concluded that this was not correlated with the probability of trading
30
See also Federal Housing Administration fact sheet on <http://portal.hud.gov/hudportal/documents/ huddoc?id=DOC_13006.pdf>. 31
See also Federal Housing Administration fact sheet on <http://portal.hud.gov/hudportal/documents/ huddoc?id=DOC_13006.pdf>. 32
For more details, refer to <http://portal.hud.gov/hudportal/HUD?src=/program_offices/ housing/sfh/hecm/hecmabou>. 33
In order not to run interest-rate risk (CFPB 2012, p.188). 34
As indicated before, the lump sum payments do not show up in the IBM Global Business Services (2010) statistics, while the fixed interest rate loans reached a share of almost 70 per cent in 2009, running up to 100 per cent according to CFPB (2012) in a later year. 35
This is the latest data available on the HUD website. Details can be found at <http://portal.hud.gov/ hudportal/HUD?src=/program_offices/housing/rmra/oe/rpts/hecm/hecmmenu> (last accessed 11 December, 2012).

41
up36 or investing in investment property. This implies that soaring household debt
during the house price boom must have been the outcome of a surge in the take-up of
MEW products. But the GFC helped put an end to the rapid growth in HECMs at the
beginning of this century. The CFPB (2012, p.76) notes that the US HECM market is
today ‘fragile’.
CFPB (2012) notes that the current US reverse mortgage market is very small,
comprising 2 to 3 per cent of the 24 million homeowner households who are eligible
for reverse mortgages. Nevertheless, CFPB (2012, p.5) states that: ‘reverse
mortgages have the potential to become a much more prominent part of the financial
landscape in the coming decades’. This is based on the expectation that the potential
market for reverse mortgages will expand significantly as baby boomers retire in
droves. Furthermore, the availability of a mortgage interest deduction (from taxable
income) for home loans makes for attractive borrowing compared with loans for other
purposes in the US (Do 2012).
The trends discussed around HECM are of course mirrored when the amounts are
connected to them and cash-out refinancing is included, as Belsky (2010, p.90) does:
‘the amount of home equity extraction through borrowing soared during the 2000s in a
truly epic manner …. In 2005 total real mortgage equity extracted through home
equity loans and cash-out refinancing was $1880 for every adult and child in the USA,
nearly 10 times the level in the early 1990s. Though equity extraction through home
equity borrowing peaked in 2004, and cash-out from refinancing peaked in 2005,
neither dropped significantly until 2007, and even then the combined total still
amounted to $1136 per capita’. These amounts are based on increase of debt on
average in every age category, the oldest being aged over 85.
3.4.2 Sale of the home
Leviton (2001) was not the first to observe the resistance of the elderly towards using
housing wealth to fund the consumption needs of old age. Megbolugbe et al. (1997),
in their analyses of the Panel Survey of Income Dynamics (PSID) from 1968 to 1988,
found that the home ownership rate remained high up until the age of 70. After that
age, homeowners would move into renting at a rate of 3 per cent per year. In
principle, moves towards renting increased with time, though trading up and down
also took place.
Venti and Wise (2000, p.2), using data from the Survey of Income and Program
Participation (SIPP) and Asset and Health Dynamics Among the Oldest Old (AHEAD)
for the years 1984 to 1995, found that the group aged 70 and over who were surveyed
in the 1990s usually did not withdraw housing equity, even when they moved (which is
not often) in old age. If there was relatively a large amount of housing equity available
relative to financial wealth, HEW would sometimes take place. Only after unexpected
events like decease or moving to a nursing home, housing equity would become
liquid.
Venti and Wise (2004) later confirmed some of the results of the earlier study, as
Poterba et al. (2011, p.105) suggest: ‘The results thus suggest that households do not
tap home equity until well into retirement and that substantial declines in housing
wealth are often associated with shocks’. This time they used the Health and
Retirement Study 1992–98 in combination with the AHEAD data between 1993–98 to
observe that younger households that moved or moved out of home ownership on
average increased their housing equity, while the older generation decreased it.
36
However, Mian and Sufi (2011) could not identify within-zipcode moves and were unable to rule out the possibility that these are responsible for the observed increase in household debt over the period in question.

42
Chiuri and Jappelli (2010) suggest from their LIS analyses that in countries which
feature less developed and/or less efficient mortgage markets, those aged 75 to 80
are more likely to move into renting than in countries that have more developed
mortgage markets. According to their index of mortgage market regulation, the US
has relatively developed mortgage markets, but the propensity to move was put in the
middle range by the authors in the US compared to many other countries.
When amounts are put to these data, Belsky (2010, p.90) concludes; ‘The velocity of
home sales also reached new levels, unlocking additional stores of home equity and
converting it to cash in the pockets of consumers …. In 2005 realized capital gains on
sale reached almost one trillion dollars. While most of these proceeds were likely put
towards a down payment for the next home purchase, if one is to believe a recent
2003 National Association of Realtors (NAR) survey, 18 per cent of net sale proceeds
are put to other uses, which in this case amounts to nearly $180 billion (Greenspan &
Kennedy 2007). However, this too has done a recent about face, dropping by half by
2007’. These amounts will be based not only on moving behaviour by older
homeowners.
3.4.3 Uses of HEW
The existing literature highlights the importance of housing equity in fulfilling a welfare
role among American older homeowners. Using the PSID, Skinner (1996) found that
over the period 1984–89, 8.4 per cent of the elderly traded down into cheaper
housing, and many of these homeowners had experienced a decline in income, as
well as unexpected life shocks such as divorce, bereavement or poor health. On
comparing income relative to income in the year of moves he finds that movers
releasing housing equity have steeper declines in income. Megbolugbe et al. (1997),
in their analyses of the PSID from 1968 to 1988, found that poor health appeared to
play a role in influencing decisions to sell one’s home.37
Leviton (2001) notes that the elderly are generally resistant to extracting equity from
their home.38 The study further confirms that only in emergency situations, such as the
need to meet unexpected health expenditures, would this option have been
considered. Venti and Wise (2000, p.2), using data from the Survey of Income and
Program Participation (SIPP) and AHEAD for the years 1984 to 1995, also found that
‘housing wealth is typically not used to support non-housing consumption during
retirement’. Once again, it was unexpected life events such as the need to move into
a nursing home, which appeared to trigger moves and HEW. Supporting the findings
of Venti and Wise (2000), Poterba et al.’s (2011, p.96) analysis of the Health and
Retirement Study found that ‘many households appear to treat housing equity and
non-annuitized financial assets as ‘precautionary savings,’ tending to draw them down
only when they experience a shock such as the death of a spouse or a period of
substantial medical outlays’.
37
On the other hand, the study did not find any link between the sale of the home and the need to supplement a cash-poor household. 38
This is in contrast with increased borrowing as a result of house price increases. Mian and Sufi (2011) suggest (even though more evidence is needed, as they state) that consumers use home equity for consumption or home improvement. Klyuev and Mills (2006, republished in 2007 and 2010) report on earlier survey evidence from research by Canner et al. (2002) that within the survey period (2001–2002H1), 45 per cent of those who refinanced their mortgage extracted equity. This amounted to an estimated $132 billion. Of this HEW, 35 per cent went to home improvements, 26 per cent to debt repayment, 21 per cent to the acquisition of real assets, and 16 per cent to the finance of consumers’ expenditure.

43
3.5 Netherlands
3.5.1 MEW products
During the late 1990s, house price inflation accelerated in the Netherlands following
15 years of steady growth in house prices. This price increase sparked a massive
expansion in HEW in the Netherlands; data from the Dutch National Bank or De
Nederlandsche Bank (DNB) Household Panel 2002 shows that the share of
mortgages for which the LVR exceeds 100 per cent rose from 42 per cent in the
period 1996–2000 to 70 per cent in 2001–02. Furthermore, about 42 per cent of total
outstanding mortgage debt was taken out in the form of an interest-only mortgage. In
addition, more than 33 billion Euro of housing equity was released via MEW between
1996 and 2001. In the year 2000, the annual amount of housing equity withdrawn
peaked at more than 10 billion Euro, followed by half that amount in 2001 (van den
End et al. 2002).39
Given that mortgage markets in the Netherlands are so well developed, various styles
of MEW are on offer, though not all fit in with the conventional definitions we have
applied in Section 2.2.2. MEW does not always occur in situ, that is, after the initial
purchase of the primary residence. In the Netherlands, MEW often takes place when
a mortgage loan is taken out at initial purchase of a property or when a mortgage
contract is re-negotiated at the point of purchase of a new dwelling (Van Els et al.
2003; Ministerie van BZK 2010).
As regards products specifically targeted at the elderly, the Florius Verzilver
Hypotheek40 is a reverse mortgage which has a no negative equity guarantee. To be
eligible to access this product, the homeowner (or younger partner in a couple
homeowners household) must to be at least 60 years of age. It is not very popular,
however, even though Florius Verzilver Hypotheek is the brand name of a large Dutch
bank, ABN-AMRO Hypothekengroep B.V. Also available are what Reifner et al.
(2007b) calls extended or second mortgages that are offered by credit institutions. A
form of second mortgage called opeethypotheek is offered by a bank (Rabobank) to
homeowners older than 55 years. It can be described as a line of credit which is
repaid when the home is sold, but if the credit amount exceeds 75 per cent of what
Reifner et al. call the ‘crash value’ of the house, repayment is required before the
house is sold (Reifner et al. 2007b, p.146).41
During the period 1993–99, Alessie and Kapteyn (2002) found that the elderly had a
higher propensity to withdraw equity in the form of second mortgages than younger
households. Later research concluded that, in contrast to past cohorts, recent cohorts
of the over-65s are increasingly not repaying their mortgage loan fully in old age
(Haffner 2008).
3.5.2 Sale of the home
The only home reversion product we have uncovered from the literature that falls
under the ‘sell and stay’ model in the Netherlands is the Torenstad Verzilverd Wonen.
It is a home reversion product that can be applied to the dwelling and the land or the
land only, and may or may not require rental payments on the part of the occupier.
39
Van den End et al. (2002) refer to second mortgages and refinancing as examples of MEW mechanisms. 40
For more details, refer to <http://www.florius.nl/consument/hypotheken/floriusverzilverhypotheek> (last accessed 17 December 2012). 41
At the time of writing of this report, Rabobank was offering these mortgage products under different names. For more details, refer to <http://www.rabobank.nl/particulieren/producten/hypotheken/ hypotheekvormen/speciale_hypotheken/> (last accessed 4 November 2012).

44
However, since the GFC, it is no longer available as cautious lenders are currently not
taking on any new clients.42
As regards the ‘sell and move’ option, we find that Dutch older homeowners are
generally relatively immobile (Rouwendal 2007; see also Haffner 2005). More than
three-quarters of those aged over 75 years prefer to age in their own dwelling for as
long as possible (Eigenhuis panel results reported in VEH, 2012). As illustrated in
Figure 3, the Netherlands has a very well-developed mortgage market. Hence, as
expected, Haffner (2008) concluded that trading down in order to withdraw housing
equity is not a popular option for older Dutch homeowners. Ebner (2010) also finds
that older homeowners withdraw their housing equity mainly by remortgaging or taking
out a second mortgage instead of trading down.
3.5.3 Uses of HEW
Given steadily climbing rates of home ownership in recent decades, the question of
the uses of housing equity is increasingly researched in the Netherlands. However,
there is a consensus among Dutch studies that older Dutch homeowners are
generally unwilling to engage in HEW.
Early results from the Sociaal Economisch Panel (SEP), established that people
generally do not dissave until they reach a very old age (Alessie et al.1995, Alessie et
al. 1997). Haffner (2005, 2008) conducted interviews with some 20 homeowners aged
70 years and over, and found that while one in three did not have plans to repay their
mortgage fully, the trend was expected to weaken over time as the pension system
was deemed adequate enough to comfortably fund spending needs in old age. The
expectation was that housing wealth would for the most part remain unused savings in
old age, a finding echoed by Toussaint et al. (2007).
Among those who do engage in HEW, the precautionary savings motive appears to
be weak. Based on an analysis of the 2002–07 DNB Household Survey, Ebner (2010)
concluded that HEW is not being used as a buffer against adverse financial shocks.
The study argued that consumption smoothing over the life cycle and the desire to
diversify one’s investment portfolio are more likely to influence the equity withdrawal
decision.
Van den End et al.’s (2002) analysis of the DNB Household Panel found that on
average, 84 per cent of households that engaged in MEW43 used the equity withdrawn
for home improvements, 24 per cent for consumption, and 13 per cent for repayment
of loans. The study also found that the frequency of MEW is higher than average
among households with lower incomes. The same theme emerges in Toussaint and
Elsinga’s (2012) study, which found that financial difficulties can increase the
likelihood of MEW later in life, suggesting that among those who are willing to engage
in HEW, housing assets can perform a welfare role for the materially deprived in the
Netherlands.
3.6 Finland
3.6.1 MEW products
A key MEW product targeted at older Finnish homeowners is the reverse-loan model,
which provides monthly payments at a variable interest rate, and was introduced by
the OP-Pohjola Group (group of 200 cooperative banks) in 2007. The reverse-loan
42
For more details, refer to <http://www.torenstad-verzilverdwonen.nl/index.php> (last accessed 17 December 2012). 43
The study does not make a distinction between HEW via MEW and sale of the home. However, the study mostly refers to the mortgage market. Hence, we infer that its focus is on MEW.

45
model is a reverse mortgage offered to elderly homeowners either as a tenure loan or
over a fixed term. The tenure loan is a lifetime loan in a broad sense only because in
practice, the loan operates as a reverse loan for 10 years only. However, the payment
to the homeowner is set as if the loan will run over the homeowner’s lifetime.44 After
10 years, the contract must be revised and renewed before the loan can continue.
Another variant of the reverse mortgage is a balloon loan45 called Homeflex which
was launched by the Nordea Bank Finland in 2005. This loan offers a line of credit
(current account) facility where a loan can be granted up to the point where LVRs
reach 75 per cent. The customer pays interest during the course of the loan term and
the loan capital must be repaid after 10 years unless a new agreement is made or an
amortisation scheme agreed on. Ordinary lines of credit also exist to facilitate HEW,
though these are not solely restricted to older Australians.
Overall, the limited46 literature on the Finnish market for MEW suggests that it is still
relatively undeveloped compared to MEW markets in countries such as Australia, UK
and US. Reifner (2007b) speculates that this is due to the existence of a well-
functioning age pension system, which will be politically difficult to withdraw, even
though the study could not identify institutional barriers to MEW.
3.6.2 Sale of the home
Little information is available in the literature about HEW products that fall under the
sale model (Reifner et al. 2007b). A ‘sell and stay’ product is offered by the Mortgage
Society of Finland, a commercial bank, which offers a sale and leaseback style of
HEW for a limited term (usually 10 years).
As for the potential for adopting a ‘sell and move’ approach to HEW, national statistics
indicate that mobility declines as one ages within the Finnish population. Inter-
municipal migration occurs at a rate of 10 moves per 1000 of those aged 60 to 64
years.47 On the other hand, younger age groups exhibit higher mobility rates; between
50 and 200 moves occur per 1000 persons.48
However, these statistics do not shed light on the relative mobility of the Finnish
elderly in comparison to older people in other countries. Naumanen et al. (2012)
conducted interviews with 30 homeowners residing in Turku, in three age groups
ranging from 25–35 years, to 45–55 years and 65 years or over. When asked about
their views on the role of housing equity in retirement, respondents acknowledged that
they would consider trading down to reap capital gains. In comparison, there
appeared to be greater resistance to MEW (via re-mortgaging or reverse mortgages)
and selling and moving into the rental sector was ‘practically out of the question’
(p.62).
3.6.3 Uses of HEW
As mentioned above, Reifner et al. (2007b) notes that the need for HEW by older
homeowners in Finland is limited because of the adequacy of the old-age pension
44
This is contrary to loans with a fixed term that offer higher amounts to the homeowner but assume that the loan will be repaid at the end of the term. 45
Other types of loans, such as ordinary line of credits and bullet loans, also exist and are used for equity release purposes, but they do not fit Reifner et al. (2007b)’s definition of ERS targeted to the elderly and part of retirement income (see the last paragraph of Section 3.1). They are thus not described in that study, Reifner et al. (2007b) also state that they would be classified in statistics as ordinary consumer loans. 46
For example, statistics on the size of the MEW market in Finland are not available (Reifner et al. 2007b). 47
For more details, refer to <http://www.stat.fi/til/muutl/2011/muutl_2011_2012-04-27_kuv_002_en.html> last accessed 17 December 2012. 48
Moves within municipalities are excluded from these estimates.

46
system in Finland. Naumanen et al.’s (2012) study supports this argument. The study
reported that interviews with elderly Finnish homeowners uncovered the view that
reverse mortgages are seen as an option of ‘last resort’ only (Naumanen et al. 2012,
p.65; see also Naumanen & Ruonavaara 2010). Most homeowners prefer to save
their housing equity for emergency purposes, and possess conservative or religious
attitudes that support bequest motives.
3.7 Germany
3.7.1 MEW products
The market for MEW products for the older German homeowners is not very well
developed, and second mortgages, too, are quite uncommon (Reifner et al. 2007b).
The total equity release product market for the elderly was estimated at less than 100
contracts in 2008 (0.0008% of outstanding domestic mortgages), with only two
products being offered.49 One of the products was a reverse loan where the retired
homeowner would pay a monthly interest, but no capital repayment, until the
homeowner leaves the property. An example of a reverse loan is the so-called
Rentenhypothek for retired homeowners.50 However, Wicke (2008; see also Tiffe
2007) notes that all attempts to launch reverse mortgages in the German market have
failed because of the complexity of the products and associated legal insecurities.
Helbrecht and Geilenkeuser’s (2010) qualitative study which interviewed 36
households in and around Bremen regarding their views on the use of housing equity
in retirement, found that most of the respondents had never even heard of reverse
mortgages. Even among those who knew of the product, many were hesitant to use
them. Lang and Westerheide’s (2006) study, based on a survey of 232 experts,
proposed that the main reason for such caution is the inheritance motive, followed by
resistance to making estimations about one’s own life expectancy, distrust of financial
institutions, and the unwelcome prospect of potentially having to sell the dwelling in
the future.
More broadly speaking, among the six countries we have reviewed, Germany not only
has the lowest rate of home ownership but it also features the second to smallest
mortgage market when expressed as a share of GDP. Furthermore, another stark
difference that exists between Germany and the other countries is that it is the only
country being reviewed that has experienced a drop in real house prices since the
mid-1990s, as Figure 4 shows. Hence, there have been no capital gains to be reaped
from engaging in HEW in Germany.
It should be noted, however, that even though the market for HEW products has not
taken off, some studies have argued that a potential market exists in Germany, as
about every second retired German household would be a homeowner by now
(Bundeszentrale für politische Bildung 2008; Statistisches Bundesamt 2011). Wicker
concludes (based on Conrad 2007) that Germany has a reverse mortgage market
potential of about one million out of 39 million homeowners, as the coverage of the
state pension is rapidly shrinking and private pensions are not sufficient to cover this
gap. Reifner et al. (2007b) proposes that potential demand for equity release by older
homeowners is worth 7 per cent of the domestic mortgage market. On the other hand,
they also report on signals from financial institutions that the equity release market will
not be viable because it will be too small.
49
However, planning was underway in 2008 to launch three more products in 2008–09. 50
For more details, refer to <http://www.test.de/Rentenhypothek-der-Hannoversche-Leben-Guenstig-fuer-Rentner-mit-Eigenheim-1669749-0/> (last accessed 17 December 2012).

47
3.7.2 Sale of the home
As with the market for MEW products, there are hardly any financial products
designed to facilitate HEW using a sale model, with the exception of a home reversion
product for which take-up has been extremely low.
The ‘sell and move’ option appears to be equally unpopular. Data from the European
Union Statistics on Income and Living Conditions (EU-SILC) show that about 2 per
cent (4%) of homeowners aged 65 years and over (55–64 years) moved in 2008
(Elsinga & Doling 2012). Chiuri and Jappelli (2010) argue that Germans aged 75 to 80
are more likely to decumulate housing wealth by moving into renting than those in
countries with well-developed mortgage markets, such as US and UK. However, this
contrasts with findings offered by various other studies. Angelini et al. (2011)
concluded from their Survey of Health, Ageing and Retirement in Europe (SHARE)
analysis that a smaller share of homeowners sell their home and move in Germany
than in some countries with more developed mortgage markets. Elsinga and Doling
(2012, data from EU-SILC 2008) and Tatsiramos (2006, data from European
Community Household Panel 1994–2001) also reported that older homeowners aged
55 years and over in Germany are less likely to move than similarly aged
homeowners in the UK. The inconsistency in existing studies’ findings suggests that
there are multiple factors at play in determining the extent to which alternative HEW
mechanisms are used to release housing equity. For example, house prices have
been more or less stagnant in Germany for the last few decades (see Figure 4). In
contrast, house prices in the UK have soared. Moves may have been deterred in
Germany as there are no capital gains to be realised upon sale of the home.
3.7.3 Uses of HEW
German policy does treat owner-occupied dwelling as part of the pension system in
old age. For example, the so-called Riester Rente (Riester Pension) was introduced in
Germany in 2008 (Reifner et al. 2007b). It is a voluntary private pension system based
on private savings and government subsidies. Since 1 January 2008, the acquisition
of owner-occupied and cooperative housing based on the Riester Pension is also
eligible for subsidisation (Bundesregierung 2009).51 But this does not seem to have
stimulated HEW in old age.
As noted in the previous sub-sections, the take-up of HEW has been extremely low in
Germany. In Helbrecht and Geilenkeuser’s (2010) qualitative study, the over-65s who
were interviewed stated that they would only sell their home in the event of an
emergency (see also Jones et al. 2012). Furthermore, respondents were of the view
that pension levels at the time of interview (2009) did not make it necessary for them
to tap into housing equity.
Households interviewed by Helbrecht and Geilenkeuser (2010) revealed a preference
to save to buy an investment property in old age, once the mortgage for the primary
home has been repaid and the household was debt-free. Younger respondents (aged
25–35) were conscious that a home purchased relatively early in the life cycle would
contribute to economic security in old age by offering lower housing costs in
retirement. This implies that the primary home functions more as a pillar in Germany’s
pension system by offering low housing costs in old age than as an economic
resource that can release funds to support consumption in retirement.
51
Specifically, repayments on so-called ‘for the Riester Pension certified’ mortgage loans to acquire housing property can be subsidised with an annual subsidy. Both amounts (repayment and subsidy) are counted as savings in a fictitious Riester Pension account. Tax payment on this account is deferred until the ‘official date’ of usage has passed, such as the pension age.
48
3.8 Institutional settings influencing the use of HEW
This chapter has reported findings from country-specific reviews on the availability of
HEW mechanisms and uses of HEW in six developed countries. Differences in the
extent to which MEW and sale of the home are used as channels of HEW by older
homeowners have been uncovered across countries, and cross-country comparisons
reveal that many of these differences are driven by variations in institutional settings.
The extent to which we have been able to uncover literature that offers insights into
HEW by older homeowners also varies across countries. For example, while there is
substantial relevant literature in the UK and Australia, at the other extreme, the
literature on HEW by older homeowners in countries such as Finland and Germany is
relatively sparse. This could be due to the currently limited volume of HEW activities
occurring in these two countries as compared with other countries in this study.
Nonetheless, the country-specific reviews reported in Sections 3.2 to 3.7 offer
sufficient information for us to draw out inferences about the styles of HEW that tend
to dominate in various countries and relate these to various institutional factors that
are likely to influence the popularity (or lack of) of different forms of HEW, as detailed
below.
3.8.1 Degree of mortgage market development
It is clear that the degree of mortgage market development is positively correlated with
the propensity to MEW. We find that in Australia, UK and the US, the use of MEW
products such as flexible mortgages and reverse mortgages is more prevalent than in
countries with more limited closed circuit mortgage markets such as Finland and
Germany. In the Netherlands, MEW has also been taking place, not via flexible or
reverse mortgages, but mostly via refinancing and second mortgages. Indeed, the
take-up of MEW products in Australia, the UK, US and Netherlands grew substantially
on the back of soaring house prices during the pre-GFC boom. However, even in the
US (where mortgage markets are well-developed and reverse mortgage products are
typically guaranteed with government backing) as well as the UK, the take-up of
reverse or lifetime mortgages has waned as a result of the GFC; and it would appear
that taxation settings in the Netherlands will likely blunt incentives to engage in MEW
among older homeowners in the near future. In Australia, however, the origination of
reverse mortgages has continued to rise through the GFC years.
3.8.2 Housing markets
There appear to be several conflicting factors influencing decisions to sell the home in
order to release housing equity. Chiuri and Jappelli (2010) hypothesise that in
countries such as Germany, where mortgage markets are limited, older homeowners
are more willing to withdraw housing equity by selling their homes and moving into
rental housing than in countries with well-developed mortgage markets such as the
UK. However, interestingly, Tatsiramos (2006) and Elsinga and Doling (2012) have
uncovered contrasting findings, that is older homeowners in Germany are in fact less
likely to move than older homeowners in the UK.
The inconsistency in existing studies’ findings as reported above suggests that there
may be multiple factors at play in determining the extent to which alternative HEW
mechanisms are used to release housing equity. For example, the extent of house
price appreciation clearly plays a critical role. In Germany, house prices have been
stagnant over the last few decades; in comparison, house prices in Australia and the
UK have soared. Hence, there are no capital gains to be realised from selling one’s
home in a country where house prices have not appreciated, and this may have

49
dampened incentives to engage in HEW through the sale of the home in Germany
relative to countries such as Australia and the UK.
Van der Heijden et al. (2011) also distinguishes between dynamic and static housing
systems, which may also potentially influence the extent to which HEW is used. The
study proposes that dynamic systems are much more likely to feature a large volume
of speculative property construction and a high rate of turnover of the existing housing
stock than static systems. On the other hand, in static housing systems, the purchaser
of a property typically invests much more effort into the construction process in
consultation with an architect, such as arranging for the necessary planning permits
and having input into the design process (Ball et al. 1988; Dol et al. 2010). Hence,
mobility rates will be higher in countries with dynamic housing systems (such as the
UK), while in countries with static systems (such as Germany), changing housing
preferences are more likely to result in home modifications rather than sale of one’s
home (Van der Heijden et al. 2011).
3.8.3 Taxation settings
The institutional environment concerning taxation does impact on the take up of HEW
via downsizing or selling up and renting. As reported in Table 4, CGT applies on the
sale of the primary home in Germany if sold within 10 years from the date of
acquisition of the property. On the other hand, in countries such as Australia and the
UK, the sale of the primary home is exempt from CGT. This is a potential reason why
Tatsiramos (2006) and Elsinga and Doling (2012) both found that older homeowners
in Germany are in fact less likely to move than older homeowners in the UK.
The availability of a mortgage interest deduction (from taxable income) for home loans
makes for attractive borrowing compared with loans for other purposes, for example in
the US (Do 2012). In regard to MEW, until recently, mortgage interest deduction was
available in the Netherlands, hence encouraging the withdrawal of housing equity via
MEW.
The institutional environment concerning taxation in the Netherlands, however, has
changed, and may temper inclinations to engage in MEW in the Netherlands. Firstly,
the 2001 tax reform abolished the mortgage interest deduction for that part of the
mortgage spent on non-housing uses. Secondly, since 2001, the mortgage interest
deduction term has been limited to 30 years. Given the length of the term, it is likely to
end in later life. Hence, older homeowners will have fewer incentives to continue to
engage in MEW when they reach the end of their mortgage interest deduction term.
Thirdly, from 2004 onwards, the amount of mortgage that is eligible for mortgage
interest deduction on moving to a new dwelling is capped at the difference between
the acquisition price and the equity embodied in the previous house (thus deterring
over-mortgaging). Fourthly, from 2005 onwards, the amount of taxable imputed rent
(which is taxed under income tax provisions) is also limited to the amount of mortgage
interest to be deducted. The intention is to motivate accelerated repayment of the
principal because once a mortgage loan is repaid, the owner-occupier no longer pays
income tax on imputed rent (Haffner & De Vries 2010). More institutional changes
have been agreed upon by policy-makers, which make the use of mortgage loans to
release housing equity less attractive than it used to be. As of 1 January 2013, all new
loans have to be repaid in 30 years at least in an annuity pattern (Ministerie van
Financiën 2012). This makes interest-only mortgages unattractive. Furthermore, from
1 January 2014, the Dutch government that came into office in autumn of 2012
intends to reduce the rate at which mortgage interest can be deducted from the
current maximum of 52 per cent of taxable income, by half a percentage point each
year, until it reaches the next lower tax rate of 42 per cent (VVD-PvDA 2012). These

50
changes suggest that in situ MEW will become less attractive in the Netherlands in the
future than at present.
It is noteworthy that changes to taxation settings as described above and partly
instituted after the GFC may shift preferences away from MEW towards sale of the
home among those who wish to withdraw housing equity. In addition, in 2012 the
transaction tax payable on property purchase was temporarily reduced to stimulate
property exchanges in a market that had slowed considerably after the GFC. The
transaction tax was permanently set at 2 per cent on July 1 2012, a hefty reduction
from the previous 6 per cent that was applicable.
3.8.4 Regulatory frameworks
The role of regulation is an important one that influences the willingness of older
persons to take up HEW due to the multitude of risks associated with reducing equity
in the primary home, to which one usually has a strong emotional attachment.
Currently in the US, over 90 per cent of all reverse mortgages are based on the
Federal Home-Equity-Conversion-Mortgage (HECM) Program (see Bishop & Shan
2008; Gotman 2011), under which the FHA is responsible for accrediting financial
institutions providing the HECM reverse mortgages. The involvement of the US
government in the reverse mortgage market, and its willingness to assume a
guarantor-type role has inspired more confidence in the use of HECMs than
proprietary reverse mortgages that are not government-backed.
In the UK, apart from standard contract and consumer protection laws, certain equity
release products that are deemed to pose higher risks to consumers are subject to the
its Financial Services Authority (FSA)52 regulation, including lifetime mortgages, home
reversion products and sale and leaseback products. Moreover, industry self-
regulation is extensive, with 90 per cent of equity release business being transacted
with providers who subscribe to the ERC’s self-regulatory codes (Fox-O’Mahony &
Overton 2013).
Similarly, in Australia, SEQUAL operates as a peak industry body which seeks to
maintain professional standards of practice in the equity release market. SEQUAL’s
code of conduct requires that all providers who are SEQUAL members include clear
and transparent no-negative equity guarantees in the products they offer, as well as
comply with other self-regulatory codes (SEQUAL, n.d.).
On the other hand, the lack of success of MEW products in Germany may be
attributed to the presence of legal barriers that complicate the supply of MEW
products by lenders. For example, financial institutions that are not licensed as an
insurer need to search for alternative ways of insuring against the longevity risk of the
homeowner. The institutional settings, however, favour the take-up of reverse
mortgages by homeowners, as payments from reverse mortgages are not regarded
as a form of income, and are thus not taxed under current income tax arrangements
(Reifner et al. 2007b).
3.8.5 The generosity of public pension systems
The generosity of a public pension system in a country will no doubt also influence the
use of HEW by older persons. While public pension regimes vary considerably across
countries, the gross replacement rate from public pension schemes offers a valuable
52
The FSA is an independent non-governmental organisation that has statutory powers by the Financial Services and Markets Act 2000. While financed by the financial services industry, the FSA is accountable to Treasury Ministers and the UK Parliament. For more information, please refer to <http://www.fsa.gov.uk/about/who>.
51
point of comparison as it estimates the level of public pensions in retirement relative to
earnings when working.
According to the OECD (2011), the gross replacement rate from public pension
schemes is lowest in Australia at 11.8 per cent. The replacement rates in the
Netherlands, UK and US fall in the intermediate range, being 29.2 per cent, 31.9 per
cent and 39.4 per cent respectively. However, it is noteworthy that among these three
countries, only the Netherlands has a quasi-mandatory private pension system, under
which pensions are provided by employers or industry-wide schemes. The public
pension replacement rates climb up to 42 per cent in Germany and 57.8 per cent in
Finland, indicating that the public pension systems are likely to be the most generous
in Finland and Germany (though these countries do not have mandatory private
pension schemes).
The Netherlands has the most developed quasi-mandatory private pension system
among the six countries, which covers over 95 per cent of the Dutch workforce, that
came about as a result of the introduction of the private occupational pension
schemes in the mid-1800s for railroad workers. By 1949, a law on occupational
pension sectoral funds had been implemented, which made it obligatory for employers
to participate in pension funds in sectors where there was a collective agreement on
occupational pensions schemes (Trampusch et al. 2010). At the end of 2008, there
were 656 pension funds that fell under the quasi-mandatory private pension system in
the Netherlands (OECD 2011). Under this system, each employee has to pay a fixed
percentage of his or her salary in return for future pension entitlements. In 2008, this
percentage was around 16 per cent of gross income (Ministerie van Sociale Zaken en
Werkgelegenheid 2008). In comparison, Australia’s compulsory guarantee system
was only established in 1992, and the US, UK, Finland and Germany do not have
established private pension systems in place (OECD 2011, p.107).
It is therefore not altogether unsurprising to find more widespread use of MEW
products in Australia, the UK and US, than in countries that are supported by more
generous public or private pension systems such as the Netherlands, Finland and
Germany. At the same time, the existing literature hints at a greater willingness
among older homeowners to sell and move in Australia (see, e.g. Olsberg & Winters
2005) and the UK than in countries such as Germany (Tatsiramos 2006; Elsinga &
Doling 2012).53 Given growing pressures on government budgets to meet age-related
payments and services, we can expect the continued retreat of welfare states in
countries with neo-liberal welfare regimes such as Australia (see Section 1.3.1), and
as a result older homeowners will increasingly engage in HEW to supplement
retirement incomes.
3.8.6 The welfare role of housing wealth
Little is known about the specific uses of HEW by older homeowners. There are
potentially a range of competing uses for HEW. The limited evidence available seems
to suggest that, at least in the Netherlands, Finland, Germany and US, older
homeowners do not regard their housing wealth as a store of savings to be tapped in
order to meet routine consumption needs. Rather, the release of housing wealth is a
last resort in the event of emergencies. It would appear that in these countries, the
accumulation of housing wealth fulfils a precautionary savings motive. It seems that
older homeowners in these countries are cautious and recourse to housing equity is
limited to meeting urgent welfare needs (e.g. medical expenses).
53
Ong et al. (2013) found among all homeowners, the propensity to trade on is similar in Australia and the UK. However, the propensity to sell and rent is higher in Australia than the UK.

52
On the other hand, Smith and Searle (2008) and Ong et al. (2013) have used large-
scale surveys and quantitative as well as qualitative methods to investigate the uses
of HEW by the general Australian and UK home owning population. These studies
hint at a larger welfare role for housing in Australia and the UK. Homeowners are
prepared to tap into their housing equity for a wider range of competing uses—to
supplement incomes, consolidate debts, and to pay for home maintenance and
renovations. These studies do not distinguish between older and younger
homeowners, but qualitative studies focusing on older homeowners, such as ASIC
(2007) and Bridge et al. (2010), confirm that older homeowners, at least in Australia,
do use their housing equity for a wider range of uses than in the Netherlands, Finland,
Germany and US.
3.8.7 Implications for HEW in Australia
Drawing together the key observations from the existing literature, we hypothesise
that HEW, via both MEW and sale of the primary home, is likely to grow at a faster
rate in Australia in the future than the other countries reviewed in this chapter. The
significant house price appreciation experienced in Australia over the last few
decades (Figure 4), together with the CGT exemption of the sale of the primary home,
will have fuelled incentives to channel housing wealth to fund consumption needs.
Financial market innovation has made housing wealth fungible, thereby providing
homeowners with vehicles that allow them to respond to these sharper incentives.
Existing studies generally confirm that Australia has an extremely well-developed
mortgage market (see Section 3.1). Statistics from Australian sources such as Deloitte
Touche Tohmatsu and SEQUAL (2011, 2012) also indicate that the Australian reverse
mortgage market did not suffer any noticeable downturn through the GFC years (see
Section 3.2.1), whereas the take-up of reverse mortgages did subsequently decline in
the similarly complete UK and US mortgage markets (see Sections 3.3.1 and 3.4.1).
Interestingly, we also find that despite its well-developed mortgage market, Australian
homeowners aged 75–80 years are more likely to move into renting than homeowners
in the same age group in the UK or US (based on Chiuri and Jappelli’s Figure 6). This
raises the question of whether HEW via sale of the home is also more likely to occur
in Australia than other countries with similarly complete mortgage markets because of
institutional settings that facilitate or motivate the sale of a home to move into the
rental sector. Indeed, Wood and Ong’s (2012) statistical comparisons of exits from the
home ownership sector into the rental tenure suggest that homeowners were more
likely to move into the rental sector in Australia than the UK during the period 2001–
08. The study suggests that this difference has arisen as a result of divergent
institutional settings in the rental sectors of the two countries. Australia has a larger
relatively unregulated private rental sector (around one-fifth of the population rents
privately), and is therefore more likely to be able to accommodate moves from the
home ownership sector into the private rental sector should homeowners be forced to
sell up.54 However, it should be noted that the absence of rent controls and security of
tenure in Australia’s private rental market means that older homeowners are unlikely
to be willing to sell and move into the rental market unless they have no other option.
Finally, as noted in the previous sub-section, it is possible that housing wealth is being
used to fund everyday consumption needs in Australia rather than just to fulfil
precautionary savings motives. If this is the case, and given the availability of MEW
products in Australia’s developed mortgaged markets, it is likely that Australian
54
Ong et al. (2013) find that among housing equity extractors, the incidence of financial distress is higher among those who sell up and rent than those who trade on or withdraw equity in situ, possibly indicating that selling up and renting is usually view as a measure of last resort.

53
homeowners are increasingly tapping into their housing equity at earlier stages of the
life course to fund spending needs. To the extent that HEW is exercised by MEW over
the life course (and not just post-retirement), more and more older Australians will
approach retirement with outstanding debt, that is either paid off from lump sum
superannuation payouts, or by regular repayments which are a drain on retirement
pensions. This will have important ramifications for the effectiveness of the retirement
income system in Australia. We consider these issues in greater detail by testing the
strength of our hypothesis via statistical analysis in the next chapter.

54
4 THE ASSET AND DEBT PROFILE OF OLDER AUSTRALIANS
This chapter profiles the asset and debt composition of older Australians. This
profiling exercise will present background information that will inform the remainder of
this project.
The previous chapter has highlighted the increasingly important role that housing may
play as an asset base for welfare, in particular in countries with a neo-liberal welfare
regime such as Australia. Indeed successive Australian governments have implicitly
promoted this switch to asset-based welfare via the use of tax expenditures
(subsidies), concessionary asset tests (governing eligibility to allowances and
pensions) and assistance to first homebuyers that promote home ownership and the
accumulation of savings in housing wealth. The assumption has been, as appears to
be the case in Germany, that lower retirement incomes than employment incomes will
be matched by relatively low housing costs post-retirement because retired
homeowners would own their homes outright, and can therefore get by on smaller
pensions (Castles 1998).55 There is evidence supporting the effectiveness of this
strategy. For example, on comparing six countries, Yates and Bradbury (2010) find
that while Australia has the highest before-housing poverty rate among the over-65s,
it has one of the lowest after-housing poverty rates in this age group.56 Hence,
housing wealth has traditionally been an important pillar supporting Australian
retirement policy. Government interventions that encourage extensive accumulation of
wealth in the primary home have become a cornerstone of Australian social policy as
it has allowed the age pension to be set at relatively low levels as compared to other
countries (Baxter & McDonald 2005).
However, HEW eats into housing wealth, leaving less housing equity to fall back on in
the event of emergencies. Toussaint and Elsinga (2009) distinguish between
traditional and new ‘housing-asset-based welfare’. In the former, home ownership is
perceived as a means to accumulate housing equity that can be tapped into
contingently, as a last resort, and typically late in the life course. In the latter, housing
equity is used as a financial resource and built up or released as needed over the life
course via financial products. The increased availability of these financial products
permits the welfare role of housing wealth to reach into earlier stages of the life
course. Hence, to the extent that HEW is exercised by MEW over the life course (and
not just post-retirement), more and more older Australians will approach retirement
with outstanding debt, that is either paid off using lump sum occupational pension
payouts, or is paid off by regular repayments which are a drain on retirement
pensions. It is these fears (and others about price volatility) that motivate concern
about the robustness of housing wealth as an asset base in old age.
The empirics reported in this chapter shed light on the sturdiness of home ownership
as a pillar supporting Australian retirement income policy. Is this pillar still strong, or is
it now a crumbling pillar, as suggested by Yates and Bradbury (2010)? Might HEW
indeed be reducing the effectiveness of housing wealth as an asset base for welfare
in old age?
55
The small minority unable to attain outright ownership are assumed to be accommodated in public housing at affordable income related rents, or in private rental housing with housing cushioned by Commonwealth Rent Assistance. 56
Doling and Ronald (2010) report a significant positive correlation between before-housing poverty rates among over 65s and the rate of homeownership in a sample of EU countries. Heylen and Haffner (2012) conclude that it is not about the rate of homeownership but the rate of outright owners that determines the reduction in after-housing poverty rates.

55
In this chapter, we define older Australians as those aged 45 years and over. The
ABS broadly classifies the adult population into four groups; youths aged 15–24
years, prime working aged from 25–44 years, those approaching retirement from 45–
64 years, and finally those aged 65 years and over who are usually no longer part of
the working age population (ABS 1995). The peak of life cycle earnings typically
occurs at some point after 44 years or age. Asset accumulation and divestment
decisions will become more critical from age 45 onwards. Section 1.2 highlighted the
growing dominance of baby boomers (currently in their 40s, 50s and 60s) within the
population. By focusing on those aged 45 years and over, we have an opportunity to
gain some insight into the behaviours and expectations of baby boomers with respect
to the use of housing equity in later life, as this group is likely to exert increasing
influence on the direction of public policy-making in Australia in the near future.
As life expectancies lengthen, older Australians in later life are becoming an
increasingly heterogeneous group. In recognition of this, we make important
distinctions between the following life cycle stages:
Pre-retirement phase, when men and women are typically still accumulating assets (45–54 years).
The years surrounding retirement decisions and transitions (55–64 years).
Post-retirement years, when asset divestment is expected (65 years and over).
4.1 Method
4.1.1 Data
The empirics described in this chapter are sourced from the confidentialised unit
record files of waves 2, 6 and 10 of the Household Income and Labour Dynamics in
Australia (HILDA) Survey. These waves represent the calendar years 2002, 2006 and
2010. They have been selected for analysis because they contain special wealth
modules necessary to map the asset and debt profile of older Australians. The years
represented by the wealth modules are also convenient markers of two distinct
periods in housing markets. The period 2002–06 represents a period of house price
boom in Australia; those fortunate enough to be owning housing in sub-markets where
prices were soaring over this period would have reaped large windfall gains. On the
other hand, in the period 2006–10, house prices peaked and then declined as a
worldwide financial crisis shook the confidence of housing market participants and
ushered in a new era of risk and volatility.
4.1.2 Measurement of assets and debts
The HILDA Survey reports most asset and debt values on a household basis.
However, households can comprise multiple income units. An income unit contains
persons who live in the same dwelling, but can be expected to share their income.
Households contain all the persons who live in the same dwelling. So, for example, a
household comprising a couple with two dependent children aged under 15 years of
age contains only one income unit. But a household consisting of a couple and a non-
dependent 26-year-old son in full-time employment contains two income units. It is
clear from the example provided that it would be misleading to assume that the two
income units have equal access to aggregate household wealth. And if the household
were an owner-occupier, it would be misleading to attribute any of the wealth stored in
the primary home to the adult son, when his parents are in fact the homeowners.
Indeed these ideas inform the application of Australia’s income support payment asset
tests, which are applied on an income unit, rather than a household basis.

56
We therefore invoke a series of algorithms to translate the HILDA Survey’s reported
household and individual asset and debt values into income unit estimates. The most
important function of these algorithms assigns the value of property held by a multi-
income unit household to the income unit that is the legal owner of the property, as
reported in the wealth modules. The household’s business assets are divided equally
among those identified as business owners in the household. Each individual in an
income unit has their business wealth summed to derive income unit business wealth.
Savings in bank account balances and superannuation funds are reported on an
individual basis; arriving at an income unit estimate involves simply adding these
values across members of the same income unit. On the other hand, investments
such as shares and bonds, life insurance, trust funds as well as assets such as
vehicles and collectibles are reported on a household basis. These components of
household wealth are divided equally among adult members of the household, and
then summed across members of each income unit.
A series of similar algorithms are also applied to reported debt values. Debts secured
against property are treated in the same way as property assets and assigned to legal
owners of the property. Business debts are divided equally among those identified as
business owners in the household. Credit card and other debts are reported on an
individual basis.57 These outstanding debt amounts are added up across those
belonging to the same income unit.
Table A1 in the appendix lists the key asset and debt variables, their units of
measurement in the HILDA Survey, and the algorithm we have applied to transform
the variables onto an income unit basis. These algorithms broadly follow those
reported in Wood et al. (2010a); the imputed income unit values that result from
application of these algorithms will no doubt contain some measurement error, but the
extent of measurement error will be limited since almost 80 per cent of households
are single-income unit households, where the algorithms are unnecessary.
Asset and debt estimates are all population weighted so that survey estimates are
translated into population level estimates in each of the three waves that include
wealth modules.58 Consumer Price Index (CPI) deflators are applied to convert
nominal asset and debt estimates into real values at constant 2002 price levels.59
4.1.3 Sample design
The analysis reported in this chapter exploits two different sample designs.
First, the availability of cross-sectional population weights in every wave allows us to
convert the HILDA dataset into a repeated cross-section dataset that can compare
‘snapshots’ of the asset and debt profiles of older Australians in each of the three
years under scrutiny, that is 2002, 2006 and 2010. This permits us to judge whether or
not older Australians in 2010 have significantly different asset and debt portfolios than
their older Australian counterparts in 2002 (see Sections 4.2 and 4.3).
However, the HILDA Survey is first and foremost a panel survey that allows
researchers to track individuals as they age over time. We exploit the longitudinal
57
Other debts include Higher Education Contribution Scheme loans, car loans, investment loans, personal loans, hire purchase and overdue bills. 58
As explained below, two different sample designs are used for the analysis. Where a repeated cross-sectional sample design is adopted, cross-sectional population weights are applied. Where a balanced panel is invoked, longitudinal population weights are used. 59
The CPIs in 2002, 2006 and 2010 are 138.1, 154.4 and 172.6 respectively. Hence, to express the 2006 house values in real terms, we deflate the 2006 values by a CPI deflator equivalent to 138.1/154.4. Similarly, to express the 2010 house values in real terms, we deflate the 2010 values by a CPI deflator equivalent to 138.1/172.6.

57
nature of the data to investigate how asset and debt portfolios change as the same
panel of Australians age (see Section 4.4).
In both samples, the unit of analysis is the person. This is necessary because income
units dissolve and re-form over time, and so it is not possible to track the same
income units between 2002 and 2010. For example, some income units will dissolve
because of divorce and separation, and new income units will be formed as
dependent children grow up and leave the family home. If there were no deaths,
births, separations, divorces or other additions/subtractions to income units, it would
be possible to profile a balanced sample of unchanging income units. However, given
that life events do alter the composition of income units, their use as the unit of
analysis would result in an unbalanced sample of income units that confounds
interpretation of findings about wealth and debt across years.
4.2 Snapshots of older Australians’ asset and debt portfolios
In this section, we examine the size and composition of asset and debt portfolios
accumulated by older Australians. We are especially interested in the extent to which
the primary home is an important store of wealth relative to other asset types. In
addition, we investigate whether older Australians in 2010 have significantly different
asset and debt portfolios as compared to older Australians in 2006 and 2002. We
achieve this by taking snapshots of the asset and debt portfolios of older Australians
in 2002, 2006 and 2010 and compare them, using repeated cross-sectional analysis.
This approach also allows us to examine whether the importance of the primary home
as a store of wealth in old age has grown or diminished over time. If the primary home
and housing equity continue to dominate the asset portfolios of older Australians, they
will remain a critical influence over their retirement strategies and welfare. On the
other hand, if the primary home and housing equity have become less prominent
components of older Australians’ asset portfolios, their influence over retirement
strategies and welfare will wane. We might then ask whether the focus of retirement
strategies has shifted away from the primary home to other components of wealth
portfolios such as superannuation. The welfare implications of HEW in old age will
differ depending upon our findings. For example, tapping into housing wealth as
retirement approaches or after transition into retirement is much less of a threat to
future welfare if superannuation is catching up, or even overtaking housing as the
major store of wealth.
Table 6 presents the average values of a range of assets and debts held in the 2002,
2006 and 2010 portfolios of older Australians in those years. The primary home
clearly remains the main vehicle used by most older Australians for the accumulation
of wealth, representing approximately 45 per cent of their asset portfolio over the
period 2002 to 2010.60 Housing is followed by superannuation wealth, representing
roughly one-fifth of older Australians’ total assets. Other properties and savings and
investments are less important sources of wealth, comprising 16 per cent and 13 per
cent of older Australians’ 2010 asset portfolios respectively. Given the continued
dominance of the primary home, it is not surprising to find that debt secured against
the primary home takes up the major share of debt owed by older Australians in all
years. In summary, in the new millennium housing clearly performs an important role,
both as a vehicle for wealth accumulation, and as collateral against which debt can be
secured.
60
The estimates in Table 5 represent average values for all older Australians regardless of housing tenure; 80 per cent of older Australians were homeowners in 2002 and 2006, but this fell slightly to 78 per cent in 2010.

58
Looking across the three years, it is clear that older Australians reaped significant real
capital gains from soaring house prices in the early 2000s. By 2006, average primary
home values had soared to $442 000, almost 75 per cent higher (in real terms) than
the average 2002 ($255 000) value of older Australians primary homes. Perhaps more
surprising is that house prices remained resilient through the GFC. Between 2006 and
2010, the real value of primary homes in older Australians’ portfolios continued to
grow, defying the generally volatile global economic climate, to reach $586 000. ABS
house price indices displayed in Figure 5 indicate that while house price growth
slowed, their levels in 2011 exceeded those prior to the start of the GFC in 2006. The
real value of debt owed against the primary home (as well as other property) also
climbed, more than tripling over the period 2002 to 2010, indicating that the current
cohort of older Australians are much more indebted than their 2002 counterparts.
Despite widespread fears of tighter borrowing constraints, post-GFC debt secured
against the primary home and other property continued to increase between 2006 and
2010.
Superannuation has not increased its share in older Australians’ wealth portfolios
despite tax preferences and the maturing of the compulsory superannuation
guarantee system and the increasing proportion of older Australians who have been
benefiting from contributions over longer time periods. Superannuation funds have
been hit hard by GFC-related stock market reversals. Hence, we haven’t witnessed
the rising share of superannuation that one might have anticipated. In contrast,
between 2002 and 2010 the real value of ‘other property’ (largely housing not
occupied by the owner) in older Australians’ portfolios more than tripled, and its share
of total assets surged from 11 per cent to 16 per cent. This is consistent with Seelig et
al.’s (2009) qualitative study which finds that retirees (and other Australians) favour
‘bricks and mortar’ investment as a conservative low risk investment option that
generates regular weekly income payments. In comparison, there can be a reluctance
to invest in shares because returns would not be received with the regularity
desired.61
Among older Australian homeowners, average primary home debt is consistently
higher among those who also own other properties. Indeed, the divergence in average
real primary home debt between those who have versus those who do not have other
property widened between 2002 and 2010, from $29 000 in 2002 to $125 000 in 2010.
It would appear that older Australians are inclined to use other property investments
as collateral backing borrowings against the primary home where they are able to do
so.
Unlike other property in asset portfolios and in spite of strong growth in house prices,
the primary home accounted for an unchanging share of older Australians’ total
assets, remaining steady at around 45 per cent over the last decade. The share of the
primary home in older Australians’ portfolios will depend upon both the rise in house
prices, and the percentage of the population holding owner-occupied property. The
proportion of older Australians who are homeowners declined slightly from 80 per cent
in 2002 to 78 per cent in 2010. On the other hand, the proportion of older Australians
who own other properties rose from 19 per cent to 23 per cent in 2006; this
percentage remained constant at 23 per cent in 2010. Moreover, it is interesting to
note that the proportion of older homeowners owning more than one other property
actually increased from 34 per cent to 37 per cent between 2006 and 2010.
61
However, it is worth noting that the asset and income test treatment of rental investments may encourage older Australian investors to sell up.

59
Table 6: Asset and debts of older Australians aged over 45 years, 2002–10
Mean income unit asset and debt, 2002 price level,
in $’000s
Composition of income unit asset and debt, per cent
(calculated based on means)
2002 2006 2010 2002 2006 2010
Asset
Primary home 254.5 441.6 585.7 45.3 43.8 45.5
Other property 59.6 177.5 200.5 10.6 17.6 15.6
Superannuation 110.1 199.9 264.5 19.6 19.9 20.6
Business 23.1 20.1 39.5 4.1 2 3.1
Savings and investments 92 139.4 161.4 16.4 13.8 12.5
Other 22.3 28.6 35.6 4 2.8 2.8
Total 561.6 1,007.1 1,287.1 100.0 100.0 100.0
Debt
Primary home 24.3 48.9 78.4 61.0 61.5 62.5
Other property 10.2 25.9 38.0 25.8 32.5 30.3
Business 4.2 3.1 6.4 10.5 3.9 5.1
Credit card 0.8 1.2 1.9 2.0 1.5 1.5
Other 0.3 0.5 0.6 0.6 0.6 0.5
Total 39.7 79.5 125.3 100.0 100.0 100.0
Population (‘000s) 6,833.7 7,078.8 7,663.3
Source: Authors’ own calculations from the 2002, 2006 and 2010 HILDA Survey

60
Figure 5: House price index, Australian capital cities, March 2002 to September 2012 a
Note:
a. The price indexes are for established houses, and calculated on an index reference period of 2003–04 = 100 for each of the eight capital cities.
Source: House price index from ABS 2012a
Our older Australians grouping ranges from those in middle age through to the very
elderly. It seems that the prominence of the primary home in wealth portfolios is at its
greatest among those who are likely to have retired (see Table 7). In 2010, the
primary home accounted for 50 per cent of the total assets held by those aged 65
years and over, compared to 46 per cent (42%) among those aged 45–54 years (55–
64 years) in the same year.
On the other hand, the share of superannuation is lowest in the oldest age group,
accounting for only 16 per cent of their total assets compared to between 20–25 per
cent of the total assets of those aged 45–64 years. Most of the prime income-earning
years of those aged over 65 years in 2010 would have preceded the introduction of
the compulsory superannuation guarantee in 1992. Hence, the oldest age group have
had significantly less opportunity to benefit from introduction of the compulsory
superannuation guarantee. As a result of these differences in savings patterns, wealth
Sydney
Melbourne
Brisbane
Adelaide
Perth
Hobart
Darwin
Canberra
50
70
90
110
130
150
170
190
210
230
250Jun-2
002
Dec-2
002
Jun-2
003
Dec-2
003
Jun-2
004
Dec-2
004
Jun-2
005
Dec-2
005
Jun-2
006
Dec-2
006
Jun-2
007
Dec-2
007
Jun-2
008
Dec-2
008
Jun-2
009
Dec-2
009
Jun-2
010
Dec-2
010
Jun-2
011
Dec-2
011
Jun-2
012
Quarter
House price index

61
portfolios become less diversified in the older age groups. The Herfindahl index can
be used to measure whether wealth portfolios are diversified or concentrated on one
or two assets. It is calculated as the sum of the squared values of each asset’s share
in total wealth portfolios, and has a range between 0 and 1, with lower values
indicating a more diversified wealth accumulation strategy. It takes on an average
value of 0.657 for those aged over 65 years. In comparison, the mean Herfindahl
index for those aged 55–64 years (45–54 years) is 0.554 (0.549). The highest index
value for the oldest age group reflects the higher concentration of housing in their
asset portfolios and suggests that the oldest age group are at greatest risk of
disruption to economic wellbeing on exposure to housing market volatility.
On a more reassuring note, the average real value of primary home debt is
significantly lower among those aged 65 years and over, at $9000. In comparison, the
primary home debt carried by the 45–54 year age group is 16 times the debt carried
by those aged 65 years and over. This is to be expected as those aged 65 years and
over would have had more time to repay mortgage debt.
The life cycle patterns observed in 2010 are replicated in earlier years. Hence,
estimates from 2002 and 2006 are not reported in this section, but have been
relegated to Table A2 in the appendix.
Table 7: Asset and debts of older Australians, by age band, 2010
Mean income unit asset and debt, 2002 price level,
in $’000s
Composition of income unit asset and debt, per cent
(calculated based on means)
45–54 years
55–64 years
65+ years
45–54 years
55–64 years
65+ years
Asset
Primary home 568.5 653.8 542.7 45.6 41.9 50.0
Other property 235.8 238.4 129.3 18.9 15.3 11.9
Superannuation 250.2 385 171.6 20.1 24.7 15.8
Business 43 61.9 15.7 3.5 4 1.4
Savings and investments 108.7 180.8 199.5 8.7 11.6 18.4
Other 40 40.9 26.1 3.2 2.6 2.4
Total 1,246.2 1,560.8 1,084.9 100.0 100.0 100.0
Debt
Primary home 142.8 79.8 9.0 64.4 63.0 40.3
Other property 67.5 35.4 9.3 30.4 27.9 41.6
Business 6.9 9.1 3.6 3.1 7.2 16.0
Credit card 3.4 1.9 0.4 1.5 1.5 2.0
Other 1.3 0.4 0.0 0.6 0.3 0.2
Total 221.8 126.6 22.4 100.0 100.0 100.0
Population (‘000s) 2,739.7 2,327.2 2,596.5
Source: Authors’ own calculations from the 2002, 2006 and 2010 HILDA Survey
There is another demographic dimension to the asset and debt profile of older
Australians that is particularly noteworthy. Women have longer life expectancies than

62
men, are more likely to experience interrupted careers during child-bearing and child-
rearing years, less inclined than men to re-marry following a marital breakdown and
more likely to have been adversely affected by their inability to access superannuation
accumulations on divorce prior to a regulatory change in 2001 (Jefferson & Preston
2005; Sheehan 2002). The interaction of these factors causes women to be more
vulnerable to economic shocks as they age. Indeed, as Table 8 shows, single older
women are more exposed to property risk, and have lower levels of superannuation
and liquid assets than do single older men. Indeed, the asset and debt composition of
single older men mirror that of partnered older persons. It is single older women, who
stand out, having almost two-thirds of their total assets, and three-quarters of their
total debt, tied up in the primary home. While the tables here do not present further
breakdowns by age, we can report that reliance on the primary home as one’s main
form of asset is greatest among women who are single and aged 65 years and over.
The numbers in this group will grow; women are disproportionately represented within
the older population, comprising two-thirds of those aged over 85 years (Sharp &
Austen 2007).
Once again, 2010 differences in patterns across income unit types are replicated in
earlier years. Hence, estimates from 2002 and 2006 are not reported in this section,
but have been relegated to Table A3 in the appendix.
Table 8: Asset and debts of older Australians, by income unit type, 2010 a
Mean income unit asset and debt, 2002 price level, in
$’000s
Composition of income unit asset and debt, per cent
(calculated based on means)
Single men
Single women
Partnered persons
a Single men
Single women
Partnered persons
a
Asset
Primary home 284.6 359.9 681.1 49.5 62.2 43.9
Other property 69.0 63.7 251.0 12.0 11.0 16.2
Superannuation 108.2 71.7 331.3 18.8 12.4 21.3
Business 0.2 0.0 54.3 0.0 0.0 3.5
Savings and investments 94.4 72.9 191.4 16.4 12.6 12.3
Other 18.5 10.9 43.7 3.2 1.9 2.8
Total 574.9 579.1 1,552.8 100.0 100.0 100.0
Debt
Primary home 32.9 29.5 96.2 64.0 74.1 61.8
Other property 14.5 8.5 48.2 28.2 21.3 30.9
Business 2.0 0.0 8.5 3.9 0.1 5.5
Credit card 1.5 1.2 2.2 2.9 2.9 1.4
Other 0.5 0.6 0.6 0.9 1.6 0.4
Total 51.4 39.8 155.7 100.0 100.0 100.0
Population (‘000s) 809.9 1,277.0 7,659.7
Note:
a. Due to the income unit asset and debt measurement method applied in this chapter, a man and a woman belonging to the same income unit will have the same asset and debt levels. Hence, partnered men and women have similar levels of wealth and are grouped into one category.
Source: Authors’ own calculations from the 2002, 2006 and 2010 HILDA Survey

63
Snapshots of the asset and debt profiles of older Australians over the years 2002,
2006 and 2010 highlight a key and unchanging theme; the primary home, and
property in general, remain the dominant form of wealth accumulation in later life. The
resilience of Australian housing markets contrasts sharply with the weakness evident
in world sharemarkets, and this helps explain superannuation’s stagnant share of
older Australians wealth portfolios. The primary home and other property perform an
increasingly important role, both as a store of wealth in asset accumulation strategies
and as collateral against which debt can be secured.
4.3 The mortgage debt of older homeowners
We have shown that debt secured against property (the primary home and other
property) has climbed among all older Australians (owners and renters). In this section
we narrow our focus to older homeowners. Owner-occupied housing’s importance as
a pillar supporting retirement incomes policy, and as a buffer stock of wealth in the
event of emergencies in old age, could be threatened if growing numbers are
approaching retirement age as mortgagors with increasing levels of indebtedness.
We first address this issue by invoking repeated cross-sectional data from the ABS’s
Income and Housing surveys that span almost three decades from 1982 through to
2009.62 The use of long-run data allows us to observe changes in borrowing
behaviour among successive homeowner cohorts over a period when financial
markets underwent significant changes. Financial deregulation was well underway
from the 1980s. Massive increases in lending and borrowing activities were witnessed
in the 1990s and early 2000s when house prices increased rapidly. However, by the
latter part of the decade, financial markets had crashed as a result of the GFC. Were
owner-occupiers in the 1990s and early 2000s emboldened to take on larger
mortgage debts against their homes, their confidence buoyed by booming housing
markets during this era of deregulation? And did we witness a return to prudent
borrowing behaviour among more recent homeowner cohorts in the post-GFC era?
The use of long-run data also allows us to make more decisive judgements about
whether any increase in mortgage indebtedness is an unusual phenomenon in the
context of historical trends.
Figure 6 presents some striking trends for each of five age groups ranging from 25–
34 years to 65 years and over. With the exception of those aged 65 years and over,
whose debts remain low, mortgage indebtedness rose significantly among all other
age groups between 1982 and 2009. Among those of pre-retirement age, the rise in
mortgage indebtedness coincided with the start of the house price boom in the mid-
1990s. Between 1996 and 2009, the proportion of 35–64-year-old homeowners with a
mortgage debt climbed by over 20 percentage points. Even during the post-GFC
phase (2007–09), mortgage indebtedness continued to climb, albeit at a slower rate
than during the period of rapidly rising house prices (2002–07). Parkinson et al. (2009)
show that in both Australia and Great Britain large numbers of young and middle aged
owners (particularly couples with children) used flexible mortgage products to tap into
housing wealth. Part of this increase in the number of 35–64-year-old mortgagors is
likely due to the growing incidence of mortgage equity withdrawal. The bar chart in
Figure 7 compares the loan-value ratios of mortgagors in each of the same five age
62
A similar exercise was conducted in Wood and Ong (2012), over a slightly shorter timeframe of 1982–2007 and using the household as the unit of analysis. The analysis presented in this report uses the individual as the unit of analysis in keeping with the unit of measurement used in the rest of this report. Despite differences in the unit of analysis, the trends in this report are similar to those reported in Wood and Ong (2012), and the extension of the timeframe in the present analysis allows us to observe trends in the post-GFC era not captured in Wood and Ong (2012).

64
bands (25–34 years to 65 years and over). With the exception of the post-retirement
age group there is a rise in gearing; the increase in the youngest age band (25–34) is
as much as 20 percentage points. Even those approaching retirement age (55–64
years) are gearing up with LVRs rising from 22 per cent to 28 per cent, an increase of
six percentage points. These two figures reveal some important long run trends; more
Australian homeowners are securing debt against property later in their lives, and are
increasingly inclined to secure debt against their housing wealth.
Curiously, persons 65 years and above are defying these long run trends. A much
more conservative borrowing profile is apparent; the proportion with outstanding
mortgage debt has remained very low (below 10%) over the nearly 30-year timeframe,
and in 2009 remained much the same as it was in 1990. Even those with a mortgage
showed no inclination to gear up against their housing wealth. But how has their
indebtedness remained low when pre-retirement age groups are becoming more
indebted? A potentially important explanation is the use of lump sum superannuation
to pay off mortgages on retirement; if true the divergent patterns in Figures 6 and 7
could well reflect the use of mortgages to tap into superannuation balances before
retirement.
While not graphically illustrated here, it is also worth highlighting that though partnered
persons and single men are more likely to have a mortgage debt against their primary
home than single women, the incidence of mortgage indebtedness has risen the most
among single older women, by 11 percentage points, from 24 per cent to 35 per
cent.63
Figure 6: Percentage of homeowners with a mortgage debt, 1982–2009
Source: 1982, 1990, 1996, 2002, 2007 and 2009 surveys of income and housing from the ABS
63
The incidence of mortgage indebtedness among single men (partnered persons) rose from 41 per cent to 46 per cent (52% to 58%) between 1982 and 2009.
25-34 yrs
35-44 yrs
45-54 yrs
55-64 yrs
65+ yrs
0%
10%
20%
30%
40%
50%
60%
70%
80%
90%
100%
1982 1990 1996 2000 2002 2007 2009 Year
% of home owners with a mortgage debt

65
Figure 7: Mean LVR of homeowners with a mortgage debt, 1990–2009 a
Note:
a. It is not possible to calculate LVRs for 1982 due to the absence of house value and mortgage debt data in the 1982 survey.
Source: 1990 and 2009 surveys of income and housing from the ABS
Having charted long-run trends using the ABS Surveys of Income and Housing, we
now return to our repeated cross sectional analysis of comparatively shorter run
HILDA Survey data (covering the years 2001–10). We are able to use debt and house
value variables for homeowners in every year during the 2001–10 timeframe, thereby
enabling a year-by-year analysis of borrowing behaviour. This presents an excellent
opportunity to test the proposition that debt levels continued to rise post-GFC. Figure
8 suggests that the share of homeowners with a mortgage continued to climb post-
GFC among those aged 45 years and over; but among younger homeowners the
share did in fact stabilise post-GFC. The average LVR estimates in Figure 9 suggest
that in recent years older mortgagors 55 years and over have curbed their borrowing,
though LVRs still remain slightly higher than in 2006. However, younger mortgagors
continue to gear up against housing wealth, and this is particularly evident among the
age cohort 45–54 years.
0%
10%
20%
30%
40%
50%
60%
70%
25-34 yrs 35-44 yrs 45-54 yrs 55-64 yrs 65+ yrs
41%
32%
25%22%
14%
61%
45%
34%
28%
15%
Mean LVR of home owners with a mortgage debt
1990 2009

66
Figure 8: Percentage of homeowners with a mortgage debt, 2001–10
Source: Authors’ own calculations from the 2001–10 HILDA Survey
Figure 9: Mean LVR of homeowners with a mortgage debt, 2001–10
Source: Authors’ own calculations from the 2001–10 HILDA Survey
25-34 yrs
35-44 yrs
45-54 yrs
55-64 yrs
65+ yrs
0%
10%
20%
30%
40%
50%
60%
70%
80%
90%
100%
2001 2002 2003 2004 2005 2006 2007 2008 2009 2010 Year
% of home owners with a mortgage debt
25-34 yrs
35-44 yrs
45-54 yrs
55-64 yrs
65+ yrs
0%
10%
20%
30%
40%
50%
60%
70%
2001 2002 2003 2004 2005 2006 2007 2008 2009 2010 Year
Mean LVR of home owners with a mortgage debt

67
Table 9 analyses the incidence of MEW by the same five homeowner age groups in
each year from 2002–2010. It confirms that regardless of year, and hence
independent of house price trends, younger homeowners are more inclined to MEW.
In the two youngest age groups (25–34 years; 35–44 years) between one-quarter and
one-third of homeowners added to their existing mortgages in any one year. The very
low incidence estimates for the oldest age band (65 years and over) confirm their
conservative attitude and reluctance to add to borrowings in order to meet everyday
spending needs. Use of MEW is highest among the groups that have become most
indebted (see Figures 8 and 9). The trends over the decade are mixed. In the early
years of the new millennium when house prices were booming the two youngest age
groups seemed more disposed to MEW, but in the post-GFC years their enthusiasm
for MEW cooled (or increasing numbers found that borrowing constraints were
binding). On the other hand our oldest two groups of owners continued to MEW more
frequently even though house price growth had slowed post-GFC. It is possible that
the over-55-year-old groups were more exposed to risks in the post GFC era, and
were therefore forced to unlock housing wealth more often to meet emergencies. But
this is speculation; further research is required here before anything more definitive
can be added.64
Table 9: Incidence of MEW among homeowners, by age band, 2001–10, per cent
Year 25–34 yrs 35–44 yrs 45–54 yrs 55–64 yrs 65+ yrs
% of homeowners who engaged in MEW
2001–02 26.5 26.0 18.4 8.3 2.0
2002–03 33.3 30.3 24.9 10.5 3.8
2003–04 34.0 27.3 23.1 9.9 1.5
2004–05 34.0 33.2 25.8 12.7 3.7
2005–06 30.7 32.2 23.0 10.1 3.0
2006–07 28.8 33.7 28.8 14.3 2.5
2007–08 30.1 30.2 23.4 13.6 3.8
2008–09 29.6 27.3 22.4 15.1 3.1
2009–10 24.7 27.1 24.3 16.0 4.0
% point change in the incidence of MEW
2001–02 to 2006–07 (boom period)
2.3 7.7 10.4 6.0 0.6
2007–08 to 2009–10 (post-GFC) -5.4 -3.1 0.8 2.4 0.2
2001–02 to 2009–10 -1.9 1.1 5.9 7.7 2.0
Source: Authors’ own calculations from the 2001–10 HILDA Survey
4.4 How do asset and debt portfolios change as ageing occurs?
The panel nature of the HILDA Survey allows us to introduce a longitudinal aspect into
the analysis, and to profile changes in the asset and debt portfolios of a panel of
Australians as they age and transition into their retirement years. To conduct such
analyses we use a balanced sample design as described in Section 4.1. The profiles
6464
These hypotheses will be tested empirically in the Final Report of this project.

68
offer interesting insights into decisions about wealth accumulation in later life.65 For
example, at what point in the life course does wealth accumulation slow and/or asset
divestment become evident as predicted by life cycle theories of saving and
consumption? What happens to the portfolio composition of older Australians as they
age? Does their wealth become more and more concentrated in housing assets,
exposing them to greater house price risk as they age?
Finally, for older Australians, a critical decision during their retirement transition years
occurs when they reach their superannuation preservation age.66 We have
established that debt burdens are largely accounted for by mortgages secured against
the primary home (Section 4.3), and that an increasing number and share of
homeowners are entering their middle and later years with mortgages that have still to
be paid off. The question therefore arises as to whether older homeowners draw down
on their superannuation reserves in order to pay off their mortgage debt once they
reach their superannuation preservation age. The answer has important ramifications
for retirement incomes policy in Australia. In an era of fiscal austerity, homeowners
are increasingly encouraged both explicitly and implicitly by government to rely on
their housing assets as a base for welfare. There are others who may be drawing
down on their housing equity to fund retirement lifestyles over and above basic needs.
Regardless of motive, we have noted in Section 4.3 the growing tendency to use
MEW to channel funds from housing equity to consumption and the associated
increased indebtedness among those approaching retirement. If superannuation
funds are being used to pay off housing debts post-retirement, then growing numbers
of older Australian homeowners will have to rely on government income support as
their main source of retirement funding. If this behavioural pattern is emerging, then
government budgets will come under increasing pressure, as the pool of ageing
Australians in need of income support will undoubtedly grow.
4.4.1 Change in portfolio composition as ageing occurs
Table 10 tracks changes in the composition of asset and debt portfolios as three birth
cohorts grow older over the period 2002 to 2010. The three birth cohorts are all drawn
from Australians aged 45 years and older in 2002; the youngest (baby boomers)
cohort was born between 1948 and 1957 and is between 45 and 54 years of age in
2002. This birth cohort will still be ineligible for the age pension in 2010, and we would
expect most in this age group to remain active in the labour force.67 The intermediate
birth cohort was born between 1938 and 1947 (‘war babies’) and is between 55 and
64 years of age in 2002. Most of this war baby cohort will retire from the labour force
by 2010.68 Finally our oldest birth cohort were all born before 1938 (pre-war) and is 65
years or older in 2002. The majority of the pre-war cohort has already retired by
2002.69
All birth cohorts increasingly tie up their wealth in residential property (primary home
and other property) as they age. Liquid financial assets (bank deposits, shares, bonds
and so on) become less important as a store of wealth for all cohorts (other than the
baby boomers), while all three reduce their reliance on business assets. Progression
to later stages of the life cycle also has similar effects on debt. Ageing seems to
encourage all three birth cohorts to secure a rising share of total debt against
65
Note, however, that changes in stocks on assets will reflect changes in the value of assets as asset prices rise or fall, as well as behaviour with respect to saving and portfolio balance. When asset prices are particularly volatile, valuation effects will dominate. 66
This is the age at which one is allowed to withdraw funds from superannuation balances. 67
89 per cent of baby boomers had not yet retired in 2010. 68
72 per cent of the ‘war babies’ had retired by 2010. 69
86 per cent of the pre-war cohort had retired by 2002.

69
residential property (primary home and other property), though this trend is stronger
among the pre-war and war baby cohorts. There is a fall in the share of business and
other debt as each cohort grows older, but again this is stronger among pre-war and
war baby cohorts. In short, as each of our cohorts age residential property becomes
an increasingly prominent asset in wealth portfolios and as collateral securing debt.
The share of assets and debts in the portfolios of the baby boomers showed little
variation between 2002 and 2010. This is hardly surprising; this is a phase in the life
course when many in this age group are still in the labour force and decision-making
surrounding the use of assets in retirement is still some way off for significant
numbers who started 2002 in their 40s.
However, larger shifts in the share of selected asset and debt groups are noticeable
among the war babies. The majority of those aged 55–64 years old in 2002 are in
their 60s and early 70s in 2010. The share of the primary home, and indeed all forms
of property assets, grow in importance, while financial assets and debts held in
business, savings and investments shrink in importance. This is a phase in the life
cycle when retirement is a common occurrence. One-third of the war babies made a
transition into retirement between 2002 and 2010, and the decline in importance of
business and financial assets reflect this transition.
The importance of the primary home becomes more evident as the pre-war cohort
entered their 70s and beyond between 2002 and 2010. Primary home debt increases
its share by a significant 27 percentage points, while financial debts decline in
importance. Other property debt, too, becomes less important, possibly an indication
of the decline in benefits associated with negative gearing as taxable income from
earnings drops in old age.
Table 10: Percentage point change in share of key assets and debts in older
Australians’ portfolios between 2002 and 2010, by age band in 2002
% point change in share of assets and debts
Baby boomers
45–54 yrs in 2002
53–62 yrs in 2010
War babies
55–64 yrs in 2002
63–72 yrs in 2010
Pre-war cohort 65+ yrs in 2002
73+ yrs in 2010
Primary home -1.8 4.0 7.0
Other property 3.3 3.0 1.6
Superannuation 0.7 1.4 -4.3
Business -1.2 -3.7 -0.8
Savings/investments 0.3 -2.9 -2.3
Other -1.3 -1.8 -1.1
Debt
Primary home 0.3 -5.9 27.4
Other property 2.5 14.9 -9.9
Business -2.8 -8.3 -10.7
Credit card 0.2 -0.2 -2.7
Other -0.3 -0.5 -4.1
Source: Authors’ own calculations from the 2002, 2006 and 2010 HILDA Survey.

70
4.4.2 Are older Australians drawing down their superannuation wealth to pay off mortgage debts in retirement?
For older Australians, a critical point during their retirement transition years is reaching
their superannuation preservation age (the age when superannuation balances can
be accessed). The superannuation preservation age varies according to date of birth.
Those born after 1 July 1964 (or aged under 38 years in 2002) cannot access their
superannuation wealth before turning 60 years of age. On the other hand, those born
before 1 July 1960 (or aged 42 years and over during 2002) have a lower
superannuation preservation age of 55 years.70
Our repeated cross section analysis led us to suspect that superannuation balances
are being used by mortgagors to pay off outstanding mortgage debt. In this section we
examine this hypothesis by designing a sample of older Australian mortgagors in 2002
(when the first wealth module is available), that retired between 2002 and 2003 and
therefore became eligible to access their superannuation in 2003. Our sample
therefore includes mortgagors aged at least 54 years old in 2002, and at least 55
years of age in 2003, and retired. By comparing their superannuation wealth levels in
2002 and in the next wealth module in 2006, we can observe whether these
mortgagors have drawn down their superannuation reserves since retiring in 2003. By
comparing their primary home debt levels over the same period, we can also observe
whether they have paid off some or all of their mortgage debt since retiring. The
exercise is repeated using mortgagors aged at least 54 years old in 2006, who
reached at least 55 years of age in 2007, and had retired between 2006 and 2007.
Comparisons are again made between superannuation and primary home debt levels
in 2006 and 2010. The two samples are pooled and results reported in Table 11
below.
The mean and median values in Table 11 offer weak support for the hypothesis that
older mortgagors are drawing down superannuation balances to reduce mortgage
debt. This select sample unlocks wealth tied up in superannuation and businesses;
the latter appears to be used to pay off business debts.71 Reductions in
superannuation are correlated with falls in debt secured against the primary home, but
the dynamics are complicated by a sharp rise in other property investments and debt
secured against other property. Perhaps some retirees are making a calculated
decision to rebalance portfolios in favour of residential property. The small sample
size of 33 persons is an important caveat.
The HILDA Survey offers another relevant research opportunity because it asks
respondents in every wave whether they took out superannuation as a lump sum in
the last financial year, and if so, the value of that lump sum. Pooling together all the
available waves of the HILDA Survey, we selected those older homeowners with a
mortgage at t reporting that they made lump sum superannuation withdrawals
between t-1 and t. The number of superannuation withdrawals across the 10 waves
remains small at 37, though when population weights are applied, the number
amounts to 47 800 lump sum superannuation withdrawals over the 10 years.
We find that between t and t-1, the mean (median) superannuation lump sum
withdrawal was $206 600 ($146 000). Interestingly, those who withdrew
superannuation as a lump sum between t-1 and t were much more likely to have
reduced mortgage debt over the same period than those older mortgagors who did
not withdraw superannuation as a lump sum. Indeed, half of the former group
70
The preservation age steadily increases in increments of one year for those born between 1960 and 1964. 71
The decline in mean business assets almost exactly offsets a decline in mean business debts.

71
managed to reduce their mortgage debt to zero by t (compared to only 17% of the
latter). Furthermore, among those who withdrew superannuation as a lump sum and
reduced mortgage debt concurrently, the mean (median) amount of debt reduction
was $109 800 ($68 000), noticeably higher than the amount of mortgage debt
reduction among those who reduced mortgage debt without dipping into their
superannuation funds.
Reductions in superannuation are also correlated with sharp increases in other
property investments. When we compare changes in other property investments
made by those who made lump sum superannuation withdrawals during 2002–06 and
2006–10 versus those who did not, we find that 24.3 per cent among those who did
make lump sum superannuation withdrawals between 2002 and 2006 had increased
the real values of their other property investment as well. In comparison, a lower
proportion (20.3%) of those who did not make lump sum withdrawals had increased
their other property investment. The disparity between those who made lump sum
superannuation withdrawals and those who did not widens even further when we
compare the years 2006 and 2010. In those years, 38.4 per cent of those who cashed
in lump sums from superannuation balances increased their other property portfolios
between 2006 and 2010. In comparison, only 19 per cent of those not making lump
sum withdrawals had increased their other property investment.72 The additional
estimates support our speculation that some retirees may be making a calculated
decision to rebalance portfolios in favour of residential property. Over the period 2006
and 2010, returns on superannuation funds were adversely affected by the GFC. It
would appear that investors are even more likely to shift wealth away from
superannuation while favouring increased holdings of housing during periods of
economic uncertainty.
72
The estimates are provided over four-year periods because data on the values of other property are only available in the wealth modules from 2002, 2006 and 2010. Seventy-six (42) older Australians, regardless of tenure of mortgage debt status, made lump sum withdrawals between 2002 and 2006 (2006 and 2010).

72
Table 11: Change in real value of assets and debts of older homeowners before and
after becoming eligible to access their superannuation wealth between wave t and t+4,
$’000s
Means Medians
Real value at
t Real value
at t+4
Change in real value between t and t+4
Real value at
t
Real value at t+4
Change in real value between t and t+4
Asset
Primary home 520.7 909.9 389.2 391.5 624.9 233.4
Other property 340.0 507.7 167.7 167.7 335.4 167.7
Superannuation 369.7 360.0 -9.8 279.5 212.5 -67.0
Business 18.6 13.0 -5.6 0.0 0.0 0.0
Savings and investments
93.9 103.3 9.4
23.8 21.5 -2.3
Other 27.1 31.7 4.5 22.4 25.0 2.6
Total 1,370.0 1,925.4 555.5 1,292.8 1,886.0 593.2
Debt
Primary home 189.3 100.5 -88.7 165.0 0.0 -165.0
Other property 10.0 94.7 84.7 0.0 0.0 0.0
Business 5.7 0.0 -5.7 0.0 0.0 0.0
Credit card 2.5 2.8 0.3 0.0 0.0 0.0
Other 1.1 0.7 -0.5 0.0 0.0 0.0
Total 208.5 198.7 -9.9 194.5 44.7 -149.8
Sample 33
Population (‘000s) 41.8
Source: Authors’ own calculations from the 2002, 2006 and 2010 HILDA Survey

73
Table 12: Change in mortgage debt and superannuation lump sum withdrawal between
t-1 and t, homeowners with a mortgage at time t-1
Change in mortgage debt and superannuation
Withdrew superannuation lump sum between t-1 and t
Did not withdraw superannuation lump sum between t-1 and t
Superannuation lump sum withdrawal amount ($’000s)
Mean 206.6 n.a.
Median 146.0 n.a.
% who reduced mortgage debt between t-1 and t
84.9 58.1
Change in mortgage debt (among those who reduced mortgage debt between t-1 and t)
Mean 109.8 71.9
Median 68.0 20.0
% who became outright owners between t-1 and t
50.0 17.1
Sample 37 14,447
Population (‘000s) 47.8 19,014.8
Source: Authors’ own calculations from the 2001–10 HILDA Survey
4.5 Summary
To sum up this descriptive work, we emphasise some key preliminary findings.
Firstly, housing wealth is the most important store of wealth for Australia’s ageing
population. It also performs an important role as collateral against which debt can be
secured. Its importance is especially pronounced in the asset and debt portfolios of
those aged 65 years and over as well as single older women, two groups that have
noticeably undiversified portfolios relative to the rest of the older population.
Mortgage indebtedness has clearly risen over the long-run for most age groups.
Between 1996 and 2009, the proportion of homeowners with a mortgage debt climbed
by over 20 percentage points among those aged 35–64 years old. Interestingly, even
during the post-GFC phase (2007–09), mortgage indebtedness continued to climb,
albeit at a slower rate than when house prices were peaking over the boom period.
Preliminary estimates suggest a growing appetite for MEW among older Australians,
especially those aged 45–64 years, over the period 2001–10.
There are hints of an emerging pattern of behaviour; as growing numbers of older
Australians enter retirement with non-negligible amounts of mortgage debt, some
40 600 (or 84.9% of all lump sum superannuation withdrawals by older homeowners
with a mortgage) may have been used to pay down mortgage debt during the period
2001–10.
These findings have some noteworthy preliminary policy ramifications in an era in
which reliance on one’s own housing assets is increasingly nurtured through
government reforms and the continued proliferation of financial products which
facilitate the release of housing equity for consumption purposes in later life. We tease
out these potential policy implications in the concluding chapter.

74
5 CONCLUDING COMMENTS AND FUTURE RESEARCH DIRECTIONS
This Positioning Paper presents background material that will inform this project that
aims to uncover the uses, financial costs and risks of HEW by older Australians. In
particular, the Positioning Paper has:
Described the policy context of this project.
Developed a typology that provides the framework for systematically describing and comparing various HEW mechanisms.
Conducted an international literature review that has highlighted how institutional settings and the generosity of public pension systems can influence decisions to HEW in mid-to-late life.
Presented a descriptive analysis that assesses the importance of housing assets and debts within the portfolios of Australia’s ageing population, and the extent to which HEW weakens the effectiveness of housing wealth as a pillar within Australia’s retirement income system.
In Section 5.1, we will draw together the key themes that have emerged from the
preceding chapters. We conclude in Section 5.2 with an outline of the methodology
we propose to implement in the next stage of this project.
5.1 Concluding comments
The research reported in this Positioning Paper has uncovered three key features of
HEW by older homeowners in Australia.
First, wealth stored in the primary home remains the most dominant asset in the
portfolios of most older persons in Australia. The GFC has not reversed the housing
bias in portfolios. Older single women and all those aged over 65 years are
particularly reliant on housing assets. Their wealth is concentrated in the primary
home and superannuation balances are relatively low. Nevertheless, the over-65s are
reluctant to dip into housing wealth to help maintain living standards in old age.
Second, Australia’s institutional settings appear to be more conducive for HEW than in
other countries. It has an extremely well-developed mortgage market that was not
significantly affected by the GFC, and its relatively large private rental sector make
selling up and renting a more realistic option than in countries with smaller private
rental markets (e.g. the UK). Furthermore, the significant house price appreciation
experienced in Australia over the last few decades as well as the exemption of the
primary home from CGT have fuelled incentives to cash out capital gains. The new
mortgage products that have emerged since financial system deregulation have also
helped by transforming housing wealth into a liquid asset such that borrowers can
draw down their housing equity as and when they choose. For working age Australian
homeowners there is now convincing evidence that HEW is being used to fund
everyday consumption needs. There is a contrast here with homeowners that have
already reached retirement age, who appear to view housing wealth as precautionary
savings that are only rolled out in extreme circumstances. The literature suggests that
this reluctance is also evident among retired homeowners in countries such as the
Netherlands, Finland and Germany.
This leads us to the third key finding, which relates to the implications of HEW for the
robustness of housing wealth as an asset base in old age. Government policies (e.g.
tax expenditures and concessionary asset tests) that encourage accumulation of
wealth in the primary home are a cornerstone of Australian social policy. These

75
policies are prefaced on the assumption that homeowners will own their homes
outright in old age, hence lower incomes in retirement will be matched by low housing
costs, and retirees can therefore get by on smaller pensions (Castles 1998; Baxter &
McDonald 2005). However, homeowners that use HEW to meet spending needs
earlier in their life cycle will eat into housing wealth. The statistical analysis reported in
Chapter 4 confirmed that more and more older Australians are approaching retirement
with outstanding mortgage debt, a trend that (on early indications) has not been
reversed by the GFC. The analysis further suggests that some may be paying off their
mortgage debt using lump sum superannuation payouts that become accessible on
reaching the preservation age. Those who do not will presumably continue making
regular mortgage repayments after they retire. While this might constitute a rational
decision on the part of homeowners with mortgages to pay down their mortgage debt
with their superannuation upon entering retirement, there is no doubt that such moves
will result in increasing pressure on the age pension system, as superannuation funds
and pensions are drained to repay mortgage debts that are still outstanding as
retirement approaches. Since the 1990s housing’s role as a pillar supporting
retirement incomes policy has weakened as baby boomers use their housing wealth
to bring forward superannuation balances and smooth consumption during their
working lives.
There are two other important trends that have relevance. Wood and Ong (2012)
argue that the edges of home ownership are now more fluid as growing numbers of
Australians churn back and forth between owning and renting, or even permanently
fall off the ‘home ownership ladder’. First transitions into ownership are no longer the
secure foothold they once were, and this is particularly evident among the casualties
of relationship breakdown. Those on the edges of home ownership confront a
particularly uncertain future housing career that threatens their security in retirement.
Moreover, the fact that MEW has become quite routine among working age Australian
homeowners in the new millennium was clearly fuelled by soaring house prices in the
period 1996–2007; high real house prices were sustained in the post-GFC period and
it seems that homeowners in their middle years have continued to use MEW. Indeed
the incidence has risen in the post-GFC period among the 45–64 year age group. But
there is a tension here that may undermine MEW for younger Australians. High real
house prices impede access to home ownership and higher debt stress means that
more and more Australians are losing home ownership status. There are then
polarising trends; those Australian homeowners that succeed in securing that status
throughout the life course can take advantage of the fungible housing wealth that is
inflated by rising real house prices. On the other hand, there are increasing numbers
of Australians that are unable to fall back on housing wealth as a welfare resource.
5.2 Future research directions
The research reported in this Positioning Paper has provided important material to
inform the key research aim of this project. To recap, this project aims to uncover the
uses, financial costs and risks of HEW via alternative mechanisms by older
Australians. It seeks to make a policy contribution by providing a comprehensive
evidence base for policies and programs aimed at maximising the availability and
quality of information to support Australians in their decision-making about housing
equity in later life.
The next stage of the project will build on the preliminary evidence in this Positioning
Paper by directly addressing the project’s key research questions via a mixed
methods framework. It will use a web of inter-related methodologies to triangulate
findings.

76
5.2.1 Research question 1: To what extent are older Australians tapping into their housing equity via alternative mechanisms, and what are they using HEW for?
Statistical analysis of national data will be carried out to address the project’s first key
research question. We will continue to tap into the nationally representative and
longitudinal HILDA Survey to identify the prevalence of three key HEW mechanisms
used by older Australians, that is in situ MEW, trading on, and selling up to move into
rental housing.
We are mindful (see Section 4.1) that the needs of older Australians will change as
they age and it is therefore sensible to make a distinction between different age
groups. Specifically, we will exploit expenditure data in the 2005–10 HILDA Survey to
analyse the likely uses of HEW in later life by measuring associations between
expenditure patterns and alternative HEW mechanisms over the life course.73 Such
analysis will offer insights into whether HEW is increasingly used as a financial buffer
by older persons as they transition into retirement, and then experience increasing
physical frailty in retirement. In our study, the Productivity Commission’s (2011) Aged
Care Equity Release scheme is of particular interest here, as its recommendations
encourage reliance on housing as an asset base for welfare. The report considers the
use of housing wealth to fund aged care needs. Hence, scenario modelling will be
conducted to estimate the amount and share of equity among the elderly that will
likely have to be diverted towards aged care costs in order to sufficiently fund their
aged care needs in old age. The feasibility of this scheme will be assessed, as judged
by whether it leaves elderly homeowners with levels of housing equity sufficient to
meet bequest motives and other needs (e.g. funeral expenses).74
5.2.2 Research question 2: What are the costs and risks of using HEW in later life, and how do these vary across the older population according to socio-economic groups and across scenarios relating to tax-benefit settings and asset price changes?
The research reported in this Positioning Paper has already partially addressed the
project’s second research question by reviewing the costs and risks associated with
key forms of HEW in later life within a range of institutional settings. We will further
address this research question by invoking empirical analysis to estimate the risks
and costs of alternative forms of HEW in later life in Australia.
This Positioning Paper has already identified the primary forms of risks attached to
HEW as being house price risk, interest rate risk and negative equity risk. The next
stage of the project will model the extent to which older homeowners are exposed to
these three forms of risk using data from the 2001–10 HILDA Survey. The timeframe
of the HILDA Survey offers a valuable opportunity to investigate how exposure to
these risks vary under changing boom and bust conditions, as proxied by the earlier
and later years of the last decade respectively. Our empirical estimates will offer
indications of the impact of housing market volatility on the gains from HEW by
comparing the levels of equity withdrawn by older homeowners during a housing
market slump as compared to those who withdrew equity during a house price boom
in the last decade. The empirical analysis will also shed light on whether in situ MEW
73
As in situ MEW is expected to be the main form of HEW in later life, we will also seek to supplement the HILDA data estimates by drawing information from the 2007–08 Survey of Income and Housing Survey (SIH) and the 2003–04 Household Expenditure Survey (HES), which contain direct questions on uses of loans secured against the primary home. 74
Previous work by Ong (2010) identified that most older Australians engaging in MEW wish to retain at
least 50 per cent of their housing equity at the end of their loan.

77
has eaten into housing equity such that older Australians are increasingly prone to
interest risk and negative equity risk in later life.75
In relation to the costs of HEW, the existing literature has identified a lack of studies
that offer detailed evaluations of how the operation of the tax system affects the
consequences of using HEW to support consumption in retirement, and/or make
intergenerational transfers. Here, we will invoke tax-benefit modelling to generate an
evidence base that addresses this critical gap in the literature. Using AHURI-3M, a
housing market microsimulation model that is operationalised using the 2001–10
HILDA Survey and contains detailed contemporaneous parameters of the Australian
tax-benefit system, we will conduct three tax-benefit modelling exercises. The first is
an estimate of the extent to which the stamp duty on conveyance (and brokerage
costs) eats into the amount of housing equity withdrawn by older Australians when
trading on. This will be followed by an assessment of the impacts of downsizing
proceeds on asset test limits and subsequent income support payment entitlements.
Third, we will estimate the tax-benefits consequences should older homeowners
transfer their homes to other family members. Gifting property to relatives is common
following a move into an aged care facility.
5.2.3 Research question 3: How do older Australians perceive the different mechanisms for HEW and how do these perceptions influence decisions about the use of HEW?
The project’s third research question relates to perceptions of HEW, a variable that is
to our knowledge not observable from any secondary dataset in Australia. Hence, we
will conduct an embedded qualitative data collection analysis to specially address this
research question (Creswell & Plano-Clark 2007). The process for qualitative data
collection and analysis has been approved under Curtin University’s Human Research
Ethics processes (approval number HR18/2011). Qualitative data will be collected
through individual, face-to-face semi-structured interviews that are recorded and
transcribed.76
A program of 35 interviews is envisaged in the research budget. Thirty of these
interviews are to be undertaken with older homeowners in Perth, Adelaide and
Sydney.77 Participants have been selected from different age groups (45–54 years;
55–64 years; 65–74 years; and 75 years and over), household types (single person
and couple households), sex and home ownership status (with mortgage, fully
owned). A further five interviews are planned with staff from organisations that provide
support to older Australians contemplating HEW (e.g. the Department of Families,
Housing, Community Services and Indigenous Affairs and seniors organisations).
Their views of support services used and needed by older Australians using HEW will
be elicited.
The sample for these interviews is theoretical (or purposive) rather than statistical. In
the logic of sampling based on a theoretical or purposive strategy, units are chosen
75
However, it should be noted that while there are risks attached to HEW, investment in other assets such as shares and superannuation are subject to significant risks too, as evidenced by the relatively large losses incurred in the shares and superannuation sectors compared to the housing sector. However, an examination of risks of investment in non-housing assets is beyond the scope of this project. 76
The process of recruitment, piloting of the interview schedule and initial interviews have already begun at the time of writing this Positioning Paper. 77
At the time of writing this Positioning Paper, 52 hard copy invitations to participate have been distributed via the Council on the Ageing Western Australia (COTAWA) and electronic invitations have been distributed nationally through a newsletter produced by National Seniors. One participant from Melbourne who responded to the invitation to participate was also included as his profile added diversity to the range of participants and could be readily interviewed by a research team member.

78
not for their representativeness, but for their relevance to the research question,
analytical framework and narrative being developed in the research project (Schwandt
2007). At the outset, identified variables and causal relationships are not defined.
Initial sampling is carried out with the aim of developing themes and categories
directly from data. The broad theme for the data is defined by the research question
and, in an embedded study such as this, further shaped by the questions underlying
the analysis of HILDA data. However, within this framework, themes and categories of
issues raised by interview participants are developed in an iterative process that
allows for key issues to emerge from the data. Ideally, further sampling is then carried
out to refine and develop these themes and categories. Further data collection is
typically seen as unnecessary once ‘saturation’ has occurred. That is, no new themes
or conceptual insights are emerging from additional data collection.78
Throughout the analysis data will be managed using N*Vivo9 software. The analytical
approach to this stage of the inquiry will be twofold. Firstly we will analyse all
transcripts using a constant comparison approach to open coding. This will allow key
concepts and constructs relevant to perceptions and plans on HEW. We will also
identify key areas of commonality and uniqueness among participants’ perceptions.
Secondly, by comparing perceptions of the risks attached with various HEW options
with the results of the empirical modelling, we will identify the extent to which attitudes
to HEW appear to be based on an understanding of the costs and risks of available
options.
5.2.4 Research question 4: What financial products can be introduced to mitigate the risks associated with HEW in older age?
We will extend the international review already reported in this Positioning Paper by
canvassing what is known about financial instruments that reduce the risks of HEW in
later life for the consumer. Collated findings that address the three previous research
questions, together with material uncovered from this review, will form the basis of our
recommendations of financial products (e.g. insurance products) which can mitigate
risks associated with withdrawing housing equity in later life.
78
In practice, the need to define samples and associated data collection costs and budgets before a project commences means that the size of samples is determined by factors other than saturation. For the project, the decision to include 30 interviews in the data collection and analysis process was based on patterns in previous studies which suggest that a program of 30 interviews is likely to generate sufficiently rich data to generate insights and emergent concepts (Miles & Huberman 1994; Mason 2010).

79
REFERENCES
Australian Bureau of Statistics (ABS) 1995, Australian social trends, 1995, cat. no.
4102.0, ABS, Canberra.
——1999, Demographic variables, 1999, cat. no. 1285.0, ABS, Canberra.
——2011a, Australian social trends, March 2011, cat. no. 4102.0, ABS, Canberra.
——2011b, Migration, Australia, 2009–10, cat. no. 3412.0, ABS, Canberra.
——2012a, House price indexes: Eight capital cities, September 2012, Time Series
Spreadsheets, cat. no. 6416.0, ABS, Canberra.
——2012b, Year book Australia, 2012, cat. no. 1301.0, ABS, Canberra.
Alessie, R & Kapteyn, A 2002, ‘Huizenprijzen en besparingen’ in RJM Alessie, PJA
van Els & LH Hoogduin (eds.), De rol van vermogen in de economie,
Koninklijke Vereniging voor de Staathuishoudkunde preadviezen, Amsterdam,
pp.31–56.
Alessie, R, Lusardi, A & Aldershof, T 1997, ‘Income and wealth over the life cycle:
Evidence from panel data’, Review of Income and Wealth, vol. 43, no. 1, pp.1–
32.
Alessie, R, Lusardi, A & Kapteyn, A 1995, ‘Saving and wealth holdings of the elderly’,
Ricerche Enonomiche, vol. 49, pp.293–315.
Angelini, V & Laferrère, A 2011, ‘Residential mobility of the European elderly’, CESifo
Economic Studies, vol. 58, no. 3, pp.544–569.
Angelini, V, Brugiavini, A & Weber, G 2011, ‘Does downsizing of housing equity
alleviate financial distress in old age?’ in A Börsch-Supan, M Brandt, K Hank &
M Shröder (eds.), The individual and the welfare state, Berlin, Heidelberg,
Springer-Verlag.
Australian Securities and Investments Commission (ASIC) 2005, Equity release
products, report 59,
<http://www.asic.gov.au/asic/pdflib.nsf/LookupByFileName/Equity_release_rep
ort.pdf/$file/Equity_release_report.pdf> (last accessed 19 December 2012).
——2007, All we have is this house: Consumer experiences with reverse mortgages,
report 109,
<http://www.asic.gov.au/asic/pdflib.nsf/LookupByFileName/Rep109_reverse_
mortgages_Nov07.pdf/$file/Rep109_reverse_mortgages_Nov07.pdf> (last
accessed 19 December 2012).
Australian Government 2010, Australia to 2050: Future challenges, intergenerational
report 2010,
<http://archive.treasury.gov.au/igr/igr2010/report/pdf/IGR_2010.pdf> (last
accessed 19 December 2012).
Australian Taxation Office 2012, Guide to superannuation for individuals – Overview,
<http://www.ato.gov.au/individuals/content.aspx?menuid=0&doc=/content/002
50233.htm&page=7#P166_12178> (last accessed 19 December 2012).
Ball, M, Harloe, M & Martens, M 1988, Housing and social change in Europe and the
USA, Routledge, London and New York.

80
Banks, J, Blundell, R, Oldfield, Z & Smith, JP 2007, Housing price volatility and
downsizing in later life, Working paper 13496, National Bureau of Economic
Research, Cambridge.
Baxter, J & McDonald, P 2005, Why is the rate of home ownership falling in Australia?
Research and Policy Bulletin, Australian Housing and Urban Research
Institute, Melbourne.
Belsky, ES 2010, Housing wealth effects and course of the US economy: Theory,
evidence, and policy implications, in SJ Smith & BA Searle (eds.), The
Blackwell companion to the economics of housing: The housing wealth of
nations, Wiley-Blackwell, Chichester, West Sussex, pp.82–104.
Benito, A 2007, Housing equity as a buffer: Evidence from UK households, Working
Paper 324, Bank of England.
Bishop, TB & Shan, H 2008, Reverse mortgages: A closer look at HECM loans,
National Bureau of Economic Research, Cambridge.
Bridge, C, Adams, T, Phibbs, P, Mathews, M & Kendig, H 2010, Reverse mortgages
and older people: Growth factors and implications for retirement decisions,
Final Report No. 146, Australian Housing and Urban Research Institute,
Melbourne.
—— 2011, Reverse mortgages and older people, Research and Policy Bulletin,
Australian Housing and Urban Research Institute, Melbourne.
Bundesregierung 2009, Bericht -über die wohnungs- und immobilienwirtschaft in
Deutschland, Bundesregierung, Berlin.
Bundeszentrale für politische Bildung 2008, Datenreport 2008, Ein Sozialbericht für
die Bundesrepublik Deutschland, Bonn, Statistische Bundesamt in
collaboration with Gesellschaft Sozialwissenschaftlicher
Infrastruktureinrichtungen (GESI-ZUMA), and Wissenschaftszentrum Berlin für
Sozialforschung (WZB), Bonn.
Consumer Financial Protection Bureau (CFPB) 2012, Reverse mortgages, Report to
Congress, no place of publication given, CFPB.
Canner, G, Dynan, K & Passmore, W 2002, ‘Mortgage refinancing in 2001 and early
2002’, Federal Reserve Bulletin, December, pp.469–481.
Caplin, A, Cunningham, N, Engler, M & Pollock, F 2008, Facilitating shared
appreciation mortgages to prevent housing crashes and affordability crises,
Discussion paper 2008–12, The Hamilton Project paper, The Brookings
Institution, Washington, D.C.
Castles, F 1998, ‘The really big trade-off: Home ownership and the welfare state in the
new world and the old’, Acta Politica, vol. 33, no. 1, pp.5–19.
Chiuri, MC & Jappelli, T 2010, ‘Do the elderly reduce housing equity? An international
comparison’, Journal of Population Economics, vol. 23, pp.643–663.
Clark, WAV 2011, Mobility and mobility contexts: Modeling and interpreting residential
change in Australia, Paper presented at the HILDA Survey Conference,
Melbourne, 14–15 July.
Cnossen, S 2010, Three VAT studies, The Hague, CPB Netherlands Bureau for
Economic Policy Analysis.

81
Conrad, A 2007, ‘Das konzept des reverse mortgage—Eine alternative für
Deutschland, in (Österreichisches), BankArchiv, Heft 8, Springer-Verlag
GmbH, Wien.
Creswell, J & Plano-Clark, V 2007, Designing and conducting mixed methods
research, Sage, Thousand Oaks CA.
Davies, J B & Shorrocks, AF 2000, ‘The distribution of wealth’, in AB Atkinson & F
Bourguignon (eds.) (2000), Handbook of income distribution, vol. 1, Elsevier
Science BV, Amsterdam, pp.605–675.
De Roon, F, Eichholtz, P & Koedijk, K 2010, Housing with a silver lining, paper Tilburg
University, October.
Deloitte Touche Tohmatsu and SEQUAL 2011, Australia’s reverse mortgage market
reaches $3bn at 31 December 2010,
<http://www.sequal.com.au/images/Media_Releases/australia%5C%27s%20r
everse%20mortgage%20market%20reaches%20%243bn.pdf>
——2012, Australia’s reverse mortgage market reaches $3.3bn at 31 December
2011, <http://www.deloitte.com/assets/Dcom-
Australia/Local%20Assets/Documents/news-
research/Press%20releases/Louise%20Denver/Media%20Release%20_Austr
alia%20reverse%20mortgage.pdf>
Do, C 2012, ‘Withdrawing home equity: Differences across race and ethnicity’,
Housing Studies, vol. 27, no. 3, pp.299–323.
Dol, K & Haffner, MEA (eds.) 2010, Housing statistics in the European Union, The
Hague, Ministry of the Interior and Kingdom Relations.
Dol, K, van der Heijden, H & Oxley, M 2010, Economische crisis, Woningmarkt en
beleidsinterventies: Een internationale inventarisatie (Economic Crisis,
Housing Market and Policy Measures: An International Comparison), Delft
University of Technology, OTB Research Institute for Urban, Housing and
Mobility Studies, Delft.
Dolan, A, McLean, P & Roland, D 2005, Home equity, Retirement incomes and family
relationships, Paper prepared for the 9th Australian Institute of Family Studies
Conference, Melbourne, 9–11 February.
Doling, J & Ronald, R 2010, ‘Property-based welfare and European homeowners:
How would housing perform as a pension?’, Journal of Housing and the Built
Environment, vol. 25, pp.227–241.
Earley, F 2001, ‘Mortgage equity withdrawal’, Housing finance, vol. 51, pp.21–27.
Ebner, A 2010, A micro view on home equity withdrawal and its determinants,
evidence from Dutch households, Munich Discussion Paper No 2010-2,
Department of Economics, University of Munich, Munich.
Elsinga, M & Doling, J 2012, Demographic change and housing wealth: Home-
owners, pensions and asset-based welfare in Europe, Springer.
EMF 2010, ‘Hypostat 2010. A review of Europe’s mortgage and housing markets, no
place of publication given, European Mortgage Federation.
Flatau, P & Wood, G 2000, ‘Comprehensive income measures, housing equity, and
tax-transfer effects’, Australian Economic Papers, vol. 39, no. 3, pp.327–346.
Fornero, E, Rossi, MC & Brancati, MCU 2011, Explaining why, right or wrong, (Italian)
households do not like reverse mortgages, Netspar Discussion Paper no.

82
09/2011-086, <http://papers.ssrn.com/sol3/papers.cfm?abstract_id=1950519>
(last accessed 6 March 2013).
Fox, O’Mahony & Overton, L 2013, Equity release in the UK: Markets, consumers and
the role of the state, Paper presented at the Health, Wealth and Hearth:
Perspectives on an Ageing Australia Masterclass, University of Western
Australia, Perth, 14 February.
Girouard, N, Kennedy, M, van den Noord, P & André, C 2006, Recent house price
developments: The role of fundamentals, OECD Economics Department
Working Papers, No. 475, OECD Publishing.
http://dx.doi.org/10.1787/864035447847.
Gotman, A 2011, ‘Towards the end of bequest? The life cycle hypothesis sold to
seniors. Critical reflections on the reverse mortgage financial fashion’, Civitas,
Porto Algre, vol. 11, no. 1, pp.93–114.
Greenspan, A & Kennedy, J 2007, Sources and uses of equity extracted from homes,
Finance and Economics Discussion Series 2007–20, Divisions of Research
and Statistics and Monetary Affairs Federal Reserve Board, Washington, D.C.
Haffner, MEA 2002, ‘Dutch personal income tax reform 2001: An exceptional position
for owner-occupied housing’, Housing Studies, vol. 17, no. 3, pp.521–534.
—— 2005, Appel voor de Dorst? Vermogen van Ouderen op de Woningmarkt,
Utrecht: DGW/NETHUR-partnership, no. 29.
—— 2008, Savings for old age? Housing wealth of the Dutch elderly, Housing, Theory
and Society, vol. 25, no. 2, pp.110–131.
Haffner, MEA & de Vries, P 2010, ‘Dutch house prices and tax reform, in M Stewart
(ed.), Housing and tax policy, Australian Tax Research Foundation, Sydney,
pp.151–173, republished in P De Vries, 2010, TU Delft institutional repository,
<http://repository.tudelft.nl/view/ir/uuid%3A57c33fa8-a663-47cf-a63b-
dcef16429edc/>
Hamnett, C 1999, Winners and losers: Home ownership in modern Britain, UCL
Press, London.
Hancock, R, Katbamna, S, Marin, G, Clarke, H & Stuchbury, R 2002, Attitudes to
inheritance: An exploratory study, Joseph Rowntree Foundation, York.
Helbrecht, I & Geilenkeuser, T 2010, ‘Home ownership in Germany: Retirement
strategies of households in a tenant society, Teorija in Praksa, vol. 47, no. 5,
pp.975–993.
Heylen, K & Haffner, MEA 2012, ‘The effect of housing expenses and subsidies on
income distribution in Flanders and the Netherlands’, Housing Studies, vol. 27,
no. 8, pp.1142–1161.
Hickey, J, Handley, K & Ling, J 2007, SEQUAL/Trowbridge Deloitte reverse mortgage
market study (December 2007), Trowbridge Deloitte, Sydney.
Hugo, G 2003, ‘Australia’s ageing population’, Australian Planner, vol. 40, no. 2,
pp.109–118.
Hurd, MD 1990, ‘Research on the elderly: Economic status, retirement, and
consumption and saving’, Journal of Economic Literature, vol. 28, pp.565–637.
IBM Global Business Services 2010, An actuarial analysis of FHA home equity
conversion mortgage loans in the mutual mortgage insurance fund: Fiscal year

83
2010, prepared for US Department of Housing and Urban Development,
October 14.
International Monetary Fund (IMF) 2008, World economic outlook: Housing and the
business cycle, International Monetary Fund, Washington DC.
—— 2011, Global financial stability report: Durable financial stability: Getting there
from here, International Monetary Fund, Washington DC.
Jefferson, T & Preston, A 2005, ‘Australia’s other gender wage gap: Baby boomers
and compulsory superannuation accounts’, Feminist Economics, (Special
edition on Women and Ageing), July, vol. 11, no. 2, pp.79–100.
Jones, A, Geilenkeuser, T, Helbrecht, I & Quilgars, D 2012, ‘Demographic change and
retirement planning: Comparing households’ views on the role of housing
equity in Germany and the UK’, International Journal of Housing Policy, vol.
12, no. 1, pp.27–45.
Klyuev, V & Mills, P 2006, republished in 2007 and 2010, ‘Is housing wealth an
“ATM”? The relationship between household wealth, home equity withdrawal,
and savings rates’, IMF Working Paper WP/06/162, International Monetary
Fund; republished in 2007, IMF staff papers, vol. 54, no. 3, pp.539–561;
republished in 2010 in SJ Smith & BA Searle (eds.), The Blackwell companion
to the economics of housing: The housing wealth of nations, Wiley-Blackwell,
Chichester, West Sussex, pp.58–81.
Lang, G & Westerheide, P 2006, ‘Sonderfrage: Reverse mortgae in Deutschland’,
ZEW Finanzmarktreport, Mai, p.3.
Leviton, R 2001, ‘Reverse mortgage decision-making’, Journal of Aging and Social
Policy, vol. 134, pp.1–16.
Mason, M 2010, ‘Sample size and saturation in PhD studies using qualitative
interviews’, Forum: Qualitative Social Research, vol. 11, no. 3, article 8.
Megbolugbe, IF, Sa-Aadu, J & Shilling, JD 1997, ‘Oh, yes, the elderly will reduce
housing equity under the right circumstances’, Journal of Housing Research,
vol. 8, no. 1, pp.53–74.
Mian, A & Sufi, A 2011, ‘House prices, home equity-based borrowing, and the US
household leverage crisis’, American Economic Review, vol. 101, pp.2132–
2156.
Miles, M B & Huberman, AM 1994, Qualitative data anaysis: An expanded
sourcebook, second edn., Sage, Thousand Oaks CA.
Ministerie van BZK 2010, Cijfers over wonen, Wijken en integratie 2010, Ministerie
van Binnenlandse Zaken en Koninkrijksrelaties, Den Haag.
Ministerie van Financiën 2012, Belastingplan 2013, Ministerie van Financiën, Den
Haag.
Ministerie van Sociale Zaken en Werkgelegenheid 2008, The old-age pension system
in the Netherlands, Publicatie-nr. SZW 74r610, Juni, Rijksoverheid, Den Haag.
Modigliani, F & Brumberg, R 1954, ‘Utility analysis and the consumption function: an
interpretation of cross-section data’, in KK Kurihara, (ed.), Post Keynesian
Economics, Rutgers University Press, New Brunswick.
Moloney, D & Bor, A 2003, Improving accessibility and flexibility of mortgage lending
for Australians, A Report for the Prime Minister’s Home ownership Task Force,
Booz Allen Hamilton Inc., Sydney.

84
Monk, S & Whitehead, C (eds.) 2010, Front matter, in making housing more
affordable: The role of intermediate tenures, Wiley-Blackwell, Oxford, UK. doi:
10.1002/9781444327854.fmatter
Naumanen, P & Ruaonavaara, H 2010, ‘Old age and the role of housing equity. A
case study on the Finnish homeowners’ perceptions’, Teorija in Praksa, vol.
47, no. 5, pp.1078–96.
Naumanen, P, Perista, P & Ruaonavaara, H 2012, ‘Homes as old age security?
Households’ perceptions of housing and elderly care in Finland and Portugal’,
International Journal of Housing Policy, vol. 12, no. 1, pp.47–68.
NSW Treasury 2010, Interstate comparison of taxes 2010–11, no place of publication
given, NSW Treasury.
Organisation for Economic Co-operation and Development (OECD) 2007, OECD
economic surveys: United States, OECD, Paris.
—— 2011, Pensions at a glance 2011: Retirement-income systems in OECD and G20
countries, OECD Publishing, Paris.
Olsberg, D & Winters, M 2005, Ageing in place: Intergenerational and intrafamilial
housing transfers and shifts in later life, Final Report No. 88, Australian
Housing and Urban Research Institute, Melbourne.
Ong, R 2008, ‘Unlocking housing equity through reverse mortgages: The case of
elderly homeowners in Australia’, European Journal of Housing Policy, vol. 8,
no. 1, pp.61–79.
—— 2010, ‘House price appreciation in old age: Analysis and issues for the use of
reverse mortgages as a retirement funding strategy in Australia’, Journal of
Population Ageing, vol. 3(3–4), pp.139–60.
Ong, R, Parkinson, S, Searle, BS,. Smith, S.J & Wood, G 2013), ‘Channels from
housing wealth to consumption’, Housing Studies,
DOI:10.1080/02673037.2013.783202.
Oxley, M & Haffner, MEA 2010, Housing taxation and the subsidies: International
comparisons and the options for reform, Joseph Rowntree Foundation
Housing Taskforce, Joseph Rowntree Foundation, York.
<http://www.jrf.org.uk/publications/housing-taxation-subsidies> (last accessed
19 December 2012).
Oxley, M, Lishman, Ros, Brown, Tim, Haffner, MEA & Hoekstra, Joris 2010,
Promoting investment in private rented housing supply: International policy
comparison, Department for Communities and Local Government, London.
<http://www.communities.gov.uk/publications/housing/investprivaterentedhousi
ng> (last accessed 19 December 2012).
Parkinson, S, Searle, BA, Smith, S, Stoakes, A & Wood, G 2009, ‘Mortgage equity
withdrawal in Australia and Britain: Toward a wealth-fare state?, European
Journal of Housing Policy, vol. 9, no. 4, pp.365–89.
Poterba, J, Venti, S & Wise, D 2011, ‘The composition and drawdown of wealth in
retirement’, Journal of Economic Perspectives, vol. 25, no. 4, pp.95–118.
Productivity Commission 2011, Caring for older Australians, Report No. 53, Final
Inquiry Report, Canberra.

85
Reifner, U, Clerc-Renaud, S, Pérez-Carillo, EF, Tiffe, A & Knobloch, M 2007a, Study
on equity release schemes in the EU—Part I: General report, Institut für
Finanzdienstleistungen e.V., Hamburg.
—— 2007b, Study on equity release schemes in the EU—Part II: Country reports,
Institut für Finanzdienstleistungen e.V., Hamburg.
Reinold, K 2011, ‘Housing equity withdrawal since the financial crisis’, Research and
Analysis, Q2, pp.127–33.
Reserve Bank of Australia 2003, Housing equity withdrawal, Reserve Bank of
Australia Bulletin, February, pp.50–54.
Rouwendal, J 2007, Housing wealth and housing portfolios in an aging society,
Netspar Discussion Paper 2007-048, Amsterdam, VU.
Rowlingson, K 2005, Attitudes to inheritance in Britain, Joseph Rowntree Foundation,
York.
Rozario, A 2012, ‘The state of the equity release market’, in Lord German (ed.),
Making the most of equity release: Perspectives from key players, The Smith
Institute, London, pp.12–16.
Schneider, M 2009a, ‘Kalkulation von reverse mortgages: Rechnet sich das?’, Die
Bank, vol. 7, pp.30–34.
—— 2009b, ‘Immobilienkapitalverzehr: Darlehen auf den Kopf gestellt’, Bankmagzin,
2, September, pp.30–34.
Schwandt, T 2007, ‘Sampling logic’, in SAGE Dictionary of qualitative inquiry, third
edn., Sage, Thousand Oaks CA, pp.270–72.
Schwartz, C, Hampton, T, Lewis, C & Norman, D 2006, republished in 2010, ‘A survey
of housing equity withdrawal and injection in Australia, RDP 2006-08, no place
of publication given, Reserve Bank of Australia; republished 2010 in SJ Smith
& BA Searle (eds.), The Blackwell companion to the economics of housing:
The housing wealth of nations, Wiley-Blackwell, Chichester, West Sussex,
pp.147–175.
Schwartz, H. & Seabrooke, L. 2008, ‘Varieties of residential capitalism in the
international political economy: Old welfare states and the new politics of
housing’, Comparative European Polities, vol. 6, pp.237–61.
Seelig, T., Thompson, A., Burke, T., Pinnegar, S., McNelis, S. & Morris, A. 2009,
Understanding What Motivates Households to Become and Remain Investors
in the Private Rental Market, Final Report No. 130, Australian Housing and
Urban Research Institute, Melbourne.
Senior Australians Equity Release Association of Lenders (SEQUAL) (n.d.), Code of
conduct,
<http://www.sequal.com.au/attachments/SEQUAL_Conduct_Code.pdf> (last
accessed 6 March 2013).
Sharp, R & Austen, S 2007, ‘The 2006 Federal budget: A gender analysis of the
superannuation taxation concessions’, Australian Journal of Labour
Economics, vol. 10, no. 2, pp.61–77.
Sheehan, G 2002, ‘Financial aspects of the divorce transition in Australia: Recent
empirical findings’, International Journal of Law, Policy and the Family, vol. 16,
pp.95–126.
86
Shiller, R.J. 2003, The new financial order: Risk in the 21st century, Princeton
University Press, Princeton, New Jersey.
Skinner, J 1996, ‘Is housing wealth a sideshow?’, in D Wise (ed.) 1996, Papers in the
economics of aging, University of Chicago Press, Chicago.
Smith, J 2004, ‘Exploring attitudes to housing wealth and retirement’, Housing
Finance, vol. 63 (Autumn), pp.22–33.
—— 2005, ‘Mortgage equity withdrawal and remortgaging activity’, in P Boulhouwer, J
Doling & M Elsinga (eds.) 2005, Home ownership: Getting in, getting from,
getting out, Housing and Urban Policy Studies, vol. 29, Delft, DUP Science,
pp.145–159.
Smith, S, Searle, BA & Cook, N 2009, ‘Rethinking the risks of home ownership’,
Journal of Social Policy, vol. 38, no. 1, pp.83–102.
Smith, SJ 2012, Care-full Markets: Miracle or mirage?, in Tanner Lecture Library
(Clare Hall Tanner Lectures 2010),
<http://www.tannerlectures.utah.edu/lectures/atoz.htm> (last accessed 19
December 2012).
Smith, SJ & Searle, BA 2008, ‘Dematerialising money? Observations on the flow of
wealth from housing to other things, Housing Studies, vol. 23, no. 1, pp.21–43.
—— (eds.) 2010, The Blackwell companion to the economics of housing: The housing
wealth of nations, Wiley-Blackwell, Chichester, West Sussex.
Smith, SJ, Ford, J & Munro, M 2002, A review of flexible mortgage, Council of
Mortgage Lenders, London.
Statistisches Bundesamt 2011, Im blickpunkt: Ältere menschen in Deutschland und
der EU, Statistisches Bundesamt, Wiesbaden.
Schwartz, H & Seabrooke, L 2008, ‘Varieties of residential capitalism in the
international political economy: Old welfare states and the new politics of
housing’, Comparative European Politics,vol. 6, pp.237–61.
Tatsiramos, K 2006, Residential mobility and housing adjustment of older households
in Europe, Discussion Paper no.. 2435, IZA, <http://ftp.iza.org/dp2435.pdf>
(last accessed 19 December 2012).
The Wriglesworth Consultancy 2011, SHIP 20th anniversary report: December 1991 to
December 2011, no place of publication given, The Wriglesworth Consultancy.
Tiffe, A 2007, ‘Revers mortgage—Marktchancen, kundenwünsche und gestaltung:
wohneigentum in der altersvorsorge’, Immobilien and Finanzierung, vol. 17,
pp.586–90.
Toussaint, J & Elsinga, M 2012, ‘Mortgage-equity release: The potential of housing
wealth for future Dutch retirees’, Journal for Housing and the Built
Environment, DOI 10.1007/s10901-012-9301-x.
—— 2009, ‘Exploring ‘housing and asset-based welfare’—Can the UK be held up as
an example for Europe?’ Housing Studies, vol. 24, no. 5, pp.669–92.
Toussaint, J, Tegeder, G, Elsinga, M & Helbrecht, I 2007, ‘Security and insecurity of
home ownership: Germany and the Netherlands’, European Journal of
Housing Policy, vol. 7, no. 2, pp.173–92.
Trampusch, C, Eichenberger, P, de Roo, M, Bartlett Rissi, R, Bieri, I, Schmid, L &,
Steinlin, S (eds.) 2010, Pension in the Netherlands, Research on Social

87
Benefits in Collective Agreements, Database, Part 2 ‘Social Benefits in
Collective Agreements’. SNF-Project No. 100012-119898, Institute of Political
Science, University of Berne, <http://www.bridge.uni-
koeln.de/fileadmin/wiso_fak/wisosoz/pdf/REBECA/Netherlands_Pension_eng.
pdf> (last accessed 19 December 2012).
Tsatsaronis, K & Zhu, H 2004, ‘What drives housing price dynamics: Cross-country
evidence’, BIS Quarterly Review, March, pp.65–78.
Van den End, WA, Kakes, JI, van Rooij, MCJ & Stokman, ACJ 2002,
Vermogensbeheer Nederlandse gezinnen: Analyse op basis van een enquête,
Onderzoeksrapport WO nr. 687, Mei, De Nederlandsche Bank, Amsterdam,
see also Kwartaalbericht Juni 2002.
Van der Heijden, H., Dol, K. & Oxley, M. 2011, ‘Western European housing systems
and the impact of the international financial crisis’, Journal of Housing and the
Built Environment, vol. 26, no. 3, pp.295-313.
Van Els, PJ.A, van den End, WA & van Rooij, MCJ 2003, Financial behaviour of
Dutch households: An analysis of the DNB household survey 2003, Research
Memorandum WO no. 744, October, De Nederlandsche Bank, Amsterdam,
see also Kwartaalbericht September 2003.
VEH 2012, Het pensioen staat als een huis. Is de overwaarde van het huis te
verzilveren?, 29 Maart, Vereniging Eigen Huis, Amsersfoort.
Venti, S & Wise, D 2000, Aging and housing equity, National Bureau of Economic
Research, Working Paper Series, Cambridge.
—— 2004, ‘Aging and housing equity: Another look’, in D Wise (ed.) 2004,
Perspective on the economics of aging, Chicago Press, Chicago, pp.127–80.
Vorms, B. 2009, Home Ownership as Wealth over the Life Cycle: European
Household Motivation for Residential Assets Current Situation and Future
Prospects, DEMHOW Research Report,
http://www.birmingham.ac.uk/Documents/college-social-sciences/social-
policy/DEMHOW/A3.pdf
VVD-PvdA (2012), Bruggen slaan. Regeerakkoord VVD – PvdA, place of publication
not given, 29 oktober, http://www.rijksoverheid.nl/regering/documenten-en-
publicaties/rapporten/2012/10/29/regeerakkoord.html.
Wicke, E 2008, ‘Umgekehrte Hypotheek—Ein zukunftsmodell für Deutschland?’, E-
Journal of Practical Business Research, Sonderausgabe Bank Nr. vol. 1, no.
12, pp.1–17.
Wood, G & Nygaard, CA 2010, ‘Housing equity withdrawal and retirement: Evidence
from the Household, Income and Labour Dynamics in Australia Survey
(HILDA), in SJ Smith & BA Searle (eds.), The Blackwell companion to the
economics of housing: The housing wealth of nations, Wiley-Blackwell,
Chichester, West Sussex, pp.257–78.
Wood, G & Ong, R 2012, Sustaining home ownership in the 21st century: Emerging
policy concerns, Final Report No. 187, Australian Housing and Urban
Research Institute, Melbourne.
Wood, G, Colic-Peisker, V, Berry, M & Ong, R 2010a, Asset-poverty and older
Australians transitions onto housing assistance programs, Final Report No.
156, Australian Housing and Urban Research Institute, Melbourne.

88
Wood, G, Stewart, M & Ong, R 2010b, Housing taxation and transfers, Final Report,
Research Study for the Review of Australia’s Future Tax System,
<http://www.taxreview.treasury.gov.au/content/html/commissioned_work/down
loads/Wood_Stewart_and_Ong.pdf> (last accessed 19 December 2012).
Yates, J 2012, ‘Taxation’, in SJ Smith, M Elsinga, LF O’Mahony, SE Ong, S Wachter
& R Ronald (eds.), International Encyclopedia of Housing and Home, vol. 7,
Elsevier, Oxford, pp.138–147.
Yates, J & Bradbury, B 2010, ‘Home ownership as a (crumbling), fourth pillar of social
insurance in Australia’, Journal of Housing and the Built Environment, vol. 25,
pp.193–211.

89
APPENDICES
Appendix 1: Measuring income unit assets and debts
In single-income unit households, household assets and debts are equivalent to
income unit assets and debts respectively. In multi-income unit households, the
algorithm for measuring assets and debts on an income unit basis is detailed in Table
A1 below.
Table A1: Algorithm for the measurement of wealth and debt for income units residing
in multi-income unit households
Asset/debt type
Unit of measurement in HILDA
Algorithm
Asset
Primary home Household We have identified income units that own the primary home in a multi-income unit household using AHURI-3M. Hence, the wealth stored in the primary home is assigned to the income unit that owns the primary home
Other property Household We are able to identify legal owners of other property within the household. We assume legal owners have equal share of property value to get the income unit value. So, for example, suppose there are three adult members in the household, of which two are members of a couple income unit, and the third is a non-related household member. Suppose, that all three are reported as legal owners of other property owned by the household. The couple income unit would be assigned two-thirds of the household wealth stored in other property, while the third adult would be assigned one-third of the household wealth.
Business Household Each respondent is asked what their financial year business income is. Respondents who report business income (whether made profit, loss or broke even) are classified as business owners. The household business assets are then divided equally among business owners in the household. For a couple income unit, the sum of personal business wealth is added up to derive income unit business wealth.
Savings/
investments
Personal and household
Savings include own and joint bank account balances and these are reported on a personal basis. For a couple income unit, the sum of personal own bank account wealth is added up to derive income unit joint bank account wealth. Similarly, the sum of each partner’s share of joint bank account wealth is added up to derive income unit joint bank account wealth.
Investments include equity investments, cash investments, life insurance and trust funds and these are reported on a household basis. Household investment wealth is divided equally among adult members of the household then summed for members of each income unit to derive income unit wealth.
Superannuation Personal For a couple income unit, the sum of personal superannuation wealth is added up to derive income superannuation wealth.
Other assets Household Other assets include vehicles and collectibles. Other assets are divided equally among adult members of the household then summed for members of each income unit to derive income unit wealth.

90
Asset/debt type
Unit of measurement in HILDA
Algorithm
Debt
Primary home Household Apply method of assigning primary home wealth (see above).
Other property Household Apply method of assigning other property wealth (see above).
Business Household Apply method of assigning business wealth (see above).
Credit card Personal Credit card debt is derived from personal and one’s share of joint credit card debt. For a couple income unit, the sum of personal own credit card debt is added up to derive income unit own credit card debt. Similarly, the sum of each partner’s share of joint credit card debt is added up to derive income unit joint credit card debt.
Other debt Personal Other debts include HECS, car loans, investment loans, personal loans, hire purchase and overdue bills. For a couple income unit, the sum of personal other debts is added up to derive the income unit’s other debt.
Source: Wood et al. (2010a)
Appendix 2: Supplementary tables on the assets and debts of older Australians
Table A2: Asset and debts of older Australians, by age band, 2002 and 2006
(a) 2002
Mean income unit asset and debt, 2002 price level,
in $’000s
Composition of income unit asset and debt, per cent
(calculated based on means)
45–54 years
55–64 years
65+ years
45–54 years
55–64 years
65+ years
Asset
Primary home 274.6 260.8 225.8 45.2 39.3 53.5
Other property 69.3 79.4 31.6 11.4 12.0 7.5
Superannuation 141.6 145.4 44.1 23.3 21.9 10.4
Business 33.6 28.1 6.7 5.5 4.2 1.6
Savings and investments 64.4 121.4 99.4 10.6 18.3 23.6
Other 24.0 29.2 14.5 3.9 4.4 3.4
Total 607.5 664.3 422.1 100.0 100.0 100.0
Debt
Primary home 47.8 17.8 2.4 65.4 49.3 58.1
Other property 18 10.8 0.8 24.6 29.8 19.2
Business 5.6 6.4 0.7 7.6 17.8 16.5
Credit card 1.3 0.9 0.2 1.7 2.4 4.4
Other 0.4 0.2 0.1 0.6 0.7 1.7
Total 73 36.2 4.1 100.0 100.0 100.0
Population (‘000s) 2,642.7 1,913.4 2,277.6

91
(b) 2006
Mean income unit asset and debt, 2002 price level, in
$’000s
Composition of income unit asset and debt, per cent
(calculated based on means)
45–54 years
55–64 years
65+ years
45–54 years
55–64 years
65+ years
Asset
Primary home 446.8 469.8 410.8 44.5 38.8 49.4
Other property 198.5 201.4 132.8 19.8 16.7 16.0
Superannuation 214 294.1 100.8 21.3 24.3 12.1
Business 25.6 29.3 5.9 2.6 2.4 0.7
Savings and investments 86.3 182.3 160.9 8.6 15.1 19.4
Other 32.9 32.5 20.3 3.3 2.7 2.4
Total 1,004.1 1,209.3 831.4 100.0 100.0 100.0
Debt
Primary home 94.8 41.6 3.8 65.1 56.1 38.5
Other property 41.2 29.4 5.4 28.3 39.7 55.0
Business 6.6 1.6 0.4 4.5 2.2 4.1
Credit card 2 1.4 0.2 1.4 1.9 2.2
Other 1.1 0.2 0.0 0.7 0.2 0.1
Total 145.8 74.2 9.9 100.0 100.0 100.0
Population (‘000s) 2,641.1 2,084.4 2,353.3
Source: Authors’ own calculations from the 2002, 2006 and 2010 HILDA Survey

92
Table A3: Asset and debts of older Australians, by income unit type, 2002 and 2006
(a) 2002
Mean income unit asset and debt, 2002 price level, in
$’000s
Composition of income unit asset and debt, per cent
(calculated based on means)
Single men
Single women
Partnered persons
Single men
Single women
Partnered persons
Asset
Primary home 135.8 167.4 290.0 45.3 60.3 43.8
Other property 21.0 24.5 72.7 7.0 8.8 11.0
Superannuation 58.1 28.4 136.0 19.4 10.2 20.6
Business 0.0 0.0 31.5 0.0 0.0 4.8
Savings and investments 71.5 47.4 105.1 23.8 17.1 15.9
Other 13.5 9.7 26.4 4.5 3.5 4.0
Total 299.9 277.4 661.6 100.0 100.0 100.0
Debt
Primary home 12.6 10.0 29.1 74.3 67.6 60.0
Other property 2.0 3.8 12.8 11.8 25.9 26.4
Business 1.6 0.2 5.4 9.7 1.5 11.2
Credit card 0.5 0.5 0.9 3.2 3.6 1.8
Other 0.2 0.2 0.3 1.1 1.4 0.6
Total 17.0 14.9 48.5 100.0 100.0 100.0
Population (‘000s) 632.0 1,183.9 6,833.7
(b) 2006
Mean income unit asset and debt, 2002 price level, in
$’000s
Composition of income unit asset and debt, per cent
(calculated based on means)
Single men
Single women
Partnered persons
Single men
Single women
Partnered persons
Asset
Primary home 233.9 269.0 507.9 47.7 57.1 42.4
Other property 61.5 77.1 215.5 12.5 16.4 18.0
Superannuation 86.1 51.7 248.7 17.5 11.0 20.8
Business 0.0 0.0 27.3 0.0 0.0 2.3
Savings and investments 92.0 61.8 163.4 18.8 13.1 13.7
Other 17.3 11.5 34.0 3.5 2.4 2.8
Total 490.9 471.1 1,196.7 100.0 100.0 100.0
Debt
Primary home 27.7 19.2 58.5 58.6 67.8 61.2
Other property 17.5 7.3 31.2 37.1 25.9 32.7
Business 0.7 0.5 4.0 1.5 1.9 4.2
Credit card 0.9 0.8 1.4 1.9 2.8 1.4
Other 0.4 0.4 0.5 0.9 1.6 0.5
Total 47.2 28.3 95.5 100.0 100.0 100.0
Population (‘000s) 659.3 1,208.5 7,078.8
Source: Authors’ own calculations from the 2002, 2006 and 2010 HILDA Survey

AHURI Research Centres
AHURI Research Centre—Curtin University
AHURI Research Centre—Monash University
AHURI Research Centre—RMIT University
AHURI Research Centre—Swinburne University of Technology
AHURI Research Centre—University of New South Wales
AHURI Research Centre—University of Queensland
AHURI Research Centre—University of Tasmania
AHURI Research Centre—University of Western Australia
AHURI Research Centre—University of Western Sydney
Australian Housing and Urban Research Institute
Level 1, 114 Flinders Street, Melbourne Victoria 3000
Phone +61 3 9660 2300 Fax +61 3 9663 5488
Email [email protected] Web www.ahuri.edu.au