asset/liability management – year 2 - madison, wi · lecture materials asset/liability management...
TRANSCRIPT

Lecture Materials
ASSET/LIABILITY MANAGEMENT – YEAR 2
Darren D. Herrmann Executive Vice President & Corporate Treasurer
UMB Financial Corporation Kansas City, Missouri
[email protected] 816-860-7195
August 1, 2016

Asset/Liability Management
Graduate School of Banking, Madison, Wisconsin 2
Year 2 OverviewDarren Herrmann—Day 1• Asset/Liability Management (ALM): Profitability & Process
Andy Trovillion—Day 2 • Interest Rate Risk Measurement and ManagementJohn McQueen—Day 3• Developing an Effective Liquidity Strategy Dave Koch—Day 4• Putting it all together: Implementation of a Risk-Return
Framework

Asset/Liability Management
Graduate School of Banking, Madison, Wisconsin 3
DisclosuresThe information and opinions expressed in this message are solely those of the author and do not necessarily state or reflect the opinion of UMB Bank, n.a. or UMB Financial Corporation. This communication is provided for informational purposes only. UMB Bank, n.a. and UMB Financial Corporation are not liable for any errors, omissions, or misstatements.

Asset/Liability Management
Graduate School of Banking, Madison, Wisconsin 4
Overview• ALM Overview• ALM and the Interest Rate Environment• ALM & Profitability
• Drivers of Net Interest Income (NII)• A Case Study• Balance Sheet Optimization• Leverage Deployment• Intersession Project Part 1
• The ALM Process• Structure, responsibilities• Seven Steps to an Improved ALCO• Intersession Project Part 2

Asset/Liability Management
Graduate School of Banking, Madison, Wisconsin 5
ALM
Definition• The term “asset/liability management”
refers to the processes of acquiring and deploying funds to maximize net interest income, and thereby profitability and the value of the bank, while balancing against related financial risks and constraints.

Asset/Liability Management
Graduate School of Banking, Madison, Wisconsin 6
ALM’s Primary Areas of Responsibility• Net Interest Income• Balance Sheet & Off Balance Sheet Structure
• ALM Mix • Loan and Deposit Pricing• Investment Portfolio Management• Wholesale Funding • Capital Utilization
• Risk Measurement and Management/Constraints• Interest Rate Risk• Liquidity Risk• Capital

Asset/Liability Management
Graduate School of Banking, Madison, Wisconsin 7
ALM Levers
• Pricing• Mix Optimization• Capital Levels/Leverage (Balance of
Stakeholders) • Interest Rate Risk• Liquidity Risk

Asset/Liability Management
Graduate School of Banking, Madison, Wisconsin 8
Interaction of Net Interest Margin & Profitability
NIM ROA Leverage ROE EarningsEfficiencyRatio

Asset/Liability Management
Graduate School of Banking, Madison, Wisconsin 9
ALM and the Interest Rate Environment

Asset/Liability Management
Graduate School of Banking, Madison, Wisconsin 10
The Current ALM Environment• Fed increased 25 basis points in December, has the expected impact
materialized in your bank’s NIM?
• Compressed NIMs and higher loan to deposit ratios leading to increased competition for funding
• Could increase further as banks are pushed to grow in order to grow earnings
• CRE, Energy, Auto Lending concentrations dominating credit discussion
• Derivative usage growing mainly to enable loan growth, what about your bank?
• Bond portfolio exposure to rising rates—how great should be the concern?
• Lots of M&A—how efficient is the combined balance sheet?
• Balance sheet optimization key in tough rate environment
• Funding mixes much more concentrated in indeterminate deposits vs. pre-crisis

Asset/Liability Management
Graduate School of Banking, Madison, Wisconsin 11
The Current ALM Environment• Regulatory changes could have unforeseen impact (Liquidity Coverage Ratio)
• Unprecedented FOMC easing through rate lowering and other monetary liquidity programs has created liquidity (surge deposits) and interest rate risk concerns
• Flat yield curve caused by twist of short rates higher and long rates lower pressures net interest margin
• If rates rise, bonds and loans with options extend (less cash flow, less liquidity, less repricing)
• As rates rise, bond portfolio gains will disappear (less liquidity)
• Depending on interest rate risk position margin will expand or compress?
• Deposit growth could slow or reverse
• Wholesale funding will become more expensive

Asset/Liability Management
Graduate School of Banking, Madison, Wisconsin 12
Interest Rates: Past, Present, Future?
‐
1.00
2.00
3.00
4.00
5.00
6.00
3 MO 6 MO 1 YR 2 YR 3 YR 5 YR 7 YR 10 YR 30 YR
2007 2009 2011 2013 2016 1 Year Forward Rates

Asset/Liability Management
Graduate School of Banking, Madison, Wisconsin 13
Is This Time Different?

Asset/Liability Management
Graduate School of Banking, Madison, Wisconsin 14
Yield Curve Is Flat by Historical Norms (Spread between the 10 and 2 year treasury rates on average)
1.17 1.26
1.66 1.74
1.28
0.93
Last 30 years Last 20 years Last 10 years Last 5 years Last year Current

Asset/Liability Management
Graduate School of Banking, Madison, Wisconsin 15
Curve Conundrum

Asset/Liability Management
Graduate School of Banking, Madison, Wisconsin 16
Rate Environment Overview

Asset/Liability Management
Graduate School of Banking, Madison, Wisconsin 17
ALM & Profitability

Asset/Liability Management
Graduate School of Banking, Madison, Wisconsin 18
Net Interest Income Key to Community Bank Profitability(Net Interest Income as Percentage of Total Revenue Commercial Banks)
56%
65%69%
65%62% 64%
74%
79%77% 75%
0%
10%
20%
30%
40%
50%
60%
70%
80%
90%
Mar‐04
Jun‐04
Sep‐04
Dec‐0
4Mar‐05
Jun‐05
Sep‐05
Dec‐0
5Mar‐06
Jun‐06
Sep‐06
Dec‐0
6Mar‐07
Jun‐07
Sep‐07
Dec‐0
7Mar‐08
Jun‐08
Sep‐08
Dec‐0
8Mar‐09
Jun‐09
Sep‐09
Dec‐0
9Mar‐10
Jun‐10
Sep‐10
Dec‐1
0Mar‐11
Jun‐11
Sep‐11
Dec‐1
1Mar‐12
Jun‐12
Sep‐12
Dec‐1
2Mar‐13
Jun‐13
Sep‐13
Dec‐1
3Mar‐14
Jun‐14
Sep‐14
Dec‐1
4Mar‐15
Jun‐15
Sep‐15
Dec‐1
5Mar‐16
Assets > $1 Billion Assets < $1 BillionSource: FDIC

Asset/Liability Management
Graduate School of Banking, Madison, Wisconsin 19
Yield Decline Not as Severe for Community Banks
Source: FDIC
0.00%
2.00%
4.00%
6.00%
8.00%
10.00%
12.00%
14.00%
Assets > $10 Billion
Assets $1 Billion - $10 Billion
Assets $100 Million - $1 Billion
Assets < $100 Million
Average Yield on Interest-Earning Assets
Asset/Liability Management
Graduate School of Banking, Madison, Wisconsin 20
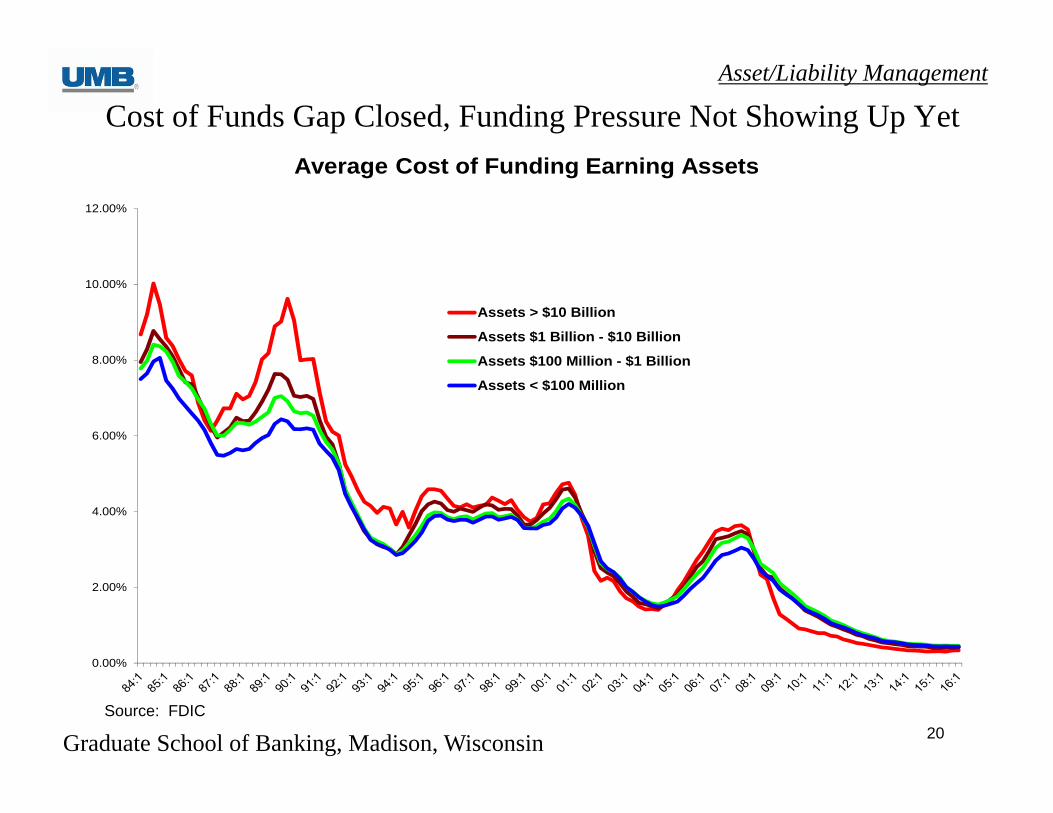
Cost of Funds Gap Closed, Funding Pressure Not Showing Up Yet
Source: FDIC
0.00%
2.00%
4.00%
6.00%
8.00%
10.00%
12.00%
Assets > $10 Billion
Assets $1 Billion - $10 Billion
Assets $100 Million - $1 Billion
Assets < $100 Million
Average Cost of Funding Earning Assets

Asset/Liability Management
Graduate School of Banking, Madison, Wisconsin 21
Community Banks Continue Net Interest Margin Outperformance
Source: FDIC
0.00%
0.50%
1.00%
1.50%
2.00%
2.50%
3.00%
3.50%
4.00%
4.50%
5.00%
Assets > $10 Billion
Assets $1 Billion - $10 Billion
Assets $100 Million - $1 Billion
Assets < $100 Million
Quarterly Net Interest Margin (NIM)

Asset/Liability Management
Graduate School of Banking, Madison, Wisconsin 22
AVGRATE
AVERAGE INTEREST EARNED/ASSETS: BALANCE INC/EXP PAID Net Loans 384,108 26,004 6.77% Total Investment Securities 266,797 12,913 4.84% Total FF, Repos & Trade Securities 36,308 1,881 5.18% Total Earning Assets 687,213 40,798 5.94%LIABILITIES: Total Demand Deposits 171,783 Total Transaction Accounts 259,524 6,151 2.37% Total Time Deposits 120,423 5,624 4.67%
Total Interest Bearing Deposits 379,947 11,774 3.10% Total Borrowings 132,859 6,470 4.87%Total Interest Bearing Liabilities 512,806 18,245 3.56%
Free Funds 174,407 Interest Income & Rate Earned 40,798 5.94%Interest Expense & Rate Paid 18,245 3.56%Net Interest Income & Rate Spread 22,553 2.38%Net Interest Margin 3.28%
NII & Margin Components

Asset/Liability Management
Graduate School of Banking, Madison, Wisconsin 23
NII & Margin Components
Earning Assets 687,213 40,798 5.94% Yield on Earning AssetsCosting Liabilities 512,806 18,245 3.56% Cost of FundsFree Funds 174,407 16,348 2.38% Contribution of SpreadFree Funds Ratio 25.38% 0.90% Contribution of Free Funds in basis points
6,205 Contribution of Free Funds in $Net Interest Income 22,553 3.28% Net Interest Margin
Interest Income
Interest Expense
Free Funds/Earning Assets174,407 / 687,213
Contribution of Spread * Earning Assets2.38% * 687,213
Free Funds Ratio * Cost of Funds25.38% * 3.56%
Free Funds * Cost of Funds174,407 * 3.56%

Asset/Liability Management
Graduate School of Banking, Madison, Wisconsin 24
Drivers of Net Interest Income

Asset/Liability Management
Graduate School of Banking, Madison, Wisconsin 25
Drivers of NII
• Rate (Pricing, credit risk interest rate risk, liquidity risk)
• Volume of assets and liabilities• Mix of assets and liabilities

Asset/Liability Management
Graduate School of Banking, Madison, Wisconsin 26
Net Interest Income Variance Equations
Avg. Avg. Avg. Avg.Balance Rate Balance Rate
14,294,477 5.21% Investments 14,698,713 5.23%34,181,351 Earning Assets 34,084,953
Investments Rate M2 * L2 * R2 - M2 * L2 * R1
Variance 14,698,713 / 34,084,953 34,084,953 5.23% - 14,698,713 / 34,084,953 34,084,953 5.21% = 2,940
Investments Volume M2 * L2 * R1 - M2 * L1 * R1
Variance 14,698,713 / 34,084,953 34,084,953 5.21% - 14,698,713 / 34,084,953 34,181,351 5.21% = (2,166)
Investments Mix M2 * L1 * R1 - M1 * L1 * R1
Variance 14,698,713 / 34,084,953 34,181,351 5.21% - 14,294,477 / 34,181,351 34,181,351 5.21% = 23,227
Total Investments Variance 24,000
Net Interest Income Variance Analysis Calculation ExampleDollars 000s Omitted
Period 1 Period 2
Rate Variance = M(2)*L(2)*R(2) - M(2)*L(2)*R(1) Volume Variance = M(2)*L(2)*R(1) - M(2)*L(1)*R(1) Mix Variance = M(2)*L(1)*R(1)* - M(1)*L(1)*R(1)
Asset/Liability Management
Graduate School of Banking, Madison, Wisconsin 27
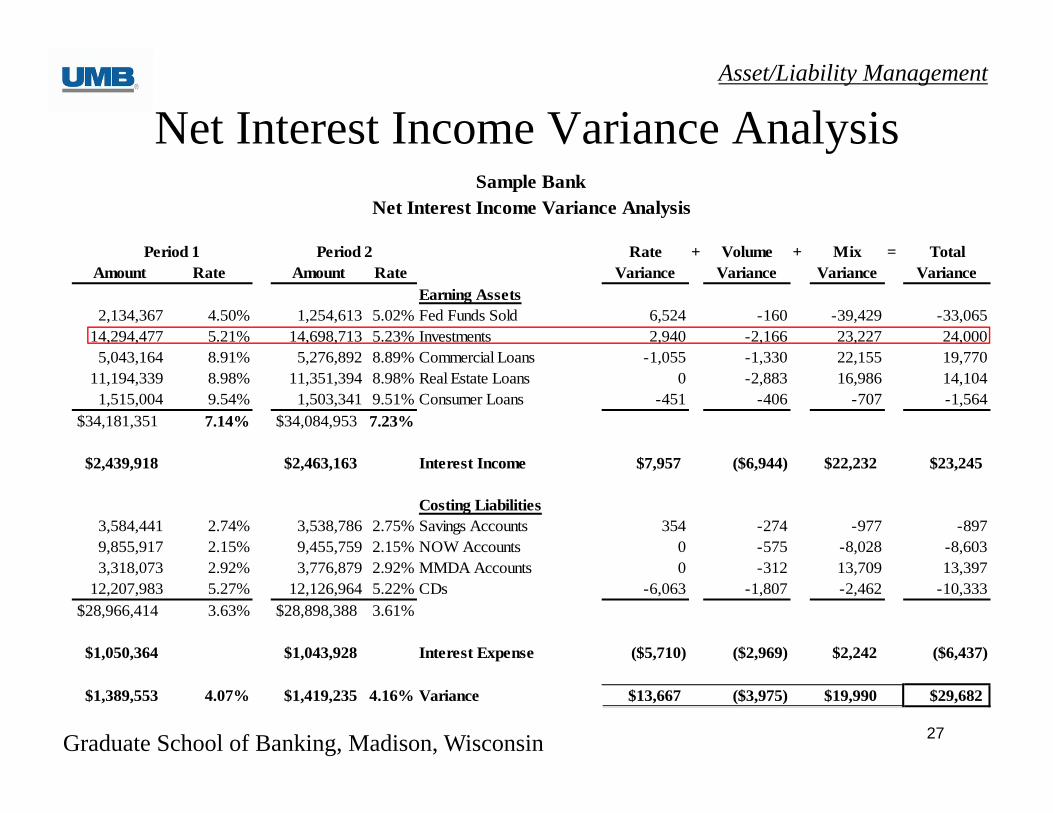
Net Interest Income Variance Analysis
Period 1 Period 2 Rate + Volume + Mix = TotalAmount Rate Amount Rate Variance Variance Variance Variance
Earning Assets2,134,367 4.50% 1,254,613 5.02% Fed Funds Sold 6,524 -160 -39,429 -33,065
14,294,477 5.21% 14,698,713 5.23% Investments 2,940 -2,166 23,227 24,0005,043,164 8.91% 5,276,892 8.89% Commercial Loans -1,055 -1,330 22,155 19,770
11,194,339 8.98% 11,351,394 8.98% Real Estate Loans 0 -2,883 16,986 14,1041,515,004 9.54% 1,503,341 9.51% Consumer Loans -451 -406 -707 -1,564
$34,181,351 7.14% $34,084,953 7.23%
$2,439,918 $2,463,163 Interest Income $7,957 ($6,944) $22,232 $23,245 Costing Liabilities
3,584,441 2.74% 3,538,786 2.75% Savings Accounts 354 -274 -977 -8979,855,917 2.15% 9,455,759 2.15% NOW Accounts 0 -575 -8,028 -8,6033,318,073 2.92% 3,776,879 2.92% MMDA Accounts 0 -312 13,709 13,397
12,207,983 5.27% 12,126,964 5.22% CDs -6,063 -1,807 -2,462 -10,333$28,966,414 3.63% $28,898,388 3.61%
$1,050,364 $1,043,928 Interest Expense ($5,710) ($2,969) $2,242 ($6,437)
$1,389,553 4.07% $1,419,235 4.16% Variance $13,667 ($3,975) $19,990 $29,682
Sample BankNet Interest Income Variance Analysis

Asset/Liability Management
Graduate School of Banking, Madison, Wisconsin 28
Case Study

Asset/Liability Management
Graduate School of Banking, Madison, Wisconsin 29
Year-to-Date -- Jun 2009 Year-to-Date -- Jun 2008AVG AVG VARIANCE ANALYSISRATE RATE
AVERAGE INTEREST EARNED/ AVERAGE INTEREST EARNED/ RATE BASIS VOLUME MIX TOTALASSETS: BALANCE INC/EXP PAID BALANCE INC/EXP PAID VARIANCE VARIANCE VARIANCE VARIANCE VARIANCE Net Loans 436,723 10,013 4.58% 405,634 11,702 5.74% (2,704) (70) 2,240 (1,154) (1,688) Total Investment Securities 446,703 7,048 3.51% 313,818 6,601 4.64% (2,278) (5) 1,634 1,095 447 Other Earning Assets 43,277 97 .57% 44,635 609 2.86% (489) (3) 103 (123) (512) Total Earning Assets 932,151 17,159 3.87% 768,882 18,912 5.12% (5,471) (78) 3,977 (182) (1,754) Int IncLIABILITIES: - - - - - - - - - Total Demand Deposits 235,101 - 189,917 - - - - - - Total Transaction Accounts 368,692 929 .51% 284,896 1,825 1.29% (1,317) (12) 396 38 (896) Total Time Deposits 148,622 1,714 2.33% 147,947 3,055 4.15% (1,336) (17) 537 (525) (1,341) Total Interest Bearing Deposits 517,314 2,643 1.03% 432,843 4,879 2.27% (2,652) (29) 933 (487) (2,236) Total Borrowings 150,951 197 .26% 137,335 1,627 2.38% (1,595) (10) 316 (141) (1,430) Total Interest Bearing Liabilities 668,265 2,841 .86% 570,178 6,507 2.29% (4,247) (39) 1,248 (628) (3,666) Int ExpInterest Income & Rate Earned 17,159 3.87% 18,912 5.12% - - - - - Interest Expense & Rate Paid 2,841 .86% 6,507 2.29% - - - - - Net Interest Income & Rate Spread 14,318 3.01% 12,406 2.83% (1,224) (39) 2,729 446 1,912 NIINet Interest Margin 3.25% 3.41%
Net Interest Income Variance Analysis
Asset/Liability Management
Graduate School of Banking, Madison, Wisconsin 30
Drivers of NII Observations• Fairly large negative rate variance during period of
declining rates becoming a drag on net interest income growth
• What does that indicate?• The bank has seen its spread widen but its net interest
margin decline• What explains this?• What does this indicate about this bank’s interest rate risk
exposure?• The bank’s volume variance offset the negative rate
variance due to significant asset growth, what happens if this growth slows and rates stay low?
• What levers remain for this bank to pull?

Asset/Liability Management
Graduate School of Banking, Madison, Wisconsin 31
Net Interest Income Variance Analysis$ In Thousands
Year-to-Date -- 2013 Year-to-Date -- 2012AVG AVG VARIANCE ANALYSIS
RATE RATEAVERAGE INTEREST EARNED/ AVERAGE INTEREST EARNED/ RATE VOLUME MIX TOTAL
ASSETS: BALANCE INC/EXP PAID BALANCE INC/EXP PAID VARIANCE VARIANCE VARIANCE VARIANCENet Loans 585,582 9,267 3.78% 502,719 9,023 4.26% (988) 1,078 154 244 Investment Securities 679,385 4,544 1.90% 611,730 4,839 2.22% (833) 591 (54) (295)Other Earning Assets #1 21,721 248 3.55% 16,896 211 3.77% (26) 30 32 36 Other Earning Assets #2 81,706 98 .29% 85,313 115 .32% 7 10 (34) (17) Total Earning Assets 1,376,012 14,156 2.64% 1,224,685 14,187 2.95% (1,839) 1,709 99 (31)LIABILITIES: - - - - - Total Demand Deposits 465,905 403,855 - - - - Total Rate Bearing Transaction Accts. 588,867 247 .10% 497,235 293 .14% (98) 38 14 (46)Total Time Deposits 112,048 357 .77% 133,181 505 .91% (68) 47 (127) (148)Total Int Bearing Deposits 700,915 603 .21% 630,417 798 .30% (167) 85 (113) (195)Total Borrowings 170,871 100 .14% 153,066 105 .17% (5) 12 (12) (5)Total Interest Bearing Liabilities 871,787 704 .20% 783,483 903 .28% (171) 96 (125) (200)
Interest Income & Rate Earned 14,156 2.64% 14,187 2.95%Interest Expense & Rate Paid 704 .20% 903 .28%Net Interest Income & Rate Spread 13,452 2.44% 13,284 2.67% (1,668) 1,613 223 168 Net Interest Margin 2.52% 2.77%

Asset/Liability Management
Graduate School of Banking, Madison, Wisconsin 32
Drivers of NII Observations• Bank continues to offset negative rate variance with
positive volume variance and positive mix variance• What constraints could this bank face in trying to continue
this strategy?• The bank is sacrificing net interest margin for net interest
income, what financial goals must be a priority (ROA vs. ROE vs. EPS)?
• As you survey the regulatory and competitive landscape what if anything concerns you about the bank’s funding base?
• What levers remain for this bank to pull?

Asset/Liability Management
Graduate School of Banking, Madison, Wisconsin 33
Tier One Leverage Ratio %
9.739.29
8.057.32
6.55 6.897.53
2007 2008 2009 2010 2011 2012 2013
Asset/Liability Management
Graduate School of Banking, Madison, Wisconsin 34
Drivers of NII Conclusions• Determine what has been driving net interest income• If rate variance has been positive, will likely be negative as rates
rise• Assess what levers exist to alter this• Assess likelihood of offsetting this negative rate variance through
growth or mix changes• If already highly loaned, assess likelihood of improving mix
variance on the liability side of the balance sheet• Assess the impact of any changes on the institution’s risk profile• Model forward results and load into simple comparison• Consider the potential impact of sustained high or low rate
environments
Asset/Liability Management
Graduate School of Banking, Madison, Wisconsin 35
Balance Sheet Optimization

Asset/Liability Management
Graduate School of Banking, Madison, Wisconsin 36
Yield on Earning Asset Differential Explained More by Earning Asset Mix Than Level of Loans vs. Investments
Peer Mix with Example Bank’sYields Increases YEA 1 bp
3.40%
2.87%
3.06%
3.23%
Peer Example Bank 90% of Peer 95% of Peer
Yield on Earning Assets Q1 2016
55%42%
3%
58%
37%
5%
Earning Asset MixOuter Ring Peer, Inner Example Bank
Total Loans Total Investments Other
4.20%
3.79% 3.78%
3.99%
Peer Example Bank 90% of Peer 95% of Peer
Loan Yield
51%
29%
3% 5% 4%8%
35%28%
18%14%
1%4%
Commercial CRE Consumer Consumer RE Credit Card HELOC
Loan Mix
Example Bank Peer

Asset/Liability Management
Graduate School of Banking, Madison, Wisconsin 37
Is the Bank’s Earning Asset Mix Optimized?Goal--Optimize or Maximize earning asset yield subject to:Macro Constraints:1. Overall Risk Weighted Asset ratio should be capped at current level of 72%2. Loan to deposit ratio capped at 75%
Micro Constraints:1. Total Taxable AFS portfolio floored at 22% of EA due to collateral needs2. HTM floored at 4% and capped at 7% of EA3. C&I floored at 18% of EA4. Cards capped at 3% of EA5. CLD held between 3% and 5% of EA6. HELOC held between 3% and 5% of EA7. 1-4 Family Mortgage capped at 20% of EA

Asset/Liability Management
Graduate School of Banking, Madison, Wisconsin 38
An Optimized Mix Would Require Less C&I/CRE & Much More in 1-4 Mortgage
Current OptimizedMix Mix
Comm, Fin, Agricul, and Leases 23% 18%Const, Land Dev, Oth Land Loan 3% 4%Home Equity 1‐4 Fam Rev Opn En 4% 3%Res Mtg Lns/1‐4Fm CL 1 Lie&Jr 3% 20%Loan Sec by Comml Real Estate 15% 13%Credit Card Loan & Oth Revolv 3% 3%Consumer Loans 0% 0%Factoring Loans 0% 1%Asset Based Loans 1% 2%Other Loans 1% 0%AFS Investments 38% 27%Industrial Revenue Bonds ‐ HTM 4% 7%Other Assets 5% 2%
RWA 72% 72%Yield on EA 2.86% 3.29%
% of EA
Asset/Liability Management
Graduate School of Banking, Madison, Wisconsin 39
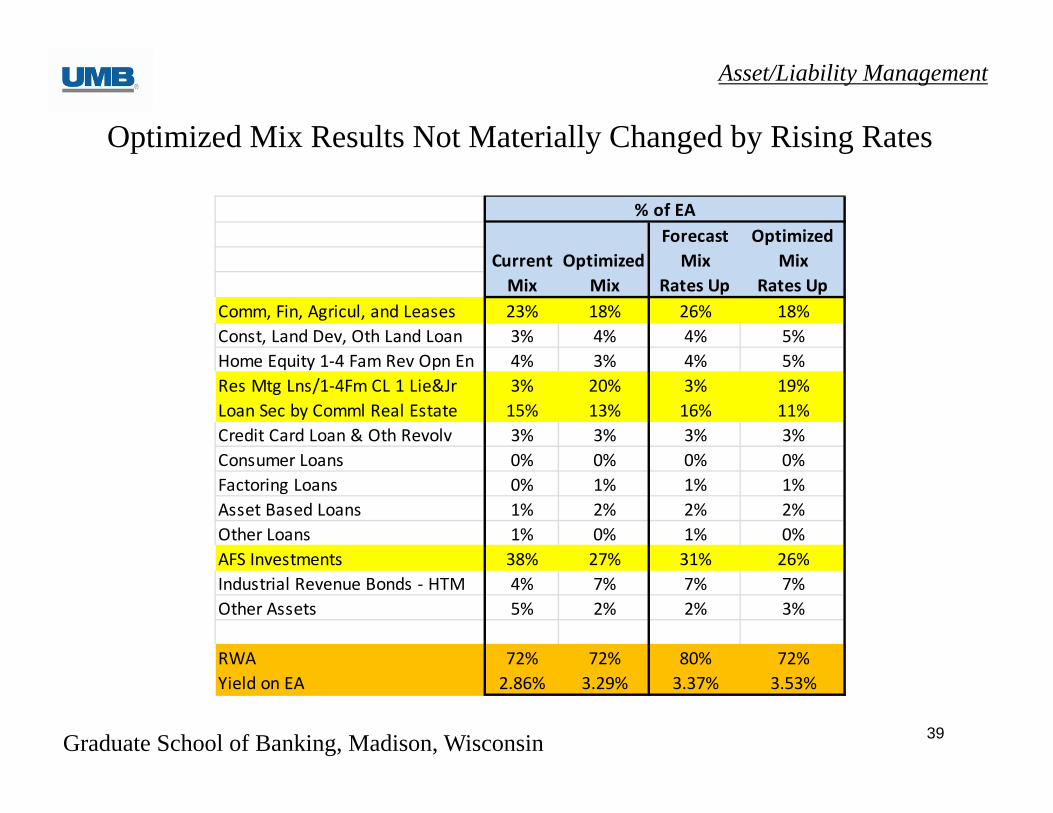
Optimized Mix Results Not Materially Changed by Rising Rates
Forecast OptimizedCurrent Optimized Mix MixMix Mix Rates Up Rates Up
Comm, Fin, Agricul, and Leases 23% 18% 26% 18%Const, Land Dev, Oth Land Loan 3% 4% 4% 5%Home Equity 1‐4 Fam Rev Opn En 4% 3% 4% 5%Res Mtg Lns/1‐4Fm CL 1 Lie&Jr 3% 20% 3% 19%Loan Sec by Comml Real Estate 15% 13% 16% 11%Credit Card Loan & Oth Revolv 3% 3% 3% 3%Consumer Loans 0% 0% 0% 0%Factoring Loans 0% 1% 1% 1%Asset Based Loans 1% 2% 2% 2%Other Loans 1% 0% 1% 0%AFS Investments 38% 27% 31% 26%Industrial Revenue Bonds ‐ HTM 4% 7% 7% 7%Other Assets 5% 2% 2% 3%
RWA 72% 72% 80% 72%Yield on EA 2.86% 3.29% 3.37% 3.53%
% of EA

Asset/Liability Management
Graduate School of Banking, Madison, Wisconsin 40
• An optimized earning asset mix would result in less C&I and CRE growth, and much larger growth in 1-4 Mortgages
• An optimized earning asset mix would result in a dramatic reduction in AFS bonds, largely used to fund 1-4 Mortgage growth
• An optimized earning asset mix would get the Example Bank to within 97% of peer average on Yield on EA as of Q1 2016
• An optimized earning asset mix could provide superior yields than the mix currently being forecast and at a lower RWA
• Rising rates do not dramatically change these conclusions• Optimization impact on overall interest rate risk profile should be assessed in ALM
model to gauge change to future sensitivity
Key Considerations

Asset/Liability Management
Graduate School of Banking, Madison, Wisconsin 41
Leverage Deployment

Asset/Liability Management
Graduate School of Banking, Madison, Wisconsin 42
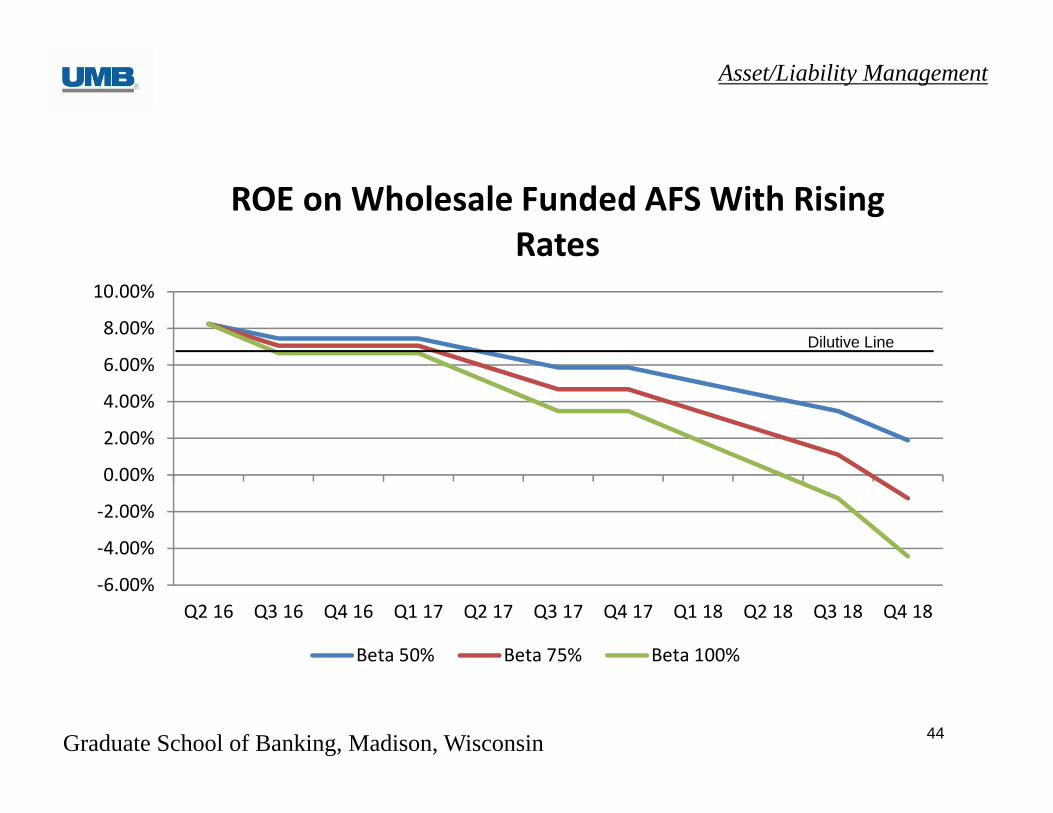
• Bank has utilized excess deposits to leverage capital by having balance sheet size in excess of budget
• Strategy has generated 1%+ ROA and 11%+ ROE to date• Funding position has changed so that now inflated balance sheet
funded with wholesale borrowings• Given likelihood of increasing interest rates, should leverage continue
to be deployed?
Background

Asset/Liability Management
Graduate School of Banking, Madison, Wisconsin 43
‐1.00%
‐0.50%
0.00%
0.50%
1.00%
1.50%
Q2 16 Q3 16 Q4 16 Q1 17 Q2 17 Q3 17 Q4 17 Q1 18 Q2 18 Q3 18 Q4 18
Spread on Wholesale Funded AFS With Rising Rates
Beta 50% Beta 75% Beta 100%
Asset/Liability Management
Graduate School of Banking, Madison, Wisconsin 44
‐6.00%
‐4.00%
‐2.00%
0.00%
2.00%
4.00%
6.00%
8.00%
10.00%
Q2 16 Q3 16 Q4 16 Q1 17 Q2 17 Q3 17 Q4 17 Q1 18 Q2 18 Q3 18 Q4 18
ROE on Wholesale Funded AFS With Rising Rates
Beta 50% Beta 75% Beta 100%
Dilutive Line
Asset/Liability Management
Graduate School of Banking, Madison, Wisconsin 45
• What is the impact of this leverage on overall interest rate risk profile?• What is the impact of this leverage on overall liquidity risk profile?• How would the bank minimize the risk of narrowing spreads becoming
negative?• What is missing from this analysis that could adversely impact the
indicated results?
Key Considerations
Asset/Liability Management
Graduate School of Banking, Madison, Wisconsin 46
Intersession Project Part 1
Analysis of Financial Performance

Asset/Liability Management
Graduate School of Banking, Madison, Wisconsin 47
Equity MultiplierTotal Assets 100,000,000$ Total Equity 8,000,000$ Equity Ratio 8%Equity Multiplier 12.5
Peer Total Assets 100%Peer Equity 8%Equity Multiplier 12.5
Asset/Liability Management
Graduate School of Banking, Madison, Wisconsin 48
Seven Steps to a Better ALCO

Asset/Liability Management
Graduate School of Banking, Madison, Wisconsin 49
Seven Steps to a Better ALCO• Step 1: Make your policies metric driven• Step 2: Get your membership right• Step 3: Focus your agenda on risk/return metrics
and action items• Step 4: Build meeting information around agenda• Step 5: Review Your Risk/Return Profile
--Is the bank measuring the opportunity cost of its current interest rate risk position?
• Step 6: Pricing methodologies should be robust and reflect metrics
• Step 7: Have action items--Meeting should not just be a history lesson

Asset/Liability Management
Graduate School of Banking, Madison, Wisconsin 50
Setting Limits
0.00%
0.20%
0.40%
0.60%
0.80%
1.00%
1.20%
‐
500
1,000
1,500
2,000
2,500
3,000
3,500
4,000
Base Case 20% NII Limits 0.80% ROA
Comparison of Base Case to Limit Methodologies
NII ROA
Base Case 20% NII LimitsMinimum .80%
ROA MetricTotal Assets 100,000,000 100,000,000 100,000,000 NII 3,500,000 2,800,000 3,192,308 NI 1,000,000 545,000 800,000 Tax Rate 35% 35% 35%ROA 1.00% 0.55% 0.80%
ROA metric requires NII limit of < 9%, not 10%-20%

Asset/Liability Management
Graduate School of Banking, Madison, Wisconsin 51
Expected Outcomes
• More engaged ALCO• Increased volume and quality of ideas• Greater strategic focus • Improved financial results

Asset/Liability Management
Graduate School of Banking, Madison, Wisconsin 52
Intersession Project Part 2
ALCO Responsibilities and Tools

Asset/Liability Management
Graduate School of Banking, Madison, Wisconsin 53
Conclusions• ALM’s primary responsibilities center on
• Net interest income and net interest margin • Rate, volume, mix
• Interest rate risk• Liquidity risk• Capital Management
• Levers—Pricing, Leverage, Mix Optimization, Interest Rate Risk, Liquidity Risk
• Understand the interest rate cycles and what the yield curve is saying
• Follow the 7 steps for an improved ALM process

Asset/Liability Management
Graduate School of Banking, Madison, Wisconsin 54
Questions?
Darren HerrmannExecutive Vice President & TreasurerUMB Financial [email protected]

Asset/Liability Management
Graduate School of Banking, Madison, Wisconsin 55
Appendix

Asset/Liability Management
Graduate School of Banking, Madison, Wisconsin 56
No Growth StrategyInterest Interest Interest
Balance Rate Expense Balance Rate Expense Balance Rate ExpenseMMDA 15,000,000 1.00% 150,000 15,000,000 1.50% 225,000 13,500,000 1.00% 135,000Wholesale Funding 1,500,000 1.71% 25,650Combined Position 15,000,000 1.00% 150,000 15,000,000 1.50% 225,000 15,000,000 1.07% 160,650
Marginal Cost Savings 64,350Marginal Cost Break Even 6.00%
Marginal Cost Analysis
Current Position Rates Up 50bp Match Rate Rates Up 50bp Don't Match Rate
Growth StrategyInterest Interest Interest
Balance Rate Expense Balance Rate Expense Balance Rate ExpenseExisting CDs 15,000,000 1.75% 262,500 14,000,000 1.75% 245,000 15,000,000 1.75% 262,500New Money 37 Month CD Special 1,000,000 3.25% 32,500Old Money 37 Month CD Special 1,000,000 3.25% 32,500Wholesale Funding 1,000,000 3.50% 35,000Combined Position 15,000,000 1.75% 262,500 16,000,000 1.94% 310,000 16,000,000 1.86% 297,500
Marginal Cost of Funds $ 47,500 35,000Marginal Cost of Funds Rate 4.75% 3.50%
Comments:75% new money assumption gets the special CD option down to a marginal cost of 3.75%.
Current Position Special Nets $2 Million 50/50 Split No Special, Fund Wholesale
Asset/Liability Management
Graduate School of Banking, Madison, Wisconsin 57
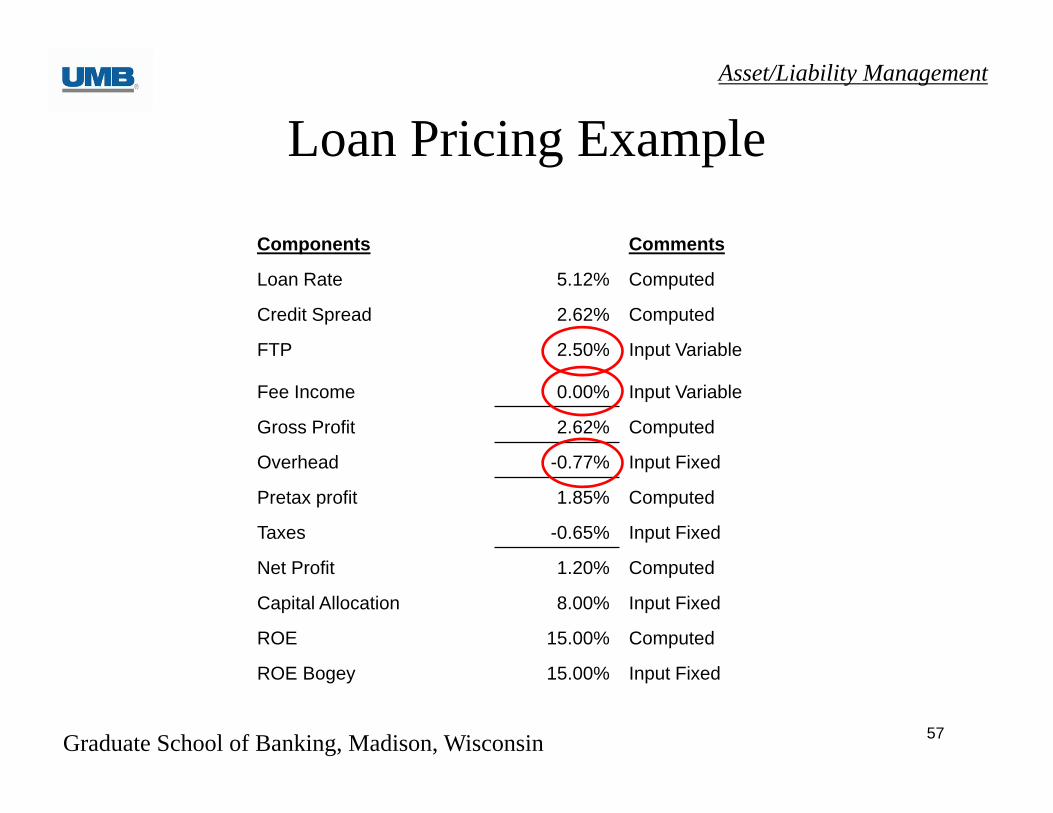
Loan Pricing Example
Components Comments
Loan Rate 5.12% Computed
Credit Spread 2.62% Computed
FTP 2.50% Input Variable
Fee Income 0.00% Input Variable
Gross Profit 2.62% Computed
Overhead -0.77% Input Fixed
Pretax profit 1.85% Computed
Taxes -0.65% Input Fixed
Net Profit 1.20% Computed
Capital Allocation 8.00% Input Fixed
ROE 15.00% Computed
ROE Bogey 15.00% Input Fixed
Asset/Liability Management
Graduate School of Banking, Madison, Wisconsin 58
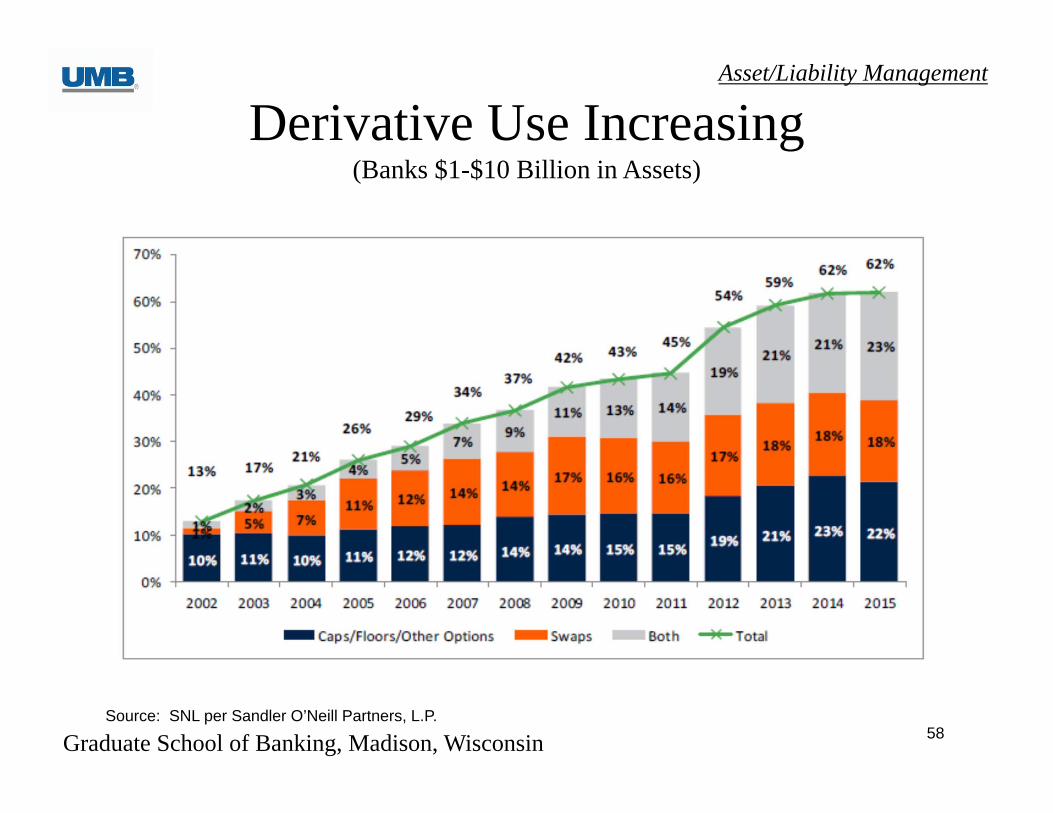
Derivative Use Increasing(Banks $1-$10 Billion in Assets)
Source: SNL per Sandler O’Neill Partners, L.P.