asset management answering the 5 core...
TRANSCRIPT
Powerpoint TemplatesPage 1
Powerpoint Templates
Asset ManagementAnswering the 5 Core Questions
by Timothy Taber, PEBarton & Loguidice
Powerpoint TemplatesPage 2
Agenda
Asset Management Case Study
1. What is the current state of my assets?
2. What is my required “sustainable” level of service?
3. Which assets are critical to sustained performance?
4. What are my minimum life cycle costs?
5. What is my best long-term funding strategy?

Powerpoint TemplatesPage 3
Question #1
What is the current state of my assets?
• What do I own?
• Where is it?
• What condition is it in?
• What is its remaining useful life?
• What is its remaining economic value?
Powerpoint TemplatesPage 4
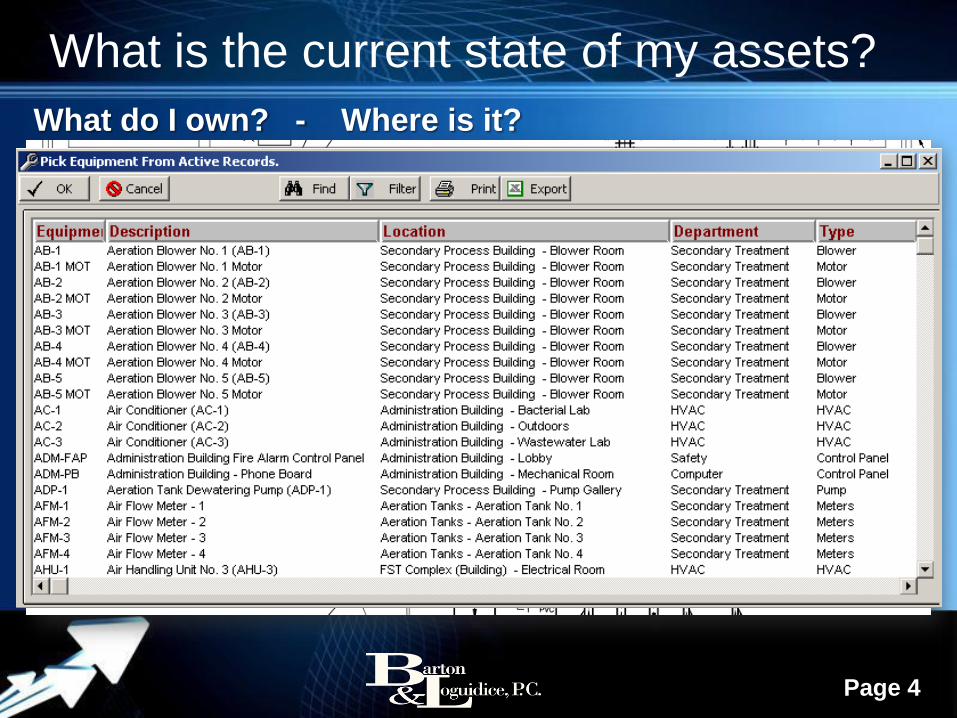
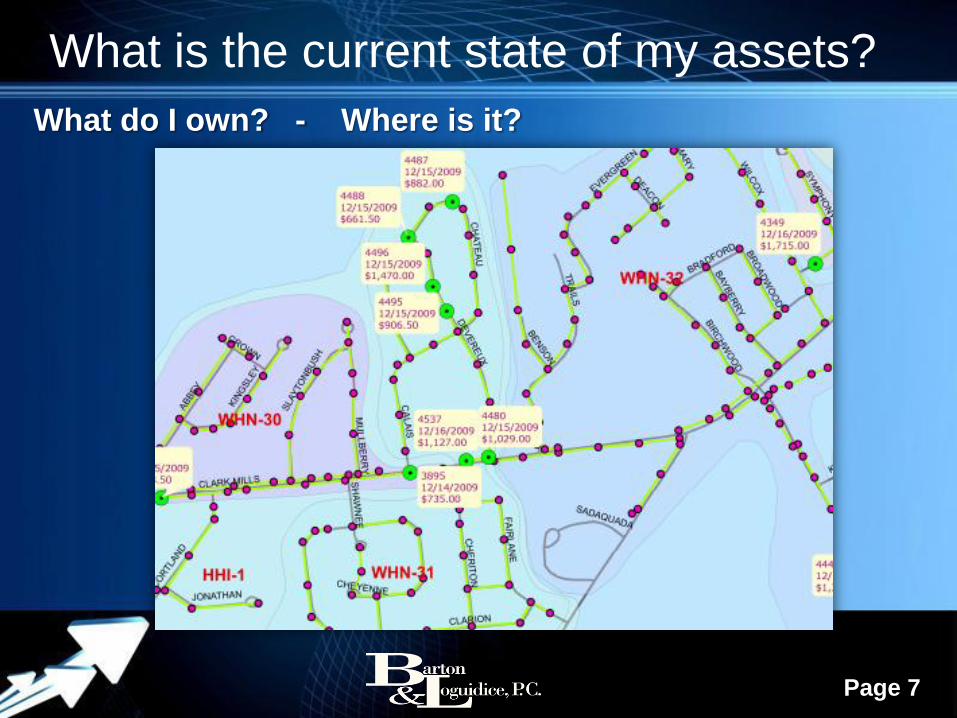
What is the current state of my assets?
What do I own? - Where is it?

Powerpoint TemplatesPage 5
Information needed on my assets?Information for Asset Management
Consequence of
Failure
Current Condition
% Redundancy
Installation Date
Expected Life
Replacement Cost
Powerpoint TemplatesPage 6
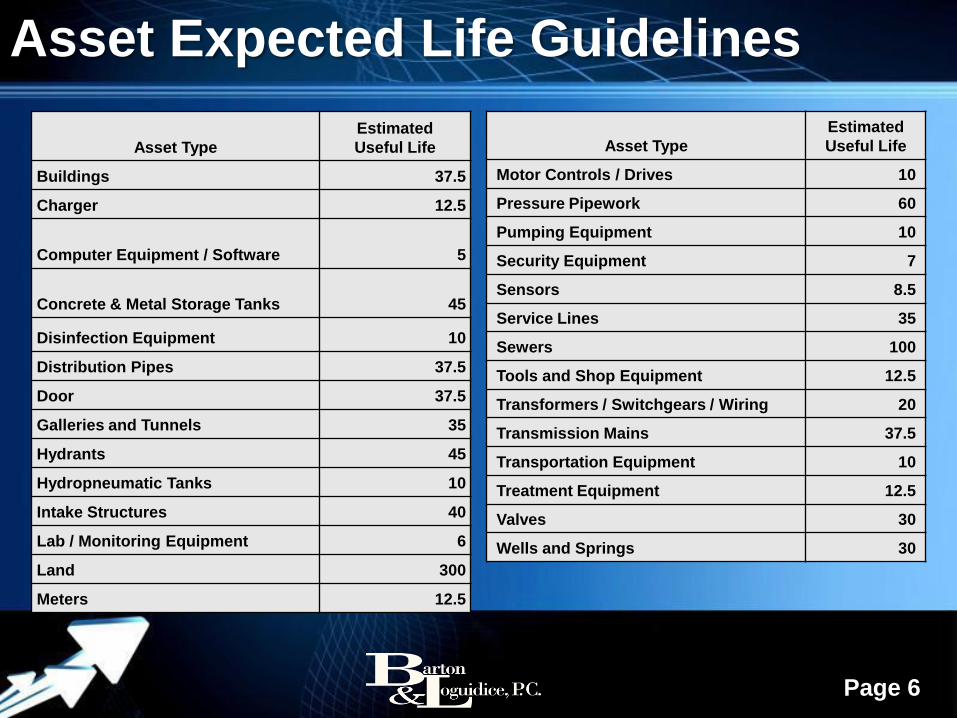
Asset Expected Life Guidelines
Asset Type
Estimated
Useful Life
Buildings 37.5
Charger 12.5
Computer Equipment / Software 5
Concrete & Metal Storage Tanks 45
Disinfection Equipment 10
Distribution Pipes 37.5
Door 37.5
Galleries and Tunnels 35
Hydrants 45
Hydropneumatic Tanks 10
Intake Structures 40
Lab / Monitoring Equipment 6
Land 300
Meters 12.5
Asset Type
Estimated
Useful Life
Motor Controls / Drives 10
Pressure Pipework 60
Pumping Equipment 10
Security Equipment 7
Sensors 8.5
Service Lines 35
Sewers 100
Tools and Shop Equipment 12.5
Transformers / Switchgears / Wiring 20
Transmission Mains 37.5
Transportation Equipment 10
Treatment Equipment 12.5
Valves 30
Wells and Springs 30
Powerpoint TemplatesPage 7
What is the current state of my assets?
What do I own? - Where is it?

Powerpoint TemplatesPage 8
What is the current state of my assets?
What condition is it in?
Powerpoint TemplatesPage 9
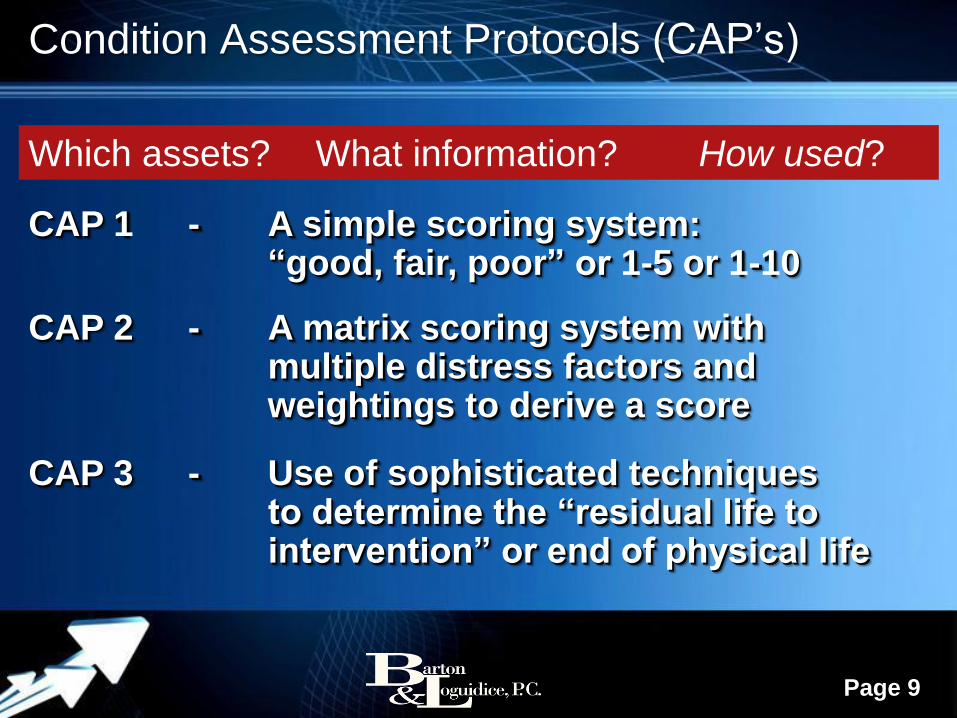
Condition Assessment Protocols (CAP’s)
CAP 1 - A simple scoring system:“good, fair, poor” or 1-5 or 1-10
CAP 2 - A matrix scoring system withmultiple distress factors and weightings to derive a score
CAP 3 - Use of sophisticated techniquesto determine the “residual life to intervention” or end of physical life
Which assets? What information? How used?

Powerpoint TemplatesPage 10
What is the current state of my assets?What is its remaining useful life?
Powerpoint TemplatesPage 11
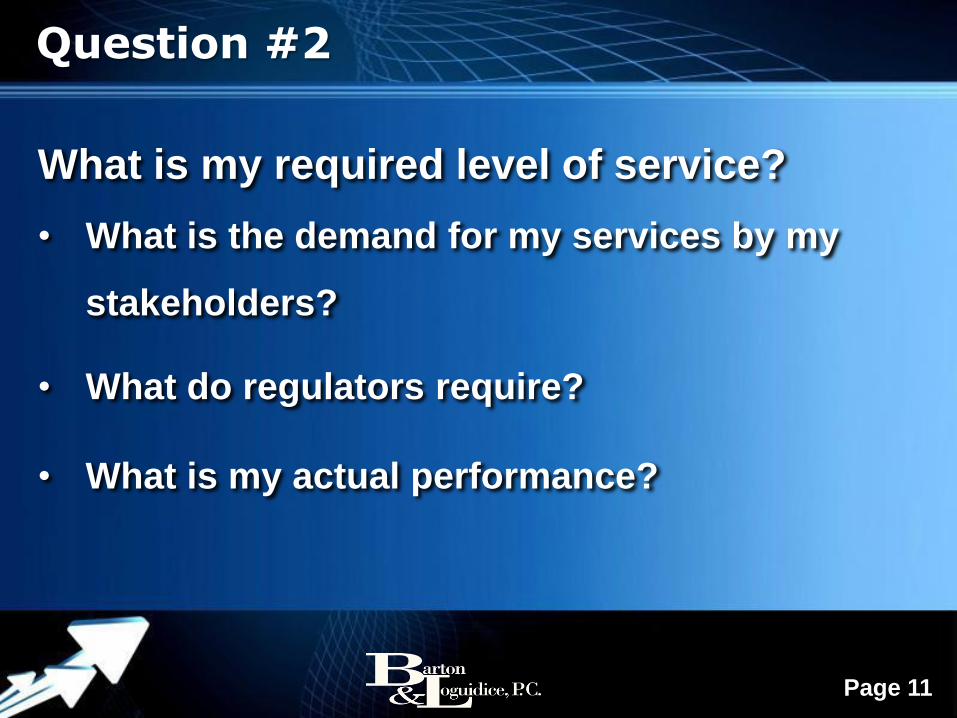
Question #2
What is my required level of service?
• What is the demand for my services by my
stakeholders?
• What do regulators require?
• What is my actual performance?
Powerpoint TemplatesPage 12
12
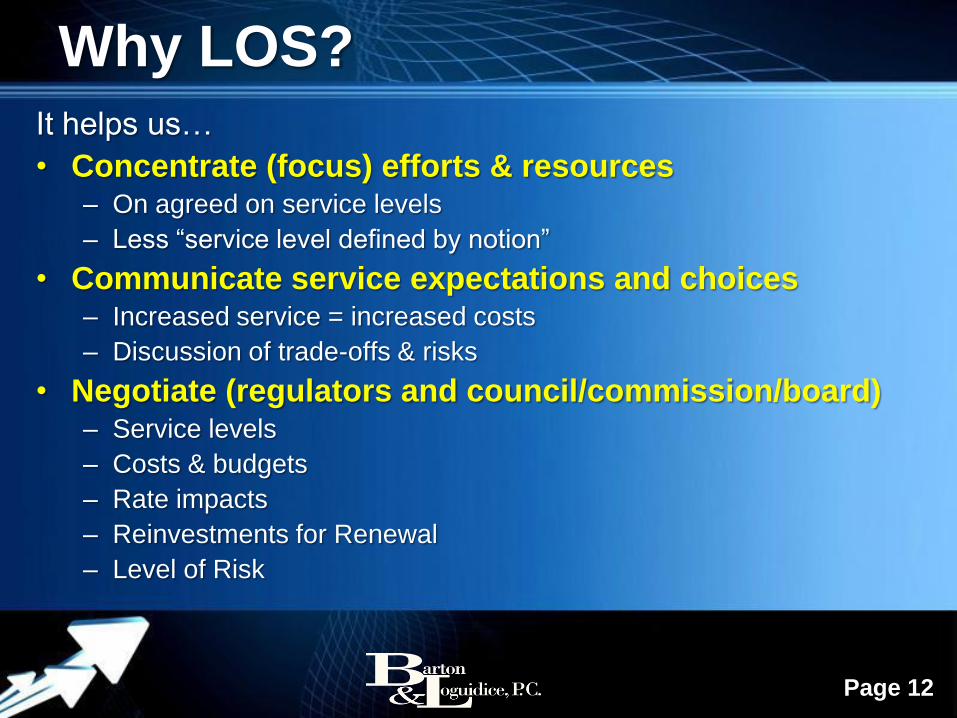
Why LOS?It helps us…
• Concentrate (focus) efforts & resources– On agreed on service levels
– Less “service level defined by notion”
• Communicate service expectations and choices– Increased service = increased costs
– Discussion of trade-offs & risks
• Negotiate (regulators and council/commission/board)– Service levels
– Costs & budgets
– Rate impacts
– Reinvestments for Renewal
– Level of Risk
Powerpoint TemplatesPage 13
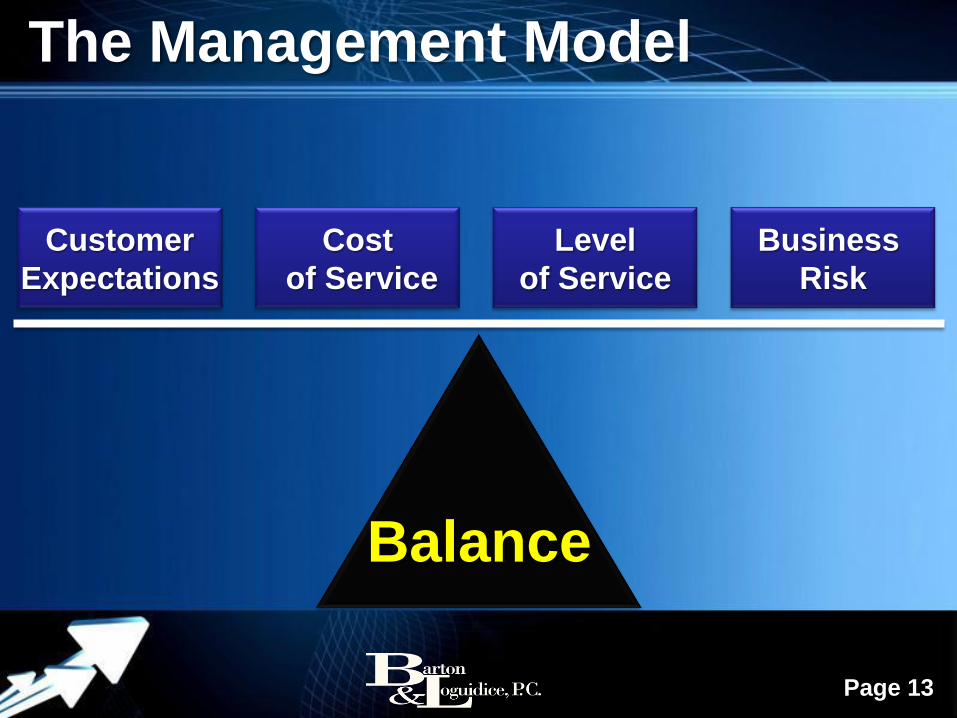
Copyright ©
Balance
Customer
Expectations
Cost
of Service
Level
of Service
Business
Risk
The Management Model
Powerpoint TemplatesPage 14
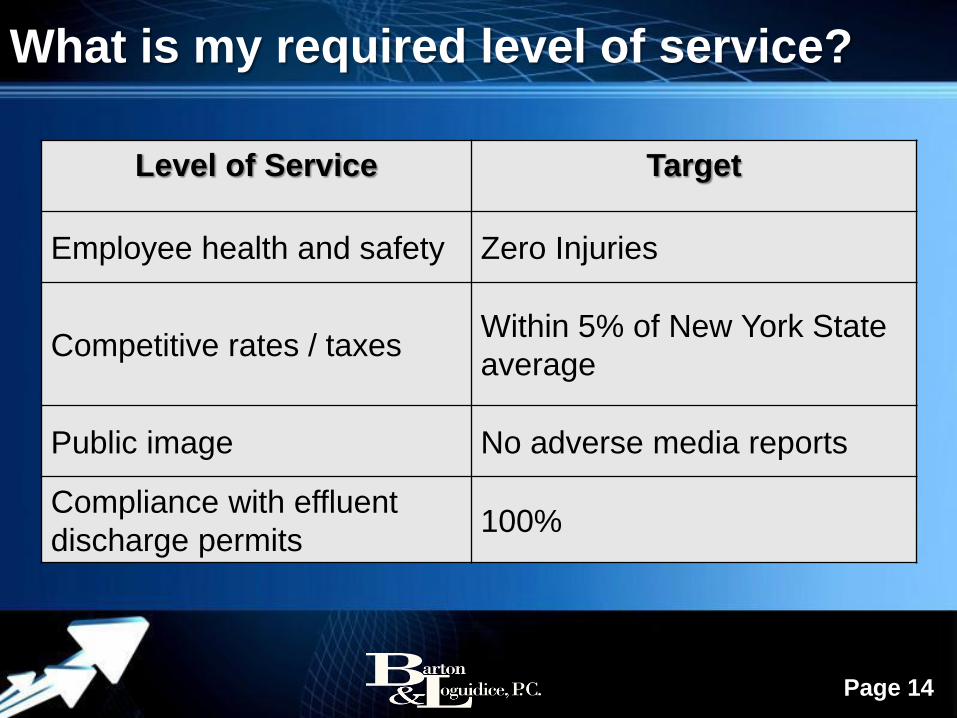
What is my required level of service?
Level of Service Target
Employee health and safety Zero Injuries
Competitive rates / taxesWithin 5% of New York State
average
Public image No adverse media reports
Compliance with effluent
discharge permits100%
Powerpoint TemplatesPage 15
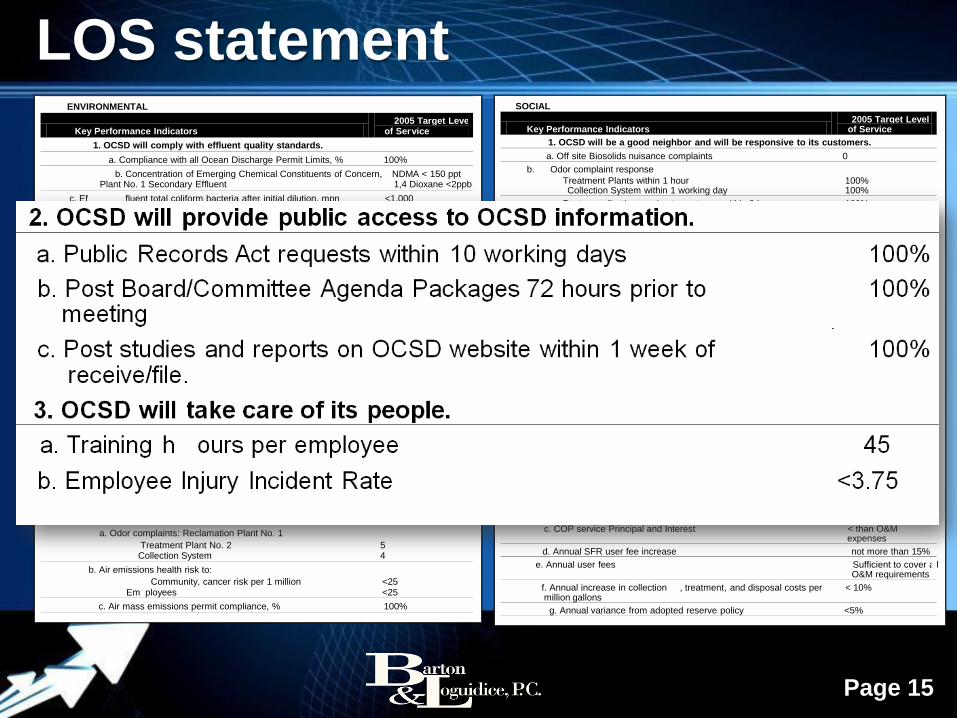
LOS statementENVIRONMENTAL
Key Performance Indicators2005 Target Level
of Service
1. OCSD will comply with effluent quality standards.
a. Compliance with all Ocean Discharge Permit Limits, % 100%
b. Concentration of Emerging Chemical Constituents of Concern, Plant No. 1 Secondary Effluent
NDMA < 150 ppt1,4 Dioxane <2ppb
c. Ef fluent total coliform bacteria after initial dilution, mpn <1,000
d. Source Control permitee compliance with permit conditions, percent
>90%
2. OCSD will manage flows reliably.
a. Frequency of use of emergency 1- mile outfall 0 per year during dry weather
< once per 3 years in peak wet weather
b. Sanitary sewer spills per 100 miles < 2.1
c. Contain sanitary sewer spills within 5 hours 100%
3. OCSD’s effluent will be recycled.
a. Treated effluent reclaimed, % (flow) 4% (10 mgd)
4. OCSD will impleme nt a sustainable biosolids management program.
a. National Biosolids Program Certification for Environmental Management System
Maintain
b. Percent of biosolids beneficial reuse
Class "B"Class "A/EQ"
100%
40%60%
5. OCSD will improve the regional watershed.
a. Dry weather urban runoff collected and treated 4 mgd
b. Rainfall induced inflow and infiltration, wet weather peak factor<2.2
c. Stormwater management, % of treatment process area runoff treated on- site
100%
d. Per capital wastewater flo w rate, gallons per person per day <105
6. OCSD will protect the air environment.
a. Odor complaints: Reclamation Plant No. 1
Treatment Plant No. 2Collection System
54
b. Air emissions health risk to:
Community, cancer risk per 1 millionEm ployees
<25<25
c. Air mass emissions permit compliance, % 100%
SOCIAL
Key Performance Indicators2005 Target Level
of Service
1. OCSD will be a good neighbor and will be responsive to its customers.
a. Off site Biosolids nuisance complaints 0
b. Odor complaint response
Treatment Plants within 1 hourCollection System within 1 working day
100%100%
c. Restore collection service to customer within 8 hours 100%
d. Respond to public complaints or inquiries regarding construction projects within 1 working day
>90%
e. Respond to collection system spills within 1 hour 100%
f. New connection permits processed within one working day >90%
g. Dig Alert response within 48 hours 100%
2. OCSD will provide public access to OCSD information.
a. Public Records Act requests within 10 working days 100%
b. Post Board/Committee Agenda Packages 72 hours prior to meeting
100%
c. Post studies and reports on OCSD website within 1 week of receive/file.
100%
3. OCSD will take care of its people.
a. Training h ours per employee 45
b. Employee Injury Incident Rate <3.75
ECONOMIC
Key Performance Indicators2005 Target Level
of Service
1. OCSD will exercise sound financial management.
a. New borrowing Not more than annual Capital Improvement Program requirements
b. COP coverage ratio Between 1.25 and 2.0
c. COP service Principal and Interest < than O&M expenses
d. Annual SFR user fee increase not more than 15%
e. Annual user fees Sufficient to cover all O&M requirements
f. Annual increase in collection , treatment, and disposal costs per million gallons
< 10%
g. Annual variance from adopted reserve policy <5%

Powerpoint TemplatesPage 16
Question #3
Which assets are critical to sustained
performance?
• How does it fail? How can it fail?
• What is the likelihood of failure?
• What does it cost to repair?
• What are the consequences of failure?
RISK
Powerpoint TemplatesPage 17
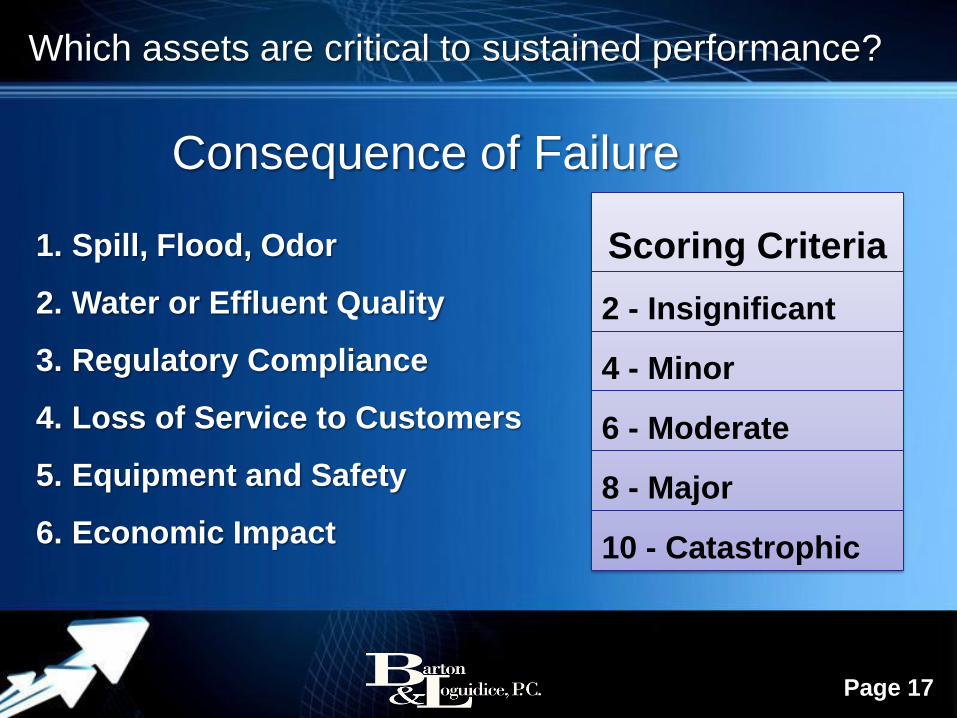
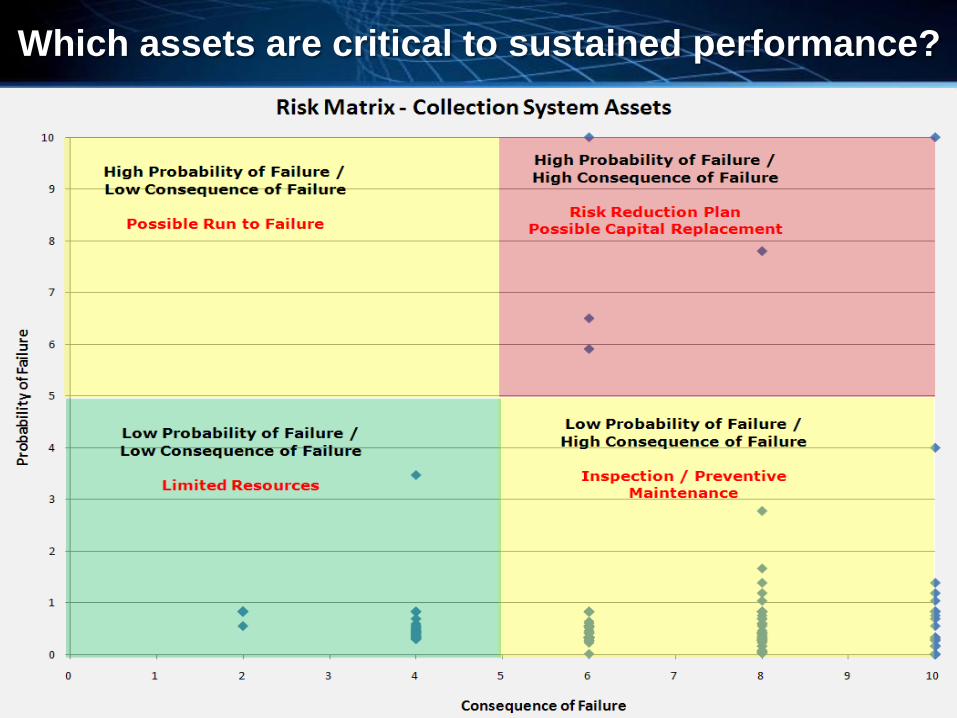
Which assets are critical to sustained performance?
1. Spill, Flood, Odor
2. Water or Effluent Quality
3. Regulatory Compliance
4. Loss of Service to Customers
5. Equipment and Safety
6. Economic Impact
Scoring Criteria
2 - Insignificant
4 - Minor
6 - Moderate
8 - Major
10 - Catastrophic
Consequence of Failure

Powerpoint TemplatesPage 18
Which assets are critical to sustained performance?
Probability of Failure
Probability that the asset will fail
(no longer perform its function) in a given year.
Probability of Failure = ((Estimated Useful Life – Remaining Useful
Life) / Estimated Useful Life) * (1 – Redundancy Factor) * 10
Powerpoint TemplatesPage 19
Which assets are critical to sustained performance?

Powerpoint TemplatesPage 20
Four Major Failure Modes
Failure Mode Definition Tactical AspectsManagement
Strategy
CapacityVolume of demand
exceeds design capacity
Growth, system
expansionRedesign
Level of
ServiceFunctional requirements
exceed design capacity
Codes & permits:
NPDES, CSOs, OSHA,
noise, odor, life safety;
service, etc.
O&M
optimization,
renewal
MortalityConsumption of asset
reduces performance
below acceptable level
Physical deterioration
due to age, usage
(including operator
error), acts of nature
O&M
optimization,
renewal
Financial
Efficiency
Operations costs exceed
that of feasible
alternatives
Pay-back period Replace
Powerpoint TemplatesPage 21
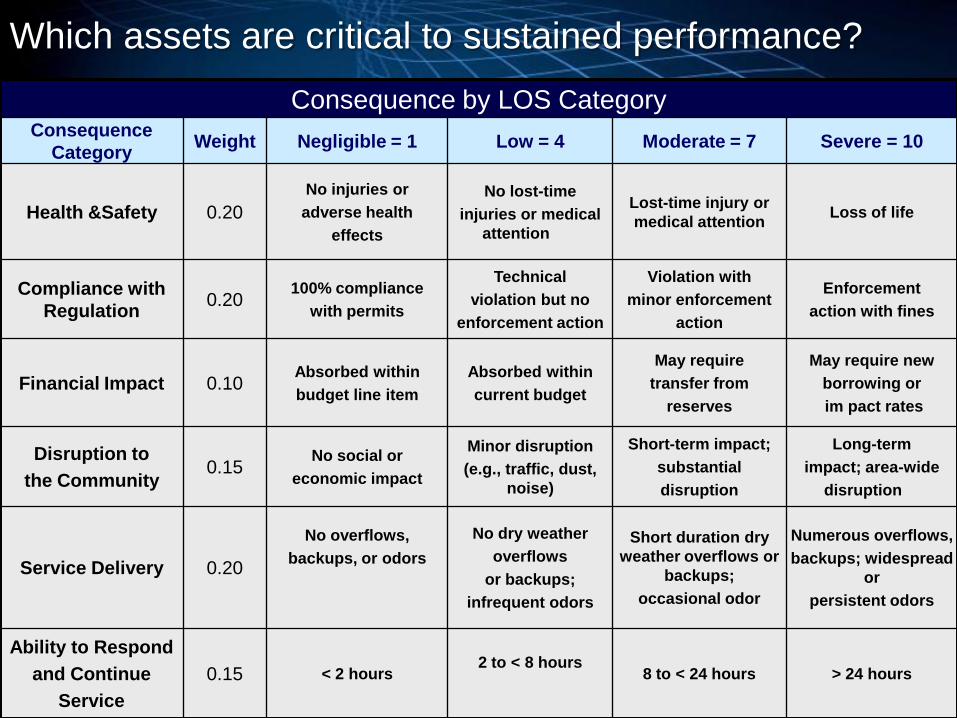
Which assets are critical to sustained performance?
Consequence by LOS CategoryConsequence
CategoryWeight Negligible = 1 Low = 4 Moderate = 7 Severe = 10
Health &Safety 0.20
No injuries or
adverse health
effects
No lost-time
injuries or medical
attention
Lost-time injury or
medical attentionLoss of life
Compliance with
Regulation 0.20
100% compliance
with permits
Technical
violation but no
enforcement action
Violation with
minor enforcement
action
Enforcement
action with fines
Financial Impact 0.10Absorbed within
budget line item
Absorbed within
current budget
May require
transfer from
reserves
May require new
borrowing or
im pact rates
Disruption to
the Community 0.15
No social or
economic impact
Minor disruption
(e.g., traffic, dust,
noise)
Short-term impact;
substantial
disruption
Long-term
impact; area-wide
disruption
Service Delivery 0.20
No overflows,
backups, or odors
No dry weather
overflows
or backups;
infrequent odors
Short duration dry
weather overflows or
backups;
occasional odor
Numerous overflows,
backups; widespread
or
persistent odors
Ability to Respond
and Continue
Service
0.15 < 2 hours2 to < 8 hours
8 to < 24 hours > 24 hours
Powerpoint TemplatesPage 22
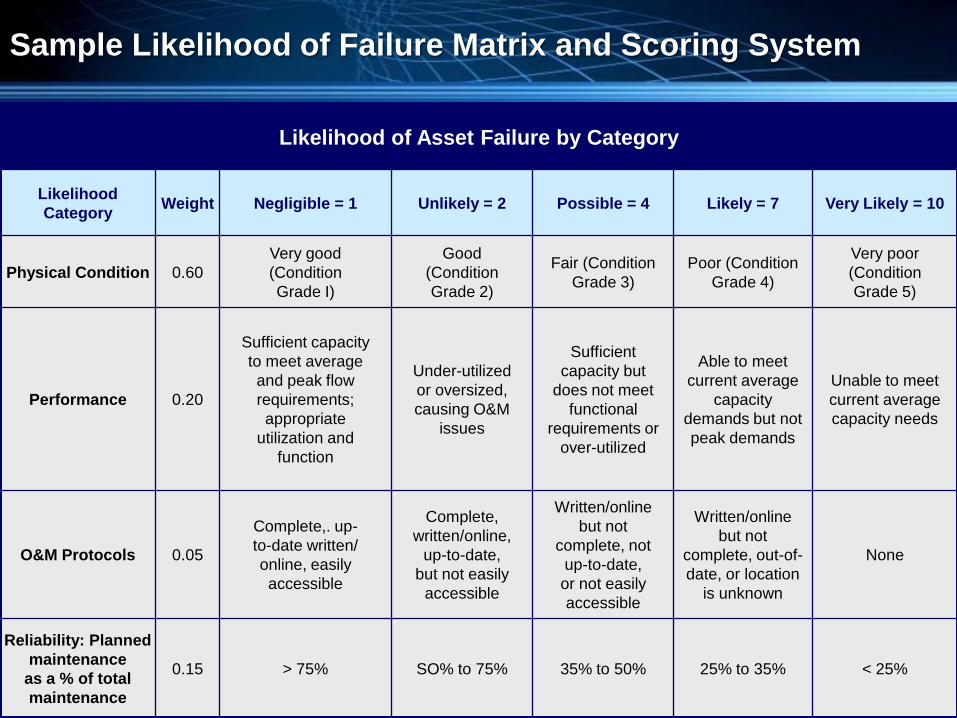
Sample Likelihood of Failure Matrix and Scoring System
Likelihood of Asset Failure by Category
Likelihood
CategoryWeight Negligible = 1 Unlikely = 2 Possible = 4 Likely = 7 Very Likely = 10
Physical Condition 0.60
Very good
(Condition
Grade I)
Good
(Condition
Grade 2)
Fair (Condition
Grade 3)
Poor (Condition
Grade 4)
Very poor
(Condition
Grade 5)
Performance 0.20
Sufficient capacity
to meet average
and peak flow
requirements;
appropriate
utilization and
function
Under-utilized
or oversized,
causing O&M
issues
Sufficient
capacity but
does not meet
functional
requirements or
over-utilized
Able to meet
current average
capacity
demands but not
peak demands
Unable to meet
current average
capacity needs
O&M Protocols 0.05
Complete,. up-
to-date written/
online, easily
accessible
Complete,
written/online,
up-to-date,
but not easily
accessible
Written/online
but not
complete, not
up-to-date,
or not easily
accessible
Written/online
but not
complete, out-of-
date, or location
is unknown
None
Reliability: Planned
maintenance
as a % of total
maintenance
0.15 > 75% SO% to 75% 35% to 50% 25% to 35% < 25%
Powerpoint TemplatesPage 23
Question #4
What are my best O&M and CIP investment
strategies?
• What alternative management options
exist?
• Which are the most feasible for my
organization?

Powerpoint TemplatesPage 24
Yes
No
Yes
Yes
Consider
usage-based
maintenance (UBM)
Test proactive
maintenance
Consider
condition-based
maintenance (CBM)
Consider run-to-
failure with planned
corrective failure
response
No
No
Based on
condition?
Cost effective?
Is failure
predictable
Yes
Based on
usage?
Cost effective?
Is failure
preventable
YesIs failure
preventable
Yes
Yes
No
No
No
Determine Proactive Maintenance Strategy
No
Powerpoint TemplatesPage 25
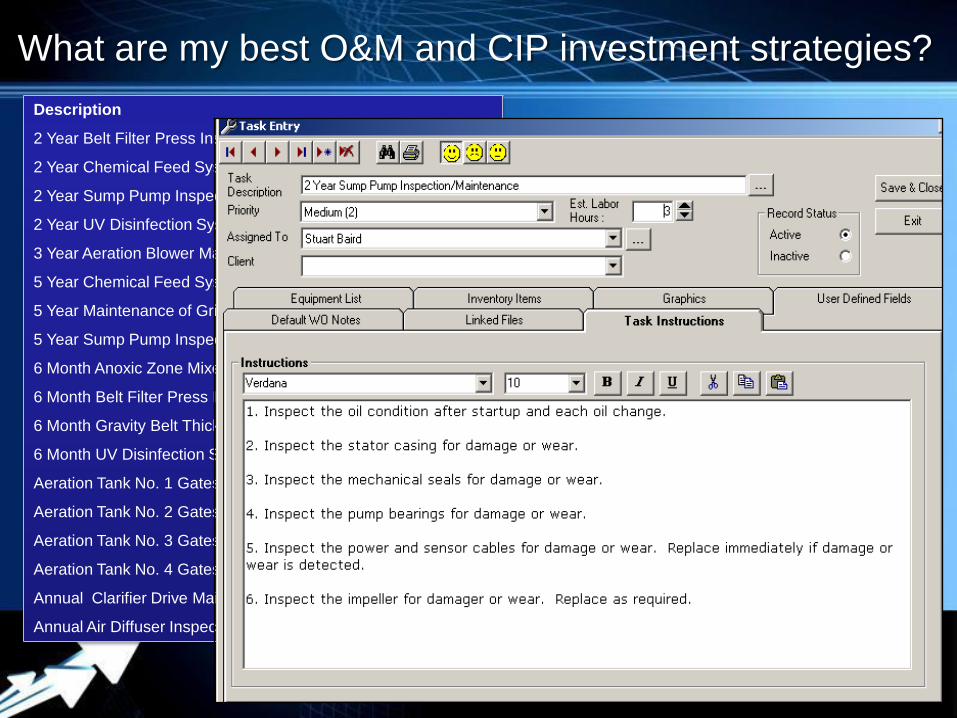
What are my best O&M and CIP investment strategies?
Description
2 Year Belt Filter Press Inspection/Maintenance
2 Year Chemical Feed System Maintenance
2 Year Sump Pump Inspection/Maintenance
2 Year UV Disinfection System Maintenance
3 Year Aeration Blower Maintenance
5 Year Chemical Feed System Maintenance
5 Year Maintenance of Grit Classifier
5 Year Sump Pump Inspection/Maintenance
6 Month Anoxic Zone Mixer Maintenance/Inspection
6 Month Belt Filter Press Inspection/Maintenance
6 Month Gravity Belt Thickener Inspection/Maintenance
6 Month UV Disinfection System Inspection/Maintenance
Aeration Tank No. 1 Gates - 6 Month Inspection / Maintenance
Aeration Tank No. 2 Gates - 6 Month Inspection / Maintenance
Aeration Tank No. 3 Gates - 6 Month Inspection / Maintenance
Aeration Tank No. 4 Gates - 6 Month Inspection / Maintenance
Annual Clarifier Drive Maintenance
Annual Air Diffuser Inspection/Maintenance

Powerpoint TemplatesPage 26
What are my best O&M and CIP investment
strategies?

Powerpoint TemplatesPage 27
What are my best O&M and CIP investment strategies?
1. Capital rehabilitation
2. Capital replacement
3. Changes to operating procedures
4. Changes to maintenance procedures
5. Demand management
6. Reduction of level(s) of service
7. Improvement in response or recovery
Risk Reduction Opportunities

Powerpoint TemplatesPage 28
28
Total Projected CostsOCSD Expenditure - Total Future Predicted Cash Flows
0
100
200
300
400
500
600
2006
2009
2012
2015
2018
2021
2024
2027
2030
2033
2036
2039
2042
2045
2048
2051
2054
2057
2060
2063
2066
2069
2072
2075
2078
2081
2084
2087
2090
2093
2096
2099
2102
2105
Year
Ex
pe
nd
itu
re -
$M
(C
urr
en
t D
olla
rs)
0
2,000
4,000
6,000
8,000
10,000
12,000
As
se
t V
alu
es
- $
M
CIP Existing - Current ProgramCIP New - Future GrowthCIP New - Future Levels of ServiceCIP - Future Rehab and Replace (New Levels of Service / Growth)CIP - Future Rehab and Replace (Plants)CIP - Future Rehab and Replace (Collections)Operations (Operations)Operations (Maintenance)Operations (Overhead)Book ValueReplace ValueAverage Expenditure
Powerpoint TemplatesPage 29
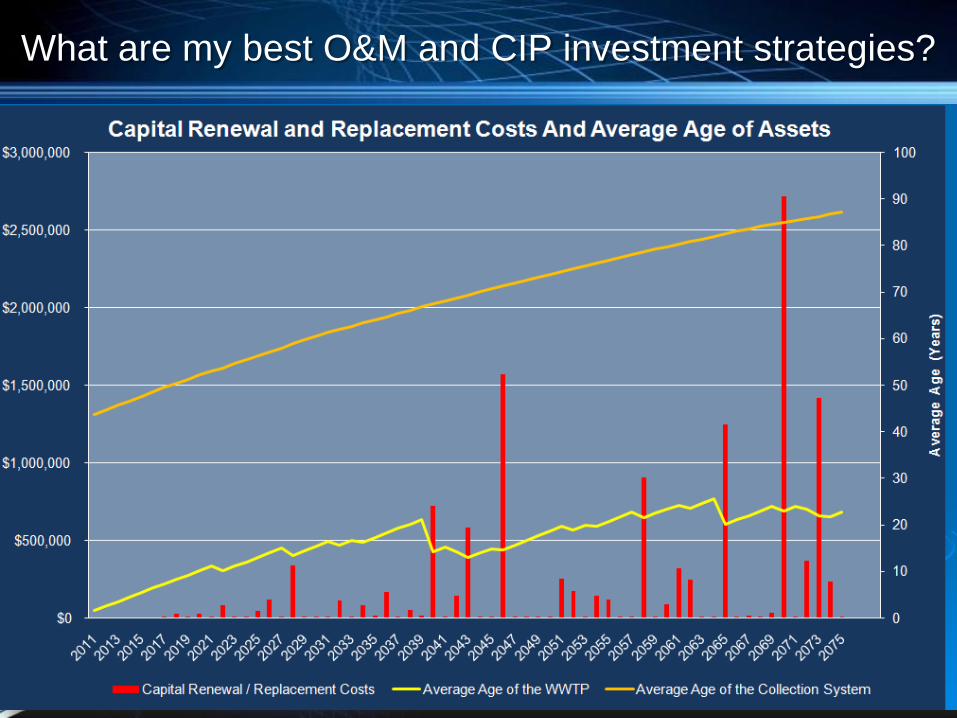
What are my best O&M and CIP investment strategies?
Powerpoint TemplatesPage 30
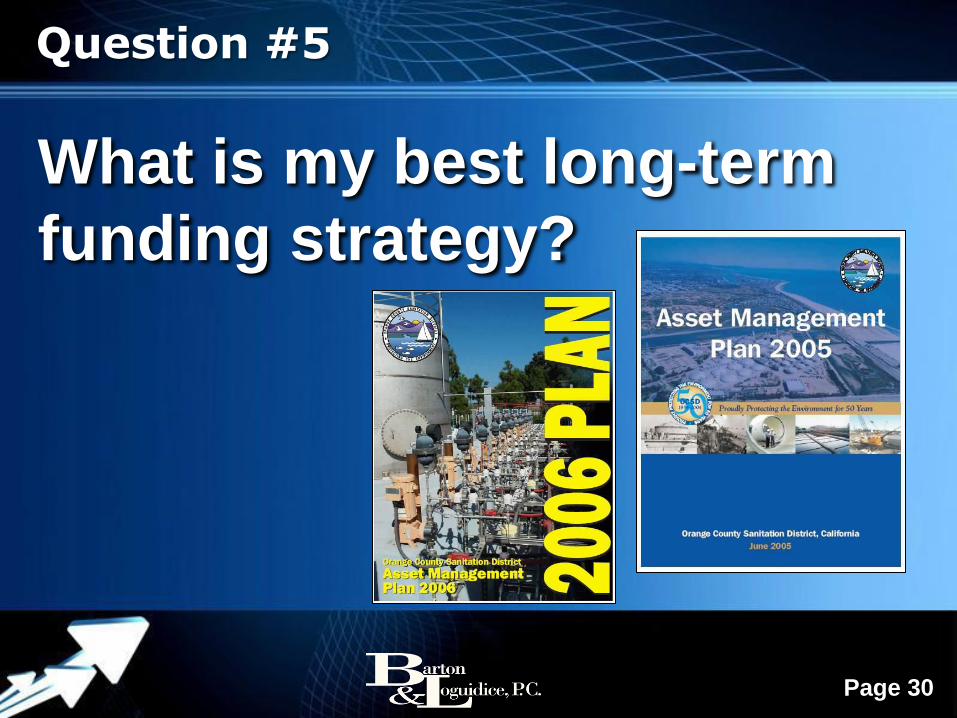
Question #5
What is my best long-term
funding strategy?

Powerpoint TemplatesPage 31
What is my best long-term funding strategy?
Powerpoint TemplatesPage 32
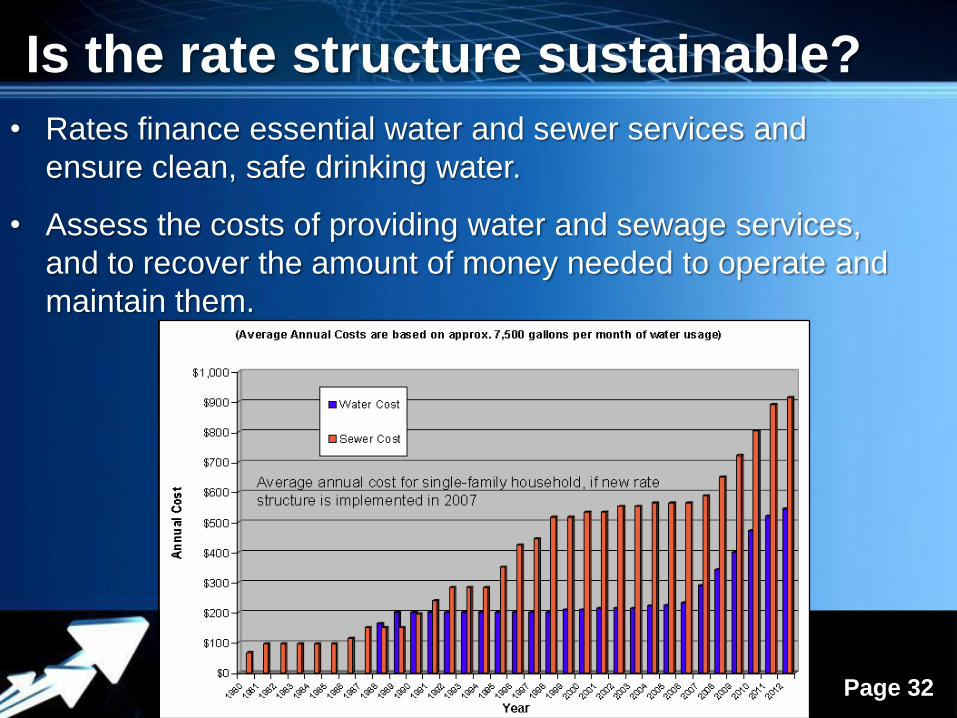
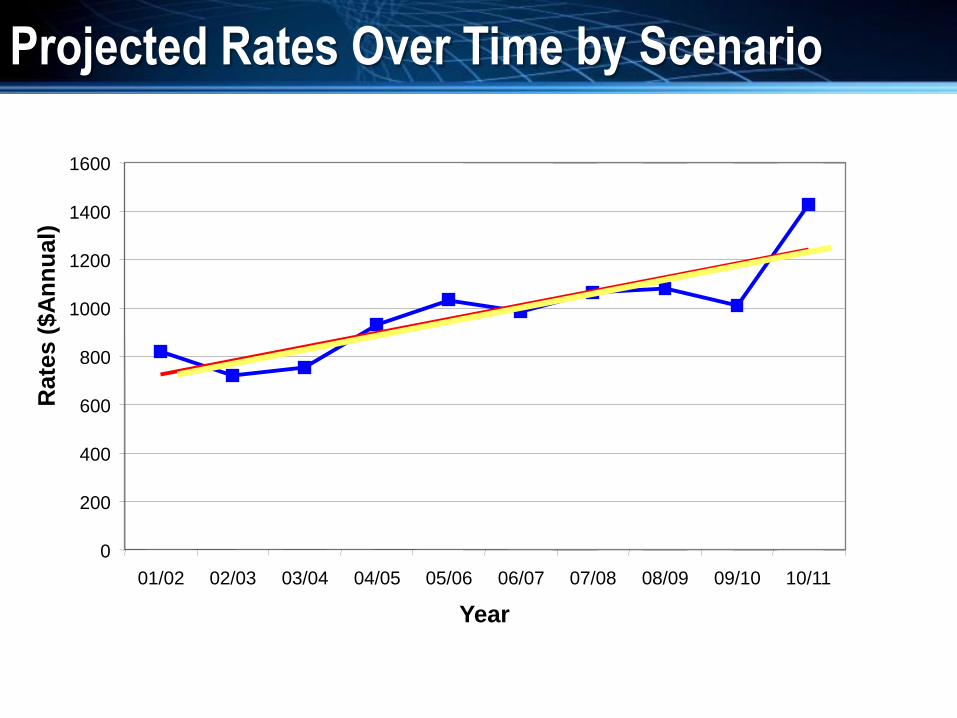
Is the rate structure sustainable?
• Rates finance essential water and sewer services and
ensure clean, safe drinking water.
• Assess the costs of providing water and sewage services,
and to recover the amount of money needed to operate and
maintain them.
Powerpoint TemplatesPage 33
33
0
200
400
600
800
1000
1200
1400
1600
01/02 02/03 03/04 04/05 05/06 06/07 07/08 08/09 09/10 10/11
Year
Rate
s (
$A
nn
ual)
Projected Rates Over Time by Scenario
Powerpoint TemplatesPage 34
34
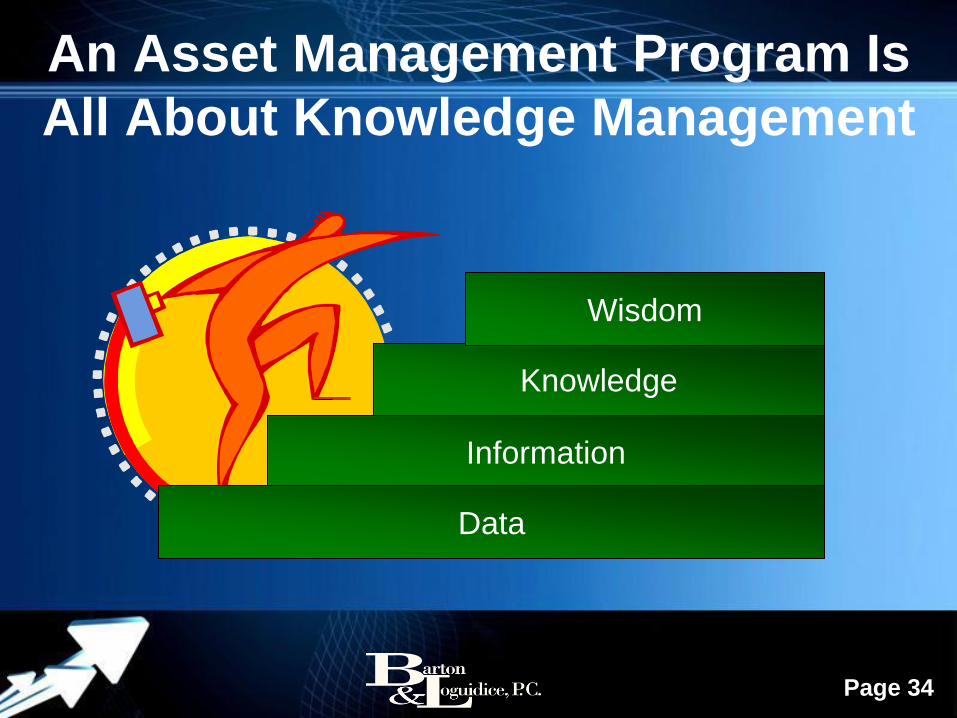
Information
Data
Knowledge
Wisdom
An Asset Management Program Is
All About Knowledge Management
Powerpoint TemplatesPage 35
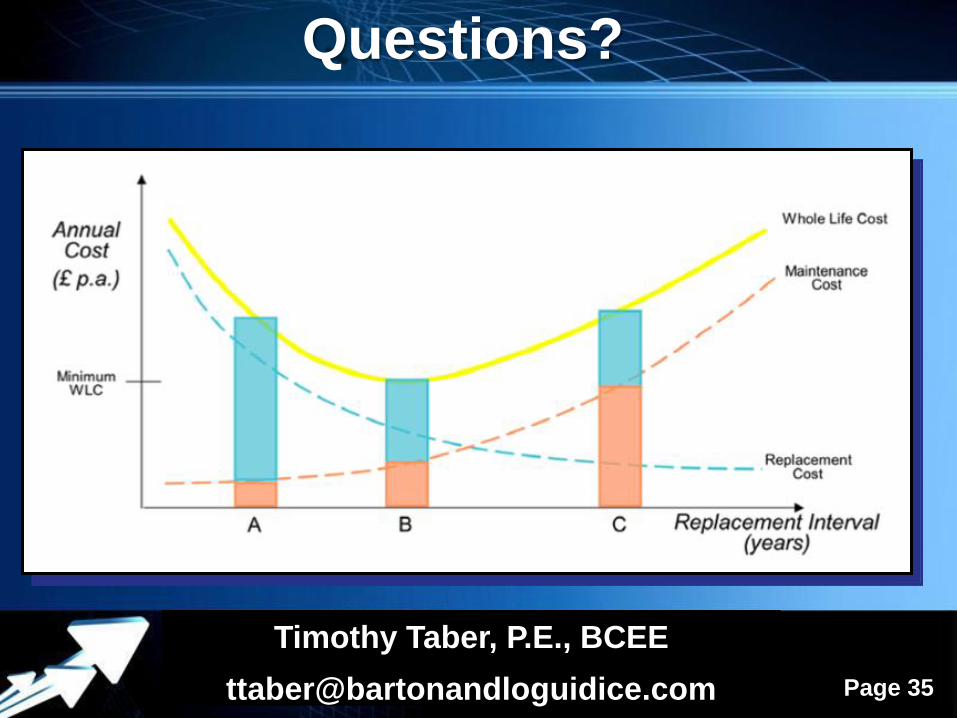
Questions?
Timothy Taber, P.E., BCEE