asset management and criticality assessment for public ...€¦ · basis to justify rate structures...
TRANSCRIPT

Asset Management and
Criticality Assessment for
Public Works Infrastructure
Steven E. Eubanks, P.E., CFMCity of Fort Worth
Asset Management
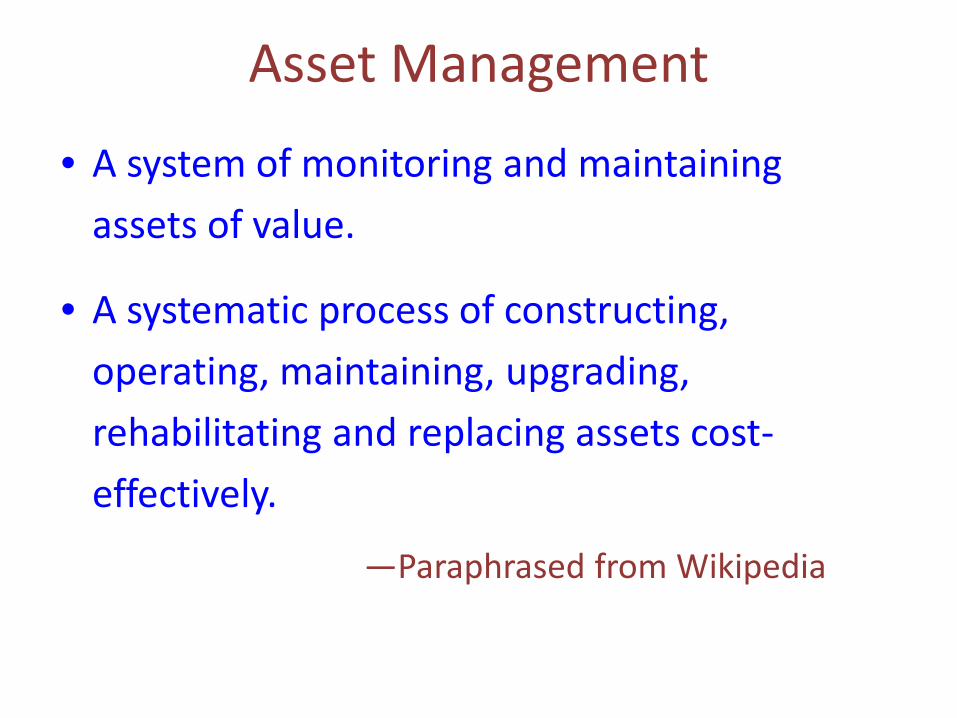
• A system of monitoring and maintaining assets of value.
• A systematic process of constructing, operating, maintaining, upgrading, rehabilitating and replacing assets cost-effectively.
—Paraphrased from Wikipedia
Asset Management
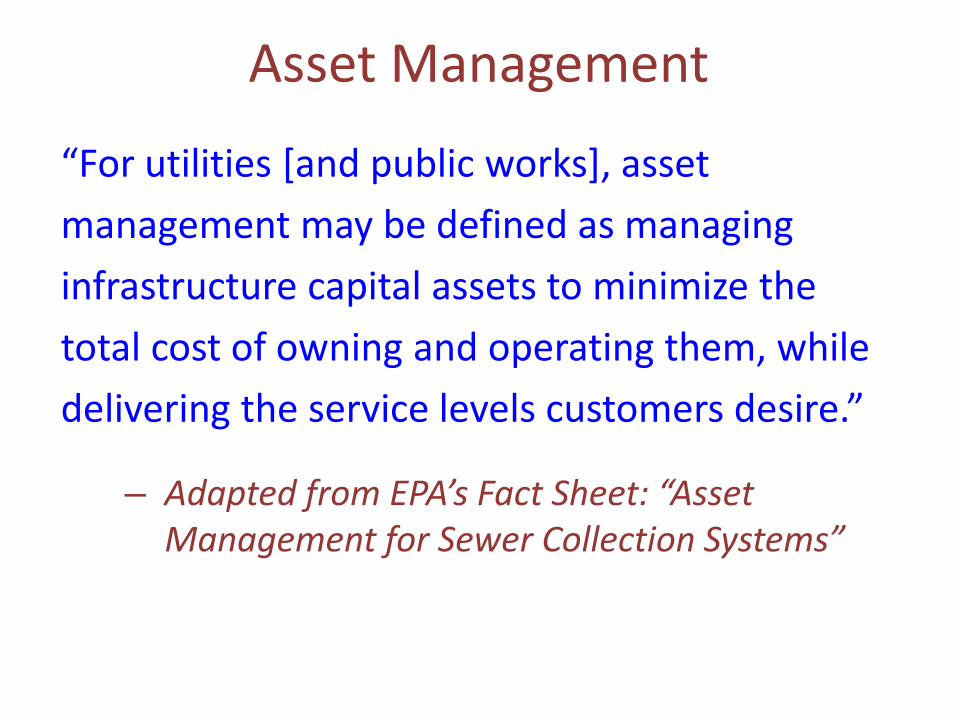
“For utilities [and public works], asset management may be defined as managing infrastructure capital assets to minimize the total cost of owning and operating them, while delivering the service levels customers desire.”
– Adapted from EPA’s Fact Sheet: “Asset Management for Sewer Collection Systems”
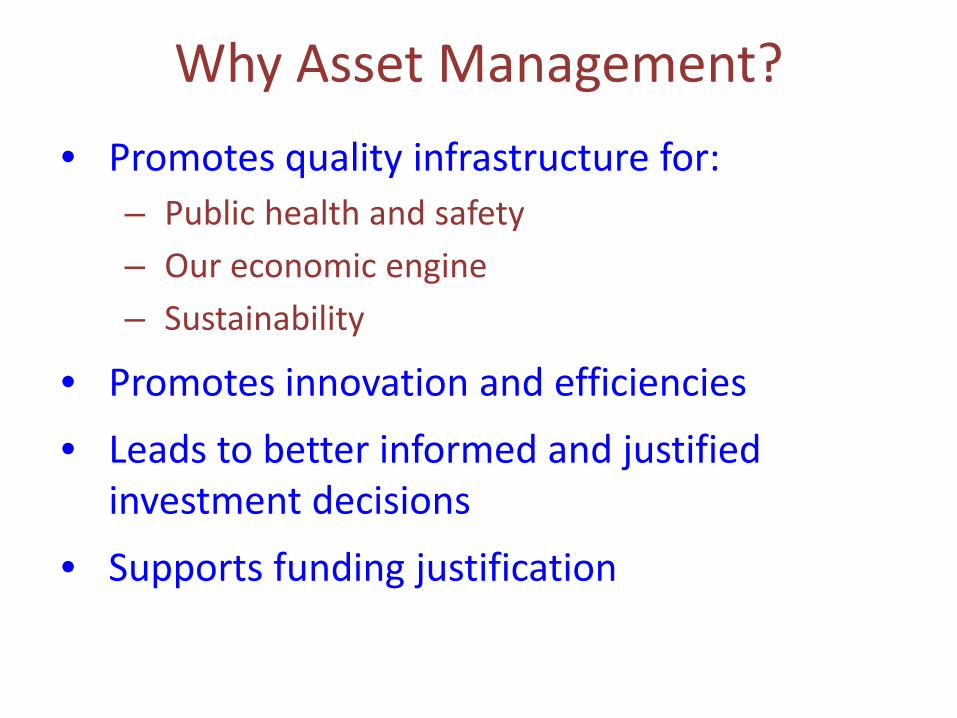
Why Asset Management?• Promotes quality infrastructure for:
– Public health and safety– Our economic engine– Sustainability
• Promotes innovation and efficiencies• Leads to better informed and justified
investment decisions• Supports funding justification
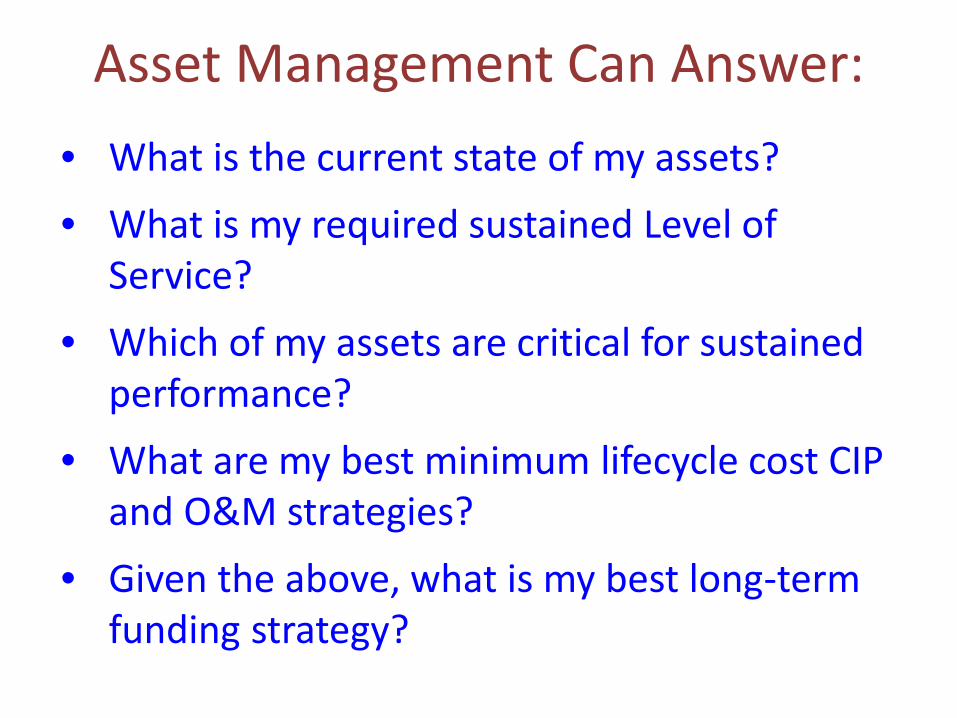
Asset Management Can Answer:• What is the current state of my assets?• What is my required sustained Level of
Service?• Which of my assets are critical for sustained
performance?• What are my best minimum lifecycle cost CIP
and O&M strategies?• Given the above, what is my best long-term
funding strategy?

Work Programs• Capital Programs• Maintenance• Process Improvements• Master Planning
Information & Data• Asset Inventory &
Condition• Costs• Capacity• Demand
Asset Management Plans• Inventory/Condition• Forecasts/Scenarios• Risk Management
Corporate Direction• Vision/Mission• Service Level Goals• Strategic Plans• Performance Measures• Budget
An Ongoing Program

In a Nutshell…Asset management is balancing the total cost of ownership with
sustainable levels of service.
Service Levels
Lifecycle Costs

Level of Service• Transportation Infrastructure and Supply
Utilities have service levels set by customers: pressure, voltage, road condition, etc.
• Collection Utilities historically have little demand: just make it go away (although Sanitary Sewer LOS now subject to EPA)
• Storm Drain LOS is “don’t flood me” [often]• Public Works do not have federal mandates
for LOS and similarly do not have independent revenue stream needed to meet LOS demands

Asset Depreciation

Life-Cycle Decision Support Re-invest Savings
Time (NTS)
Asset
Perf
orm
an
ce
Likely Aging Without Normal Maintenance
Likely Aging Without Renewal (NormalMaintenance)
Likely Aging With Renewal
Likely Aging With Renewal
Service Life Lost Due toPoor Maintenance
Service Life Gained Through TargetedMaintenance
DesignService Life
OptimalPerformance
Minimum AcceptablePerformance
LEVE
L O
F SE
RVIC
E

Asset Decay Curves
TIME
LEVE
L O
F SE
RVIC
E

In SummaryAsset Management is an integrative optimization process that enables a utility or public works department to determine how to minimize the total life-cycle cost of owning and operating infrastructure assets while continuously delivering the service levels that customers desire. It also provides a systematic basis to justify rate structures and funding requests.

In SummaryAsset Management is an integrative optimization process that enables a utility or public works department to determine how to minimize the total life-cycle cost of owning and operating infrastructure assets while continuously delivering the service levels that customers desire. It also provides a systematic basis to justify rate structures and funding requests.

In SummaryAsset Management is an integrative optimization process that enables a utility or public works department to determine how to minimize the total life-cycle cost of owning and operating infrastructure assets while continuously delivering the service levels that customers desire. It also provides a systematic basis to justify rate structures and funding requests.

In SummaryAsset Management is an integrative optimization process that enables a utility or public works department to determine how to minimize the total life-cycle cost of owning and operating infrastructure assets while continuously delivering the service levels that customers desire. It also provides a systematic basis to justify rate structures and funding requests.

Overview of the Asset Management Elements
• Also, Performance Management and Monitoring

Asset Criticality• Focuses on:
– Managing overall risk– Identifying the assets that pose the most risk– Data collection activities and frequency– Condition assessment remaining useful life
• Ties maintenance to capital planning, strengthening their interdependence
• Enables informed decision making
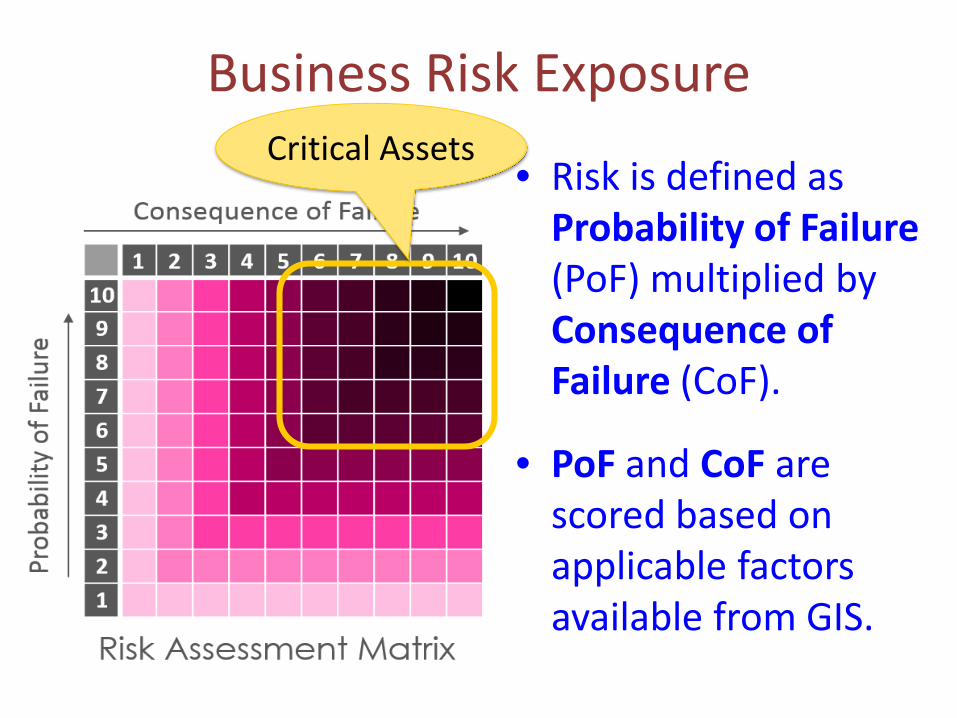
Business Risk Exposure
• Risk is defined as Probability of Failure (PoF) multiplied by Consequence of Failure (CoF).
• PoF and CoF are scored based on applicable factors available from GIS.
Critical Assets

FORT WORTH STORMWATER’S EXPERIENCE
Criticality Assessment

Probability of Failure• What types of failure are most likely—
functional (clogging) or structural?• What is likely to cause those failures?• What factors best capture those causes? • How much weight should each factor have?• Straight-line depreciation used since no
comprehensive condition assessment.

Consequence of Failure• If a failure occurs, what happens?
• For functional failure, consequences focus on what is subject to flooding
• For structural failure, repair difficulty and cost plays large role
• Are there nearby critical facilities (fire stations, hospitals, CBD, etc.) at risk?

Determining Asset Criticality Factors• Fort Worth Stormwater’s experience• Developed by GIS, Engineering and Field
Operations staff– Several work sessions– Determined assets to be evaluated– Brainstormed criticality factors
• Reviewed later for feasibility– Availability of data (e.g. perched outfalls)– Can be easily analyzed by GIS tools– Repeatable annually


Assets Considered• Pipes – our primary focus
– Mains, Culverts and “Transitions”
• Inlets – clogging failure most common issue• Outfalls – scour and erosion most common• Infalls – clogging failure most common• Channels – future (after mapping)• Drains – not many; slotted & french• Manholes – very few ever fail

Stormwater Asset Summary
Asset Class Type CountLength
(Feet) (Miles)
Pipe 21,921 4,031,330 763.50
Culvert Line 3,785 382,601 72.46
Gravity Main & Transition Line 18,136 3,648,729 691.04
Inlet Point 26,362
Outfall Point 7,627
Infall Point 6,012

Estimated Effective LifeAsset Class Material EEL
(Years)
Gravity Mains,
Transitions and
Culverts
RCP, CIP 100
Cast Iron, Concrete, HDPE, PVC, Corrugated Metal with Tar Lining 75
Corrugated Iron, Corrugated Metal, Metal, Masonry, VCP, Wood, Other, Unknown 50
Inlets ALL 75
Infalls ALL 75
Outfalls ALL 75
Channels Not Yet Evaluated ??
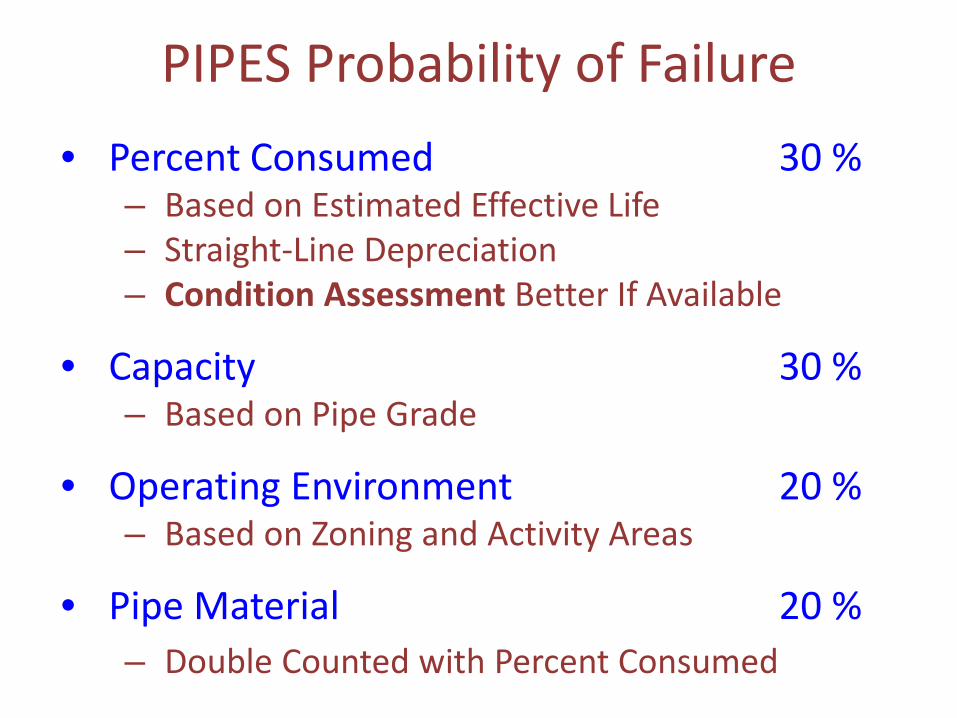
PIPES Probability of Failure• Percent Consumed 30 %
– Based on Estimated Effective Life– Straight-Line Depreciation– Condition Assessment Better If Available
• Capacity 30 %– Based on Pipe Grade
• Operating Environment 20 %– Based on Zoning and Activity Areas
• Pipe Material 20 %– Double Counted with Percent Consumed

Gravity/Culvert/Transition
POF Factor Weight Rating Description Notes
Percent Consumed 4 3 Age/EEL Actual Age ÷ EEL NULL IO_DATE = 1970
Capacity 1 3
1 A Source: BGE Graded_Pipes outputA is excellent and F is failureNull pipe grades will be reassigned in Scenario Analysis (IO Toolset) with the following criteria:1. Percent Consumed ≤ 5 = A grade2. Percent Consumed > 5 = F grade
2 B3 C4 D
5 F
Operating Environment(High Traffic
/Density)
2
1
Zoning A (all sizes), B, R-1 or R-2 single- or
two-family residential districts
CFWGIS.DBO.ADM_ZONING w/ query: ZONING = 'A-10' OR ZONING = 'A-2.5' OR ZONING = 'A-2.5A' OR ZONING = 'A-21' OR ZONING = 'A-43' OR ZONING = 'A-5' OR ZONING = 'A-7.5' OR ZONING = 'AR' OR ZONING = 'B' OR ZONING = 'R-1' OR ZONING = 'R-2'
2 All other zoning districts
CFWGIS.DBO.ADM_ZONING w/ query: ZONING <> 'A-10' AND ZONING <> 'A-2.5' AND ZONING <> 'A-2.5A' AND ZONING <> 'A-21' AND ZONING <> 'A-43' AND ZONING <> 'A-5' AND ZONING <> 'A-7.5' AND ZONING <> 'AR' AND ZONING <> 'B' AND ZONING <> 'R-1' AND ZONING <> 'R-2'
+1 Within Central City CFWGIS.DBO.ADM_CENTRAL_CITY_BOUNDARY
+1 Within Growth Center CFWGIS.DBO.ADM_GROWTH_CENTERS
+1Within TIF, Urban
Village and/or Commercial Corridor
CFWGIS.DBO.ADM_TIFSCFWGIS.DBO.ADM_URBAN_VILLAGESCFWGIS.DBO.ADM_COMMERCIAL_CORRIDORS
Create a field for each factor and assign a value by using ‘Select by Location’. Sum of each field is the Operating Environment score. Maximum rating is 5.
Pipe Material 3 2
1 HDPE, RCP and DIP
2PVC, Other,
Corrugated Metal with Tar Liner
3 All OthersCast Iron, Concrete, Wood, VCP, Masonry, Corru-gated Iron, Corrugated Metal, Metal, and Unknown. Should we consider 5 points for this class?
Total 10
• Report table includes rating details
• Notes by GIS staff provide details of the analysis
• Allows us to update analysis annually
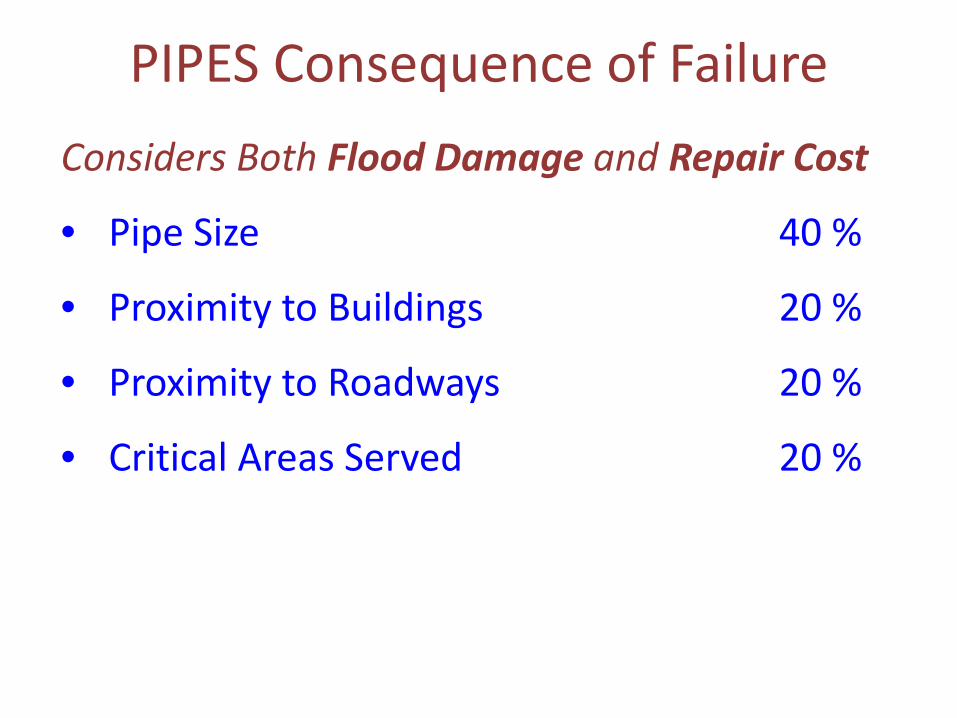
PIPES Consequence of FailureConsiders Both Flood Damage and Repair Cost
• Pipe Size 40 %
• Proximity to Buildings 20 %
• Proximity to Roadways 20 %
• Critical Areas Served 20 %

Business Risk Exposure:
PIPES
• Most high risk pipes inside the loop
• Highest concentration is downtown area

Pipe Grades

Probability of Failure

Consequence of Failure

Business Risk Exposure

INLETS
• Functional failure (clogging) of much greater frequency than structural failure
• PoF focuses on inlet size, inlet type and off-street vs. on-street
• CoF focuses on proximity of structures and critical facilities
• Redundancy included as consequence factor

Business Risk Exposure:
INLETS
• Most high risk inlets inside the loop
• Highest concentration is downtown area

OUTFALLS
• Erosion and scour are greatest issues.• Each outfall pipe considered separately.• PoF weighted toward pipe system
outfalls vs. culverts.• Velocity is other key PoF factor.• CoF considers distance from roadway
both to identify failure before it becomes significant, as well as access difficulty.

INFALLS
• Clogging considered the major issue• Primarily culverts• PoF considers channel type (structural,
earthen, or natural) for debris potential• PoF also based on City’s “ditch list”• Smaller pipes have higher PoF but larger
pipes have higher CoF• Redundancy considered as CoF factor

REPLACEMENT COSTAsset Management

Replacement Cost• Cost information is imperative in the
valuation of assets and life-cycle costing.• Can use depreciated value for current assets.• But for financial programming, replacement
cost is needed.– Most often project construction costs are used– Can use present-day costs or future costs
• Can be used to put value on entire system, or can limit to most critical assets.
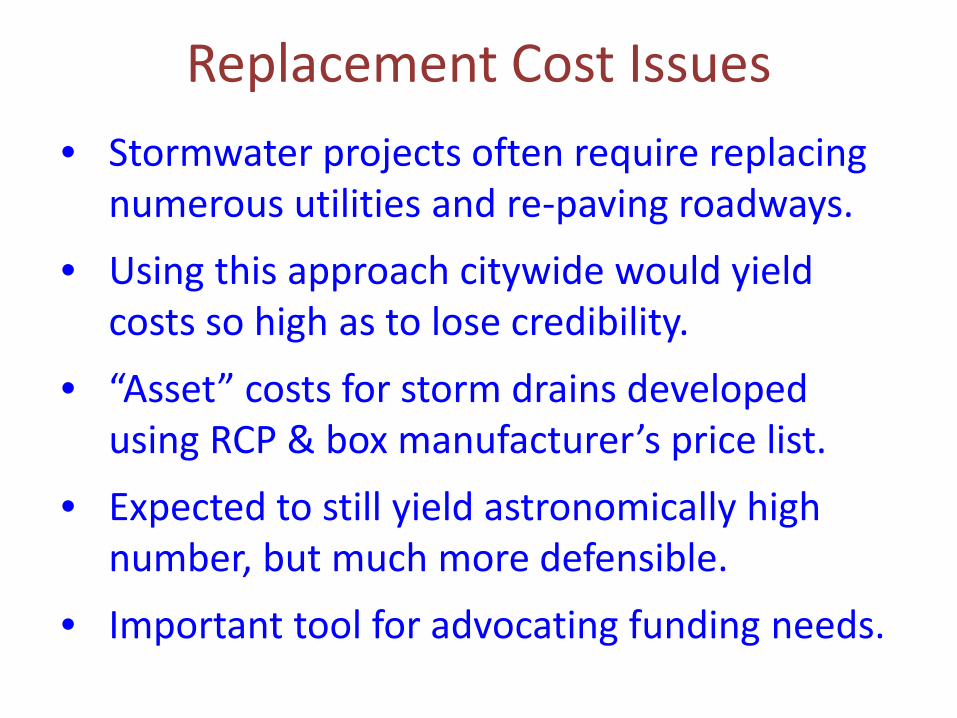
Replacement Cost Issues• Stormwater projects often require replacing
numerous utilities and re-paving roadways.• Using this approach citywide would yield
costs so high as to lose credibility.• “Asset” costs for storm drains developed
using RCP & box manufacturer’s price list.• Expected to still yield astronomically high
number, but much more defensible.• Important tool for advocating funding needs.

Replacement Cost Source• City “installed” prices
from 2014 developer agreement were low.
• Used 2015 purchase prices instead.
• Used RCP prices.• For all other shapes,
used box prices for same width x height.

Replacement Pipe CostsDia. (in)
Cost per LF
Dia. (in)
Cost per LF Dia. (in) Cost per LF
≤ 21" $ 43.00 42"* $ 148.00 84" $ 556.00
24"* $ 54.00 48"* $ 180.00 90" $ 664.00
27"* $ 62.00 54"* $ 241.00 96" $ 753.00
30"* $ 73.00 60" $ 285.00 108" $ 1,000.00**
33"* $ 90.00 66" $ 350.00 120" $ 1,275.00**
36"* $ 107.00 72" $ 409.00 132" $ 1,500.00**
39"* $ 134.00 78" $ 486.00 * Or smaller sizes ** Estimated

Box Replacement Cost Determination
$-
$200.00
$400.00
$600.00
$800.00
$1,000.00
$1,200.00
$1,400.00
$1,600.00
$1,800.00
0 20 40 60 80 100 120 140 160
Rinker $/LF CFA price list
$500 + ($6 x Area)
$100 + ($14 x Area)
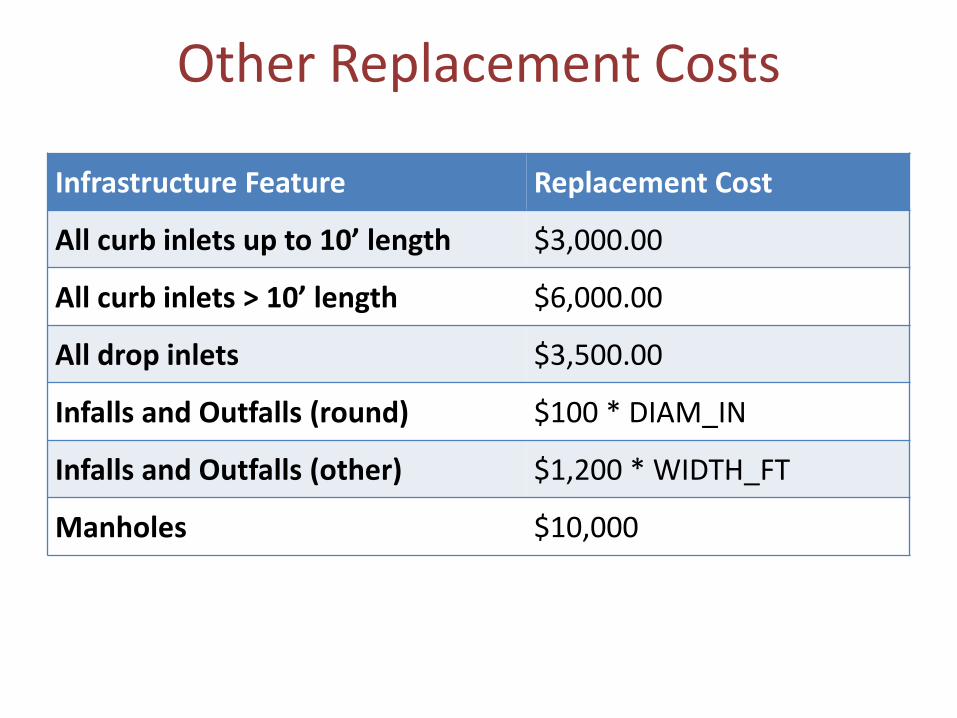
Other Replacement Costs
Infrastructure Feature Replacement Cost
All curb inlets up to 10’ length $3,000.00
All curb inlets > 10’ length $6,000.00
All drop inlets $3,500.00
Infalls and Outfalls (round) $100 * DIAM_IN
Infalls and Outfalls (other) $1,200 * WIDTH_FT
Manholes $10,000

Current Status• Maintenance and engineering staff to vet
PoF and CoF factors for infalls and outfalls• GIS Staff to analyze infalls, outfalls and
system replacement cost or value.• Before beginning a channel mapping
program, plan to develop criticality assessment factors to identify data needs.
• Traffic Management adopting criticality assessment process.

Criticality Moving Forward• Routine updates annually• Channel criticality after mapping• Develop condition assessment
program to use conditioninstead of straight-linedepreciation

Criticality in Practice• Prioritize Emergency Response
• Highlight Capital Projects Needs
• Rank Condition Assessment Needs
• Drive Preventative Maintenance
• Permitting and Reporting
• Helps with FEMA’s CRS rating

Questions?