asset building policy and programs for the poor
TRANSCRIPT

Policy Report
Asset Building Policy andPrograms for the Poor
Michael Sherraden2000
Center for Social Development
Symposium on Benefits and Mechanisms forSpreading Asset Ownership in the United States
Sponsored by the Ford FoundationNew York University, December 1998
Asset Building Policy and Programs for the Poor
Michael Sherraden, PhDBenjamin E. Youngdahl Professor of Social Development
Director, Center for Social Development
George Warren Brown School of Social WorkCampus Box 1196
Washington UniversityOne Brookings DriveSt. Louis, MO 63130
Telephone 314-935-7433Fax 314-935-8661
Email [email protected]
Revised July 2000

1
In this chapter I summarize the emergence of asset building for the poor as a communitydevelopment and policy innovation.1 The paper begins with a short statement on policycontext, followed by an applied section that looks at policy and programs. Last is aresearch section, focusing on savings theory and asset building in applied research andwhat we are learning in early stages of investigation. This is a lot to cover in one chapter,but it would be misleading to present the policies and programs as if they stood apartfrom theory and inquiry.
Policy Context
To provide perspective, I begin with a short statement on policy context. There is reasonto believe that a shift to asset-based policy is underway in many countries. Around theworld, it is uncommon to encounter a new or expanding system of social insurance, butcommon to find a new or expanding policy based on asset accounts. In the United States,this can been seen in the introduction and growth of 401(k)s, 403(b)s, IRAs, Roth IRAs,the Federal Thrift Savings Plan, Educational Savings Accounts, Medical SavingsAccounts, Individual Training Accounts, College Savings Plans in the states, andproposed individual accounts in Social Security. Some of these are public and some are“private,” but it is important to bear in mind that the private sector plans are typicallydefined by public policies and receive substantial subsidies through the tax system. All ofthese asset-based policies have been introduced in the United States since 1970. Overall,asset accounts, for various purposes, are the most rapidly growing form of domesticpolicy, and it seems quite possible that the shift to asset-based policy will continue.
Unfortunately, the shift to asset accounts has the potential to be considerably moreregressive than social insurance and means-tested income transfer policies. The reasonsare twofold: first, the poor often do not participate in the asset-based policies thatcurrently exist, and second, asset-based policies operate primarily through tax benefits(tax expenditures) that are highly regressive and benefit the poor little or not at all. Inother words, asset-based policies have the potential to exacerbate inequality, and indeedare doing so, because the poor are being left behind.
For people with progressive values, the trend toward greater inequality in asset-basedpolicy, and its repercussions in diminished living conditions and opportunities for a largepart of the population, are unacceptable. If asset-based policy is being created, a majorchallenge will be to aim for inclusiveness in the policy as it is emerging. The goal shouldbe to bring everyone into the system, with adequate resources in their accounts for socialprotections and household development. Recent innovations in matched savings for low-income and low-wealth households, such as Individual Development Accounts (IDAs),proposed Universal Savings Accounts (USAs) and Retirement Savings Accounts (RSAs)are designed with this larger policy context in mind (Sherraden, 1991; Corporation forEnterprise Development, 1996; Clinton, 2000).

2
Asset Building for the Non-Poor
Domestic policy is delivered via two major pathways, direct expenditures and taxexpenditures. Tax expenditure is the term used by the Congress and policy analysts torefer to a tax deduction or exemption. The logic is that the government has two ways ofproviding benefits: it can collect taxes and then distribute the money (direct expenditure),or it can for a particular reason decide not to collect taxes in the first place (taxexpenditure). From the standpoint of government accounts, both are expenditures; andfrom the standpoint of households, both are benefits received. Howard (1997) hasreferred to tax expenditures as “hidden” social policy in that these expenditures are oftennot tabulated as part of social policy, and the vast majority of recipients do not view themas such.
Taking direct expenditures and tax expenditures together, well over half of all federalspending is in categories that we typically think of as social policy. Previously, I havetabulated direct and tax expenditures for 1990 in seven major social policy categories:education, employment, social services, health care, income security, housing, andnutrition (Sherraden, 1991). For the purposes of this discussion, one overall point is mostimportant: direct expenditures made up 75.0 percent of the total, and tax expendituresmade up 25.0 percent of the total. When this tabulation is repeated with estimated year2000 figures the pattern is much the same at 76.3 percent for direct expenditures and 23.7percent for tax expenditures.2 Other estimates of direct and tax expenditures are similar(see Seidman, this volume); the point is simply that tax expenditures are a substantial partof social policy.
A second point about tax expenditures is that they are predominantly oriented towardasset building. Table 1 summarizes asset building tax expenditures to individuals in threeasset-building categories: homeownership, retirement accounts, and investments.Estimated year 2000 tax expenditures to individuals in these three asset-buildingcategories are large at $288.5 billion. Thus the major portion of all year 2000 taxexpenditures to individuals (56.8 percent) were directed to these three categories of assetbuilding. While direct expenditures in welfare states of the twentieth century have beendevoted primarily to income transfers designed to maintain consumption levels, taxexpenditures, a more recent form of social policy, are oriented primarily toward assetaccumulation (Sherraden, 1991; Sherraden, Page-Adams, and Yadama, 1995).
[Table 1 about here]
Not coincidentally, asset building tax expenditures are related to the pattern of assetaccumulation in U.S. households. According to figures presented by Wolff (this volume),75.8 percent of wealth in U.S. households is held in principal residences (30.4 percent),pension accounts (9.0 percent), and business capital (36.4 percent), and these threecategories correspond to the asset building tax expenditure categories presented in Table1.

3
Most of the tax expenditures enumerated in Table 1 go to the non-poor. In the case of taxexpenditures for business assets, this is not surprising. However, this pattern also occurswith the more “social” tax expenditures for homes and retirement security. For example,of $47 billion in federal mortgage interest deductions in 1998, homeowners with incomesover $100,000 received 54 percent of the total tax expenditures; and homeowners withincomes over $50,000 received 91 percent of the total tax expenditures (calculated fromU.S. Congress, Joint Committee on Taxation, 1998).3 Tax expenditures for retirementalso are highly regressive. Of all retirement tax benefits, 67 percent go to householdsearning more than $100,000 per year, and 93 percent go to households earning more than$50,000 per year (U.S. Executive Office of the President, 1999).4
In other words, public policy is an integral part of the structure of wealth inequality. Iemphasize this point because the common perception of social policy in the United Statesis that resources are redistributed downwards in the class structure by the federalgovernment. This is to some extent true for direct expenditures, but it is decidedly nottrue for tax expenditures. Thus there is a large and somewhat “hidden” asset-based policyin the United States. Many people accumulate assets, and do so in a manner that cannotaccurately be described as “saving.” Rather, for most Americans, most assets accumulatein structured systems, defined and heavily subsidized by public policy, in whichparticipants do not make periodic decisions to “save.” Indeed, most Americans withretirement accounts and home equity seem to be little aware that the subsidies theyreceive are part of social policy expenditures. They tend to think instead that they havebeen prudent and made wise investments.
Why Not Asset Building for the Poor?
In the mid 1980s when I began this work there was very little applied or academicdiscussion about asset building by the poor in policy and community development. Atthe time, and still largely today, the policy emphasis was on income support. To be sure,some social science researchers had been focusing on asset distributions (Wolff, 1987;Oliver and Shapiro, 1990). There had been creative proposals for capital accounts inlump sum payments, usually for youth, (Tobin, 1968; Haveman, 1988; Sawhill, 1989).5Community organizations emphasized home ownership for the poor, but this was notcommon.6 Some community innovators had been promoting microenterprise and itsinvestment qualities (Friedman, 1988), but there were no proposals for asset building asan overall direction in anti-poverty policy and community development. At the time,income-for-consumption was largely taken for granted as the main theme of anti-povertypolicy. Today, in addition to assets, there is a much richer discussion of alternatives toincome-based policy. These include incentives for behavioral change, enterprisedevelopment, social capital strategies, and human capital strategies. Asset building as apolicy strategy for the poor can be viewed in the context of a growing questioning ofincome maintenance as a singular strategy.

4
There is a good reason for this questioning. It has been known for some time that incometransfers to the poor do not reduce pre-transfer poverty (e.g., Danziger and Plotnick,1986). In other words, while income transfers have helped to ease hardship, they havenot enabled families to develop. Such policy might be considered sufficient in the case ofthe elderly or severely disabled, for whom care and maintenance is the primary concern.But it is insufficient in the case of most households, particularly those with children.Federal income transfers to the poor were a positive step forward when they wereintroduced in 1935, but they are well short of a sufficient response to poverty at thebeginning of the twenty-first century. The best policy alternatives move beyond the ideaof consumption-as-well-being, toward what Sen (1985, 1993) identifies as functionings orcapabilities. Asset building is one policy pathway to increase capabilities. Because assetbuilding can be accomplished with relatively simple policy instruments, and becausepublic policy already does it for the non-poor, it should be possible, and would be morejust, to do so for the poor as well.
Policy Innovation
To greatly oversimplify, we can think of two levels from which to understand policyinnovation, and each carries a portion of the truth. The first level is the very broadcontext, which might be called social forces. From this perspective, a policy arisesbecause the time is right, i.e., social, economic, and political conditions are such thatpolicy change is more or less a historical inevitability. This is the perspective in the“policy context” section near the beginning of this paper, and a great deal of academicpolicy analysis and social and political history employs a broad perspective of this nature.The second level is institutional, focusing on the organizations, offices, interest groups,and so on that organize and act to bring the policy into being. From this perspective,policy innovation occurs because institutions cause it to occur. And particular people ininstitutions -- reformers, office holders, academics, opinion leaders -- make thingshappen. Both levels are useful in understanding asset-based policy innovation.
From the social forces viewpoint, the standard interpretation is that income-based policywas created during the industrial era to fit with and support systems of industrialproduction. As we move into the information era, it seems likely that income-basedpolicy is changing because it is no longer as good a fit for the economy or for households.Asset-based policy is beginning to play a larger role because asset accounts allow greaterindividual control and investment throughout the life course. Control, flexibility,portability, and life-long investment are likely to be more important in information eralabor markets (Sherraden, 1997).
Despite the overall trend toward asset building policy, the poor are for the most part notincluded. The most vocal advocates of asset accounts, e.g., the Cato Institute, proposehighly regressive policies. And many traditional liberals have opposed asset accounts,even progressively funded asset accounts, because they are in a defensive posture tryingto protect income-based policies. This defense is well intentioned, but if the overall

5
policy direction is toward assets, a more constructive position would be to include thepoor in the new policies.
From the perspective of the organizations involved, there is nothing that is automatic orinevitable about asset building policy and programs for the poor. These policies andprograms are being purposefully created, and purposeful policy innovation is the provinceof institutional explanations. Following discussions with mothers who were receivingAid to Families with Dependent Children (AFDC or “welfare”) in the mid 1980s, Ideveloped the idea of matched savings accounts for the poor, called individualdevelopment accounts (IDAs). In 1989-90, with draft chapters Assets and the Poor(1991), I initiated discussions with Bob Friedman at the Corporation for EnterpriseDevelopment (CFED) and Will Marshall at the Progressive Policy Institute, and bothorganizations published policy reports on asset-building and IDAs. The CFED report wasthe subject of several columns by William Raspberry in the Washington Post, andfollowing this we had inquiries from a number of congressional offices and committees.One of these was the House Select Committee on Hunger, chaired by Tony Hall (D-OH).Ray Boshara, now the Capitol Hill strategist for CFED, was a staffer on the committeeand he brought IDAs to Hall’s attention. Friedman worked with Boshara to draft the firstlegislation. A companion bill was later introduced in the Senate by Bill Bradley (D-NJ).A later version of these first IDA bills became the Assets for Independence Act of 1998,described below.
Jack Kemp, Secretary of Housing and Urban Development (HUD), became veryinterested in asset building. In 1991-92 he initiated several meetings with high-leveladministration officials, including President Bush. Asset-building discussions withdomestic policy advisors in the White House continued, leading to a provision byPresident Bush in his 1992 budget proposal to raise welfare asset limits from $1,000 to$10,000. This was a bold proposal at the time; no liberal Democrat had made such aproposal. This proposal by a leading Republican substantially influenced the discussionon changing welfare asset limits. Today, almost every state has increased asset limits inmeans-tested programs. This in itself has been an important policy shift.
Secretary Kemp initiated a program called Family Self-Sufficiency (FSS), administeredby HUD. FSS permits residents of subsidized federal housing to save and accumulateassets in the following manner: Rent is normally calculated as a portion of income, butunder the FSS program, if a resident’s income rises, the increased portion that would goto rent goes into an escrow account. When the individual is no longer a recipient offederal means-tested programs, he or she can use the escrowed savings. There has neverbeen an evaluation of FSS (no money for evaluation was allocated), but anecdotal reportsfrom many parts of the country are positive. We have heard numerous reports ofresidents having several thousand dollars in their FSS accounts; many have becomehomeowners; others have used the money for education. Quite likely the impact of theFSS program is substantial, but research is needed. A simple descriptive study on the

6
scope of FSS, numbers of participants, and amounts of savings would be a good place tobegin.
IDA policy innovations have been led by CFED in Washington and the Center for SocialDevelopment (CSD) at Washington University since the early 1990s. In 1991-92, CFEDundertook an initiative called the State Human Investment Policy (SHIP) to work onIDAs in Iowa and Oregon. The Joyce Foundation in Chicago funded the first three majorIDA projects in 1994. CSD created an IDA Evaluation Handbook (Sherraden et al.,1995) to facilitate research on early IDA programs. CFED initiated an IDA listserve onthe internet, and organized national conferences on IDAs in 1995, 1998, 1999, and 2000.The 1999 and 2000 conferences drew more than 500 people from community groups,foundations, financial institutions, and government agencies around the country. CFEDand CSD have worked in virtually all of the states that have an IDA policy, and providedtechnical assistance of some type to most of the community IDA programs. CFED hasassumed responsibility for spearheading federal policy changes, with noteworthysuccesses. CSD has created a management information system for individualdevelopment accounts, known as MIS IDA, to facilitate program design and management,and also to serve as a monitoring instrument to collect timely and comparable data frommultiple IDA sites (Johnson and Hinterlong, 1998).7
Bill Clinton supported IDAs in his 1992 campaign, and IDAs were included in thePresident’s 1994 “welfare reform” proposal. CFED and CSD worked with Bruce Reed,Co-Chair of the White House welfare reform task force. Prior to becoming a domesticpolicy advisor to the President, Reed had written a very positive 1990 article on IDAs forThe Mainstream Democrat, a publication of the Democratic Leadership Council. Withcontinuing efforts by CFED, IDAs were included as a state option in the 1996 federalwelfare reform act, which replaced AFDC with Temporary Assistance to Needy Families(TANF). This act has two important provisions: First, if TANF participants accumulateassets in an IDA, these funds are exempt from asset limits for all federal means-testedprograms (in other words, the welfare poor can save without penalty in IDAs). Second,states are permitted to use TANF funds to match savings in IDAs. Although not widely-recognized at the time, these asset-building provisions in TANF marked the first time in afederal anti-poverty policy that asset-building was no longer discouraged, and in factcould be subsidized with federal funds. Allowing IDAs as a state option in TANF was animportant step toward establishing asset building as a policy option on equal footing withincome support for welfare households. In 1999, another federal ruling specified thatIDA participation, including matching funds, would not be defined as “assistance” underTANF and thus would not run a participant’s “clock” of eligibility for TANF support.This ruling removed a major concern and impediment to inclusion of IDAs in welfarereform in the states.
Another federal IDA initiative, the Assets for Independence Act (a legislative descendentof the first IDA bill in 1991), was passed by Congress in 1998 with bipartisan support,and signed by the President.8 The bill was sponsored in the House by Hall and John

7
Kasich (R-OH), and in the Senate by Dan Coats (R-IN) and Tom Harkin (D-IA). TheAssets for Independence Act provides $125 million in federal funding for IDAdemonstrations over five years. At this writing, Abt Associates and CSD are workingwith the Department of Health and Human Services to design the evaluation for thisdemonstration.
Current Policy and Community Initiatives
At this writing, almost all states have raised asset limits in welfare, and at least 25 stateshave included IDAs in their welfare reform plans. Twenty-seven states have passed IDAlegislation for TANF and/or other low-income residents. Five other states have passedlegislation for other asset-building initiatives for education or job training. Altogether, 44states have some type of IDA policy or initiative at this writing.9 None of the state-funded IDA programs is limited to TANF participants, which is what CFED and CSDhave recommended. We do not see IDAs as a welfare reform program, but as a familyand community development program that might be utilized by any low-wealthhousehold. IDA legislation in the states typically has broad bipartisan support, and a keyreason for this support is inclusion of the working poor.
Several prominent networks of IDA programs have or are being established. A nationalprogram of IDAs was initiated by AmeriCorps VISTA, with volunteers working atcommunity development credit unions and other community organizations. The EagleStaff Fund of the First Nations Development Institute has initiated IDAs on several IndianReservations. The Neighborhood Reinvestment Coalition has started an IDA program.United Ways in Atlanta and St. Louis have funded multi-site IDA programs. Some stateshave organized IDA networks (e.g., North Carolina, Tennessee, Michigan).
IDAs first began in community organizations in the early 1990s, including housingorganizations, community action agencies, microenterprise programs, social serviceagencies, and community development financial institutions. Today there are at least 200operating IDA programs and many more in the planning stages.10 Some locations are atthe point of “second generation” IDA programs, where pioneers are providing a modeland technical assistance to newly emerging programs. Altogether, the partnership ofCFED, a Washington-based policy innovation organization, and CSD, a university-basedapplied research organization, has proven to be successful in introducing asset-basedpolicies for the poor and establishing an applied research agenda.
Directions
This mixture of IDA policy and community development activity, with interest andfunding from many sources, indicates lively policy and program innovation. Asset-basedpolicy proposals are emerging from many quarters. For example, three promising policydirections that are on the horizon.

8
Children’s Savings Accounts (CSAs), have been proposed by Senator Bob Kerrey (D-NE), with federal deposits for all children beginning at birth and extending through age18, to be used for education and later retirement security.11 To put this proposal inperspective, it is useful to bear in mind that every economically advanced nation exceptthe United States has some form of child allowance (monthly payment to families withchildren), designed for consumption support. The nations of Western Europe spend anaverage of 1.8 percent of GDP on child allowances (European Commission, 1995; seeCurley and Sherraden, forthcoming, for a detailed description of these policies anddiscussion of lessons for CSAs in the United States). By this standard, the United Statesunderinvests in children. Based on our history, the United States is unlikely to enact achildren’s allowance, but CSAs may be more consistent with U.S. values. If the UnitedStates invested only 1.0 percent of GDP in CSAs, it would be more than enough todeposit $1,000 per year into the accounts of every young person, from birth through theage of 18.
IDAs in Electronic Funds Transfer (EFT) have been thoughtfully proposed by Stegman(1999). At present, a large portion of the poverty population is “unbanked,” i.e., theyhave no mainstream financial services. Instead, they pay high prices for financial servicesin check cashing outlets, pawn shops, and the like (Caskey, 1994). The transition to EFTpresents an unusual opportunity to provide a full range of financial services, not merelytransaction accounts, for nearly all Americans. (Unfortunately, there is also great risk forthe poor in being overcharged by unscrupulous financial institutions. Predatory practiceswill have to be identified and controlled.) At this writing, proposed guidelines on EFTsfrom the Treasury Department do not include the provision of savings accounts. Stegmanis among the first to recognize the enormous potential in the federal initiative for EFTs todeliver a wide range of financial services to impoverished households and communities,including saving and matched saving in the form of IDAs. Stegman has proposed, andSenator Joseph Lieberman (D-CT) has introduced legislation, to use federal funds tosupport a progressive system of IDAs operated by banks and other financial institutions.
Universal Savings Accounts (USAs) were proposed by President Clinton in his 1999State of the Union Address and spelled out in greater detail in a White Housepresentation.12 Clinton proposed using 11 or 12 percent of the budget surplus, anestimated $38 billion per year at the outset, rising with the rate of inflation, to create aprogressive system of accounts for retirement. The federal government would makeannual deposits plus matching deposits into accounts of low and middle-income workers,taking in most of the working population, on a progressive basis, i.e., the largest subsidieswould be at the bottom. Some have described this as a 401(k) available to all workers. Itwould be the largest anti-poverty initiative since the Earned Income Tax Credit.Republican response to the Clinton USA proposal has been unenthusiastic, largely forpolitical reasons. In the past, leading Republicans, including Rep. John Kasich (R-OH),have proposed individual accounts created with surplus funds, with equal deposits intoeveryone’s account, regardless of income. Retirement Savings Accounts (RSAs), ascaled-down version of USAs estimated $5.4 billion per year, were proposed in the 2000

9
State of the Union Address (Clinton, 2000). Despite the name, RSAs could be used forhome ownership, education, and other goals in addition to retirement security. In makingthese proposals, Clinton explicitly mentions the regressivity of current tax expendituresfor retirement, and the early success of IDAs in showing that the poor can save whensavings are matched.13
In sum, the primary purposes of IDAs and proposed USAs/RSAs are threefold: (1) todemonstrate that low-income and low-wealth households can save and accumulate assetsif they have the same opportunities and incentives that are available to the non-poor; (2)to document that funders of asset building, public and private, are making a goodinvestment; and (3) to model a progressive asset-based policy that can be taken to scale.Returning to the policy context mentioned at the beginning, IDAs and USAs/RSAs areefforts to include the poor in what is perhaps the most fundamental domestic policytransition of our time, the shift to asset accounts.
Research on Individual Development Accounts
Although the topic of matched saving is decidedly applied, it has academic roots. In thelong term, academic foundations must be defined and empirically supported if the policyis to grow and be sustained.
How Do People Save?
There is a large but inconclusive body of work on saving theory and research (Beverly,1997; Korczyk, 1998; Carney and Gale, this volume). Neoclassical theories represent thecore of the discussion. The two most well known are the life cycle hypothesis or LCH(Modigliani and Brumberg, 1954) and the permanent income hypothesis or PIH(Friedman, 1957). These theories assume that individuals and households are focused onexpected future income and long-term consumption patterns. Other schools of thoughtinclude a wide range of behavioral, psychological and sociological theories. Behavioraltheory emphasizes financial management strategies, often self-imposed, and focuses onincentives and constraints (e.g., Thaler and Shefrin, 1981; Shefrin and Thaler, 1988).Psychological and sociological theories assume that consumer preferences are not fixedbut rather change with economic and social stimuli (e.g., Duesenberry, 1949; Katona,1975; Cohen, 1994). Turning to empirical evidence, LCH and PIH models have mixedsupport, but they especially fail to explain patterns of asset accumulation in low-incomehouseholds, which are typically low or negative. Among the other theories, very fewbehavioral, psychological, or sociological propositions have been rigorously tested. Afair summation is that evidence is mixed and incomplete; no single perspective is at thistime clearly supported.14
On this indefinite terrain we begin to specify and offer for test an institutional view ofsaving that is embodied in IDA proposals (Beverly and Sherraden, 1999). Institutionalperspectives are not new (e.g., Gordon, 1980; Neal, 1987) and if we are making any

10
contribution it is only in specifying what this might mean in the applied case of asset-based policy. We have identified four major categories of institutional variables: (1)incentives, (2) information, (3) access, and (4) facilitation. The first three are commonlydiscussed, and I offer the fourth term “facilitation” to describe institutional arrangementswhere “saving” is actually done for the participant, as in automatic payroll deduction.Facilitation is a key feature of most contractual saving systems.
Turning to empirical evidence, there is the large and unavoidable fact – rather like anelephant sitting in the living room -- that accumulation of assets in a typical U.S.household occurs largely through institutionalized mechanisms, primarily via homeownership and retirement pension accounts. If future social security benefits are countedas assets then this is even more true, and brings in poor households because the pooroften hold a large share of their net worth in social security entitlements (Burkhauser andWeathers, this volume).
Turning to specific studies, there is some evidence that financial information andeducation programs increase savings rates (e.g., Bayer et al., 1996). There is littleconsensus on the effect of incentives, because substitution effects may outweigh incomeeffects (e.g., Boskin, 1978; Summers, 1981). However, there is evidence that asset limitsdiscourage savings among participants in means-tested programs (Hubbard et al., 1995).There is some evidence that access and facilitation may increase institutionalized saving(Katona, 1975; Maital and Maital, 1994). From anecdotal evidence – discussions withboth IDA participants and 401(k) participants -- I suspect that facilitation may be the mostimportant of the four institutional factors listed above.15 Other evidence on theimportance of facilitation is the common practice of using the income tax withholdingsystem as a kind of savings plan. Millions of households withhold more than the taxesthey owe, planning for a lump sum refund, despite the strong economic disincentive (thecost of foregone earnings on the money) in saving through this mechanism.
[Table 2 about here]
Thinking in more detail about all four of the institutional constructs, specific hypothesesare formulated in reference to IDA programs (Table 2). Most of these hypotheses seemlike common sense and it is probable that, with proper tests, most would be supported.More fundamental questions are the amount of variance explained and the extent towhich these hypotheses are supported vs. other competing hypotheses, particularly thoserelated to personal characteristics and preferences. The overall theoretical statementunderlying IDAs would be that institutional constructs are as important as personalcharacteristics and preferences in determining savings behavior. If the four institutionalconstructs discussed above and perhaps others do in fact affect saving, then it is importantto point out that low-income households typically have limited access to theseinstitutionalized saving features (e.g., Caskey, 1994; Bernheim and Garret, 1996; Beverlyand Sherraden, 1999).

11
Research on IDAs, Early Results
In this section, I discuss a research program focusing on IDAs, the “Down Payments onthe American Dream Policy Demonstration,” known in short as the “American DreamDemonstration” (ADD). Eleven private foundations are funding this first largedemonstration and evaluation of IDAs in 14 community programs around the country.16
CFED is undertaking the demonstration and CSD has designed and is overseeing theevaluation. The demonstration is scheduled to last four years (1997-2001). The researchis multi-method and will extend two additional years (to 2003). Methods includeimplementation assessment, program and participant monitoring, experimental designsurvey, in-depth interviews to supplement the survey, community level evaluation, and abenefit-cost analysis. Abt Associates is collecting the experimental survey data and willreport on policy impact. I report here on program and participant monitoring.
CSD initiated an IDA Monitoring Task Force during 1996 and, through this process,created and pre-tested a monitoring instrument. During 1997, the monitoring instrumentwas adapted to user-friendly software, and again pre-tested. Known as the managementinformation system for individual development accounts (MIS IDA), the software isdesigned to record basic program information on design, match rates, and so on, andinformation on participant characteristics, patterns of savings, and uses of savings. Thesedata are not the impact data that will come from the experimental design survey, but theyshed light on how well IDAs are working and for whom. As far as we know, this is thefirst time that a policy demonstration at the outset has created unique software for anMIS. Version 2.0 of MIS IDA has collected data from all 14 ADD sites (Johnson andHinterlong, 1998). Monitoring data are delivered electronically to CSD, where they aretransferred to a statistical program for analysis.17 At this writing, we can report on thefirst two years of ADD, through June 30, 1999 (for a more thorough report, see Sherradenet al., 2000).
ADD Programs
At the program level, six ADD sites are in community development organizations, two insocial service agencies, two in credit unions, two in housing organizations, and two arecollaborations among multiple sites. Match rates for accounts vary from 1:1 to 6:1, and2:1 is most common. Regarding funding partners, 14 have not-for-profit funders(foundations play the largest role); nine have corporate funders (most often the bankswhere IDAs are held); eight have public funding; and two have funding from individuals.Eight programs have annual deposit limits, ranging from $180 to $3,000; and sixprograms have lifetime deposit limits, ranging from $1,800 to $8,000. Regardingdepository institutions, nine programs are using a bank or savings and loan, and five areusing a credit union. Twelve programs provide monthly statements, and two providequarterly reports. All programs offer interest-bearing accounts, and in three programsIDA deposits can be earned. All 14 program permit IDAs to be use for home purchase,
12
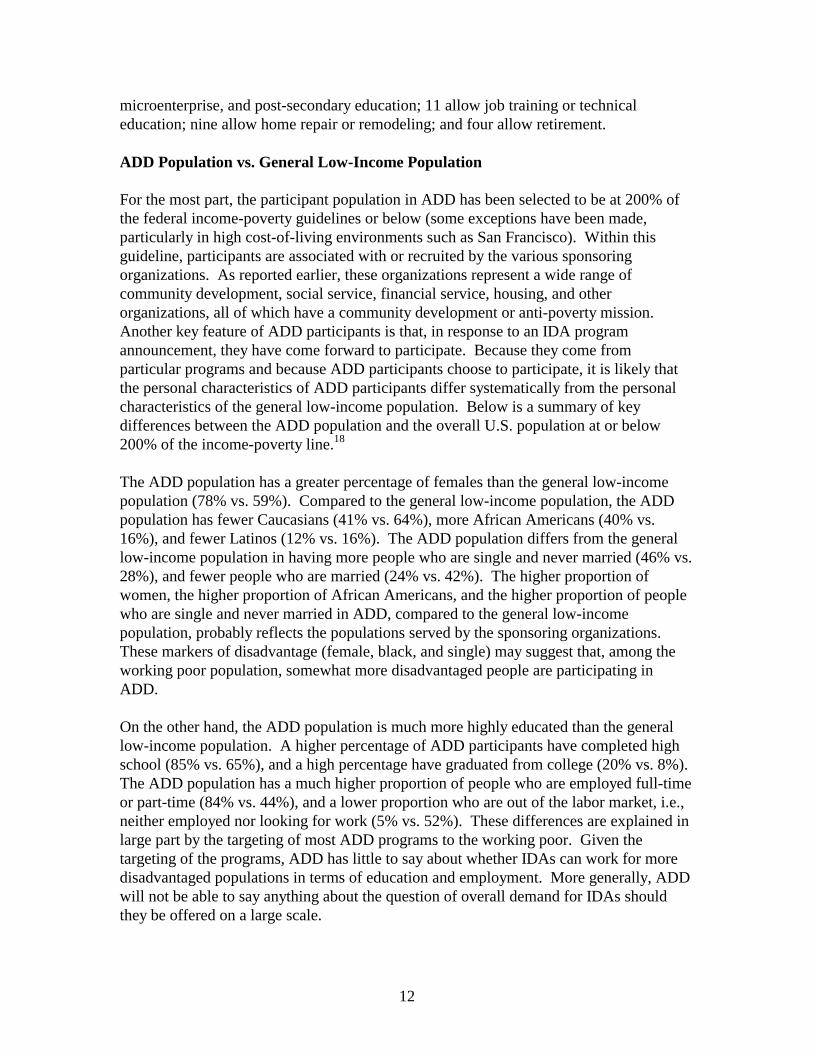
microenterprise, and post-secondary education; 11 allow job training or technicaleducation; nine allow home repair or remodeling; and four allow retirement.
ADD Population vs. General Low-Income Population
For the most part, the participant population in ADD has been selected to be at 200% ofthe federal income-poverty guidelines or below (some exceptions have been made,particularly in high cost-of-living environments such as San Francisco). Within thisguideline, participants are associated with or recruited by the various sponsoringorganizations. As reported earlier, these organizations represent a wide range ofcommunity development, social service, financial service, housing, and otherorganizations, all of which have a community development or anti-poverty mission.Another key feature of ADD participants is that, in response to an IDA programannouncement, they have come forward to participate. Because they come fromparticular programs and because ADD participants choose to participate, it is likely thatthe personal characteristics of ADD participants differ systematically from the personalcharacteristics of the general low-income population. Below is a summary of keydifferences between the ADD population and the overall U.S. population at or below200% of the income-poverty line.18
The ADD population has a greater percentage of females than the general low-incomepopulation (78% vs. 59%). Compared to the general low-income population, the ADDpopulation has fewer Caucasians (41% vs. 64%), more African Americans (40% vs.16%), and fewer Latinos (12% vs. 16%). The ADD population differs from the generallow-income population in having more people who are single and never married (46% vs.28%), and fewer people who are married (24% vs. 42%). The higher proportion ofwomen, the higher proportion of African Americans, and the higher proportion of peoplewho are single and never married in ADD, compared to the general low-incomepopulation, probably reflects the populations served by the sponsoring organizations.These markers of disadvantage (female, black, and single) may suggest that, among theworking poor population, somewhat more disadvantaged people are participating inADD.
On the other hand, the ADD population is much more highly educated than the generallow-income population. A higher percentage of ADD participants have completed highschool (85% vs. 65%), and a high percentage have graduated from college (20% vs. 8%).The ADD population has a much higher proportion of people who are employed full-timeor part-time (84% vs. 44%), and a lower proportion who are out of the labor market, i.e.,neither employed nor looking for work (5% vs. 52%). These differences are explained inlarge part by the targeting of most ADD programs to the working poor. Given thetargeting of the programs, ADD has little to say about whether IDAs can work for moredisadvantaged populations in terms of education and employment. More generally, ADDwill not be able to say anything about the question of overall demand for IDAs shouldthey be offered on a large scale.

13
Enrollment, Savings Outcomes, and Uses of IDAs
Enrollment began slowly in the start-up period and gradually increased. As of June 30,2000, there were 1326 participants in ADD, including 107 (8%) who had dropped out.Moving and inability to save were the most common reasons for dropping out. The meanand median length of participation at that date was nine months. Altogether, $378, 708had been saved by participants, with $741,609 in matching funds, for a total of$1,120,317.
There are many different ways to think about savings outcomes. Table 3 presents someof the basic savings outcome measures used in ADD, with data as of June 30, 1999. Atthis date, the mean and median length of participation was nine months. All outcomemeasures are reported for 1326 participants.
[Table 3 about here]
Participant savings is total participant deposits, minus unapproved withdrawals, plusinterest (matching funds are not included). Participant savings had a mean value of $285and a median of $181. The largest savings amount was $2,253. The size of the standarddeviation suggests that participant savings vary markedly across participants, but ofcourse this measure does not control for length of participation. Across the 14 ADDprograms, the program mean varied from a low of $104 to a high of $508; some of thisdifference is explained by different savings targets, some by length of time since start-up,and some by savings performance.
Average monthly deposit is participant savings divided by the number of months in theIDA program. Average monthly deposit had a mean value of $33 and a median value of$23. The highest average monthly deposit was $738. Again, the large standard deviationof $44 indicates considerable variation across participants. Across the 14 ADDprograms, the program mean varied from a low of $13 to a high of $61; some of thisdifference is explained by different savings targets, and some by savings performance.
Deposit regularity is the number of months in which deposits were made divided by thenumber of months in the IDA program. Deposit regularity has a mean value of 0.66 and amedian value of 0.70, indicating that the typical participant made deposits in seven out often months. The standard deviation was 0.29. Across the 14 ADD programs, theprogram mean varied from a low of 0.51 to a high of 0.84. It is interesting to note that,controlling for other variables, deposit regularity is not strongly related to averagemonthly deposit. Thus, different savings strategies can be successful. In particular, thelowest-income IDA participants are likely to be lumpier savers, but they save a higherproportion of their income.

14
Proportion of savings goal is participant saving compared to amount that could be savedand matched. Proportion of savings goal is perhaps the best measure of savingsperformance because it controls for both time and savings targets. Overall, the meanvalue is 0.71 and the median value is 0.59. In other words, ADD participants as a groupwere saving at a rate equivalent to 71 cents for every dollar they could save and bematched. The standard deviation of 0.84 suggests wide variation across participants.Across the 14 ADD programs, the program mean varied from a low of 0.40 to a high of1.07. This program level variation suggests that some programs are better at enablingIDA participants to “keep up” with their savings targets, however we do not yet know ifthose who are “behind” will make large deposits before the IDA savings period ends;indeed we can anticipate this pattern based on experience in a previous study of IDAs(Lazear, 1999).
Will ADD participants use their IDAs to purchase the intended assets? Looking atintended uses of accounts, 55% of participants intended to purchase a home, 17%microenterprise, 17% post-secondary education, 6% home repair, 3% retirement, and 2%job training. The strong interest in home ownership may be noteworthy, given that onlytwo of the 14 IDA programs in ADD is a housing organization. Turning to actual uses ofIDAs, as of June 30, 1999, 92 participants had made an “approved” (matched)withdrawal. Of these, 33% were for microenterprise, 27% home purchase, 20% homerepair, 13% post-secondary education, 4% retirement, and 3% job training. The largerpercentage for microenterprise compared to home purchase may be due to smalleramounts of capital needed to business supplies or a piece of equipment, compared to theamount needed for down payment and closing on a home. It is too early to know howmany ADD savers will purchase intended assets; we do know anecdotally that some arehappy just to have the savings.
Income Poverty and Savings
There is not space in this chapter to discuss program and participant characteristics thatare associated with savings performance in the early ADD research (see Sherraden et al.,2000). However, in this section one important relationship (or non-relationship) ishighlighted: income poverty and savings. When we look at average monthly depositsome rather striking patterns emerge. In Table 4 below, the median monthly deposit ofthe group at 50% of the poverty line and below was $20.10, while the median for thegroup at 176% to 200% of the poverty line was $25.30. This is an income difference ofover 300%, but a savings difference of only 26%. In bivariate analysis, income povertylevel is somewhat associated with average monthly deposit and is statistically significant,but in regression analysis the relationship is small (equivalent to $1.40 in averagemonthly deposit when going from 100 percent to 200 percent of the poverty line) and notstatistically significant (Sherraden, et al., 2000, chapter 12).
[Table 4 about here]

15
Further insight is gained by looking at the average monthly deposit divided by householdmonthly income (also shown in Table 4). Here we find that the group at 50% of thepoverty line and below was saving a median of 4.0% of monthly income, while the groupat 176 to 200% of the poverty line was saving 1.3% of monthly income. The mean valuesshow even greater differences (8.3% compared to 2.0%). Thus, in the IDA programs ofADD, the very poorest participants are saving at a far higher rate than those who arerelatively well off. (It should be noted that the very poor may appear to save at a higherrate because they have under-reported their incomes, but the level of under-reporting islikely to be small compared to the large size of the saving rate differences across incomelevels.)
These results are consistent with an institutional theory of saving, in which aninstitutional structure (in this case, the IDA program) is more explanatory than individualcharacteristics and constraints, even monthly income, in determining saving outcomes.The savings match and other IDA program features appear to have a strong effect onsavings choices of very low income IDA participants. We know from qualitative researchthat very low income participants are trying to respond to program expectations for thetarget savings amount. At the same time, the maximum matchable amount appears to bean economic cap (no additional economic incentive) and psychological cap (reaching thetarget savings amount) on average monthly deposit for higher income participants.Additional data on institutional savings issues will come from other research methods inADD.
At this point we are able to say only that some low-income working people respond wellto a program of matched savings. We are not yet able to say if they have simply shiftedassets or borrowed to make deposits. Cross-sectional survey data suggest a strong rolefor consumption efficiency, such as eating out less often (report forthcoming). A moredefinitive test will come with the experimental survey data. Academic work on assetbuilding policy and programs for the poor has barely begun. Many questions remainunanswered and more research will be required to ascertain whether the above thinkingabout saving has merit, in what ways, and for whom.
Conclusion
In closing, I return to the theme of inclusiveness. Taking the long view, I am reminded ofHeclo’s (1995) observation of the welfare state of the twentieth century: “If there hasbeen a direction to our century’s struggle, it seems to have been mainly a question ofexpanding presumptions of inclusiveness, of assuming that more people matter and thatthey matter as equals in aspirations for social welfare.” This observation is consistentwith T.H. Marshall’s (1964) historical interpretation of an expansion of rights, firstpolitical and economic rights, and finally “social rights” as a natural progression ofmodern society. Unfortunately, the past does not always predict the future, andMarshall’s theory of a natural progression toward social rights may be overly optimistic.Trends in the late twentieth century raise serious questions about inclusiveness.

16
Inequality of both income and assets has been growing in the United States (Levy, 1999;Wolff, this volume). As pointed out at the beginning of this chapter, there is apronounced shift toward asset-based domestic policy in the United States and it is farfrom inclusive.
Nonetheless, the shift to asset building continues, quite possibly because it is a better fitfor the post-industrial economy. Thoughtful proposals for asset building policy andprograms are becoming more common. For example, as one of eight strategies for policyaction in the twenty-first century, Steuerle, Gramlich, Heclo, and Nightengale (1998)include a proposal to “increase everyone’s chances to build financial security” by
. . . creating opportunities to accumulate assets for financial security,especially among those facing the greatest disadvantages. In this waysociety can give everyone a greater stake in the future and the commongood. Much of twentieth century social policy, ranging from welfare tosocial security, created a safety net by redistributing income. Withoutabandoning those redistributive aims, we must recognize the limits to thisapproach and how it can reduce incentives to create wealth. We shouldlook to the twenty first century as a time to move beyond simpleredistributive policy toward “cumulative” policy. The aim is to strike anew kind of balance between security and opportunity (pp. 7-8).
While I am pleased to see this call for “cumulative” policy as a complement to incomemaintenance, it is essential to bear in mind that at the present time cumulative publicpolicy is part of the structure of asset inequality. The challenges will be to change thepolicy structure so that everyone is included, and to undertake the extensive research thatwill be required to determine which policy and program features are most successful.

17
References
Ackerman, Bruce A., and Allstot, Anne (1999). The Stakeholder Society. New Haven:Yale University Press.
Bayer, P.J.; Bernheim, B.D., and Scholz, J.K. (1996). The Effects of Financial Educationin the Workplace: Evidence from a Survey of Employers, Working Paper No. 5655.Cambridge: National Bureau of Economic Research.
Bernheim, B.D., and Garrett, D.M. (1966). The Determinants and Consequences ofFinancial Education in the Workplace: Evidence from a Survey of Households, WorkingPaper No. 5667. Cambridge: National Bureau of Economic Research.
Beverly, Sondra (1997). How Can the Poor Save? Theory and Evidence on Saving inLow-Income Households, Working Paper 97-3. St. Louis: Center for Social Development,Washington University.
Beverly, Sondra, and Sherraden, Michael (1999). Institutional Determinants of Saving:Implications for Low-Income Households, Journal of Socio-Economics 28, 457-473.
Boskin, M.J. (1978). Taxation, Saving, and the Rate of Interest, Journal of PoliticalEconomy 86(2): S3-S27.
Caskey, John P. (1994). Fringe Banking: Check-Cashing Outlets, Pawnshops, and thePoor. New York: Russell Sage Foundation.
Clinton, William Jefferson (2000). State of the Union Address, January 27. Washington:U.S. Government Printing Office.
Cohen, S. (1994). Consumer Socialization: Children’s Saving and Spending. ChildhoodEducation 70(4): 244-246.
Corporation for Enterprise Development (1996). Universal Savings Accounts: A Route toNational Economic Growth and Family Economic Security. Washington: Corporation forEnterprise Development.
Curley, Jami, and Sherraden, Michael (forthcoming). Children’s Allowances: Lessons forChildren’s Savings Accounts, Child Welfare.
Danziger, Sheldon, and Plotnick, Robert (1986). Poverty and Policy: Lessons of the PastTwo Decades, Social Service Review 60(1): 34-51.
Duesenberry, J.S. (1949). Income, Saving and the Theory of Consumer Behavior.Cambridge: Harvard University Press.

18
European Commission, Directorate-General Employment, Industrial Relations and SocialAffairs (1995). Social Protection in Europe. Luxembourg: Official Publications of theEuropean Communities.
Friedman, Milton (1957). A Theory of the Consumption Function. Princeton: PrincetonUniversity Press.
Friedman, Robert E. (1988). The Safety Net As Ladder: Transfer Payments and EconomicDevelopment. Washington: Council of State Policy and Planning Agencies.
Gordon, W. (1980). Institutional Economics: The Changing System. Austin: University ofAustin Press.
Haveman, Robert (1988). Starting Even: An Equal Opportunity Program to Combat theNation’s New Poverty. New York: Simon and Schuster.
Heclo, Huge (1995). The Social Question, in K. McFate, R. Lawson, and W.J. Wilson,eds., Poverty, Inequality, and the Future of Social Policy. New York: Russell SageFoundation.
Howard, Christopher (1997). The Hidden Welfare State: Tax Expenditures and SocialPolicy in the United States. Princeton: Princeton University Press.
Hubbard, R.G.; Skinner, J.; and Zeldes, S.P. (1995). Precautionary Saving and SocialInsurance, Journal of Political Economy 103(2): 360-399.
Imbens, G.W.; Rubin, D.B.; and Sacerdote, B. (1999). Estimating the Effects of UnearnedIncome on Labor Supply, Earnings, Savings, and Consumption: Evidence from a Surveyof Lottery Winners, NBER Working Paper 7001. Cambridge, MA: National Bureau ofEconomic Research.
Johnson, Alice, and Sherraden, Michael (1992). Asset-Based Social Welfare Policy:Home Ownership for the Poor, Journal of Sociology and Social Welfare 19(3): 65-83.
Johnson, Elizabeth, and Hinterlong, James (1998). Management Information System forIndividual Development Accounts, Version 2.0, software. St. Louis: Center for SocialDevelopment, Washington University.
Katona, George (1975). Psychological Economics. New York: Elsevier.
Korczyk, Sophie M. (1998). How Americans Save. Washington: American Association ofRetired Persons.

19
Lazear, Diane (1999). Implementation and Outcomes of an Individual DevelopmentAccount Project, policy report. St. Louis: Center for Social Development, WashingtonUniversity.
Levy, Frank (1999). The New Dollars and Dreams. New York: Russell Sage Foundation.
Lindsey, Duncan (1994). The Welfare of Children. New York: Oxford University Press.
Maital, S., and Maital, S.L. (1994). Is the Future What It Used to Be? A BehavioralTheory of the Decline of Saving in the West, Journal of Socio-Economics 23(1/2): 1-32.
Marshall, T.H. (1964). Class, Citizenship, and Social Development. Garden City, NY:Doubleday.
Modigliani, F., and Brumberg, R. (1954). Utility Analysis and the Consumption Function:An Interpretation of Cross-Section Data, in K.K. Kurihara, ed., Post-KeynesianEconomics, 388-436. New Brunswick: Rutgers University Press.
Neal, W.C. (1987). Institutions, Journal of Economic Issues, 21(3): 1177-1206.
Oliver, Melvin, and Shapiro, Thomas (1990). Wealth of a Nation: A Reassessment ofAsset Inequality in America Shows at Least One Third of Households Are Asset Poor,American Journal of Economics and Sociology 49:129-51.
Oliver, Melvin, and Shapiro, Thomas (1995). Black Wealth/White Wealth: A NewPerspective on Racial Inequality. New York: Routledge.
Reed, Bruce (1990). Poor Man’s IRA, The Mainstream Democrat March: 4-5.
Sawhill, Isabelle (1989). “The Underclass: An Overview,” The Public Interest96(summer): 3-15.
Sen, Amartya (1985). Commodities and Capabilities. Amsterdam: North-HollandPublishing Company.
Sen, Amartya (1993). Capability and Well-being, in M. Nussbaum and A. Sen, eds., TheQuality of Life, 30-53. Oxford: Clarendon Press.
Shefrin, H.M., and Thaler, R.H. (1988). The Behavioral Life-Cycle Hypothesis,Economic Inquiry 26: 609-643.
Sherraden, Michael (1988). Rethinking Social Welfare: Toward Assets, Social Policy18(3): 37-43.

20
Sherraden, Michael (1991). Assets and the Poor: A New American Welfare Policy.Armonk, NY: M.E. Sharpe.
Sherraden, Michael (1997). Conclusion: Social Security in the Twenty-first Century, inJames Midgley and Michael Sherraden, eds., Alternatives to Social Security: AnInternational Inquiry. Westport, CT: Auburn House.
Sherraden, Michael (1999). Key Questions in Asset Building Research, revised. St. Louis:Center for Social Development, Washington University.gwbweb.wustl.edu/Users/csd/question/html
Sherraden, Michael; Johnson, Elizabeth; Clancy, Margaret; Beverly, Sondra; Schreiner,Mark; Zhan, Min; & Curly, Jami (2000). Saving Patterns in IDA Programs. St. Louis:Center for Social Development, Washington University.
Sherraden, Michael; Page-Adams, Deborah; Emerson, Shirley; Beverly, Sondra; Scanlon,Edward; Cheng, Li-Chen; Sherraden, Margaret S.; and Edwards, Karen (1995). IDAEvaluation Handbook. St. Louis: Center for Social Development, Washington University.
Sherraden, Michael; Page-Adams, Deborah; and Yadama, Gautam (1995). Assets and theWelfare State: Policies, Proposals, Politics, and Research, in R.E. Ratcliff, M.L. Oliver,and T.M. Shapiro, eds., The Politics of Wealth and Inequality (Research in Politics andSociety, vol. 5): 241-268.
Stegman, Michael (1999). Savings and the Poor: The Hidden Benefits of ElectronicBanking. Washington: Brookings Institution.
Steuerle, Eugene; Gramlich, Edward; Heclo, Hugh; and Nightengale, Demetra Smith(1998). The Government We Deserve: Responsive Democracy and ChangingExpectations. Washington: Urban Institute.
Summers, L.H. (1981). Capital Taxation and Accumulation in the Life Cycle GrowthModel, American Economic Review 71(4), 533-544.
Thaler, R.H., and Shefrin, H.M. (1981). An Economic Theory of Self-Control, Journal ofPolitical Economy 89(2): 392-401.
Tobin, James (1968). Raising the Incomes of the Poor, in K. Gordon, ed., Agenda for theNation, 77-116. Washington: Brookings Institution.
U.S. Congress (1996). Personal Responsibility and Work Opportunity Reconciliation Act.Washington: U.S. Government Printing Office.
21
U.S. Congress (1998). Assets for Independence Act. Washington: U.S. GovernmentPrinting Office.
U.S. Congress, Joint Committee on Taxation (1998). Estimates of Federal TaxExpenditures for the Years 1999-2003. Washington: U.S. Government Printing Office.
U.S. Executive Office of the President, Office of Management and Budget (1998). Budgetof the United States Government, Analytical Perspectives. Washington: U.S. GovernmentPrinting Office.
U.S. Executive Office of the President, Office of the Press Secretary (1999). PressBriefing by Director of the National Council Gene Sperling, and Deputy Secretary of theTreasury Larry Summers. Washington: The White House, April 14.
The White House (2000). President Clinton’s Plan to Provide Fiscally ResponsibleTargeted Tax Cuts to Promote Savings, Child Care, Family, and Philanthropy, January27. Washington: The White House.
Wolff, Edward N. (1987). Estimates of Wealth Inequality in the U.S., 1962-1983, Reviewof Income and Wealth 33(3): 231-242.

22
Table 1Estimated Federal Tax Expenditures:
Proportion in Asset Building Categories(Fiscal Year 2000, Billions of Dollars)
Asset-Building Tax Expenditures to Individuals
Homeownership $75.2mortgage interest deduction,exclusion of capital gains, etc.
Retirement Accounts $123.6exclusion of pension contributions,IRAs, Keoghs, etc.
Investments and Business Property $89.7 capital gains rates and exclusions,exclusion of interest on governmentbonds, etc.
Total of Three Asset Building Tax Expenditures $288.5
All Other Tax Expenditures to Individuals $219.8 Total Tax Expenditures to Individuals $508.3
_________
Source: Calculated from data in U.S. Congress, Joint Committee on Taxation (1998).Estimates of Federal Tax Expenditures for the Years 1999-2003.

23
Table 2Hypotheses on Institutional Determinants of Savings
Incentives:• The higher the matching deposits, the greater the participation and savings.• The higher the earnings on savings, the greater the participation and savings.• The more feasible the saving goal (home purchase, microenterprise, job
training, etc.), the greater the participation and savings.Information:
• The more the program outreach, the greater the participation and savings.• The more educational programming and “economic literacy,” the greater the
participation and savings.• The more peer modeling and information sharing, the greater the participation
and savings.Access:
• The closer the proximity of the savings program, the greater the participationand savings.
• The more the use of electronic deposits, the greater the participation andsavings.
• The fewer the organizational barriers, the greater the participation and savings.Facilitation:
• The more involved the program and staff in assisting with savings, the greaterthe participation and savings.
• The more automatic the system (especially automatic deposits), the greater theparticipation and savings.
____________
Source: Sherraden (1999). Key Questions in Asset-Building Research.

24
Table 3
Savings Outcomes in a Demonstration of Individual Development Accounts (IDAs)
N=1326
Mean Median Standard Deviation
Participant Savings
$286 $181 $309
Average Monthly Deposit
$33 $23 $44
Deposit Regularity
0.66 0.70 0.29
Proportion of Savings Goal
0.71 0.59 0.84
___________ Notes: Participant savings is total participant deposits, minus unapproved withdrawals,plus interest. Average monthly deposit is participant savings divided by the number ofmonths in the IDA program. Deposit regularity is number of months in which depositswere made divided by the number of months in the program. Proportion of savings goalis participant savings divided by the amount that could be saved and matched. At thisdata collection point, June 30, 1999, the mean and median length of participation wasnine months. Source: Sherraden et al. (2000), Savings Patterns in IDA Programs.

25
Table 4
Savings by Poverty Level in a Demonstration of IDAsN=1326
Average Monthly DepositIn Dollars
Average Monthly Deposit/Household Monthly Income
Income Poverty Level Mean Median Mean Median
.50 and Below 29.10 20.10 0.083 0.040
.51 to .75 31.00 19.50 0.038 0.023
.76 to 1.00 30.60 22.60 0.031 0.0231.01 to 1.25 36.60 22.50 0.029 0.0181.26 to 1.50 35.80 28.00 0.025 0.0181.51 to 1.75 31.60 24.10 0.020 0.0151.76 to 2.00 38.20 25.30 0.020 0.013Over 2.00 36.30 34.40 0.017 0.014
Total 33.30 23.50 0.033 0.019 Source: Sherraden et al. (2000), Savings Patterns in IDA Programs.

26
Notes
1 It is a special pleasure to participate in this symposium on asset ownership, a topic thatis drawing increasing attention in public policy and community development. Theleadership of the Ford Foundation, especially Vice President Melvin Oliver, has been amajor catalyst to asset building projects as well as research and academic debate. Thesymposium organizers, Tom Shapiro and Ed Wolff, have contributed to a body ofacademic work that has put this topic on the table for discussion. The title of thesymposium, “Benefits and Mechanisms of Asset Ownership,” indicates a commitment toapplication, and the distinguished scholars in this forum reflect the highest standards ofacademic inquiry and debate. I am grateful to all of the conference participants for theirpapers and discussion. My thinking particularly benefited from the summative commentsof Tim Smeeding and Bob Haveman.
2 I thank Jami Curley for calculating year 2000 estimates of federal direct expendituresand tax expenditures (U.S. Executive Office of the President, 1998; U.S. Congress, JointCommittee on Taxation, 1998).
3 Current U.S. homeownership policy is a misguided use of public funds. At thehousehold level, there is not a good rationale for subsidizing luxury housing and thispolicy is unjust to the majority of U.S. households. At the macroeconomic level, largeresidential dwellings provide a low return on capital. A better policy would promotehomeownership across a broader population. Benefits should be progressive, or at leastequal, so that more low-income and low-wealth families could become homeowners.
4 President Bill Clinton, “Universal Savings Accounts,” speech at The White House,April 14, 1999. Figures on retirement tax benefits confirmed in a press conference thatday by then Deputy Secretary of the Treasury, Larry Summers (U.S. Executive Office ofthe President, 1999).
5 The emphasis in proposals for capital accounts has been on providing lump sumresources for welfare and consumption choices at age 18 or 21. A more recent versionhas been offered in 1999 by two law professors (Ackerman and Allstot, 1999). However,the lump sum idea may not be good policy. A study of lottery winners finds that thosewho win about $15,000 per year considerably reduce the amount held in retirementaccounts, in bonds and mutual funds, and in general savings (Imbens, Rubin, andSacerdote, 1999). Instead of lump sum deposits, I have suggested long-term andsystematic asset accumulation in Individual Development Accounts with deposits at birthand throughout the growing up years (Sherraden, 1991). In another version of this,Lindsey (1994) proposes a Child Social Security Account, wherein assets would build

27
over time by government and private contributions. Lindsey points to the likely positivechanges that would result from the experience of saving and investing.
6 Despite a stronger federal policy emphasis on homeownership for the poor in recentyears, most low-income housing programs still concentrate on rental housing.Homeownership for the poor has been a somewhat controversial strategy, but there isreason to believe that it can be effective (Johnson and Sherraden, 1992).
7 MIS IDA software is, to our knowledge, the first example of an information technologytool that collects real time data from multiple sites, created at the beginning of a policyinnovation.
8 Ray Boshara’s policy work at CFED was highly instrumental in enactment of the Assetsfor Independence Act.
9 For summaries of state IDA policies, see CSD’s web site atgwbweb.wustl.edu/Users/csd/stateIDAprofiles/html
10 See CFED’s web page for information on operating IDA programs, atwww.cfedonline.org
11 Children’s Savings Accounts were proposed by Senator Bob Kerry (D-NE) in a speechentitled “Who Owns America: A New Economic Agenda,” at the National Press Club,September 17, 1997. Republicans Paul Coverdell, Newt Gingrich, and Robert Torricelliproposed a form of educational savings accounts shortly thereafter (“Accounts for Kids,”Washington Post, October 23, 1997, A23).
12 The concept and name USAs has been presented by CFED and CSD over the pastseveral years. Early experience with IDAs was influential in the White House decision topropose USAs. In designing USAs, the Treasury Department asked CSD for early datafrom the “American Dream Demonstration” showing that, with matching funds, at leastsome of the poor will be able to save. At the time of the President’s State of the UnionAddress, CFED and CSD were meeting in Washington on “Universal Savings Accounts,”with experts who form a Growing Wealth Working Group, co-chaired by Friedman,Boshara, and Sherraden.
13 In his State of the Union Address on January 27, 2000, President Clinton said: Tens of millions of Americans live from paycheck to paycheck. As hardas they work, they still don’t have the opportunity to save. Too few canmake use of IRAs and 401(k) plans. We should do more to help allworking families save and accumulate wealth. That’s the idea behind theIndividual Development Accounts, the IDAs. I ask you to take that idea toa new level, with new retirement savings accounts that enable every low-

28
and moderate-income family in America to save for retirement, a firsthome, a medical emergency, or a college education. I propose to matchtheir contributions, however small, dollar for dollar, every year they save.
In a separate publication, the White House (2000) also pointed to the influence of IDAresearch which is now published in the CSD report, Saving Patterns in IDA Programs.
14 I thank Sandy Beverly (1997) for her summation of saving theory and evidence.
15 To take one example of the importance of facilitation, an unsuccessful IDA participanton whom we are conducting a case study in ADD was able to save at only one period inher life, when she had a payroll deduction plan, even though there was no matches fromthe employer. In contrast, she is so far unable to save in the IDA program, even thoughher savings would be matched.
16 The American Dream Demonstration is funded by the Ford Foundation, CharlesStewart Mott Foundation, Joyce Foundation, Citigroup Foundation, F.B. HeronFoundation, John D. and Catherine T. MacAurther Foundation, Fannie Mae Foundation,Levi Strauss Foundation, Ewing Marion Kauffman Foundation, Rockefeller Foundation,and the Moriah Fund.
17 A more comprehensive and flexible Version 3.0 of MIS IDA is now available. MISIDA was originally designed by CSD as a research instrument, but it has become thestandard for IDA program operations, and is now in use by at least 150 IDA programs.MIS IDA tracks and provides reports on the sometimes complex financial arrangementsamong funders, programs, and participants.
18 Comparison statistics are from the U.S. Census Bureau’s Survey of Income andProgram Participation (SIPP). These data (which come from the ninth wave of the 1993SIPP panel) refer to September 1995. The sample includes individuals 18 years old andolder who were living in households with income at or below 200% of the appropriateofficial poverty threshold. To obtain annual household income, we multiplied householdincome for the month of September by 12. Data on employment status refer tocharacteristics as of the first week of September 1995. The “bank use” variable identifiesindividuals living in households that had a checking or savings account in the first quarterof 1995. The data are weighted by person-level weights provided by the Census Bureau.