asset-based estimates for default probabilities for ... · pdf filea large historical default...
TRANSCRIPT
Structural ModelsKMV-Model
CreditGrades ModelEmpirical Results
Asset-based Estimates for Default Probabilitiesfor Commercial Banks
Luitgard Veraart
Statistical Laboratory, University of Cambridge
September 2005
Luitgard Veraart Estimating Default Probabilities for Banks

Structural ModelsKMV-Model
CreditGrades ModelEmpirical Results
Outline
Structural Models
KMV-Model
CreditGrades ModelModel Inputs and OutputsModel DescriptionClassical CreditGrades vs. “exact” CreditGrades
Empirical Results
Luitgard Veraart Estimating Default Probabilities for Banks

Structural ModelsKMV-Model
CreditGrades ModelEmpirical Results
Challenges of modelling default probabilities for banks
Two main challenges
◮ Banks have opaque liabilities.◮ Unclear maturity profile: distinction between long-term and
short-term liabilities difficult.◮ Banks are highly leveraged but do not behave like other highly
leveraged industrial companies (e.g. w.r.t. asset volatilities).
◮ Number of banks ≪ number of industrials.◮ Less default data for banks available.◮ Model calibration difficult.
Luitgard Veraart Estimating Default Probabilities for Banks
Structural ModelsKMV-Model
CreditGrades ModelEmpirical Results
Black-Scholes-Merton Default ModelFirst-Passage-Time Models
Structural Models
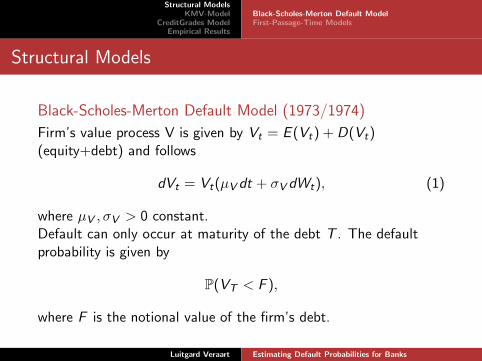
Black-Scholes-Merton Default Model (1973/1974)
Firm’s value process V is given by Vt = E (Vt) + D(Vt)(equity+debt) and follows
dVt = Vt(µV dt + σV dWt), (1)
where µV , σV > 0 constant.Default can only occur at maturity of the debt T . The defaultprobability is given by
P(VT < F ),
where F is the notional value of the firm’s debt.
Luitgard Veraart Estimating Default Probabilities for Banks

Structural ModelsKMV-Model
CreditGrades ModelEmpirical Results
Black-Scholes-Merton Default ModelFirst-Passage-Time Models
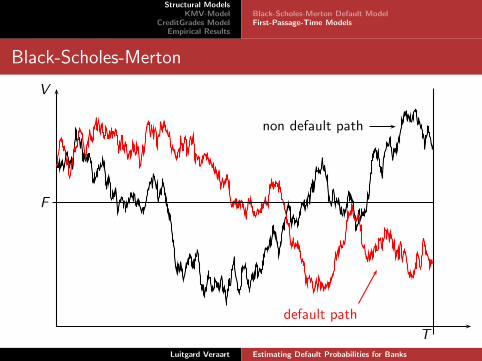
Black-Scholes-Merton
T
F
V
default path
non default path
Luitgard Veraart Estimating Default Probabilities for Banks

Structural ModelsKMV-Model
CreditGrades ModelEmpirical Results
Black-Scholes-Merton Default ModelFirst-Passage-Time Models
The probability of default at time T given the asset value Vt attime t is given by
P(VT < F |Vt) = P(log(VT ) < log(F )|Vt)
= P
WT − Wt√T − t
< −log
(
Vt
F
)
+(
µV − σ2V
2
)
(T − t)
σV
√T − t
= Φ
−log
(
Vt
F
)
+(
µV − σ2V
2
)
(T − t)
σV
√T − t
Luitgard Veraart Estimating Default Probabilities for Banks

Structural ModelsKMV-Model
CreditGrades ModelEmpirical Results
Black-Scholes-Merton Default ModelFirst-Passage-Time Models
Structural Models
First-Passage-Time Models (Black and Cox, 1976)
Default can now occur at any time and not only at the maturity ofthe debt T .
DefinitionThe passage time Tb to a level b ∈ R is defined by
TYb (ω) = inf{t ≥ 0 : Yt(ω) = b},
where Y is a stochastic process.
Luitgard Veraart Estimating Default Probabilities for Banks

Structural ModelsKMV-Model
CreditGrades ModelEmpirical Results
Black-Scholes-Merton Default ModelFirst-Passage-Time Models
TheoremConsider the process Y that equals Yt = at + bWt with constant a
and b, b > 0 and W a standard Brownian motion. Let us denote
by mYt the running minimum of Y , i.e. mY
t = mins∈[0,t] Ys . Then
the following formula is valid for every y ≤ 0:
P(mYt ≥ y) = Φ
(−y + at
b√
t
)
− e2ayb−2Φ
(
y + at
b√
t
)
,
where Φ denotes the standard normal cumulative distribution
function.
The relationship between this running minimum and passage timesis given by
P(mYt ≥ y) = P(TY
y ≥ t).
Luitgard Veraart Estimating Default Probabilities for Banks

Structural ModelsKMV-Model
CreditGrades ModelEmpirical Results
Black-Scholes-Merton Default ModelFirst-Passage-Time Models
Survival Probability
The probability that the asset value process does not reach theboundary until time T given that no default has occurred untiltime t is given by
P(log(Vs) ≥ log(F ),∀s ∈ [t,T ]∣
∣Vt)
= P(
m(s − t) + (Ws − Wt) ≥ −DDt ,∀s ∈ [t,T ]∣
∣Vt
)
= Φ
(
DDt + m(T − t)√T − t
)
− exp(−2mDDt)Φ
(−DDt + m(T − t)√T − t
)
,
where m := 1σV
(µV − σ2V
2 ), DDt := log(Vt)−log(F )σV
.
Luitgard Veraart Estimating Default Probabilities for Banks
Structural ModelsKMV-Model
CreditGrades ModelEmpirical Results
Black-Scholes-Merton Default ModelFirst-Passage-Time Models
Black-Scholes-Merton
T
F
V
default path
non default path
Luitgard Veraart Estimating Default Probabilities for Banks

Structural ModelsKMV-Model
CreditGrades ModelEmpirical Results
Black-Scholes-Merton Default ModelFirst-Passage-Time Models
Black-Cox
T
F
V
default path
default path
Luitgard Veraart Estimating Default Probabilities for Banks

Structural ModelsKMV-Model
CreditGrades ModelEmpirical Results
Main IdeaEstimation of Asset Value and Asset VolatilityCalculation of Distance-to-defaultCalculation of Default Probability
KMV-Model
Basic idea:Firm’s equity is interpreted as a perpetual option.Default point is the absorbing barrier of firm’s asset value.Default occurs as soon as the asset value hits the default point.
Estimation requires three steps:
◮ Estimation of asset value and asset volatility
◮ Calculation of distance to default.
◮ Calculation of default probability.
KMV-Model is not completely published; it uses a proprietarydata base.
Luitgard Veraart Estimating Default Probabilities for Banks

Structural ModelsKMV-Model
CreditGrades ModelEmpirical Results
Main IdeaEstimation of Asset Value and Asset VolatilityCalculation of Distance-to-defaultCalculation of Default Probability
Estimation of Asset Value and Asset Volatility
Capital structure: equity, short-term debt, long-term debt(modelled as perpetuity).The value of equity VE and equity volatility σE > 0 are given by
VE = f (V , σV ,K , c , r) and
σE = g(V , σV ,K , c , r),(2)
where
◮ K leverage ratio of capital structure,
◮ c average coupon paid on the long-term debt,
◮ r risk-free interest rate,
◮ functions f , g determined by option pricing theory.
Equations (2) can be solved simultaneously for V and σV .
Luitgard Veraart Estimating Default Probabilities for Banks

Structural ModelsKMV-Model
CreditGrades ModelEmpirical Results
Main IdeaEstimation of Asset Value and Asset VolatilityCalculation of Distance-to-defaultCalculation of Default Probability
Calculation of Distance-to-default
The distance to default (DD) is given by
DD =market value of assets - default point
(market value of assets)(asset volatility),
where the default point (DP) is given by
DP = short-term debt +1
2long-term debt.
Luitgard Veraart Estimating Default Probabilities for Banks

Structural ModelsKMV-Model
CreditGrades ModelEmpirical Results
Main IdeaEstimation of Asset Value and Asset VolatilityCalculation of Distance-to-defaultCalculation of Default Probability
Calculation of Default Probability
No analytic, strictly model-based default probability is computed.A large historical default database is used to assign a defaultprobability (EDF=Expected Default Frequency) to different levelsof the distance to default.
Distance-to-default
EDF
Luitgard Veraart Estimating Default Probabilities for Banks

Structural ModelsKMV-Model
CreditGrades ModelEmpirical Results
Model Inputs and OutputsModel DescriptionClassical CreditGrades vs. “exact” CreditGrades
CreditGrades: Model Inputs and Outputs
MarketObservables:
◮ Equity prices
◮ Equityvolatility
◮ Risk-freeRate
+
Balance SheetInformation:
◮ Debt pershare
◮ Recoveryrate
=
CreditGradesModel:
◮ CreditSpreads
◮ DefaultProbabilities
CreditGrades is in contrast to KMV an open model.
Luitgard Veraart Estimating Default Probabilities for Banks

Structural ModelsKMV-Model
CreditGrades ModelEmpirical Results
Model Inputs and OutputsModel DescriptionClassical CreditGrades vs. “exact” CreditGrades
Model Description
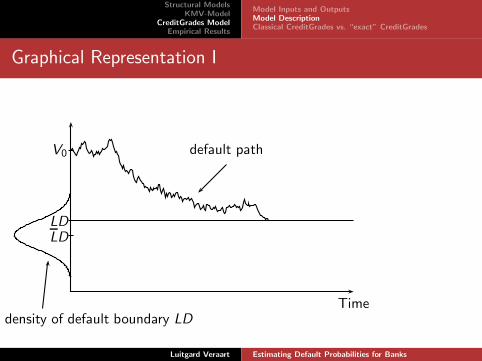
In the CreditGrades model default is defined as the first time thata stochastic process V crosses the default barrier LD.
◮ The stochastic process V is the asset value process on a pershare basis for the firm, and
dVt = σVtdWt ,
with σ > 0.
◮ The default barrier is the amount of the firm’s assets thatremain in the case of default, which is LD where L is therecovery rate and D the firm‘s debt-per-share.
Luitgard Veraart Estimating Default Probabilities for Banks

Structural ModelsKMV-Model
CreditGrades ModelEmpirical Results
Model Inputs and OutputsModel DescriptionClassical CreditGrades vs. “exact” CreditGrades
Modelling the Recovery Rate
◮ Historical data show randomness of L.
◮ The recovery rate L is modelled as a lognormal randomvariable
L = LeλZ−λ2/2,
with λ,L ∈ R+, Z ∼ N(0, 1).Z and hence L is assumed to be independent of W .
◮ The default barrier LD is then given by
LD = LDeλZ−λ2/2.
Luitgard Veraart Estimating Default Probabilities for Banks
Structural ModelsKMV-Model
CreditGrades ModelEmpirical Results
Model Inputs and OutputsModel DescriptionClassical CreditGrades vs. “exact” CreditGrades
Graphical Representation I
Time
LDLD
density of default boundary LD
V0 default path
Luitgard Veraart Estimating Default Probabilities for Banks
Structural ModelsKMV-Model
CreditGrades ModelEmpirical Results
Model Inputs and OutputsModel DescriptionClassical CreditGrades vs. “exact” CreditGrades
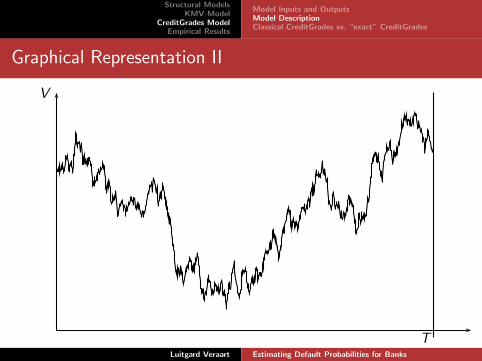
Graphical Representation II
T
V
Luitgard Veraart Estimating Default Probabilities for Banks

Structural ModelsKMV-Model
CreditGrades ModelEmpirical Results
Model Inputs and OutputsModel DescriptionClassical CreditGrades vs. “exact” CreditGrades
Graphical Representation II
LD
non default path
T
V
Luitgard Veraart Estimating Default Probabilities for Banks

Structural ModelsKMV-Model
CreditGrades ModelEmpirical Results
Model Inputs and OutputsModel DescriptionClassical CreditGrades vs. “exact” CreditGrades
Graphical Representation II
LD
default path
T
V
Luitgard Veraart Estimating Default Probabilities for Banks

Structural ModelsKMV-Model
CreditGrades ModelEmpirical Results
Model Inputs and OutputsModel DescriptionClassical CreditGrades vs. “exact” CreditGrades
Survival Probability
Default does not occur as long as
Vt > LD
⇐⇒ V0eσWt−σ2t/2 > LDeλZ−λ2/2,
where V0 initial asset value per share.The probability that the asset value does not reach the barrierbefore time t is the survival probability of the company up to timet.This survival probability is the quantity of interest in CreditGrades.
Luitgard Veraart Estimating Default Probabilities for Banks

Structural ModelsKMV-Model
CreditGrades ModelEmpirical Results
Model Inputs and OutputsModel DescriptionClassical CreditGrades vs. “exact” CreditGrades
Computing the Survival Probability
Define a process
Xt = σWt − λZ − σ2t
2− λ2
2.
Then default does not occur as long as
Xt > log
(
LD
V0
)
− λ2.
We need to compute
P(Vs > LD,∀s < t) = P(Xs > log
(
LD
V0
)
− λ2,∀s < t).
Luitgard Veraart Estimating Default Probabilities for Banks
Structural ModelsKMV-Model
CreditGrades ModelEmpirical Results
Model Inputs and OutputsModel DescriptionClassical CreditGrades vs. “exact” CreditGrades
Classical CreditGrades vs. “exact” CreditGrades
Determining the survival probability
Two possibilities to determine the survival probability:
1. (Finger et al. 2002) use an approximation X of X anddetermine a closed-form formula for the survival probability.
2. However, an explicit formula for the exact survival probabilitycan also be determined (Veraart 2004).
Luitgard Veraart Estimating Default Probabilities for Banks
Structural ModelsKMV-Model
CreditGrades ModelEmpirical Results
Model Inputs and OutputsModel DescriptionClassical CreditGrades vs. “exact” CreditGrades
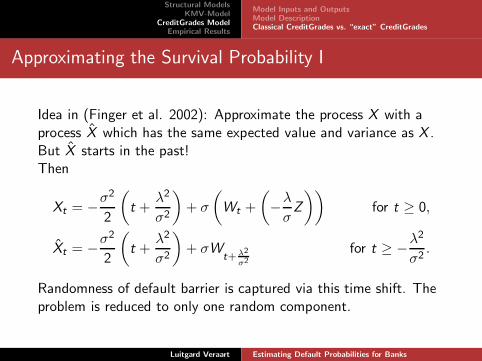
Approximating the Survival Probability I
Idea in (Finger et al. 2002): Approximate the process X with aprocess X which has the same expected value and variance as X .But X starts in the past!Then
Xt = −σ2
2
(
t +λ2
σ2
)
+ σ
(
Wt +
(
−λ
σZ
))
for t ≥ 0,
Xt = −σ2
2
(
t +λ2
σ2
)
+ σWt+ λ2
σ2
for t ≥ −λ2
σ2.
Randomness of default barrier is captured via this time shift. Theproblem is reduced to only one random component.
Luitgard Veraart Estimating Default Probabilities for Banks

Structural ModelsKMV-Model
CreditGrades ModelEmpirical Results
Model Inputs and OutputsModel DescriptionClassical CreditGrades vs. “exact” CreditGrades
Approximating the Survival Probability II
Standard results from first-passage times of Brownian motion withdrift give the (approximated) survival probability up to time t
P(t) = Φ
(
−At
2+
log(d)
At
)
− dΦ
(
−At
2− log(d)
At
)
(3)
where
A2t = σ2t + λ2,
d =V0e
λ2
LD.
The survival probability as given by (3) includes the possibility
of default in the period (−λ2
σ2 , 0]!
Luitgard Veraart Estimating Default Probabilities for Banks

Structural ModelsKMV-Model
CreditGrades ModelEmpirical Results
Model Inputs and OutputsModel DescriptionClassical CreditGrades vs. “exact” CreditGrades
Theorem (Veraart 2004): Exact Formula
The exact survival probability up to time t is given by
PE (t) = P(Vs > LD,∀s < t) = P(Xs > log(
LDV0
)
− λ2,∀s < t)
= Φ2
(
−λ
2+
log(d)
λ,−At
2+
log(d)
At
;λ
At
)
− d Φ2
(
λ
2+
log(d)
λ,−At
2− log(d)
At;− λ
At
)
,
where A2t = σ2t + λ2 and d = V0e
λ2
LDand
Φ2(a, b; ρ) =
a∫
−∞
b∫
−∞
1
2π√
1 − ρ2exp
(
−1
2
(
x2 − 2ρxy + y2
1 − ρ2
))
dx dy
Luitgard Veraart Estimating Default Probabilities for Banks

Structural ModelsKMV-Model
CreditGrades ModelEmpirical Results
Model Inputs and OutputsModel DescriptionClassical CreditGrades vs. “exact” CreditGrades
Comments
◮ The approximated survival probability (CreditGrades formula)
includes the possibility of default in the period (−λ2
σ2 , 0]!
◮ The exact formula in (Veraart 2004) is not the formula givenin (Finger et al. 2002).
◮ “For practical purposes, the numerical differences between thesurvival probabilities given by the two approaches aremarginal” (Finger et al. 2002).Is that still true for banks???
Luitgard Veraart Estimating Default Probabilities for Banks
Structural ModelsKMV-Model
CreditGrades ModelEmpirical Results
Model Inputs and OutputsModel DescriptionClassical CreditGrades vs. “exact” CreditGrades
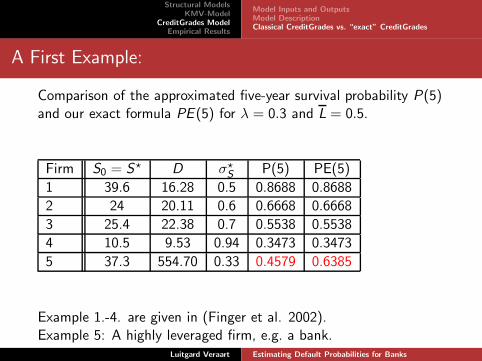
A First Example:
Comparison of the approximated five-year survival probability P(5)and our exact formula PE (5) for λ = 0.3 and L = 0.5.
Firm S0 = S⋆ D σ⋆S P(5) PE(5)
1 39.6 16.28 0.5 0.8688 0.8688
2 24 20.11 0.6 0.6668 0.6668
3 25.4 22.38 0.7 0.5538 0.5538
4 10.5 9.53 0.94 0.3473 0.3473
5 37.3 554.70 0.33 0.4579 0.6385
Example 1.-4. are given in (Finger et al. 2002).Example 5: A highly leveraged firm, e.g. a bank.
Luitgard Veraart Estimating Default Probabilities for Banks
Structural ModelsKMV-Model
CreditGrades ModelEmpirical Results
The DataKMV-Empirical ResultsCreditGrades - Empirical Results
The Data1
Three banks: Commerzbank AG, Deutsche Bank AG andBayerische HypoVereinsbank AG.
◮ KMV-Data: Monthly data of EDF for three banks from June2000 until September 2003.
◮ Data for CreditGrades:Market and balance sheet data from Bloomberg.
◮ Commerzbank and HypoVereinsbank: data range June 2000until December 2003.
◮ Deutsche Bank: data range March 2002 until September 2003.
Balance sheet data are available quarterly, stock price datadaily (trading days).
1The data have been kindly supplied by Deutsche Bundesbank.
Luitgard Veraart Estimating Default Probabilities for Banks

Structural ModelsKMV-Model
CreditGrades ModelEmpirical Results
The DataKMV-Empirical ResultsCreditGrades - Empirical Results
KMV-EDF
Time
EDF
Jun 00 Dec 00 Jun 01 Dec 01 Jun 02 Dec 02 Jun 03
0.0
0.00
50.
010
0.01
50.
020 Commerzbank
Deutsche BankHypoVereinsbank
◮ DB lowest EDF([0.0002, 0.0015]),
◮ CB highest EDFuntil June 2002,afterwards HVBhighest EDF.
◮ EDF of DB quitestable in contrast toHVB and CB
Luitgard Veraart Estimating Default Probabilities for Banks

Structural ModelsKMV-Model
CreditGrades ModelEmpirical Results
The DataKMV-Empirical ResultsCreditGrades - Empirical Results
CreditGrades - Empirical Results
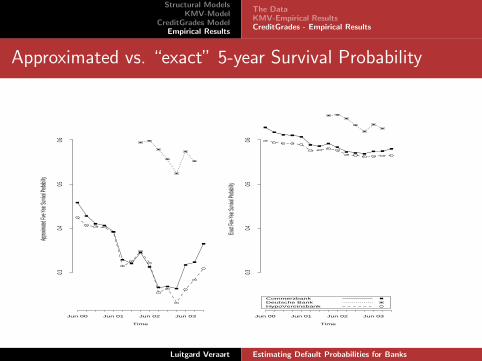
◮ Approximated vs. “exact” CreditGrades
◮ Choice of model parameters, in particular for λ = V(log(L))and computation of the debt-per-share.
Luitgard Veraart Estimating Default Probabilities for Banks
Structural ModelsKMV-Model
CreditGrades ModelEmpirical Results
The DataKMV-Empirical ResultsCreditGrades - Empirical Results
Approximated vs. “exact” 5-year Survival Probability
Time
Approx
imated
Five-Y
ear Su
rvival P
robabi
lity
Jun 00 Jun 01 Jun 02 Jun 03
0.30.4
0.50.6
Time
Exact F
ive-Ye
ar Surv
ival Pr
obabilit
y
Jun 00 Jun 01 Jun 02 Jun 03
0.30.4
0.50.6
CommerzbankDeutsche BankHypoVereinsbank
Luitgard Veraart Estimating Default Probabilities for Banks
Structural ModelsKMV-Model
CreditGrades ModelEmpirical Results
The DataKMV-Empirical ResultsCreditGrades - Empirical Results
Choice of Model Parameters
◮ We modify the computation of the debt per share byeliminating the short term liabilities.
◮ For industrials, CreditGrades uses λ = 0.3. Since the financialsector is strongly regulated, we expect λ to be lower for thefinancial sector. We choose λ = 0.1.
◮ Both modifications seem to improve the model.
Luitgard Veraart Estimating Default Probabilities for Banks

Structural ModelsKMV-Model
CreditGrades ModelEmpirical Results
The DataKMV-Empirical ResultsCreditGrades - Empirical Results
Choice of Model Parameters
Time
Five-y
ear Su
rvival P
robabi
lity
Jun 00 Dec 00 Jun 01 Dec 01 Jun 02 Dec 02 Jun 03 Dec 03
0.30.4
0.50.6
0.70.8 Commerzbank
Deutsche BankHypoVereinsbank
Time
Five-y
ear Su
rvival P
robabi
lity for
Financ
ials
Jun 00 Dec 00 Jun 01 Dec 01 Jun 02 Dec 02 Jun 03 Dec 03
0.30.4
0.50.6
0.70.8
CommerzbankDeutsche BankHypoVereinsbank
Luitgard Veraart Estimating Default Probabilities for Banks

Structural ModelsKMV-Model
CreditGrades ModelEmpirical Results
The DataKMV-Empirical ResultsCreditGrades - Empirical Results
Where we started ...
KMV
Time
ED
F
Jun 00 Sep 00 Dec 00 Mar 01 Jun 01 Sep 01 Dec 01 Mar 02 Jun 02 Sep 02 Dec 02 Mar 03 Jun 03 Sep 03
0.0
00
0.0
05
0.0
10
0.0
15
0.0
20
CommerzbankDeutsche BankHypoVereinsbank
0.02
Standard CreditGrades
Time
Ap
pro
xim
ate
d O
ne
−Y
ea
r D
efa
ult P
rob
ab
ility
Jun 00 Sep 00 Dec 00 Mar 01 Jun 01 Sep 01 Dec 01 Mar 02 Jun 02 Sep 02 Dec 02 Mar 03 Jun 03 Sep 03
0.0
0.2
0.4
0.6
0.8
CommerzbankDeutsche BankHypoVereinsbank
0.8
Luitgard Veraart Estimating Default Probabilities for Banks

Structural ModelsKMV-Model
CreditGrades ModelEmpirical Results
The DataKMV-Empirical ResultsCreditGrades - Empirical Results
Where we are ...
KMV
Time
ED
F
Jun 00 Sep 00 Dec 00 Mar 01 Jun 01 Sep 01 Dec 01 Mar 02 Jun 02 Sep 02 Dec 02 Mar 03 Jun 03 Sep 03
0.0
00
0.0
05
0.0
10
0.0
15
0.0
20
CommerzbankDeutsche BankHypoVereinsbank
0.02
Modified exact model
Time
Exa
ct
On
e−
Ye
ar
De
fau
lt P
rob
ab
ility
Jun 00 Sep 00 Dec 00 Mar 01 Jun 01 Sep 01 Dec 01 Mar 02 Jun 02 Sep 02 Dec 02 Mar 03 Jun 03 Sep 03
0.0
0.1
0.2
0.3
0.4
CommerzbankDeutsche BankHypoVereinsbank
0.4
Luitgard Veraart Estimating Default Probabilities for Banks
Structural ModelsKMV-Model
CreditGrades ModelEmpirical Results
The DataKMV-Empirical ResultsCreditGrades - Empirical Results
Conclusions
◮ Significant difference between the standard CreditGradesdefault probabilities and our exact formula.
◮ Results from our exact formula coincide much better with theKMV results than the standard CreditGrades results.
◮ Absolute default probabilities are still quite high.
◮ However, modified “exact” CreditGrades gives a good relativedescription of the default risk of the three banks and theirbehaviour over time.
Luitgard Veraart Estimating Default Probabilities for Banks
Structural ModelsKMV-Model
CreditGrades ModelEmpirical Results
The DataKMV-Empirical ResultsCreditGrades - Empirical Results
References
Crosbie, P. and A. Kocagil (2003).Modeling default risk.KMV LLC, http://www.kmv.com.
Finger, C. C., V. Finkelstein, G. Pan, J.-P. Lardy, T. Ta, andJ. Tierney (2002).CreditGrades, Technical document.RiskMetrics Group, Inc., New York.
Veraart, L. (2004).Asset-based estimates for default probabilities for commercialbanks.Diplomarbeit Universitat Ulm.
Luitgard Veraart Estimating Default Probabilities for Banks