asset-backed securities primer
DESCRIPTION
Asset-Backed Securities PrimerTRANSCRIPT
A U G U S T 5 , 2 0 0 8
I N V E S T I N G I N A S S E T B A C K E D S E C U R I T I E S
ABS Research
Chris Flanagan AC
Head, Global Structured Finance Research (1-212) [email protected]
Edward Reardon (1-212) [email protected]
Amy Sze, CFA(1-212) [email protected]
Brynja Sigurdardottir(1-212) [email protected]
AgendaAgenda
Page
Home Equity ABS
Student Loan ABS (FFELP)
Automobile ABS
Credit Card
Introduction to ABS
1
1
11
35
53
86
IN
VE
ST
IN
GI
NA
SS
ET
BA
CK
ED
SE
CU
RI
TI
ES
404
536
732
901
1072
1281
1543
1694
1828
1955
24802472
2130
400
600
800
1,000
1,200
1,400
1,600
1,800
2,000
2,200
2,400
2,600
96 98 00 02 04 06 1Q08
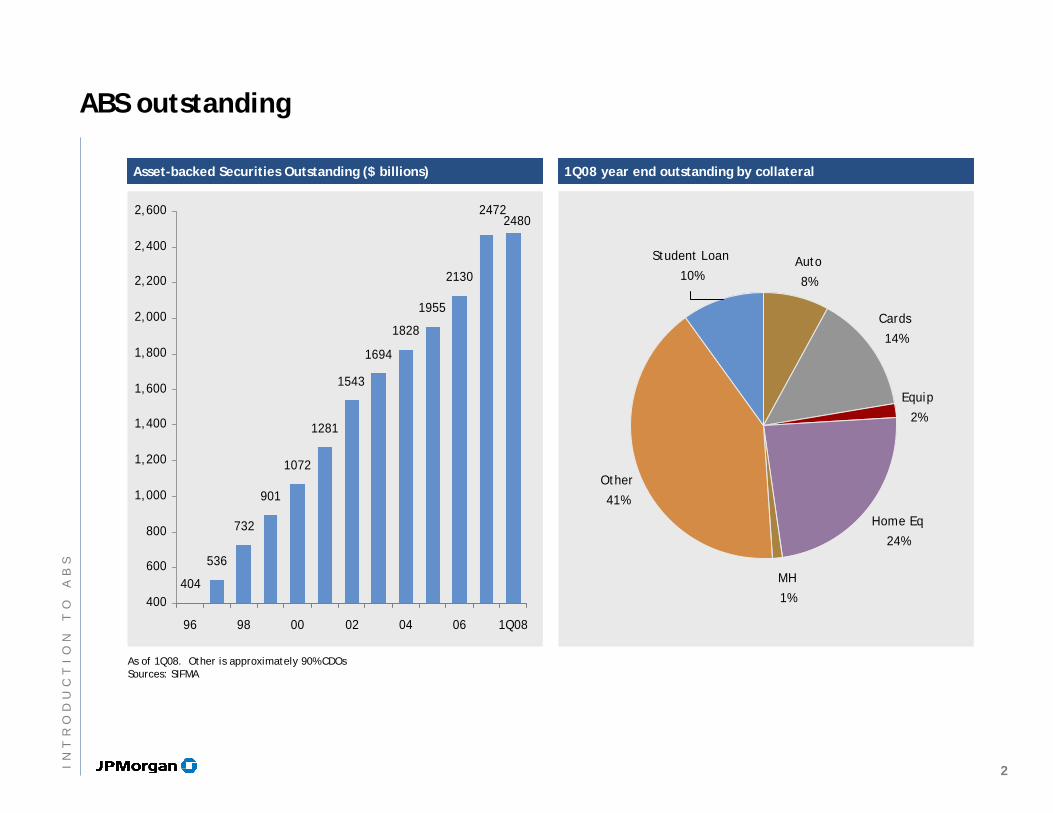
As of 1Q08. Other is approximately 90% CDOsSources: SIFMA
Asset-backed Securities Outstanding ($ billions)Asset-backed Securities Outstanding ($ billions) 1Q08 year end outstanding by collateral1Q08 year end outstanding by collateral
Cards
14%
Equip
2%
Home Eq
24%
Student Loan
10%
Other
41%
MH
1%
Auto
8%
ABS outstanding
2IN
TR
OD
UC
TI
ON
TO
AB
S
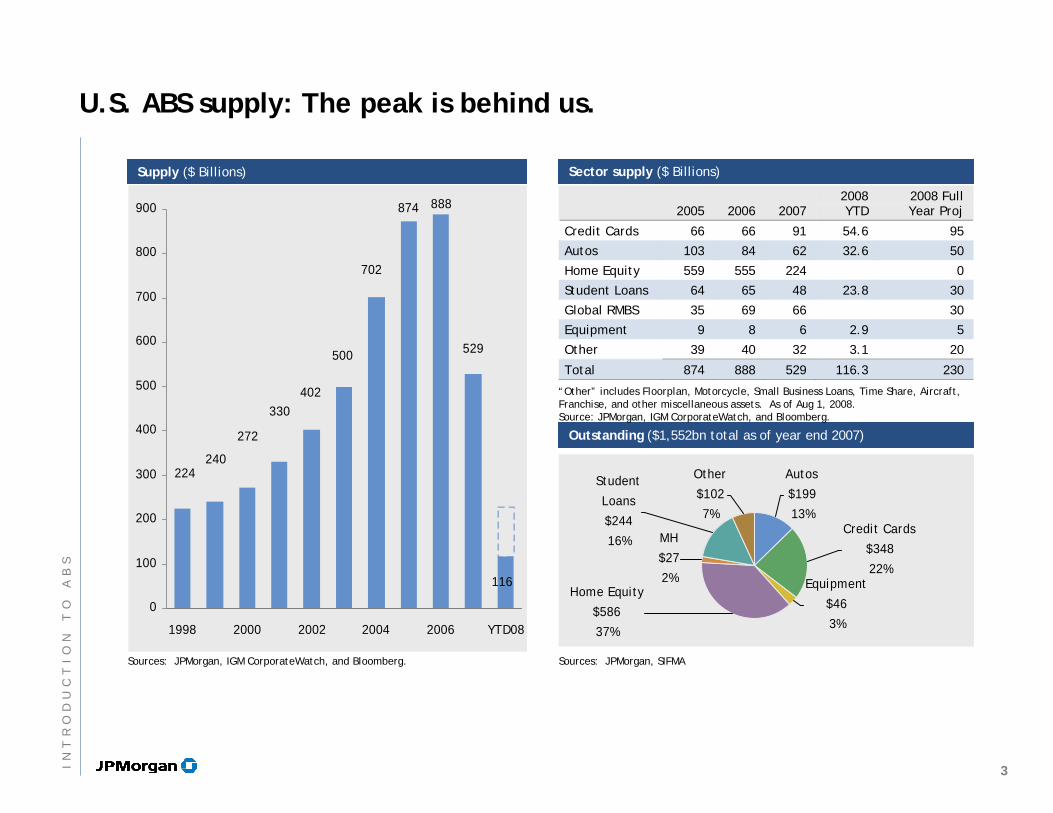
Supply ($ Billions)Supply ($ Billions)
U.S. ABS supply: The peak is behind us.
Sources: JPMorgan, IGM CorporateWatch, and Bloomberg.
Sector supply ($ Billions)Sector supply ($ Billions)
Outstanding ($1,552bn total as of year end 2007)Outstanding ($1,552bn total as of year end 2007)
Other
$102
7%
Student
Loans
$244
16%
Home Equity
$586
37%
Equipment
$46
3%
MH
$27
2%
Autos
$199
13%Credit Cards
$348
22%
Sources: JPMorgan, SIFMA
224240
272
330402
500
702
874 888
529
116
0
100
200
300
400
500
600
700
800
900
1998 2000 2002 2004 2006 YTD08
2005 2006 2007 2008 YTD
2008 Full Year Proj
Credit Cards 66 66 91 54.6 95
Autos 103 84 62 32.6 50
Home Equity 559 555 224 0
Student Loans 64 65 48 23.8 30
Global RMBS 35 69 66 30
Equipment 9 8 6 2.9 5
Other 39 40 32 3.1 20
Total 874 888 529 116.3 230
“Other” includes Floorplan, Motorcycle, Small Business Loans, Time Share, Aircraft, Franchise, and other miscellaneous assets. As of Aug 1, 2008. Source: JPMorgan, IGM CorporateWatch, and Bloomberg.
3IN
TR
OD
UC
TI
ON
TO
AB
S
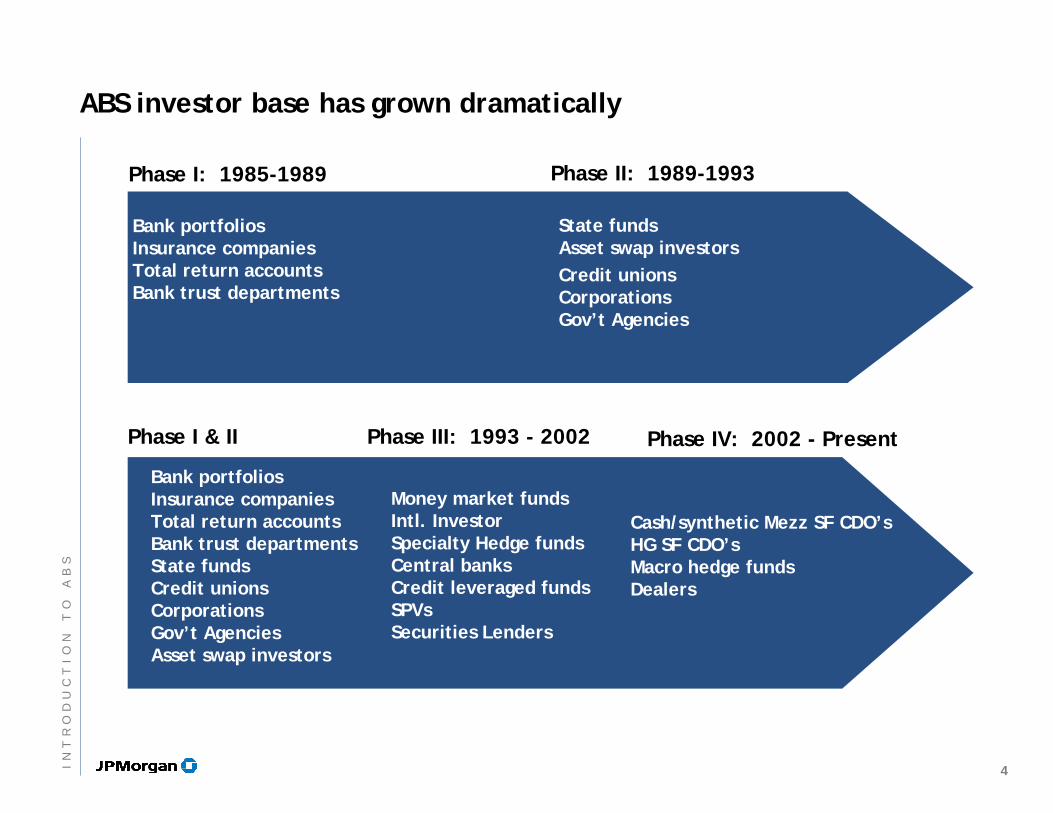
ABS investor base has grown dramatically
Bank portfoliosInsurance companiesTotal return accountsBank trust departments
Phase I: 1985-1989 Phase II: 1989-1993
Phase III: 1993 - 2002
State fundsAsset swap investorsCredit unionsCorporationsGov’t Agencies
Bank portfoliosInsurance companiesTotal return accountsBank trust departmentsState fundsCredit unionsCorporationsGov’t AgenciesAsset swap investors
Money market fundsIntl. InvestorSpecialty Hedge fundsCentral banksCredit leveraged fundsSPVsSecurities Lenders
Cash/synthetic Mezz SF CDO’sHG SF CDO’sMacro hedge fundsDealers
Phase IV: 2002 - PresentPhase I & II
4IN
TR
OD
UC
TI
ON
TO
AB
S
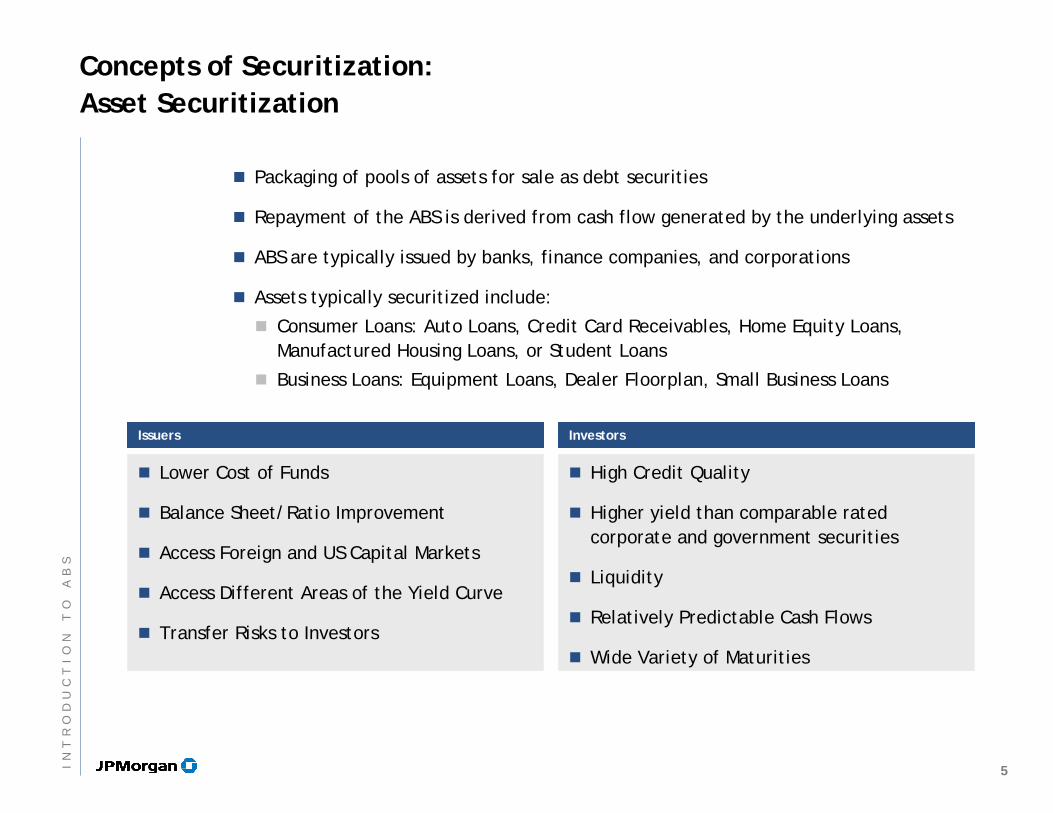
Concepts of Securitization:Asset Securitization
Packaging of pools of assets for sale as debt securities
Repayment of the ABS is derived from cash flow generated by the underlying assets
ABS are typically issued by banks, finance companies, and corporations
Assets typically securitized include:
Consumer Loans: Auto Loans, Credit Card Receivables, Home Equity Loans, Manufactured Housing Loans, or Student Loans
Business Loans: Equipment Loans, Dealer Floorplan, Small Business Loans
IssuersIssuers InvestorsInvestors
Lower Cost of Funds
Balance Sheet/Ratio Improvement
Access Foreign and US Capital Markets
Access Different Areas of the Yield Curve
Transfer Risks to Investors
High Credit Quality
Higher yield than comparable rated corporate and government securities
Liquidity
Relatively Predictable Cash Flows
Wide Variety of Maturities
5IN
TR
OD
UC
TI
ON
TO
AB
S
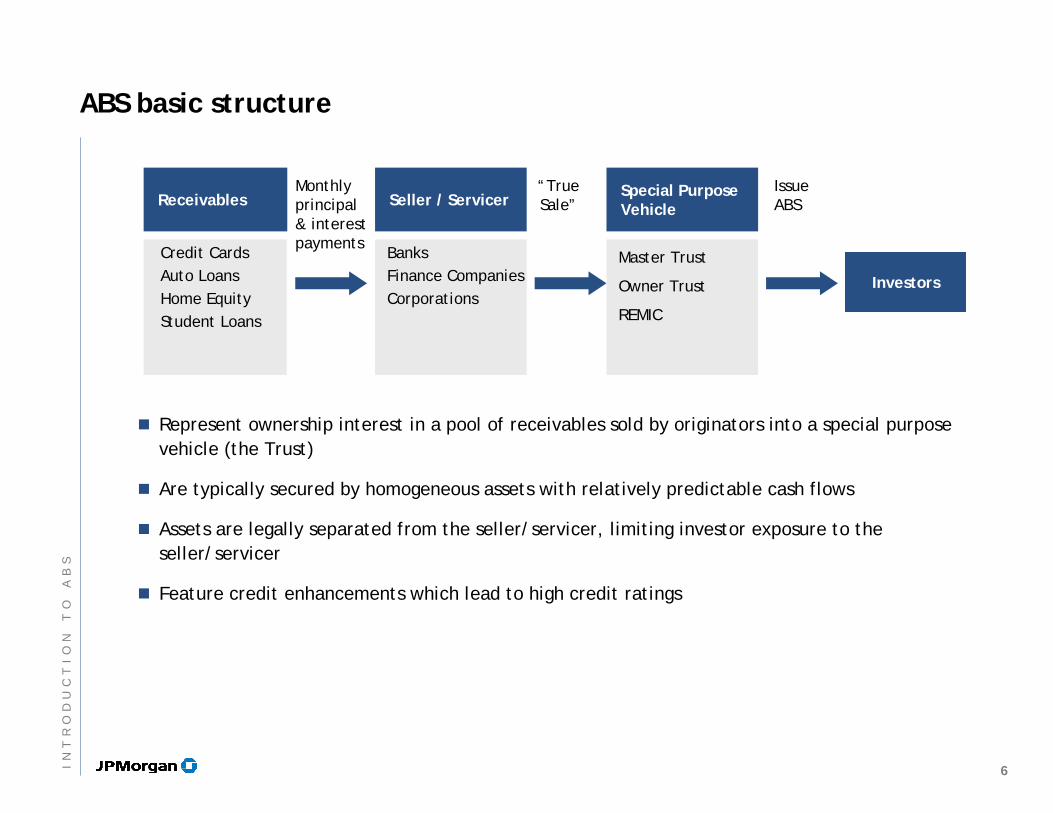
ABS basic structure
Represent ownership interest in a pool of receivables sold by originators into a special purpose vehicle (the Trust)
Are typically secured by homogeneous assets with relatively predictable cash flows
Assets are legally separated from the seller/servicer, limiting investor exposure to the seller/servicer
Feature credit enhancements which lead to high credit ratings
Monthlyprincipal & interest payments
“True Sale”
Issue ABS
Investors
Receivables
Credit CardsAuto LoansHome EquityStudent Loans
Seller / Servicer
BanksFinance CompaniesCorporations
Special Purpose Vehicle
Master Trust
Owner Trust
REMIC
6IN
TR
OD
UC
TI
ON
TO
AB
S

How do ABS issued get AAA Ratings?
AAA Rating
Trust StructureTrust Structure
Bankruptcy Remote Vehicle
Insulates Investor from Issuer
Payout Events /Performance Triggers
Payout Events /Performance Triggers
Protects investors from adverse credit developments
Credit EnhancementCredit Enhancement
Internal
Excess Spread
Subordination
Reserve Fund
Spread Account
Overcollateralization
External
AAA-rated Monoline Insurer
7IN
TR
OD
UC
TI
ON
TO
AB
S
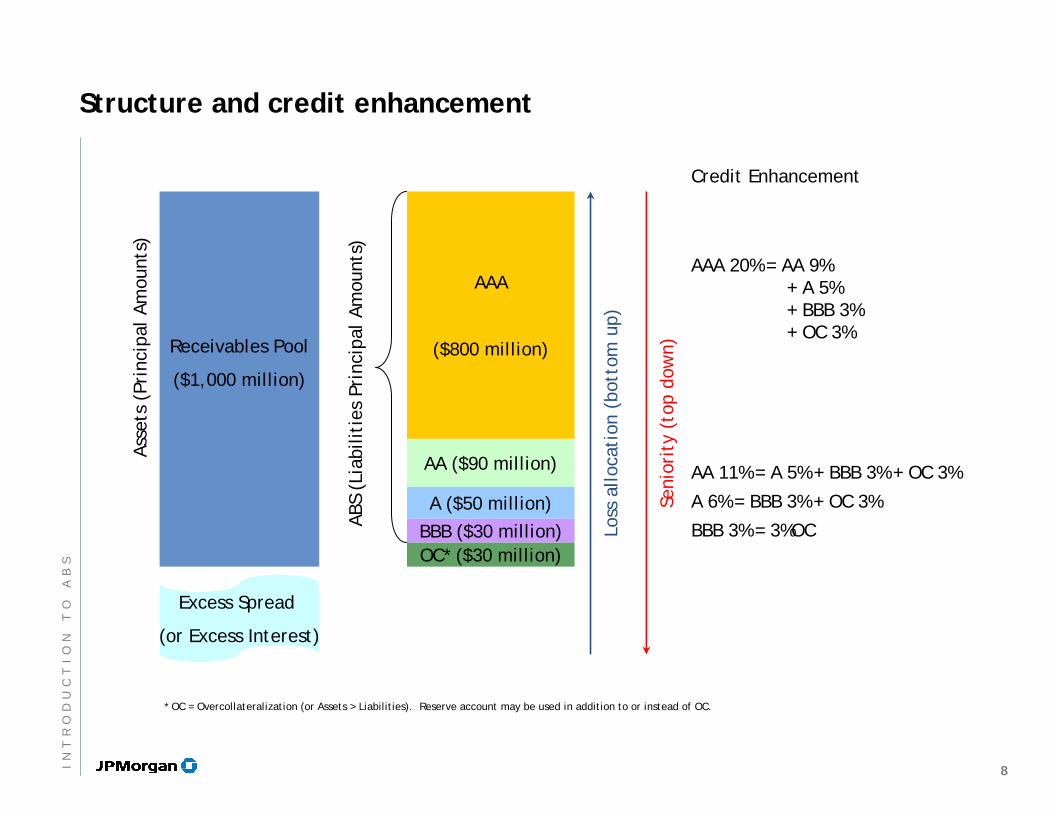
Structure and credit enhancement
Receivables Pool
($1,000 million)
AAA
($800 million)
AA ($90 million)
A ($50 million)BBB ($30 million)OC* ($30 million)
Asse
ts (
Prin
cipa
l Am
ount
s)
ABS
(Lia
bilit
ies
Prin
cipa
l Am
ount
s)
Excess Spread
(or Excess Interest)Lo
ss a
lloca
tion
(bo
ttom
up)
Credit Enhancement
AAA 20% = AA 9% + A 5% + BBB 3% + OC 3%
AA 11% = A 5% + BBB 3% + OC 3%
A 6% = BBB 3% + OC 3%
BBB 3% = 3%OC
* OC = Overcollateralization (or Assets > Liabilities). Reserve account may be used in addition to or instead of OC.
Seni
orit
y (t
op d
own)
8IN
TR
OD
UC
TI
ON
TO
AB
S
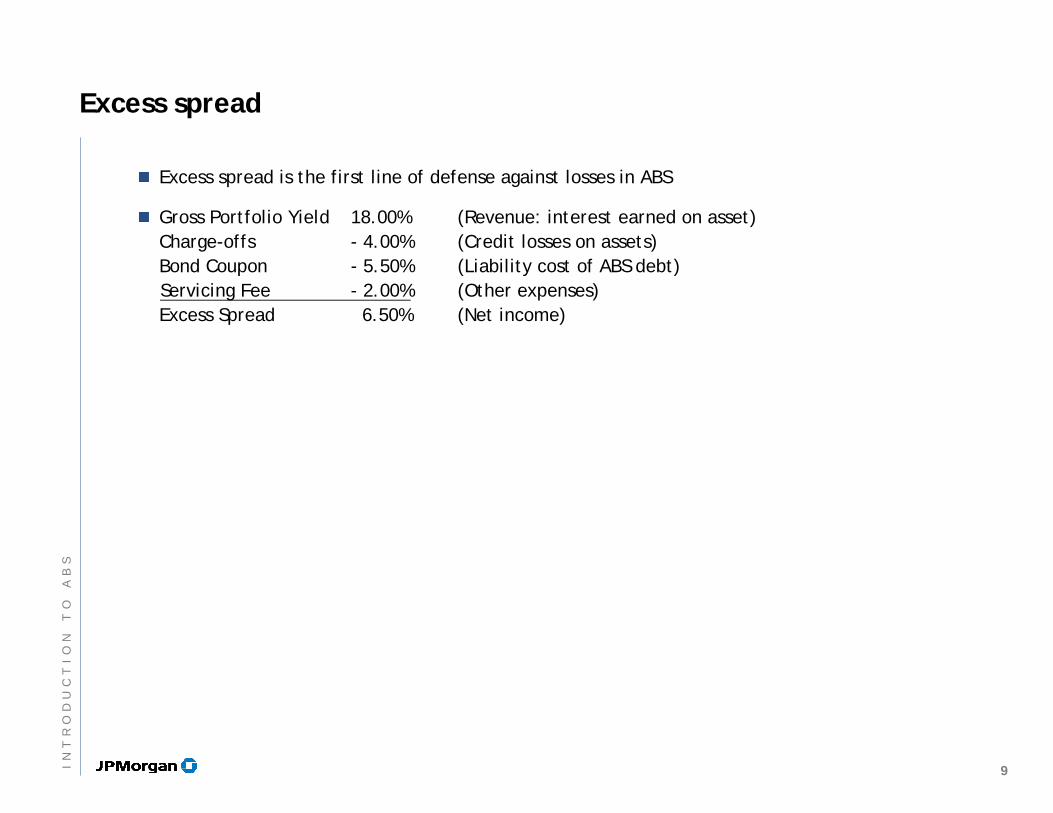
Excess spread
Excess spread is the first line of defense against losses in ABS
Gross Portfolio Yield 18.00% (Revenue: interest earned on asset)Charge-offs - 4.00% (Credit losses on assets)Bond Coupon - 5.50% (Liability cost of ABS debt)Servicing Fee - 2.00% (Other expenses)Excess Spread 6.50% (Net income)
9IN
TR
OD
UC
TI
ON
TO
AB
S
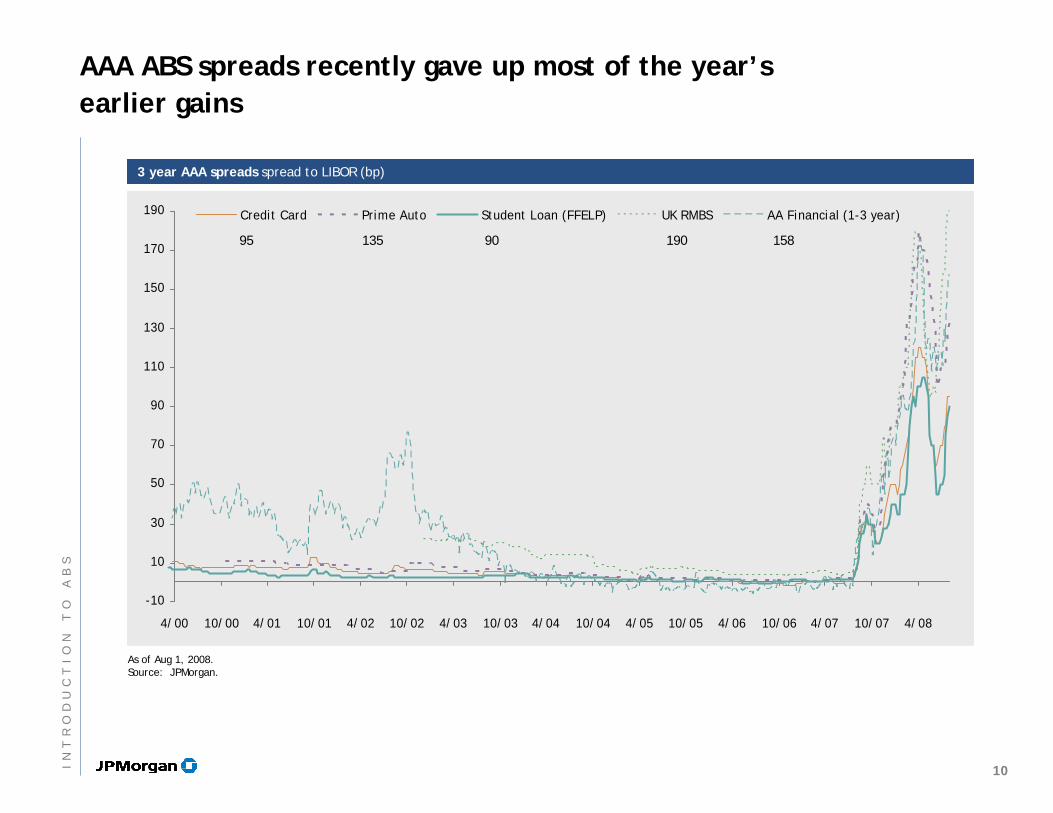
AAA ABS spreads recently gave up most of the year’s earlier gains
As of Aug 1, 2008.Source: JPMorgan.
3 year AAA spreads spread to LIBOR (bp)3 year AAA spreads spread to LIBOR (bp)
-10
10
30
50
70
90
110
130
150
170
190
4/00 10/00 4/01 10/01 4/02 10/02 4/03 10/03 4/04 10/04 4/05 10/05 4/06 10/06 4/07 10/07 4/08
Credit Card Prime Auto Student Loan (FFELP) UK RMBS AA Financial (1-3 year)
95 135 90 190 158
10IN
TR
OD
UC
TI
ON
TO
AB
S
AgendaAgenda
Page
Home Equity ABS
Student Loan ABS (FFELP)
Automobile ABS
Credit Card
Introduction to ABS
11
1
11
35
53
86
IN
VE
ST
IN
GI
NA
SS
ET
BA
CK
ED
SE
CU
RI
TI
ES
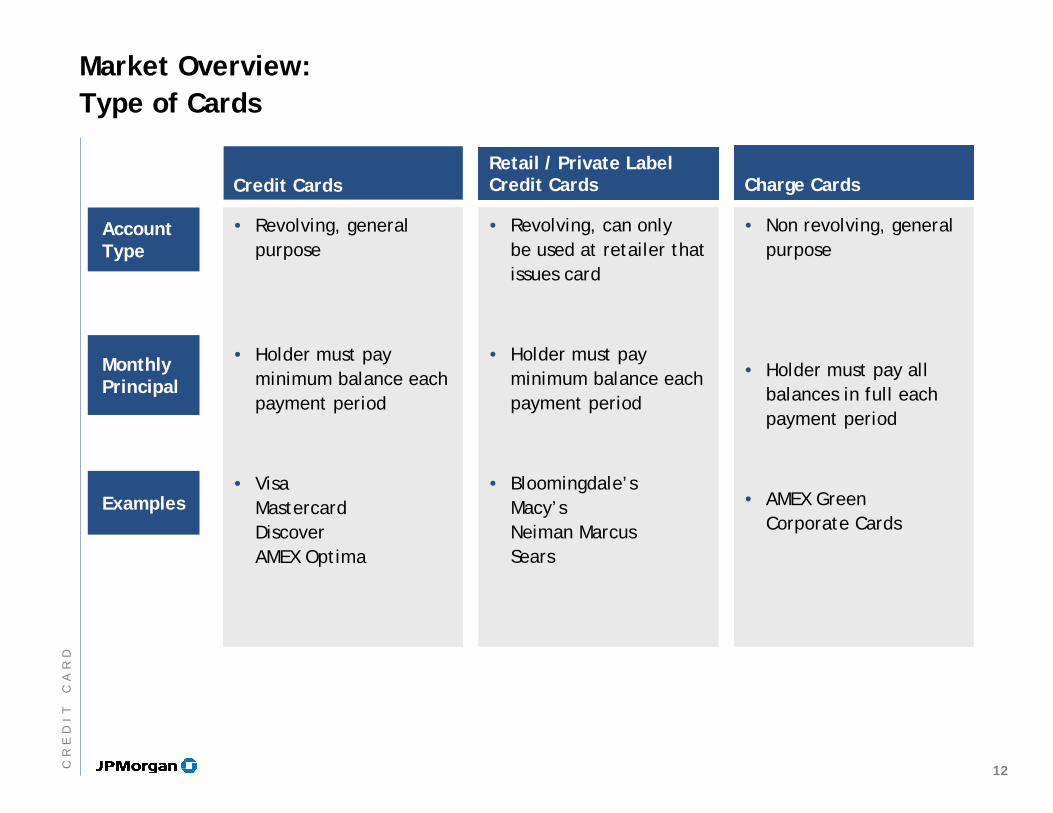
Credit CardsCredit CardsRetail / Private LabelCredit CardsRetail / Private LabelCredit Cards Charge CardsCharge Cards
Market Overview:Type of Cards
Revolving, general purpose
Holder must pay minimum balance each payment period
VisaMastercardDiscoverAMEX Optima
Revolving, can onlybe used at retailer that issues card
Holder must pay minimum balance each payment period
Bloomingdale’sMacy’sNeiman MarcusSears
Non revolving, general purpose
Holder must pay all balances in full each payment period
AMEX GreenCorporate Cards
AccountType
MonthlyPrincipal
Examples
12CR
ED
IT
CA
RD
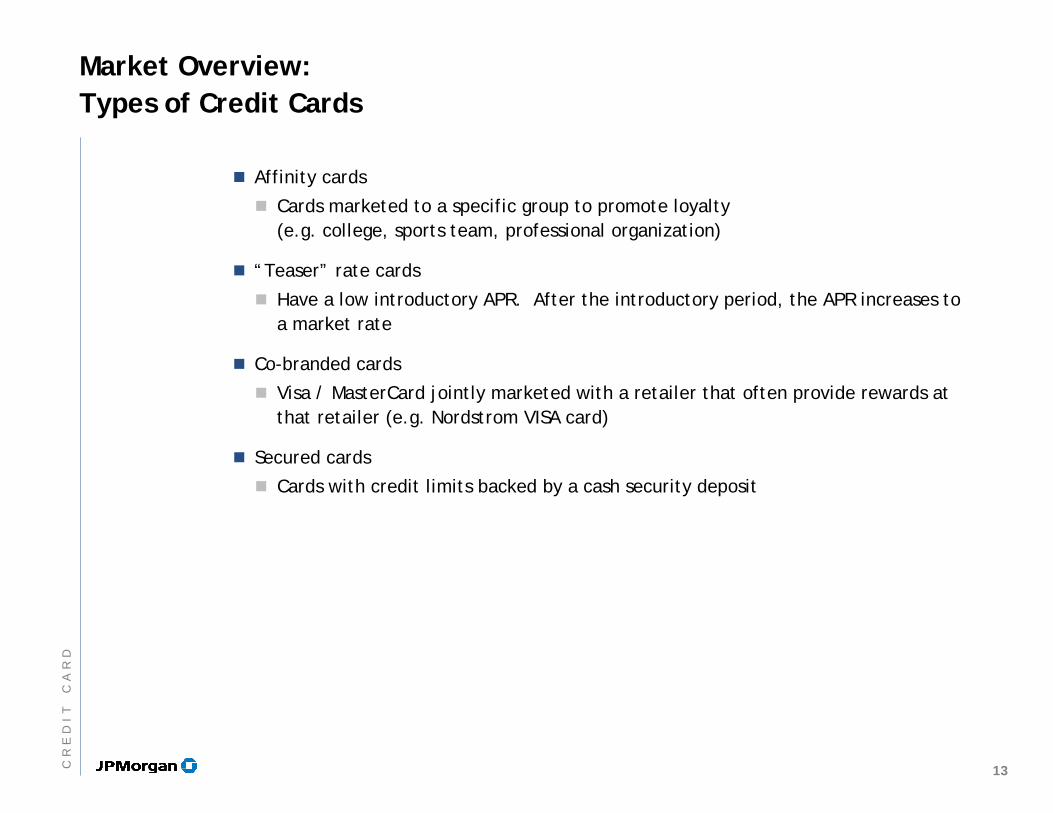
Market Overview:Types of Credit Cards
Affinity cards
Cards marketed to a specific group to promote loyalty(e.g. college, sports team, professional organization)
“Teaser” rate cards
Have a low introductory APR. After the introductory period, the APR increases to a market rate
Co-branded cards
Visa / MasterCard jointly marketed with a retailer that often provide rewards at that retailer (e.g. Nordstrom VISA card)
Secured cards
Cards with credit limits backed by a cash security deposit
13CR
ED
IT
CA
RD
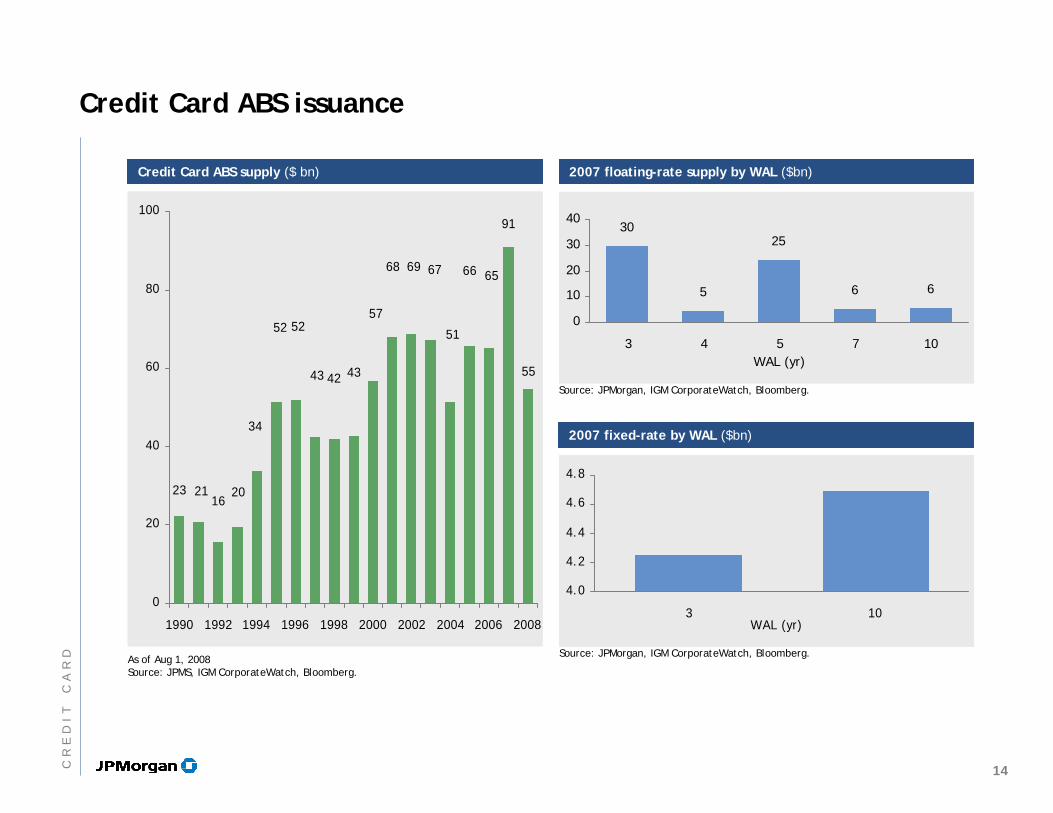
Credit Card ABS issuance
Credit Card ABS supply ($ bn)Credit Card ABS supply ($ bn)
55
91
6566
51
676968
57
434243
5252
34
2016
2123
0
20
40
60
80
100
1990 1992 1994 1996 1998 2000 2002 2004 2006 2008
As of Aug 1, 2008Source: JPMS, IGM CorporateWatch, Bloomberg.
Source: JPMorgan, IGM CorporateWatch, Bloomberg.
Source: JPMorgan, IGM CorporateWatch, Bloomberg.
2007 floating-rate supply by WAL ($bn)2007 floating-rate supply by WAL ($bn)
2007 fixed-rate by WAL ($bn)2007 fixed-rate by WAL ($bn)
30
5
25
6 6
0
10
20
30
40
3 4 5 7 10WAL (yr)
4.0
4.2
4.4
4.6
4.8
3 10WAL (yr)
14CR
ED
IT
CA
RD
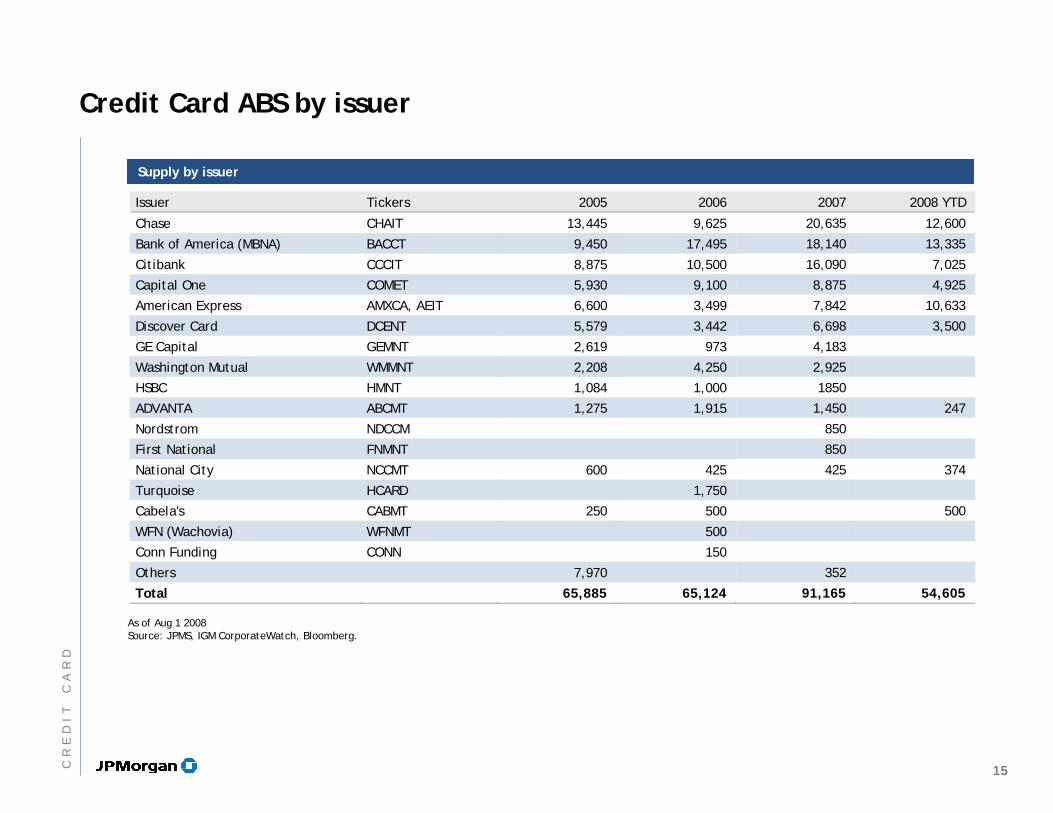
Credit Card ABS by issuer
Supply by issuerSupply by issuer
As of Aug 1 2008Source: JPMS, IGM CorporateWatch, Bloomberg.
Issuer Tickers 2005 2006 2007 2008 YTD
Chase CHAIT 13,445 9,625 20,635 12,600
Bank of America (MBNA) BACCT 9,450 17,495 18,140 13,335
Citibank CCCIT 8,875 10,500 16,090 7,025
Capital One COMET 5,930 9,100 8,875 4,925
American Express AMXCA, AEIT 6,600 3,499 7,842 10,633
Discover Card DCENT 5,579 3,442 6,698 3,500
GE Capital GEMNT 2,619 973 4,183
Washington Mutual WMMNT 2,208 4,250 2,925
HSBC HMNT 1,084 1,000 1850
ADVANTA ABCMT 1,275 1,915 1,450 247
Nordstrom NDCCM 850
First National FNMNT 850
National City NCCMT 600 425 425 374
Turquoise HCARD 1,750
Cabela's CABMT 250 500 500
WFN (Wachovia) WFNMT 500
Conn Funding CONN 150
Others 7,970 352
Total 65,885 65,124 91,165 54,605
15CR
ED
IT
CA
RD
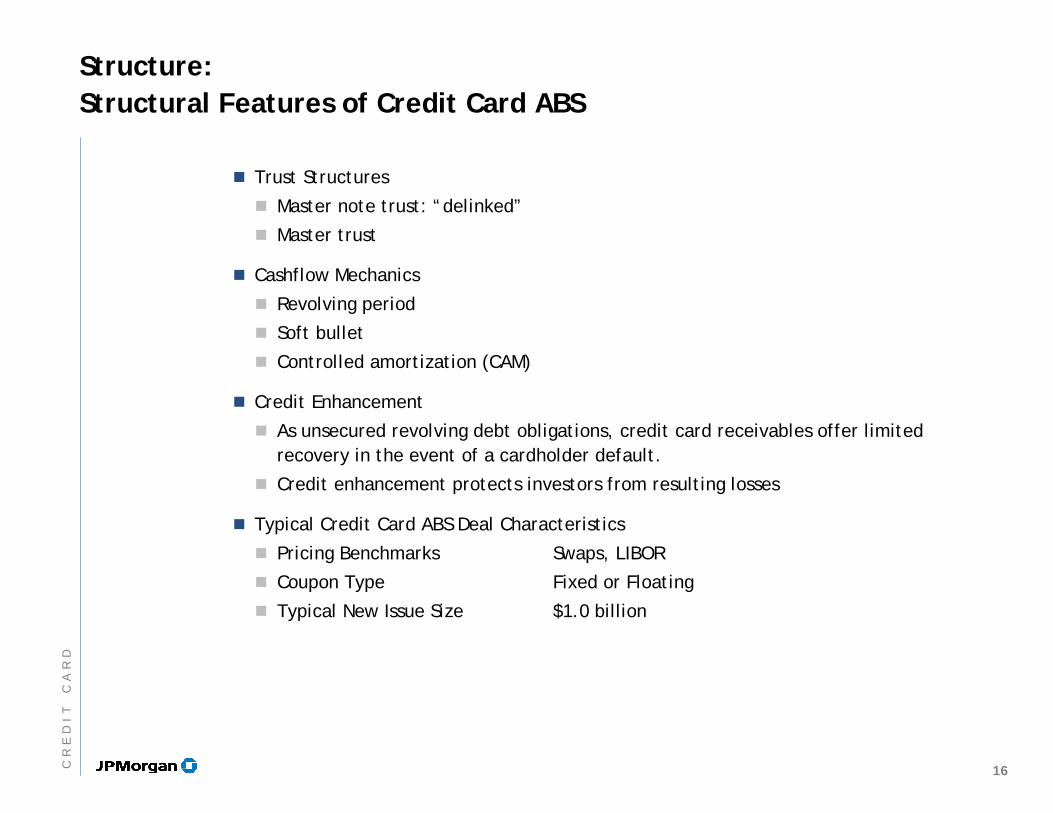
Structure:Structural Features of Credit Card ABS
Trust Structures
Master note trust: “delinked”
Master trust
Cashflow Mechanics
Revolving period
Soft bullet
Controlled amortization (CAM)
Credit Enhancement
As unsecured revolving debt obligations, credit card receivables offer limited recovery in the event of a cardholder default.
Credit enhancement protects investors from resulting losses
Typical Credit Card ABS Deal Characteristics
Pricing Benchmarks Swaps, LIBOR
Coupon Type Fixed or Floating
Typical New Issue Size $1.0 billion
16CR
ED
IT
CA
RD
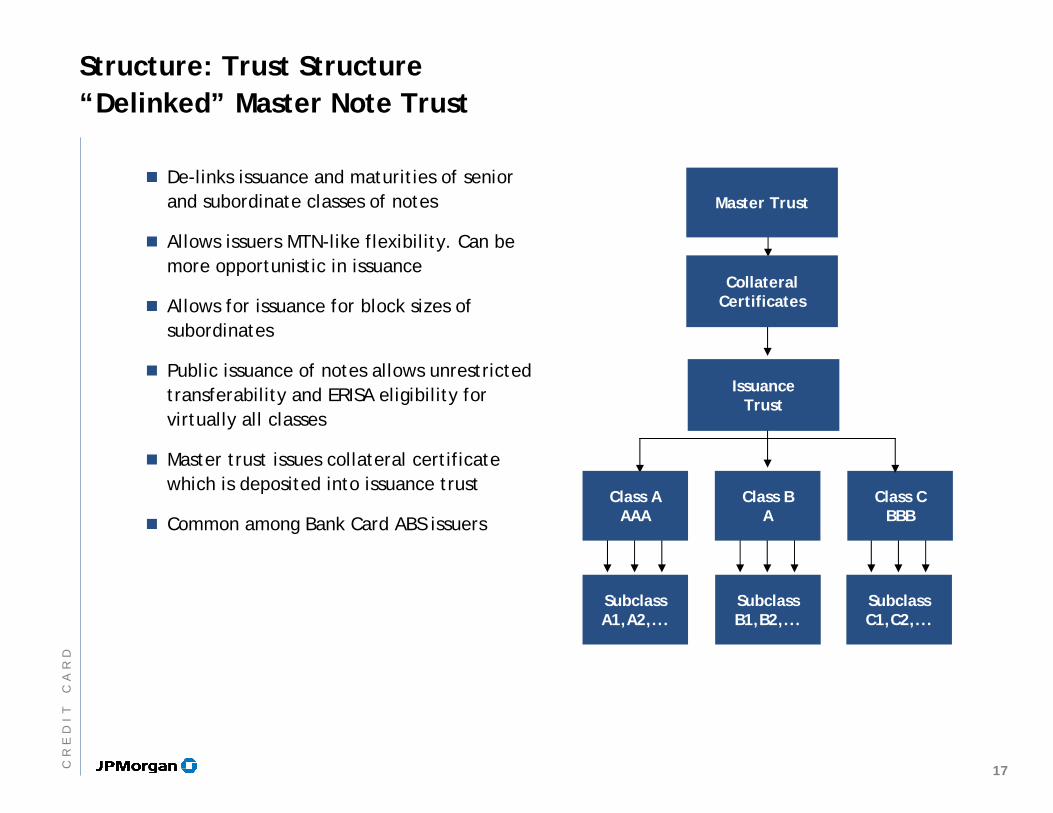
Structure: Trust Structure“Delinked” Master Note Trust
De-links issuance and maturities of senior and subordinate classes of notes
Allows issuers MTN-like flexibility. Can be more opportunistic in issuance
Allows for issuance for block sizes of subordinates
Public issuance of notes allows unrestricted transferability and ERISA eligibility for virtually all classes
Master trust issues collateral certificate which is deposited into issuance trust
Common among Bank Card ABS issuers
SubclassC1,C2,...
SubclassA1,A2,...
SubclassB1,B2,...
Class BA
Class AAAA
Class CBBB
Master Trust
CollateralCertificates
IssuanceTrust
17CR
ED
IT
CA
RD
Structure: Cashflow MechanicsRevolving Period
The interest-only period, during which time bondholders receive interest payments but no principal payments
Revolving period typically lasts from 1–10 years, depending on the life of the transaction
It is followed by the controlled amortization or accumulation period
Monthly principal collections are used to purchase new receivables
Revolving period can be terminated early if certain early amortization events occur
18CR
ED
IT
CA
RD
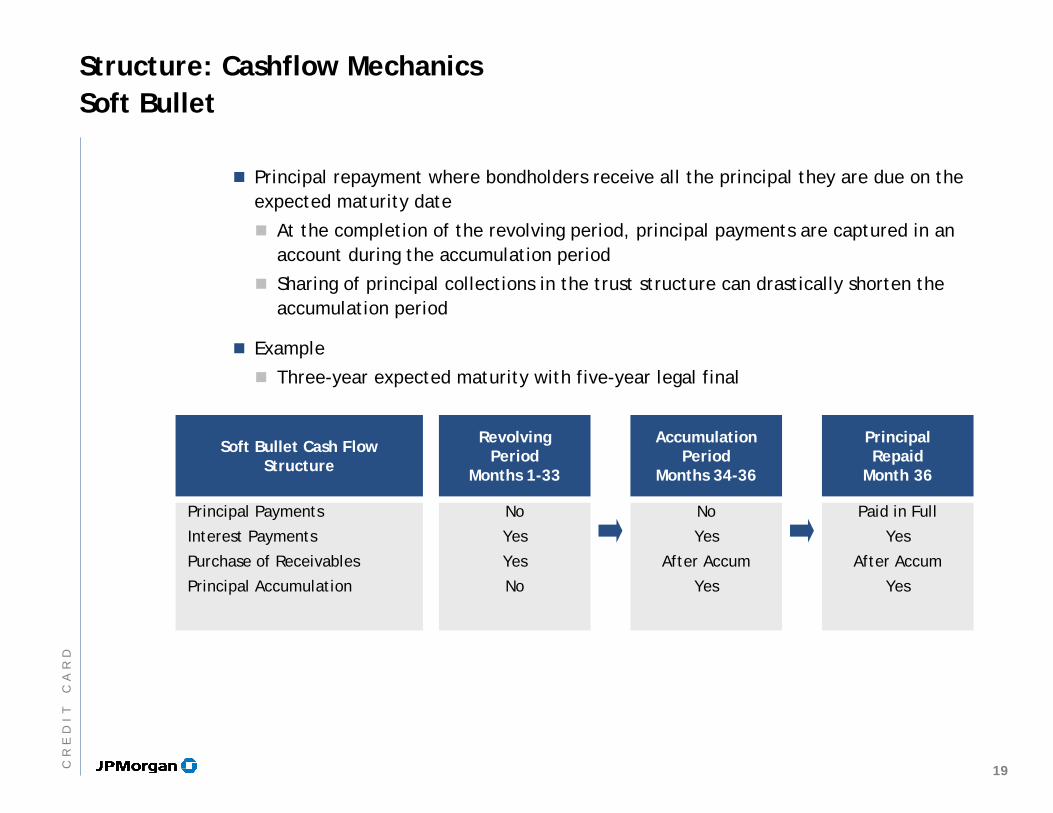
Structure: Cashflow Mechanics Soft Bullet
Principal repayment where bondholders receive all the principal they are due on the expected maturity date
At the completion of the revolving period, principal payments are captured in an account during the accumulation period
Sharing of principal collections in the trust structure can drastically shorten the accumulation period
Example
Three-year expected maturity with five-year legal final
Revolving Period
Months 1-33
No
Yes
Yes
No
Accumulation Period
Months 34-36
No
Yes
After Accum
Yes
PrincipalRepaid
Month 36
Paid in Full
Yes
After Accum
Yes
Soft Bullet Cash Flow Structure
Principal Payments
Interest Payments
Purchase of Receivables
Principal Accumulation
19CR
ED
IT
CA
RD
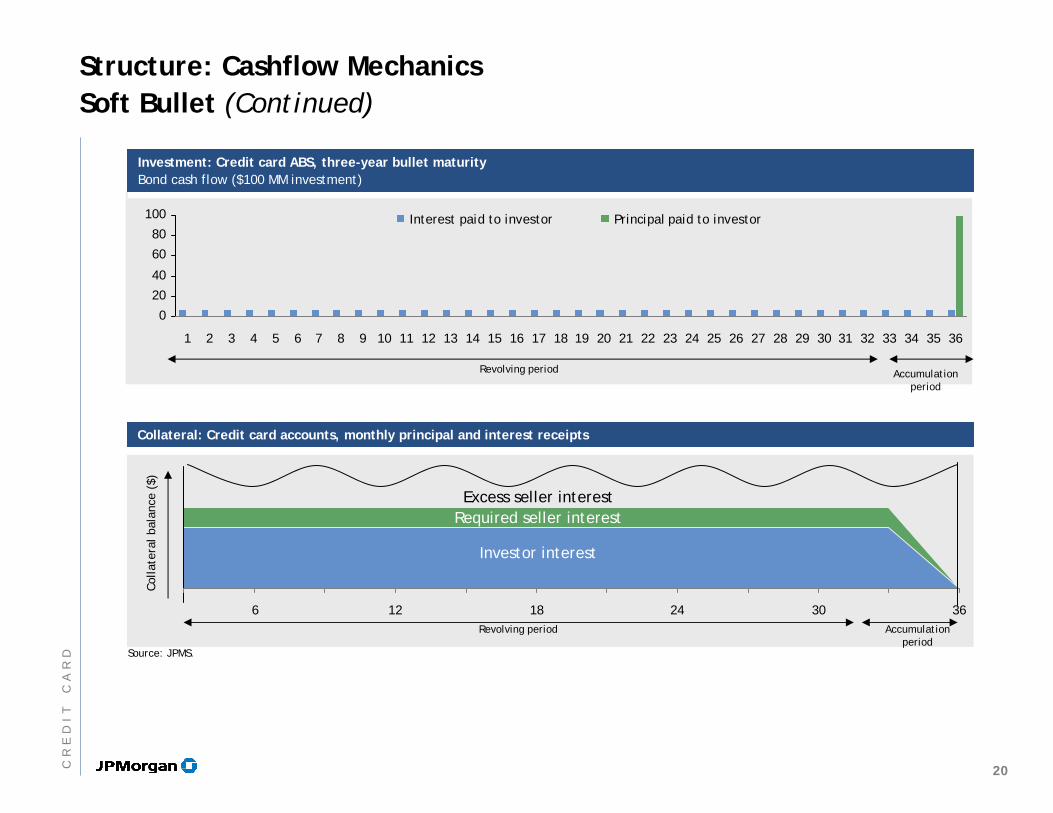
0
20
40
60
80
100
1 2 3 4 5 6 7 8 9 10 11 12 13 14 15 16 17 18 19 20 21 22 23 24 25 26 27 28 29 30 31 32 33 34 35 36
Interest paid to investor Principal paid to investor
Investment: Credit card ABS, three-year bullet maturityBond cash flow ($100 MM investment)
Investment: Credit card ABS, three-year bullet maturityBond cash flow ($100 MM investment)
Collateral: Credit card accounts, monthly principal and interest receiptsCollateral: Credit card accounts, monthly principal and interest receipts
Source: JPMS.
6 12 18 24 30 36
Structure: Cashflow Mechanics Soft Bullet (Continued)
Revolving period Accumulation period
Excess seller interestRequired seller interest
Investor interest
Revolving period Accumulation period
Colla
tera
l bal
ance
($)
20CR
ED
IT
CA
RD
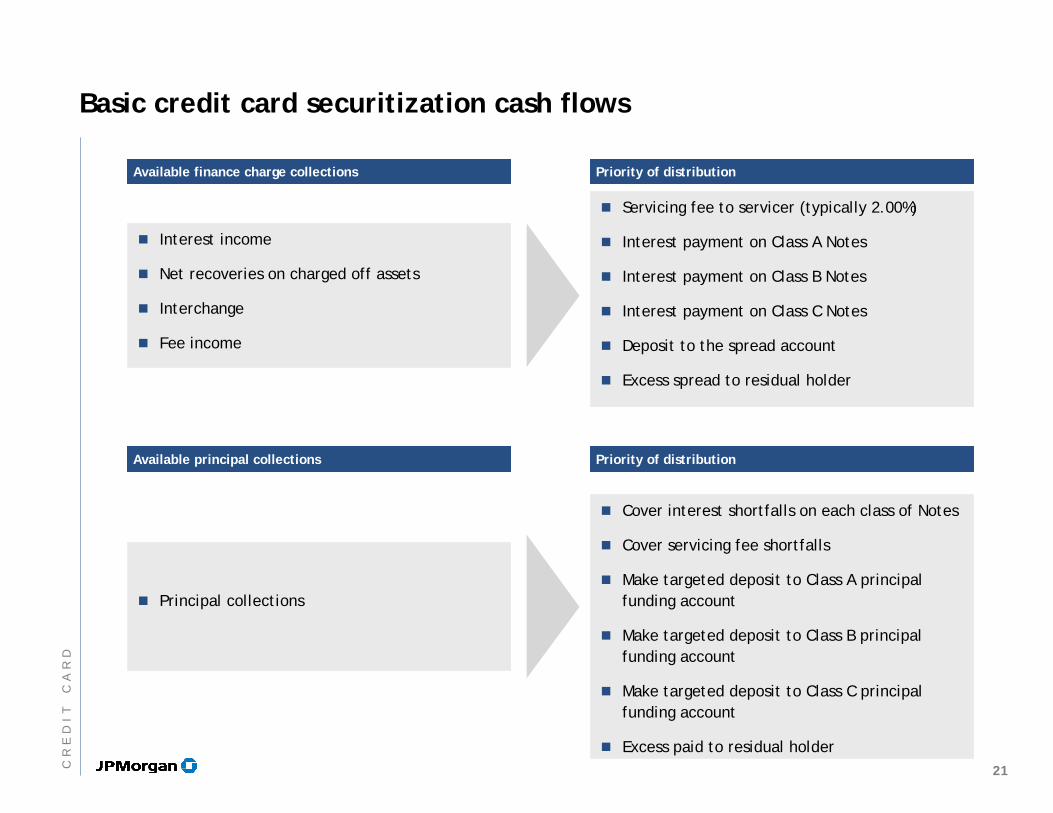
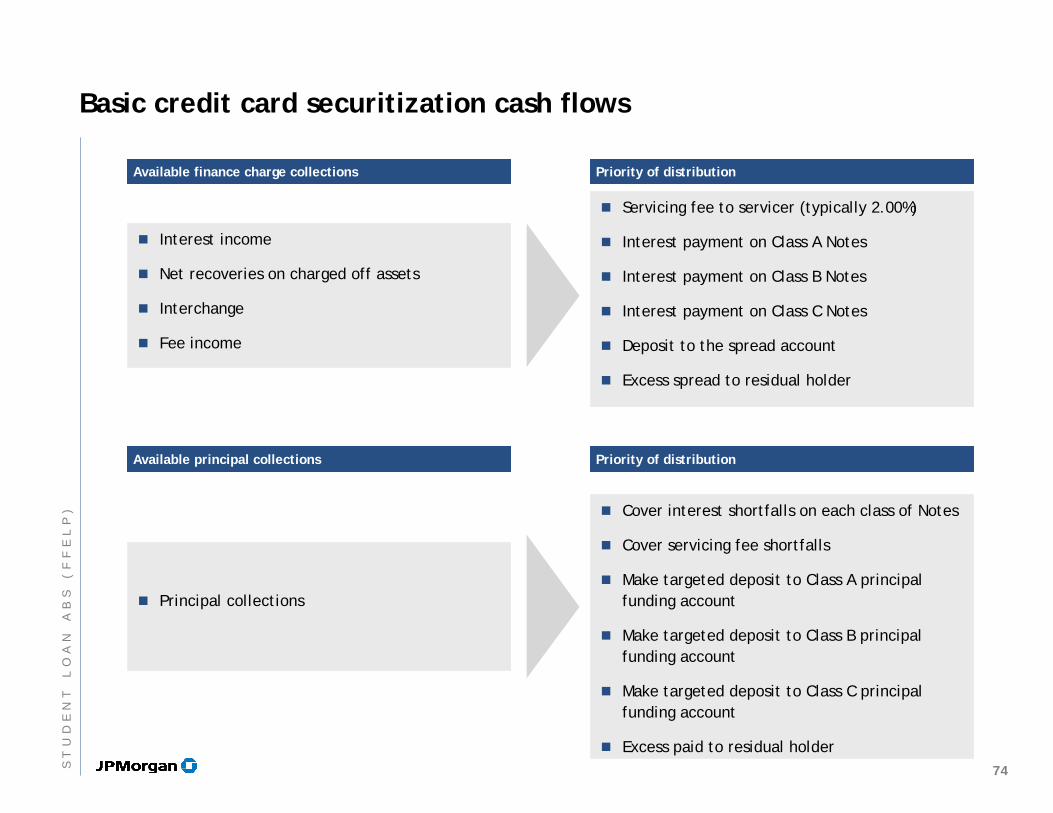
Basic credit card securitization cash flows
Interest income
Net recoveries on charged off assets
Interchange
Fee income
Servicing fee to servicer (typically 2.00%)
Interest payment on Class A Notes
Interest payment on Class B Notes
Interest payment on Class C Notes
Deposit to the spread account
Excess spread to residual holder
Available finance charge collectionsAvailable finance charge collections Priority of distributionPriority of distribution
Available principal collectionsAvailable principal collections Priority of distributionPriority of distribution
Principal collections
Cover interest shortfalls on each class of Notes
Cover servicing fee shortfalls
Make targeted deposit to Class A principal funding account
Make targeted deposit to Class B principal funding account
Make targeted deposit to Class C principal funding account
Excess paid to residual holder21C
RE
DI
TC
AR
D
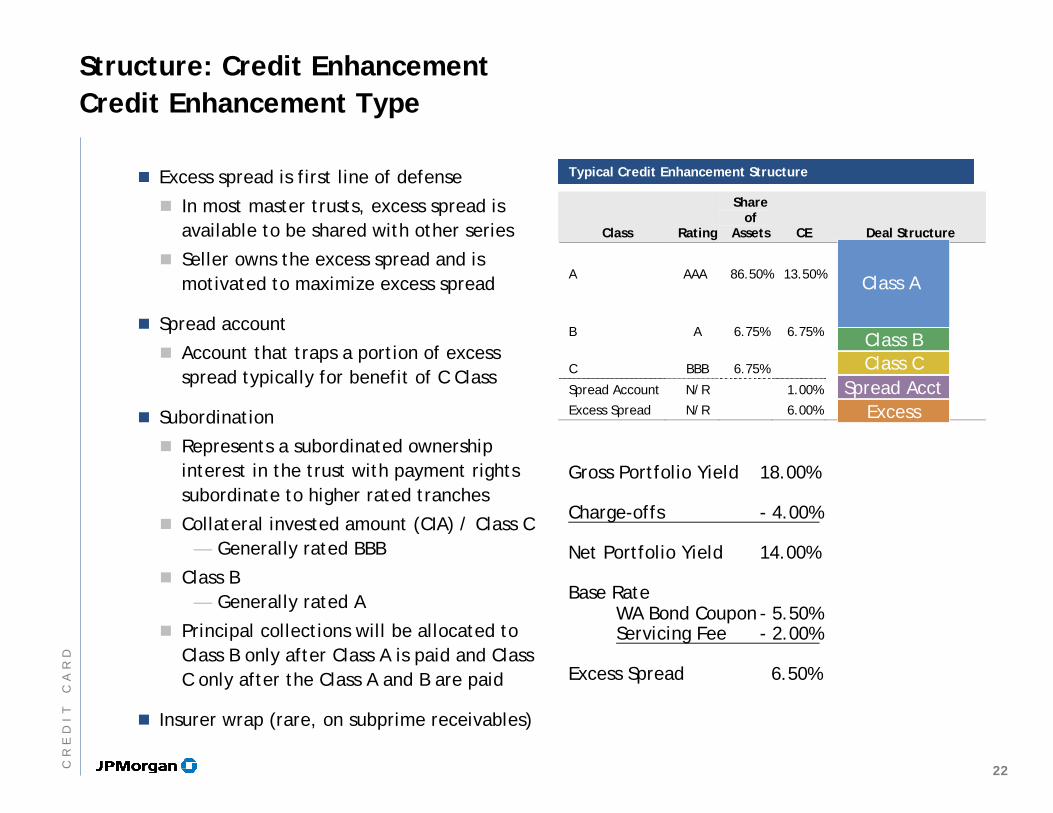
Structure: Credit EnhancementCredit Enhancement Type
Excess spread is first line of defense
In most master trusts, excess spread is available to be shared with other series
Seller owns the excess spread and is motivated to maximize excess spread
Spread account
Account that traps a portion of excess spread typically for benefit of C Class
Subordination
Represents a subordinated ownership interest in the trust with payment rights subordinate to higher rated tranches
Collateral invested amount (CIA) / Class C — Generally rated BBB
Class B— Generally rated A
Principal collections will be allocated to Class B only after Class A is paid and Class C only after the Class A and B are paid
Insurer wrap (rare, on subprime receivables)
Class Rating
Share of
Assets CE Deal Structure
A
AAA
86.50%
13.50%
B
A
6.75%
6.75%
C BBB 6.75%
Spread Account N/R 1.00%
Excess Spread N/R 6.00%
Class A
Class BClass C
ExcessSpread Acct
Typical Credit Enhancement StructureTypical Credit Enhancement Structure
Gross Portfolio Yield 18.00%
Charge-offs - 4.00%
Net Portfolio Yield 14.00%
Base RateWA Bond Coupon - 5.50%Servicing Fee - 2.00%
Excess Spread 6.50%
22CR
ED
IT
CA
RD
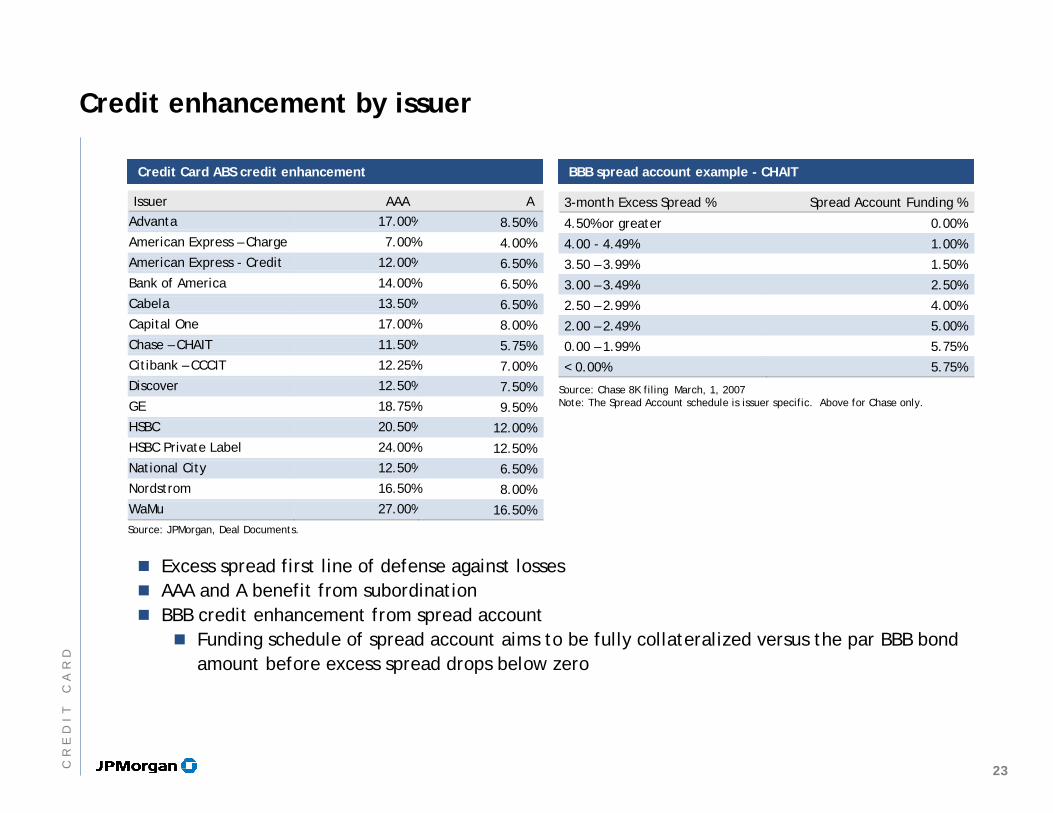
Credit enhancement by issuer
Credit Card ABS credit enhancement Credit Card ABS credit enhancement
Source: JPMorgan, Deal Documents.
BBB spread account example - CHAITBBB spread account example - CHAIT
3-month Excess Spread % Spread Account Funding %
4.50% or greater 0.00%
4.00 - 4.49% 1.00%
3.50 – 3.99% 1.50%
3.00 – 3.49% 2.50%
2.50 – 2.99% 4.00%
2.00 – 2.49% 5.00%
0.00 – 1.99% 5.75%
< 0.00% 5.75%
Source: Chase 8K filing March, 1, 2007Note: The Spread Account schedule is issuer specific. Above for Chase only.
Excess spread first line of defense against lossesAAA and A benefit from subordinationBBB credit enhancement from spread account
Funding schedule of spread account aims to be fully collateralized versus the par BBB bond amount before excess spread drops below zero
Issuer AAA A Advanta 17.00% 8.50% American Express – Charge 7.00% 4.00% American Express - Credit 12.00% 6.50% Bank of America 14.00% 6.50% Cabela 13.50% 6.50% Capital One 17.00% 8.00% Chase – CHAIT 11.50% 5.75% Citibank – CCCIT 12.25% 7.00% Discover 12.50% 7.50% GE 18.75% 9.50% HSBC 20.50% 12.00% HSBC Private Label 24.00% 12.50% National City 12.50% 6.50% Nordstrom 16.50% 8.00% WaMu 27.00% 16.50%
23CR
ED
IT
CA
RD
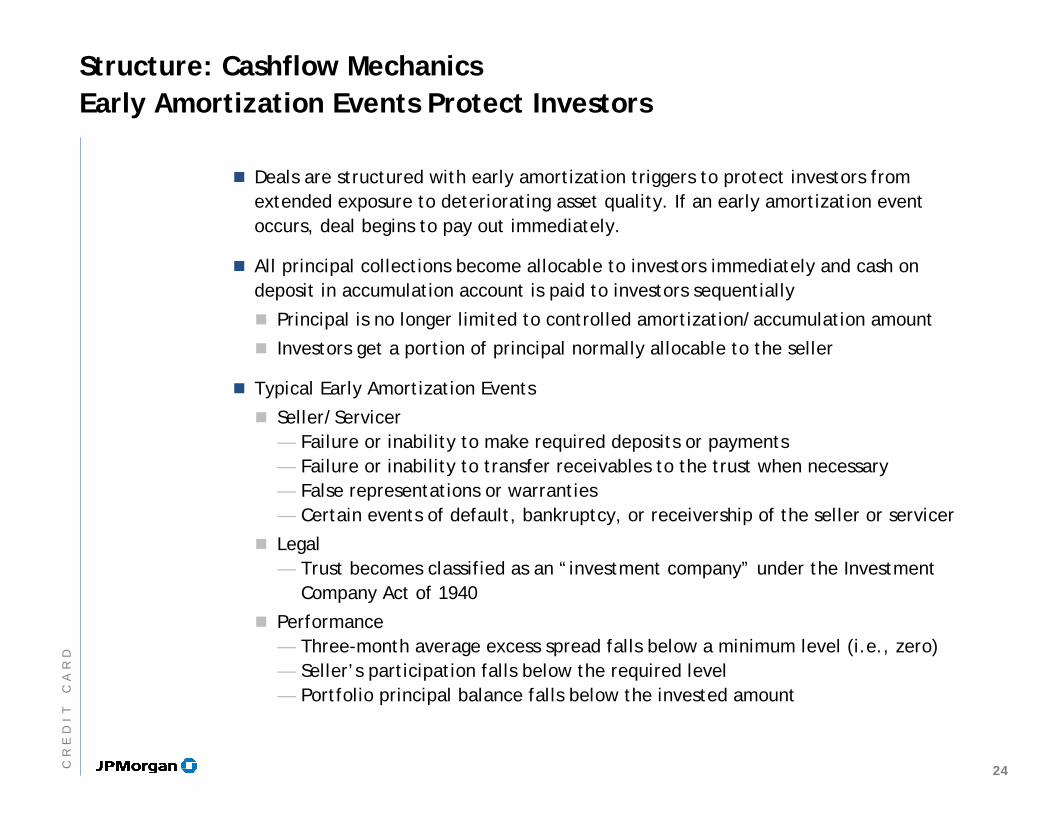
Structure: Cashflow Mechanics Early Amortization Events Protect Investors
Deals are structured with early amortization triggers to protect investors from extended exposure to deteriorating asset quality. If an early amortization event occurs, deal begins to pay out immediately.
All principal collections become allocable to investors immediately and cash on deposit in accumulation account is paid to investors sequentially
Principal is no longer limited to controlled amortization/accumulation amount
Investors get a portion of principal normally allocable to the seller
Typical Early Amortization Events
Seller/Servicer— Failure or inability to make required deposits or payments— Failure or inability to transfer receivables to the trust when necessary— False representations or warranties— Certain events of default, bankruptcy, or receivership of the seller or servicer
Legal— Trust becomes classified as an “investment company” under the Investment
Company Act of 1940
Performance— Three-month average excess spread falls below a minimum level (i.e., zero)— Seller’s participation falls below the required level— Portfolio principal balance falls below the invested amount
24CR
ED
IT
CA
RD
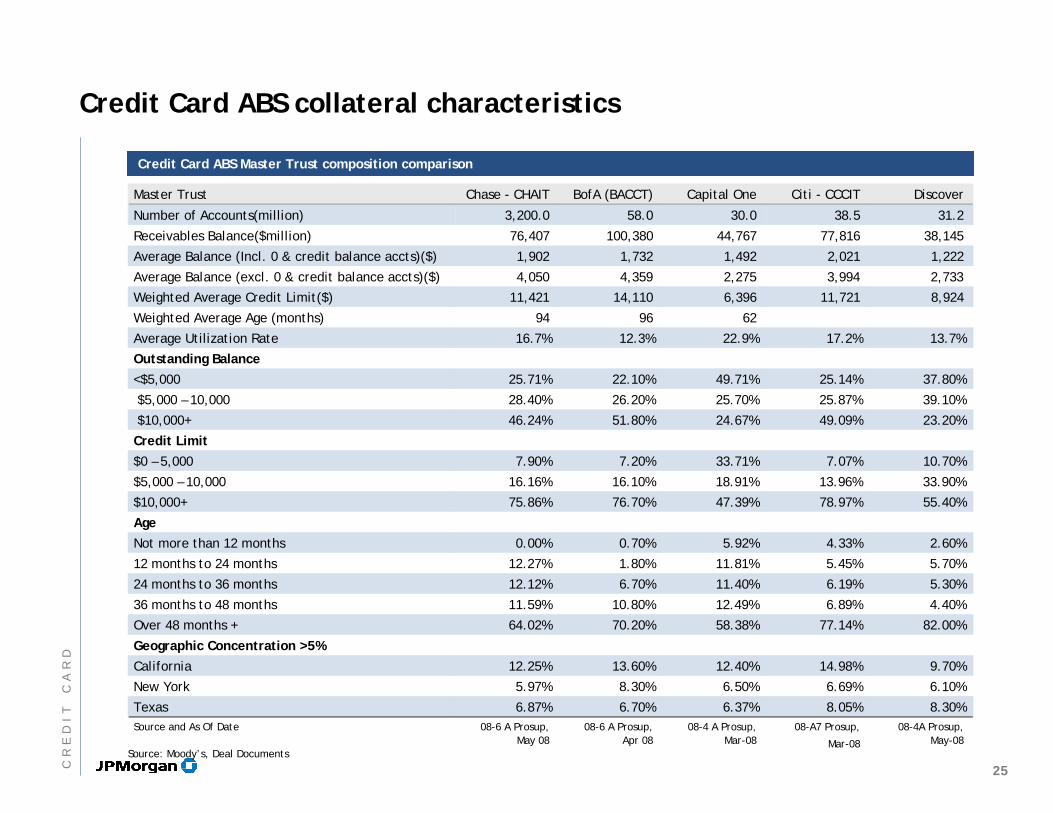
Credit Card ABS collateral characteristics
Credit Card ABS Master Trust composition comparison Credit Card ABS Master Trust composition comparison
Source: Moody’s, Deal Documents
Master Trust Chase - CHAIT BofA (BACCT) Capital One Citi - CCCIT Discover
Number of Accounts(million) 3,200.0 58.0 30.0 38.5 31.2
Receivables Balance($million) 76,407 100,380 44,767 77,816 38,145
Average Balance (Incl. 0 & credit balance accts)($) 1,902 1,732 1,492 2,021 1,222
Average Balance (excl. 0 & credit balance accts)($) 4,050 4,359 2,275 3,994 2,733
Weighted Average Credit Limit($) 11,421 14,110 6,396 11,721 8,924
Weighted Average Age (months) 94 96 62
Average Utilization Rate 16.7% 12.3% 22.9% 17.2% 13.7%
Outstanding Balance
<$5,000 25.71% 22.10% 49.71% 25.14% 37.80%
$5,000 – 10,000 28.40% 26.20% 25.70% 25.87% 39.10%
$10,000+ 46.24% 51.80% 24.67% 49.09% 23.20%
Credit Limit
$0 – 5,000 7.90% 7.20% 33.71% 7.07% 10.70%
$5,000 – 10,000 16.16% 16.10% 18.91% 13.96% 33.90%
$10,000+ 75.86% 76.70% 47.39% 78.97% 55.40%
Age
Not more than 12 months 0.00% 0.70% 5.92% 4.33% 2.60%
12 months to 24 months 12.27% 1.80% 11.81% 5.45% 5.70%
24 months to 36 months 12.12% 6.70% 11.40% 6.19% 5.30%
36 months to 48 months 11.59% 10.80% 12.49% 6.89% 4.40%
Over 48 months + 64.02% 70.20% 58.38% 77.14% 82.00%
Geographic Concentration >5%
California 12.25% 13.60% 12.40% 14.98% 9.70%
New York 5.97% 8.30% 6.50% 6.69% 6.10%
Texas 6.87% 6.70% 6.37% 8.05% 8.30% Source and As Of Date 08-6 A Prosup,
May 08 08-6 A Prosup,
Apr 08 08-4 A Prosup,
Mar-08 08-A7 Prosup,
Mar-08
08-4A Prosup, May-08
25C
RE
DI
TC
AR
D
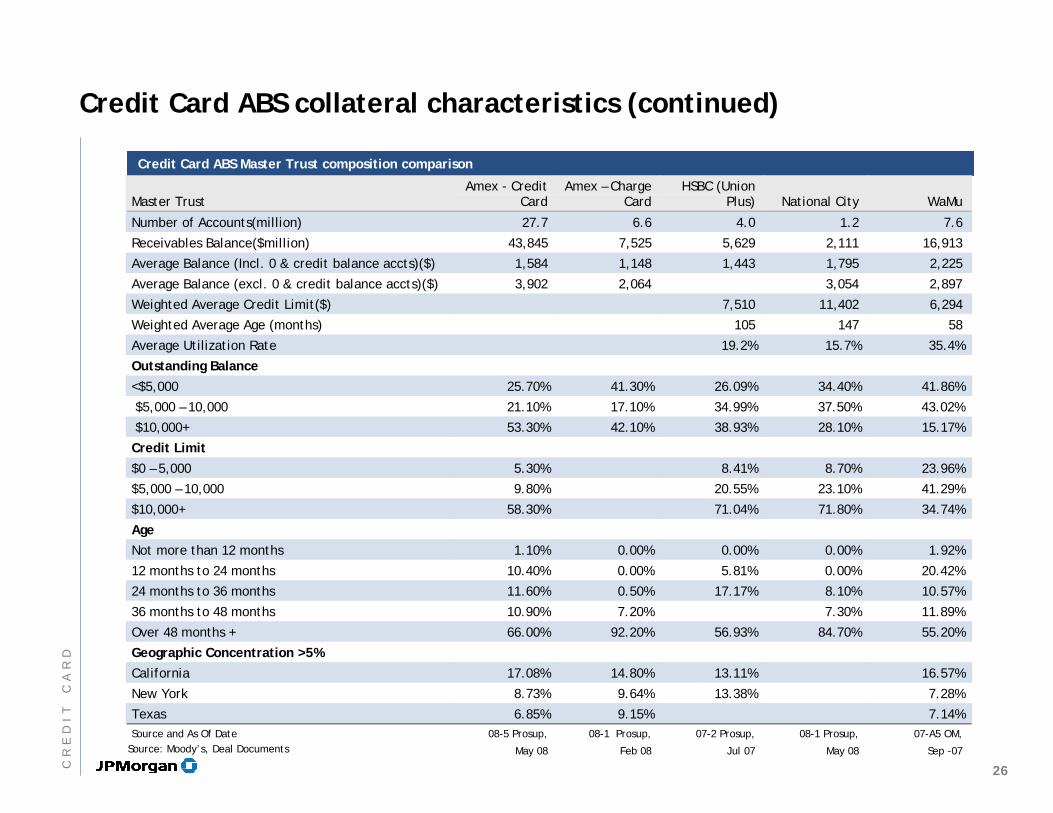
Credit Card ABS collateral characteristics (continued)
Credit Card ABS Master Trust composition comparison Credit Card ABS Master Trust composition comparison
Master Trust Amex - Credit
Card Amex – Charge
Card HSBC (Union
Plus) National City WaMu
Number of Accounts(million) 27.7 6.6 4.0 1.2 7.6
Receivables Balance($million) 43,845 7,525 5,629 2,111 16,913
Average Balance (Incl. 0 & credit balance accts)($) 1,584 1,148 1,443 1,795 2,225
Average Balance (excl. 0 & credit balance accts)($) 3,902 2,064 3,054 2,897
Weighted Average Credit Limit($) 7,510 11,402 6,294
Weighted Average Age (months) 105 147 58
Average Utilization Rate 19.2% 15.7% 35.4%
Outstanding Balance
<$5,000 25.70% 41.30% 26.09% 34.40% 41.86%
$5,000 – 10,000 21.10% 17.10% 34.99% 37.50% 43.02%
$10,000+ 53.30% 42.10% 38.93% 28.10% 15.17%
Credit Limit
$0 – 5,000 5.30% 8.41% 8.70% 23.96%
$5,000 – 10,000 9.80% 20.55% 23.10% 41.29%
$10,000+ 58.30% 71.04% 71.80% 34.74%
Age
Not more than 12 months 1.10% 0.00% 0.00% 0.00% 1.92%
12 months to 24 months 10.40% 0.00% 5.81% 0.00% 20.42%
24 months to 36 months 11.60% 0.50% 17.17% 8.10% 10.57%
36 months to 48 months 10.90% 7.20% 7.30% 11.89%
Over 48 months + 66.00% 92.20% 56.93% 84.70% 55.20%
Geographic Concentration >5%
California 17.08% 14.80% 13.11% 16.57%
New York 8.73% 9.64% 13.38% 7.28%
Texas 6.85% 9.15% 7.14% Source and As Of Date 08-5 Prosup,
May 08
08-1 Prosup,
Feb 08
07-2 Prosup,
Jul 07
08-1 Prosup,
May 08
07-A5 OM,
Sep -07
Source: Moody’s, Deal Documents
26CR
ED
IT
CA
RD
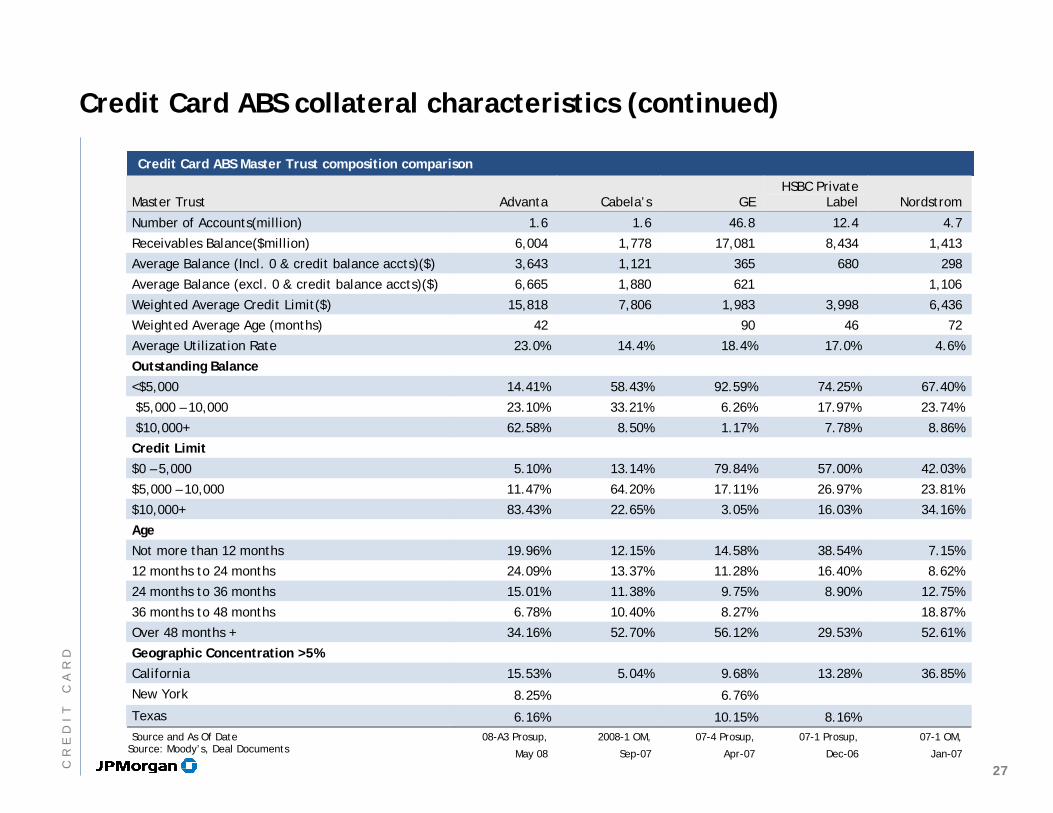
Credit Card ABS collateral characteristics (continued)
Credit Card ABS Master Trust composition comparison Credit Card ABS Master Trust composition comparison
Master Trust Advanta Cabela’s GE HSBC Private
Label Nordstrom
Number of Accounts(million) 1.6 1.6 46.8 12.4 4.7
Receivables Balance($million) 6,004 1,778 17,081 8,434 1,413
Average Balance (Incl. 0 & credit balance accts)($) 3,643 1,121 365 680 298
Average Balance (excl. 0 & credit balance accts)($) 6,665 1,880 621 1,106
Weighted Average Credit Limit($) 15,818 7,806 1,983 3,998 6,436
Weighted Average Age (months) 42 90 46 72
Average Utilization Rate 23.0% 14.4% 18.4% 17.0% 4.6%
Outstanding Balance
<$5,000 14.41% 58.43% 92.59% 74.25% 67.40%
$5,000 – 10,000 23.10% 33.21% 6.26% 17.97% 23.74%
$10,000+ 62.58% 8.50% 1.17% 7.78% 8.86%
Credit Limit
$0 – 5,000 5.10% 13.14% 79.84% 57.00% 42.03%
$5,000 – 10,000 11.47% 64.20% 17.11% 26.97% 23.81%
$10,000+ 83.43% 22.65% 3.05% 16.03% 34.16%
Age
Not more than 12 months 19.96% 12.15% 14.58% 38.54% 7.15%
12 months to 24 months 24.09% 13.37% 11.28% 16.40% 8.62%
24 months to 36 months 15.01% 11.38% 9.75% 8.90% 12.75%
36 months to 48 months 6.78% 10.40% 8.27% 18.87%
Over 48 months + 34.16% 52.70% 56.12% 29.53% 52.61%
Geographic Concentration >5%
California 15.53% 5.04% 9.68% 13.28% 36.85%
New York 8.25% 6.76%
Texas 6.16% 10.15% 8.16%
Source and As Of Date 08-A3 Prosup,
May 08
2008-1 OM,
Sep-07
07-4 Prosup,
Apr-07
07-1 Prosup,
Dec-06
07-1 OM,
Jan-07 Source: Moody’s, Deal Documents
27CR
ED
IT
CA
RD
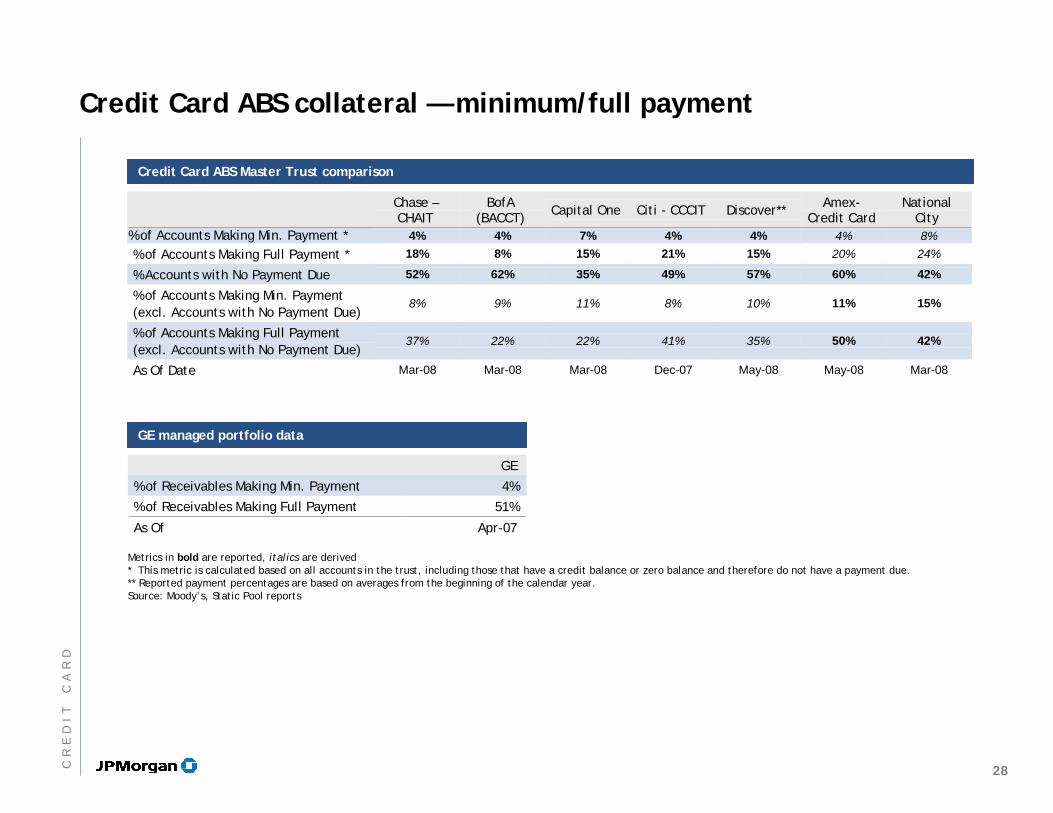
Credit Card ABS collateral — minimum/full payment
Credit Card ABS Master Trust comparison Credit Card ABS Master Trust comparison
Metrics in bold are reported, italics are derived* This metric is calculated based on all accounts in the trust, including those that have a credit balance or zero balance and therefore do not have a payment due.** Reported payment percentages are based on averages from the beginning of the calendar year.Source: Moody’s, Static Pool reports
Chase – CHAIT
BofA (BACCT) Capital One Citi - CCCIT Discover** Amex-
Credit Card National
City % of Accounts Making Min. Payment * 4% 4% 7% 4% 4% 4% 8% % of Accounts Making Full Payment * 18% 8% 15% 21% 15% 20% 24%
% Accounts with No Payment Due 52% 62% 35% 49% 57% 60% 42%
% of Accounts Making Min. Payment (excl. Accounts with No Payment Due)
8% 9% 11% 8% 10% 11% 15%
% of Accounts Making Full Payment (excl. Accounts with No Payment Due)
37% 22% 22% 41% 35% 50% 42%
As Of Date Mar-08 Mar-08 Mar-08 Dec-07 May-08 May-08 Mar-08
GE managed portfolio dataGE managed portfolio data
GE
% of Receivables Making Min. Payment 4%
% of Receivables Making Full Payment 51%
As Of Apr-07
28CR
ED
IT
CA
RD
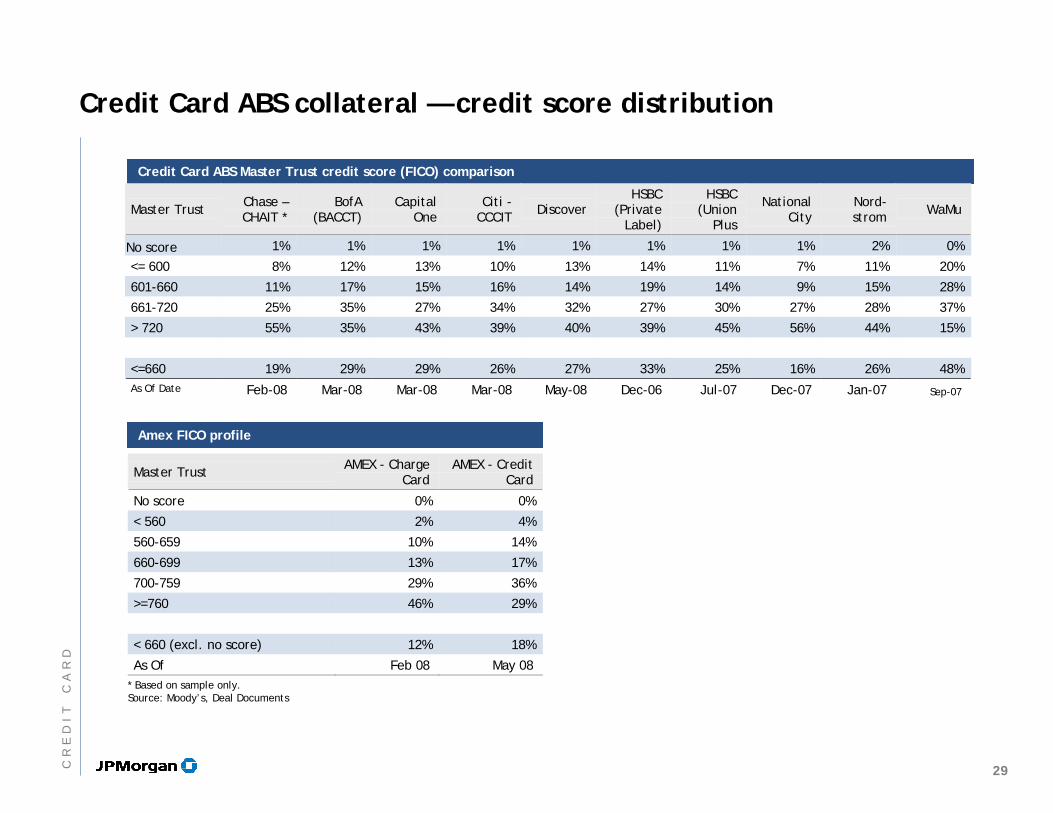
Credit Card ABS collateral — credit score distribution
Credit Card ABS Master Trust credit score (FICO) comparison Credit Card ABS Master Trust credit score (FICO) comparison
* Based on sample only. Source: Moody’s, Deal Documents
Master Trust Chase – CHAIT *
BofA (BACCT)
Capital One
Citi - CCCIT Discover
HSBC (Private
Label)
HSBC (Union
Plus
National City
Nord-strom WaMu
No score 1% 1% 1% 1% 1% 1% 1% 1% 2% 0%
<= 600 8% 12% 13% 10% 13% 14% 11% 7% 11% 20%
601-660 11% 17% 15% 16% 14% 19% 14% 9% 15% 28%
661-720 25% 35% 27% 34% 32% 27% 30% 27% 28% 37%
> 720 55% 35% 43% 39% 40% 39% 45% 56% 44% 15%
<=660 19% 29% 29% 26% 27% 33% 25% 16% 26% 48% As Of Date Feb-08 Mar-08 Mar-08 Mar-08 May-08 Dec-06 Jul-07 Dec-07 Jan-07 Sep-07
Amex FICO profileAmex FICO profile
Master Trust AMEX - Charge Card
AMEX - Credit Card
No score 0% 0%
< 560 2% 4%
560-659 10% 14%
660-699 13% 17%
700-759 29% 36%
>=760 46% 29%
< 660 (excl. no score) 12% 18%
As Of Feb 08 May 08
29CR
ED
IT
CA
RD
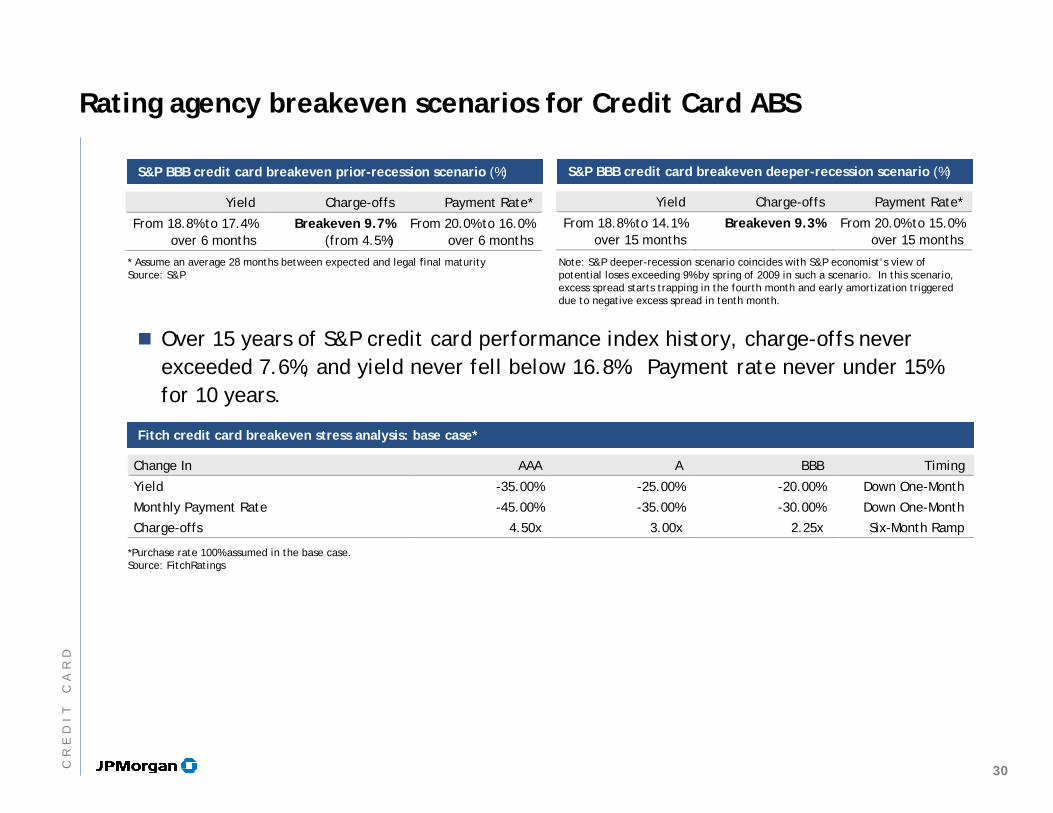
Rating agency breakeven scenarios for Credit Card ABS
Yield Charge-offs Payment Rate*
From 18.8% to 17.4% over 6 months
Breakeven 9.7% (from 4.5%)
From 20.0% to 16.0% over 6 months
S&P BBB credit card breakeven prior-recession scenario (%) S&P BBB credit card breakeven prior-recession scenario (%)
* Assume an average 28 months between expected and legal final maturity Source: S&P
Yield Charge-offs Payment Rate*
From 18.8% to 14.1% over 15 months
Breakeven 9.3% From 20.0% to 15.0% over 15 months
S&P BBB credit card breakeven deeper-recession scenario (%) S&P BBB credit card breakeven deeper-recession scenario (%)
Note: S&P deeper-recession scenario coincides with S&P economist’s view of potential loses exceeding 9% by spring of 2009 in such a scenario. In this scenario, excess spread starts trapping in the fourth month and early amortization triggered due to negative excess spread in tenth month.
Over 15 years of S&P credit card performance index history, charge-offs never exceeded 7.6%, and yield never fell below 16.8%. Payment rate never under 15% for 10 years.
Fitch credit card breakeven stress analysis: base case*Fitch credit card breakeven stress analysis: base case*
Change In AAA A BBB Timing
Yield -35.00% -25.00% -20.00% Down One-Month
Monthly Payment Rate -45.00% -35.00% -30.00% Down One-Month
Charge-offs 4.50x 3.00x 2.25x Six-Month Ramp
*Purchase rate 100% assumed in the base case.Source: FitchRatings
30CR
ED
IT
CA
RD
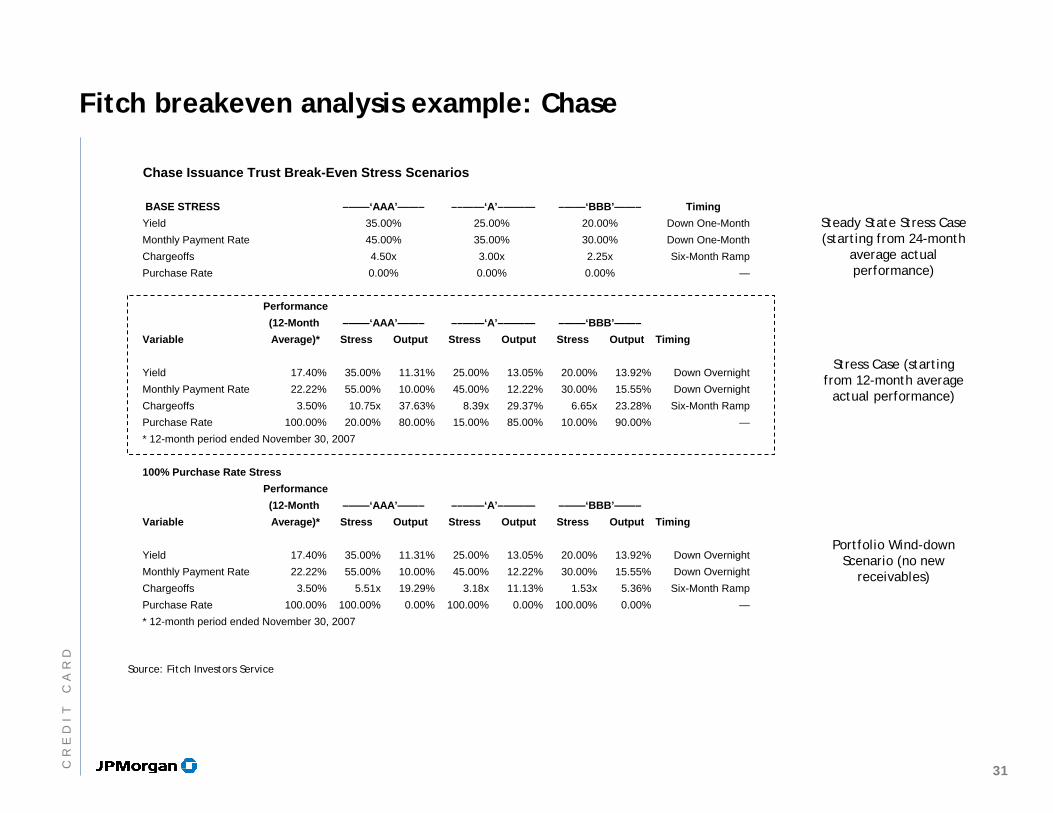
Fitch breakeven analysis example: Chase
Stress Case (starting from 12-month average
actual performance)
Portfolio Wind-down Scenario (no new
receivables)
Steady State Stress Case (starting from 24-month
average actual performance)
Source: Fitch Investors Service
Chase Issuance Trust Break-Even Stress Scenarios
BASE STRESS TimingYield Down One-MonthMonthly Payment Rate Down One-MonthChargeoffs Six-Month RampPurchase Rate —
Performance(12-Month
Variable Average)* Stress Output Stress Output Stress Output Timing
Yield 17.40% 35.00% 11.31% 25.00% 13.05% 20.00% 13.92% Down OvernightMonthly Payment Rate 22.22% 55.00% 10.00% 45.00% 12.22% 30.00% 15.55% Down OvernightChargeoffs 3.50% 10.75x 37.63% 8.39x 29.37% 6.65x 23.28% Six-Month RampPurchase Rate 100.00% 20.00% 80.00% 15.00% 85.00% 10.00% 90.00% —* 12-month period ended November 30, 2007
100% Purchase Rate StressPerformance(12-Month
Variable Average)* Stress Output Stress Output Stress Output Timing
Yield 17.40% 35.00% 11.31% 25.00% 13.05% 20.00% 13.92% Down OvernightMonthly Payment Rate 22.22% 55.00% 10.00% 45.00% 12.22% 30.00% 15.55% Down OvernightChargeoffs 3.50% 5.51x 19.29% 3.18x 11.13% 1.53x 5.36% Six-Month RampPurchase Rate 100.00% 100.00% 0.00% 100.00% 0.00% 100.00% 0.00% —* 12-month period ended November 30, 2007
–——‘AAA’——– ––——‘A’–——— –——‘BBB’——–
0.00% 0.00% 0.00%
–——‘AAA’——– ––——‘A’–——— –——‘BBB’——–
45.00% 35.00% 30.00%4.50x 3.00x 2.25x
–——‘AAA’——– ––——‘A’–——— –——‘BBB’——–35.00% 25.00% 20.00%
31CR
ED
IT
CA
RD
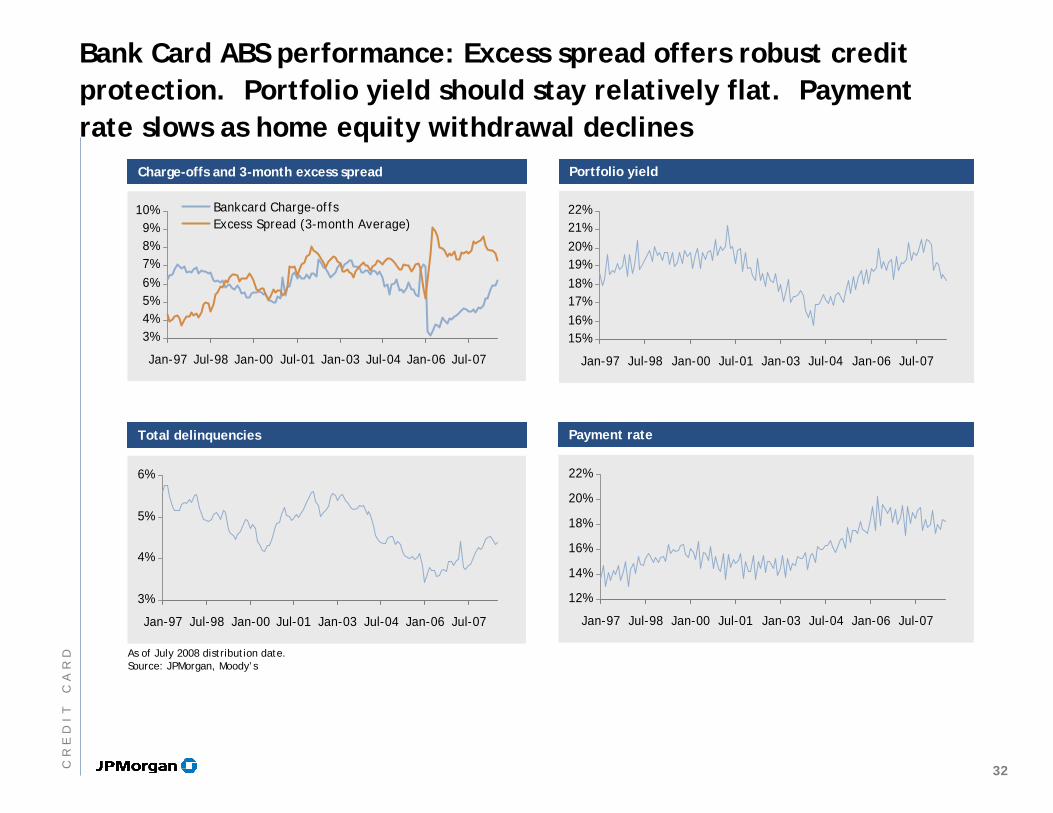
15%16%17%18%19%20%21%22%
Jan-97 Jul-98 Jan-00 Jul-01 Jan-03 Jul-04 Jan-06 Jul-07
As of July 2008 distribution date.Source: JPMorgan, Moody’s
Portfolio yieldPortfolio yieldCharge-offs and 3-month excess spreadCharge-offs and 3-month excess spread
3%4%5%6%7%8%9%
10%
Jan-97 Jul-98 Jan-00 Jul-01 Jan-03 Jul-04 Jan-06 Jul-07
Bankcard Charge-offs Excess Spread (3-month Average)
Bank Card ABS performance: Excess spread offers robust credit protection. Portfolio yield should stay relatively flat. Payment rate slows as home equity withdrawal declines
Payment ratePayment rate
12%
14%
16%
18%
20%
22%
Jan-97 Jul-98 Jan-00 Jul-01 Jan-03 Jul-04 Jan-06 Jul-07
Total delinquenciesTotal delinquencies
3%
4%
5%
6%
Jan-97 Jul-98 Jan-00 Jul-01 Jan-03 Jul-04 Jan-06 Jul-07
32CR
ED
IT
CA
RD
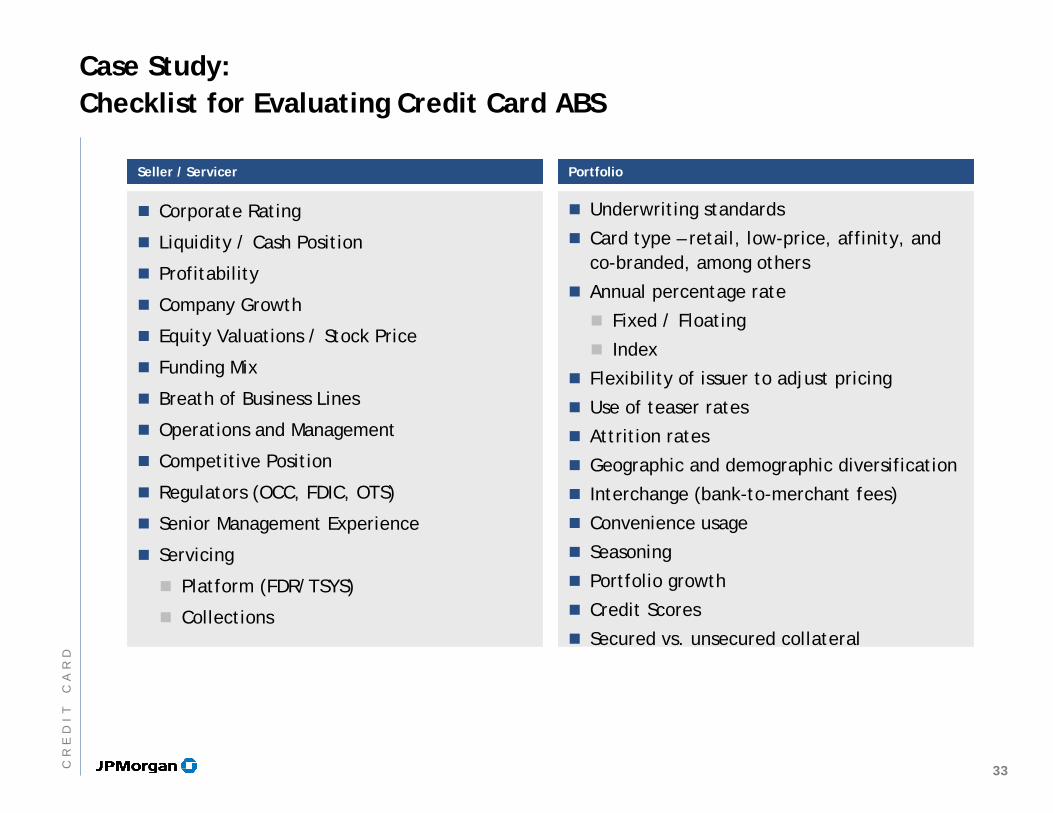
Seller / ServicerSeller / Servicer PortfolioPortfolio
Case Study:Checklist for Evaluating Credit Card ABS
Corporate Rating
Liquidity / Cash Position
Profitability
Company Growth
Equity Valuations / Stock Price
Funding Mix
Breath of Business Lines
Operations and Management
Competitive Position
Regulators (OCC, FDIC, OTS)
Senior Management Experience
Servicing
Platform (FDR/TSYS)
Collections
Underwriting standards
Card type – retail, low-price, affinity, and co-branded, among others
Annual percentage rate
Fixed / Floating
Index
Flexibility of issuer to adjust pricing
Use of teaser rates
Attrition rates
Geographic and demographic diversification
Interchange (bank-to-merchant fees)
Convenience usage
Seasoning
Portfolio growth
Credit Scores
Secured vs. unsecured collateral
33CR
ED
IT
CA
RD
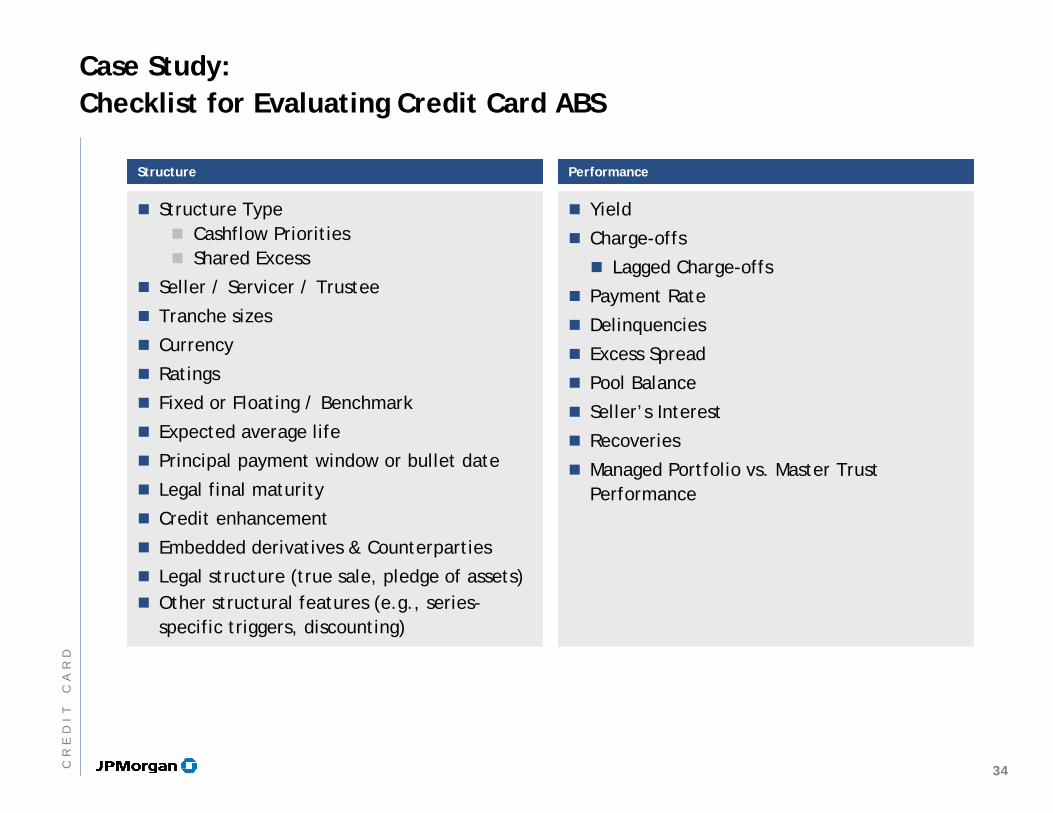
StructureStructure PerformancePerformance
Case Study:Checklist for Evaluating Credit Card ABS
Structure TypeCashflow PrioritiesShared Excess
Seller / Servicer / Trustee
Tranche sizes
Currency
Ratings
Fixed or Floating / Benchmark
Expected average life
Principal payment window or bullet date
Legal final maturity
Credit enhancement
Embedded derivatives & Counterparties
Legal structure (true sale, pledge of assets)Other structural features (e.g., series-specific triggers, discounting)
Yield
Charge-offs
Lagged Charge-offs
Payment Rate
Delinquencies
Excess Spread
Pool Balance
Seller’s Interest
Recoveries
Managed Portfolio vs. Master Trust Performance
34CR
ED
IT
CA
RD
AgendaAgenda
Page
Home Equity ABS
Student Loan ABS (FFELP)
Automobile ABS
Credit Card
Introduction to ABS
35
1
11
35
53
86
IN
VE
ST
IN
GI
NA
SS
ET
BA
CK
ED
SE
CU
RI
TI
ES
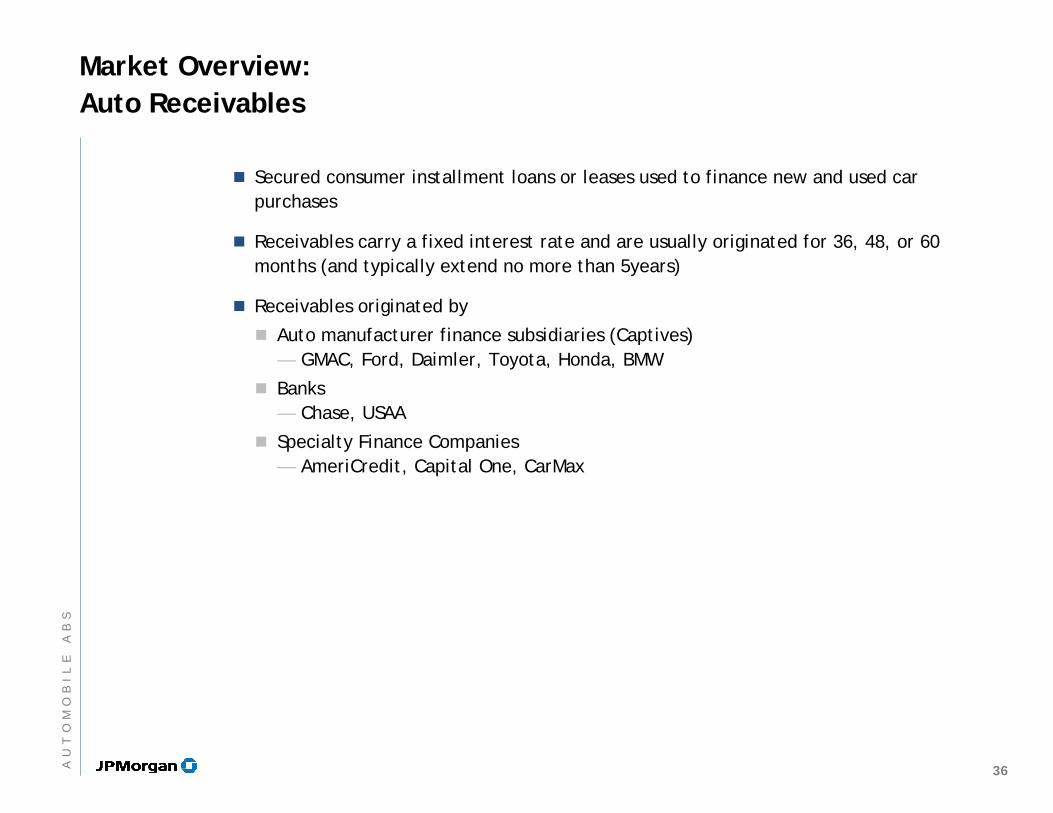
Market Overview:Auto Receivables
Secured consumer installment loans or leases used to finance new and used car purchases
Receivables carry a fixed interest rate and are usually originated for 36, 48, or 60 months (and typically extend no more than 5years)
Receivables originated by
Auto manufacturer finance subsidiaries (Captives)— GMAC, Ford, Daimler, Toyota, Honda, BMW
Banks— Chase, USAA
Specialty Finance Companies— AmeriCredit, Capital One, CarMax
36AU
TO
MO
BI
LE
AB
S
Prime Auto LoansPrime Auto Loans Near-Prime Auto Loans
Near-Prime Auto Loans
Subprime Auto LoansSubprime Auto Loans
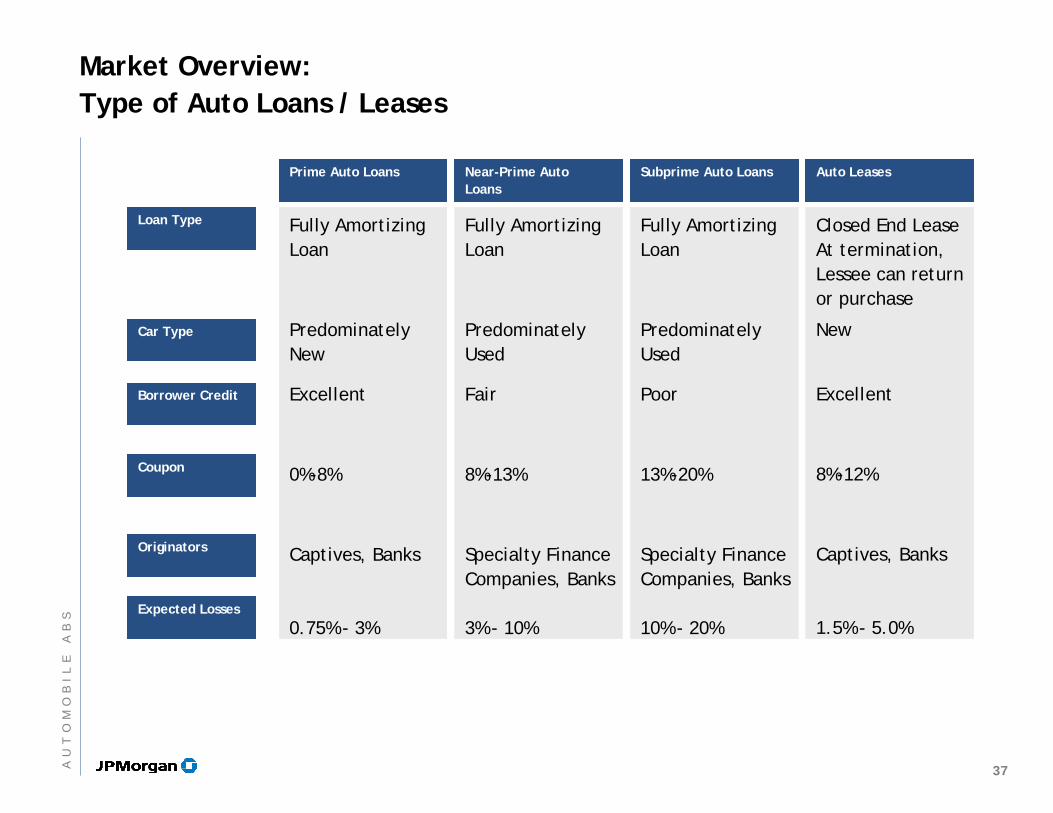
Market Overview: Type of Auto Loans / Leases
Fully Amortizing Loan
Predominately New
Excellent
0%-8%
Captives, Banks
0.75% - 3%
Fully Amortizing Loan
Predominately Used
Fair
8%-13%
Specialty Finance Companies, Banks
3% - 10%
Fully Amortizing Loan
Predominately Used
Poor
13%-20%
Specialty Finance Companies, Banks
10% - 20%
Loan TypeLoan Type
Car TypeCar Type
Borrower CreditBorrower Credit
CouponCoupon
OriginatorsOriginators
Expected LossesExpected Losses
Auto LeasesAuto Leases
Closed End Lease At termination, Lessee can return or purchase
New
Excellent
8%-12%
Captives, Banks
1.5% - 5.0%
37AU
TO
MO
BI
LE
AB
S
Total = $__mm
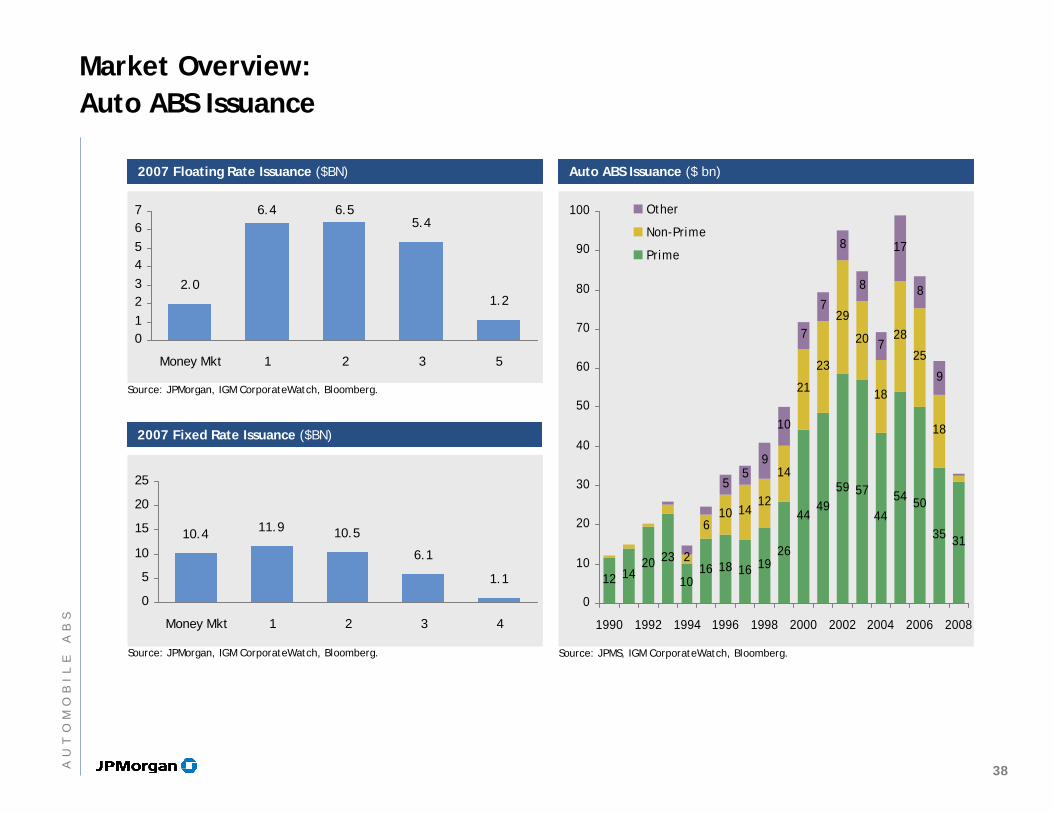
Market Overview:Auto ABS Issuance
Auto ABS Issuance ($ bn)Auto ABS Issuance ($ bn)
12 1420 23
1016 18 16 19
26
4449
59 57
44
54 50
35 312
610 14
12
14
21
23
29
20
18
28
25
18
55
9
10
7
7
8
8
7
17
8
9
0
10
20
30
40
50
60
70
80
90
100
1990 1992 1994 1996 1998 2000 2002 2004 2006 2008
Other
Non-Prime
Prime
Source: JPMS, IGM CorporateWatch, Bloomberg.
Source: JPMorgan, IGM CorporateWatch, Bloomberg.
Source: JPMorgan, IGM CorporateWatch, Bloomberg.
2007 Floating Rate Issuance ($BN)2007 Floating Rate Issuance ($BN)
2007 Fixed Rate Issuance ($BN)2007 Fixed Rate Issuance ($BN)
2.0
6.4 6.55.4
1.2
01234567
Money Mkt 1 2 3 5
10.4 11.9 10.5
6.1
1.1
0
5
10
15
20
25
Money Mkt 1 2 3 4
38AU
TO
MO
BI
LE
AB
S
Source: JPMS, IGM CorporateWatch, Bloomberg.
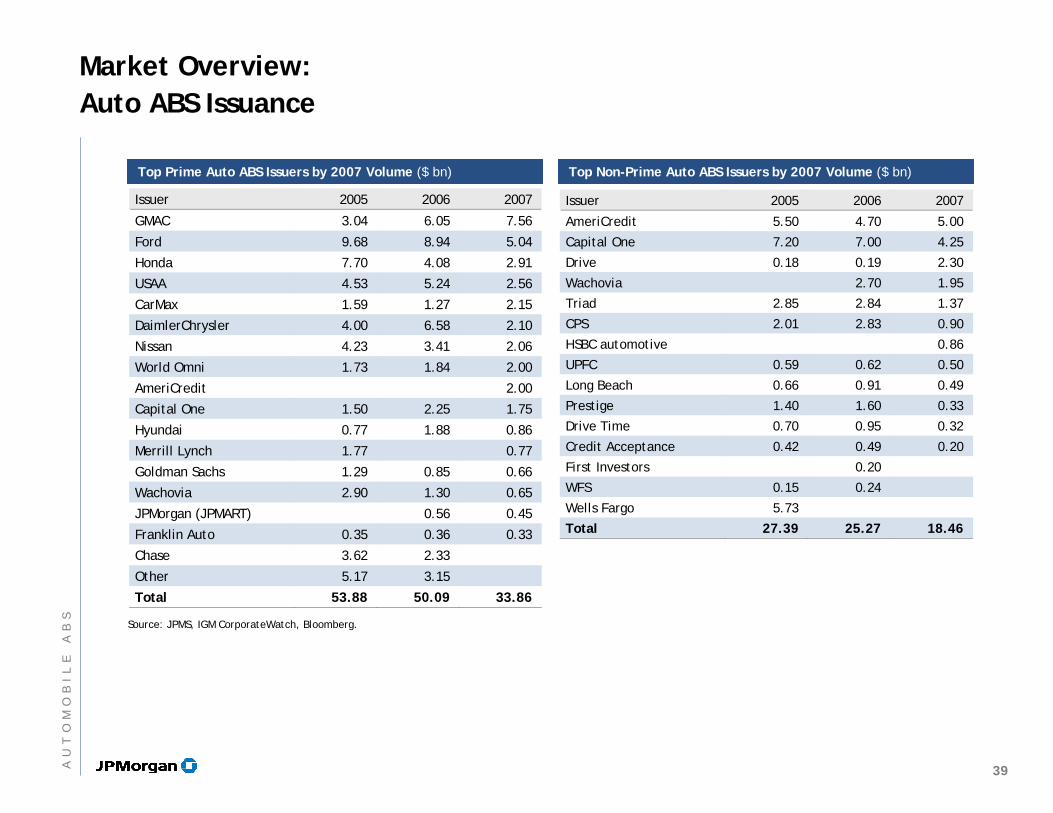
Market Overview:Auto ABS Issuance
Top Prime Auto ABS Issuers by 2007 Volume ($ bn)Top Prime Auto ABS Issuers by 2007 Volume ($ bn)
Issuer 2005 2006 2007
GMAC 3.04 6.05 7.56
Ford 9.68 8.94 5.04
Honda 7.70 4.08 2.91
USAA 4.53 5.24 2.56
CarMax 1.59 1.27 2.15
DaimlerChrysler 4.00 6.58 2.10
Nissan 4.23 3.41 2.06
World Omni 1.73 1.84 2.00
AmeriCredit 2.00
Capital One 1.50 2.25 1.75
Hyundai 0.77 1.88 0.86
Merrill Lynch 1.77 0.77
Goldman Sachs 1.29 0.85 0.66
Wachovia 2.90 1.30 0.65
JPMorgan (JPMART) 0.56 0.45
Franklin Auto 0.35 0.36 0.33
Chase 3.62 2.33
Other 5.17 3.15
Total 53.88 50.09 33.86
Top Non-Prime Auto ABS Issuers by 2007 Volume ($ bn)Top Non-Prime Auto ABS Issuers by 2007 Volume ($ bn)
Issuer 2005 2006 2007
AmeriCredit 5.50 4.70 5.00
Capital One 7.20 7.00 4.25
Drive 0.18 0.19 2.30
Wachovia 2.70 1.95
Triad 2.85 2.84 1.37
CPS 2.01 2.83 0.90
HSBC automotive 0.86
UPFC 0.59 0.62 0.50
Long Beach 0.66 0.91 0.49
Prestige 1.40 1.60 0.33
Drive Time 0.70 0.95 0.32
Credit Acceptance 0.42 0.49 0.20
First Investors 0.20
WFS 0.15 0.24
Wells Fargo 5.73
Total 27.39 25.27 18.46
39AU
TO
MO
BI
LE
AB
S
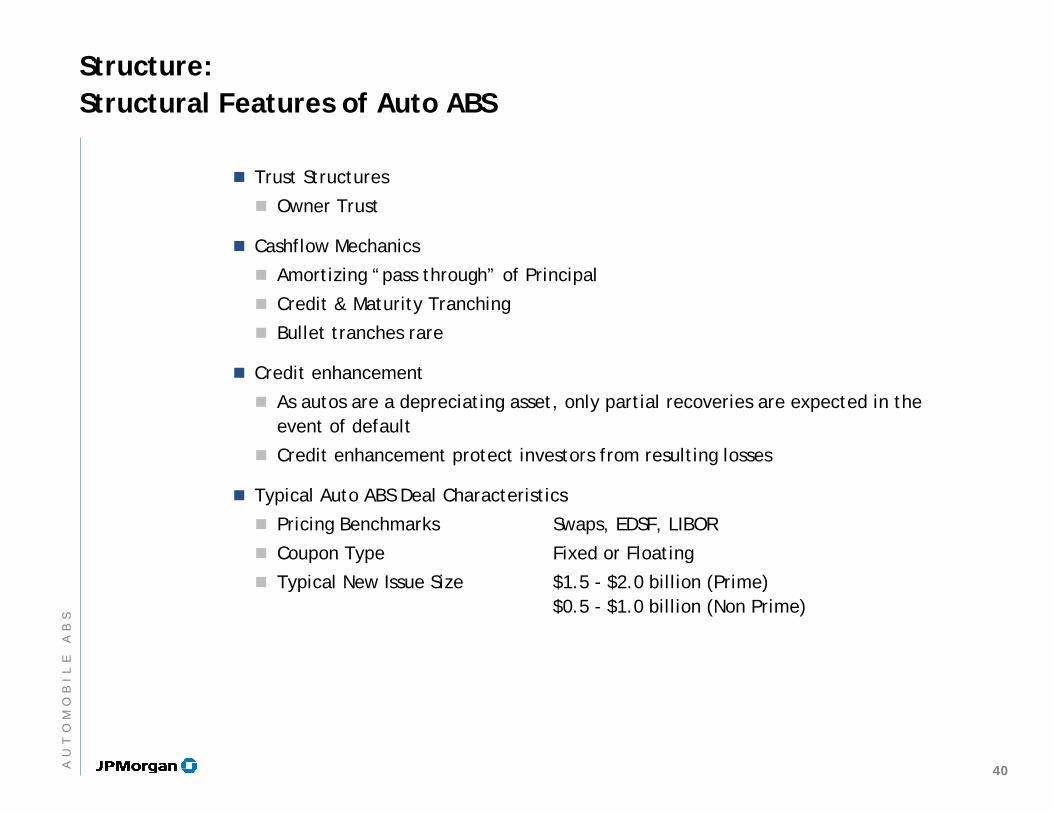
Structure: Structural Features of Auto ABS
Trust Structures
Owner Trust
Cashflow Mechanics
Amortizing “pass through” of Principal
Credit & Maturity Tranching
Bullet tranches rare
Credit enhancement
As autos are a depreciating asset, only partial recoveries are expected in the event of default
Credit enhancement protect investors from resulting losses
Typical Auto ABS Deal Characteristics
Pricing Benchmarks Swaps, EDSF, LIBOR
Coupon Type Fixed or Floating
Typical New Issue Size $1.5 - $2.0 billion (Prime)$0.5 - $1.0 billion (Non Prime)
40AU
TO
MO
BI
LE
AB
S
Structure:Amortizing Cashflows
Loan amortizes principal over their term-to-maturity
Loan may prepay in advance of the scheduled maturity
Voluntary prepayment— Refinancing or sale of vehicle
Involuntary prepayment— Repossession or loss of vehicle
When a prepayment occurs, principal is paid through to the security holders, thus retiring that portion of principal that is attributable to the loan that has prepaid
Prepayments measured by Absolute (ABS) prepayment model— Standard measure of prepayments for automobile loan backed securities, which
calculates monthly prepayments as the percent of the original dollar balance of receivables. Prime auto ABS typically prices using 1.5% ABS assumption.
The small collateral balance and relatively short maturity for the typical auto loan contract reduces the incentive to refinance because monthly payment saving would be minimal
41AU
TO
MO
BI
LE
AB
S
1 2 3 4 5 6 7 8 9 10 11 12 13 14 15 16 17 18 19 20 21 22 23 24 25 26 27 28 29 30 31 32 33 34 35 36 37 38 39 40 41 42 43Deal Age
Principal Paid Interest Paid
1 2 3 4 5 6 7 8 9 10 11 12 13 14 15 16 17 18 19 20 21 22 23 24 25 26 27 28 29 30 31 32 33 34 35 36 37 38 39 40 41 42 43Deal Age
Principal
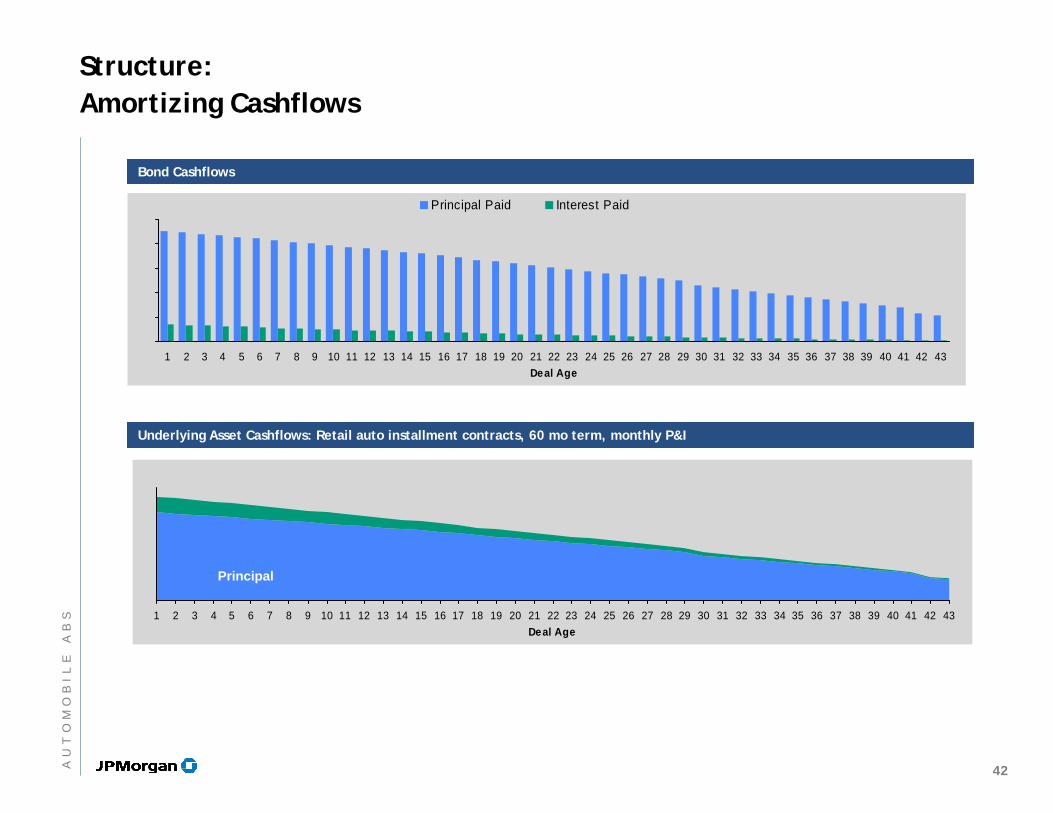
Structure:Amortizing Cashflows
Bond CashflowsBond Cashflows
Underlying Asset Cashflows: Retail auto installment contracts, 60 mo term, monthly P&IUnderlying Asset Cashflows: Retail auto installment contracts, 60 mo term, monthly P&I
42AU
TO
MO
BI
LE
AB
S
Obligors Seller/Servicer
Investors Investors
Reserve Fund
Class A-1Notes
A-1+/P-1
Class A-2 NotesAAA
Bankruptcy remote sale
Owner TrustIssuer
Investors /Retained
Class B Certs
A
Investors Investors
Class A-3NotesAAA
Class A-4 NotesAAA
Structure:Owner Trust
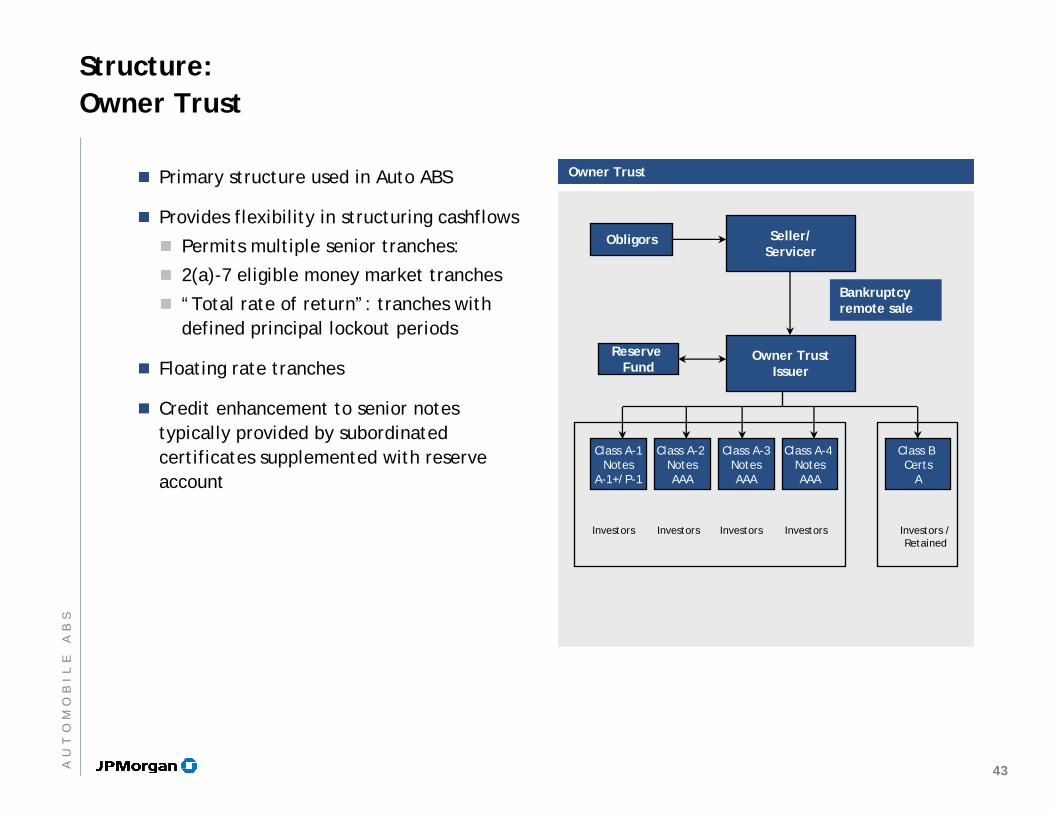
Primary structure used in Auto ABS
Provides flexibility in structuring cashflows
Permits multiple senior tranches:
2(a)-7 eligible money market tranches
“Total rate of return”: tranches with defined principal lockout periods
Floating rate tranches
Credit enhancement to senior notes typically provided by subordinated certificates supplemented with reserve account
Owner TrustOwner Trust
43AU
TO
MO
BI
LE
AB
S
Basic auto securitization cash flows
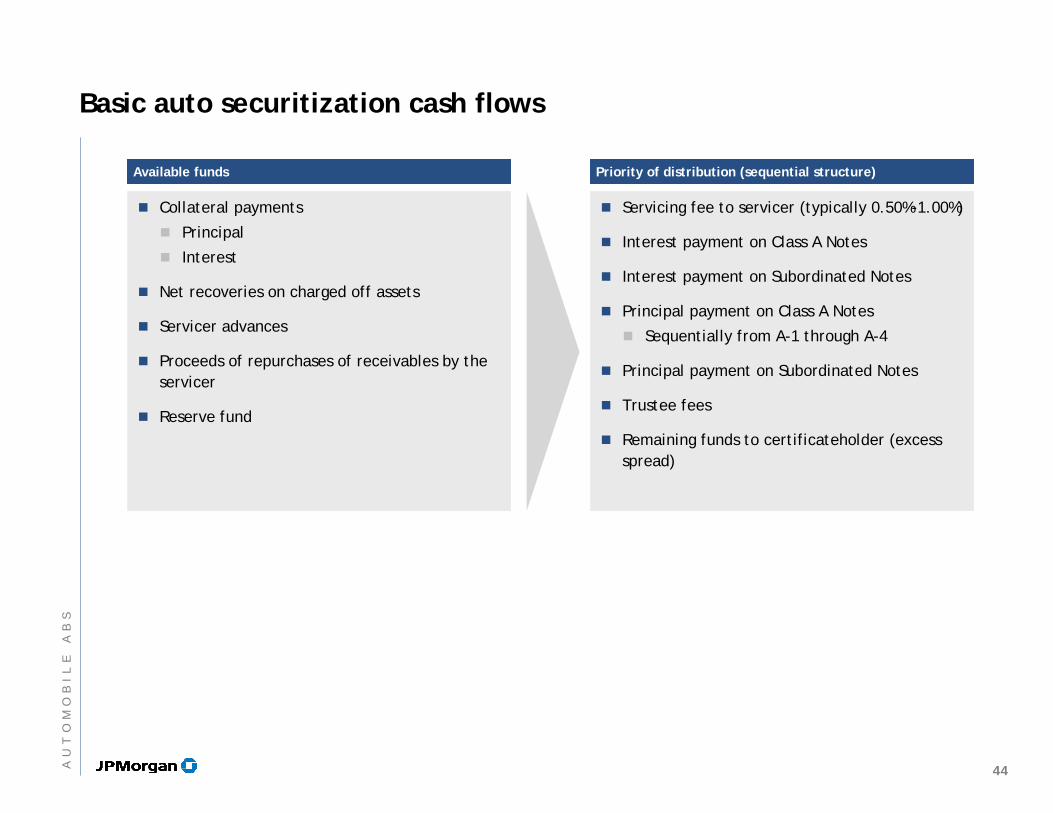
Collateral payments
Principal
Interest
Net recoveries on charged off assets
Servicer advances
Proceeds of repurchases of receivables by the servicer
Reserve fund
Servicing fee to servicer (typically 0.50%-1.00%)
Interest payment on Class A Notes
Interest payment on Subordinated Notes
Principal payment on Class A Notes
Sequentially from A-1 through A-4
Principal payment on Subordinated Notes
Trustee fees
Remaining funds to certificateholder (excess spread)
Available fundsAvailable funds Priority of distribution (sequential structure)Priority of distribution (sequential structure)
44AU
TO
MO
BI
LE
AB
S
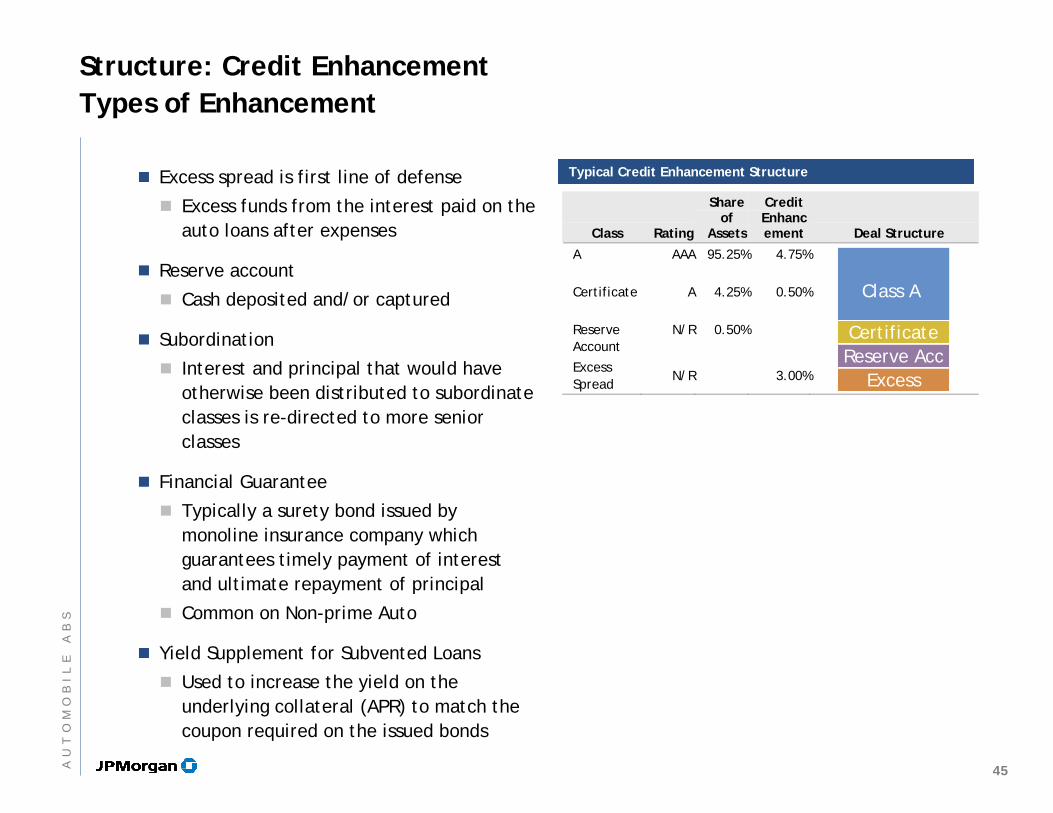
Structure: Credit EnhancementTypes of Enhancement
Excess spread is first line of defense
Excess funds from the interest paid on the auto loans after expenses
Reserve account
Cash deposited and/or captured
Subordination
Interest and principal that would have otherwise been distributed to subordinate classes is re-directed to more senior classes
Financial Guarantee
Typically a surety bond issued by monoline insurance company which guarantees timely payment of interest and ultimate repayment of principal
Common on Non-prime Auto
Yield Supplement for Subvented Loans
Used to increase the yield on the underlying collateral (APR) to match the coupon required on the issued bonds
Class Rating
Share of
Assets
Credit Enhancement Deal Structure
A
AAA 95.25% 4.75%
Certificate
A 4.25% 0.50%
Reserve Account
N/R 0.50%
Excess Spread
N/R 3.00%
Typical Credit Enhancement StructureTypical Credit Enhancement Structure
Class A
Certificate
ExcessReserve Acc
45AU
TO
MO
BI
LE
AB
S
Structural features of Auto Loan ABS
Strict sequential: Classes in order of A1, A2, A3, A4, then subordinates
Partial sequential: A1, then pro-rata senior/sub if credit enhancement at target and passing triggers, sequential otherwise
Reserve funds
Fully funded, non-declining
Reserve fund step up or down based on triggers
Triggers
Based on delinquency and cumulative loss schedule
Credit enhancement increase over the life of the deal due to:
Non-declining reserve accounts, which grows as a percentage of current outstanding balance as the ABS pool amortizes
Availability of excess spread to turbo notes
Trapping excess spread within the ABS deal
As a result, Auto ABS sector experiences a high number of upgrades to downgrades — 148 upgrades to 0 downgrades by Moody’s in 2006
46AU
TO
MO
BI
LE
AB
S
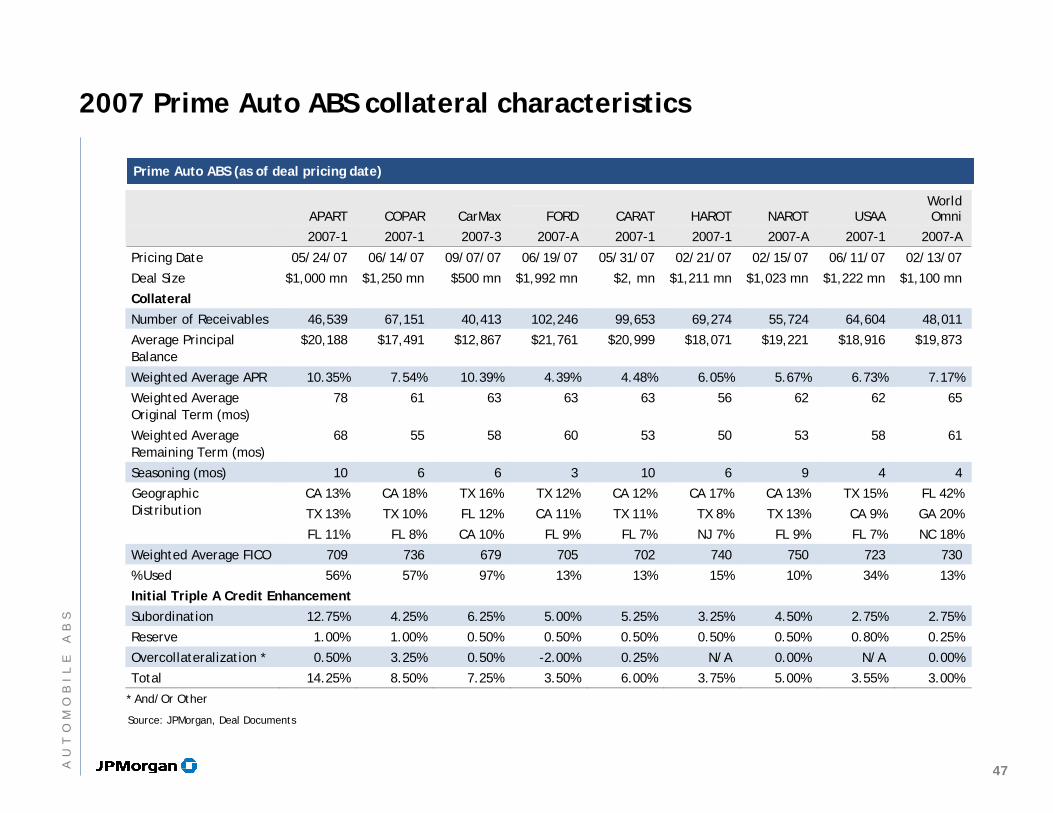
APART COPAR CarMax FORD CARAT HAROT NAROT USAA World Omni
2007-1 2007-1 2007-3 2007-A 2007-1 2007-1 2007-A 2007-1 2007-A
Pricing Date 05/24/07 06/14/07 09/07/07 06/19/07 05/31/07 02/21/07 02/15/07 06/11/07 02/13/07
Deal Size $1,000 mn $1,250 mn $500 mn $1,992 mn $2, mn $1,211 mn $1,023 mn $1,222 mn $1,100 mn
Collateral
Number of Receivables 46,539 67,151 40,413 102,246 99,653 69,274 55,724 64,604 48,011
Average Principal Balance
$20,188 $17,491 $12,867 $21,761 $20,999 $18,071 $19,221 $18,916 $19,873
Weighted Average APR 10.35% 7.54% 10.39% 4.39% 4.48% 6.05% 5.67% 6.73% 7.17%
Weighted Average Original Term (mos)
78 61 63 63 63 56 62 62 65
Weighted Average Remaining Term (mos)
68 55 58 60 53 50 53 58 61
Seasoning (mos) 10 6 6 3 10 6 9 4 4
CA 13% CA 18% TX 16% TX 12% CA 12% CA 17% CA 13% TX 15% FL 42%
TX 13% TX 10% FL 12% CA 11% TX 11% TX 8% TX 13% CA 9% GA 20%
Geographic Distribution
FL 11% FL 8% CA 10% FL 9% FL 7% NJ 7% FL 9% FL 7% NC 18%
Weighted Average FICO 709 736 679 705 702 740 750 723 730
% Used 56% 57% 97% 13% 13% 15% 10% 34% 13%
Initial Triple A Credit Enhancement Subordination 12.75% 4.25% 6.25% 5.00% 5.25% 3.25% 4.50% 2.75% 2.75%
Reserve 1.00% 1.00% 0.50% 0.50% 0.50% 0.50% 0.50% 0.80% 0.25%
Overcollateralization * 0.50% 3.25% 0.50% -2.00% 0.25% N/A 0.00% N/A 0.00%
Total 14.25% 8.50% 7.25% 3.50% 6.00% 3.75% 5.00% 3.55% 3.00%
* And/Or Other
Prime Auto ABS (as of deal pricing date)Prime Auto ABS (as of deal pricing date)
Source: JPMorgan, Deal Documents
2007 Prime Auto ABS collateral characteristics
47AU
TO
MO
BI
LE
AB
S
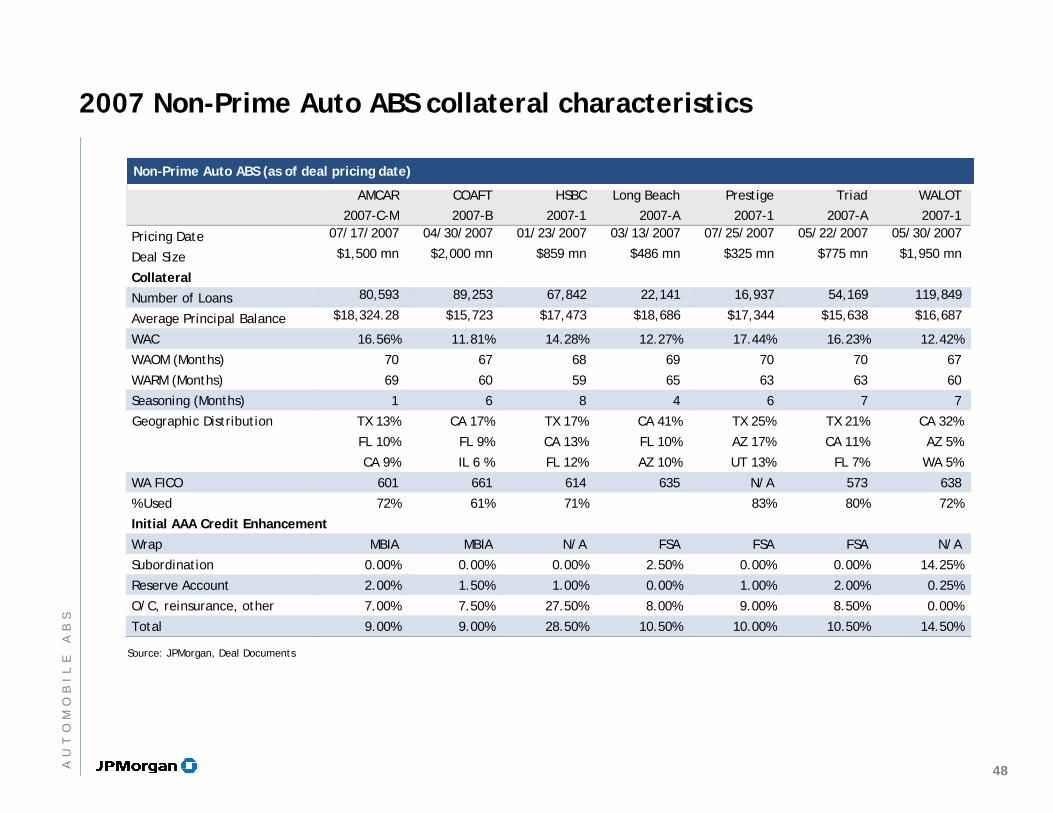
AMCAR COAFT HSBC Long Beach Prestige Triad WALOT
2007-C-M 2007-B 2007-1 2007-A 2007-1 2007-A 2007-1
Pricing Date 07/17/2007 04/30/2007 01/23/2007 03/13/2007 07/25/2007 05/22/2007 05/30/2007
Deal Size $1,500 mn $2,000 mn $859 mn $486 mn $325 mn $775 mn $1,950 mn
Collateral
Number of Loans 80,593 89,253 67,842 22,141 16,937 54,169 119,849
Average Principal Balance $18,324.28 $15,723 $17,473 $18,686 $17,344 $15,638 $16,687
WAC 16.56% 11.81% 14.28% 12.27% 17.44% 16.23% 12.42%
WAOM (Months) 70 67 68 69 70 70 67
WARM (Months) 69 60 59 65 63 63 60
Seasoning (Months) 1 6 8 4 6 7 7
TX 13% CA 17% TX 17% CA 41% TX 25% TX 21% CA 32%
FL 10% FL 9% CA 13% FL 10% AZ 17% CA 11% AZ 5%
Geographic Distribution
CA 9% IL 6 % FL 12% AZ 10% UT 13% FL 7% WA 5%
WA FICO 601 661 614 635 N/A 573 638
% Used 72% 61% 71% 83% 80% 72%
Initial AAA Credit Enhancement
Wrap MBIA MBIA N/A FSA FSA FSA N/A
Subordination 0.00% 0.00% 0.00% 2.50% 0.00% 0.00% 14.25%
Reserve Account 2.00% 1.50% 1.00% 0.00% 1.00% 2.00% 0.25%
O/C, reinsurance, other 7.00% 7.50% 27.50% 8.00% 9.00% 8.50% 0.00%
Total 9.00% 9.00% 28.50% 10.50% 10.00% 10.50% 14.50%
Non-Prime Auto ABS (as of deal pricing date)Non-Prime Auto ABS (as of deal pricing date)
Source: JPMorgan, Deal Documents
2007 Non-Prime Auto ABS collateral characteristics
48AU
TO
MO
BI
LE
AB
S
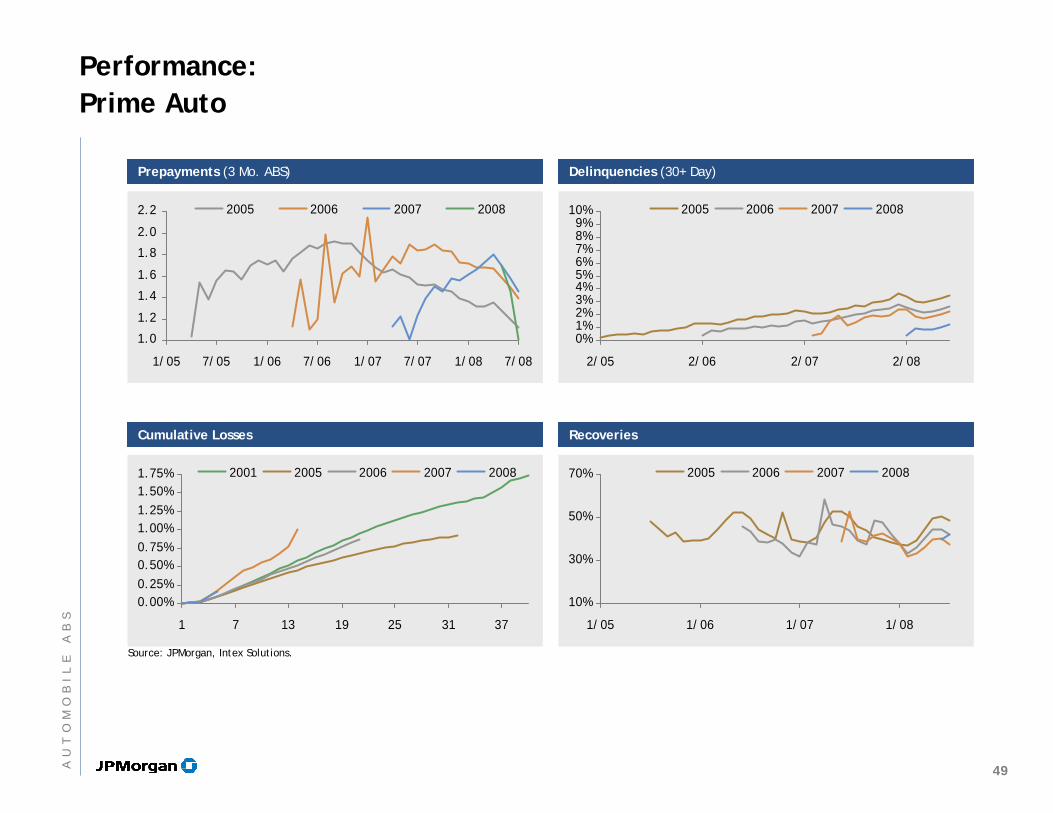
Source: JPMorgan, Intex Solutions.
Prepayments (3 Mo. ABS)Prepayments (3 Mo. ABS) Delinquencies (30+ Day)Delinquencies (30+ Day)
Cumulative LossesCumulative Losses RecoveriesRecoveries
1.0
1.2
1.4
1.6
1.8
2.0
2.2
1/05 7/05 1/06 7/06 1/07 7/07 1/08 7/08
2005 2006 2007 2008
Performance:Prime Auto
0.00%0.25%0.50%0.75%1.00%1.25%1.50%1.75%
1 7 13 19 25 31 37
2001 2005 2006 2007 2008
0%1%2%3%4%5%6%7%8%9%
10%
2/05 2/06 2/07 2/08
2005 2006 2007 2008
10%
30%
50%
70%
1/05 1/06 1/07 1/08
2005 2006 2007 2008
49AU
TO
MO
BI
LE
AB
S
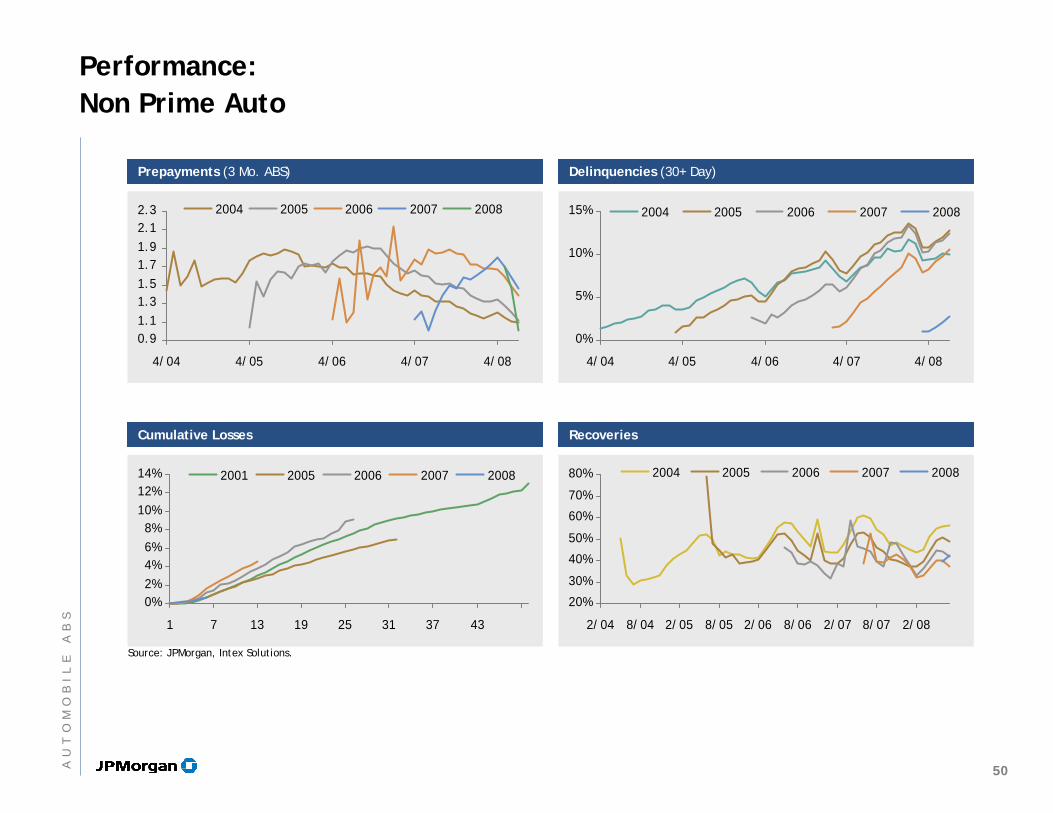
Source: JPMorgan, Intex Solutions.
Prepayments (3 Mo. ABS)Prepayments (3 Mo. ABS) Delinquencies (30+ Day)Delinquencies (30+ Day)
Cumulative LossesCumulative Losses RecoveriesRecoveries
Performance:Non Prime Auto
0%2%4%6%8%
10%12%14%
1 7 13 19 25 31 37 43
2001 2005 2006 2007 2008
0%
5%
10%
15%
4/04 4/05 4/06 4/07 4/08
2004 2005 2006 2007 2008
20%
30%
40%
50%
60%
70%
80%
2/04 8/04 2/05 8/05 2/06 8/06 2/07 8/07 2/08
2004 2005 2006 2007 2008
0.91.11.31.51.71.92.12.3
4/04 4/05 4/06 4/07 4/08
2004 2005 2006 2007 2008
50AU
TO
MO
BI
LE
AB
S
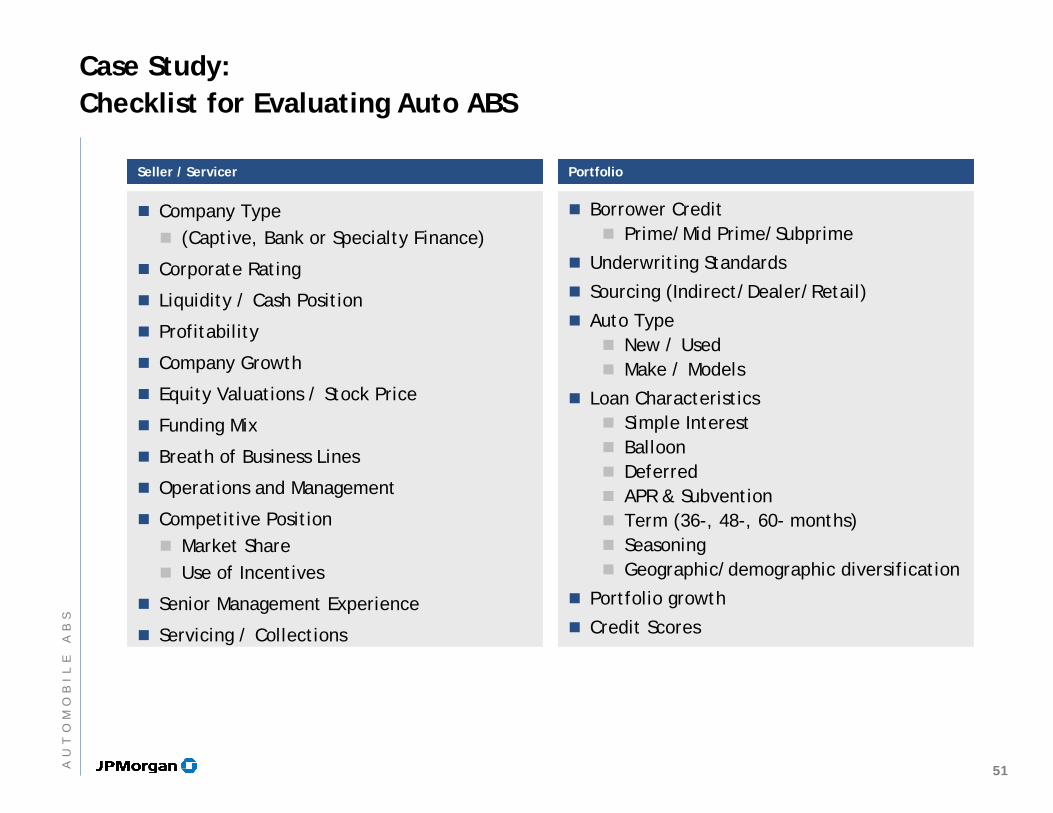
Seller / ServicerSeller / Servicer PortfolioPortfolio
Case Study:Checklist for Evaluating Auto ABS
Company Type(Captive, Bank or Specialty Finance)
Corporate Rating
Liquidity / Cash Position
Profitability
Company Growth
Equity Valuations / Stock Price
Funding Mix
Breath of Business Lines
Operations and Management
Competitive PositionMarket ShareUse of Incentives
Senior Management Experience
Servicing / Collections
Borrower CreditPrime/Mid Prime/Subprime
Underwriting Standards
Sourcing (Indirect/Dealer/Retail)
Auto TypeNew / UsedMake / Models
Loan CharacteristicsSimple InterestBalloonDeferredAPR & SubventionTerm (36-, 48-, 60- months)SeasoningGeographic/demographic diversification
Portfolio growth
Credit Scores
51AU
TO
MO
BI
LE
AB
S
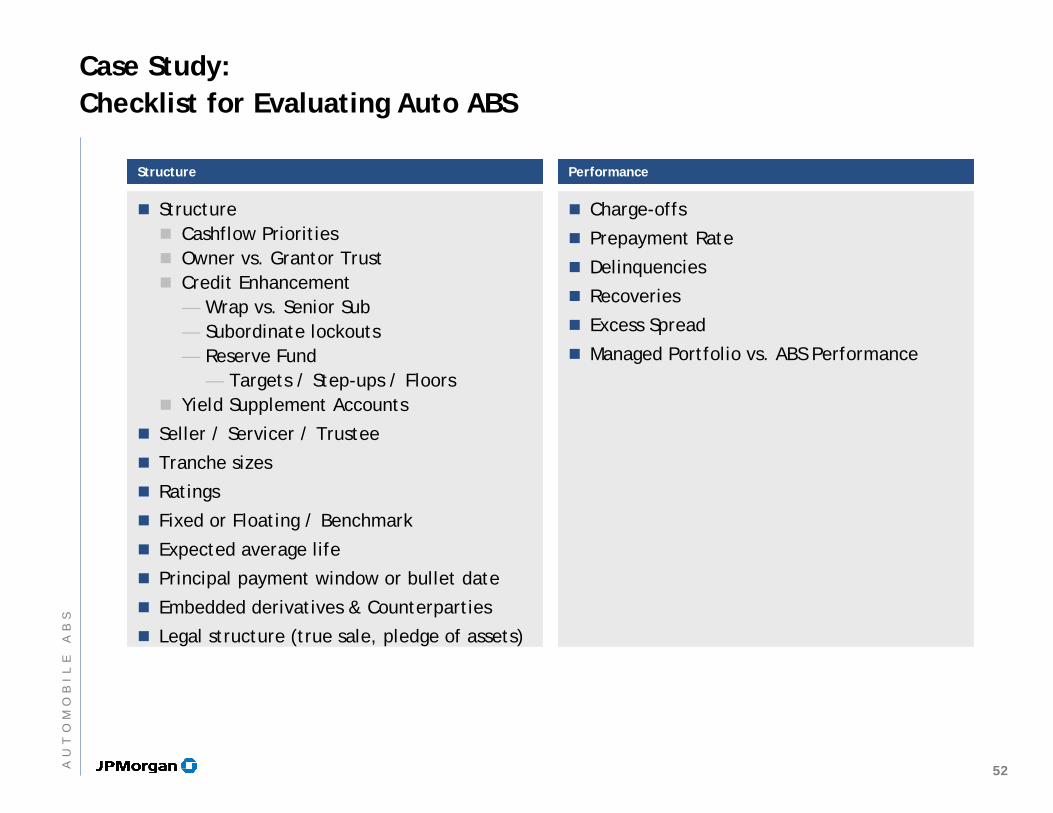
StructureStructure PerformancePerformance
Case Study:Checklist for Evaluating Auto ABS
StructureCashflow PrioritiesOwner vs. Grantor TrustCredit Enhancement— Wrap vs. Senior Sub— Subordinate lockouts— Reserve Fund
— Targets / Step-ups / FloorsYield Supplement Accounts
Seller / Servicer / Trustee
Tranche sizes
Ratings
Fixed or Floating / Benchmark
Expected average life
Principal payment window or bullet date
Embedded derivatives & Counterparties
Legal structure (true sale, pledge of assets)
Charge-offs
Prepayment Rate
Delinquencies
Recoveries
Excess Spread
Managed Portfolio vs. ABS Performance
52AU
TO
MO
BI
LE
AB
S
AgendaAgenda
Page
Home Equity ABS
Student Loan ABS (FFELP)
Automobile ABS
Credit Card
Introduction to ABS
53
1
11
35
53
86
IN
VE
ST
IN
GI
NA
SS
ET
BA
CK
ED
SE
CU
RI
TI
ES
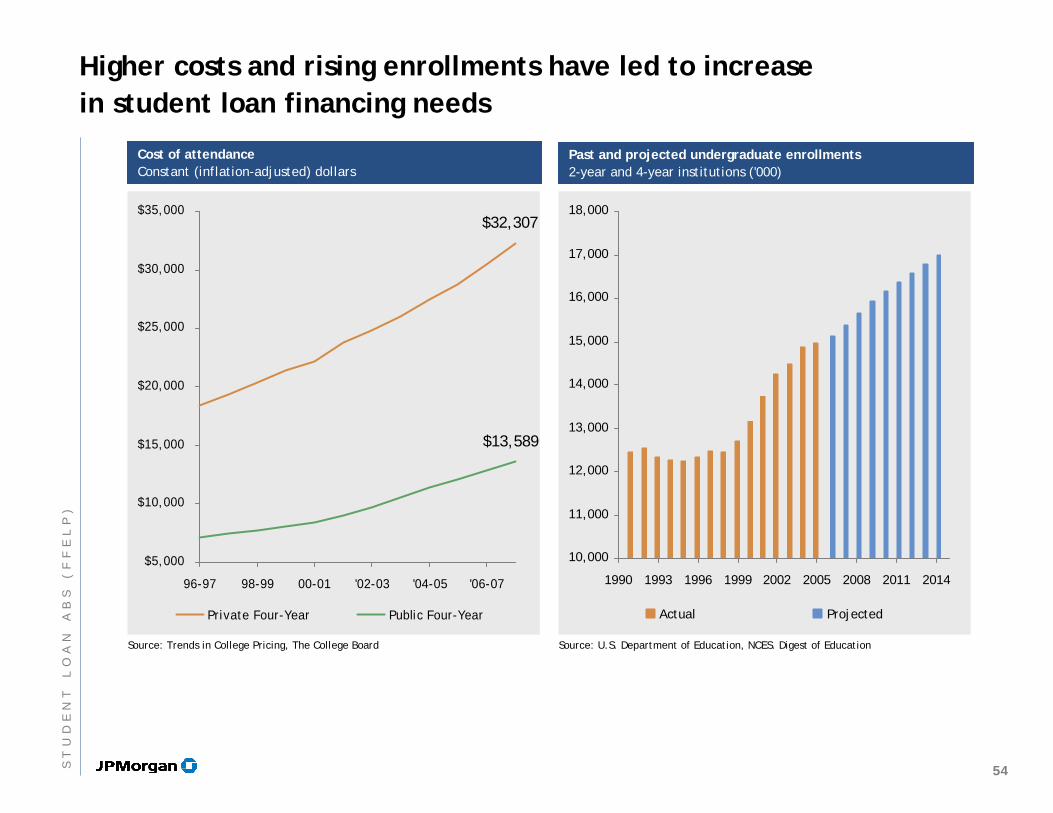
$5,000
$10,000
$15,000
$20,000
$25,000
$30,000
$35,000
96-97 98-99 00-01 '02-03 '04-05 '06-07
Private Four-Year Public Four-Year
Source: Trends in College Pricing, The College Board Source: U.S. Department of Education, NCES. Digest of Education
Cost of attendanceConstant (inflation-adjusted) dollars
Cost of attendanceConstant (inflation-adjusted) dollars
Higher costs and rising enrollments have led to increase in student loan financing needs
$13,589
$32,307
10,000
11,000
12,000
13,000
14,000
15,000
16,000
17,000
18,000
1990 1993 1996 1999 2002 2005 2008 2011 2014
Actual Projected
Past and projected undergraduate enrollments2-year and 4-year institutions ('000)
Past and projected undergraduate enrollments2-year and 4-year institutions ('000)
54ST
UD
EN
TL
OA
NA
BS
(F
FE
LP
)
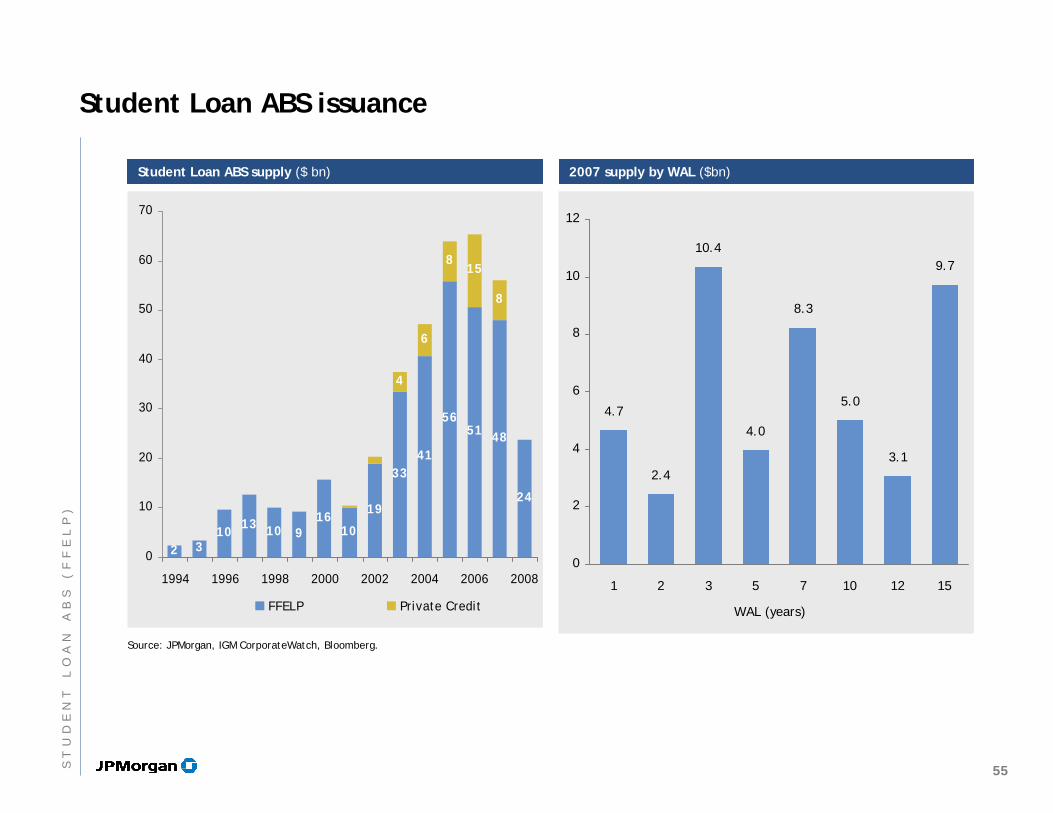
Student Loan ABS issuance
Student Loan ABS supply ($ bn)Student Loan ABS supply ($ bn)
2 310 13 10 9
1610
19
3341
5651 48
24
4
6
815
8
0
10
20
30
40
50
60
70
1994 1996 1998 2000 2002 2004 2006 2008
FFELP Private Credit
2007 supply by WAL ($bn)2007 supply by WAL ($bn)
4.7
2.4
10.4
4.0
8.3
5.0
3.1
9.7
0
2
4
6
8
10
12
1 2 3 5 7 10 12 15
WAL (years)
Source: JPMorgan, IGM CorporateWatch, Bloomberg.
55ST
UD
EN
TL
OA
NA
BS
(F
FE
LP
)
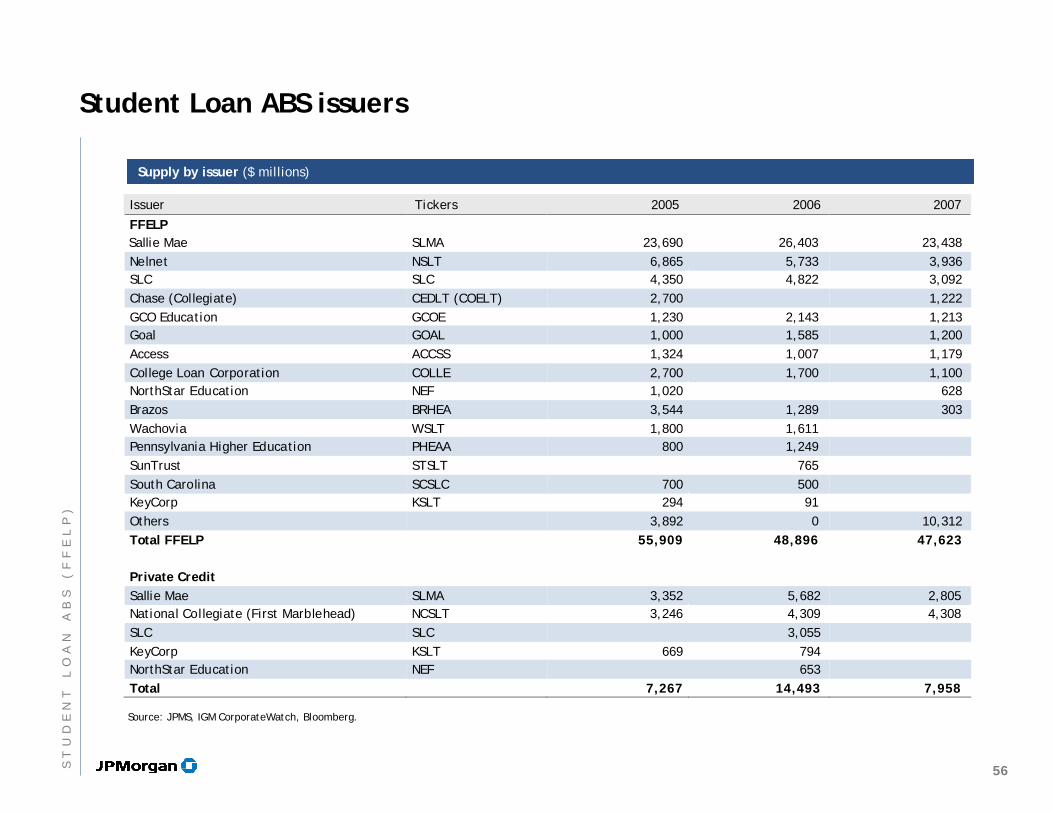
Student Loan ABS issuers
Supply by issuer ($ millions)Supply by issuer ($ millions)
Source: JPMS, IGM CorporateWatch, Bloomberg.
Issuer Tickers 2005 2006 2007
FFELP Sallie Mae SLMA 23,690 26,403 23,438 Nelnet NSLT 6,865 5,733 3,936 SLC SLC 4,350 4,822 3,092 Chase (Collegiate) CEDLT (COELT) 2,700 1,222 GCO Education GCOE 1,230 2,143 1,213 Goal GOAL 1,000 1,585 1,200 Access ACCSS 1,324 1,007 1,179 College Loan Corporation COLLE 2,700 1,700 1,100 NorthStar Education NEF 1,020 628 Brazos BRHEA 3,544 1,289 303 Wachovia WSLT 1,800 1,611 Pennsylvania Higher Education PHEAA 800 1,249 SunTrust STSLT 765 South Carolina SCSLC 700 500 KeyCorp KSLT 294 91 Others 3,892 0 10,312 Total FFELP 55,909 48,896 47,623 Private Credit Sallie Mae SLMA 3,352 5,682 2,805 National Collegiate (First Marblehead) NCSLT 3,246 4,309 4,308 SLC SLC 3,055 KeyCorp KSLT 669 794 NorthStar Education NEF 653 Total 7,267 14,493 7,958
56ST
UD
EN
TL
OA
NA
BS
(F
FE
LP
)
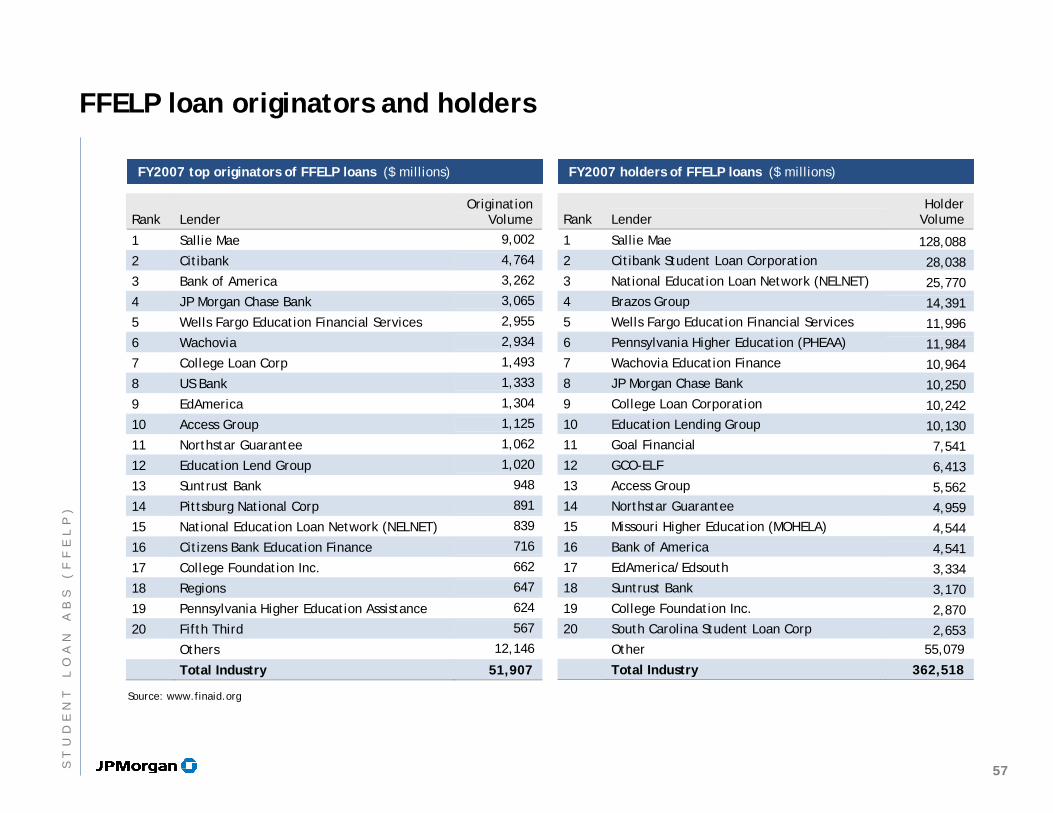
FFELP loan originators and holders
FY2007 top originators of FFELP loans ($ millions)FY2007 top originators of FFELP loans ($ millions) FY2007 holders of FFELP loans ($ millions)FY2007 holders of FFELP loans ($ millions)
Rank Lender Origination
Volume
1 Sallie Mae 9,002
2 Citibank 4,764
3 Bank of America 3,262
4 JP Morgan Chase Bank 3,065
5 Wells Fargo Education Financial Services 2,955
6 Wachovia 2,934
7 College Loan Corp 1,493
8 US Bank 1,333
9 EdAmerica 1,304
10 Access Group 1,125
11 Northstar Guarantee 1,062
12 Education Lend Group 1,020
13 Suntrust Bank 948
14 Pittsburg National Corp 891
15 National Education Loan Network (NELNET) 839
16 Citizens Bank Education Finance 716
17 College Foundation Inc. 662
18 Regions 647
19 Pennsylvania Higher Education Assistance 624
20 Fifth Third 567
Others 12,146
Total Industry 51,907
Source: www.finaid.org
Rank Lender Holder
Volume
1 Sallie Mae 128,088 2 Citibank Student Loan Corporation 28,038 3 National Education Loan Network (NELNET) 25,770 4 Brazos Group 14,391 5 Wells Fargo Education Financial Services 11,996 6 Pennsylvania Higher Education (PHEAA) 11,984 7 Wachovia Education Finance 10,964 8 JP Morgan Chase Bank 10,250 9 College Loan Corporation 10,242 10 Education Lending Group 10,130 11 Goal Financial 7,541 12 GCO-ELF 6,413 13 Access Group 5,562 14 Northstar Guarantee 4,959 15 Missouri Higher Education (MOHELA) 4,544 16 Bank of America 4,541 17 EdAmerica/Edsouth 3,334 18 Suntrust Bank 3,170 19 College Foundation Inc. 2,870 20 South Carolina Student Loan Corp 2,653 Other 55,079
Total Industry 362,518
57ST
UD
EN
TL
OA
NA
BS
(F
FE
LP
)
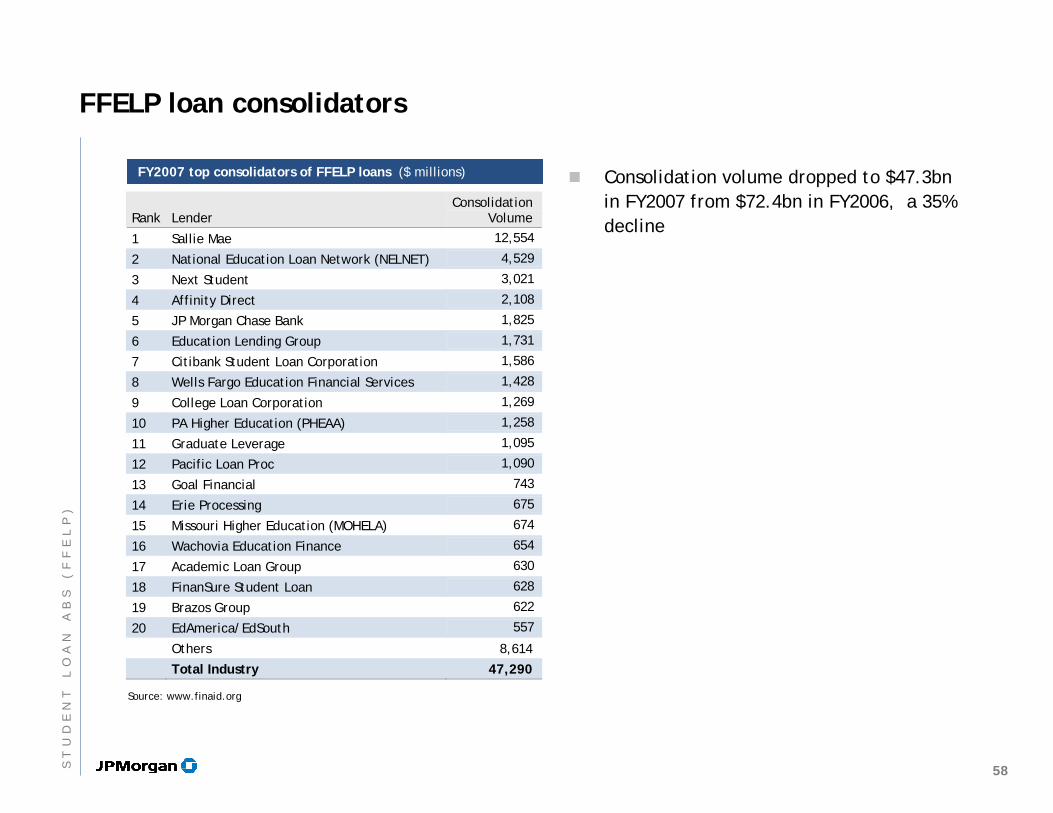
FFELP loan consolidators
FY2007 top consolidators of FFELP loans ($ millions)FY2007 top consolidators of FFELP loans ($ millions)
Rank Lender Consolidation
Volume
1 Sallie Mae 12,554
2 National Education Loan Network (NELNET) 4,529
3 Next Student 3,021
4 Affinity Direct 2,108
5 JP Morgan Chase Bank 1,825
6 Education Lending Group 1,731
7 Citibank Student Loan Corporation 1,586
8 Wells Fargo Education Financial Services 1,428
9 College Loan Corporation 1,269
10 PA Higher Education (PHEAA) 1,258
11 Graduate Leverage 1,095
12 Pacific Loan Proc 1,090
13 Goal Financial 743
14 Erie Processing 675
15 Missouri Higher Education (MOHELA) 674
16 Wachovia Education Finance 654
17 Academic Loan Group 630
18 FinanSure Student Loan 628
19 Brazos Group 622
20 EdAmerica/EdSouth 557
Others 8,614
Total Industry 47,290 Source: www.finaid.org
Consolidation volume dropped to $47.3bn in FY2007 from $72.4bn in FY2006, a 35% decline
58ST
UD
EN
TL
OA
NA
BS
(F
FE
LP
)
Ensuring Continued Access to Student Loans Act of 2008
Signed into law by the President on May 7th
Key provisions
ED (Dept of Education) to serve as secondary market for FFELP loans until July 2009 (Prohibits such loan purchases from resulting in any cost to the federal government)
Clarify ED’s authority as “lender of last resort” with capital— Authorizes Secretary of Education to advance funds to guaranty agencies
acting as lender of last resort— Include parent borrowers in lender-of-last-resort program for those unable
to obtain loans
Allow deferment of PLUS loans until 6 months after graduation
Increase annual loan limit by $2k and aggregate limit to $31k/$57.5k for dependent/independent undergraduates
Authorizes lenders, for loans made from July 2008 through June 2009, to determine that borrowers of PLUS, who are no more than 180 days delinquent on their home mortgages, and no more than 89 days delinquent on the repayment of any other debt, meet a specified extenuating circumstances requirement which makes them eligible for such loans despite having an adverse credit history
59ST
UD
EN
TL
OA
NA
BS
(F
FE
LP
)
Reductions to lenders in the FFELP program (College Cost Reduction and Access Act of 2007)
Eliminate the "Exceptional Performer" status that allows lenders that meet certain requirements established by the Secretary of Education to receive higher insurance rates on defaulted loans
Reduce the insurance paid by the federal government to lenders on defaulted loans from 97 percent to 95 percent of unpaid principal balances on October 1, 2012
Reduce the amount that guarantors may keep through collections on defaulted loans from 23 percent to 16 percent
Reduce the special allowance payments (SAP) from the Department to lenders based on their tax status. For-profit lenders would receive a 55 basis point SAP reduction and non-for-profit lenders would receive a 40 basis point SAP reduction. To ensure that only nonprofit lenders benefit from the increased subsidization, nonprofit lenders that are owned in-whole or in-part by a for-profit entity would not be eligible for the reduced subsidy reductions. Nonprofit lenders that are purchased by for-profit entities would also lose their higher subsidization rateson the date of the sale
Increase the loan fee paid to the Department by lenders - that cannot be passed on to borrowers - from 0.5 percent to 1 percent of the principal amount of each newly originated loan made on or after October 1, 2007
Decrease the account maintenance fees paid by the Department to guarantors from .10 percent to .06 percent on newly originated loans
60ST
UD
EN
TL
OA
NA
BS
(F
FE
LP
)
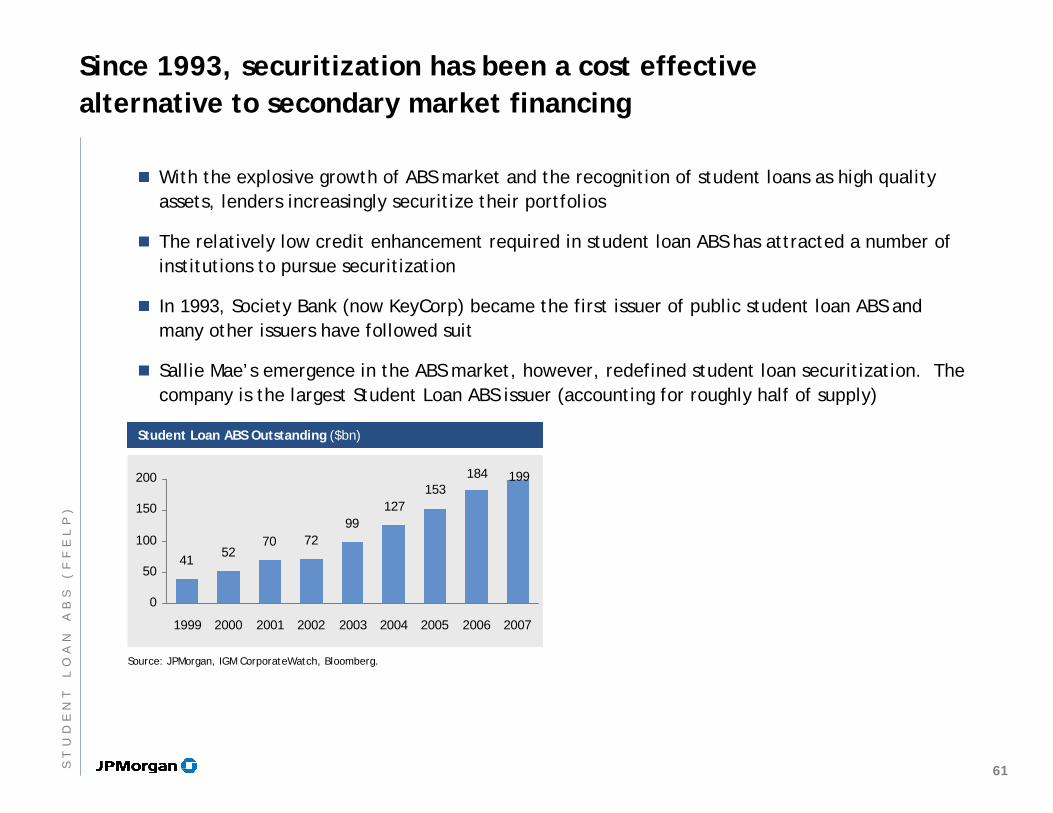
Since 1993, securitization has been a cost effective alternative to secondary market financing
With the explosive growth of ABS market and the recognition of student loans as high quality assets, lenders increasingly securitize their portfolios
The relatively low credit enhancement required in student loan ABS has attracted a number of institutions to pursue securitization
In 1993, Society Bank (now KeyCorp) became the first issuer of public student loan ABS and many other issuers have followed suit
Sallie Mae’s emergence in the ABS market, however, redefined student loan securitization. The company is the largest Student Loan ABS issuer (accounting for roughly half of supply)
Source: JPMorgan, IGM CorporateWatch, Bloomberg.
Student Loan ABS Outstanding ($bn)Student Loan ABS Outstanding ($bn)
4152
70 7299
127153
184 199
0
50
100
150
200
1999 2000 2001 2002 2003 2004 2005 2006 2007
61ST
UD
EN
TL
OA
NA
BS
(F
FE
LP
)
FFELP overview
Established in 1965, the Family Federal Education Loan Program (FFELP) has helped make higher education affordable by providing access to guaranteed student loans
FFELP loans are financed by private lenders, serviced and administrated by the private sector
FFELP volume nationwide total approximately $85bn in fiscal year 2006
FFELP loan benefit from U.S. Government guarantee
97% (initial loan disbursement 7/06 and after), 98% (10/93 to 6/06) or 100% (pre 10/93), guaranteed for principal and accrued interest
Will decline to 95% on October 1, 2012
Borrower benefits
Long term financing (up to 30 years if consolidated)
Interest subsidies during “in school” period on some loans
Deferment/forbearance allows borrower to temporarily stop payments if they return to school or experience financial hardship
FFELP loans are not dischargeable in bankruptcy
62ST
UD
EN
TL
OA
NA
BS
(F
FE
LP
)
FFELP loan types
FFELP provides the following types of loans
Stafford loans — Subsidized: To students demonstrating financial need— Unsubsidized: To students who either do not demonstrate need or require supplement to
Subsidized loan
PLUS: To graduate and professional students and or parents of undergraduates (in excess of Stafford
Consolidation loans: Consolidation multiple loans under FFELP into one for the borrower
63ST
UD
EN
TL
OA
NA
BS
(F
FE
LP
)
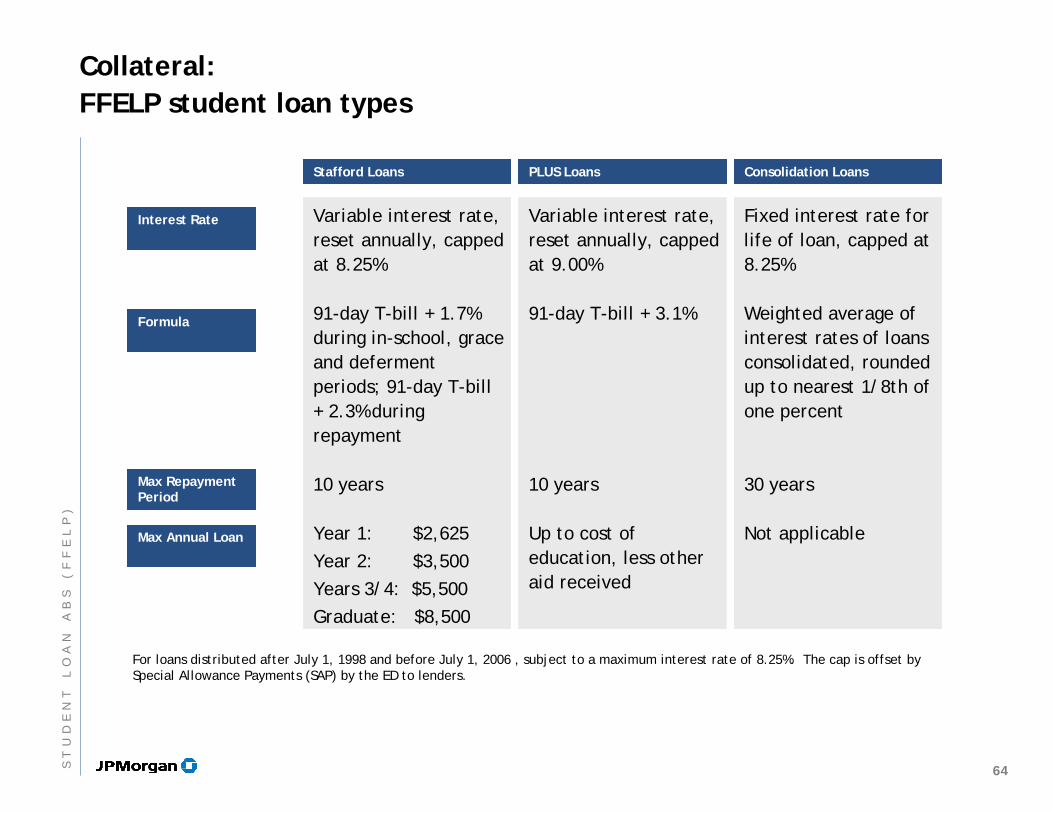
Stafford LoansStafford Loans PLUS LoansPLUS Loans Consolidation LoansConsolidation Loans
Collateral:FFELP student loan types
Variable interest rate, reset annually, capped at 8.25%
91-day T-bill + 1.7% during in-school, grace and deferment periods; 91-day T-bill + 2.3% during repayment
10 years
Year 1: $2,625Year 2: $3,500Years 3/4: $5,500Graduate: $8,500
Variable interest rate, reset annually, capped at 9.00%
91-day T-bill + 3.1%
10 years
Up to cost of education, less other aid received
Fixed interest rate for life of loan, capped at 8.25%
Weighted average of interest rates of loans consolidated, rounded up to nearest 1/8th of one percent
30 years
Not applicable
Interest RateInterest Rate
FormulaFormula
Max Repayment Period
Max Repayment Period
Max Annual LoanMax Annual Loan
For loans distributed after July 1, 1998 and before July 1, 2006 , subject to a maximum interest rate of 8.25%. The cap is offset by Special Allowance Payments (SAP) by the ED to lenders.
64ST
UD
EN
TL
OA
NA
BS
(F
FE
LP
)
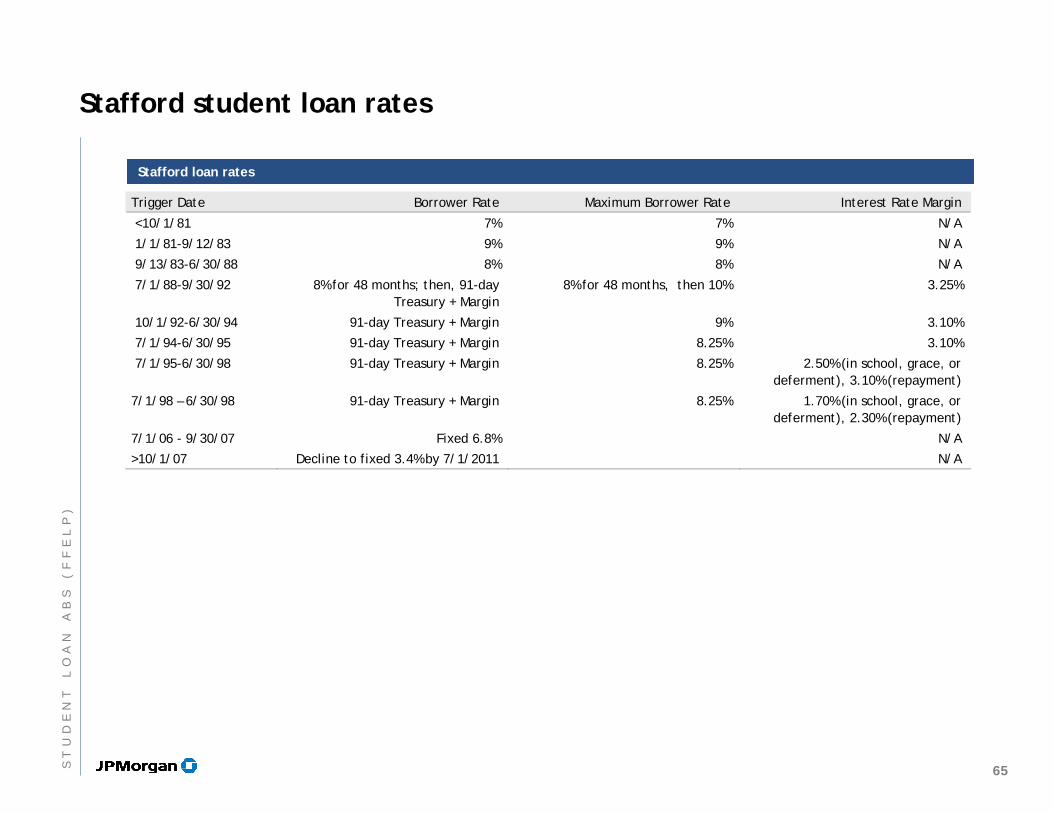
Stafford student loan rates
Stafford loan ratesStafford loan rates
Trigger Date Borrower Rate Maximum Borrower Rate Interest Rate Margin
<10/1/81 7% 7% N/A
1/1/81-9/12/83 9% 9% N/A
9/13/83-6/30/88 8% 8% N/A
7/1/88-9/30/92 8% for 48 months; then, 91-day Treasury + Margin
8% for 48 months, then 10% 3.25%
10/1/92-6/30/94 91-day Treasury + Margin 9% 3.10%
7/1/94-6/30/95 91-day Treasury + Margin 8.25% 3.10%
7/1/95-6/30/98 91-day Treasury + Margin 8.25% 2.50% (in school, grace, or deferment), 3.10% (repayment)
7/1/98 – 6/30/98 91-day Treasury + Margin 8.25% 1.70% (in school, grace, or deferment), 2.30% (repayment)
7/1/06 - 9/30/07 Fixed 6.8% N/A
>10/1/07 Decline to fixed 3.4% by 7/1/2011 N/A
65ST
UD
EN
TL
OA
NA
BS
(F
FE
LP
)
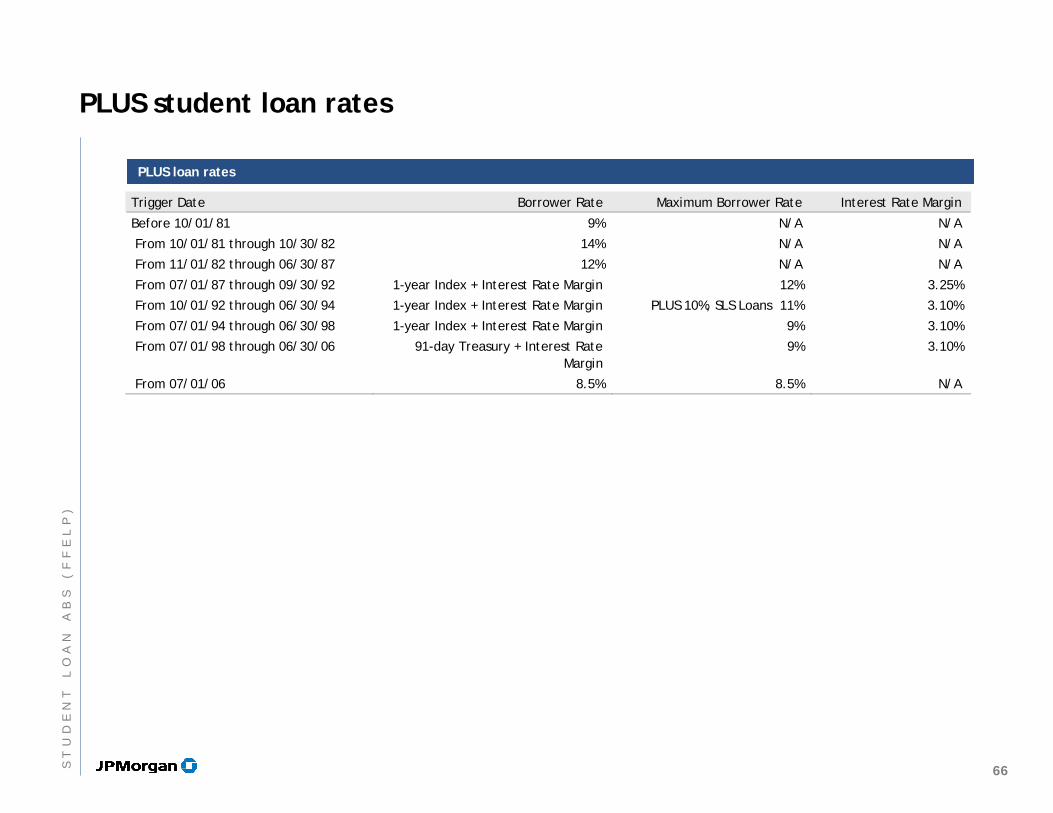
PLUS student loan rates
PLUS loan ratesPLUS loan rates
Trigger Date Borrower Rate Maximum Borrower Rate Interest Rate Margin
Before 10/01/81 9% N/A N/A
From 10/01/81 through 10/30/82 14% N/A N/A
From 11/01/82 through 06/30/87 12% N/A N/A
From 07/01/87 through 09/30/92 1-year Index + Interest Rate Margin 12% 3.25%
From 10/01/92 through 06/30/94 1-year Index + Interest Rate Margin PLUS 10%, SLS Loans 11% 3.10%
From 07/01/94 through 06/30/98 1-year Index + Interest Rate Margin 9% 3.10%
From 07/01/98 through 06/30/06 91-day Treasury + Interest Rate Margin
9% 3.10%
From 07/01/06 8.5% 8.5% N/A
66ST
UD
EN
TL
OA
NA
BS
(F
FE
LP
)
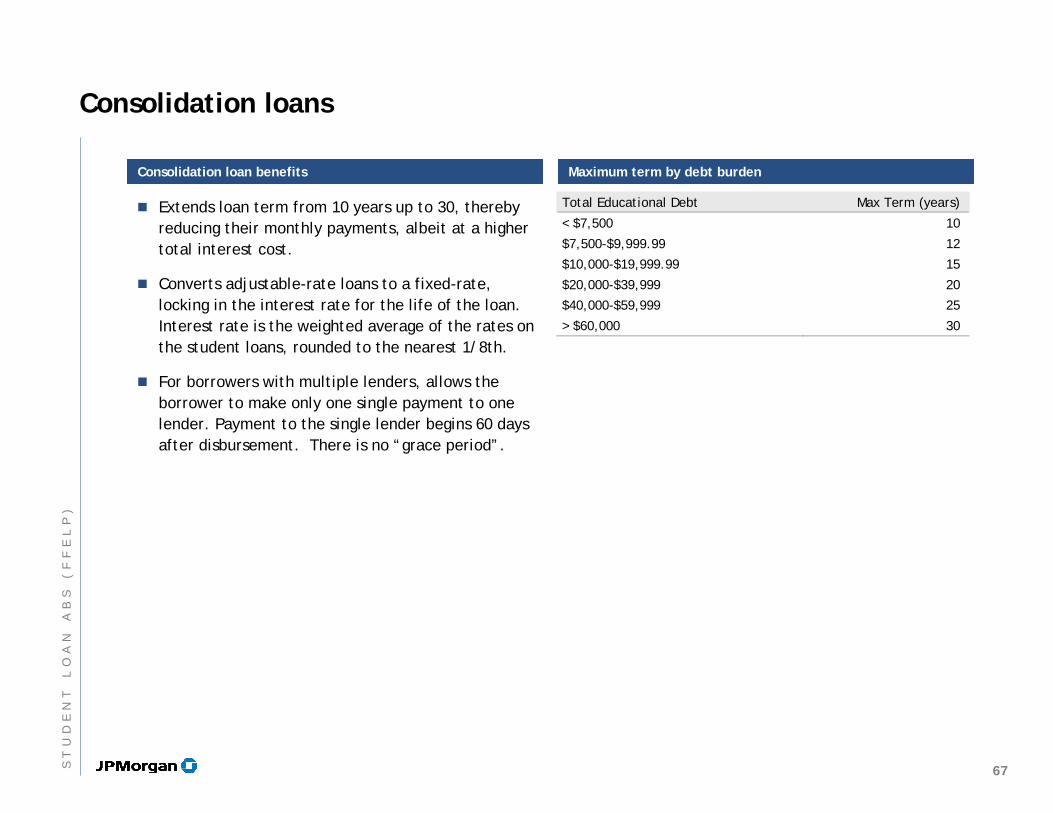
Consolidation loans
Consolidation loan benefitsConsolidation loan benefits Maximum term by debt burdenMaximum term by debt burden
Extends loan term from 10 years up to 30, thereby reducing their monthly payments, albeit at a higher total interest cost.
Converts adjustable-rate loans to a fixed-rate, locking in the interest rate for the life of the loan. Interest rate is the weighted average of the rates on the student loans, rounded to the nearest 1/8th.
For borrowers with multiple lenders, allows the borrower to make only one single payment to one lender. Payment to the single lender begins 60 days after disbursement. There is no “grace period”.
Total Educational Debt Max Term (years)
< $7,500 10
$7,500-$9,999.99 12
$10,000-$19,999.99 15
$20,000-$39,999 20
$40,000-$59,999 25
> $60,000 30
67ST
UD
EN
TL
OA
NA
BS
(F
FE
LP
)

Interest Subsidy Payments and Special Allowance Payments
Dept of Education (ED)
Borrower
SAP and ISP
Paid quarterly
Principal and Interest
Lender
Interest Subsidy Payment (ISP)
Federal government pays for in-school, grace and deferment interest on subsidized loans
Available for Stafford Subsized and Subsidized Consolidation Loans
Special Allowance Payment (SAP)
Provides lenders with minimum returns to either the 91-day T-Bill or 90-day CP plus a spread
Available for Stafford and Consolidation Loans
Available for PLUS loans when borrower hits a cap
68ST
UD
EN
TL
OA
NA
BS
(F
FE
LP
)
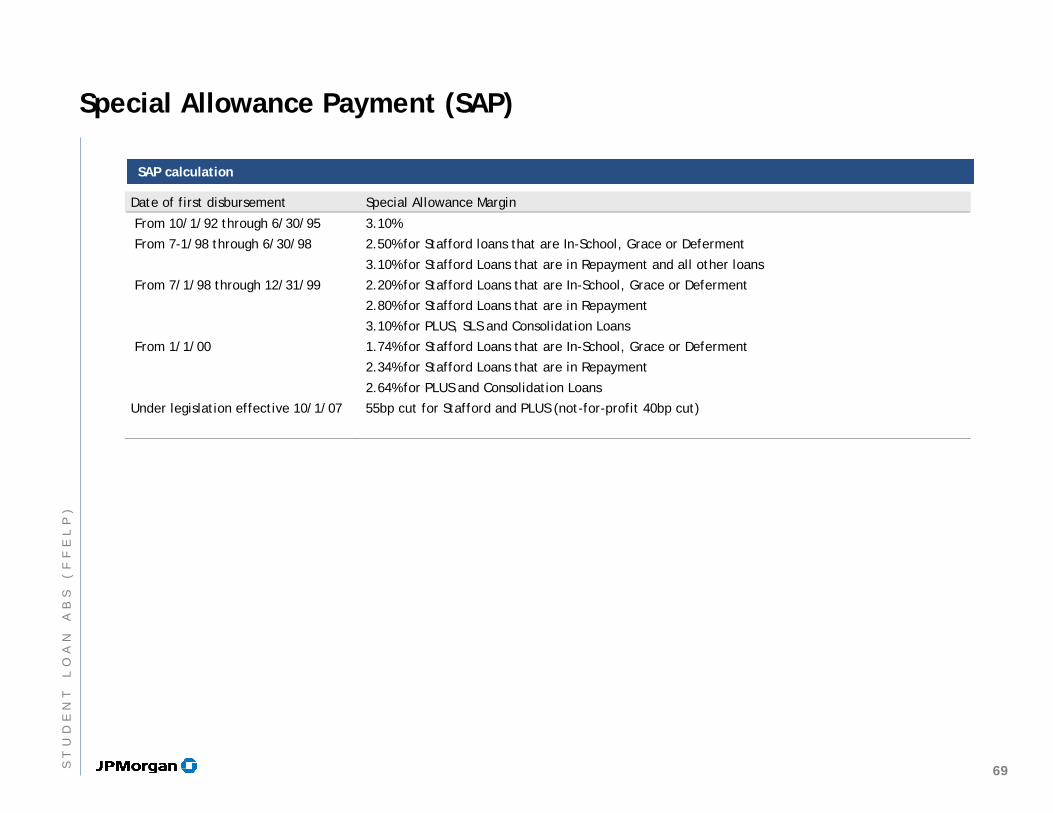
Special Allowance Payment (SAP)
SAP calculationSAP calculation
Date of first disbursement Special Allowance Margin
From 10/1/92 through 6/30/95 3.10%
From 7-1/98 through 6/30/98 2.50% for Stafford loans that are In-School, Grace or Deferment
3.10% for Stafford Loans that are in Repayment and all other loans
From 7/1/98 through 12/31/99 2.20% for Stafford Loans that are In-School, Grace or Deferment
2.80% for Stafford Loans that are in Repayment
3.10% for PLUS, SLS and Consolidation Loans
From 1/1/00 1.74% for Stafford Loans that are In-School, Grace or Deferment
2.34% for Stafford Loans that are in Repayment
2.64% for PLUS and Consolidation Loans
Under legislation effective 10/1/07 55bp cut for Stafford and PLUS (not-for-profit 40bp cut)
69ST
UD
EN
TL
OA
NA
BS
(F
FE
LP
)
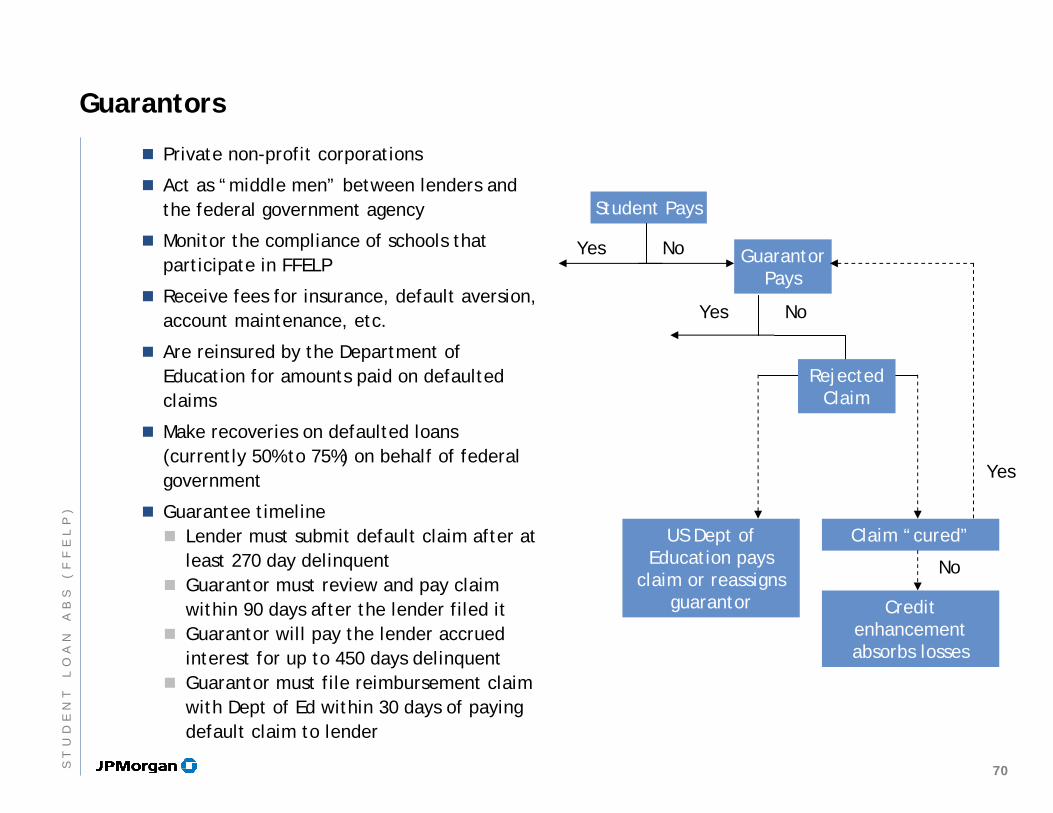
Guarantors
Private non-profit corporations
Act as “middle men” between lenders and the federal government agency
Monitor the compliance of schools that participate in FFELP
Receive fees for insurance, default aversion, account maintenance, etc.
Are reinsured by the Department of Education for amounts paid on defaulted claims
Make recoveries on defaulted loans (currently 50% to 75%) on behalf of federal government
Guarantee timelineLender must submit default claim after at least 270 day delinquentGuarantor must review and pay claim within 90 days after the lender filed itGuarantor will pay the lender accrued interest for up to 450 days delinquentGuarantor must file reimbursement claim with Dept of Ed within 30 days of paying default claim to lender
Student Pays
Guarantor Pays
Yes No
Yes No
Rejected Claim
US Dept of Education pays
claim or reassigns guarantor
Claim “cured”
Credit enhancement absorbs losses
Yes
No
70ST
UD
EN
TL
OA
NA
BS
(F
FE
LP
)
Servicer Guarantor
Claim Package
98% reimbursement
Collect payments
Process deferments
Reinsurance claim
Reinsurance $
US Departmentof Education
Apply for ISP
Apply for SAP
Collection on delinquent loans
Submit claim package to guarantor
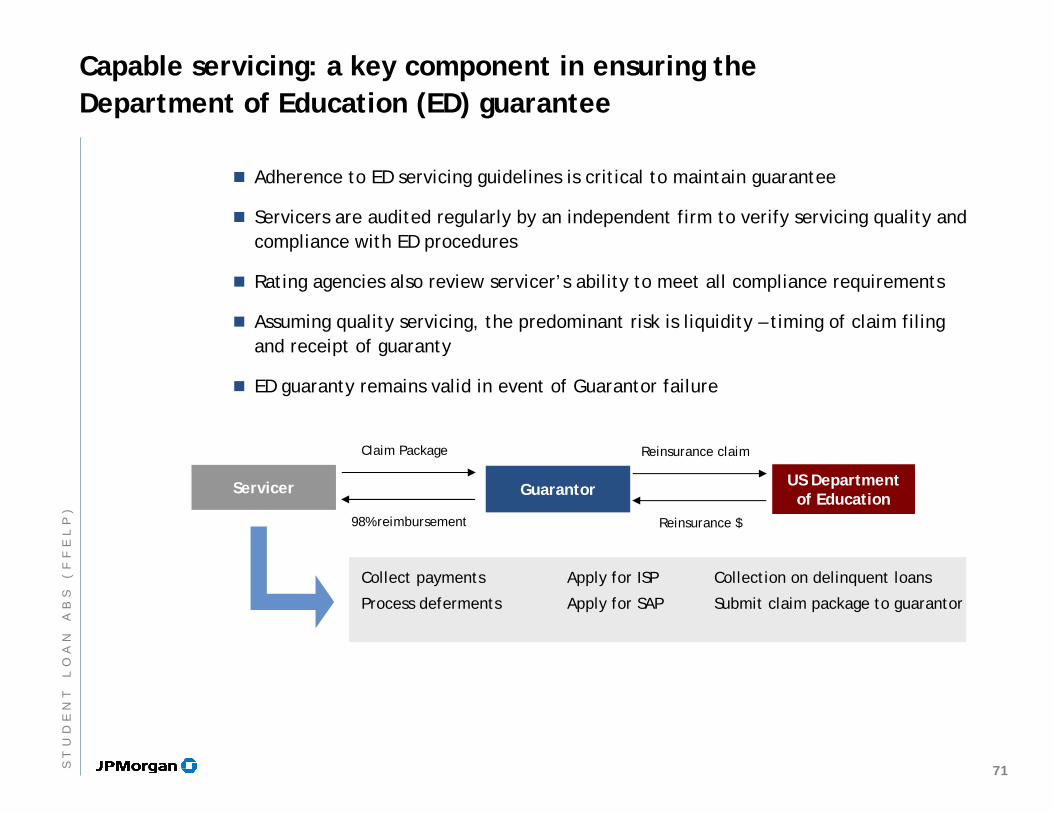
Capable servicing: a key component in ensuring the Department of Education (ED) guarantee
Adherence to ED servicing guidelines is critical to maintain guarantee
Servicers are audited regularly by an independent firm to verify servicing quality and compliance with ED procedures
Rating agencies also review servicer’s ability to meet all compliance requirements
Assuming quality servicing, the predominant risk is liquidity – timing of claim filing and receipt of guaranty
ED guaranty remains valid in event of Guarantor failure
71ST
UD
EN
TL
OA
NA
BS
(F
FE
LP
)
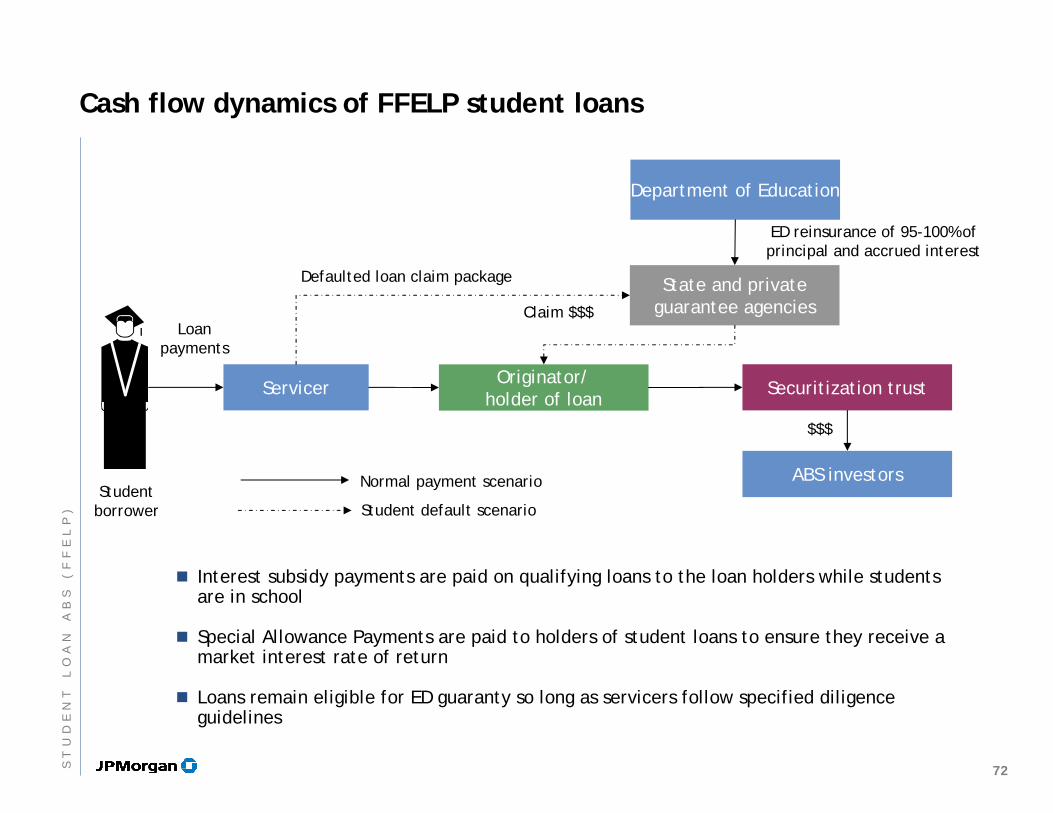
Cash flow dynamics of FFELP student loans
Department of Education
State and private guarantee agencies
ABS investors
Securitization trustOriginator/holder of loan
Servicer
Defaulted loan claim package
Claim $$$
$$$
Normal payment scenario
Student default scenario
ED reinsurance of 95-100% of principal and accrued interest
Loan payments
Student borrower
Interest subsidy payments are paid on qualifying loans to the loan holders while students are in school
Special Allowance Payments are paid to holders of student loans to ensure they receive a market interest rate of return
Loans remain eligible for ED guaranty so long as servicers follow specified diligence guidelines
72ST
UD
EN
TL
OA
NA
BS
(F
FE
LP
)
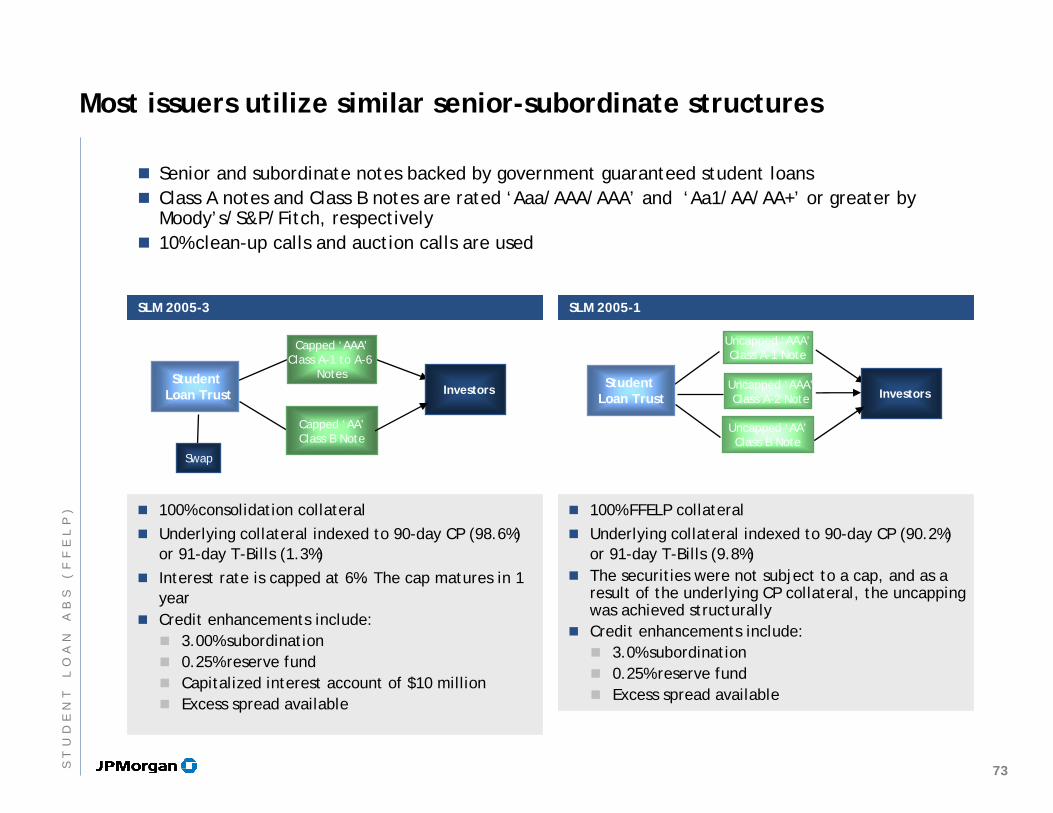
Most issuers utilize similar senior-subordinate structures
100% consolidation collateralUnderlying collateral indexed to 90-day CP (98.6%) or 91-day T-Bills (1.3%)Interest rate is capped at 6%. The cap matures in 1 yearCredit enhancements include:
3.00% subordination0.25% reserve fund Capitalized interest account of $10 millionExcess spread available
100% FFELP collateralUnderlying collateral indexed to 90-day CP (90.2%) or 91-day T-Bills (9.8%)The securities were not subject to a cap, and as a result of the underlying CP collateral, the uncapping was achieved structurallyCredit enhancements include:
3.0% subordination0.25% reserve fund Excess spread available
SLM 2005-3SLM 2005-3 SLM 2005-1SLM 2005-1
Senior and subordinate notes backed by government guaranteed student loans Class A notes and Class B notes are rated ‘Aaa/AAA/AAA’ and ‘Aa1/AA/AA+’ or greater by Moody’s/S&P/Fitch, respectively10% clean-up calls and auction calls are used
Student Loan Trust
Capped ‘AAA’Class A-1 to A-6
Notes
Capped ‘AA’Class B Note
Investors
Swap
Student Loan Trust
Uncapped ‘AAA’Class A-1 Note
Uncapped ‘AAA’Class A-2 Note
Uncapped ‘AA’Class B Note
Investors
73ST
UD
EN
TL
OA
NA
BS
(F
FE
LP
)
Basic credit card securitization cash flows
Interest income
Net recoveries on charged off assets
Interchange
Fee income
Servicing fee to servicer (typically 2.00%)
Interest payment on Class A Notes
Interest payment on Class B Notes
Interest payment on Class C Notes
Deposit to the spread account
Excess spread to residual holder
Available finance charge collectionsAvailable finance charge collections Priority of distributionPriority of distribution
Available principal collectionsAvailable principal collections Priority of distributionPriority of distribution
Principal collections
Cover interest shortfalls on each class of Notes
Cover servicing fee shortfalls
Make targeted deposit to Class A principal funding account
Make targeted deposit to Class B principal funding account
Make targeted deposit to Class C principal funding account
Excess paid to residual holder74S
TU
DE
NT
LO
AN
AB
S(
FF
EL
P)
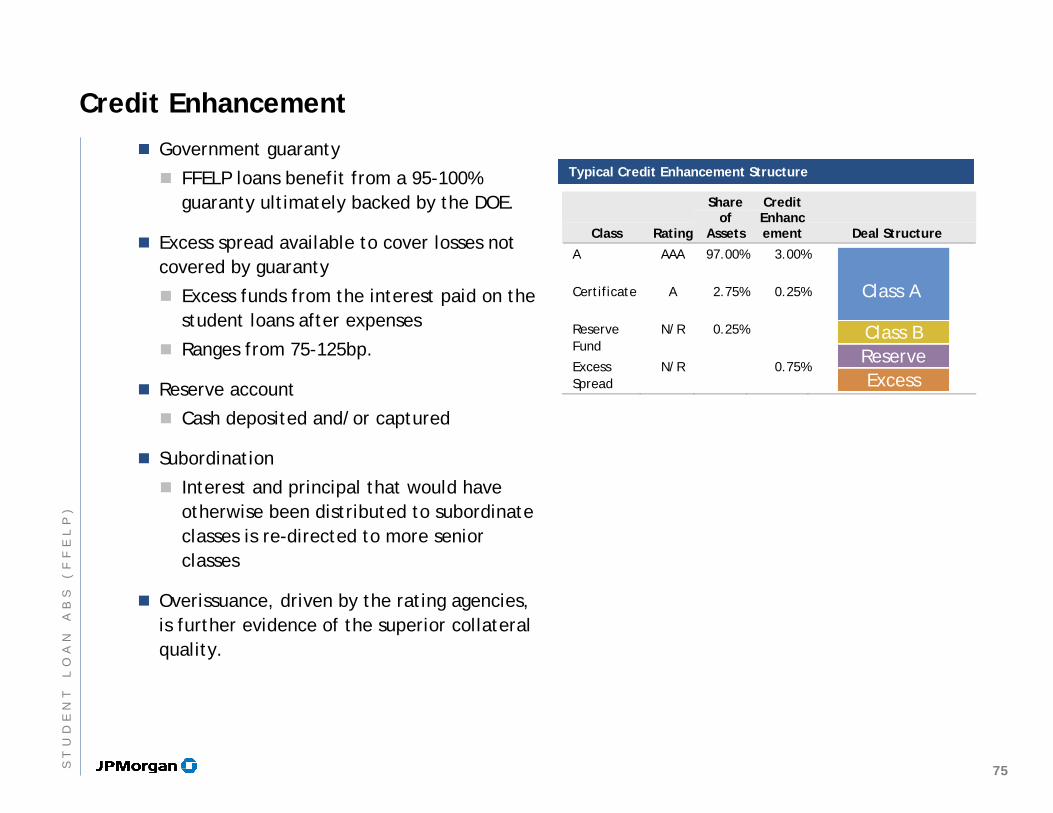
Credit EnhancementGovernment guaranty
FFELP loans benefit from a 95-100% guaranty ultimately backed by the DOE.
Excess spread available to cover losses not covered by guaranty
Excess funds from the interest paid on the student loans after expenses
Ranges from 75-125bp.
Reserve account
Cash deposited and/or captured
Subordination
Interest and principal that would have otherwise been distributed to subordinate classes is re-directed to more senior classes
Overissuance, driven by the rating agencies, is further evidence of the superior collateral quality.
Class Rating
Share of
Assets
Credit Enhancement Deal Structure
A
AAA 97.00% 3.00%
Certificate
A 2.75% 0.25%
Reserve Fund
N/R 0.25%
Excess Spread
N/R 0.75%
Typical Credit Enhancement StructureTypical Credit Enhancement Structure
Class A
Class B
ExcessReserve
75ST
UD
EN
TL
OA
NA
BS
(F
FE
LP
)
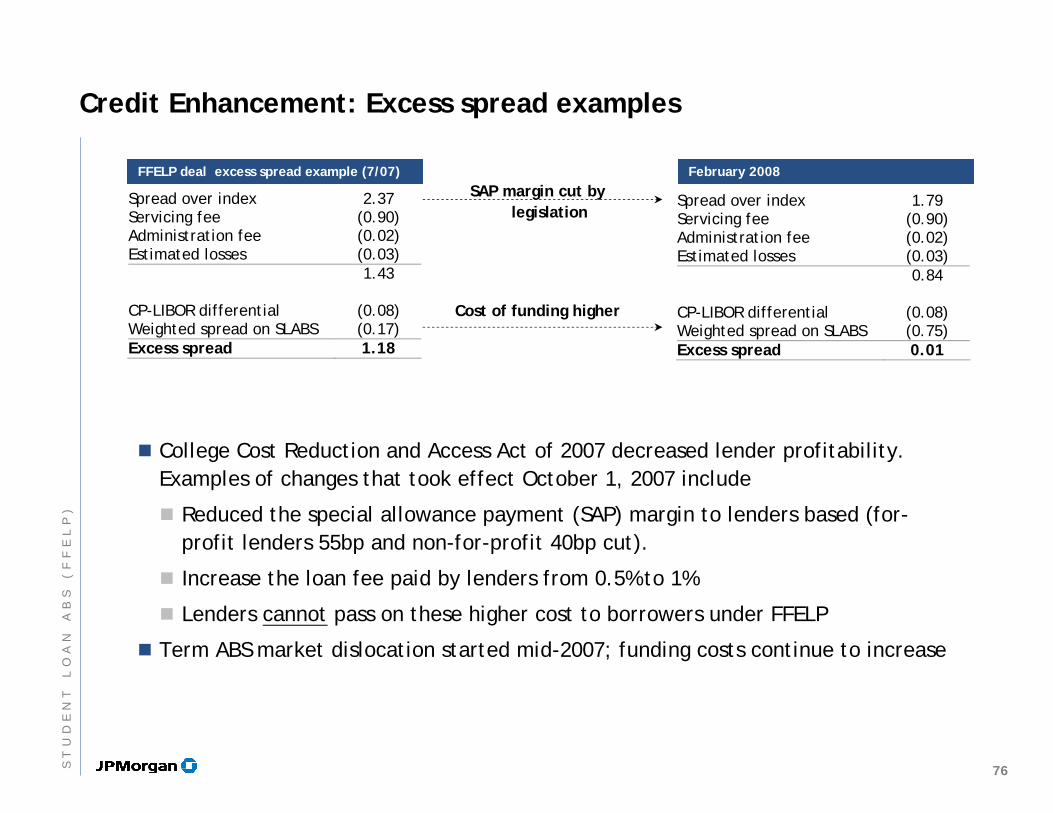
Credit Enhancement: Excess spread examples
February 2008February 2008FFELP deal excess spread example (7/07)FFELP deal excess spread example (7/07)
Spread over index 2.37 Servicing fee (0.90) Administration fee (0.02) Estimated losses (0.03)
1.43
CP-LIBOR differential (0.08) Weighted spread on SLABS (0.17) Excess spread 1.18
Spread over index 1.79 Servicing fee (0.90) Administration fee (0.02) Estimated losses (0.03)
0.84
CP-LIBOR differential (0.08) Weighted spread on SLABS (0.75) Excess spread 0.01
SAP margin cut by legislation
Cost of funding higher
College Cost Reduction and Access Act of 2007 decreased lender profitability. Examples of changes that took effect October 1, 2007 include
Reduced the special allowance payment (SAP) margin to lenders based (for-profit lenders 55bp and non-for-profit 40bp cut).
Increase the loan fee paid by lenders from 0.5% to 1%
Lenders cannot pass on these higher cost to borrowers under FFELP
Term ABS market dislocation started mid-2007; funding costs continue to increase
76ST
UD
EN
TL
OA
NA
BS
(F
FE
LP
)
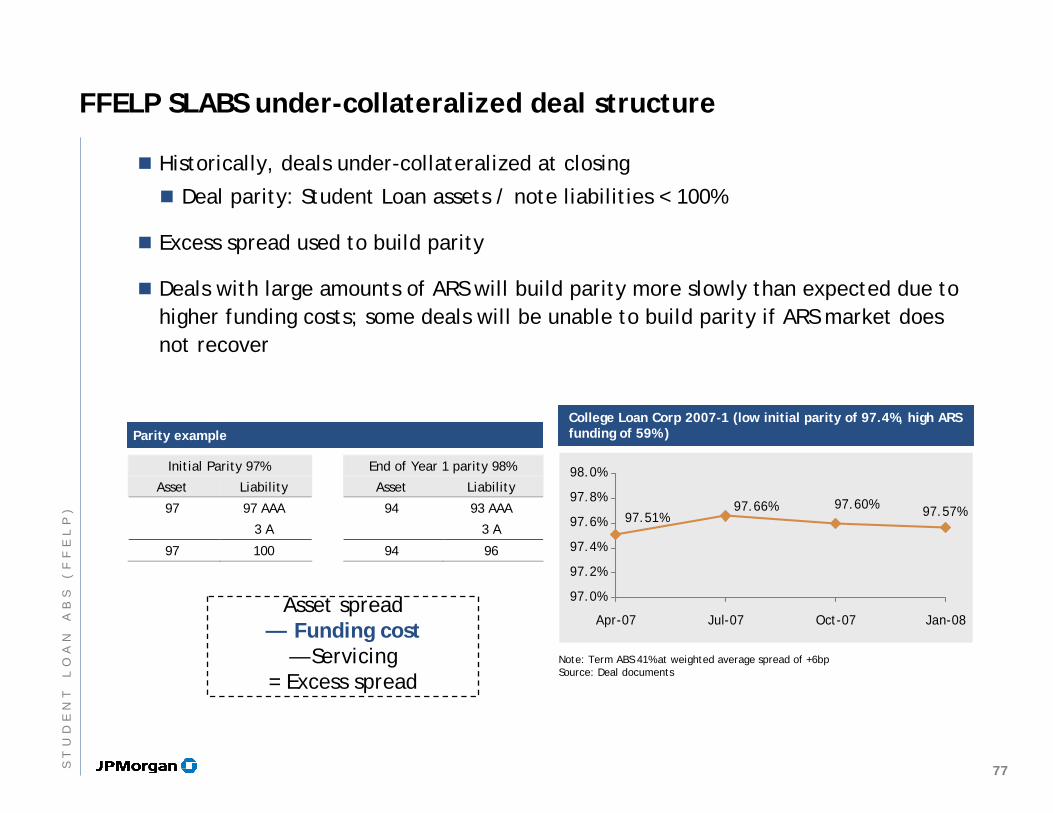
FFELP SLABS under-collateralized deal structure
Historically, deals under-collateralized at closing
Deal parity: Student Loan assets / note liabilities < 100%
Excess spread used to build parity
Deals with large amounts of ARS will build parity more slowly than expected due to higher funding costs; some deals will be unable to build parity if ARS market does not recover
Asset spread— Funding cost
— Servicing = Excess spread
Parity exampleParity example
Initial Parity 97% End of Year 1 parity 98%
Asset Liability Asset Liability
97 97 AAA 94 93 AAA
3 A 3 A
97 100 94 96
97.57%97.60%97.51%
97.66%
97.0%
97.2%
97.4%
97.6%
97.8%
98.0%
Apr-07 Jul-07 Oct-07 Jan-08
College Loan Corp 2007-1 (low initial parity of 97.4%, high ARS funding of 59% )
College Loan Corp 2007-1 (low initial parity of 97.4%, high ARS funding of 59% )
Note: Term ABS 41% at weighted average spread of +6bpSource: Deal documents
77ST
UD
EN
TL
OA
NA
BS
(F
FE
LP
)
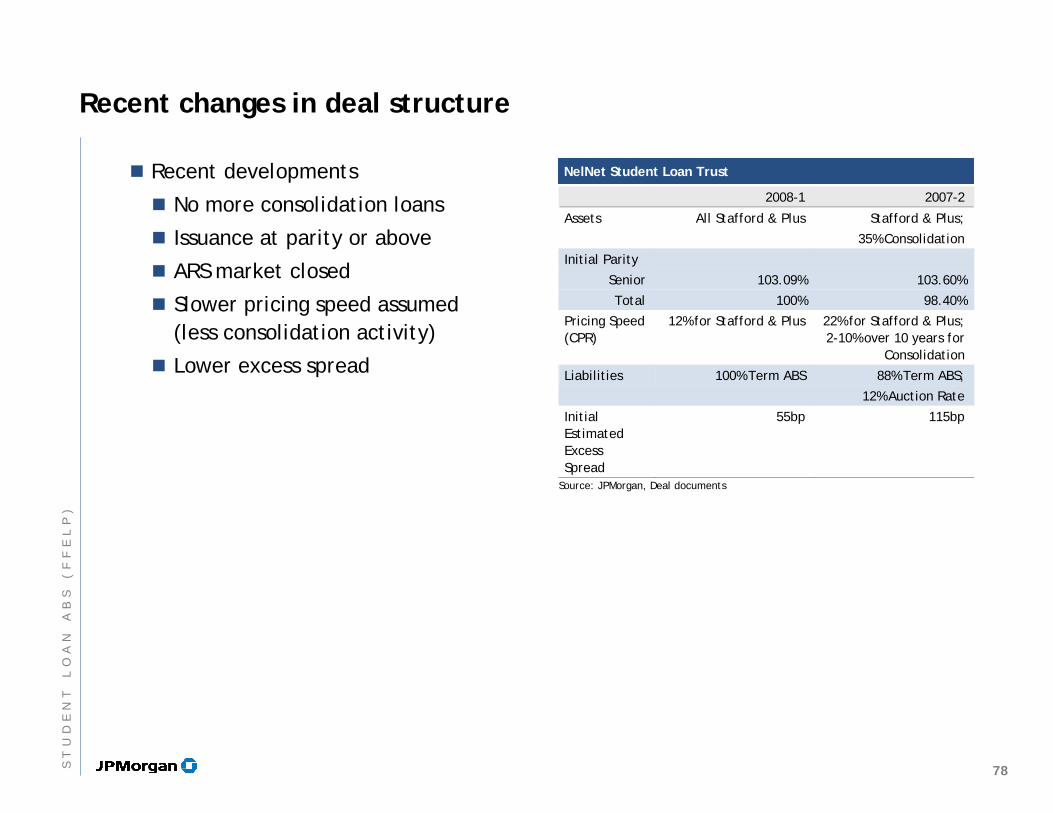
Recent changes in deal structure
Recent developments
No more consolidation loans
Issuance at parity or above
ARS market closed
Slower pricing speed assumed (less consolidation activity)
Lower excess spread
NelNet Student Loan TrustNelNet Student Loan Trust
2008-1 2007-2
Assets All Stafford & Plus Stafford & Plus;
35% Consolidation
Initial Parity
Senior 103.09% 103.60%
Total 100% 98.40%
Pricing Speed (CPR)
12% for Stafford & Plus 22% for Stafford & Plus; 2-10% over 10 years for
Consolidation
Liabilities 100% Term ABS 88% Term ABS;
12% Auction Rate
Initial Estimated Excess Spread
55bp 115bp
Source: JPMorgan, Deal documents
78ST
UD
EN
TL
OA
NA
BS
(F
FE
LP
)
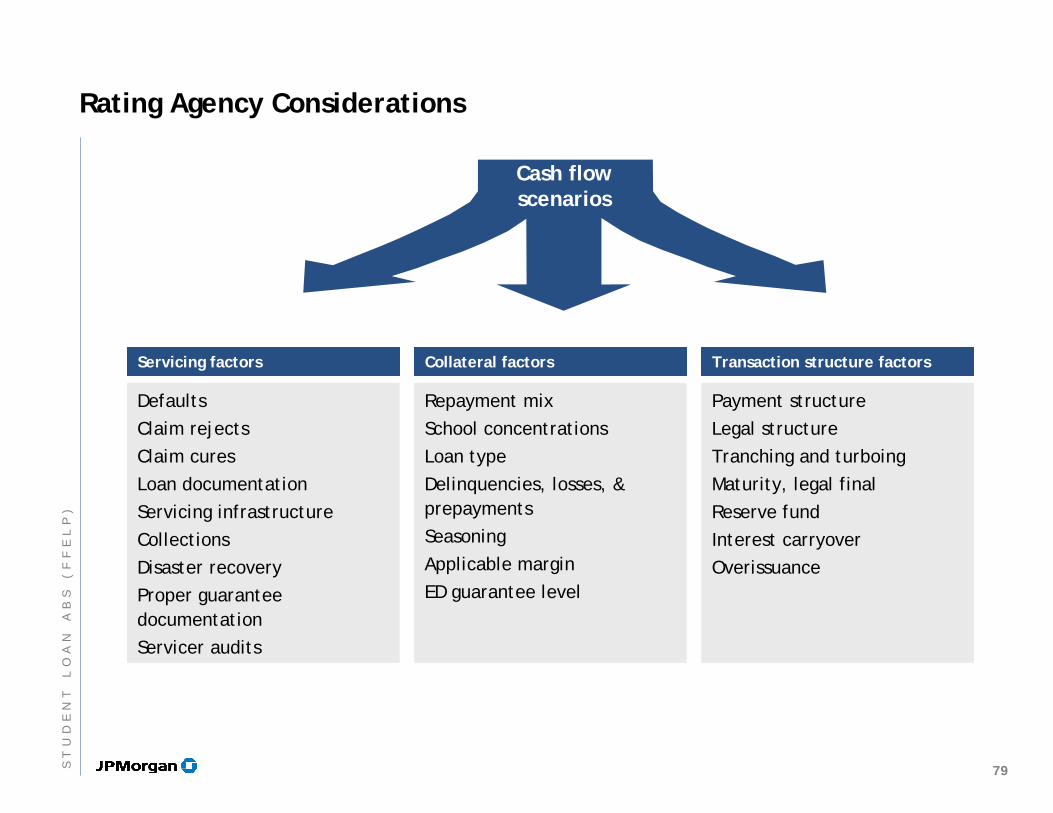
Rating Agency Considerations
Cash flowscenarios
Servicing factorsServicing factors Collateral factorsCollateral factors Transaction structure factorsTransaction structure factors
DefaultsClaim rejectsClaim curesLoan documentationServicing infrastructureCollectionsDisaster recoveryProper guarantee documentationServicer audits
Repayment mixSchool concentrationsLoan typeDelinquencies, losses, & prepaymentsSeasoningApplicable marginED guarantee level
Payment structureLegal structureTranching and turboingMaturity, legal finalReserve fundInterest carryoverOverissuance
79ST
UD
EN
TL
OA
NA
BS
(F
FE
LP
)
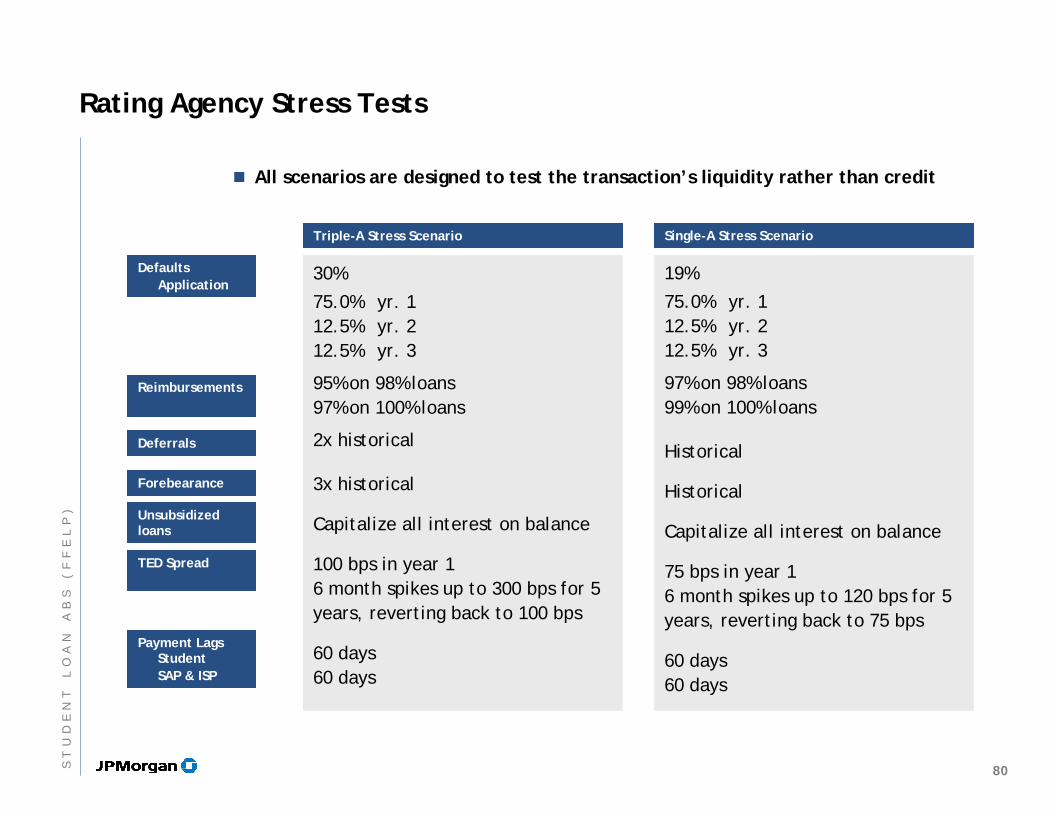
Triple-A Stress ScenarioTriple-A Stress Scenario Single-A Stress ScenarioSingle-A Stress Scenario
30%
75.0% yr. 112.5% yr. 212.5% yr. 3
95% on 98% loans97% on 100% loans
2x historical
3x historical
Capitalize all interest on balance
100 bps in year 16 month spikes up to 300 bps for 5 years, reverting back to 100 bps
60 days60 days
19%
75.0% yr. 112.5% yr. 212.5% yr. 3
97% on 98% loans99% on 100% loans
Historical
Historical
Capitalize all interest on balance
75 bps in year 16 month spikes up to 120 bps for 5 years, reverting back to 75 bps
60 days60 days
DefaultsApplication
DefaultsApplication
ReimbursementsReimbursements
ForebearanceForebearance
DeferralsDeferrals
Unsubsidized loans
Unsubsidized loans
TED SpreadTED Spread
Payment LagsStudentSAP & ISP
Payment LagsStudentSAP & ISP
Rating Agency Stress Tests
All scenarios are designed to test the transaction’s liquidity rather than credit
80ST
UD
EN
TL
OA
NA
BS
(F
FE
LP
)
Structure:Factors affecting prepayments
Student loan prepayment may be broken down to three main segments
Voluntary prepayment
Loan consolidation prepayment
Involuntary prepayment (default)
Loan type (e.g., Stafford, PLUS, consolidation) and payment status (e.g., in-school, deferral/forbearance, in re-payment) also affect speeds for each segment
For example, a Stafford loan just entering into re-payment will exhibit higher initial prepayments than other loan types. This would be the case of a student graduating and choosing to prepay/consolidate his/her loan or cannot find a job and defaults
School type (e.g., vocational, 2-year, 4-year), borrower age/indebtedness and seasonality (the school year) are some other factors
81ST
UD
EN
TL
OA
NA
BS
(F
FE
LP
)
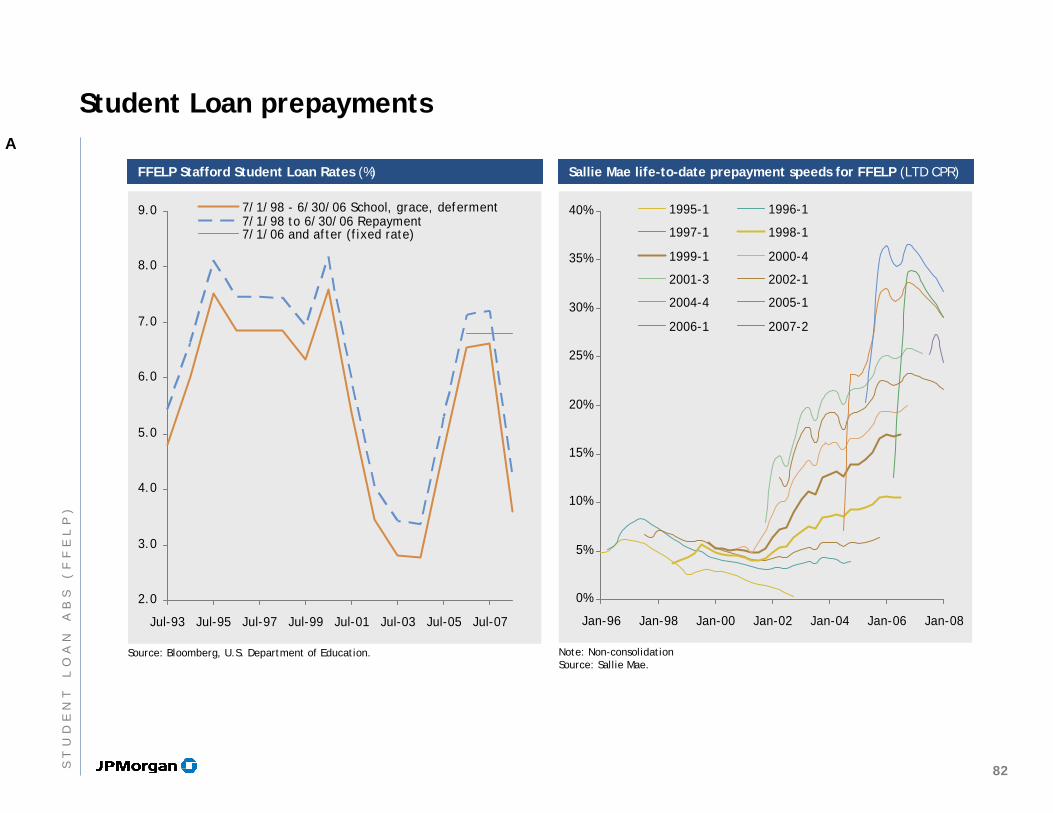
Student Loan prepayments
2.0
3.0
4.0
5.0
6.0
7.0
8.0
9.0
Jul-93 Jul-95 Jul-97 Jul-99 Jul-01 Jul-03 Jul-05 Jul-07
7/1/98 - 6/30/06 School, grace, deferment7/1/98 to 6/30/06 Repayment7/1/06 and after (fixed rate)
Source: Bloomberg, U.S. Department of Education. Note: Non-consolidationSource: Sallie Mae.
FFELP Stafford Student Loan Rates (%)FFELP Stafford Student Loan Rates (%) Sallie Mae life-to-date prepayment speeds for FFELP (LTD CPR)Sallie Mae life-to-date prepayment speeds for FFELP (LTD CPR)
0%
5%
10%
15%
20%
25%
30%
35%
40%
Jan-96 Jan-98 Jan-00 Jan-02 Jan-04 Jan-06 Jan-08
1995-1 1996-1
1997-1 1998-1
1999-1 2000-4
2001-3 2002-1
2004-4 2005-1
2006-1 2007-2
A
82ST
UD
EN
TL
OA
NA
BS
(F
FE
LP
)
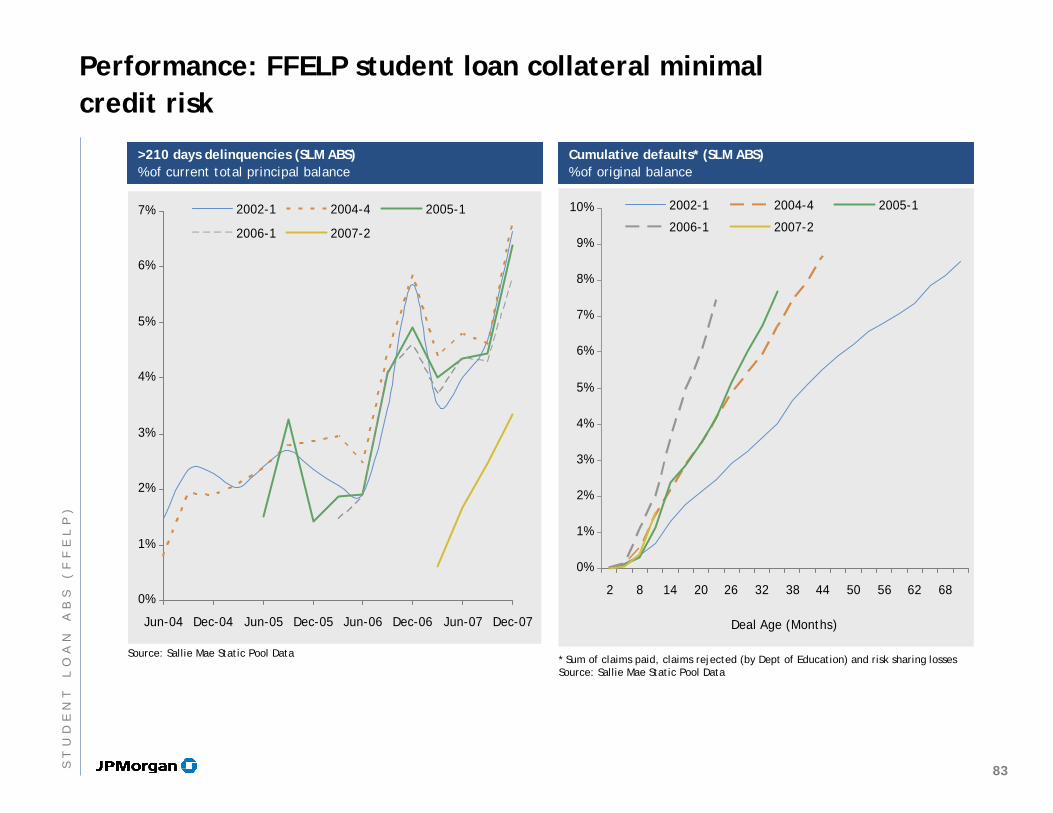
Performance: FFELP student loan collateral minimal credit risk
0%
1%
2%
3%
4%
5%
6%
7%
Jun-04 Dec-04 Jun-05 Dec-05 Jun-06 Dec-06 Jun-07 Dec-07
2002-1 2004-4 2005-1
2006-1 2007-2
Source: Sallie Mae Static Pool Data
>210 days delinquencies (SLM ABS)% of current total principal balance
>210 days delinquencies (SLM ABS)% of current total principal balance
Cumulative defaults* (SLM ABS)% of original balance
Cumulative defaults* (SLM ABS)% of original balance
0%
1%
2%
3%
4%
5%
6%
7%
8%
9%
10%
2 8 14 20 26 32 38 44 50 56 62 68
Deal Age (Months)
2002-1 2004-4 2005-1
2006-1 2007-2
* Sum of claims paid, claims rejected (by Dept of Education) and risk sharing losses Source: Sallie Mae Static Pool Data
83ST
UD
EN
TL
OA
NA
BS
(F
FE
LP
)
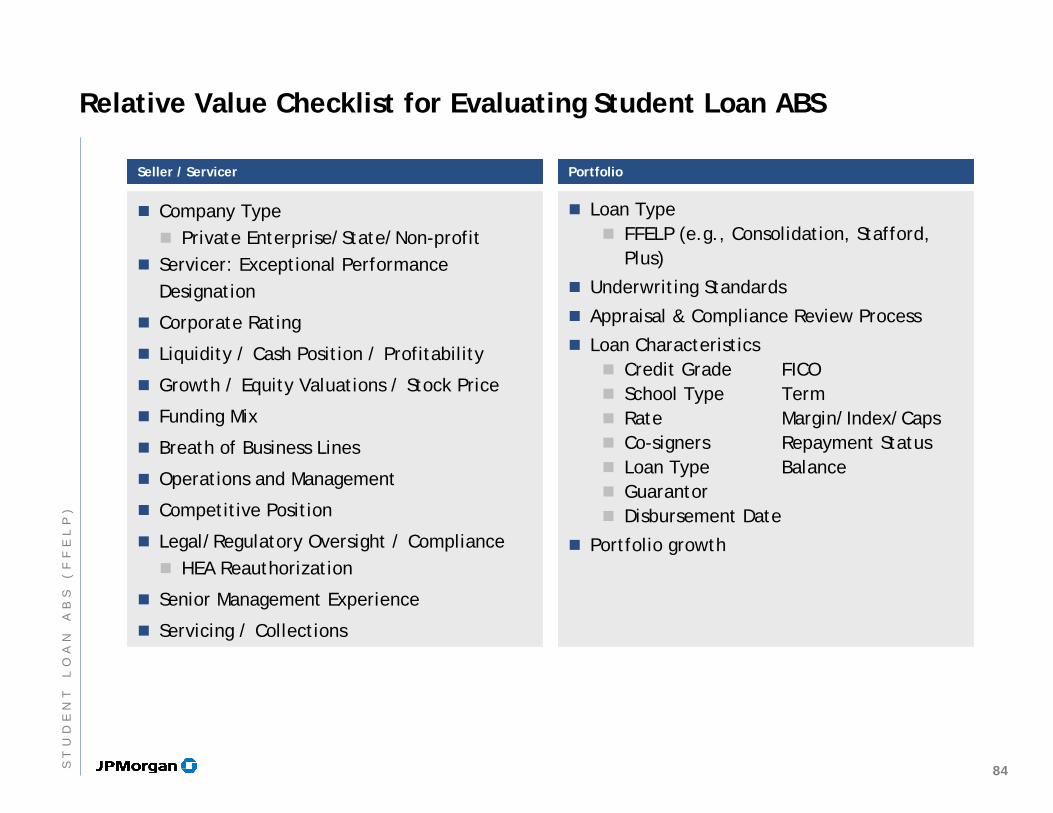
Seller / ServicerSeller / Servicer PortfolioPortfolio
Relative Value Checklist for Evaluating Student Loan ABS
Company TypePrivate Enterprise/State/Non-profit
Servicer: Exceptional Performance Designation
Corporate Rating
Liquidity / Cash Position / Profitability
Growth / Equity Valuations / Stock Price
Funding Mix
Breath of Business Lines
Operations and Management
Competitive Position
Legal/Regulatory Oversight / ComplianceHEA Reauthorization
Senior Management Experience
Servicing / Collections
Loan TypeFFELP (e.g., Consolidation, Stafford, Plus)
Underwriting Standards
Appraisal & Compliance Review Process
Loan CharacteristicsCredit Grade FICOSchool Type TermRate Margin/Index/CapsCo-signers Repayment StatusLoan Type BalanceGuarantorDisbursement Date
Portfolio growth
84ST
UD
EN
TL
OA
NA
BS
(F
FE
LP
)
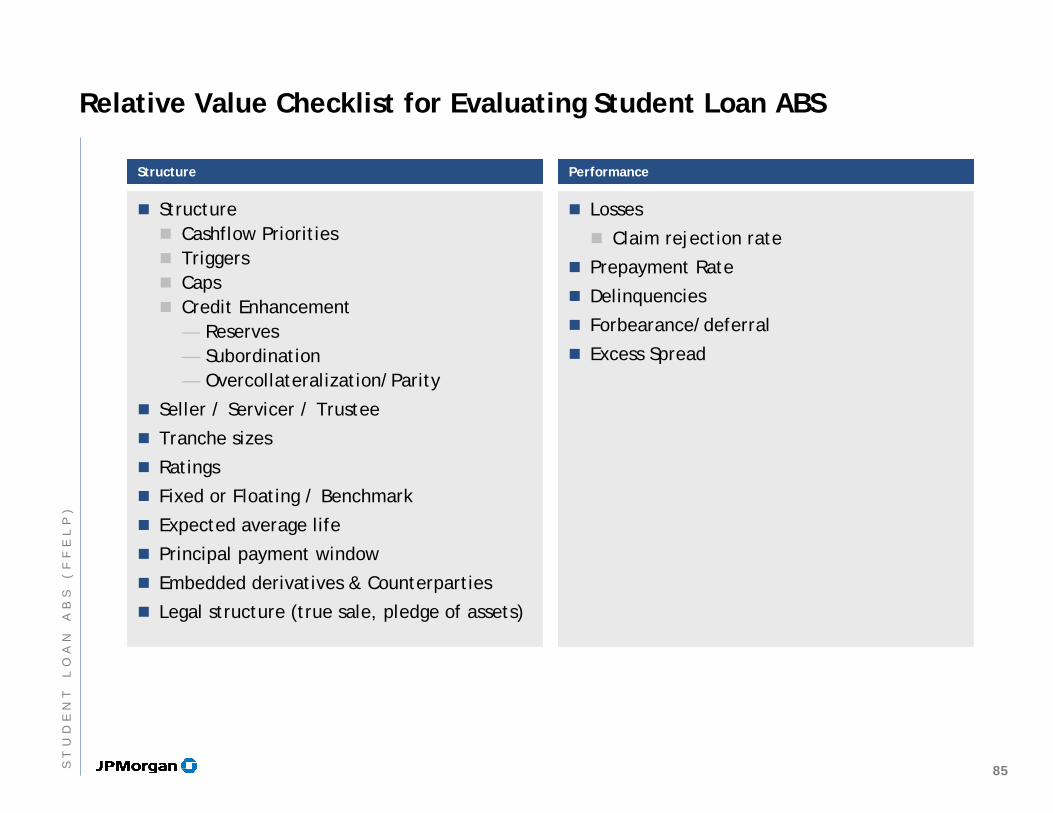
StructureStructure
Relative Value Checklist for Evaluating Student Loan ABS
StructureCashflow PrioritiesTriggersCapsCredit Enhancement— Reserves— Subordination— Overcollateralization/Parity
Seller / Servicer / Trustee
Tranche sizes
Ratings
Fixed or Floating / Benchmark
Expected average life
Principal payment window
Embedded derivatives & Counterparties
Legal structure (true sale, pledge of assets)
PerformancePerformance
Losses
Claim rejection rate
Prepayment Rate
Delinquencies
Forbearance/deferral
Excess Spread
85ST
UD
EN
TL
OA
NA
BS
(F
FE
LP
)
AgendaAgenda
Page
Home Equity ABS
Student Loan ABS (FFELP)
Automobile ABS
Credit Card
Introduction to ABS
86
1
11
35
53
86
IN
VE
ST
IN
GI
NA
SS
ET
BA
CK
ED
SE
CU
RI
TI
ES
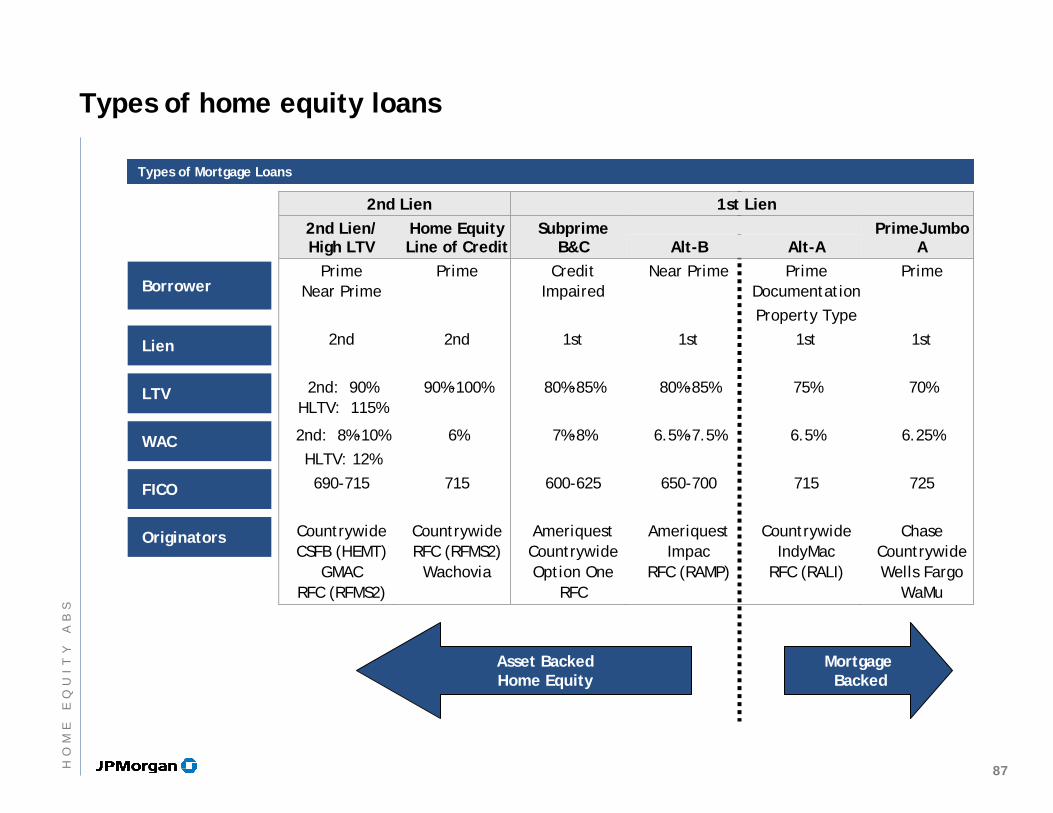
Types of home equity loans
Asset BackedHome Equity
MortgageBacked
Borrower
Lien
LTV
WAC
FICO
Originators
2nd Lien 1st Lien
2nd Lien/ High LTV
Home Equity Line of Credit
Subprime B&C Alt-B Alt-A
PrimeJumbo A
Prime Near Prime
Prime Credit Impaired
Near Prime Prime DocumentationProperty Type
Prime
2nd 2nd 1st
1st 1st 1st
2nd: 90% HLTV: 115%
90%-100% 80%-85%
80%-85% 75% 70%
2nd: 8%-10% HLTV: 12%
6% 7%-8%
6.5%-7.5% 6.5% 6.25%
690-715 715 600-625
650-700 715 725
Countrywide CSFB (HEMT)
GMAC RFC (RFMS2)
Countrywide RFC (RFMS2)
Wachovia
Ameriquest Countrywide Option One
RFC
Ameriquest Impac
RFC (RAMP)
Countrywide IndyMac
RFC (RALI)
Chase Countrywide Wells Fargo
WaMu
Types of Mortgage LoansTypes of Mortgage Loans
87HO
ME
EQ
UI
TY
AB
S
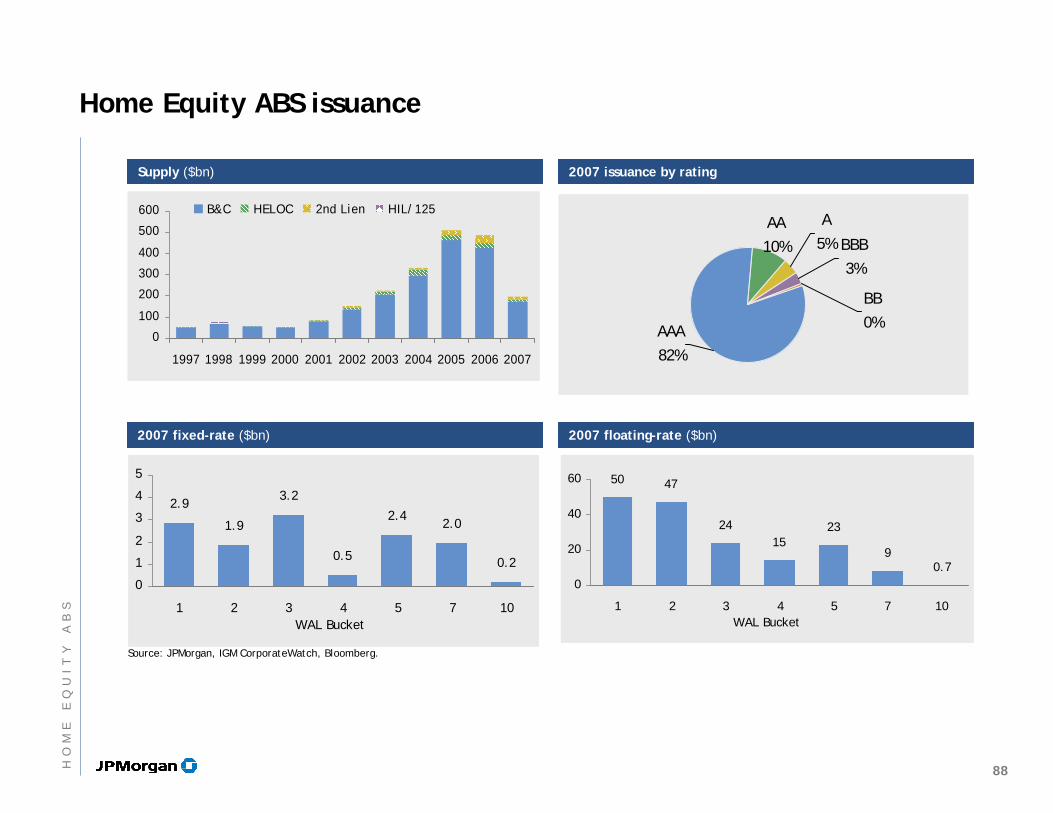
Home Equity ABS issuance
Supply ($bn)Supply ($bn)
Source: JPMorgan, IGM CorporateWatch, Bloomberg.
2007 floating-rate ($bn)2007 floating-rate ($bn)2007 fixed-rate ($bn)2007 fixed-rate ($bn)
50 47
2415
23
90.7
0
20
40
60
1 2 3 4 5 7 10WAL Bucket
0
100
200
300
400
500
600
1997 1998 1999 2000 2001 2002 2003 2004 2005 2006 2007
B&C HELOC 2nd Lien HIL/125
2.9
1.9
3.2
0.5
2.42.0
0.2
0
1
2
3
4
5
1 2 3 4 5 7 10WAL Bucket
2007 issuance by rating 2007 issuance by rating
BBB3%
BB0%
A5%
AA10%
AAA82%
88HO
ME
EQ
UI
TY
AB
S
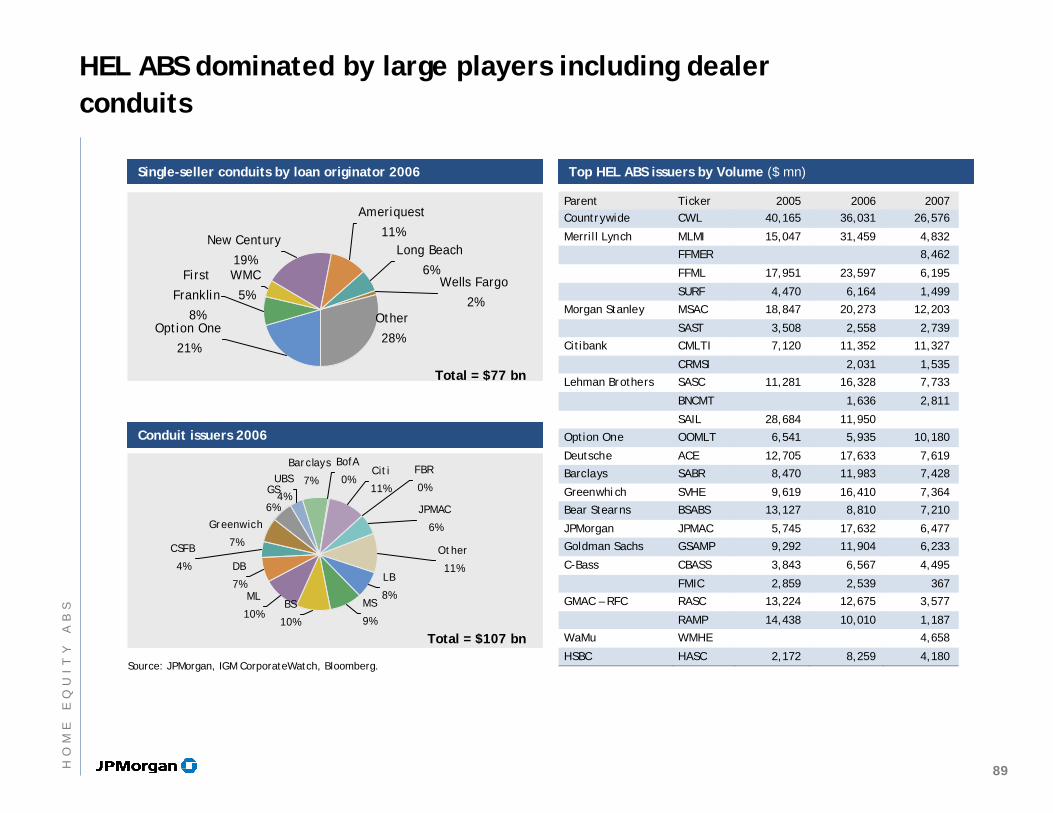
Option One
21%
Other
28%
Wells Fargo
2%
Long Beach
6%
New Century
19%WMC
5%
Ameriquest
11%
First
Franklin
8%
Source: JPMorgan, IGM CorporateWatch, Bloomberg.
Single-seller conduits by loan originator 2006 Single-seller conduits by loan originator 2006
Conduit issuers 2006Conduit issuers 2006
Total = $77 bn
HEL ABS dominated by large players including dealer conduits
Top HEL ABS issuers by Volume ($ mn)Top HEL ABS issuers by Volume ($ mn)
Parent Ticker 2005 2006 2007 Countrywide CWL 40,165 36,031 26,576
Merrill Lynch MLMI 15,047 31,459 4,832
FFMER 8,462
FFML 17,951 23,597 6,195
SURF 4,470 6,164 1,499
Morgan Stanley MSAC 18,847 20,273 12,203
SAST 3,508 2,558 2,739
Citibank CMLTI 7,120 11,352 11,327
CRMSI 2,031 1,535
Lehman Brothers SASC 11,281 16,328 7,733
BNCMT 1,636 2,811
SAIL 28,684 11,950
Option One OOMLT 6,541 5,935 10,180
Deutsche ACE 12,705 17,633 7,619
Barclays SABR 8,470 11,983 7,428
Greenwhich SVHE 9,619 16,410 7,364
Bear Stearns BSABS 13,127 8,810 7,210
JPMorgan JPMAC 5,745 17,632 6,477
Goldman Sachs GSAMP 9,292 11,904 6,233
C-Bass CBASS 3,843 6,567 4,495
FMIC 2,859 2,539 367
GMAC – RFC RASC 13,224 12,675 3,577
RAMP 14,438 10,010 1,187
WaMu WMHE 4,658
HSBC HASC 2,172 8,259 4,180
Barclays
7%
MS
9%
BS
10%
ML
10%
LB
8%
Other
11%
JPMAC
6%
FBR
0%
CSFB
4% DB
7%
Greenwich
7%
GS
6%
UBS
4%
BofA
0%Citi
11%
Total = $107 bn
89HO
ME
EQ
UI
TY
AB
S
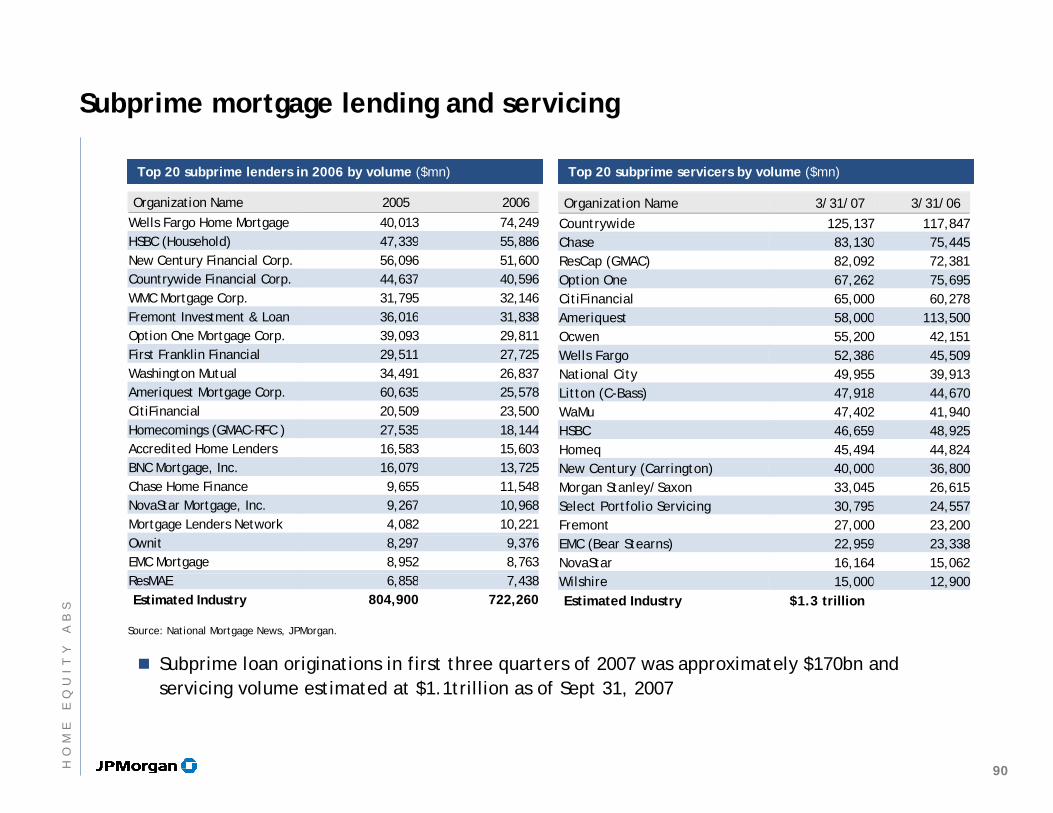
Subprime mortgage lending and servicing
Top 20 subprime lenders in 2006 by volume ($mn)Top 20 subprime lenders in 2006 by volume ($mn)
Source: National Mortgage News, JPMorgan.
Top 20 subprime servicers by volume ($mn)Top 20 subprime servicers by volume ($mn)
Organization Name 2005 2006 Wells Fargo Home Mortgage 40,013 74,249HSBC (Household) 47,339 55,886New Century Financial Corp. 56,096 51,600Countrywide Financial Corp. 44,637 40,596WMC Mortgage Corp. 31,795 32,146Fremont Investment & Loan 36,016 31,838Option One Mortgage Corp. 39,093 29,811First Franklin Financial 29,511 27,725Washington Mutual 34,491 26,837Ameriquest Mortgage Corp. 60,635 25,578CitiFinancial 20,509 23,500Homecomings (GMAC-RFC ) 27,535 18,144Accredited Home Lenders 16,583 15,603BNC Mortgage, Inc. 16,079 13,725Chase Home Finance 9,655 11,548NovaStar Mortgage, Inc. 9,267 10,968Mortgage Lenders Network 4,082 10,221Ownit 8,297 9,376EMC Mortgage 8,952 8,763ResMAE 6,858 7,438Estimated Industry 804,900 722,260
Organization Name 3/31/07 3/31/06 Countrywide 125,137 117,847Chase 83,130 75,445ResCap (GMAC) 82,092 72,381Option One 67,262 75,695CitiFinancial 65,000 60,278Ameriquest 58,000 113,500Ocwen 55,200 42,151Wells Fargo 52,386 45,509National City 49,955 39,913Litton (C-Bass) 47,918 44,670WaMu 47,402 41,940HSBC 46,659 48,925Homeq 45,494 44,824New Century (Carrington) 40,000 36,800Morgan Stanley/Saxon 33,045 26,615Select Portfolio Servicing 30,795 24,557Fremont 27,000 23,200EMC (Bear Stearns) 22,959 23,338NovaStar 16,164 15,062Wilshire 15,000 12,900Estimated Industry $1.3 trillion
Subprime loan originations in first three quarters of 2007 was approximately $170bn and servicing volume estimated at $1.1trillion as of Sept 31, 2007
90HO
ME
EQ
UI
TY
AB
S
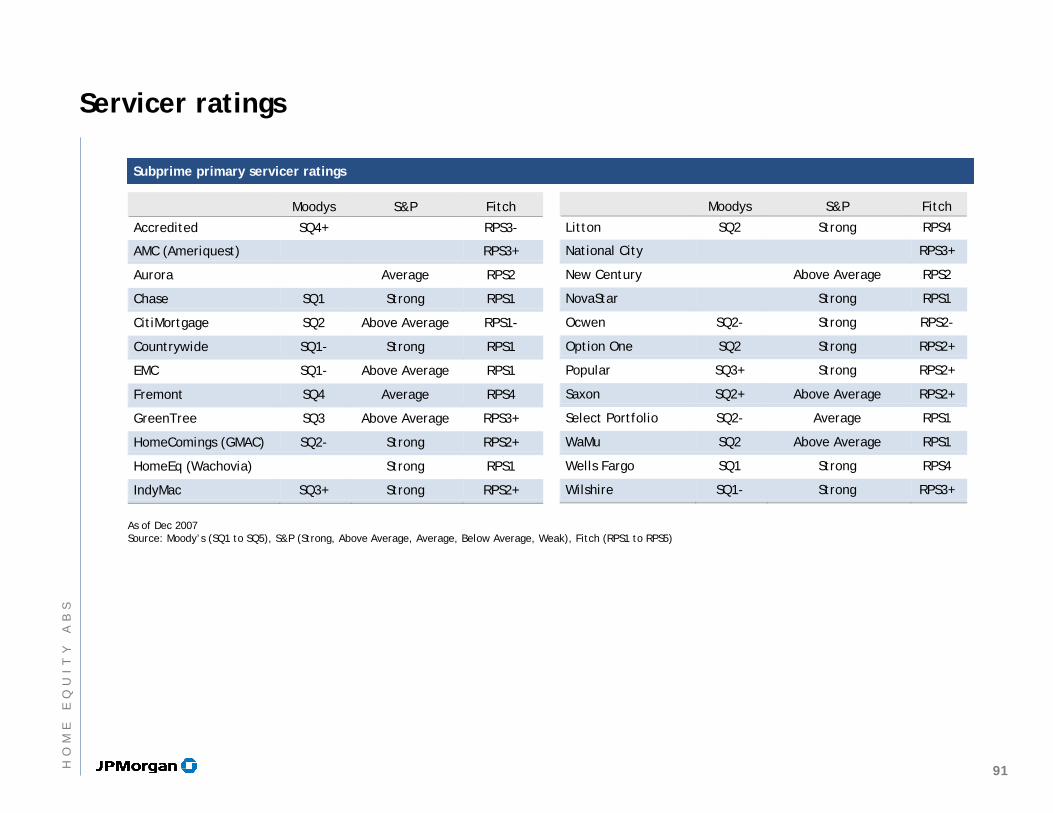
Subprime primary servicer ratingsSubprime primary servicer ratings
As of Dec 2007Source: Moody’s (SQ1 to SQ5), S&P (Strong, Above Average, Average, Below Average, Weak), Fitch (RPS1 to RPS5)
Servicer ratings
Moodys S&P Fitch
Accredited SQ4+ RPS3-
AMC (Ameriquest) RPS3+
Aurora Average RPS2
Chase SQ1 Strong RPS1
CitiMortgage SQ2 Above Average RPS1-
Countrywide SQ1- Strong RPS1
EMC SQ1- Above Average RPS1
Fremont SQ4 Average RPS4
GreenTree SQ3 Above Average RPS3+
HomeComings (GMAC) SQ2- Strong RPS2+
HomeEq (Wachovia) Strong RPS1
IndyMac SQ3+ Strong RPS2+
Moodys S&P Fitch
Litton SQ2 Strong RPS4
National City RPS3+
New Century Above Average RPS2
NovaStar Strong RPS1
Ocwen SQ2- Strong RPS2-
Option One SQ2 Strong RPS2+
Popular SQ3+ Strong RPS2+
Saxon SQ2+ Above Average RPS2+
Select Portfolio SQ2- Average RPS1
WaMu SQ2 Above Average RPS1
Wells Fargo SQ1 Strong RPS4
Wilshire SQ1- Strong RPS3+
91HO
ME
EQ
UI
TY
AB
S
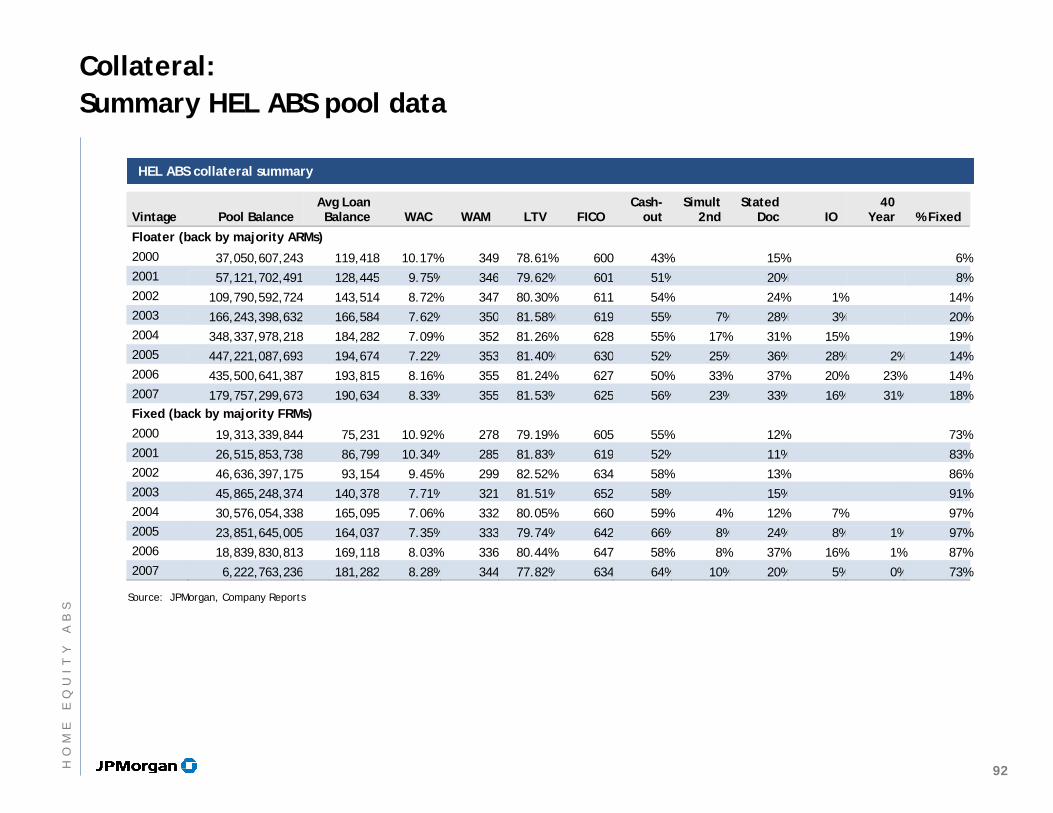
Collateral:Summary HEL ABS pool data
HEL ABS collateral summaryHEL ABS collateral summary
Source: JPMorgan, Company Reports
Vintage Pool Balance Avg Loan Balance WAC WAM LTV FICO
Cash-out
Simult 2nd
Stated Doc IO
40 Year % Fixed
Floater (back by majority ARMs) 2000 37,050,607,243 119,418 10.17% 349 78.61% 600 43% 15% 6%2001 57,121,702,491 128,445 9.75% 346 79.62% 601 51% 20% 8%2002 109,790,592,724 143,514 8.72% 347 80.30% 611 54% 24% 1% 14%2003 166,243,398,632 166,584 7.62% 350 81.58% 619 55% 7% 28% 3% 20%2004 348,337,978,218 184,282 7.09% 352 81.26% 628 55% 17% 31% 15% 19%2005 447,221,087,693 194,674 7.22% 353 81.40% 630 52% 25% 36% 28% 2% 14%2006 435,500,641,387 193,815 8.16% 355 81.24% 627 50% 33% 37% 20% 23% 14%2007 179,757,299,673 190,634 8.33% 355 81.53% 625 56% 23% 33% 16% 31% 18%Fixed (back by majority FRMs) 2000 19,313,339,844 75,231 10.92% 278 79.19% 605 55% 12% 73%2001 26,515,853,738 86,799 10.34% 285 81.83% 619 52% 11% 83%2002 46,636,397,175 93,154 9.45% 299 82.52% 634 58% 13% 86%2003 45,865,248,374 140,378 7.71% 321 81.51% 652 58% 15% 91%2004 30,576,054,338 165,095 7.06% 332 80.05% 660 59% 4% 12% 7% 97%2005 23,851,645,005 164,037 7.35% 333 79.74% 642 66% 8% 24% 8% 1% 97%2006 18,839,830,813 169,118 8.03% 336 80.44% 647 58% 8% 37% 16% 1% 87%2007 6,222,763,236 181,282 8.28% 344 77.82% 634 64% 10% 20% 5% 0% 73%
92HO
ME
EQ
UI
TY
AB
S
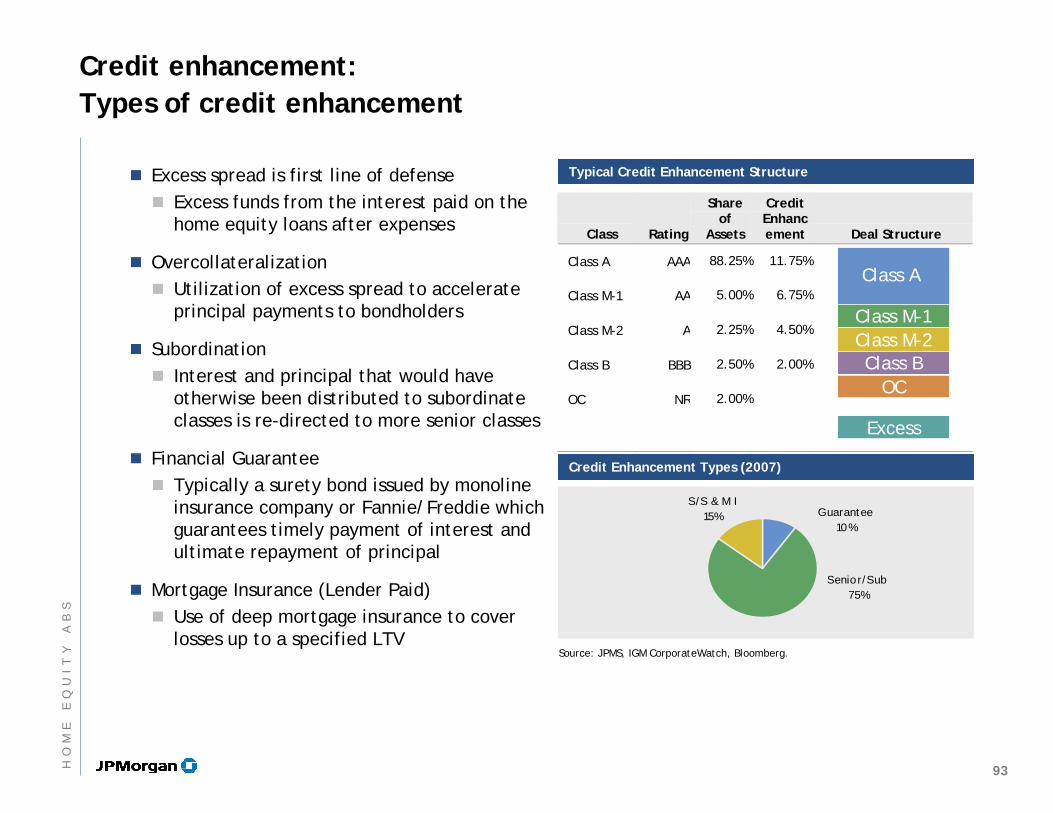
Credit enhancement:Types of credit enhancement
Excess spread is first line of defenseExcess funds from the interest paid on the home equity loans after expenses
OvercollateralizationUtilization of excess spread to accelerate principal payments to bondholders
SubordinationInterest and principal that would have otherwise been distributed to subordinate classes is re-directed to more senior classes
Financial GuaranteeTypically a surety bond issued by monoline insurance company or Fannie/Freddie which guarantees timely payment of interest and ultimate repayment of principal
Mortgage Insurance (Lender Paid)Use of deep mortgage insurance to cover losses up to a specified LTV
Class Rating
Share of
Assets
Credit Enhancement Deal Structure
Class A AAA 88.25% 11.75%
Class M-1 AA 5.00% 6.75%
Class M-2 A 2.25% 4.50%
Class B BBB 2.50% 2.00%
OC NR 2.00%
Typical Credit Enhancement StructureTypical Credit Enhancement Structure
Class A
Class M-1Class M-2
OCClass B
Source: JPMS, IGM CorporateWatch, Bloomberg.
Credit Enhancement Types (2007)Credit Enhancement Types (2007)
Senior/Sub75%
Guarantee10%
S/S & M I15%
Excess
93HO
ME
EQ
UI
TY
AB
S
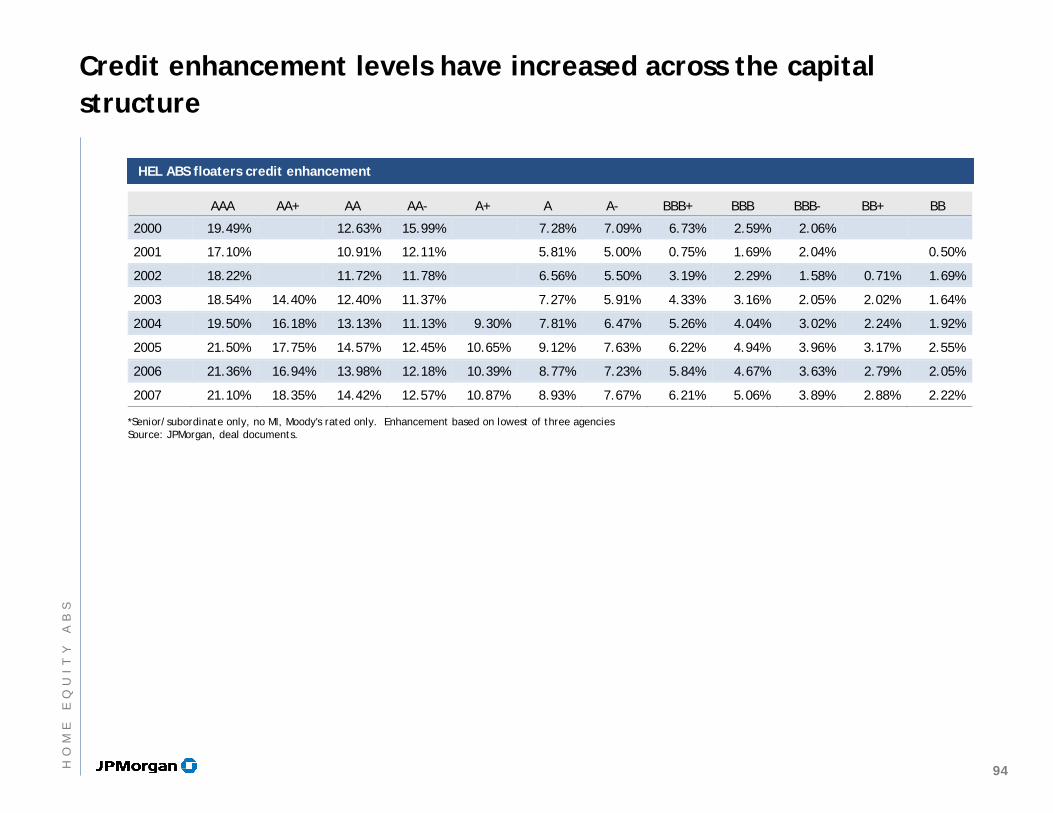
Credit enhancement levels have increased across the capital structure
HEL ABS floaters credit enhancementHEL ABS floaters credit enhancement
*Senior/subordinate only, no MI, Moody's rated only. Enhancement based on lowest of three agenciesSource: JPMorgan, deal documents.
AAA AA+ AA AA- A+ A A- BBB+ BBB BBB- BB+ BB
2000 19.49% 12.63% 15.99% 7.28% 7.09% 6.73% 2.59% 2.06%
2001 17.10% 10.91% 12.11% 5.81% 5.00% 0.75% 1.69% 2.04% 0.50%
2002 18.22% 11.72% 11.78% 6.56% 5.50% 3.19% 2.29% 1.58% 0.71% 1.69%
2003 18.54% 14.40% 12.40% 11.37% 7.27% 5.91% 4.33% 3.16% 2.05% 2.02% 1.64%
2004 19.50% 16.18% 13.13% 11.13% 9.30% 7.81% 6.47% 5.26% 4.04% 3.02% 2.24% 1.92%
2005 21.50% 17.75% 14.57% 12.45% 10.65% 9.12% 7.63% 6.22% 4.94% 3.96% 3.17% 2.55%
2006 21.36% 16.94% 13.98% 12.18% 10.39% 8.77% 7.23% 5.84% 4.67% 3.63% 2.79% 2.05%
2007 21.10% 18.35% 14.42% 12.57% 10.87% 8.93% 7.67% 6.21% 5.06% 3.89% 2.88% 2.22%
94HO
ME
EQ
UI
TY
AB
S
Structure:Amortizing Cashflows
Loans typically amortize principal over their term-to-maturity. Some loans require balloon payments.
Loans may prepay in advance of the scheduled maturityVoluntary prepayment— Refinancing or sale of homeInvoluntary prepayment— Repossession or loss of homeWhen a prepayment occurs, principal is paid through to the security holders, thus retiring that portion of principal that is attributable to the loan that has prepaidPrepayment measured by Constant prepayment model (CPR)
Home Equity loans exhibit much less negative convexity as compared to Conforming and Jumbo MBS.
Typical HEL ABS Deal CharacteristicsPricing Benchmarks Swaps, EDSF, LIBORCoupon Type Fixed or FloatingTypical New Issue Size $750 million - $2 billionTranched by credit rating and maturity
95HO
ME
EQ
UI
TY
AB
S
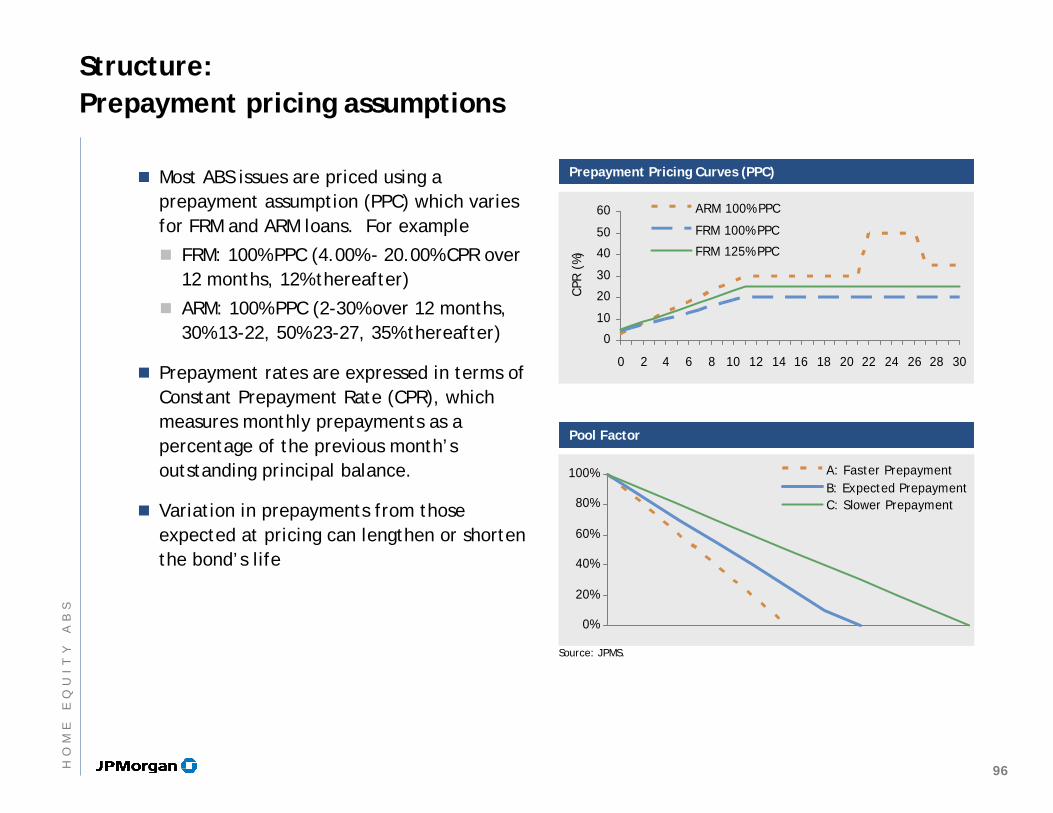
Source: JPMS.
Pool FactorPool Factor
Prepayment Pricing Curves (PPC)Prepayment Pricing Curves (PPC)
0
10
20
30
40
50
60
0 2 4 6 8 10 12 14 16 18 20 22 24 26 28 30
CPR
(%
)
ARM 100% PPC
FRM 100% PPC
FRM 125% PPC
0%
20%
40%
60%
80%
100% A: Faster PrepaymentB: Expected PrepaymentC: Slower Prepayment
Structure:Prepayment pricing assumptions
Most ABS issues are priced using a prepayment assumption (PPC) which varies for FRM and ARM loans. For example
FRM: 100% PPC (4.00% - 20.00% CPR over 12 months, 12% thereafter)
ARM: 100% PPC (2-30% over 12 months, 30% 13-22, 50% 23-27, 35% thereafter)
Prepayment rates are expressed in terms of Constant Prepayment Rate (CPR), which measures monthly prepayments as a percentage of the previous month’s outstanding principal balance.
Variation in prepayments from those expected at pricing can lengthen or shorten the bond’s life
96HO
ME
EQ
UI
TY
AB
S
Structure:Factors affecting prepayments
Interest rates
Incentive is a function of interest rates, shape of the curve, and loan rate. Higher quality borrowers tend to be more sensitive than lower quality borrowers due to the increased quantity of refinancing options.
Home Price Appreciation
Housing Market: Price appreciation may allow borrowers to take additional equity out or trade up their houses.
Credit quality
An improvement in credit history provides incentive for lower quality borrowers to refinance as their improved status makes possible substantial savings.
Prepayment penalties
Dramatically reduce the incentive to refinance while penalty is in effect.
Typical prepayment penalty is 6 months interest on 80% of the loan.
97HO
ME
EQ
UI
TY
AB
S
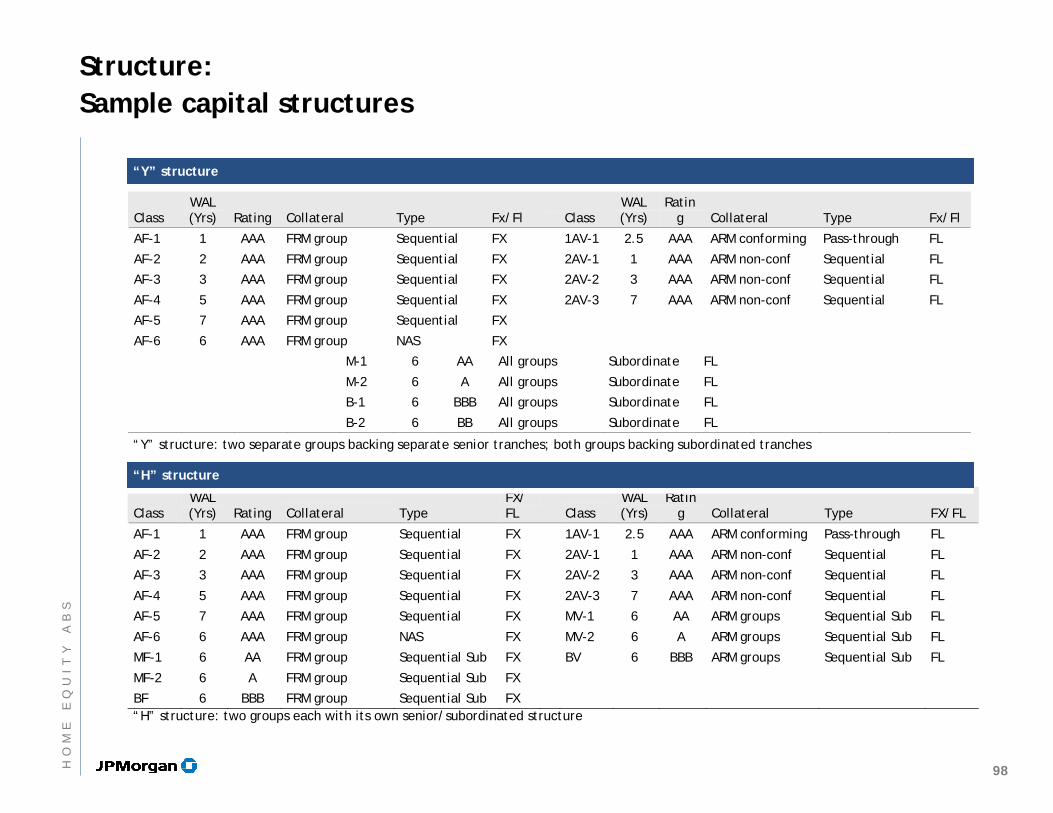
Class WAL (Yrs) Rating Collateral Type Fx/Fl
Class
WAL (Yrs)
Rating Collateral Type Fx/Fl
AF-1 1 AAA FRM group Sequential FX 1AV-1 2.5 AAA ARM conforming Pass-through FL
AF-2 2 AAA FRM group Sequential FX 2AV-1 1 AAA ARM non-conf Sequential FL
AF-3 3 AAA FRM group Sequential FX 2AV-2 3 AAA ARM non-conf Sequential FL
AF-4 5 AAA FRM group Sequential FX 2AV-3 7 AAA ARM non-conf Sequential FL
AF-5 7 AAA FRM group Sequential FX
AF-6 6 AAA FRM group NAS FX
M-1 6 AA All groups Subordinate FL
M-2 6 A All groups Subordinate FL
B-1 6 BBB All groups Subordinate FL
B-2 6 BB All groups Subordinate FL
Class WAL (Yrs) Rating Collateral Type
FX/FL
Class
WAL (Yrs)
Rating Collateral Type FX/FL
AF-1 1 AAA FRM group Sequential FX 1AV-1 2.5 AAA ARM conforming Pass-through FL
AF-2 2 AAA FRM group Sequential FX 2AV-1 1 AAA ARM non-conf Sequential FL
AF-3 3 AAA FRM group Sequential FX 2AV-2 3 AAA ARM non-conf Sequential FL
AF-4 5 AAA FRM group Sequential FX 2AV-3 7 AAA ARM non-conf Sequential FL
AF-5 7 AAA FRM group Sequential FX MV-1 6 AA ARM groups Sequential Sub FL
AF-6 6 AAA FRM group NAS FX MV-2 6 A ARM groups Sequential Sub FL
MF-1 6 AA FRM group Sequential Sub FX BV 6 BBB ARM groups Sequential Sub FL
MF-2 6 A FRM group Sequential Sub FX
BF 6 BBB FRM group Sequential Sub FX
“Y” structure“Y” structure
“H” structure“H” structure
Structure:Sample capital structures
“H” structure: two groups each with its own senior/subordinated structure
“Y” structure: two separate groups backing separate senior tranches; both groups backing subordinated tranches
98HO
ME
EQ
UI
TY
AB
S
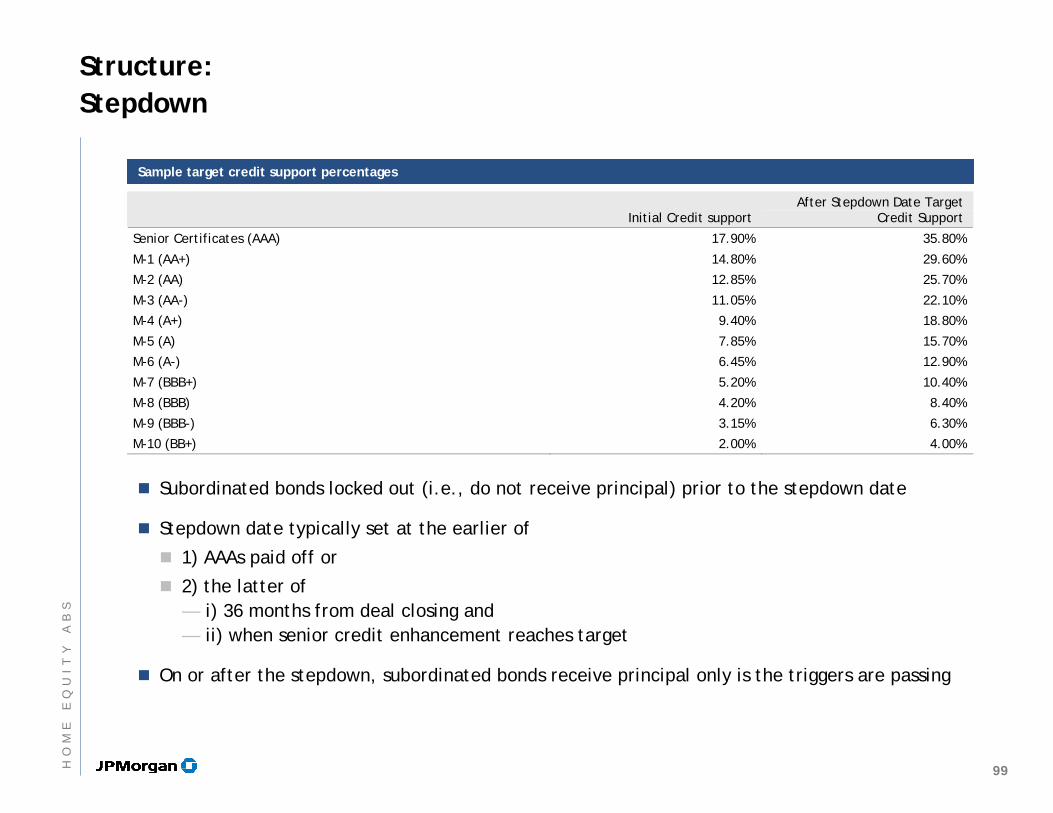
Structure: Stepdown
Sample target credit support percentagesSample target credit support percentages
Subordinated bonds locked out (i.e., do not receive principal) prior to the stepdown date
Stepdown date typically set at the earlier of
1) AAAs paid off or
2) the latter of — i) 36 months from deal closing and — ii) when senior credit enhancement reaches target
On or after the stepdown, subordinated bonds receive principal only is the triggers are passing
Initial Credit support After Stepdown Date Target
Credit Support
Senior Certificates (AAA) 17.90% 35.80%
M-1 (AA+) 14.80% 29.60%
M-2 (AA) 12.85% 25.70%
M-3 (AA-) 11.05% 22.10%
M-4 (A+) 9.40% 18.80%
M-5 (A) 7.85% 15.70%
M-6 (A-) 6.45% 12.90%
M-7 (BBB+) 5.20% 10.40%
M-8 (BBB) 4.20% 8.40%
M-9 (BBB-) 3.15% 6.30%
M-10 (BB+) 2.00% 4.00%
99HO
ME
EQ
UI
TY
AB
S
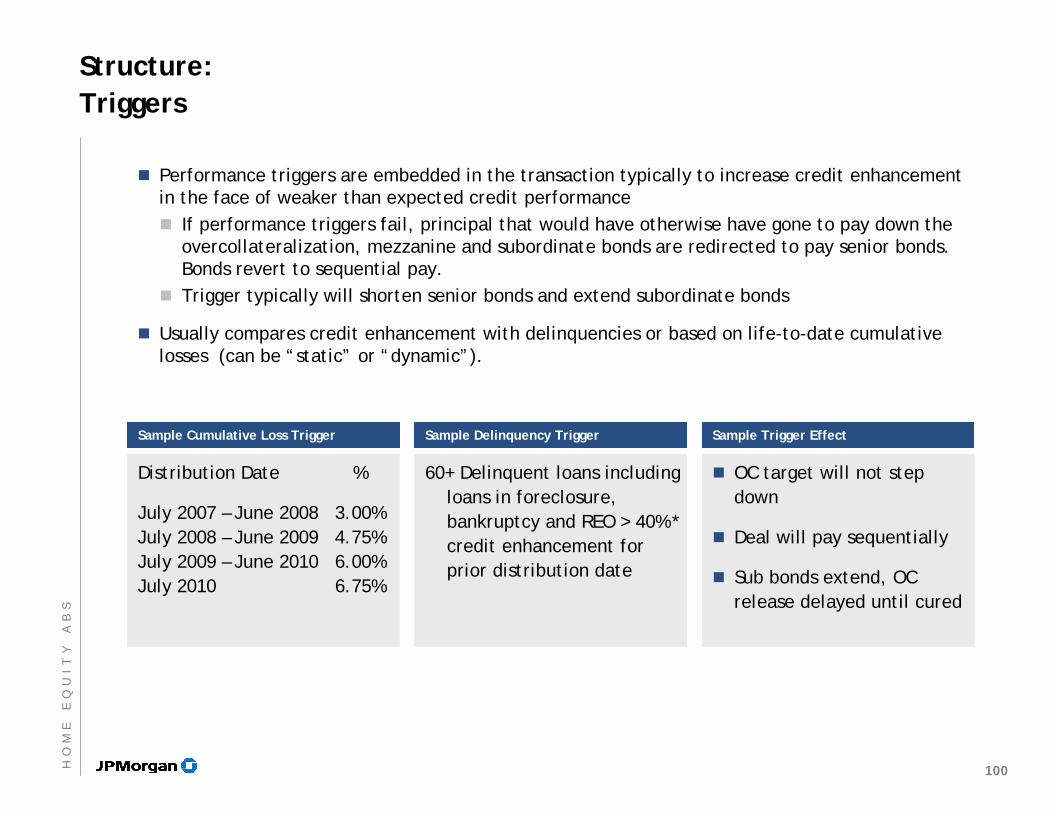
Structure:Triggers
Performance triggers are embedded in the transaction typically to increase credit enhancement in the face of weaker than expected credit performance
If performance triggers fail, principal that would have otherwise have gone to pay down the overcollateralization, mezzanine and subordinate bonds are redirected to pay senior bonds. Bonds revert to sequential pay.Trigger typically will shorten senior bonds and extend subordinate bonds
Usually compares credit enhancement with delinquencies or based on life-to-date cumulative losses (can be “static” or “dynamic”).
Sample Cumulative Loss TriggerSample Cumulative Loss Trigger Sample Delinquency TriggerSample Delinquency Trigger Sample Trigger EffectSample Trigger Effect
Distribution Date %
July 2007 – June 2008 3.00%July 2008 – June 2009 4.75%July 2009 – June 2010 6.00%July 2010 6.75%
60+ Delinquent loans including loans in foreclosure, bankruptcy and REO > 40% * credit enhancement for prior distribution date
OC target will not step down
Deal will pay sequentially
Sub bonds extend, OC release delayed until cured
100HO
ME
EQ
UI
TY
AB
S
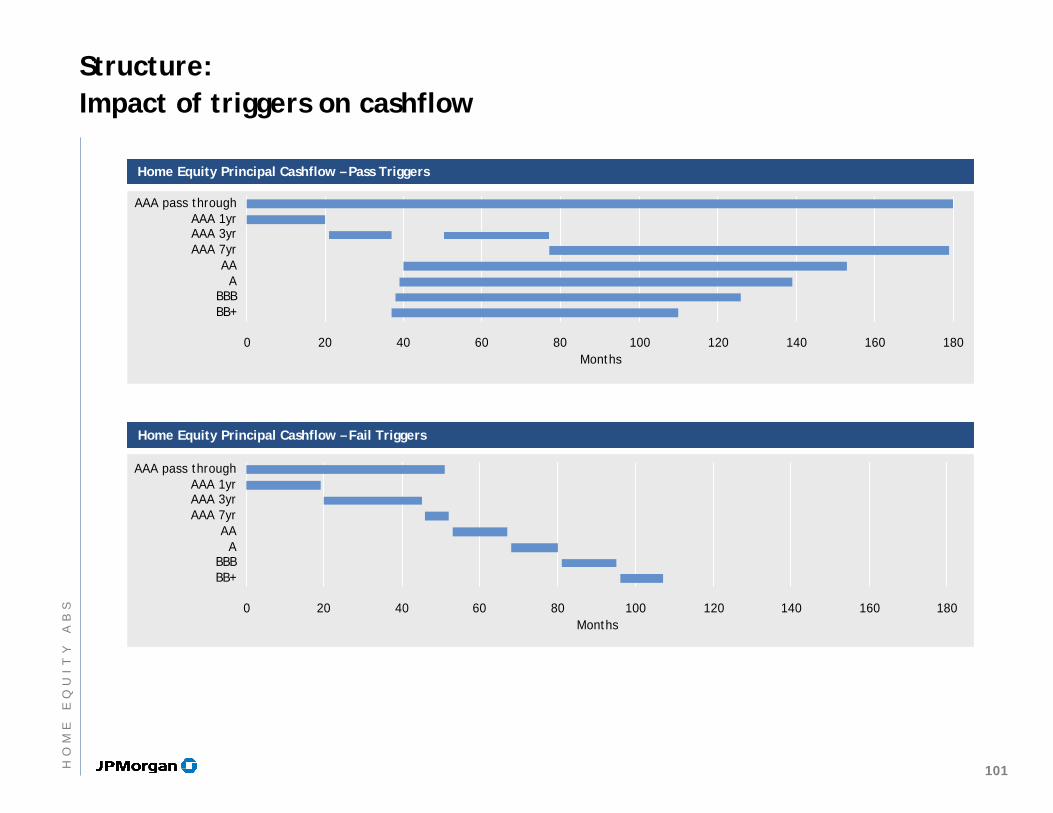
Structure:Impact of triggers on cashflow
Home Equity Principal Cashflow – Pass TriggersHome Equity Principal Cashflow – Pass Triggers
Home Equity Principal Cashflow – Fail TriggersHome Equity Principal Cashflow – Fail Triggers
0 20 40 60 80 100 120 140 160 180
AAA pass throughAAA 1yrAAA 3yrAAA 7yr
AAA
BBBBB+
Months
0 20 40 60 80 100 120 140 160 180
AAA pass throughAAA 1yrAAA 3yrAAA 7yr
AAA
BBBBB+
Months
101HO
ME
EQ
UI
TY
AB
S
Structure:Cap risk in Home Equity ABS
Available funds cap
Cap limits the bond coupon to the WA loan rate less servicing fees and other costs
Underlying mortgages subject to initial, periodic and lifetime caps (typically 3%/1%/6%)
Lifetime caps are generally quite high and unlikely to be a limiting factor
On most deals a “shortfall reimbursement” feature covers any interest payment shortfalls by drawing on future excess spread
Transactions may also purchase LIBOR caps or enter into corridors/swaps to mitigate risk
102HO
ME
EQ
UI
TY
AB
S

Structure:Interest rate hedging instruments – caps and swaps
Primary function is to mitigate basis risk (mismatch in asset and liability interest rates)Collateral — Predominantly pays fixed interest for first 2-3 years (due to fixed and hybrid ARM loans)— Floating interest typically references 6-mo LIBORBonds typically pay floating interest referencing 1-mo LIBOR
Interest Rate Caps and SwapsReference 1-mo LIBORAmortizing notional amountsConstant or changing strike rates
Interest Rate CapsRequire an initial cash outlay at deal closingProtect from rise in interest rates above strike
Interest Rate SwapsAlter cashflow characteristics to match those of the assets and liabilities Counterparties agree to swap periodic payments (trust pays fixed, receives floating)
Payments received usually flow through cashflow waterfall
103HO
ME
EQ
UI
TY
AB
S
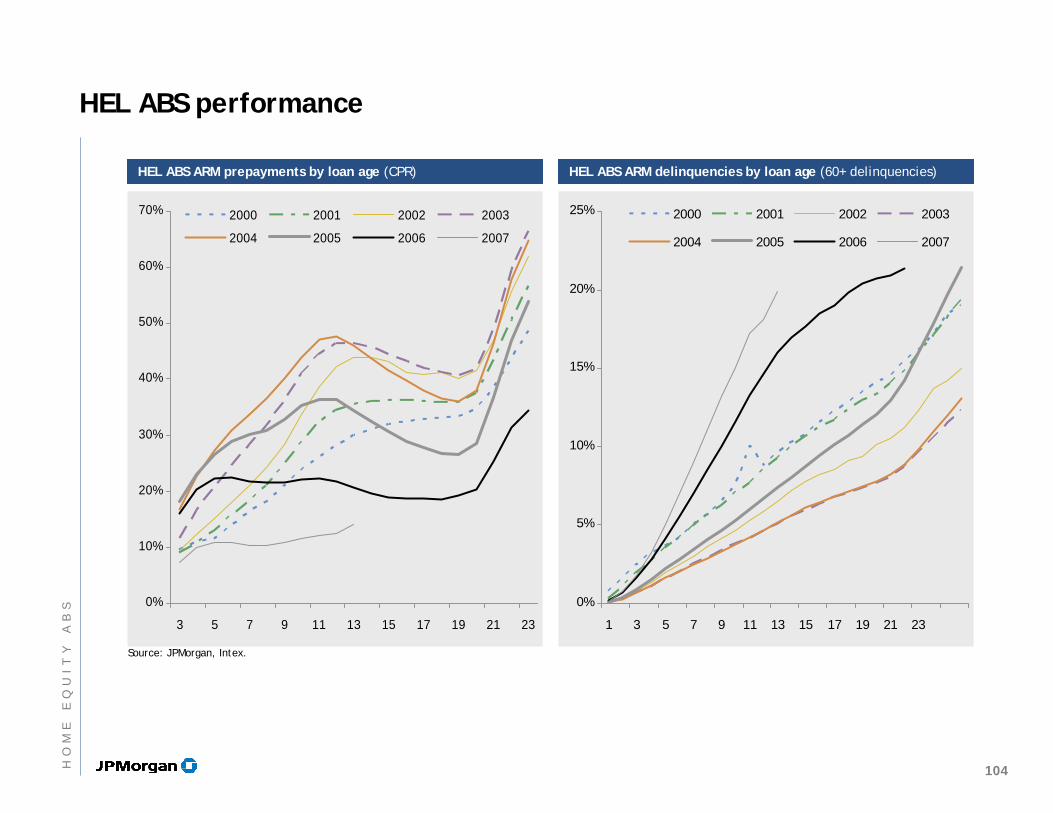
0%
5%
10%
15%
20%
25%
1 3 5 7 9 11 13 15 17 19 21 23
2000 2001 2002 2003
2004 2005 2006 2007
0%
10%
20%
30%
40%
50%
60%
70%
3 5 7 9 11 13 15 17 19 21 23
2000 2001 2002 2003
2004 2005 2006 2007
Source: JPMorgan, Intex.
HEL ABS ARM prepayments by loan age (CPR)HEL ABS ARM prepayments by loan age (CPR) HEL ABS ARM delinquencies by loan age (60+ delinquencies)HEL ABS ARM delinquencies by loan age (60+ delinquencies)
HEL ABS performance
104HO
ME
EQ
UI
TY
AB
S
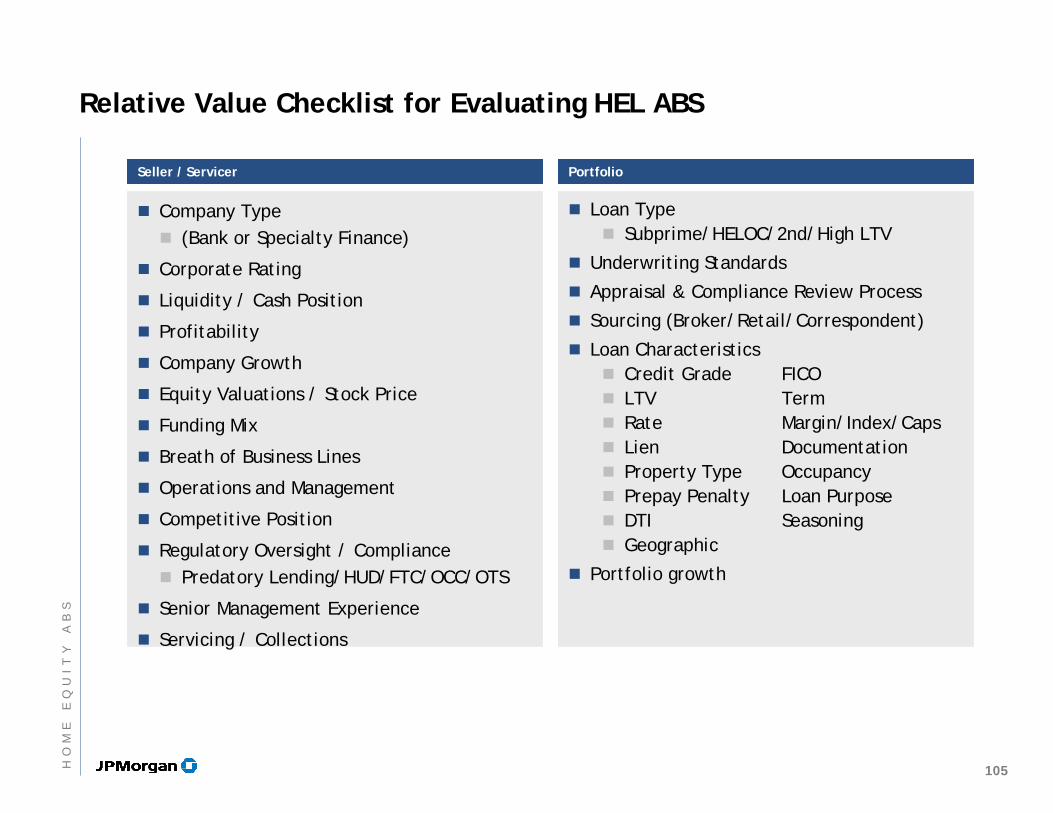
Seller / ServicerSeller / Servicer PortfolioPortfolio
Relative Value Checklist for Evaluating HEL ABS
Company Type(Bank or Specialty Finance)
Corporate Rating
Liquidity / Cash Position
Profitability
Company Growth
Equity Valuations / Stock Price
Funding Mix
Breath of Business Lines
Operations and Management
Competitive Position
Regulatory Oversight / CompliancePredatory Lending/HUD/FTC/OCC/OTS
Senior Management Experience
Servicing / Collections
Loan TypeSubprime/HELOC/2nd/High LTV
Underwriting Standards
Appraisal & Compliance Review Process
Sourcing (Broker/Retail/Correspondent)
Loan CharacteristicsCredit Grade FICOLTV TermRate Margin/Index/CapsLien DocumentationProperty Type OccupancyPrepay Penalty Loan PurposeDTI SeasoningGeographic
Portfolio growth
105HO
ME
EQ
UI
TY
AB
S
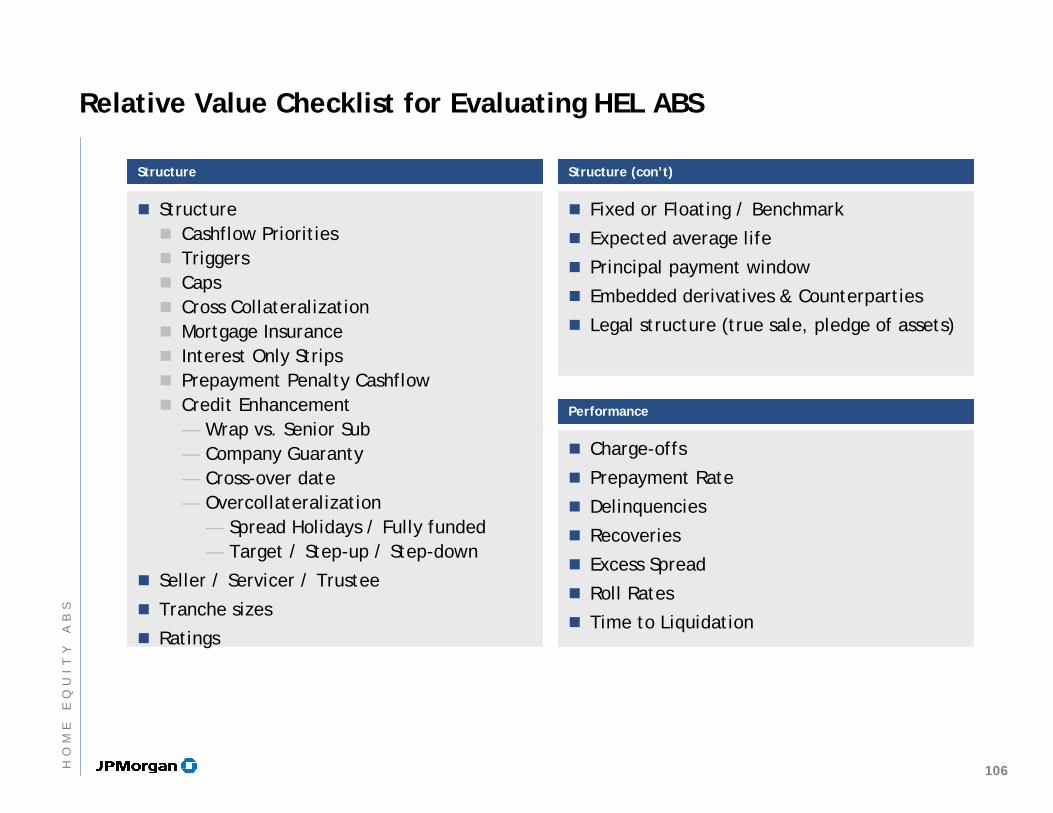
StructureStructure Structure (con’t)Structure (con’t)
Relative Value Checklist for Evaluating HEL ABS
StructureCashflow PrioritiesTriggersCapsCross CollateralizationMortgage InsuranceInterest Only StripsPrepayment Penalty CashflowCredit Enhancement— Wrap vs. Senior Sub— Company Guaranty— Cross-over date— Overcollateralization
— Spread Holidays / Fully funded— Target / Step-up / Step-down
Seller / Servicer / Trustee
Tranche sizes
Ratings
Fixed or Floating / Benchmark
Expected average life
Principal payment window
Embedded derivatives & Counterparties
Legal structure (true sale, pledge of assets)
PerformancePerformance
Charge-offs
Prepayment Rate
Delinquencies
Recoveries
Excess Spread
Roll Rates
Time to Liquidation
106HO
ME
EQ
UI
TY
AB
S
Copyright 2008 J.P. Morgan Chase & Co. All rights reserved. JPMorgan is the marketing name for J.P. Morgan Chase & Co., and its subsidiaries and affiliates worldwide. J.P. Morgan Securities Inc. is a member of NYSE and SIPC. JPMorgan Chase Bank is a member of FDIC. J.P. Morgan Futures Inc., is a member of the NFA. J.P. Morgan Securities Ltd. (JPMorganL), J.P. Morgan Europe Limited and J.P. Morgan plc are authorized by the FSA. J.P. Morgan Equities Limited is a member of the Johannesburg Securities Exchange and is regulated by the FSB. J.P. Morgan Securities (Asia Pacific) Limited (CE number AAJ321) is regulated by the Hong Kong Monetary Authority. J.P. Morgan Securities Singapore Private Limited is a member of Singapore Exchange Securities Trading Limited and is regulated by the Monetary Authority of Singapore (“MAS”). J.P. Morgan Securities Asia Private Limited is regulated by the MAS and the Financial Services Agency in Japan. J.P.Morgan Australia Limited (ABN 52 002 888 011) is a licensed securities dealer.
Additional information is available upon request. Information herein is believed to be reliable but JPMorgan does not warrant its completeness or accuracy. Opinions and estimates constitute our judgment and are subject to change without notice. Past performance is not indicative of future results. The investments and strategies discussed here may not be suitable for all investors; if you have any doubts you should consult your investment advisor. The investments discussed may fluctuate in price or value. Changes in rates of exchange may have an adverse effect on the value of investments. This material is not intended as an offer or solicitation for the purchase or sale of any financial instrument. JPMorgan and/or its affiliates and employees may hold a position, may undertake or have already undertaken an own account transaction or act as market maker in the financial instruments of any issuer discussed herein or any related financial instruments, or act as underwriter, placement agent, advisor or lender to such issuer. Clients should contact analysts at and execute transactions through a JPMorgan entity in their home jurisdiction unless governing law permits otherwise. This report should not be distributed to others or replicated in any form without prior consent of JPMorgan. This report has been issued, in the U.K. only to persons of a kind described in Article 19 (5), 38, 47 and 49 of the Financial Services and Markets Act 2000 (Financial Promotion) Order 2001 (all such persons being referred to as “relevant persons”). This document must not be acted on or relied on by persons who are not relevant persons. Any investment or investment activity to which this document relates is only available to relevant persons and will be engaged in only with relevant persons. In other European Economic Area countries, the report has been issued to persons regarded as professional investors (or equivalent) in their home jurisdiction.
JPMorgan uses the following recommendation system: Overweight. Over the next six to twelve months, we expect this bond to outperform the average total return of the bonds in the analyst’s (or analyst’s team’s) coverage universe. Neutral. Over the next six to twelve months, we expect this bond to perform in line with the average total return of the bonds in the analyst’s (or analyst’s team’s) coverage universe. Underweight. Over the next six to twelve months, we expect this bond to underperform the average total return of the bonds in the analyst’s(or analyst’s team’s) coverage universe.
JPMorgan uses the following rating system: Improving (I) The issuer’s long-term credit rating likely improves over the next six to twelve months. Stable (S) The issuer’s long-term credit rating likely remains the same over the next six to twelve months. Deteriorating (D) The issuer’s long-term credit rating likely falls over the next six to twelve months. Deteriorating+ (D+) The issuer’s long-term credit rating likely falls to junk over the next six to twelve months. Defaulting (F) There is some likelihood that the issuer defaults over the next six to twelve months.
This report should not be distributed to others or replicated without prior consent of JPMorgan.
Analyst CertificationThe research analyst(s) denoted by an “AC” on the cover of this report certifies (or, where multiple research analysts are primarilyresponsible for this report, the research analyst denoted by an “AC” on the cover or within the document individually certifies, with respectto each security or issuer that the research analyst covers in this research) that: (1) all of the views expressed in this research accurately reflect my personal views about any and all of the subject securities or issuers; and (2) no part of my compensation was, is, or will be directly or indirectly related to the specific recommendations or views expressed herein.
107