asset allocation: analysis of theory and practice in the
TRANSCRIPT

Asset Allocation:
Analysis of Theory and Practice
in the Australian Investment Management Industry
PhD thesis-in-progress
submitted to the Australasian Finance and Banking Conference
December 2014, Sydney
Lujer Santacruz
MFinPlan, MBusMgt, BScMEng
School of Commerce
Faculty of Business Education Law and Arts
University of Southern Queensland
Toowoomba Queensland 4350 Australia

PhD Thesis – Lujer Santacruz
ii
Table of contents
Abstract ...................................................................................................................................... 1
Chapter 1: Introduction and aims ............................................................................................... 2
1.1 Background ...................................................................................................................... 2
1.2 Research objectives ......................................................................................................... 2
1.3 Main research question .................................................................................................... 3
1.4 Motivation for the research .............................................................................................. 3
1.5 Expected contribution of the research ............................................................................. 3
1.6 Structure of the thesis ...................................................................................................... 5
Chapter 2: Literature review surveying asset allocation theories ............................................... 6
2.1 Modern Portfolio Theory (MPT) ..................................................................................... 6
2.1.1 Historical background ............................................................................................... 6
2.1.2 Markowitz mean-variance model of asset allocation ................................................ 7
2.1.3 Limitations of the Markowitz mean-variance model .............................................. 10
2.2 Modern Portfolio Theory subsequent research strands ................................................. 10
2.2.1 Consideration of additional parameters .................................................................. 10
2.2.2 Measures of risk other than variance of expected returns ....................................... 12
2.2.3 Parameter uncertainty with MPT ............................................................................ 18
2.2.4 Multi-period models ................................................................................................ 23
2.2.5 Non quadratic utility functions ............................................................................... 26
2.2.6 Other asset allocation models ................................................................................. 27
2.2.7 Inclusion of alternative assets in the model ............................................................ 31
2.2.8 Portfolio Separation Theorem and extension of MPT to asset pricing ................... 32
2.2.9 Non finance applications of MPT ........................................................................... 35
Chapter 3: Literature review on asset allocation theory-practice dichotomy ........................... 36
Chapter 4: Research design and methodology ......................................................................... 40
4.1 Dimensions of the proposed research ............................................................................ 40
4.2 Research sub-questions .................................................................................................. 40

PhD Thesis – Lujer Santacruz
iii
4.3 Conceptual model .......................................................................................................... 40
4.3 Research hypotheses ...................................................................................................... 45
4.4 Research instruments ..................................................................................................... 46
4.4.1 Survey research in finance ...................................................................................... 46
4.4.2 Survey structure ...................................................................................................... 47
Chapter 5: Data gathering study number 1 .............................................................................. 48
5.1 Introduction.................................................................................................................... 48
5.2 Research instrument....................................................................................................... 49
5.3 Analysis of respondent profile ....................................................................................... 51
5.4 Results and discussion ................................................................................................... 54
5.5 Summary ........................................................................................................................ 58
Chapter 6: Data gathering study number 2 .............................................................................. 59
6.1 Introduction.................................................................................................................... 59
6.2 Research instrument....................................................................................................... 60
6.3 Analysis of respondent profile ....................................................................................... 61
6.4 Results and discussion ................................................................................................... 61
6.5 Summary ........................................................................................................................ 73
Chapter 7: Data gathering study number 3 (in progress) ........................................................ 75
7.1 Introduction.................................................................................................................... 75
7.2 Research instrument....................................................................................................... 76
7.3 Sample design and data collection ................................................................................. 77
7.4 Data analysis .................................................................................................................. 78
Chapter 8: Conclusions (in progress) ...................................................................................... 80
List of references ...................................................................................................................... 81

PhD Thesis – Lujer Santacruz
1
Abstract
Asset allocation is the decision on how much of the investment portfolio to place in each of
the broad asset classes (e.g. cash, fixed interest securities, property, equities). It is a key
decision area in the investment management industry, where professional investors manage
pooled investments. The present research aims to examine any dichotomy between theory and
practice of asset allocation in the Australian investment management industry. Studying asset
allocation theory and practice in relation to one another may lead to finding ways to improve
both. The present research identifies gaps between theory and practice and the reasons for
their existence and make recommendations that may help reduce the gap. It surveys the
available body of research on Modern Portfolio Theory from the seminal Markowitz mean-
variance formulation to subsequent research strands. The present research utilises a
combination of qualitative and quantitative methods to examine the level of awareness and
usage of asset allocation theories and theory-based methods among investment management
industry practitioners.

PhD Thesis – Lujer Santacruz
2
Chapter 1: Introduction and aims
1.1 Background
An investor’s portfolio is their collection of investment assets. Investors make two levels of
decision in constructing their portfolios namely asset allocation and security selection. “Asset
allocation is the choice among broad asset classes (e.g. cash, fixed interest securities, property,
equities) and the decision on how much of the portfolio to place in each one. Security
selection is the choice of specific securities to hold within each asset class” (Bodie, Kane &
Marcus 2011 p. 36). The present research is about asset allocation although as the literature
review will show, asset allocation studies sometimes actually involve security selection in that
they are allocating the total value of the portfolio among several securities.
The significance of asset allocation on portfolio performance has been established in the
literature. Using US investment data, it was found that around 90 percent of the variability in
returns across time of a typical portfolio is explained by asset allocation (Brinson, Hood &
Beebower 1986). A similar study using data for an Australian fund manager arrived at the
same conclusion (Santacruz 2013). A follow up study to Brinson et al. (1986) found that
around 40 percent of the variation of returns across several portfolios is explained by asset
allocation (Ibbotson & Kaplan 2000). A further study decomposed portfolio return into its
components namely market return, asset allocation returns in excess of the market return and
security selection return in excess of the market return, to control for the pervasive influence
of the market and found the latter two components equally important (Xiong et al. 2010).
There is a wealth of academic literature on the topic of asset allocation for investment
portfolios. Whether this body of theory is being put to practical use in the investment
management industry is not readily apparent. There appears to be a consensus as to what the
challenge of investment theory is in general, and it is putting a rich set of tools into practice,
akin to a “tough engineering problem and not one of new science” (Merton 2003 p. 23).
1.2 Research objectives
The objective of the research is to examine any dichotomy between theory and practice of
asset allocation in the Australian investment management industry. Studying asset allocation
theory and practice in relation to one another may lead to finding ways to improve both. The
research will: (1) identify any gaps between theory and practice and the reasons for their

PhD Thesis – Lujer Santacruz
3
existence, and (2) make recommendations that may help reduce the gap. Aside from
addressing the reasons identified for the existence of any gaps, the recommendations may also
involve suggesting theory-based improvements to asset allocation practices as well as
suggesting possible directions for future research in the area of asset allocation that will make
theory more operationally relevant.
1.3 Main research question
The research addresses the following main question: to what extent are available theories and
theory-based methods of asset allocation being applied to practice in the Australian investment
management industry? Research sub-questions in support of this main research question are
detailed later on in the chapter on Research Design and Methodology.
1.4 Motivation for the research
The motivation for the research is the importance of being able to put the body of theory on
asset allocation to practical use, which importance also applies to other areas of research. The
research may benefit both academe and industry by suggesting ways to help reduce the gap
between theory and practice. A possible result from this is the development of more optimal
asset allocation strategies for institutional investors that will have flow-on benefits for
individual investors as well. Investment industry realities, in turn, can also guide future
research. There could also be implications for finance education in the area of portfolio
construction and management. Furthermore, the research methodology and any conceptual
models developed can be applied in examining similar theory-practice dichotomies in other
areas.
1.5 Expected contribution of the research
The research is expected to contribute to the body of knowledge by specifically studying asset
allocation theory and practice in the Australian context. As the literature review will show,
there are previous similar studies on the theory-practice dichotomy but on other aspects of
finance. The only closely similar study looked at the evidence from Europe, but it was not
based on a comprehensive survey of available asset allocation theories and did not probe the
reasons for the dichotomy. Studying asset allocation theory and practice in the Australian
context clearly fills a gap in the literature.

PhD Thesis – Lujer Santacruz
4
Focusing the study of asset allocation on the Australian investment management environment
will enhance the chances of the research recommendations becoming implementable, aside
from the apparent advantage of access to primary and secondary data. It should also be
pointed out that Australia’s investment management industry is a major player, being the
largest in Asia and the fourth largest in the world, as shown in figure 1.
Figure 1: Size and scale of Australia’s investment management industry (Austrade 2010)
The key drivers in the sustained growth of Australia’s investment management industry are the
country’s universal pension system known as superannuation, a strong insurance sector,
growing high net worth and retail investor sectors and steady economic growth (Austrade
2010). As there are no drastic reversals expected in these drivers, Australia can be expected to
remain a key player. While the research will be focusing on asset allocation practices of
institutional investors, it will effectively be covering individual investors as well because of
the prevailing practice of financial planners recommending to their individual clients the same
model portfolios as those of the institutional investors that they are affiliated with (Santacruz
& Phillips 2009).

PhD Thesis – Lujer Santacruz
5
1.6 Structure of the thesis
Chapter 1 provides an introduction to the thesis in terms of background, research objectives,
main research question, motivation and expected contribution.
Chapter 2 is a literature review surveying extant theories and theory-based methods of asset
allocation. The review plays a major role in the research as the asset allocation theories and
theory-based methods surveyed are also the ones that will be assessed as to whether they are
being applied in practice.
Chapter 3 is a literature review on asset allocation theory-practice dichotomy. It looks at
previous research investigating the dichotomy and identifies any gaps in the literature.
Chapter 4 details the research design and methodology employed including the development
of the conceptual model and also discusses the use of survey methodology in finance research.
Chapter 5 details the results of Study 1 investigating the opinion of academics on the
importance of asset allocation theories and theory-based methods.
Chapter 6 details the results of Study 2 investigating the process of asset allocation in the
investment management industry.
Chapter 7 details the results of Study 3 investigating the level of awareness and usage of asset
allocation theories and theory-based methods among industry practitioners and the reasons
behind these.
Chapter 8 discusses the conclusions of the research.
PhD Thesis – Lujer Santacruz
6
Chapter 2: Literature review surveying asset allocation theories
This section of the thesis provides a comprehensive survey of available asset allocation
theories and theory-based methods. It is more than just background information and will play
a major role in the research as the asset allocation theories and theory-based methods surveyed
are also the ones that will be assessed as to whether they are being applied in practice.
2.1 Modern Portfolio Theory (MPT)
2.1.1 Historical background
The formulation of portfolio asset allocation is an example of decision making under risk and
uncertainty. To fully understand the theory behind it, it is essential to trace the origins of the
theories on risk and uncertainty (Prigent 2007).
The original thinking in the academic community was that decision making is purely based on
an assessment of expected values. However, the so-called St. Petersburg Paradox initially
proposed in a 1713 letter by Nicholas Bernoulli showed that a hypothetical gamble resulting in
a random variable with infinite expected value would nevertheless be considered worth only a
small amount of money (Rubinstein 2006). Daniel Bernoulli in 1738 explained this paradox
by pointing out that the single measure of expected value of a loss or gain in wealth is not
adequate to explain human behaviour. He instead asserted that individuals will seek to
maximise expected utility and suggested a utility function having properties such that the
value of a gain in wealth is inversely proportional to wealth already possessed (Bernoulli
1954). Therefore, individuals with different utility functions and wealth situations cannot use
the same rule to evaluate a gamble, or an investment in general.
Despite the ground breaking insight offered by the work of Bernoulli, there was little attempt
to study the importance of risk and uncertainty on economic decisions for the next 200 years
(Rubinstein 2006). One of the first to suggest that risk and uncertainty play a key role in
economic theory was Frank Knight in his book (Knight 1921). Knight argued that in an
economic system with perfect competition and perfect information, no profit would exist. In
the real world, entrepreneurs would earn profits as a return for their putting up with the
uncertainty about information. Knight’s use of probability theory in his analysis also led him
to the belief that uncertainty could be reduced to a measurable degree through the use of a
PhD Thesis – Lujer Santacruz
7
well-diversified portfolio, foreshadowing the investment theories that would be developed
later on (Stabile 2005).
In their seminal book, von Neumann and Morgenstern succeeded in providing an axiomatic
analysis justifying that rational individuals should make decisions under uncertainty by
maximising their expected utility (Von Neumann & Morgenstern 1947), as originally
suggested by Daniel Bernoulli. Building on this Theory of Expected Utility, the concept of
risk aversion was developed assuming utility as a concave function of wealth, similar to
Bernoulli’s. It was demonstrated that a risk averse agent will avoid a fair gamble, or will
require an inducement to take it, as its expected utility will lie below his concave utility
function (Friedman & Savage 1948).
2.1.2 Markowitz mean-variance model of asset allocation
The papers mentioned in the previous section and some other early works in financial
economics provided the theoretical foundations for the ground breaking paper (Markowitz
1952) that originated the body of theory referred to as Modern Portfolio Theory (MPT). The
Markowitz mean-variance formulation of MPT is the first mathematical exposition of the
concept of diversification of investments although this has always been practiced on an ad hoc
basis (Rubinstein 2006). In his paper which derives from his PhD dissertation, Markowitz
specified two variables relevant to the portfolio asset allocation decision namely expected
portfolio return (now commonly represented by the vertical axis) and expected portfolio risk
which he defined as the variance of expected returns (now commonly represented by the
horizontal axis). He rejected deciding solely on the basis of maximising expected portfolio
return as this will ignore the risk-averse investor’s desire to minimise expected portfolio risk
and will also contradict the pervasiveness of the practice of diversification. Markowitz
showed how the combination of asset classes or securities in a portfolio could minimise
portfolio risk at a given level of expected return or maximise expected return at a given level
of risk, thereby providing the theoretical rationale for diversification.
PhD Thesis – Lujer Santacruz
8
Given a portfolio consisting of 𝑛 assets with 𝑤𝑖 as the fraction of the total portfolio value held
in asset 𝑖 so that ∑ 𝑤𝑖 = 1𝑛𝑖=1 , the portfolio expected return and risk respectively can be
represented as follows:
Equation 1: 𝑟𝑝 = ∑ 𝑤𝑖𝑟𝑖𝑛𝑖=1
Equation 2: 𝜎𝑝2 = ∑ ∑ 𝑤𝑖𝑤𝑗𝜎𝑖𝑗
𝑛𝑗=1
𝑛𝑖=1
where 𝑟𝑖 is the expected return of asset 𝑖 and 𝜎𝑖𝑗 is the covariance of the expected returns of
assets 𝑖 and 𝑗. With equation 1, it is easy to see that the portfolio return is just a simple
weighted average of individual expected asset returns. Portfolio risk, on the other hand, is not
just a simple weighted average of variances of expected returns. Equation 2 implies that what
is important is not just the individual assets’ variances but also their covariances with one
another, thus highlighting the importance of diversification or holding assets with differing
characteristics. The portfolio concept emphasizes that individual assets should not be looked
at in isolation.
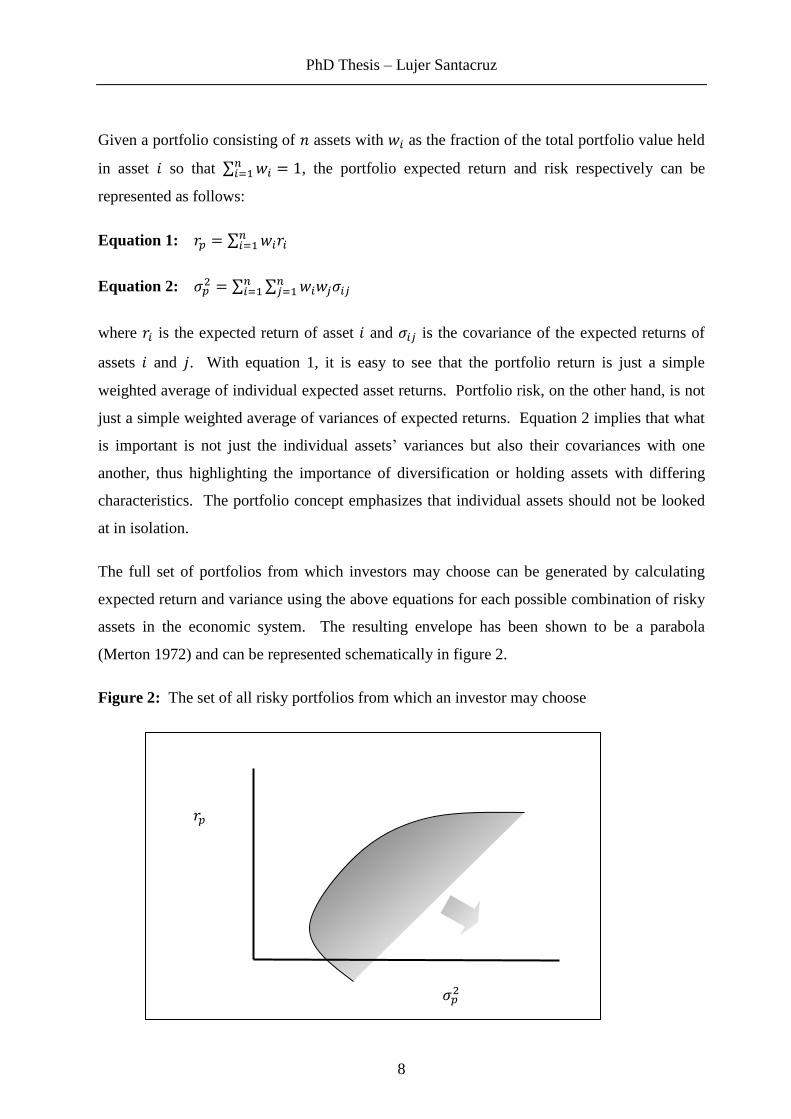
The full set of portfolios from which investors may choose can be generated by calculating
expected return and variance using the above equations for each possible combination of risky
assets in the economic system. The resulting envelope has been shown to be a parabola
(Merton 1972) and can be represented schematically in figure 2.
Figure 2: The set of all risky portfolios from which an investor may choose
𝑟𝑝
𝜎𝑝2

PhD Thesis – Lujer Santacruz
9
Some of the portfolios contained in the choice set are dominated by others. Portfolios that are
located on the northwest rim of the choice set have a higher expected return for each level of
risk (or a lower risk for each level of expected return) than portfolios contained in the interior
of the set. Risk-averse investors seeking to maximise utility as a function of return and risk
will therefore be interested in portfolios that are located as far to the northwest of the choice
set as possible. These portfolios comprise the set of optimal portfolios referred to as the
efficient frontier, as shown in figure 3.
Figure 3: The set of optimal portfolios or the efficient frontier
The efficient frontier can be derived mathematically using quadratic programming, by
maximising 𝑟𝑝 in equation 1 subject to constraining to certain values 𝜎𝑝2 in equation 2 or by
minimising 𝜎𝑝2 subject to constraining to certain values 𝑟𝑝 (Markowitz 1956). This calculation
will also yield the corresponding optimal asset allocation for each value of risk or expected
return. The actual choice of optimal asset allocation on the efficient frontier will then depend
on the acceptable level of risk or the risk tolerance on the part of the investor.
For this and subsequent work on MPT, Markowitz was awarded in 1990 The Sveriges
Riksbank Prize in Economic Sciences in Memory of Alfred Nobel jointly with Merton Miller
and William Sharpe for “pioneering work in the theory of financial economics” (Nobel Prize
2013).
𝑟𝑝
𝜎𝑝2

PhD Thesis – Lujer Santacruz
10
2.1.3 Limitations of the Markowitz mean-variance model
The Markowitz mean-variance formulation of MPT involves assumptions, some explicit and
some implied by subsequent researchers, that have tended to limit its practical application:
1. investors’ utility is a function of mean and variance of returns (i.e. they only seek
return and avoid risk) and therefore portfolios can be constructed based on these two
variables alone
2. expected return is normally distributed
3. risk is measured by the variance of expected returns
4. there is a way to accurately establish ex ante the expected returns and variances of
investment assets as well as the covariances among them
5. the investor’s expected utility is being maximised over a single investment period
6. the investor has a quadratic utility function
Several research strands have developed in MPT literature as a result of attempts to address
perceived shortcomings in the Markowitz model’s above assumptions and empirical test
results (Baker & Filbeck 2013), as well as to extend its application to other areas. These
research strands and some of the prominent associated papers will be discussed individually in
the following section. These papers can be seen as critiques of the original formulation of the
mean-variance optimisation model as well as of each other.
2.2 Modern Portfolio Theory subsequent research strands
2.2.1 Consideration of additional parameters
The search for additional parameters for use in the original mean-variance model has centred
on the non-normal distribution of asset returns contrary to the second listed assumption of the
model. Empirical evidence suggests that asset returns are positively skewed and have heavier
tails than implied by a normal distribution (Fama 1965; Kon 1984; Markowitz & Nilufer 1996;
Peiro 1999). There is also experimental evidence of investor preference for positively skewed
returns (Sortino & Price 1994). In an asset pricing context, skewness was found to be
economically attractive and investors may be willing to accept a negative expected return
accompanied by a high positive skewness (Harvey & Siddique 2000). It should also be noted
that if non-normality of returns is accepted, then variance of returns will be ineffective as the
primary measure of risk (Sheikh & Hongtao 2009).

PhD Thesis – Lujer Santacruz
11
Early work suggested the use of a third moment, skewness of expected returns, in addition to
the original two moments in the asset allocation model which are mean and variance of
expected returns (Arditti & Levy 1975; Jean 1971; Simkowitz & Beedles 1978). It was later
confirmed that including skewness as a parameter improves the mean-variance portfolio
decision (Kane 1982). A mean-absolute deviation-skewness model has been proposed where
the desirable positive skewness can be maximised under constraints on mean and absolute
deviation (Konno, Shirakawa & Yamazaki 1993). Considering the three moments and
allowing short sales, the computation of optimum portfolio weights was found to be possible
in most cases (de Athayde & Flores 2004). Adding skewness, in combination with
asymmetric dependence that recognises greater correlation among assets during market
downturns, yielded economically better portfolio decision than the purely mean-variance
model especially in the absence of short selling constraints (Patton 2004). It has been shown
that return distributions of individual securities and portfolios can be characterised solely by
their means, variances and skewness (Mencia & Sentana 2009). However, it is recognised that
with the presence of skewness, asset allocation will involve competing objectives such as
maximising portfolio expected returns and skewness and minimising portfolio variance. As it
is unlikely to meet all these objectives simultaneously, asset allocation linear programming
could be carried out only after establishing a preference among these objectives (Lai 1991).
Such multi-objective optimisation technique has been generalised in a four-moment
environment and when applied to a European equity database showed consistency with the
mean-variance model (Maillet & Merlin 2009).
A Bayesian framework has been proposed that incorporates higher order moments in the
original mean-variance model. The method was also found to result in higher expected utility
for the investor compared to other methods that do not address parameter uncertainty (Harvey
et al. 2010). Under large departures from a normal return distribution, optimal allocation of
assets is affected and four-moment optimisation strategies are better able to approximate
expected utility (Jondeau & Rockinger 2006). It has also been shown that with the use of a
return distribution model incorporating both kurtosis and skewness based on the extended
Student-t distribution, expected utility maximisers will select portfolios on the mean-variance
efficient frontier (Adcock 2010). Of more direct interest to investors is the finding that
ignoring higher moments of the return distribution can result to portfolio overweighting in
risky securities (Cvitanic, Polimenis & Zapatero 2008).

PhD Thesis – Lujer Santacruz
12
Another approach is to modify the variance and covariance formula to acknowledge the
skewness in expected returns. An example is what the authors refer to as “skewness-aware
deviation” (Low, Pachamanova & Sim 2012). The proposed formula for this yields the
regular variances and covariances when the expected return distribution is perfectly normal.
Computational experiments conducted in the study showed that the proposed parameter results
in more intuitively appealing asset allocation.
One recent book summarises the debate on this topic and the ensuing need for multi-moment
portfolio theories (Jurczenko & Maillet 2006). Multi-moment asset allocation has only
recently become popular among academics primarily because of growing concern for extreme
risks. The book aims to put together previously scattered literature on the topic.
2.2.2 Measures of risk other than variance of expected returns
It has been asserted that defining risk as the variance of expected returns is only justified when
expected returns are normally distributed and when investors have quadratic utility functions,
both of which assumptions do not hold in practice (Feldstein 1969). To address the issue of
non-normality, some have proposed tweaking the original mean-variance model by adding
higher order moments as discussed in the previous section. The other school of thought
involves using an alternative asymmetric parameter to variance that more accurately represents
downside risk. It should be noted that variance is a symmetric measure that incorrectly treats
above average returns just as negatively as below average returns. A more accurate parameter
would focus on downside risk, as investors are primarily concerned with below target returns.
The alternative parameters that have been proposed are semi-variance, lower partial moments
(LPM), value at risk (VAR) and conditional value at risk (CVAR).
Semi-variance
In the monograph follow-up to his seminal paper, Markowitz details the use of semi-variance
instead of variance in his asset allocation model (Markowitz 1959). In this case, excess
returns above average are collapsed to zero so that they do not unnecessarily add to the
variance, yielding intuitively better asset allocation. Semi-variance was shown to be a more
accurate measure of risk not just for asset allocation but also for capital budgeting (Mao
1970b). Although the calculations are more complex than those with the mean-variance
model, a viable method has been demonstrated for generating mean-semivariance efficient

PhD Thesis – Lujer Santacruz
13
portfolios (Hogan & Warren 1972). With the use of a transforming variable, the mean-
semivariance optimisation was also shown to reduce to a classical mean-variance optimisation
problem that can be solved through quadratic programming (Markowitz et al. 1993). Contrary
to some previous assertions, a mathematical proof has been provided showing that mean-
semivariance efficient strategies in a single period are always attainable (Hanqing, Markowitz
& Xun Yu 2006). It should be noted that literature has offered two definitions of semi-
variance namely below mean return semi-variance and below target return semi-variance, with
the latter being more widely used (Nawrocki 1999).
Lower partial moments (LPM)
The semi-variance measure discussed in the previous section belongs to the broader class of
downside risk measures known as Lower Partial Moments or LPM. The seminal papers on
LPM defined risk as the probability weighted function of the deviations below a target return
(Bawa 1975; Fishburn 1977) and focused on LPM’s consistency with the concept of ordering
investments based on stochastic dominance. The computational formula for LPM is as
follows:
Equation 3: 𝐿𝑃𝑀 = 1
𝑘∑ [max (0, �̅� − 𝑟𝑖)]𝑛𝑘
𝑖=1
where 𝑘 is the number of observations, �̅� is the target return, 𝑟𝑖 is the asset return during period
𝑖 and 𝑛 is the degree of the LPM. As the degree 𝑛 is increased, the more the investor becomes
averse to below target returns as a high value of 𝑛 will penalise deviations more than low
values. Below target return semi-variance is a special case of LPM when the degree of the
moment is set to two (Nawrocki 1991).
LPM-optimal portfolios were found to have realised returns with less downside risk exposures
than optimal portfolios determined using variance (Harlow 1991). Experimental study also
showed that investors’ risk perception is closer to the LPM special case of probability of loss
than to variance (Unser 2000). The LPM portfolio optimisation model was found to provide a
different set of asset class weightings compared to traditional models and exhibit a more
efficient frontier (Kong 2006). An empirical study using US investment data showed mean-
LPM optimisation yielding similar portfolio returns as mean-variance models but with the
desirable feature of avoiding extreme allocation to particular assets (Wojt 2010).

PhD Thesis – Lujer Santacruz
14
Value at risk (VAR)
Another definition of risk put forward is the probability of an adverse outcome. Roy
suggested, at around the same time Markowitz published his seminal paper, that one objective
of an investor is to minimise the probability of an adverse outcome and he referred to it as the
Safety-First criterion (Roy 1952). He argued that investors are primarily concerned with
conserving their principal through investment return 𝑟 and would therefore assess investment
risk by the probability of the returns falling below a predetermined level that he referred to as
the disaster level 𝑑. Noting that 𝑟 will have standard deviation 𝑠, the investor can choose the
portfolio with the lowest probability of going below 𝑑 by maximising (𝑟 − 𝑑)/𝑠, or what he
referred to as reward to variability ratio. It has been shown that the Safety-First approach
implies attitudes towards portfolio choices that are consistent with Expected Utility Theory
(Arzac & Bawa 1977). More recently, Roy’s original Safety-First approach has been
improved by using semi-deviation and employing linear programming to construct the
efficient frontier (Norkin & Boyko 2012).
The Safety-First approach served as precursor for the development of another risk measure
referred to as Value at Risk or VAR. Becoming popular in the wake of the series of collapse
of financial institutions during the Global Financial Crisis, VAR measures the potential loss in
value of a portfolio over a specified time horizon given a certain confidence level. For
example, a portfolio with a VAR equal to $10 million for a time horizon of one month given a
confidence level of 95% means the probability that the loss of the portfolio will exceed $10
million in one month is less than 5%. Confidence levels of 95% or 99% are commonly used in
practice.
A static asset allocation model has been proposed which maximizes the expected return
subject to the constraint that the expected loss should meet VAR limits (Campbell, Huisman &
Koedijk 2001). Applying a VAR constraint to the asset allocation problem, it has been shown
that the minimum VAR portfolio is mean-variance efficient and therefore its frontier is a
subset of the mean-variance efficient frontier (Alexander & Baptista 2002), as shown in figure
4. As the figure shows, applying a VAR constraint may result in the exclusion of the
minimum variance portfolio.

PhD Thesis – Lujer Santacruz
15
Figure 4: The mean-variance efficient frontier with a VAR constraint
The mean-VAR optimisation strategy was tested and was found workable even during periods
of severe market instability when returns exhibit significant deviation from normality
assumptions (Consigli 2002). Efficient portfolios constructed using the minimum VAR
strategy were also found to yield performance closer to that expected compared to portfolios
selected using the mean-variance model (Durand, Gould & Maller 2011). Using Genetic
Algorithm to construct the mean-VAR efficient frontier for listed Taiwanese stocks, robust
optimisation results were obtained (Lin & Ko 2009) and it was found that investors might
inefficiently allocate their wealth if the decision was based on the mean-variance model (Tsao
2010).
An improvement in VAR optimisation methodology has been suggested that considers
competing objectives such as higher return and higher risk and uses polynomial goal
programming instead of the conventional linear programming method (Chen 2008). The
earlier static single period models have also been extended to forward looking dynamic
stochastic asset allocation models in line with continuous time models (Atkinson &
Papakokkinou 2005; Rengifo & Rombouts 2004; Wang et al. 2003; Ye & Li 2012).
𝑟𝑝
𝜎𝑝2
VAR
Minimum variance portfolio
VAR feasible region

PhD Thesis – Lujer Santacruz
16
Conditional value at risk (CVAR)
Although VAR is a popular measure of risk in the financial industry, it has mathematical
shortcomings, ignores extreme losses beyond itself and is based on the standard deviation of
normal distributions (Rockafellar & Uryasev 2000). It has also been found that VAR-optimal
portfolios have larger exposure to risky assets than non VAR-optimal portfolios and therefore
would incur larger losses when losses actually occur (Basak & Shapiro 2001). Because of the
shortcomings of VAR, another definition of risk has emerged based on the expectation of a
loss: Conditional Value at Risk or CVAR. Also referred to as Expected Shortfall or ES, it is
based on the conditional expectation of the loss of the portfolio at least exceeding VAR.
Instead of looking at what could probably happen as in VAR, CVAR or ES takes into account
how bad things will go when they actually go bad. This is done by looking at the conditional
expectation and determining the expected loss for a portfolio when the loss is larger than the
VAR threshold value.
Applying a CVAR constraint to the asset allocation problem, it has been shown that the
minimum CVAR portfolio is mean-variance efficient and therefore its frontier is a subset of
the mean-variance efficient frontier (Alexander & Baptista 2004), as shown in the figure 5. As
the figure shows, applying a CVAR constraint will not result in the exclusion of the minimum
variance portfolio.
Figure 5: The mean-variance efficient frontier with a CVAR constraint
𝑟𝑝
𝜎𝑝2
CVAR
Minimum variance portfolio
CVAR feasible region

PhD Thesis – Lujer Santacruz
17
A linear programming technique has been developed to optimise CVAR while simultaneously
calculating VAR, recognising that portfolios with low CVAR would necessarily have low
VAR as well (Rockafellar & Uryasev 2000). An alternative approach has been proposed using
robust optimisation which considers the uncertainty in input parameters by finding a solution
which is feasible for all possible data realizations (Quaranta & Zaffaroni 2008). A non-
parametric estimation methodology to solve the mean-CVAR asset allocation problem has also
been presented (Yao, Li & Lai 2013).
A comparative empirical study found that for the same level of expected return, a mean-
CVAR optimal portfolio has lower risk than the corresponding mean-variance optimal
portfolio (Benbachir, Gaboune & Alaoui 2012). Investments in risky assets are found reduced
when using CVAR (Cheng & Chiung 2012). Using investment data during the credit crunch
period in the US when volatilities were relatively higher, the CVAR method was found to
generate portfolios with lower expected losses compared to the variance and VAR methods
(Ho, Cadle & Theobald 2008).
Other measures of risk
Aside from those previously discussed, other definitions of risk have been put forward. One
characterises it by the risk curve showing every severity level of the potential loss and the
probabilities of these losses occurring. Optimisation is carried out by maximising the
expected return of the portfolio and constraining the risk curve (Huang 2008).
The mean-absolute deviation (MAD) portfolio optimisation model uses the absolute deviation
of returns instead of variance as a measure of risk. Although it is almost a mathematical
equivalent, MAD has computational advantages over variance when it comes to large scale
optimisation problems as it reduces them to a linear programming problem. It has also been
shown that the MAD model is more consistent with maximisation of expected utility (Konno
& Koshizuka 2005).
Most of the risk measures discussed in the previous sections and paragraphs are in agreement
with the assertion that a definition for risk has to take into account another essential
component, exposure, in addition to uncertainty which has been measured with statistics
(Holton 2004). There is subjectivity therefore as risk will depend on an individual’s
perception of uncertainty and exposure. It is acknowledged that there are two classes of risk
measures proposed in investment portfolio literature: dispersion measures of which variance is

PhD Thesis – Lujer Santacruz
18
an example and safety risk measures of which VAR is an example (Fabozzi et al. 2005).
Expounding on this, a paper examined the properties of an ideal risk measure for use in
portfolio theory. Some of the desirable features of investment risk measures identified were:
asymmetry, non-linearity, relativity, multidimensionality, inter-temporal dependence and
recognises the impact of economic factors on investors’ preferences. Given the wide range of
desirable features, it is acknowledged that there is no single risk measure that can cover all the
characteristics (Fabozzi et al. 2008). More importantly, whatever the risk measure utilised, its
time-varying nature needs to be considered (Engle 2004).
2.2.3 Parameter uncertainty with MPT
One major obstacle to widespread industry adoption of the mean-variance model is the fact
that the portfolios generated by this optimisation model are extremely sensitive with a
tendency to amplify the effects of the imprecise input variables namely expected returns,
variances and covariances (Ceria & Stubbs 2006; DeMiguel & Nogales 2009; Goldfarb &
Iyengar 2003). These input variables are supposed to be determined ex ante but in the absence
of other methods are usually estimated ex post using historical data. Because of the model’s
sensitivity to the inputs, the resulting optimal asset allocations often have extreme or
counterintuitive weights for some assets, are unstable, fluctuate substantially over time and
have poor test performance (Fabozzi, Huang & Zhou 2010; Michaud 1989; Tütüncü & Koenig
2004).
Errors in expected returns are found to have the most impact on optimal portfolio return
followed by variances and then covariances (Best & Grauer 1991; Chopra & Ziemba 1993).
Several factor models for predicting asset covariance structure were tested and found not to
have significant effects on optimal asset allocation (Chan, Karceski & Lakonishok 1999).
However, there is an argument that extreme weights even in the absence of estimation errors
are due to some assets dominating the covariance matrix (Green & Hollifield 1992). Related
to this, it has been demonstrated that if investment managers are more productive in generating
historical information for assets more familiar to them (e.g. domestic equities), then these
assets will likely have a lower predictive variance of expected returns and will dominate the
optimal portfolios thereby possibly explaining the equity home bias puzzle (Nocetti 2006).
Similarly, predictability of equity returns arising from widely available information on
PhD Thesis – Lujer Santacruz
19
dividend-price ratios results in higher weighting for equities in a multi-period model
(Campbell, Chan & Viceira 2003).
Uncertainty in input parameters is not the only concern but also the selection of investment
interval (e.g. daily, weekly, monthly) as it is known that variance and skewness increases with
longer intervals. It was found that the choice of investment interval significantly affects the
optimal portfolio weightings (Chang, DuPoyet & Prakash 2008).
The mean-variance model assumes that the covariances among expected returns of assets are
stable, but in reality they fluctuate dramatically. Covariance among asset returns was found to
increase during volatile periods, which ironically reduces the importance of diversification
during periods when it would have been most valued (Jacquier & Marcus 2001). This point
was highlighted during the financial shocks of recent years.
Several approaches have been suggested to address the problem of parameter uncertainty and
these include imposing constraints on asset weights, Bayesian estimation, use of shrinkage
estimators, robust optimisation, portfolio resampling and other methods.
Imposing constraints on asset weights
Small errors in input parameters can result in large changes in the composition of the optimal
portfolio and one suggestion to address this is to impose sensible constraints on the portfolio
asset weights (Chopra 1993; Frost & Savarino 1988). One hindrance though is that an
analytical study found that the proportion of the efficient frontier containing positively
weighted portfolios is small and decreases as the number of assets in the portfolio increases
(Best & Grauer 1992). Nevertheless, imposing non-negativity constraints on asset weights
was found to result in better test-performing portfolios (Jagannathan & Ma 2003).
Bayesian estimation
Another method is Bayesian estimation which involves combining prior beliefs about the
parameters with recent observed values to come up with better estimates of the parameters.
An early work incorporated parameter uncertainty and the accompanying estimation risk into
the portfolio optimisation problem using Bayesian approach (Klein & Bawa 1976). A later
suggested approach is the use of an “all stocks are identical” informative prior that assumes
that all investment assets have identical expected returns, variances and covariances. This

PhD Thesis – Lujer Santacruz
20
reduced estimation error by drawing the posterior parameter estimates toward the averages for
all investment assets in the population and resulted in superior optimal portfolios (Frost &
Savarino 1986). A Bayesian technique was tried for a large-scale portfolio selection problem
where the number of possible portfolios is large relative to the historical data period and found
that portfolios constructed from all equities comprising the Standard and Poor’s Index
outperform the index itself (Polson & Tew 2000). Another modification of the Bayesian
approach considers investor aversion to ambiguity and therefore uses multiple priors that
constrain expected return values within a confidence interval. Resulting portfolios were found
to be more stable over time and deliver better test performance (Garlappi, Uppal & Tan 2007).
A variation of the Bayesian approach is the Black-Litterman model which combines the
subjective views regarding the expected returns of the portfolio assets with the implied views
or the set of expected returns that would make an actual benchmark portfolio mean-variance
optimal. The resulting mixed estimate of expected returns will then result in intuitive
portfolios that have more sensible portfolio weights (Black & Litterman 1991).
Use of shrinkage estimators
Another approach that aims to reduce the impact of input estimation errors is the use of James-
Stein shrinkage estimators (Jobson, Korkie & Ratti 1979). This is based on the assertion that
the best estimate of asset returns is the grand mean of the historical returns on all assets. The
idea behind this technique is that assets considered to belong to the same basket should have
characteristics (returns, variances and covariances) that behave similarly in the long term. The
technique involves shrinking expected returns for assets within the same class toward a global
expected return for that asset class. This need not be applied to the variances and covariances
as studies have shown that their estimation errors do not affect portfolio performance as much
as errors in means (Best & Grauer 1991). It has been found that mean-variance portfolios with
James-Stein adjusted inputs outperformed portfolios with unadjusted inputs (Chopra 1993).
Robust optimisation
Robust portfolio optimisation is a fairly recent development. This approach recognises that
the estimation process for input parameters will not yield point estimates but rather an
uncertainty set which contains the true mean and covariance matrix of asset returns within a
certain level of confidence. A robust portfolio is one that will maximise the worst-case results

PhD Thesis – Lujer Santacruz
21
of all possible values of the mean and covariance matrix within their respective uncertainty
sets (Tütüncü & Koenig 2004). The apparent aim of robust optimisation is to ensure that asset
allocation decisions are adequate even if estimates of the input parameters are inaccurate or in
other words robust to parameter uncertainty (Ceria & Stubbs 2006). A computational method
has been developed that makes the effort comparable to that required for solving convex
quadratic programs (Goldfarb & Iyengar 2003).
Using computational experiments, portfolios generated using robust optimisation were found
to outperform portfolios generated using traditional mean-variance optimisation, generally less
sensitive to input parameters (Ceria & Stubbs 2006) and are more stable over time which
makes it suitable for long term investment strategies (Tütüncü & Koenig 2004).
Similar to a Bayesian approach, another version of robust optimisation involves combining the
distinct views of a finite set of expert advisors, each having a different outlook for expected
returns, variances and covariances. The robust portfolio will be the one that performs best
under the worst case scenarios deriving from the recommendations of the expert advisors.
Simulations show that such robust portfolios are stable and well diversified (Lutgens &
Schotman 2010).
An alternative approach suggested is the use of robust estimators of the input variables in a
minimum variance portfolio model which relies solely on estimates of the covariance matrix
and is therefore less sensitive to input variable estimation errors. Empirical evidence shows
that portfolio asset allocations developed in this manner are less sensitive to departures from
normality of asset returns and are more stable over time than those constructed using a
traditional minimum variance method. The portfolios also perform better out-of-sample than
traditional mean-variance optimal portfolios (DeMiguel & Nogales 2009).
A dissenting view on robust portfolio optimisation has been offered. Empirical calculations
show that robust optimisation methods are equivalent to shrinkage estimators and yield the
same efficient set. This would appear to make the additional computational efforts unjustified
(Scherer 2007).

PhD Thesis – Lujer Santacruz
22
Portfolio resampling
Portfolio resampling is a heuristic method of accounting for estimation errors. It involves
repetitively sampling the historical returns data and generating minimum variance portfolios
for each sample set. The optimal minimum variance portfolio is then defined as having the
average of the portfolio weights of all the simulated minimum variance portfolios (Michaud
1998). Portfolio resampling has been found to result in more diversified portfolios that
outperform traditional mean-variance optimal portfolios (Scherer 2002).
Other methods of addressing parameter uncertainty
A single index model has been proposed which assumes that the returns of assets are related to
each other through individual relationships with an underlying factor. This was more to make
calculation involving large number of assets easier by collapsing the covariance matrix rather
than to address parameter uncertainty (Sharpe 1963). This index has evolved into the measure
β or Beta which is the sensitivity of asset returns relative to the market returns.
Another way to estimate expected returns is by applying the Capital Asset Pricing Model
(CAPM). Optimal portfolios with expected returns estimated based on the CAPM method (to
be discussed in a later section) performed better than optimal portfolios derived using
traditional sample means and using a shrinkage estimator (Jorion 1991).
Serial correlation of returns is another departure from one of the assumptions of asset
allocation models, which is the independence of returns from those of previous periods. This
has been found to be more pronounced for alternative asset classes such as hedge funds and
private equity. Serial correlation would tend to understate risk estimates as it smooths asset
class volatility. Application of Fisher-Geltner-Webb’s unsmoothing methodology has been
suggested to correct this (Sheikh & Hongtao 2009).
It is widely accepted that correlations between asset classes increase during periods of market
stress or volatility. Therefore, assuming linearity of correlations would underestimate joint
negative returns during market downturns. Use of copula method is suggested that would
differentiate between correlations during market stress and during normal periods (Sheikh &
Hongtao 2009). Using a correlation matrix modelled by a suitable copula parameter in a
CVAR minimisation model was found to outperform the traditional minimum variance

PhD Thesis – Lujer Santacruz
23
approach where the asset dependencies are represented by linear correlation coefficients
(Sghaier & Boubaker 2013).
Another method suggested is to create a separate return covariance matrix using outliers as
they provide a better representation of risk during periods of market turbulence. The inside-
sample and outlier-sample covariance matrices can then be blended in a procedure that takes
into consideration the investors’ views about the “quiet” and “turbulent” regimes represented
by these covariance matrices (Chow et al. 1999). Similarly, parsing return projections into
quiet and turbulent regimes has also been suggested. Two sets of optimal portfolios can then
be developed, one for a quiet regime and one or more for a turbulent regime which can be used
as overlay strategies to the former in case of market turbulence (Miccolis & Goodman 2012a).
This is extended further by a study that presented evidence that four regimes, characterised as
crash, slow growth, bull and recovery states are needed to capture asset returns (Guidolin &
Timmermann 2007).
The estimation of the covariance matrix of asset returns for use in mean-variance optimisation
can be improved through shrinkage. This involves calculating the optimally weighted average
of two estimators: the sample covariance matrix and single-index covariance matrix. This is
shown to select portfolios with lower out-of-sample variance (Ledoit & Wolf 2003).
Another approach addressing the shortcomings of batch processing of historical data in
providing the model parameters is online processing of streamed financial data as they come
in. This allows algorithmic or automatic trading of securities and portfolio asset allocation
without human intervention. This approach was found to outperform traditional allocation
techniques in both computational demand and financial performance (Tsagaris, Jasra &
Adams 2012).
2.2.4 Multi-period models
The classical mean-variance model is a single period model and therefore its static risk-reward
criterion is difficult to apply to long term investors who are faced with changing investment
conditions. The single period model is sometimes adapted for multi-period analysis with the
assumption that parameters from period to period are independent of each other, which is not
realistic (Çelikyurt & Özekici 2007).

PhD Thesis – Lujer Santacruz
24
The early works on multi-period asset allocation models are mainly based on expected utility
theory having expected return as the main variable and with not as much emphasis on
variances of returns (Merton 1969; Samuelson 1969). The former offers a continuous time
model while the latter considers discrete time periods, but both suggest a constant allocation
into risky and risk-free assets in the ideal case. Merton’s model proved to be computationally
intractable but an approximate solution based on simplifying assumptions has been offered
(Campbell, Chan & Viceira 2003). Following on from a review of multi-period mean-
variance approach based on scenario trees (Steinbach 2001), a more recent paper offers a
discrete time multi-period model that considers expected return and variance from period to
period described as a Markov chain. Dynamic programming using objective functions that
depend on the expected return and variance of the final portfolio value is then used to
determine optimal portfolios (Çelikyurt & Özekici 2007). Using a stochastic programming
technique, a VAR constraint was found to be workable for a continuous time multi-period
mean-variance model (Ye & Li 2012). A robust multi period portfolio selection model based
on minimising a risk term and maximising the end-of-horizon value has been tested and found
to reduce the variability of the final portfolio value while attaining acceptable end values
(Pınar 2007).
Strategic asset allocation has been suggested as a way to handle the issues with multiple time
periods. By adopting a long-term investment horizon, it is believed that portfolio returns can
be better optimised as mean reversion in the returns of the different asset classes becomes
more evident (Brennan & Schwartz 1997). However, differences in growth rates among the
various asset classes tend to move the portfolio away from the optimal allocation in the case of
a buy and hold approach. It has been shown that even small changes in asset allocation
weights are often statistically significant (Christie 2005). One way to keep the portfolio close
to the efficient frontier in multi-period scenarios is by rebalancing whenever asset weights
deviate from the optimal allocation by more than the pre-set thresholds. This involves
trimming the high growing asset classes and investing the proceeds in the slow growing ones,
which also has the advantage of selling assets high and buying them low (Miccolis &
Goodman 2012b; Perold & Sharpe 1988). Multi-period strategies involving rebalancing has
been found to outperform a buy and hold no-rebalancing strategy (Yu & Lee 2011). However,
there is an observation that current rebalancing practices are characterised by suboptimal
PhD Thesis – Lujer Santacruz
25
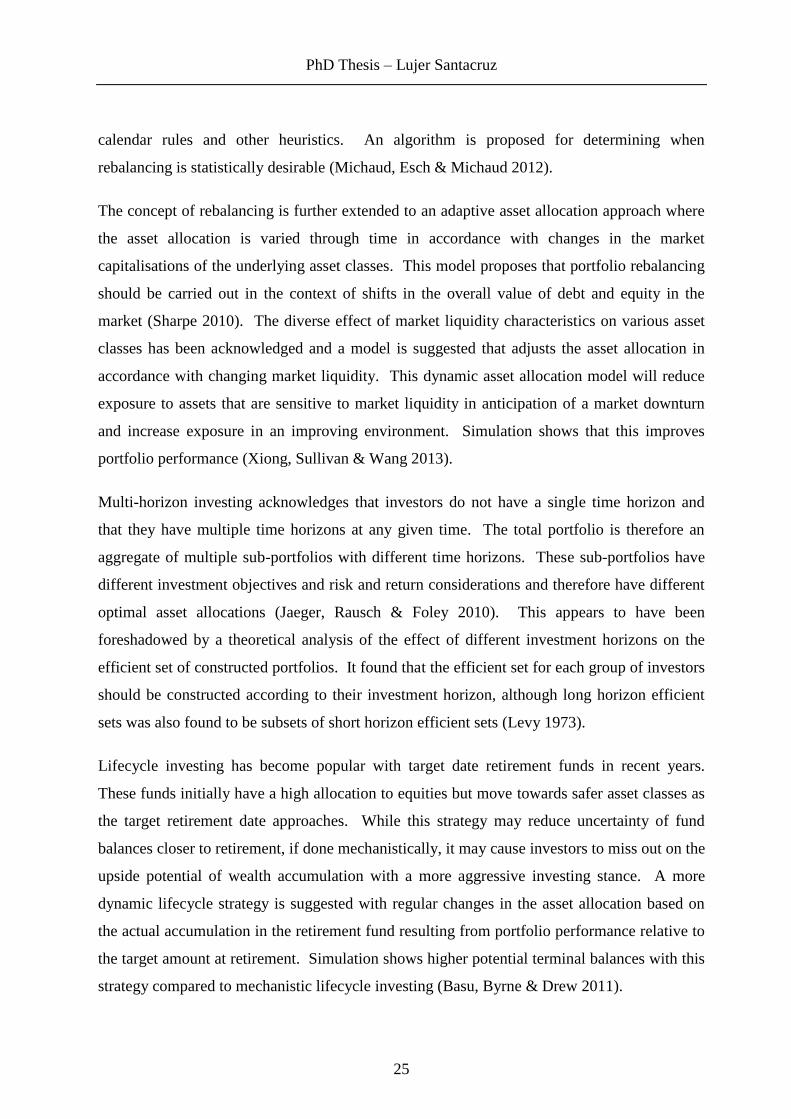
calendar rules and other heuristics. An algorithm is proposed for determining when
rebalancing is statistically desirable (Michaud, Esch & Michaud 2012).
The concept of rebalancing is further extended to an adaptive asset allocation approach where
the asset allocation is varied through time in accordance with changes in the market
capitalisations of the underlying asset classes. This model proposes that portfolio rebalancing
should be carried out in the context of shifts in the overall value of debt and equity in the
market (Sharpe 2010). The diverse effect of market liquidity characteristics on various asset
classes has been acknowledged and a model is suggested that adjusts the asset allocation in
accordance with changing market liquidity. This dynamic asset allocation model will reduce
exposure to assets that are sensitive to market liquidity in anticipation of a market downturn
and increase exposure in an improving environment. Simulation shows that this improves
portfolio performance (Xiong, Sullivan & Wang 2013).
Multi-horizon investing acknowledges that investors do not have a single time horizon and
that they have multiple time horizons at any given time. The total portfolio is therefore an
aggregate of multiple sub-portfolios with different time horizons. These sub-portfolios have
different investment objectives and risk and return considerations and therefore have different
optimal asset allocations (Jaeger, Rausch & Foley 2010). This appears to have been
foreshadowed by a theoretical analysis of the effect of different investment horizons on the
efficient set of constructed portfolios. It found that the efficient set for each group of investors
should be constructed according to their investment horizon, although long horizon efficient
sets was also found to be subsets of short horizon efficient sets (Levy 1973).
Lifecycle investing has become popular with target date retirement funds in recent years.
These funds initially have a high allocation to equities but move towards safer asset classes as
the target retirement date approaches. While this strategy may reduce uncertainty of fund
balances closer to retirement, if done mechanistically, it may cause investors to miss out on the
upside potential of wealth accumulation with a more aggressive investing stance. A more
dynamic lifecycle strategy is suggested with regular changes in the asset allocation based on
the actual accumulation in the retirement fund resulting from portfolio performance relative to
the target amount at retirement. Simulation shows higher potential terminal balances with this
strategy compared to mechanistic lifecycle investing (Basu, Byrne & Drew 2011).

PhD Thesis – Lujer Santacruz
26
2.2.5 Non quadratic utility functions
It is asserted that the mean-variance model is the optimal selection rule only if the investor’s
utility function is quadratic (Tobin 1958). However, the assumption that the investor has a
quadratic utility function is unappealing because it implies increasing absolute and relative
risk aversion (Arrow 1971). Investors with such a utility function would require higher
rewards for investment risk as their wealth increases, which is not consistent with intuition or
common investor behaviour (Harlow 1991). The specific type of investor utility function
would have been irrelevant if expected returns are normally distributed as portfolios
maximising the expected utility of returns will always be located on the efficient frontier, but
it is accepted that returns are not normally distributed (Adcock 2010; Unser 2000).
However, it was also shown empirically that for a finite population of portfolio returns, the
ordering of portfolios by the mean-variance criterion was almost the same as that obtained by
using expected utility regardless of utility function and return distribution (Levy & Markowitz
1979). This was also found true for the case of infinite population of portfolio returns (Kroll,
Levy & Markowitz 1984). An algorithm for the alternative approach of maximising expected
utility in an asset allocation problem has been suggested, which is shown to reduce to the
traditional mean-variance method in the case of quadratic investor utility function (Sharpe
2007). It has also been shown that the use of a return distribution model incorporating both
kurtosis and skewness based on the extended Student-t distribution will have the similar effect
of reducing expected utility maximisation to mean-variance optimisation (Adcock 2010). An
experimental study showed that expected utility optimisation represents a better approximation
of subjects’ preferences compared to mean variance optimisation (Morone 2008).
As investors do not necessarily have quadratic utility functions, traditional mean-variance
optimisation will only approximate the true utility-maximising portfolio. Full-scale
optimisation has been suggested that relies on computer search algorithms to identify the
utility-maximising portfolio given any set of return distribution and any type of investor utility
function. Empirical analysis show that full-scale optimisation yields significantly higher
investor utility compared to traditional mean-variance optimisation (Adler & Kritzman 2007).

PhD Thesis – Lujer Santacruz
27
2.2.6 Other asset allocation models
Around the introduction of MPT, heuristic approaches to asset allocation predominated. An
early work outlined a series of steps based on protocols in the asset allocation process for the
trust section of a bank (Clarkson & Meltzer 1960).
Prospect Theory was offered as an alternative to Expected Utility Theory, on which asset
allocation models are based. Prospect Theory is based on the understanding that investors are
averse to loss and not to risk, as rational belief asserts. Choice is explained by the assignment
of values to gains and losses and considering probabilities rather than basing it on absolute
wealth levels, thereby providing an explanation for behaviour that sometimes contradicts
Expected Utility Theory and rational belief (Kahneman & Tversky 1979). Investors have been
observed to be risk averse in the domain of gains but risk seeking in the domain of losses
(Cremers, Kritzman & Page 2005). An algorithm has been developed to calculate optimal
asset allocations based on Prospect Theory which differed significantly from the optimal
mean-variance portfolio (De Giorgi, Hens & Mayer 2007). However, despite Prospect
Theory’s assumptions being in sharp contradiction to those with mean-variance optimisation,
another study using stochastic dominance rules showed that efficient sets produced by the two
models coincide thereby implying that mean-variance optimisation can be used to construct
Prospect Theory efficient portfolios (Levy & Levy 2004). Cumulative Prospect Theory adds
to the original two propositions of decisions based on change of wealth not total wealth and
loss aversion giving more weight to losses than gains a third proposition that individuals
subjectively reweight probability assessments. While Prospect Theory lends itself to analysis
of simple binary choices of alternatives, Cumulative Prospect Theory has been shown useful
in multi-asset portfolio optimisation (Davies & Satchell 2004).
Stochastic Dominance criterion is another tool used for decision making under risk and
uncertainty. Stochastic Dominance refers to situations where an investment represented by a
return probability distribution is ranked as superior to another investment for the range of
possible outcomes. The Stochastic Dominance criterion is not restrictive as it does not require
a certain investor utility function or a normal distribution of returns. However, there is
currently no method for identifying the stochastically dominant efficient set of all
diversification strategies which was also the conclusion of a much earlier review article (Levy
1992). Towards this end, a series of operational tests have been developed for portfolio

PhD Thesis – Lujer Santacruz
28
efficiency that are based on the general stochastic dominance criterion (Kuosmanen 2004). A
robust approach has also been suggested consisting of maximising the worst case expected
utility of portfolios over all possible distributions. Special conditions have been identified
where this Stochastic Dominance approach reduces the problem to solving a parametric
quadratic program (Popescu 2007).
Another approach offered is factor-based asset allocation as opposed to asset-class-based asset
allocation. This is based on identifying the underlying factors (e.g. risk exposures) that drive
the returns of various asset classes. By analysing these underlying risk exposures, it is
possible to construct a portfolio of asset classes that has a good diversification of risk. The
main limitation of the method is that it still requires making allocations among traditional asset
classes and is therefore dependent on the risk-return characteristics of these asset classes. It
has also been found that, using both an idealized mathematical model and optimisations based
on empirical data, that neither factor-based nor asset-class-based asset allocation is inherently
superior to the other (Idzorek & Kowara 2013). An approach using return-generating factors
instead of underlying risk exposures have also been suggested (Asl & Etula 2012). Another
factor suggested as basis for asset allocation is underlying risk premia or the amount an
investment is expected to earn for bearing investment style risk and strategy risk. Empirical
analysis shows diversification benefits with investing in risk premia primarily because of their
low correlations with traditional asset classes (Bender et al. 2010). Incorporating cross
sectional global market factors with individual security factors have also been shown to
provide diversification benefits, again due to their low correlations with systematic market risk
factors (Clarke, de Silva & Murdock 2005).
Another alternative to the mean-variance method is offered which bases portfolio optimisation
directly on asset characteristics. For instance, an equity has characteristics such as the firm’s
market capitalization, book-to-market ratio or lagged return that are implicitly related to the
mean-variance model inputs (i.e. equity’s expected return, variance and covariance with other
equities). The proposed approach models the portfolio weights in each equity as a direct
function of the equity’s characteristics. The coefficients of this function are determined by
maximizing the average utility the investor would have obtained in implementing the policy
over the historical sample period. This approach addresses previously discussed parameter
uncertainty problems with the mean-variance model (Brandt, Santa-Clara & Valkanov 2009).

PhD Thesis – Lujer Santacruz
29
Risk parity investing advocates diversifying by risk through more investment in low risk assets
relative to high risk assets. Leveraging is then applied to the risk balanced portfolio to
increase both its expected return and its risk to desired levels (Asness, Frazzini & Pedersen
2012).
Another method suggested is gain-loss analysis, particularly when the expected return
deviations from normality are severe as is the case with hedge funds. Here, we wish to know
what we stand to gain if there is a gain and what we stand to lose if there is a loss, with the
reference point being a specified loss threshold (Bernardo & Ledoit 2000), as shown in figure
6. The attractiveness of an investment portfolio is measured by the gain-loss ratio which is the
conditional expected return given gain divided by the conditional expected return given loss.
This measure does not require returns to be normally distributed and captures all of the higher
moments of the expected return distribution (Shadwick & Keating 2002). A study examined
the diversification of hedge funds using gain-loss analysis and found that when deviations
from normality are small, the mean-variance model provides a good approximation to the
more robust gain-loss analysis, but when the deviations from normality are severe there is a
need for gain-loss analysis (Agarwal & Naik 2000).
Figure 6: Gain-loss analysis
Probability
Expected return Loss threshold
Expected
return
given loss Expected
return
given gain

PhD Thesis – Lujer Santacruz
30
A two-phase modified MPT methodology has been suggested involving a first phase where the
mean-variance efficient frontier is determined to provide a number of pre-selected efficient
portfolios and a second phase where the future performance of these portfolios are simulated
as a way to rank them using a multi-criteria performance index. Tested empirically using
equities from the Frankfurt and Vienna stock exchanges, this approach avoids too much
reliance on the predictive ability of input parameter historical data (Ballestero et al. 2007).
Because of the difficulties associated with estimating the mean asset returns, an alternative
approach suggested has been to focus on obtaining the minimum variance portfolio. This
model relies solely on estimates of the covariance matrix and is therefore less sensitive to
input variable estimation errors. Empirical evidence also shows that minimum variance
portfolios usually performs better out-of-sample than mean-variance optimal portfolios (Chan,
Karceski & Lakonishok 1999; Jagannathan & Ma 2003).
Traditional mean-variance optimisation will only approximate the true utility-maximising
portfolio when the utility function is not quadratic and the returns are not normally distributed.
To address this, full-scale optimisation has been suggested that relies on computer search
algorithms to identify the utility-maximising portfolio given any type of investor utility
function and any set of return distribution. (Adler & Kritzman 2007). Under this method, the
portfolio’s utility is calculated for a wide range of asset allocation and given any utility
function and return distribution in order to identify the weights that would maximise expected
utility. Full-scale optimisation yielded significantly higher investor utility compared to
traditional mean-variance optimisation for non-quadratic utility and non-normal return
distributions (Cremers, Kritzman & Page 2005).
Whilst the present research is focused on optimisation strategies, there is also a decision
making strategy in economics where the aim is to meet some acceptability criteria instead of
attempting to find the best option. Referred to as satisficing (blend of satisfy and suffice), it
can also be optimal if the costs of the optimisation process are considered. Its originator
argued that human beings lack the cognitive resources to optimise, and that this “bounded
rationality” approach is more realistic (Simon 1959). An application of this approach in
portfolio construction used returns being above the equity market index as the satisficing
criterion, noting that it is more natural for investors to specify such a criterion as opposed to

PhD Thesis – Lujer Santacruz
31
mean-variance type parameters. Although it allowed easier portfolio construction, it was
outperformed by a parallel CVAR optimisation methodology (Brown & Sim 2009).
2.2.7 Inclusion of alternative assets in the model
Up to this point, the research papers cited have limited their analysis to the traditional asset
classes cash, fixed interest security and equity. Inclusion of other asset classes such as
property, precious metals and derivative instruments in the asset allocation problem involves
additional considerations.
One problem with property portfolios is the large number of assets compared to the available
historical return data. To address this, use of Mean Absolute Deviation that gives less weight
to data outliers instead of standard deviation to characterise risk was tested and found to yield
an acceptable efficient frontier (Byrne & Lee 1997). Use of a Bayes-Stein approach in
addition to a minimum variance strategy show an increased stability in portfolio allocation to
international real estate securities as well as improvements in portfolio performance
(Stevenson 2000). A Bayesian approach using LPM as a measure of risk was also found
useful in constructing optimal property portfolios (Coleman & Mansour 2005). A study found
that the inclusion of both public and private real estate in a mixed-asset portfolio can
substantially improve the mean-variance efficient frontier (Mueller & Mueller 2003).
Portfolios that include residential real estate show a higher expected return for the range of
risk levels than portfolios without it most probably because of the relative stability of property
returns and its low correlation with other asset classes (Peat & Wright 2012).
Using a mean-variance-skewness approach, it was found that precious metals specifically gold
figured prominently in optimal portfolios constructed using various country equity indices
(Lucey, Poti & Tully 2006).
It has been shown using rank dependent expected utility theory that derivative assets have to
be included in portfolios to maximise the expected utility of investors (Prigent 2010). A
theoretical basis for approximating the optimal derivative holding in a portfolio has been
presented (Ilhan, Jonsson & Sircar 2004). An expected return maximising multi-period model
with a VAR constraint has been tested in constructing an optimal portfolio of many options
linked to a single index. Despite the large size of options included, near optimal solutions
were obtained using mixed integer programming (Schyns, Crama & Hübner 2010).

PhD Thesis – Lujer Santacruz
32
Hedge funds have become a popular addition to investment portfolios. However, hedge funds
have return characteristics different from traditional asset classes in that they exhibit return
distributions with significantly non-normal skewness and kurtosis. This renders it unsuitable
for portfolio optimisation using mean-variance optimisation and requires less restrictive
methods such as full-scale optimisation that has been described in a previous section
(Cremers, Kritzman & Page 2005).
Another alternative asset class is what is referred to as equity collars. It involves a
combination of put and call options on an underlying equity to the extent that the minimum
and maximum returns that the collar will provide is known. Zero cost collars can be structured
such that the cost of the put which provides protection against downturns is offset by the
premium revenue generated by the sale of the call. Simulation using empirical data show that
during periods of volatility when asset classes exhibit high correlations, portfolios containing a
zero cost collar in place of debt outperform traditional debt/equity portfolios (D'Antonio &
Johnsen 2011).
Private equity and venture capital are also categorised under alternative investments. Their
relative higher returns in relation to volatility make them attractive for inclusion in optimal
portfolios. However, illiquidity and the finding that they have significant exposure to the
same risk factors that drive equity and bond volatility reduces this attractiveness (Pedersen,
Page & Fei 2014).
2.2.8 Portfolio Separation Theorem and extension of MPT to asset pricing
Adding a risk-free asset to the original MPT formulation transforms the efficient frontier to a
straight line connecting the risk-free return with the tangency portfolio of risky assets on the
original efficient frontier (Tobin 1958), as shown in figure 7. Subsequently referred to as
Portfolio Separation Theorem, it separates the portfolio decision into determining the optimal
subportfolio of risky assets irrespective of the investor’s risk tolerance and then allocating the
investment between this subportfolio and the risk-free asset. An experimental study found that
introduction of a riskless asset to a portfolio of three risky assets did not seem to have the
effect predicted by Portfolio Separation Theorem (Kroll, Levy & Rapoport 1988a). However,
with parameter uncertainty, it has been shown that holding a combination of the tangency

PhD Thesis – Lujer Santacruz
33
portfolio and the risk-free asset is never optimal as an investor can improve the portfolio by
holding some other assets that would reduce the estimation risk (Kan & Zhou 2007).
Figure 7: Portfolio separation theory
This approach was further simplified by determining the risky sub-portfolio using a single
index model which assumes that the returns of assets are related to each other through
individual relationships with an underlying factor (Sharpe 1963). As mentioned earlier, this
made calculations involving large number of assets easier by collapsing the covariance matrix.
This index has evolved into the measure β or Beta which is the sensitivity of asset returns
relative to the market returns. However, the condition under which portfolio separation is
possible was studied and found to be restrictive, with similar requirements on the nature of the
expected utility function as those for mean-variance portfolio optimisation (Cass & Stiglitz
1970).
The Portfolio Separation Theorem was subsequently expanded to cover the pricing of
individual assets. A line can be constructed in the previous figure to show the risk-reward
trade-off, where an investor may obtain a higher expected return from an asset only by
incurring additional risk (Sharpe 1964), as shown in figure 8.
𝑟𝑝
𝜎𝑝2
Risky portfolio Risk-free
asset
New efficient
frontier

PhD Thesis – Lujer Santacruz
34
Figure 8: The risk-reward trade-off
Subsequent papers further developed this concept into what is now known as the Capital Asset
Pricing Model or CAPM (Lintner 1965; Mossin 1966). In the model, the risk measure is
replaced by β and the line is referred to as the Security Market Line, as shown in figure 9.
Figure 9: The Security Market Line
𝐸(𝑟)
𝛽
Risk-free
rate
𝑟
𝜎2
Risky asset
Risk-free
rate

PhD Thesis – Lujer Santacruz
35
CAPM is represented in the following equation:
Equation 4: 𝐸(𝑟) = 𝑟𝑓 + 𝛽[𝐸(𝑟𝑚) − 𝑟𝑓]
where 𝐸(𝑟) is the expected return of the asset, 𝑟𝑓 is the risk-free rate of return and 𝐸(𝑟𝑚) is the
expected return of the market. Asset price is assessed on the basis of how actual returns
compare with expected returns.
2.2.9 Non finance applications of MPT
Modern Portfolio Theory has also found application in areas other than finance and
investments. Some of the published works are shown in table 1, which all involve finding the
optimal allocation into various methodologies of doing things. Although this is not directly
relevant to the present research, it is nevertheless worth noting that MPT is being applied in
other areas. It is also worth noting that all these papers used the classical mean-variance
formulation of MPT in their analysis.
Table 1: Studies applying MPT to other areas
Title of paper Author/s
Applying Modern Portfolio Theory to the analysis of
terrorism
(Phillips 2009)
Water planning in a changing climate: joint application
of cost utility analysis and Modern Portfolio Theory
(Marinoni, Adkins & Hajkowicz
2011)
Comparing water options for irrigation farmers using
Modern Portfolio Theory
(Gaydon et al. 2012)
Using portfolio theory to guide reforestation and
restoration under climate change scenarios
(Crowe & Parker 2008)
The optimal tree species composition for a private forest
enterprise – applying the theory of portfolio selection
(Neuner, Beinhofer & Knoke
2013)
Applying modern portfolio techniques to agriculture (Coleman 2007)

PhD Thesis – Lujer Santacruz
36
Chapter 3: Literature review on asset allocation theory-practice dichotomy
Economics and finance research have been the source of a large number of innovations that
have become widely used in industry and government. Some of these innovations include
marginal analysis, the use of net present value in capital budgeting, peak load pricing,
econometric forecasting, portfolio selection models and the options pricing model. Other
theories did not end up as widely used or still going through the process of adoption which
speed is influenced by the following factors: usefulness in dealing with uncertainties in the
future, competitive pressure to adopt, additional benefits such as signalling, fairness issues in
the case of governmental adoption and capacity to serve ancillary goals. However, even after
adoption, some concepts may be understood imperfectly by users and therefore sub-optimally
employed (Faulhaber & Baumol 1988).
Asset allocation theories may be one of these innovations that have not reached their full
practical potential. Despite the Markowitz mean-variance model’s elegance, mathematical
rigour and intuitive appeal, there appears to be some evidence of contradiction with actual
practice in the investment environment. In an early work, the aggregate market values of the
major asset classes in the US namely common stocks, fixed corporate securities, real estate,
government bonds and municipal bonds were estimated over the years to get a picture of the
total market portfolio (Ibbotson & Fall 1979). Later analysis of the data extended to more
recent times showed that the evident asset allocation was inconsistent with what would have
been recommended by the Markowitz mean-variance model (Baker & Filbeck 2013). Using a
mean-variance model that acknowledges the time varying nature of the covariances of asset
returns improves the model’s fit with US stock market data although Tobin’s portfolio balance
model which relies on the tradeoff between liquidity and forgone interest still showed a better
fit (Engel et al. 1995).
An experimental test where statistically knowledgeable students were asked to construct
portfolios using two risky assets showed a high percentage of mean-variance inefficient
portfolios which did not decrease with practice (Kroll, Levy & Rapoport 1988b), probably
indicating the use of heuristics. One of the common diversification heuristics is the naïve
diversification strategy of assigning equal weights to the assets in the portfolio. An
experimental study on how participants would invest in defined contribution savings plans
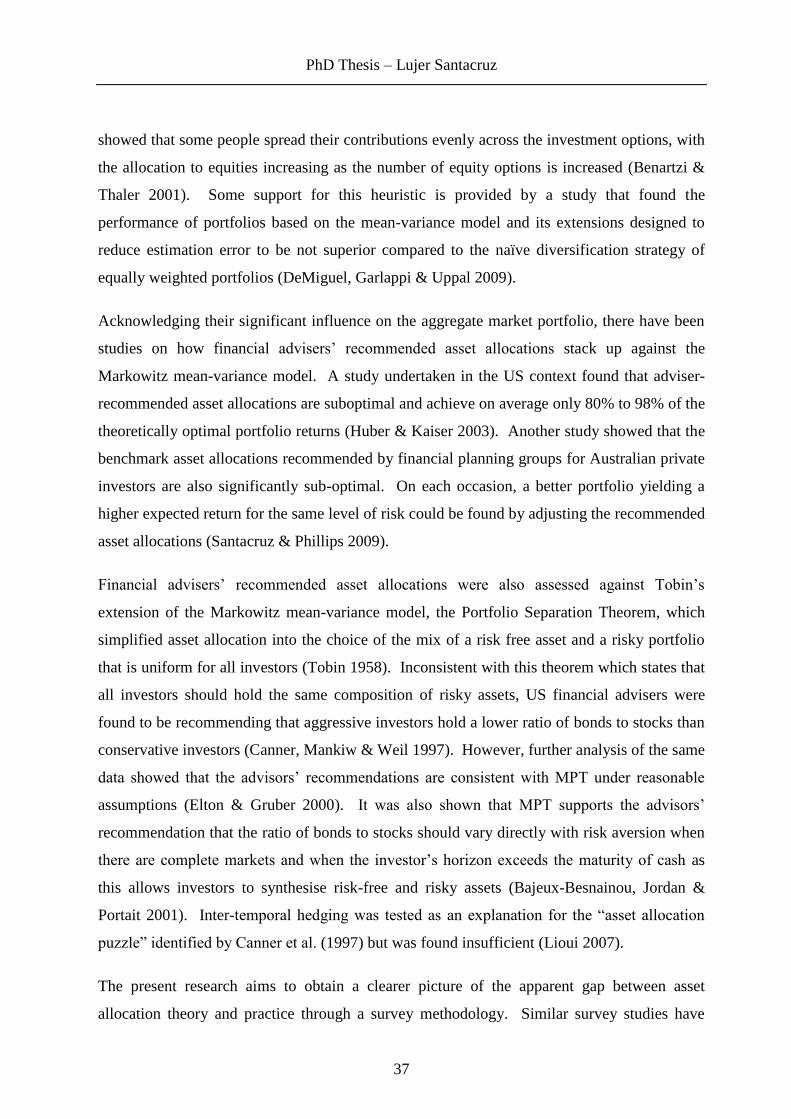
PhD Thesis – Lujer Santacruz
37
showed that some people spread their contributions evenly across the investment options, with
the allocation to equities increasing as the number of equity options is increased (Benartzi &
Thaler 2001). Some support for this heuristic is provided by a study that found the
performance of portfolios based on the mean-variance model and its extensions designed to
reduce estimation error to be not superior compared to the naïve diversification strategy of
equally weighted portfolios (DeMiguel, Garlappi & Uppal 2009).
Acknowledging their significant influence on the aggregate market portfolio, there have been
studies on how financial advisers’ recommended asset allocations stack up against the
Markowitz mean-variance model. A study undertaken in the US context found that adviser-
recommended asset allocations are suboptimal and achieve on average only 80% to 98% of the
theoretically optimal portfolio returns (Huber & Kaiser 2003). Another study showed that the
benchmark asset allocations recommended by financial planning groups for Australian private
investors are also significantly sub-optimal. On each occasion, a better portfolio yielding a
higher expected return for the same level of risk could be found by adjusting the recommended
asset allocations (Santacruz & Phillips 2009).
Financial advisers’ recommended asset allocations were also assessed against Tobin’s
extension of the Markowitz mean-variance model, the Portfolio Separation Theorem, which
simplified asset allocation into the choice of the mix of a risk free asset and a risky portfolio
that is uniform for all investors (Tobin 1958). Inconsistent with this theorem which states that
all investors should hold the same composition of risky assets, US financial advisers were
found to be recommending that aggressive investors hold a lower ratio of bonds to stocks than
conservative investors (Canner, Mankiw & Weil 1997). However, further analysis of the same
data showed that the advisors’ recommendations are consistent with MPT under reasonable
assumptions (Elton & Gruber 2000). It was also shown that MPT supports the advisors’
recommendation that the ratio of bonds to stocks should vary directly with risk aversion when
there are complete markets and when the investor’s horizon exceeds the maturity of cash as
this allows investors to synthesise risk-free and risky assets (Bajeux-Besnainou, Jordan &
Portait 2001). Inter-temporal hedging was tested as an explanation for the “asset allocation
puzzle” identified by Canner et al. (1997) but was found insufficient (Lioui 2007).
The present research aims to obtain a clearer picture of the apparent gap between asset
allocation theory and practice through a survey methodology. Similar survey studies have

PhD Thesis – Lujer Santacruz
38
been done on other areas of finance as shown in table 2. Significant gaps between theory and
practice have been identified and future directions recommended in these studies. However,
the studies are mostly descriptive and did not attempt to examine the reasons for the non-usage
of finance theories in practice. For this reason, and as they covered areas distinct from asset
allocation, a detailed review of these studies was not carried out at this point. However, some
aspects of the methodologies that they employed will be adopted in the present research.
Table 2: Survey studies on theory and practice in various areas of finance
Title of paper Author/s
Distribution of incomes of corporations among
dividends, retained earnings and taxes
(Lintner 1956)
Investment decision under uncertainty: theory and
practice
(Mao & Helliwell 1969)
Survey of capital budgeting theory and practice (Mao 1970a)
The theory and practice of corporate finance:
evidence from the field
(Graham & Harvey 2001)
Initial public offerings: an analysis of theory and
practice
(Brau & Fawcett 2006)
Capital structure policies in Europe: survey evidence (Brounen, de Jong & Koedijk 2006)
Corporate portfolio management: theory and practice (Pidun et al. 2011)
A survey study on the use of general investment theory by fund managers on four continents
found low usage in practice. The reasons cited were lack of availability of data, theory does
not work in practice, preference for a qualitative approach, external constraints and
mechanical use of theory undermining managers’ mystique (Coleman 2013). The study
sought explanation from another paper that paints finance theory as a house without windows,
where the research community acts as if all important insights are already contained within the
existing body of theory and does not attempt to engage with the practitioner environment
(Keasey & Hudson 2007). An earlier survey study among investment analysis managers in the
US also showed low level of usage of theory-based techniques and strategies in securities
analysis and portfolio management, with larger firms having relatively higher usage. No

PhD Thesis – Lujer Santacruz
39
change in usage rate was observed before and after the stock market crash of 1987 (Carter &
Van Auken 1990).
The only previous study identified which is closely similar to the present research is one that
involves a survey of 229 Europe based institutions on their portfolio construction and
performance measurement practices (Amenc, Goltz & Lioui 2011). The study found that
while most investment management practitioners in Europe are aware of the main theories in
portfolio construction, many still resort to ad hoc methods when constructing portfolios. Firm
size was found to be a contributing variable in the use of sophisticated portfolio construction
methods. Respondents were not directly asked their use of specific theories but were asked
instead to choose from lists the method that they used for certain tasks. It may have been for
this reason that the study was not able to shed much light on the role of mean-variance
optimisation in their portfolio construction activities. Furthermore, the study is also mostly
descriptive and did not attempt to examine the reasons for the non-usage of asset allocation
theories in practice. The present research will address these apparent gaps in literature. The
present research involves a more thorough review of MPT and subsequent research strands
and therefore will utilise a more comprehensive questionnaire about industry awareness and
usage of theory and theory-based methods.
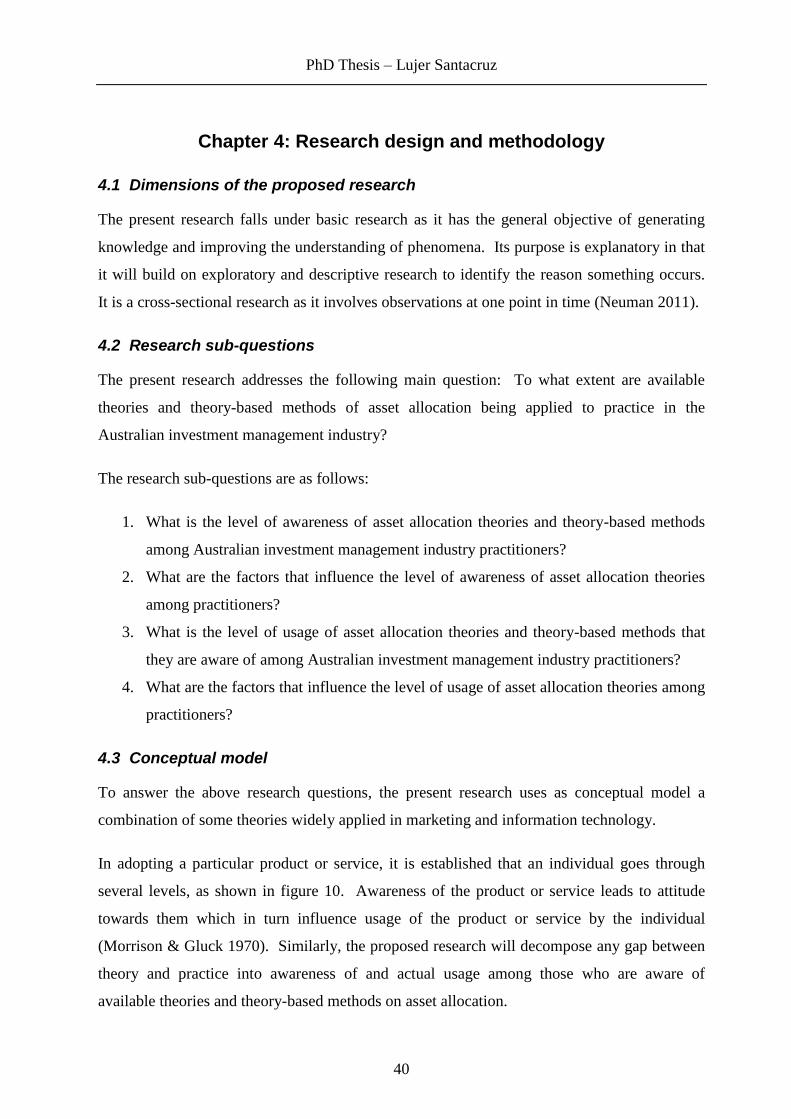
PhD Thesis – Lujer Santacruz
40
Chapter 4: Research design and methodology
4.1 Dimensions of the proposed research
The present research falls under basic research as it has the general objective of generating
knowledge and improving the understanding of phenomena. Its purpose is explanatory in that
it will build on exploratory and descriptive research to identify the reason something occurs.
It is a cross-sectional research as it involves observations at one point in time (Neuman 2011).
4.2 Research sub-questions
The present research addresses the following main question: To what extent are available
theories and theory-based methods of asset allocation being applied to practice in the
Australian investment management industry?
The research sub-questions are as follows:
1. What is the level of awareness of asset allocation theories and theory-based methods
among Australian investment management industry practitioners?
2. What are the factors that influence the level of awareness of asset allocation theories
among practitioners?
3. What is the level of usage of asset allocation theories and theory-based methods that
they are aware of among Australian investment management industry practitioners?
4. What are the factors that influence the level of usage of asset allocation theories among
practitioners?
4.3 Conceptual model
To answer the above research questions, the present research uses as conceptual model a
combination of some theories widely applied in marketing and information technology.
In adopting a particular product or service, it is established that an individual goes through
several levels, as shown in figure 10. Awareness of the product or service leads to attitude
towards them which in turn influence usage of the product or service by the individual
(Morrison & Gluck 1970). Similarly, the proposed research will decompose any gap between
theory and practice into awareness of and actual usage among those who are aware of
available theories and theory-based methods on asset allocation.

PhD Thesis – Lujer Santacruz
41
Figure 10: The Marketing Model
The conversion of attitude developed through awareness into actual usage of available asset
allocation theories will be further analysed using theories commonly used to examine adoption
of an innovation or a new technology. These are the Technology Acceptance Model (TAM)
and the Theory of Planned Behaviour (TPB). While the researcher is not aware of any
previous study applying TAM and TPB to the use of finance theory in practice, it is asserted
that use of an asset allocation theory by a previous non-user is similar to adoption of an
innovation or a new technology as defined in literature.
“Innovation is defined as an idea, practice or object that is perceived as new by an individual
or other unit of adoption, regardless of whether or not an idea is new as measured by the lapse
of time since its first use or discovery. Technology is defined as a design for instrumental
action that reduces the uncertainty in the cause-effect relationship involved in achieving a
desired outcome” (Rogers 2003 p. 12-13). Use of asset allocation can be considered an
innovation as it involves a “change in behaviour of participants in the market or regulatory
arena, acting from self-interest” (Faulhaber & Baumol 1988, p. 597)
TAM posits that an individual’s perception of its usefulness and ease of use influences attitude
and behavioural intent towards volitional adoption of an innovation or a new technology, as
shown in figure 11. Perceived usefulness is defined as the degree to which the individual
believes that adopting an innovation or new technology will enhance his or her job
performance. Perceived ease of use is defined as the degree to which the individual believes
that adopting an innovation or new technology will not require much effort (Davis 1989).
Meta analytic reviews have found TAM to be a robust model for explaining acceptance of new
technology (King & He 2006; Qingxiong Ma & Liping 2004).
Awareness of
product or service Attitude toward
product or service Usage of
product or service

PhD Thesis – Lujer Santacruz
42
Figure 11: The Technology Acceptance Model
TPB posits that an individual’s attitude toward the behaviour, the subjective norm surrounding
the behaviour and perceived behavioural control are determinants of behavioural intention
which in turn drives actual behaviour by the individual, as shown in figure 12. TPB presents a
more complete and general explanation of individual behaviour than that offered by TAM.
Figure 12: The Theory of Planned Behaviour
An individual’s attitude toward the behaviour is defined as the degree to which the person has
a favourable or unfavourable evaluation of the act of carrying out the behaviour. Subjective
norm is defined as the perceived social pressure to carry out or not carry out the behaviour
emanating from an individual’s referent group or peers. Perceived behavioural control is
defined as the degree to which the individual believes they have control over or is able to carry
Attitude toward
the behaviour
Subjective
norm
Perceived
behavioural
control
Behavioural
intention
Actual
behaviour
Perceived
usefulness of
innovation or new
technology
Attitude toward
innovation or new
technology
Behavioural intent
towards adoption
of innovation or
new technology Perceived
ease of use of
innovation or new
technology

PhD Thesis – Lujer Santacruz
43
out the behaviour without impediment. Behavioural intention is defined as the degree to
which the individual is motivated or is willing to carry out the behaviour (Ajzen 1991).
TPB suggests that behavioural intention is the most influential predictor of actual behaviour.
However, intentions may not effectively predict behaviour if the individual does not have
perceived control over the behaviour, hence the dotted line in figure 12. Perceived
behavioural control captures non-motivational factors such as ability, availability of resources,
cooperation of others and perceived absence of impediment in general (Ajzen 1991). Applied
to the case of making socially responsible investments, these impediments could be
institutional, organisational or individual impediments (Juravle & Lewis 2008).
TPB has shown wide application in diverse fields such as purchase prediction, adoption of
innovation or new technology, voting behaviour and other diverse areas. An example in the
area of finance is the use of TPB to explain the decision of individuals to invest in equities,
which was found to be related to attitude, subjective norm and perceived behavioural control
(East 1993). Meta analytic reviews have found TPB to be a robust model for explaining
behaviour (Armitage & Conner 2001; Notani 1998; Sutton 1998). A review article
categorised the criticisms of TPB into insufficient account of social factors, absence of a
construct for past behaviour, clarity of perceived behavioural control construct, affective
factors and moderation and interaction effects among the constructs (Manstead 2011). Other
criticisms of TPB include concerns on the causality between perceived behavioural control
and intention, sufficiency of the constructs in predicting behaviour, lack of distinction between
behavioural intentions and expectations that may not influence behaviour directly and lack of
detail on how intentions are implemented. Notwithstanding these criticisms, TPB was found
to be appropriate in predicting people’s intentions to seek the advice of a financial planner
(Johnson 2003) and other areas as shown by the wealth of literature that employs it as the
conceptual framework. TPB has been utilised to analyse not only individual but
organisational behaviour as well (Chen & Liu 2011; Hsiu-Fen Lin & Lee 2004; Zhang, Yang
& Bi 2013).
In the present research, the elements of TAM has been incorporated into TPB as antecedent
constructs influencing attitude toward the use of asset allocation theories, as was applied in a
study on student usage of online learning tools (Saade, Tan & Kira 2008). However, it has
been found that the relationship between attitude and behavioural intention is insignificant

PhD Thesis – Lujer Santacruz
44
when perceived usefulness and ease of use are considered in the model. These two antecedent
constructs were seen to work directly on behavioural intention and therefore can take the place
of attitude in the model (Venkatesh et al. 2003). In the same spirit, behavioural intention is
subsumed in the proposed model by the resulting four antecedent constructs directly
influencing usage of asset allocation theories and theory-based methods. This is consistent
with the focus of the present research which is on actual usage of theories instead of intended
usage. While meta-analysis has indicated that intentions explain only 28% of the variance in
future behaviour and that therefore the gap between intentions and behaviour is not negligible
(Sheeran 2002), the proposed conceptual model incorporates moderating constructs (e.g.
facilitating conditions) that should have narrowed this gap significantly. The proposed model
as shown in figure 13 has also adopted some of the construct terminologies in the Unified
Theory of Acceptance and Use of Technology (UTAUT) presented in Venkatesh et al. (2003).
Figure 13: The proposed conceptual model
The marketing model has also been incorporated in the proposed conceptual model by
acknowledging that awareness of available asset allocation theories is a pre-requisite to the
operation of the proposed modified TAM/TPB model. Lack of awareness of their availability
would naturally preclude development of perceptions toward the use of asset allocation
Perceived ease
of use
External
influence
Awareness of
available asset
allocation
theories
H4a
H4d
H4c
H4b
Perceived
usefulness
Level of usage of
asset allocation
theories aware of
Facilitating
conditions

PhD Thesis – Lujer Santacruz
45
theories in practice. To be consistent with this, the dependent construct in the proposed model
will be defined as the level of usage of asset allocation theories and theory-based methods that
they are aware of among Australian investment management industry practitioners. This will
be measured directly from the survey results as the percentage of theories and theory-based
methods practitioners are aware of that they are actually using in practice.
It is noted that the above proposed conceptual model may be addressing a current
methodology gap in trying to explain the level of usage of general finance theories in practice.
Extending it further, the model may be used to explain the level of usage of any academic
body of theories in practice.
4.3 Research hypotheses
Research sub-questions 1 and 3, respectively, will be addressed through the following
hypotheses:
H1: There is a low level of awareness of asset allocation theories and theory-based methods
among Australian investment management industry practitioners
H3: There is a low level of usage of asset allocation theories and theory-based methods that
they are aware of among Australian investment management industry practitioners
The instruments used in this research have questions that directly examine the factors
influencing the level of awareness of asset allocation theories among practitioners, thereby
addressing research sub-question 2. Research sub-question 4 is addressed using the proposed
conceptual model. Measures to operationalise the various constructs in the conceptual model
has been sourced from literature and adapted to the case of use of asset allocation theories, in
order to flesh out the factors influencing the level of usage of theories through the following
hypotheses:
H4a: Perceived usefulness has a significant influence on the use of asset allocation theories
H4b: Perceived ease of use has a significant influence on the use of asset allocation theories
H4c: External influence has a significant influence on the use of asset allocation theories
H4d: Facilitating conditions has a significant influence on the use of asset allocation theories

PhD Thesis – Lujer Santacruz
46
4.4 Research instruments
4.4.1 Survey research in finance
A greater number of the research seeking to explain decision making by finance practitioners
utilise empirical methods relying on secondary data such as share prices and financial
statements. However, there is also a significant body of knowledge based on primary data
gathered though surveys and interviews with the decision makers themselves (Neuhauser
2007). Some of these survey-based studies are widely cited such as Lintner (1956) and
Graham and Harvey (2001) that were both mentioned in Chapter 3.
There have been arguments in support of the survey method in finance. It is suggested that
academics should not focus on how practitioners should behave under finance theories but
rather on studying how they actually behave and how (Percival 1993). Towards this end,
finance practitioners should be surveyed more often and the results published as their
preferences are major factors in organisational decision making. This is also one way of
bridging the gap between financial theory and practice (Weaver 1993). Although survey
studies contribute significantly to understanding the state of practice in finance, there are also
limitations that researches should be aware of in over-relying on practitioners’ insight without
proper theoretical underpinning. First, practitioners may not be willing to divulge details of
their actions and the reasons for them. Second, practitioners may not be fully aware of all the
reasons for their organisation’s actions. Third, researchers may be unable to gain access to
practitioners who are significant decision makers in their organisations. Fourth, the constantly
changing nature of financial systems would require frequent updating of surveys which would
not be economical. Finally, interpretation of survey data requires the application of an
appropriate theoretical framework. (Aggarwal 1993). The present research will be aware of
these limitations and will seek to address them during the data gathering process.
The views of editors of finance journals were surveyed regarding survey research. Journals
were found not to have specific policies on publication of survey-based research and they
generally go through the same review process as other types of research such as empirical
studies. Editors appear to view survey research as either equal to or complimentary to other
types of research. Surveys produce data that cannot be obtained from other sources but there
can be difficulties in generalizing results with possible non-response bias. Examination of
journal issues over a 21 year period found that 37% of journals have not published a single

PhD Thesis – Lujer Santacruz
47
survey-based article with an average of around 0.27 survey-based articles per year for those
who have. Editors generally appear receptive to survey-based research as long as they are
carried out with the same rigour as other types of research (Baker & Mukherjee 2006).
The present research utilises a survey methodology as it is the most appropriate way to address
the research questions that have been defined. In doing so, it is cognizant of the possible
shortcomings and aims to address them sufficiently.
4.4.2 Survey structure
The present research involves three data gathering studies. Study 1 obtains the opinion of the
research community through a survey on the relative importance of the various theories and
theory-based methods of asset allocation. Study 2 involves structured interviews of a small
number of investment management industry practitioners to obtain an initial understanding of
their awareness and usage of asset allocation theories and theory-based methods and to obtain
a clear picture of the asset allocation process in financial institutions. Study 1 and study 2
inform the design and implementation of Study 3 which is a quantitative survey that probes
awareness and usage of the asset allocation theories and theory-based methods surveyed in the
literature review among investment management industry practitioners who have a role in
asset allocation decisions. Study 3 directly addresses the research questions stated earlier.
The data gathering studies utilise a combination of qualitative and quantitative methods. Use
of multiple methods to study the same phenomenon under investigation is referred to as
methodological triangulation. It offers the potential to provide a wider and deeper
understanding of the study phenomenon thereby increasing study credibility (Hussein 2009).
In the present research, qualitative methods are used as preliminary inquiries for a quantitative
study and the results from the former are used to inform the instruments used in the latter.
Whilst Study 1 and Study 2 inform the design and administration of the research instrument in
Study 3, there is on a higher level an iterative process among the literature review, research
methodology and data gathering. For instance, the literature review of available theories
initially guided the set of questions asked of academics. In turn, the responses gathered
identified areas of literature that needed to be further discussed.

PhD Thesis – Lujer Santacruz
48
Chapter 5: Data gathering study number 1
5.1 Introduction
Study 1 aims to determine how academics and researchers perceive the importance of various
theories and theory-based methods in making the correct asset allocation decision. The
categorisation of research is based on the literature review of theories and theory-based
methods of asset allocation that has been carried out.
A more quantitative method of assessing the importance of the various theories and theory-
based methods would have been to conduct a meta-analysis of studies that quantify their
impact on optimising asset allocation. A meta-analysis would integrate the findings of these
studies numerically and statistically rather than verbally (Leedy & Ormrod 2005). However, it
would be difficult to do this with the body of asset allocation research as there is a wide range
of methodologies and datasets used and it would not be possible to reduce the rich set of data
to a common denominator. Nevertheless, a meta-analysis of asset allocation theories and
theory-based methods could be a future area of study.
In this study, an email survey was carried out among academics and researchers who have
published papers in the area of asset allocation. The emails were sent out to 208 authors cited
in the literature review of the present research. As the literature review was quite extensive,
the views that can be extracted from this respondent selection set would be fairly
representative of the views of academics that have done research on asset allocation. This is
further reinforced by the relatively high response rate of 20% with 41 respondents.
One might question why only academics that have done research on asset allocation were
surveyed as this might have provided biased results. Ideally, the respondent selection set
should be all academics that are familiar with asset allocation. However, the main
consideration is a good understanding of and not just familiarity with the various theories and
theory-based methods as the study aims to obtain a picture of their relative importance. It is
expected anyway that academics would be naturally biased in favour of theory. It is also
worth noting that most of the published research of the academics surveyed started out as
critiques of the existing body of knowledge and therefore the respondents are not really a
homogeneous set.

PhD Thesis – Lujer Santacruz
49
5.2 Research instrument
Figure 14 below shows the email survey instrument used in this study.
Figure 14: Survey instrument for Study 1
Dear Prof __________,
I am doing a PhD research entitled “Asset Allocation: Analysis of Theory and Practice in the
Australian Investment Management Industry”. The aim of the research is to examine any
dichotomy between theory and practice of asset allocation. Studying asset allocation theory
and practice in relation to one another may lead to finding ways to improve both, which would
be beneficial to academe and industry.
My research involves doing a comprehensive survey of available theories and theory-based
methods of asset allocation, which I have mostly completed and where I cited your paper
entitled “___________________________________________”.
One of the studies I am conducting in my research aims to obtain a general picture of the
importance of this body of knowledge on asset allocation decision from the point of view of
academics. As you have done research work on this area, I would greatly appreciate if you
can put in your informed opinion on the table below which should not take more than 5
minutes and email it back to me. Also, please feel free to indicate on the spaces provided any
theory-based methods that I may have overlooked as well as provide any comments on asset
allocation or this research in general using the bottom box.
Major categories of theory or theory-based method
of asset allocation (with some examples)
How important is each major
category in making the correct
asset allocation decision?
1 - Unimportant
2 - Of little importance
3 - Moderately important
4 - Important
5 - Very important
Markowitz’s original mean-variance optimisation (MVO)
model
Use of additional parameters
- higher moments such as skewness of returns
- Bayesian framework incorporating skewness
- “skewness aware” deviation
- others such as: ____________________
Use of risk measures other than variance
- semivariance
- lower partial moments
- VAR
- conditional VAR
- others such as: ____________________

PhD Thesis – Lujer Santacruz
50
Addressing problems of parameter uncertainty
- imposing weight constraints
- Bayesian estimation
- use of shrinkage estimators
- robust optimisation
- portfolio resampling
- others such as: ____________________
Multi period models
- discrete time multi period models
- continuous time multi period models
- others such as: ____________________
Non-quadratic utility function models
Other (alternative) asset allocation models
- heuristic approach
- qualitative approach backed by simulation
- factor based asset allocation
- risk parity investing
- Prospect Theory based models
- Stochastic Dominance criterion
- gain loss analysis
- inclusion of non traditional asset classes
- Portfolio Separation Theorem
- others such as: ____________________
Please indicate also what you think are the two most important among the given examples of
other asset allocation models above:
(1)
(2)
Other comments on asset allocation or this research in general:
Your email response will be treated confidentially and the resulting PhD paper and journal
publications will not identify the survey respondents. Participation is entirely voluntary and
completion of the survey will be taken as tacit consent to be surveyed. If you decide to take
part and later change your mind, you are free to withdraw from the research at any stage. Any
information already obtained from you will be destroyed.
Should you have any queries regarding this research, you can contact myself as the principal
researcher through my details below. If you have any ethical concerns with how the research
is being conducted or any queries about your rights as a participant please feel free to contact:
Ethics and Research Integrity Officer, Office of Research and Higher Degrees, University of
Southern Queensland, Toowoomba QLD 4350, Ph: 07 4631 2690, Email: [email protected].
Thank you and regards,
Lujer Santacruz
Lecturer and PhD Candidate
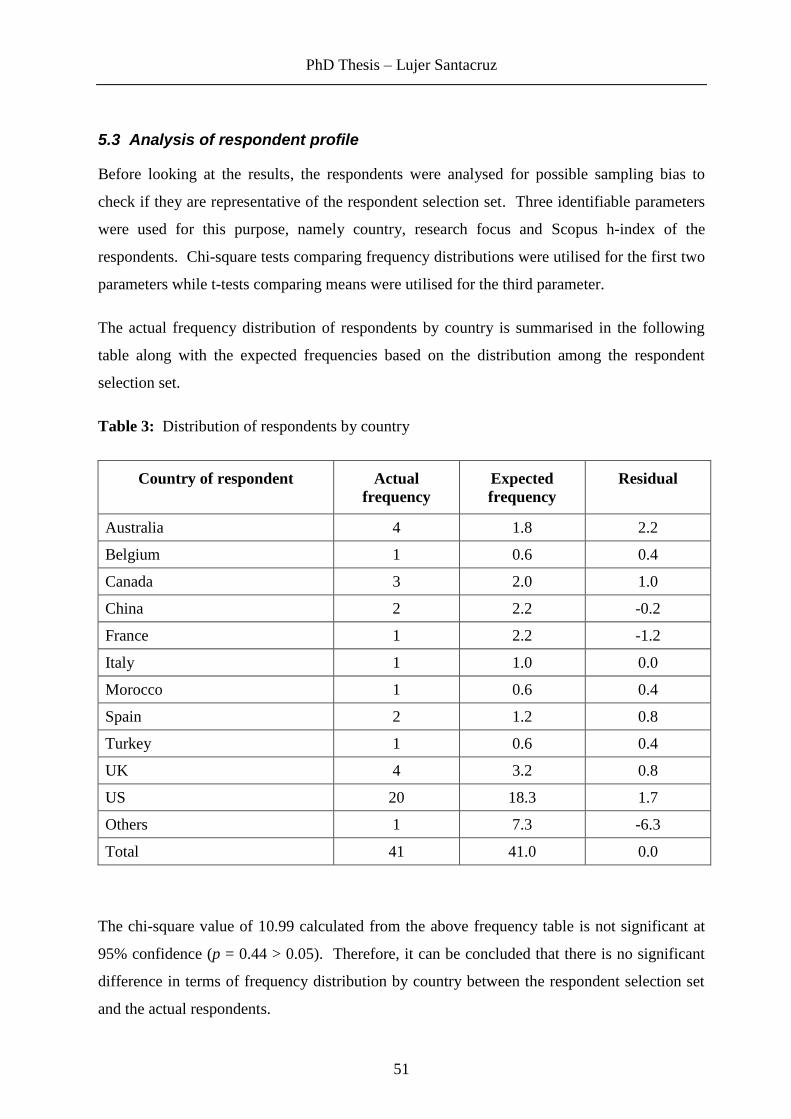
PhD Thesis – Lujer Santacruz
51
5.3 Analysis of respondent profile
Before looking at the results, the respondents were analysed for possible sampling bias to
check if they are representative of the respondent selection set. Three identifiable parameters
were used for this purpose, namely country, research focus and Scopus h-index of the
respondents. Chi-square tests comparing frequency distributions were utilised for the first two
parameters while t-tests comparing means were utilised for the third parameter.
The actual frequency distribution of respondents by country is summarised in the following
table along with the expected frequencies based on the distribution among the respondent
selection set.
Table 3: Distribution of respondents by country
Country of respondent Actual
frequency
Expected
frequency
Residual
Australia 4 1.8 2.2
Belgium 1 0.6 0.4
Canada 3 2.0 1.0
China 2 2.2 -0.2
France 1 2.2 -1.2
Italy 1 1.0 0.0
Morocco 1 0.6 0.4
Spain 2 1.2 0.8
Turkey 1 0.6 0.4
UK 4 3.2 0.8
US 20 18.3 1.7
Others 1 7.3 -6.3
Total 41 41.0 0.0
The chi-square value of 10.99 calculated from the above frequency table is not significant at
95% confidence (p = 0.44 > 0.05). Therefore, it can be concluded that there is no significant
difference in terms of frequency distribution by country between the respondent selection set
and the actual respondents.

PhD Thesis – Lujer Santacruz
52
The actual frequency distribution of respondents by research focus is summarised in the
following table along with the expected frequencies based on the distribution among the
respondent selection set.
Table 4: Distribution of respondents by research focus
Research focus Actual
frequency
Expected
frequency
Residual
General asset allocation research 3 3.6 -0.6
Markowitz’ original mean-variance model 7 2.7 4.3
Use of additional parameters 4 5.3 -1.3
Use of risk measures other than variance 7 10.6 -3.6
Addressing problems of parameter uncertainty 7 7.1 -0.1
Multi period models 4 2.6 1.4
Non quadratic utility function models 3 2.2 0.8
Other asset allocation models 6 6.9 -0.9
Total 41 41.0 0.0
The chi-square value of 9.65 calculated from the above frequency table is not significant at
95% confidence (p = 0.21 > 0.05). Therefore, it can be concluded that there is no significant
difference in terms of frequency distribution by research focus between the respondent
selection set and the actual respondents.
As mentioned, the third parameter is Scopus h-index of the respondents. The h-index attempts
to measure both the quantity and quality of an academic’s published work. The way it is
calculated, an academic with an index of h has published h papers each of which has been
cited in other papers h times (Hirsch 2005). The h-indices used in this study are those sourced
from citation database Scopus. The researcher did a comparison of the h-indeces of those who
responded with those who did not respond to discount the possibility that less prominent
academics are more likely to respond therefore clouding the opinions gathered. However, the
comparison is made only for those who have h-indices available on Scopus.

PhD Thesis – Lujer Santacruz
53
The descriptive statistics are summarised in the following table. It is worth noting that the
London School of Economics found that full professors in the field of economics, which
includes the finance discipline, have an average h-index of 7.60 (LSE 2014).
Table 5: Comparison of h-indices of respondents and non-respondents
n Scopus h-index
available
% Mean Standard
deviation
h-index of respondents 41 33 80% 6.85 5.75
h-index of non-respondents 167 130 78% 7.64 6.64
The proportions having h-index available on Scopus are almost the same for both respondents
and non-respondents. The value for the Levene’s test for equality of variances of 1.74 is not
significant at 95% confidence (p = 0.19 > 0.05). Therefore, there are no significant differences
between the variances of the two groups and the t-test for equality of means can be carried out
with the homogeneous variance assumption (Coakes, Steed & Dzidic 2006). The subsequent
value for the t-test for equality of means of 0.63 is not significant at 95% confidence (p = 0.53
> 0.05). Therefore, it can be concluded that there is no significant difference in terms of
Scopus h-index between the actual respondents and the non-respondents among the respondent
selection set.
To conclude this section, on the basis of the three parameters namely country, research focus
and Scopus h-index of the respondents, there appears to be no sampling bias and therefore the
actual respondents are representative of the respondent selection set. Given the wide coverage
of the literature survey carried out, from which the authors were selected to be part of the
respondent selection set, the results have external validity.
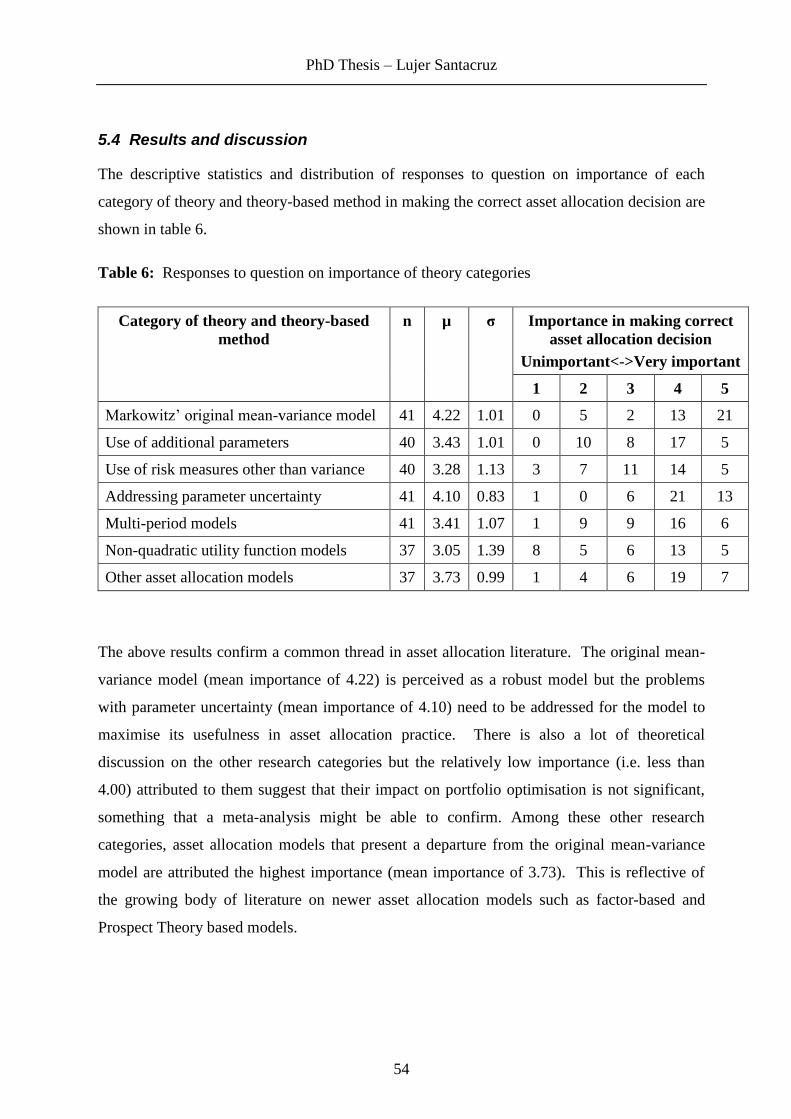
PhD Thesis – Lujer Santacruz
54
5.4 Results and discussion
The descriptive statistics and distribution of responses to question on importance of each
category of theory and theory-based method in making the correct asset allocation decision are
shown in table 6.
Table 6: Responses to question on importance of theory categories
Category of theory and theory-based
method
n µ σ Importance in making correct
asset allocation decision
Unimportant<->Very important
1 2 3 4 5
Markowitz’ original mean-variance model 41 4.22 1.01 0 5 2 13 21
Use of additional parameters 40 3.43 1.01 0 10 8 17 5
Use of risk measures other than variance 40 3.28 1.13 3 7 11 14 5
Addressing parameter uncertainty 41 4.10 0.83 1 0 6 21 13
Multi-period models 41 3.41 1.07 1 9 9 16 6
Non-quadratic utility function models 37 3.05 1.39 8 5 6 13 5
Other asset allocation models 37 3.73 0.99 1 4 6 19 7
The above results confirm a common thread in asset allocation literature. The original mean-
variance model (mean importance of 4.22) is perceived as a robust model but the problems
with parameter uncertainty (mean importance of 4.10) need to be addressed for the model to
maximise its usefulness in asset allocation practice. There is also a lot of theoretical
discussion on the other research categories but the relatively low importance (i.e. less than
4.00) attributed to them suggest that their impact on portfolio optimisation is not significant,
something that a meta-analysis might be able to confirm. Among these other research
categories, asset allocation models that present a departure from the original mean-variance
model are attributed the highest importance (mean importance of 3.73). This is reflective of
the growing body of literature on newer asset allocation models such as factor-based and
Prospect Theory based models.

PhD Thesis – Lujer Santacruz
55
In answering the survey, academics may have a more favourable view of the category where
their research efforts are focused. Possible bias is tested by comparing the views on the
importance in making the correct asset allocation decision of various research categories of
academics whose research is focused on the particular category with those of the rest. The
results are shown in table 7.
Table 7: Testing responses to question on importance of theory categories for bias
Category of theory and theory-based
method
Focus is on
the same
category
Focus is not on
the same
category
1 2 3
n µ σ n µ σ
Markowitz’ original mean-variance model 7 4.71 0.49 34 4.12 1.07 0.10 0.16 no
Use of additional parameters 3 3.67 0.58 36 3.36 1.02 0.10 0.61 no
Use of risk measures other than variance 7 4.29 0.76 33 3.06 1.09 0.33 0.01 yes
Addressing parameter uncertainty 7 4.43 0.79 34 4.03 0.83 0.59 0.25 no
Multi-period models 4 4.75 0.50 37 3.27 1.02 0.06 0.01 yes
Non-quadratic utility function models 3 4.33 0.58 34 2.94 1.39 0.07 0.10 no
Other asset allocation models 5 4.00 0.00 31 3.65 1.05 0.00 0.07 no
1 – p value for Levene’s test for equality of variances (which directs subsequent t-tests),
at 95% confidence, p > 0.05 indicates equality
2 – p value for t-test for equality of means, at 95% confidence, p > 0.05 indicates equality
3 – based on the t-test, are respondents possibly biased in their responses because of their
research focus?
The means are expectedly higher for those whose research focus is on the same category but
the significance will be confirmed through t-tests. For each research category, the variances
are tested for equality using Levene’s test. Subsequent t-tests for equality of means are carried
out based on either a homogeneous or a non-homogeneous variance assumption (Coakes,
Steed & Dzidic 2006). As table 7 shows, there is possible research focus bias in the responses
to two research categories namely ‘use of risk measures others than variance’ and ‘multi-
period models’. However, despite possible bias, the aggregate mean importance of these two
research categories are still the second and third lowest. Therefore, we can accept the data in
table 6 and proceed with the analysis on their basis.

PhD Thesis – Lujer Santacruz
56
The respondents were also asked to name the two most important among other asset allocation
models and provide comments about asset allocation in general. The responses are
summarised in table 8 and table 9.
Table 8: Top mentions among other asset allocation models for Study 1
Other asset allocation models Frequency
Factor-based asset allocation 18
Prospect Theory based models 6
Qualitative approach backed by simulation 5
Heuristic approach 4
Risk parity investing 4
Stochastic Dominance criterion 4
Non-variance risk measures 3
Inclusion of non-traditional asset classes 3
Multi-period models 1
Portfolio separation theorem 1
Gain-loss analysis 1
Bayesian framework 1
Expected utility models 1
Liquidity as a shadow allocation 1
Scenario dependent correlation matrix 1
Equal weighted asset allocation 1
Among other asset allocation models, the factor-based model is the clear front runner as
perceived by academics. It is worth noting that the model is also based on the same principle
as the original mean-variance model which is diversification of risk. As discussed earlier,
instead of attempting to directly measure the risk characteristics of each asset class (e.g. using
variance of returns), this model looks at the underlying factors that drive the various assets and
aims to diversify these optimally. The three next rated models (Prospect Theory, qualitative
with simulation and heuristic approach) share the common principle of acknowledging that
actual investor behaviour may be different from that predicted by theory.

PhD Thesis – Lujer Santacruz
57
Table 9: Comments about asset allocation in general
Analytical modelling of the asset allocation process is an important factor but needs to include the
dynamics of the underlying drivers and consider behavioural impacts.
Very important to treat asset class interdependencies in a manner that is more dynamic than simple
one-dimensional correlation coefficients. I favour copula dependency functions.
Markowitz’s original model is overly simplistic, however it is the breakthrough that introduced
mathematical rigour to asset allocation. In investing, need to remember that this is not a stable system
like other areas of science - assumptions can change and relationships can change. Therefore, (1)
always start with objective qualitative analysis – what is going on in the economy and the markets and
what is coming on the horizon? (2) go back to assumptions made and relationships used and test them
periodically (3) do not get so enamoured with your own quantitative sophistication that you do not
pay proper attention to common sense. The most important part of asset allocation is how to get
return assumptions - this is the area that needs research.
Estimation error is the single most important factor for enhancing investment value. Michaud
resampling is the only technology with provable enhanced value. Bayesian and shrinkage methods are
important in data management but the other issues are all unproven.
Within real estate investments, looking at the economic base industries of cities invested in is very
important as they drive demand for real estate in each city.
Asset allocation is insufficient - need to add sector rotation and security analysis. VAR and CVAR
are worthless as they do not measure risk. Advanced utility theory using both Prospect Theory S-
Shaped and Friedman-Savage-Markowitz Reverse S-Shaped utility functions are important. Use of
upper partial moment instead of the mean is an important development in applying utility theory.
In modelling the dynamics of prices and returns of assets, time series model is needed. Copula is also
a good tool to explain dependencies. Also, high frequency finance seems to be the future.
Multi-period modelling is very important, but not well developed in the literature.
Trending in asset class return is often overlooked and significantly contributes to higher than forecast
risk experience.
I believe that for doing any choice, we should account for the temporal horizon and using the right
definition of returns for that choice. Moreover we should account that any choice has to be done
consistently to a given investor's stochastic dominance criterion.
See several well-known papers about Stein’s lemma to see why Markowitz’s model is so important.
Kurtosis is not generally important as it is often a monotonic function of variance. Non-variance risk
measures may result in some differences but it is unlikely that these will be statistically significantly
different from an equivalent mean-variance optimisation and some of these functions can sometimes
result in a non-convex objective function. Not convinced that continuous time models are that useful
in practice, even though they may be powerful in theory.
The open-ended comments provided reinforce the findings discussed earlier. The original
mean-variance model is still relevant but the inputs to the model need to be refined. The
underlying risk factors also need to be considered as well as actual investor behaviour and
preferences.

PhD Thesis – Lujer Santacruz
58
5.5 Summary
The opinions of a fairly representative respondent set of academics and researchers who have
done research on asset allocation were gathered through an email survey. The original mean-
variance optimisation model was rated important in arriving at the correct asset allocation
decision along with the research category addressing the problems of the model with
parameter uncertainty. Other asset allocation models, which include factor-based asset
allocation, were also rated highly. Possible bias in the responses because of research focus
was analysed and found to be not material as far as the overall results are concerned.
The high importance attributed by academics to asset allocation theory and theory-based
methods indicate the relevance of studying how they are being put to practice and how they
can be put to better use. The importance ratings for each category of theory and theory-based
method of asset allocation will be used as a possible weighting factor in Study number 3,
where the level of awareness and usage of each one by practitioners, will be surveyed.
PhD Thesis – Lujer Santacruz
59
Chapter 6: Data gathering study number 2
6.1 Introduction
Study 2 involves structured interviews with a small number of investment management
industry practitioners who have a role in asset allocation decisions. Respondents were
obtained primarily from among attendees at two industry conferences: Fund Executives
Association Limited National Conference on 8 August 2013 and CFA Society Australia
Investment Conference on 24 October 2013 both in Melbourne. There were a total of 13
interviewees.
The first objective of the interviews is to obtain a clear picture of the asset allocation process
in financial institutions. In the US context (Sharpe 2007 p. 18), the process typically involves
the following steps:
1. Selects desired asset classes and representative benchmark indices.
2. Chooses a representative historical period and obtains returns for the asset classes.
3. Computes historical asset average returns, standard deviations, and correlations.
4. Estimates future expected returns, standard deviations, and correlations. Historical data
are typically used, with possible modifications, for standard deviations and
correlations. Expected returns are often based more on current market conditions
and/or typical relationships in capital markets.
5. Finds several mean-variance-efficient asset mixes for alternative levels of risk
tolerance.
6. Projects future outcomes for the selected asset mixes, often over many years.
7. Presents to the board relevant summary measures of future outcomes for each of the
selected asset mixes.
8. Finally, asks the board to choose, based on its views concerning the relevant measures
of future outcomes, one of the candidate asset mixes to be the asset allocation policy.
As the above steps are for the US context, they will be verified if applicable to the Australian
context during the interviews with practitioners. The research methodology for Study 3 will
then be based on the actual steps in the asset allocation process.
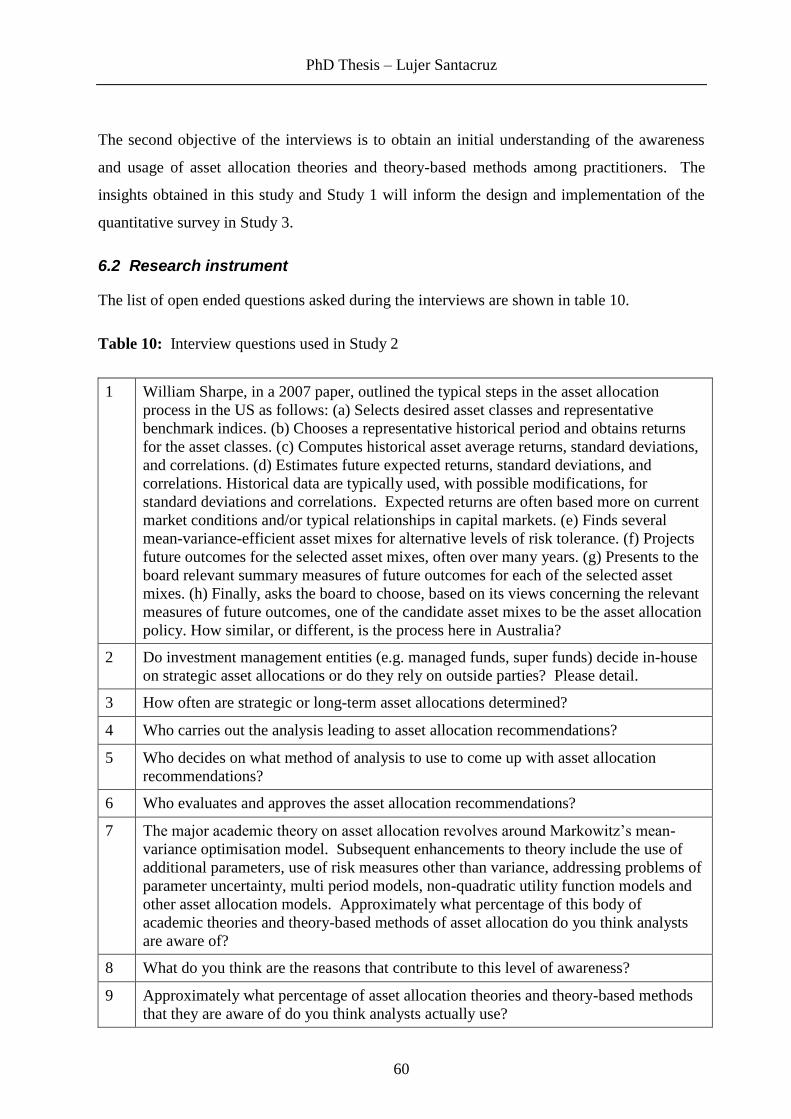
PhD Thesis – Lujer Santacruz
60
The second objective of the interviews is to obtain an initial understanding of the awareness
and usage of asset allocation theories and theory-based methods among practitioners. The
insights obtained in this study and Study 1 will inform the design and implementation of the
quantitative survey in Study 3.
6.2 Research instrument
The list of open ended questions asked during the interviews are shown in table 10.
Table 10: Interview questions used in Study 2
1 William Sharpe, in a 2007 paper, outlined the typical steps in the asset allocation
process in the US as follows: (a) Selects desired asset classes and representative
benchmark indices. (b) Chooses a representative historical period and obtains returns
for the asset classes. (c) Computes historical asset average returns, standard deviations,
and correlations. (d) Estimates future expected returns, standard deviations, and
correlations. Historical data are typically used, with possible modifications, for
standard deviations and correlations. Expected returns are often based more on current
market conditions and/or typical relationships in capital markets. (e) Finds several
mean-variance-efficient asset mixes for alternative levels of risk tolerance. (f) Projects
future outcomes for the selected asset mixes, often over many years. (g) Presents to the
board relevant summary measures of future outcomes for each of the selected asset
mixes. (h) Finally, asks the board to choose, based on its views concerning the relevant
measures of future outcomes, one of the candidate asset mixes to be the asset allocation
policy. How similar, or different, is the process here in Australia?
2 Do investment management entities (e.g. managed funds, super funds) decide in-house
on strategic asset allocations or do they rely on outside parties? Please detail.
3 How often are strategic or long-term asset allocations determined?
4 Who carries out the analysis leading to asset allocation recommendations?
5 Who decides on what method of analysis to use to come up with asset allocation
recommendations?
6 Who evaluates and approves the asset allocation recommendations?
7 The major academic theory on asset allocation revolves around Markowitz’s mean-
variance optimisation model. Subsequent enhancements to theory include the use of
additional parameters, use of risk measures other than variance, addressing problems of
parameter uncertainty, multi period models, non-quadratic utility function models and
other asset allocation models. Approximately what percentage of this body of
academic theories and theory-based methods of asset allocation do you think analysts
are aware of?
8 What do you think are the reasons that contribute to this level of awareness?
9 Approximately what percentage of asset allocation theories and theory-based methods
that they are aware of do you think analysts actually use?

PhD Thesis – Lujer Santacruz
61
10 What do you think are the reasons that contribute to this level of usage?
11 What other questions relevant to my research do you think should I be asking in this
interview?
12 Could you kindly provide your name, email address, job title, qualifications, name of
organisation and nature of business?
6.3 Analysis of respondent profile
The interviewees are fairly representative and range from investment analysts to senior
executives from six superannuation funds, five asset consultants, one non-super managed fund
and one financial planning firm. Superannuation or pension funds manage the retirement
funds of individuals and are major investors in the domestic and global financial markets.
Asset consultants are firms that provide advice on investment strategies, asset allocation and
selection of investment managers to institutional investors such as superannuation fund
trustees and fund managers and therefore serve as gatekeepers between institutional investors
and investment managers (Austrade 2010). Though modest, the number of interviewees is
sufficient for the objectives of Study 2.
6.4 Results and discussion
The interview responses to the various questions are summarised in the following tables. The
first six responses are from superannuation funds (shaded), the next five from asset
consultants, the next one from a non-super managed fund (shaded) and the last one from a
financial planning firm. The responses are presented in their entirety to have a full
appreciation of the answers provided, with a summary after each table.
Table 11: Responses to interview question 1 on the asset allocation process in practice
Sharpe outlines a typical Markowitz mean-variance optimisation (MVO) process. Given that we do
not believe the covariances and mean are stationary and that MVO gives non-sensible portfolios
heavy with unlisted assets due to its Sharpe ratio optimisation, we avoid MVO. Instead, we decide on
an asset allocation and test it using Monte Carlo simulation.
There are a range of theories in applying asset allocation. No one standard is uniformly applied. The
main difference I would identify in the given steps is with the rigidity it suggests in the asset
allocation process. It implies a level of science which, whilst done for informative purposes, in
practice is heavily overlayed with more subjective analysis. Such rigour is typically used in stress
testing various portfolios to identify how they would have performed in historic events. If I had to
isolate a general theme, it would be the focus on historical data in step (c) and then using this as a
basis going forwards. We attempt to generate forward looking return assumptions and to a lesser
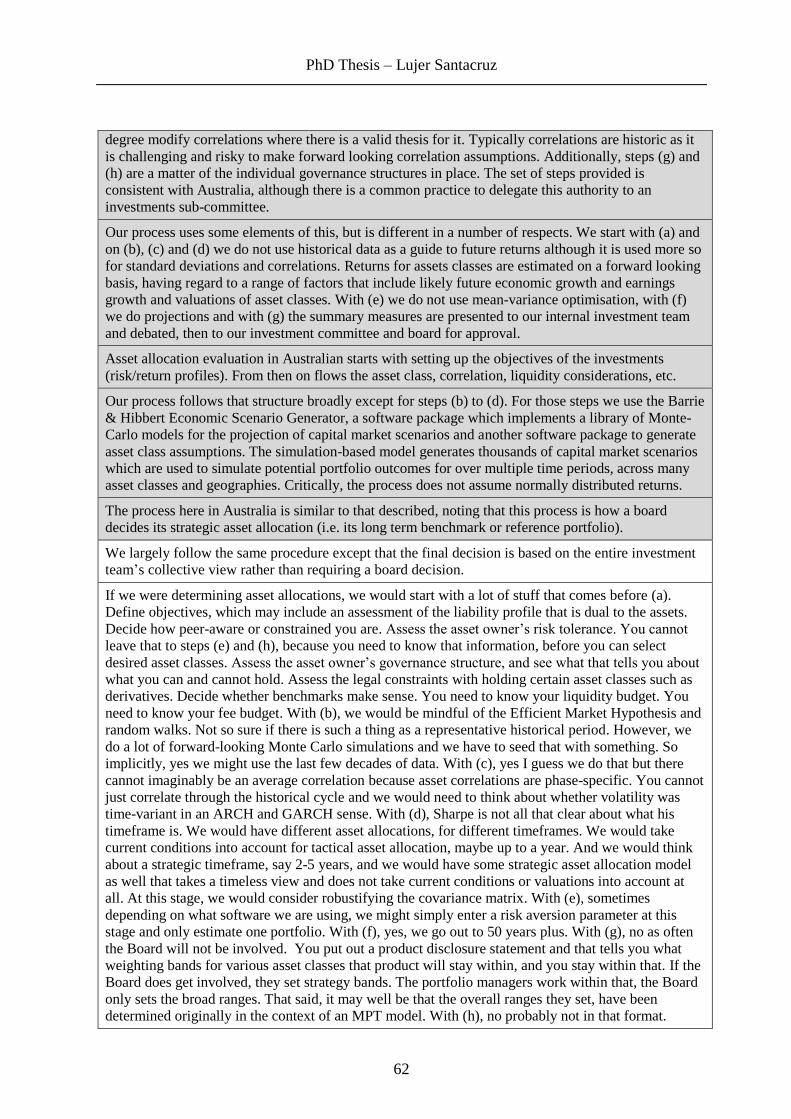
PhD Thesis – Lujer Santacruz
62
degree modify correlations where there is a valid thesis for it. Typically correlations are historic as it
is challenging and risky to make forward looking correlation assumptions. Additionally, steps (g) and
(h) are a matter of the individual governance structures in place. The set of steps provided is
consistent with Australia, although there is a common practice to delegate this authority to an
investments sub-committee.
Our process uses some elements of this, but is different in a number of respects. We start with (a) and
on (b), (c) and (d) we do not use historical data as a guide to future returns although it is used more so
for standard deviations and correlations. Returns for assets classes are estimated on a forward looking
basis, having regard to a range of factors that include likely future economic growth and earnings
growth and valuations of asset classes. With (e) we do not use mean-variance optimisation, with (f)
we do projections and with (g) the summary measures are presented to our internal investment team
and debated, then to our investment committee and board for approval.
Asset allocation evaluation in Australian starts with setting up the objectives of the investments
(risk/return profiles). From then on flows the asset class, correlation, liquidity considerations, etc.
Our process follows that structure broadly except for steps (b) to (d). For those steps we use the Barrie
& Hibbert Economic Scenario Generator, a software package which implements a library of Monte-
Carlo models for the projection of capital market scenarios and another software package to generate
asset class assumptions. The simulation-based model generates thousands of capital market scenarios
which are used to simulate potential portfolio outcomes for over multiple time periods, across many
asset classes and geographies. Critically, the process does not assume normally distributed returns.
The process here in Australia is similar to that described, noting that this process is how a board
decides its strategic asset allocation (i.e. its long term benchmark or reference portfolio).
We largely follow the same procedure except that the final decision is based on the entire investment
team’s collective view rather than requiring a board decision.
If we were determining asset allocations, we would start with a lot of stuff that comes before (a).
Define objectives, which may include an assessment of the liability profile that is dual to the assets.
Decide how peer-aware or constrained you are. Assess the asset owner’s risk tolerance. You cannot
leave that to steps (e) and (h), because you need to know that information, before you can select
desired asset classes. Assess the asset owner’s governance structure, and see what that tells you about
what you can and cannot hold. Assess the legal constraints with holding certain asset classes such as
derivatives. Decide whether benchmarks make sense. You need to know your liquidity budget. You
need to know your fee budget. With (b), we would be mindful of the Efficient Market Hypothesis and
random walks. Not so sure if there is such a thing as a representative historical period. However, we
do a lot of forward-looking Monte Carlo simulations and we have to seed that with something. So
implicitly, yes we might use the last few decades of data. With (c), yes I guess we do that but there
cannot imaginably be an average correlation because asset correlations are phase-specific. You cannot
just correlate through the historical cycle and we would need to think about whether volatility was
time-variant in an ARCH and GARCH sense. With (d), Sharpe is not all that clear about what his
timeframe is. We would have different asset allocations, for different timeframes. We would take
current conditions into account for tactical asset allocation, maybe up to a year. And we would think
about a strategic timeframe, say 2-5 years, and we would have some strategic asset allocation model
as well that takes a timeless view and does not take current conditions or valuations into account at
all. At this stage, we would consider robustifying the covariance matrix. With (e), sometimes
depending on what software we are using, we might simply enter a risk aversion parameter at this
stage and only estimate one portfolio. With (f), yes, we go out to 50 years plus. With (g), no as often
the Board will not be involved. You put out a product disclosure statement and that tells you what
weighting bands for various asset classes that product will stay within, and you stay within that. If the
Board does get involved, they set strategy bands. The portfolio managers work within that, the Board
only sets the broad ranges. That said, it may well be that the overall ranges they set, have been
determined originally in the context of an MPT model. With (h), no probably not in that format.

PhD Thesis – Lujer Santacruz
63
The process is similar to what has been described, with a tracking error overlay (i.e. let us not be too
different from everyone else).
The process is very similar to what has been described.
Somewhat similar, but the optimisation implied in (e) is rarely done, or if done not taken seriously.
Steps (f) to (h) are done at the investment team level, Boards are not given a set of different candidate
strategies to choose from.
It is very similar.
Of limited relevance. To construct 8 starting point balanced portfolios, we use projected returns
(which flow from a common long term assumption for nominal GDP growth), projected standard
deviations (where history is a guide) and historic correlations. Each private client adviser will use one
of these portfolios as a starting point after assessing a client’s investment objectives and then tailor the
asset allocation.
Investment management firms that use mean-variance optimisation generally follow a similar
process, but rely less on historical data and instead generate forward looking return and
variance assumptions. If ever historical data is used, it would be for generating correlation
matrices but with market adjustments incorporated. Some superannuation funds that do not
carry out mean-variance optimisation decide on an asset allocation and then simulate future
results. The asset allocation process generally starts with the additional step of setting out risk
and return objectives for investors. Also, in addition to strategic asset allocation, there are
additional levels such as tactical asset allocation which consider market developments.
Instead of Boards, investment teams generally make the decisions and this has particular
relevance in determining the target respondents for the survey in Study number 3.
Table 12: Responses to interview question 2 on whether asset allocation is decided in-house
or by outside parties
Typically superannuation funds are supported by an asset consultant (e.g. Mercer, Russell, Jana,
Frontier) to support the asset allocation process. The extent to how much the consultant determines
asset allocation is each fund's decision, but tends to be inversely correlated to the number of internal
staff.
Different approaches are used, often depending on the scale of the funds being managed. We utilise
the expertise of a specialist asset consultant as part of all investment decisions relating to asset
allocation and manager/investment selection. The asset consultant works closely with the internal
team and will typically do most of the in-depth quantitative analysis.
We mainly decide in-house but use some input from asset consultants (e.g. Jana, Frontier).

PhD Thesis – Lujer Santacruz
64
Strategic asset allocation is decided in-house, but rely on outside parties such as asset consultants for
recommendations and discussions.
We decide in-house. We don't have a strategic asset allocation as such. We have a Reference Portfolio
which is an easily implemented, low cost portfolio of assets that is expected to deliver the Board's
return and risk expectations. Separate from the Reference Portfolio, we run the Target Portfolio which
introduces other assets with better beta and active strategies with alpha.
As a superannuation fund, the Board is responsible for the strategic asset allocation decision, noting
that external expertise and consultants are used in the complete asset allocation process.
I cannot speak for all other houses, but we determine our own in-house asset allocation as we see this
as a repeatable source of alpha generation.
It varies. There would be lots of examples of each. Increasingly, asset owners and large
superannuation funds are doing this themselves. But historically, asset consultants have been the
outside parties doing that strategic asset allocation modelling.
Combination of both. Managed funds use own analysis but superannuation funds more often guided
by asset consultants.
Outside consultants and/or external research is almost always used.
Depends on size and resources. Large industry funds and large retail houses generally do the work
internally. Maybe an asset consultant is involved. Small to mid-sized funds rely on asset consultants.
Not really applicable to us but in-house if we need to respond.
We provide top-down strategic asset allocation benchmarks and a tactical overlay. Our advisers take
this guidance and apply it to individual client circumstances.
Superannuation funds rely on analytical inputs from asset consultants to make decisions on
strategic asset allocation. Asset consultants, by the nature of their business, have their own
investment analysts. Non-super managed funds may decide based on their own analysis. The
wide range of decision makers as far as asset allocation is concerned indicates a need to be
exhaustive in identifying target respondents for Study number 3.
Table 13: Responses to interview question 3 on how often asset allocation is determined
For us, quarterly.
Again, depends on the fund. Typically asset allocations are set, then reviewed on a quarterly or annual
basis. Our regulator requires at least annual review. Depending on the fund, asset allocations are
rarely changed in a wholesale way, they might be modified to adjust for perceived discrepancies in
markets on a risk adjusted basis.
We reset strategic allocations annually, and make adjustment to long-term plans using any new
insights.
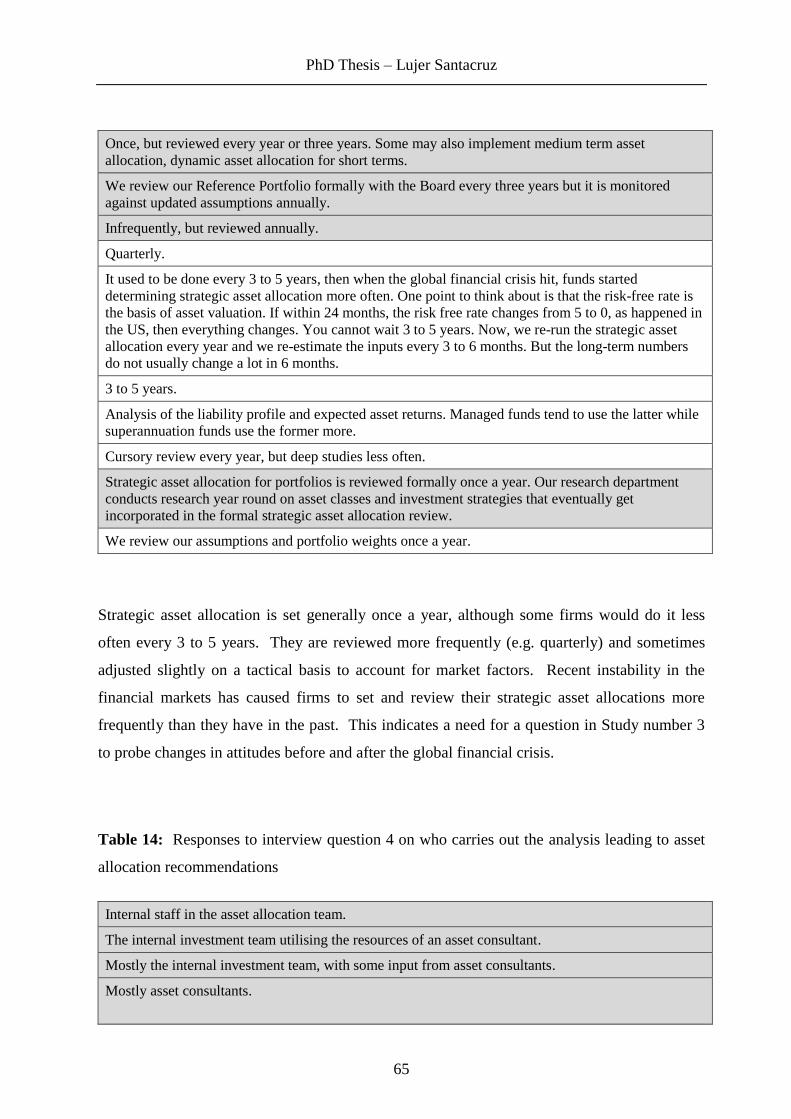
PhD Thesis – Lujer Santacruz
65
Once, but reviewed every year or three years. Some may also implement medium term asset
allocation, dynamic asset allocation for short terms.
We review our Reference Portfolio formally with the Board every three years but it is monitored
against updated assumptions annually.
Infrequently, but reviewed annually.
Quarterly.
It used to be done every 3 to 5 years, then when the global financial crisis hit, funds started
determining strategic asset allocation more often. One point to think about is that the risk-free rate is
the basis of asset valuation. If within 24 months, the risk free rate changes from 5 to 0, as happened in
the US, then everything changes. You cannot wait 3 to 5 years. Now, we re-run the strategic asset
allocation every year and we re-estimate the inputs every 3 to 6 months. But the long-term numbers
do not usually change a lot in 6 months.
3 to 5 years.
Analysis of the liability profile and expected asset returns. Managed funds tend to use the latter while
superannuation funds use the former more.
Cursory review every year, but deep studies less often.
Strategic asset allocation for portfolios is reviewed formally once a year. Our research department
conducts research year round on asset classes and investment strategies that eventually get
incorporated in the formal strategic asset allocation review.
We review our assumptions and portfolio weights once a year.
Strategic asset allocation is set generally once a year, although some firms would do it less
often every 3 to 5 years. They are reviewed more frequently (e.g. quarterly) and sometimes
adjusted slightly on a tactical basis to account for market factors. Recent instability in the
financial markets has caused firms to set and review their strategic asset allocations more
frequently than they have in the past. This indicates a need for a question in Study number 3
to probe changes in attitudes before and after the global financial crisis.
Table 14: Responses to interview question 4 on who carries out the analysis leading to asset
allocation recommendations
Internal staff in the asset allocation team.
The internal investment team utilising the resources of an asset consultant.
Mostly the internal investment team, with some input from asset consultants.
Mostly asset consultants.
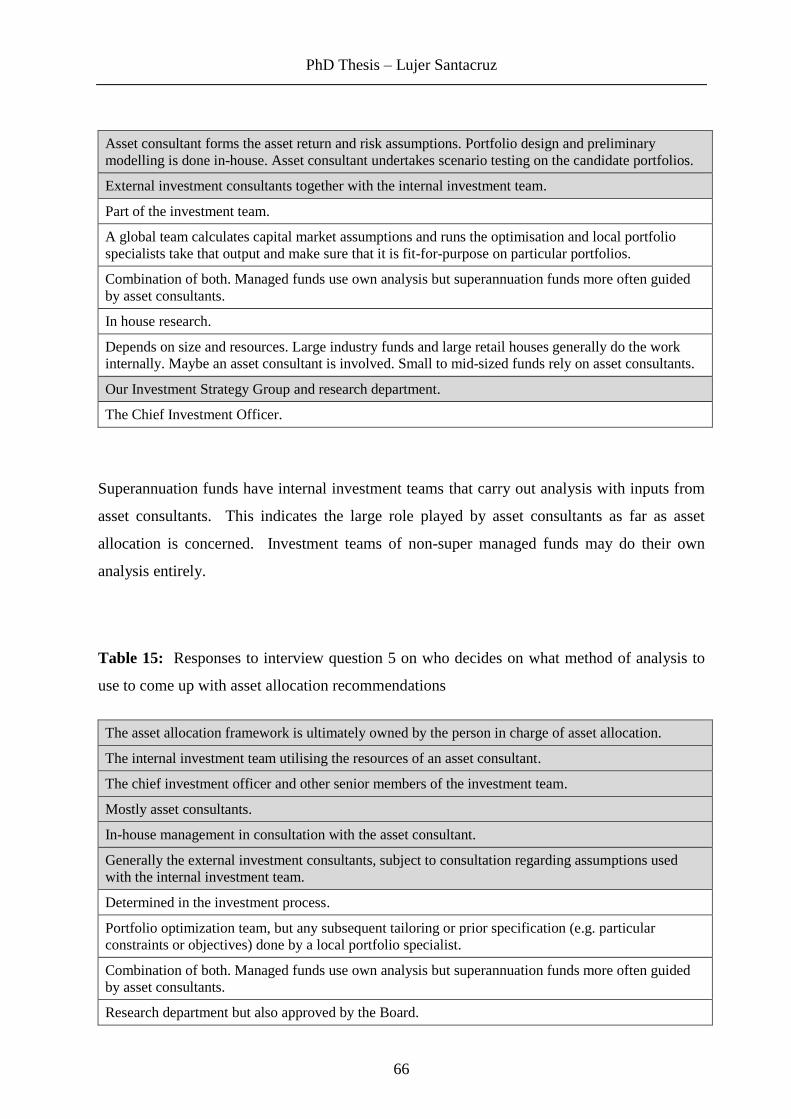
PhD Thesis – Lujer Santacruz
66
Asset consultant forms the asset return and risk assumptions. Portfolio design and preliminary
modelling is done in-house. Asset consultant undertakes scenario testing on the candidate portfolios.
External investment consultants together with the internal investment team.
Part of the investment team.
A global team calculates capital market assumptions and runs the optimisation and local portfolio
specialists take that output and make sure that it is fit-for-purpose on particular portfolios.
Combination of both. Managed funds use own analysis but superannuation funds more often guided
by asset consultants.
In house research.
Depends on size and resources. Large industry funds and large retail houses generally do the work
internally. Maybe an asset consultant is involved. Small to mid-sized funds rely on asset consultants.
Our Investment Strategy Group and research department.
The Chief Investment Officer.
Superannuation funds have internal investment teams that carry out analysis with inputs from
asset consultants. This indicates the large role played by asset consultants as far as asset
allocation is concerned. Investment teams of non-super managed funds may do their own
analysis entirely.
Table 15: Responses to interview question 5 on who decides on what method of analysis to
use to come up with asset allocation recommendations
The asset allocation framework is ultimately owned by the person in charge of asset allocation.
The internal investment team utilising the resources of an asset consultant.
The chief investment officer and other senior members of the investment team.
Mostly asset consultants.
In-house management in consultation with the asset consultant.
Generally the external investment consultants, subject to consultation regarding assumptions used
with the internal investment team.
Determined in the investment process.
Portfolio optimization team, but any subsequent tailoring or prior specification (e.g. particular
constraints or objectives) done by a local portfolio specialist.
Combination of both. Managed funds use own analysis but superannuation funds more often guided
by asset consultants.
Research department but also approved by the Board.

PhD Thesis – Lujer Santacruz
67
Whoever is doing the analysis.
Senior investment analysts and principals in the investment strategy group.
The Chief Investment Officer.
The investment team or senior analyst decides on the method of analysis to use, with inputs
from asset consultants. Financial analysts significantly influence the choice of methods used.
Table 16: Responses to interview question 6 on who evaluates and approves the asset
allocation recommendations
The Chief Investment Officer. We operate under a structure where the trustees approve a strategy and
we have the discretion to move within the limits of that strategy (e.g. +/- 5% asset allocation tilts).
A three pillar structure exists where there is peer review between the internal investment team and the
asset consultant. The results are ultimately approved by the Investment Committee or Board.
Our internal investment committee and investment committee.
Investment committee evaluates, the Board approves.
The Board.
Trustee board.
The investment team as a collective body.
Peer review, asset owner, trustee boards.
Evaluate - no one, approve asset allocation - committee or Board.
Usually external consultants are used.
Board in the case of industry superannuation funds. Investment team and senior management in the
case of retail investment houses.
Senior leaders and the global strategic asset allocation committee.
The Chief Investment Officer, but ultimately the execution lies with the adviser and client.
An investment committee, senior executive or Board approves the strategic asset allocation
recommendations by internal financial analysts and/or external asset consultants.
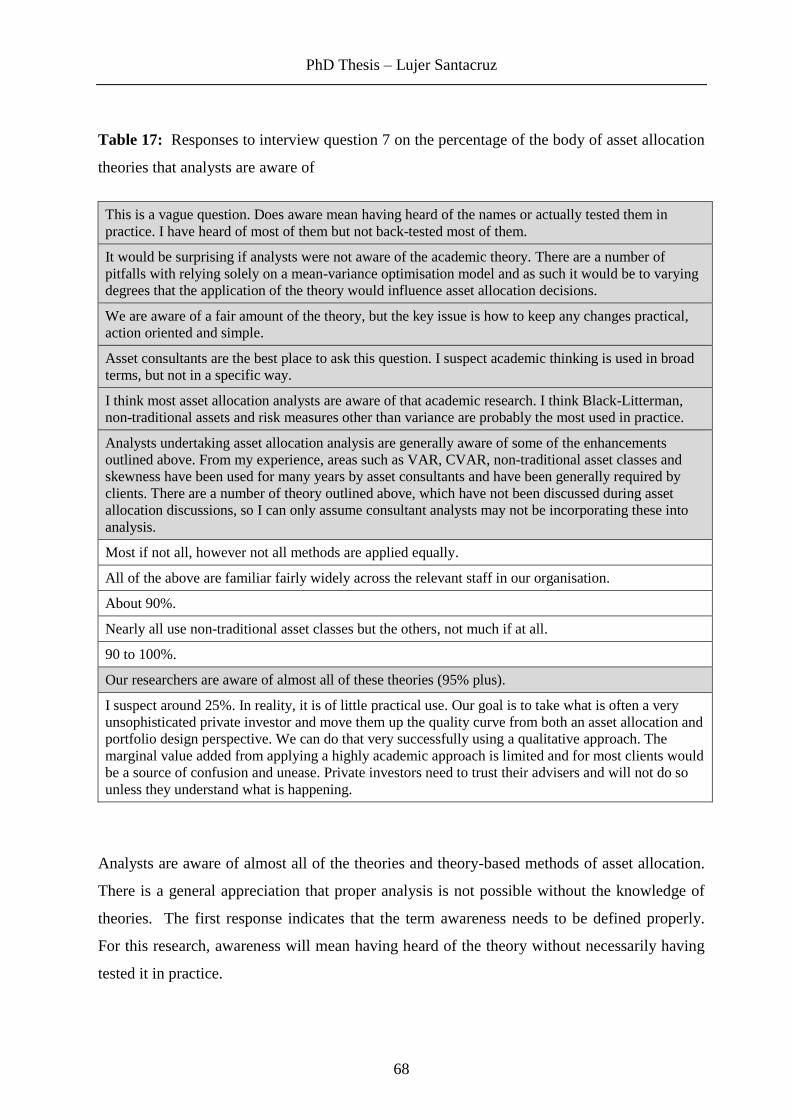
PhD Thesis – Lujer Santacruz
68
Table 17: Responses to interview question 7 on the percentage of the body of asset allocation
theories that analysts are aware of
This is a vague question. Does aware mean having heard of the names or actually tested them in
practice. I have heard of most of them but not back-tested most of them.
It would be surprising if analysts were not aware of the academic theory. There are a number of
pitfalls with relying solely on a mean-variance optimisation model and as such it would be to varying
degrees that the application of the theory would influence asset allocation decisions.
We are aware of a fair amount of the theory, but the key issue is how to keep any changes practical,
action oriented and simple.
Asset consultants are the best place to ask this question. I suspect academic thinking is used in broad
terms, but not in a specific way.
I think most asset allocation analysts are aware of that academic research. I think Black-Litterman,
non-traditional assets and risk measures other than variance are probably the most used in practice.
Analysts undertaking asset allocation analysis are generally aware of some of the enhancements
outlined above. From my experience, areas such as VAR, CVAR, non-traditional asset classes and
skewness have been used for many years by asset consultants and have been generally required by
clients. There are a number of theory outlined above, which have not been discussed during asset
allocation discussions, so I can only assume consultant analysts may not be incorporating these into
analysis.
Most if not all, however not all methods are applied equally.
All of the above are familiar fairly widely across the relevant staff in our organisation.
About 90%.
Nearly all use non-traditional asset classes but the others, not much if at all.
90 to 100%.
Our researchers are aware of almost all of these theories (95% plus).
I suspect around 25%. In reality, it is of little practical use. Our goal is to take what is often a very
unsophisticated private investor and move them up the quality curve from both an asset allocation and
portfolio design perspective. We can do that very successfully using a qualitative approach. The
marginal value added from applying a highly academic approach is limited and for most clients would
be a source of confusion and unease. Private investors need to trust their advisers and will not do so
unless they understand what is happening.
Analysts are aware of almost all of the theories and theory-based methods of asset allocation.
There is a general appreciation that proper analysis is not possible without the knowledge of
theories. The first response indicates that the term awareness needs to be defined properly.
For this research, awareness will mean having heard of the theory without necessarily having
tested it in practice.
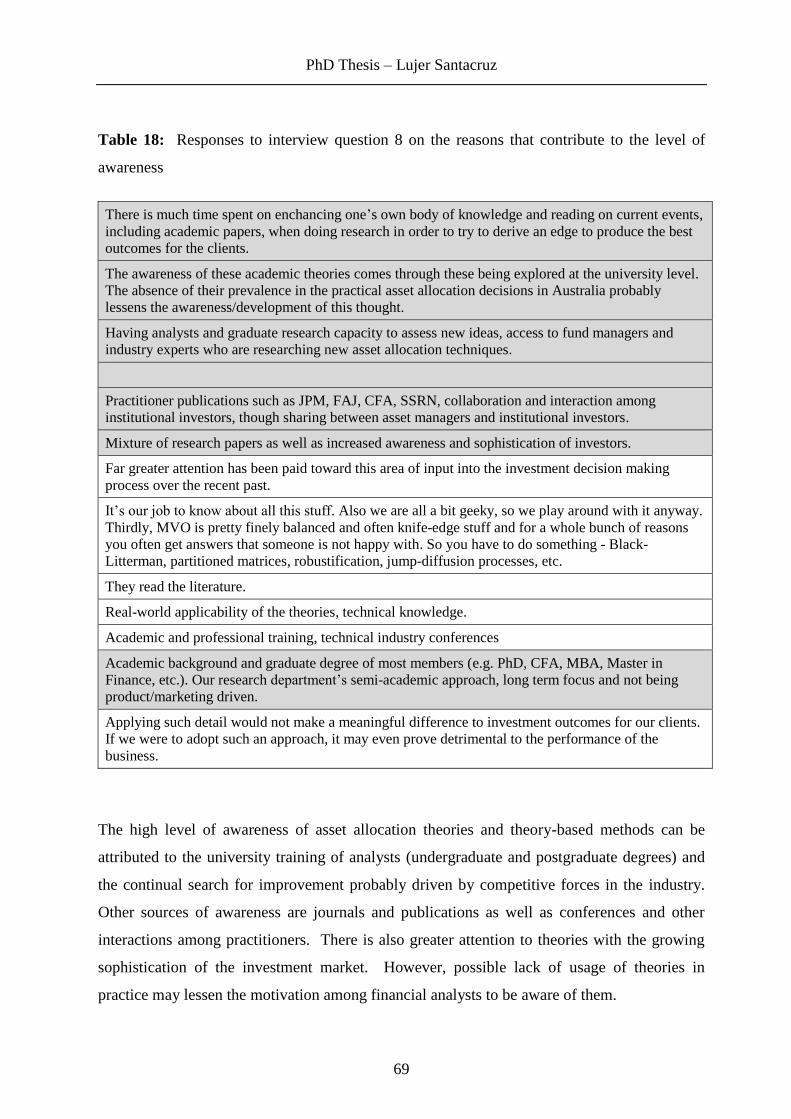
PhD Thesis – Lujer Santacruz
69
Table 18: Responses to interview question 8 on the reasons that contribute to the level of
awareness
There is much time spent on enchancing one’s own body of knowledge and reading on current events,
including academic papers, when doing research in order to try to derive an edge to produce the best
outcomes for the clients.
The awareness of these academic theories comes through these being explored at the university level.
The absence of their prevalence in the practical asset allocation decisions in Australia probably
lessens the awareness/development of this thought.
Having analysts and graduate research capacity to assess new ideas, access to fund managers and
industry experts who are researching new asset allocation techniques.
Practitioner publications such as JPM, FAJ, CFA, SSRN, collaboration and interaction among
institutional investors, though sharing between asset managers and institutional investors.
Mixture of research papers as well as increased awareness and sophistication of investors.
Far greater attention has been paid toward this area of input into the investment decision making
process over the recent past.
It’s our job to know about all this stuff. Also we are all a bit geeky, so we play around with it anyway.
Thirdly, MVO is pretty finely balanced and often knife-edge stuff and for a whole bunch of reasons
you often get answers that someone is not happy with. So you have to do something - Black-
Litterman, partitioned matrices, robustification, jump-diffusion processes, etc.
They read the literature.
Real-world applicability of the theories, technical knowledge.
Academic and professional training, technical industry conferences
Academic background and graduate degree of most members (e.g. PhD, CFA, MBA, Master in
Finance, etc.). Our research department’s semi-academic approach, long term focus and not being
product/marketing driven.
Applying such detail would not make a meaningful difference to investment outcomes for our clients.
If we were to adopt such an approach, it may even prove detrimental to the performance of the
business.
The high level of awareness of asset allocation theories and theory-based methods can be
attributed to the university training of analysts (undergraduate and postgraduate degrees) and
the continual search for improvement probably driven by competitive forces in the industry.
Other sources of awareness are journals and publications as well as conferences and other
interactions among practitioners. There is also greater attention to theories with the growing
sophistication of the investment market. However, possible lack of usage of theories in
practice may lessen the motivation among financial analysts to be aware of them.

PhD Thesis – Lujer Santacruz
70
Table 19: Responses to interview question 9 on the percentage of theories they are aware of
that analysts actually use
Many have been put to practice by the world's leading investment management and hedge funds
(Black-Litterman, risk factors, risk parity).
Difficult question, it depends on the rationale for review. This would be better addressed by the asset
consultant. In practice, I believe that analysts are aware of theories and might utilise them to test
theories but they are rarely used as the basis for determining asset allocations.
We know a simple long-term static asset allocation based on mean variance does not work, so we
spend a lot of time research how to improve it. I don’t think we use a lot of the theory straight out.
We start with the theory as an idea, and then test it internally using our analysts.
Not much, except the general concept of the benefits of diversification.
Guessing 20 to 30%. As noted above, our process uses returns and risks derived from simulations in a
non-normal environment which I think addresses the same issues the theory based methods address.
I would suggest that around 10 to 30% of these are discussed and used for client asset allocation
analysis. However, my optimistic expectation would be that asset consultants consider at least 50 to
80% of these in practice, however do not necessarily communicate how they are incorporated into
analysis with clients.
Generally I believe that most firms use some (around 30%) of these measures selectively based on
their own experience as to their usefulness in the process. Firms’ analysts are generally aware of most
of these methods though.
Maybe 95% or even 100%.
About 10%.
Unsure.
20%.
About 80% on a regular basis, and 95% plus on some specific projects.
In part resources dependent, the larger global investment banks have the resources to build a more
academic asset allocation solution for private clients. I suspect they do this more as a marketing
approach than a desire to actually drive better investment outcomes. Smaller firms such as ours do not
see the need to over-engineer - understand the correlation characteristics of each asset class and
ensure each individual portfolio is constructed in a way that does not compromise these
diversification benefits.
A significant percentage is being used in practice but mainly to provide general guidance (e.g.
the benefits of diversification), to test/fine tune analysis or probably as a marketing tool but
not often to directly determine strategic asset allocation. However, the range of responses in
terms of percentage usage is quite wide, pointing to a need to establish this in Study number 3.
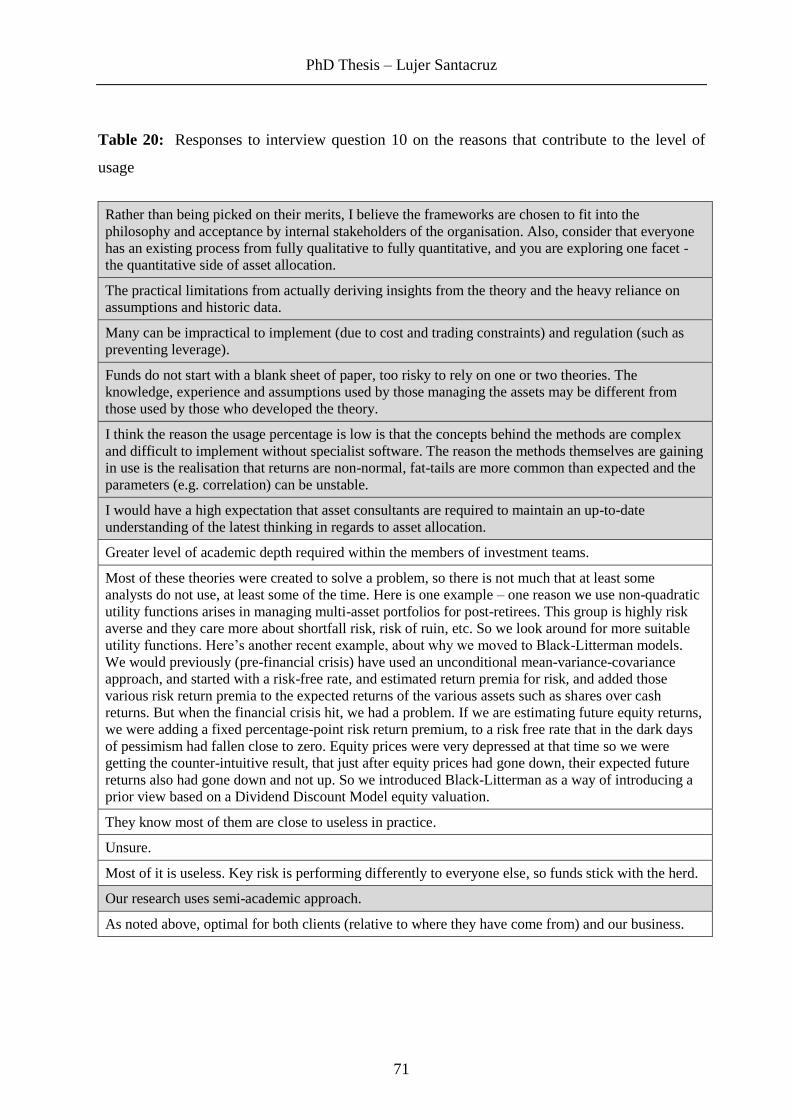
PhD Thesis – Lujer Santacruz
71
Table 20: Responses to interview question 10 on the reasons that contribute to the level of
usage
Rather than being picked on their merits, I believe the frameworks are chosen to fit into the
philosophy and acceptance by internal stakeholders of the organisation. Also, consider that everyone
has an existing process from fully qualitative to fully quantitative, and you are exploring one facet -
the quantitative side of asset allocation.
The practical limitations from actually deriving insights from the theory and the heavy reliance on
assumptions and historic data.
Many can be impractical to implement (due to cost and trading constraints) and regulation (such as
preventing leverage).
Funds do not start with a blank sheet of paper, too risky to rely on one or two theories. The
knowledge, experience and assumptions used by those managing the assets may be different from
those used by those who developed the theory.
I think the reason the usage percentage is low is that the concepts behind the methods are complex
and difficult to implement without specialist software. The reason the methods themselves are gaining
in use is the realisation that returns are non-normal, fat-tails are more common than expected and the
parameters (e.g. correlation) can be unstable.
I would have a high expectation that asset consultants are required to maintain an up-to-date
understanding of the latest thinking in regards to asset allocation.
Greater level of academic depth required within the members of investment teams.
Most of these theories were created to solve a problem, so there is not much that at least some
analysts do not use, at least some of the time. Here is one example – one reason we use non-quadratic
utility functions arises in managing multi-asset portfolios for post-retirees. This group is highly risk
averse and they care more about shortfall risk, risk of ruin, etc. So we look around for more suitable
utility functions. Here’s another recent example, about why we moved to Black-Litterman models.
We would previously (pre-financial crisis) have used an unconditional mean-variance-covariance
approach, and started with a risk-free rate, and estimated return premia for risk, and added those
various risk return premia to the expected returns of the various assets such as shares over cash
returns. But when the financial crisis hit, we had a problem. If we are estimating future equity returns,
we were adding a fixed percentage-point risk return premium, to a risk free rate that in the dark days
of pessimism had fallen close to zero. Equity prices were very depressed at that time so we were
getting the counter-intuitive result, that just after equity prices had gone down, their expected future
returns also had gone down and not up. So we introduced Black-Litterman as a way of introducing a
prior view based on a Dividend Discount Model equity valuation.
They know most of them are close to useless in practice.
Unsure.
Most of it is useless. Key risk is performing differently to everyone else, so funds stick with the herd.
Our research uses semi-academic approach.
As noted above, optimal for both clients (relative to where they have come from) and our business.

PhD Thesis – Lujer Santacruz
72
Some of the reasons cited for the low level of usage of asset allocation theories and theory-
based methods are the qualitative philosophy of some organisations and impractical results of
purely quantitative analysis that are reliant on unrealistic assumptions and historical data. It is
worth noting that the latter is also a common view among academics. It is also mentioned that
practitioners may have assumptions and knowledge different from those of academics who
developed the theories.
Table 21: Responses to interview question 11 on what other questions relevant to the research
should be asked in the interview
What type of fund/objectives are you investing for? Is it maximum long term risk adjusted
performance? What are your liquidity constraints? What liability matching are your investment
decisions constrained by?
How do investors use tactical asset allocation relative to their use of long-term (static) strategic
allocations, and has this changed over time?
Perhaps something about a set and forget approach of asset allocation versus a more dynamic
approach. For example, do managers adjust their strategic asset allocation in light of a material
change to the equity risk premium or is that only addressed at the formal review? What role does
current asset valuation levels have in the strategic asset allocation setting process?
What do you believe are the limitations of strategic asset allocation construction? Based on these
limitations (if any), is the role of strategic asset allocation construction still relevant? Apart from
strategic asset allocation, what other forms of asset allocation do you consider?
You could ask value chain type questions. In your organisation/process, what is your total return
expectation, and what is your total value-added expectation, and what is your risk budget? Of the
value-add you expect from your process, how much comes from your theoretical model itself and how
much comes from superior inputs to the model and how much comes from pragmatic ad hoc
adjustments to your model? And how much from your implementation? You could also ask how
similar or different organisations’ actual portfolios were, to the outputs of the theoretical model. Also,
about reverse optimisation also known as implied alpha, how many organisations conduct implied
alpha analysis?
Ask about the unit itself rather than opinion of what the industry is doing.
Is asset allocation being matched to the specific liabilities of the investor body? Is tax taken into
account (e.g. franking)?
What agency issues exist in the process of asset allocation? Are funds getting enough diversity of
insight in the way they do asset allocation? Is the typical governance approach used by funds likely to
result in good asset allocations?

PhD Thesis – Lujer Santacruz
73
Look into the use of research as a way to push marketing agenda and sell specific products. Also and
related to the latter, look at the problem of data mining and back testing in practical implementations
of theories.
Asset allocation outcomes from an Australian perspective - are the more academic approaches being
discounted because they are devised in the US and Europe and do not take account of Australia's
home biases, franking credits, love affair with property, limited corporate bond market, high currency
volatility etc?
Several questions have been suggested that would be considered for inclusion in the survey
instrument for Study number 3. What are the investment objectives and what is the perceived
value-added with theory-based portfolio optimisation? How is tactical and dynamic asset
allocation used relative to strategic asset allocation? What are the limitations of strategic asset
allocation construction? Is liability matching relevant to asset allocation? What are the
governance and agency issues with asset allocation? What are the marketing implications of
theory in asset allocation? Are there any context issues with the use of asset allocation
theories in the Australian environment?
6.5 Summary
The asset allocation process followed by Australian investment management firms that
practice mean-variance optimisation generally follow the one described in Sharpe (2007), but
with less reliance on historical data for determining the inputs to the model. Firms that do not
practice mean-variance optimisation usually decide on an asset allocation and then conduct
simulation of future results to validate them.
Asset consultants play a major role in asset allocation decision making as they usually provide
advice to superannuation funds on this area, although some investment managers make the
decisions in-house with their investment team. The investment team or financial analysts
(both in-house and those of external consultants) decide on the asset allocation method to use
and make the asset allocation recommendations that are approved by the investment team,
senior executives or the Board. Strategic asset allocation is set generally once a year and
reviewed quarterly, now generally more often than before the global financial crisis.
There is a high level of awareness of asset allocation theory and theory-based methods,
attributed to the university training of investment practitioners, the continual search for
improvement, availability of publications, conferences and other interactions among

PhD Thesis – Lujer Santacruz
74
practitioners. There is a wide range of opinion on the percentage of theories actually being
used in practice, but a significant level is currently being used mainly to provide general
guidance and not to directly determine asset allocation. Perceived low level of usage of
theories is attributed to the qualitative philosophy of some organisations and the impractical
results of purely quantitative analysis.
The interview results have provided several insights that will inform the design of the survey
instrument and the target respondents in Study number 3 as well as additional questions that
need to be probed.
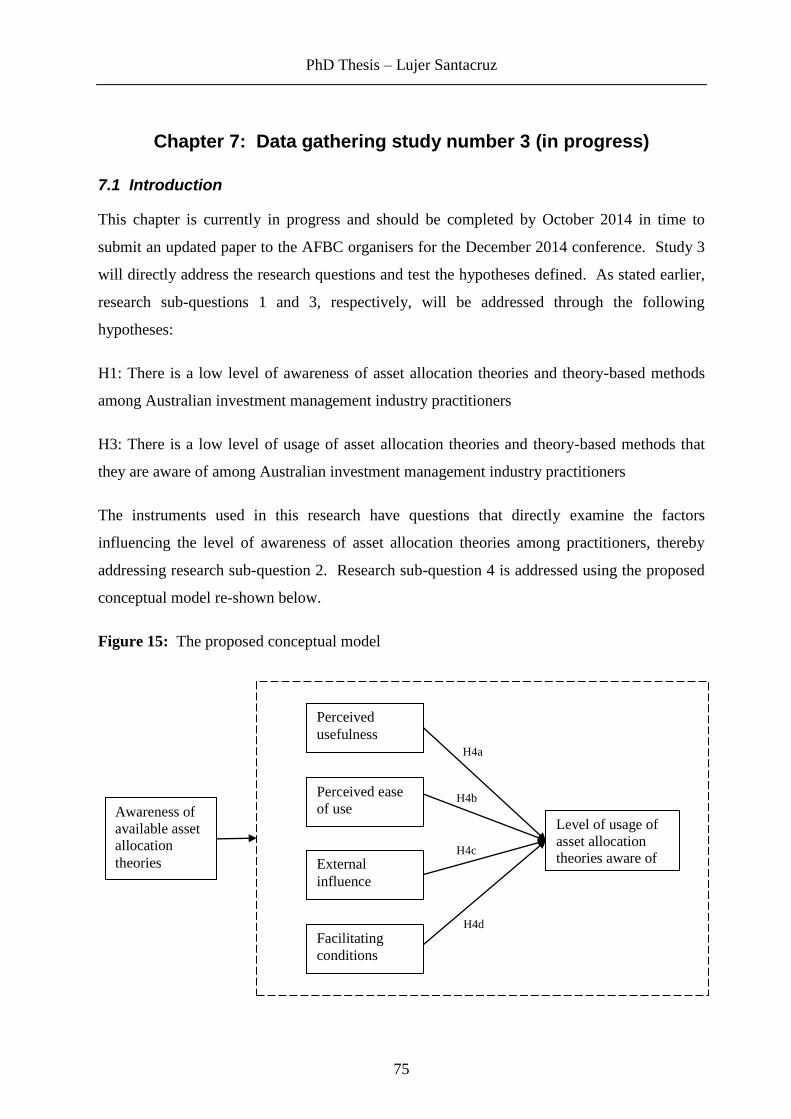
PhD Thesis – Lujer Santacruz
75
Chapter 7: Data gathering study number 3 (in progress)
7.1 Introduction
This chapter is currently in progress and should be completed by October 2014 in time to
submit an updated paper to the AFBC organisers for the December 2014 conference. Study 3
will directly address the research questions and test the hypotheses defined. As stated earlier,
research sub-questions 1 and 3, respectively, will be addressed through the following
hypotheses:
H1: There is a low level of awareness of asset allocation theories and theory-based methods
among Australian investment management industry practitioners
H3: There is a low level of usage of asset allocation theories and theory-based methods that
they are aware of among Australian investment management industry practitioners
The instruments used in this research have questions that directly examine the factors
influencing the level of awareness of asset allocation theories among practitioners, thereby
addressing research sub-question 2. Research sub-question 4 is addressed using the proposed
conceptual model re-shown below.
Figure 15: The proposed conceptual model
Perceived ease
of use
External
influence
Awareness of
available asset
allocation
theories
H4a
H4d
H4c
H4b
Perceived
usefulness
Level of usage of
asset allocation
theories aware of
Facilitating
conditions

PhD Thesis – Lujer Santacruz
76
Measures to operationalise the various constructs in the conceptual model will be sourced
from literature and adapted to the case of use of asset allocation theories, in order to flesh out
the factors influencing the level of usage of theories through the following hypotheses:
H4a: Perceived usefulness has a significant influence on the use of asset allocation theories
H4b: Perceived ease of use has a significant influence on the use of asset allocation theories
H4c: External influence has a significant influence on the use of asset allocation theories
H4d: Facilitating conditions has a significant influence on the use of asset allocation theories
7.2 Research instrument
An online survey will probe awareness and usage of the asset allocation theories and theory-
based methods surveyed in the literature review among investment management industry
practitioners who have a role in asset allocation decisions.
The types of questions that will be asked in the survey are as follows:
1. Classification questions. Examples: type of institution, age of institution, services
offered, size of assets managed, job position of respondent, educational attainment and
age.
2. Questions revolving around specific tasks in the asset allocation process with the
respondents being asked to indicate their level and source of awareness and their actual
usage of specific theories and theory-based methods as well as their reasons for non-
use. Respondents will also be provided information on theory-based methods that they
are not aware of and asked their willingness to apply them in practice if given the
chance.
3. Scale questions on the measures that have been selected to operationalise the various
constructs in the proposed conceptual model in order to flesh out the factors
influencing the usage of theories. Example (under the perceived usefulness construct):
Indicate your level of agreement with the statement “use of asset allocation theories
will enable our organisation to carry out its work better”.
In order to ensure the validity of the measures, only those that are based on extant theories and
have been tested in previous research will be utilised. As previous research was likely done
PhD Thesis – Lujer Santacruz
77
for other contexts, appropriate modification of the measures will be carried out to adapt them
to the context of the proposed research and to ensure that they are accurate representations of
the constructs being analysed.
The survey questionnaire will be designed in a physically appealing and easy-to-answer
manner, of an appropriate length and the questions will be asked in a logical manner in order
to reduce the perceived costs of being a respondent. The questionnaire will be pre-tested
among academics and practitioners before being finalised for dissemination. As is required
for all research, clearance will be obtained from the USQ Research Ethics Committee before
the survey is administered. An email with a link to the approved questionnaire will be sent out
to target respondents.
7.3 Sample design and data collection
The questionnaire will be sent out to a cross section of Australia-based institutions having
investment management functions (e.g. fund managers, superannuation trusts, insurance
companies, banks, financial planning groups) and practitioners (e.g. investment analysts,
portfolio managers, executives). The proposed research will aim for a respondent size of 200
or around the same number as in Amenc et al. (2011). Based on the typical response rate of
20% for similar studies surveyed in the literature review, an emailing list of 1,000 randomly
chosen practitioners will form the sample frame.
The research will utilise the principles of Tailored Design Method (Dillman 2000) to
maximise the response rate. An inducement will be offered as follows: “If you would like to
enter the draw to win a $300 fuel voucher, please provide your email address at the end of the
survey. Your details will not be passed to external parties and the winner will be drawn
randomly on 30 September 2014. The winner will be notified by email. This prize cannot be
exchanged for cash and the winner must claim it by 15 October 2014”.
The researcher will also try to obtain the support of key industry associations, as shown in
table 22, in disseminating the survey.

PhD Thesis – Lujer Santacruz
78
Table 22: Key investment management industry associations
Name Website
Funds Executives Association Limited http://www.feal.asn.au
Financial Services Council http://fsc.org.au
Association of Superannuation Funds of Australia http://www.superannuation.asn.au
Australian Private Equity and Venture Capital Assn. http://www.avcal.com.au
Financial Services Institute of Australasia http://www.finsia.com
Australian Institute of Superannuation Trustees http://www.aist.asn.au
Investment Management Consultants Association http://www.imca.org.au
Australian Financial Markets Association http://www.afma.com.au
CFA Society Sydney/Brisbane http://www.cfasociety.org/sydney
CFA Society Melbourne http://cfa-melbourne.com.au/
CFA Society Perth http://www.cfasociety.org/perth
7.4 Data analysis
The data gathered will be encoded into the appropriate statistical software for analysis.
Preliminary examination of the data will be carried out to ensure that they are suitable for
inferential statistical analysis. Missing data will be evaluated, outliers will be identified and
statistical assumptions underlying multivariate techniques, primarily the normality of data,
will be tested (Hair et al. 2006).
In order to check for representativeness of the respondents, Chi-square tests will be carried out
by comparing respondents with the population on the basis of the characteristics detailed in the
classification questions (Diekhoff 1992). Regression analysis will be carried out to determine
which of the characteristics in the classification questions have influence on the awareness and
usage of asset allocation theories.
After the preliminary examination and preparation of data, Structural Equation Modelling
(SEM) will be used to validate the fit with the conceptual model of data obtained through the
questionnaire survey. SEM allows estimation of the strength of all the hypothesised
relationships between constructs in a conceptual model. It therefore provides information

PhD Thesis – Lujer Santacruz
79
about impact, both directly from one variable to another and via any mediating variables (Hair
et al. 2006).
Before carrying out SEM, exploratory factor analyses will be performed on the measures
utilised. The measures obtained from this analysis will be subjected to a confirmatory factor
analysis to assess convergent validity and internal consistency.
The results of this analysis will identify any gaps between asset allocation theory and practice
and the reasons for their existence and facilitate the formulation of recommendations that will
help reduce the gap. Aside from addressing the reasons identified for the existence of any
gaps, the recommendations may also involve suggesting theory-based improvements to asset
allocation practices as well as suggesting possible directions for future research in the area of
asset allocation that will make theory more operationally relevant.

PhD Thesis – Lujer Santacruz
80
Chapter 8: Conclusions (in progress)
This chapter is currently in progress and should be completed by November 2014 in time to
submit an updated paper to the AFBC organisers for the December 2014 conference.

PhD Thesis – Lujer Santacruz
81
List of references
Adcock, CJ 2010, 'Asset pricing and portfolio selection based on the multivariate extended
skew-student- t distribution', Annals of Operations Research, vol. 176, no. 1.
Adler, T & Kritzman, M 2007, 'Mean–variance versus full-scale optimisation: in and out of
sample', Journal of Asset Management, vol. 7, no. 5.
Agarwal, V & Naik, N 2000, Does gain-loss analysis outperform mean-variance analysis?,
London Business School.
Aggarwal, R 1993, 'Theory and practice in finance education: or why we shouldn't just ask
them', Financial Practice and Education, vol. 3, no. 2.
Ajzen, I 1991, 'The Theory of Planned Behavior', Organizational Behavior & Human
Decision Processes, vol. 50, no. 2.
Alexander, GJ & Baptista, AM 2002, 'Economic implications of using a mean-VAR model for
portfolio selection: a comparison with mean-variance analysis', Journal of Economic
Dynamics and Control, vol. 26, no. 7-8.
Alexander, GJ & Baptista, AM 2004, 'A Comparison of VAR and CVAR constraints on
portfolio selection with the mean-variance model', Management Science, vol. 50, no. 9.
Amenc, N, Goltz, F & Lioui, A 2011, 'Practitioner portfolio construction and performance
measurement: evidence from Europe', Financial Analysts Journal, vol. 67, no. 3.
Arditti, FD & Levy, H 1975, 'Portfolio efficiency analysis in three moments: the multiperiod
case', Journal of Finance, vol. 30, no. 3.
Armitage, CJ & Conner, M 2001, 'Efficacy of the Theory of Planned Behaviour: a meta-
analytic review', British Journal of Social Psychology, vol. 40, no. 4.
Arrow, KJ 1971, Essays in the Theory of Risk-bearing, Markham Pub. Co., Chicago,.
Arzac, ER & Bawa, VS 1977, 'Portfolio choice and equilibrium in capital markets with safety-
first investors', Journal of Financial Economics, vol. 4, no. 3.
Asl, FM & Etula, E 2012, 'Advancing strategic asset allocation in a multi-factor world',
Journal of Portfolio Management, vol. 39, no. 1.
Asness, CS, Frazzini, A & Pedersen, LH 2012, 'Leverage aversion and risk parity', Financial
Analysts Journal, vol. 68, no. 1.
Atkinson, C & Papakokkinou, M 2005, 'Theory of optimal consumption and portfolio
selection under a Capital-at-Risk and a Value-at-Risk constraint', IMA Journal of Management
Mathematics, vol. 16, no. 1.
Austrade 2010, Investment Management Industry in Australia, Australian Trade Commission,
Sydney.

PhD Thesis – Lujer Santacruz
82
Bajeux-Besnainou, I, Jordan, JV & Portait, R 2001, 'An asset allocation puzzle: comment',
American Economic Review, vol. 91, no. 4.
Baker, HK & Mukherjee, T 2006, 'Survey research in finance: views from journal editors',
International Journal of Managerial Finance, vol. 3.
Baker, HK & Filbeck, G 2013, Portfolio Theory and Management, Oxford University Press,
New York.
Ballestero, E, Günther, M, Pla-Santamaria, D & Stummer, C 2007, 'Portfolio selection under
strict uncertainty: a multi-criteria methodology and its application to the Frankfurt and Vienna
Stock Exchanges', European Journal of Operational Research, vol. 181, no. 3.
Basak, S & Shapiro, A 2001, 'Value-at-Risk-based risk management: optimal policies and
asset prices', Review of Financial Studies, vol. 14, no. 2.
Basu, AK, Byrne, A & Drew, ME 2011, 'Dynamic lifecycle strategies for target date
retirement funds', Journal of Portfolio Management, vol. 37, no. 2.
Bawa, VS 1975, 'Optimal rules for ordering uncertain prospects', Journal of Financial
Economics, vol. 2, no. 1.
Benartzi, S & Thaler, RH 2001, 'Naive diversification strategies in defined contribution saving
plans', American Economic Review, vol. 91, no. 1.
Benbachir, S, Gaboune, B & Alaoui, ME 2012, 'Comparing portfolio selection using CVAR
and mean-variance approach', International Research Journal of Finance & Economics, no.
88.
Bender, J, Briand, R, Nielsen, F & Stefek, D 2010, 'Portfolio of risk premia: a new approach to
diversification', Journal of Portfolio Management, vol. 36, no. 2.
Bernardo, AE & Ledoit, O 2000, 'Gain, loss and asset pricing', Journal of Political Economy,
vol. 108, no. 1.
Bernoulli, D 1954, 'Exposition of a new theory on the measurement of risk (translated from the
1738 original)', Econometrica, vol. 22, no. 1.
Best, MJ & Grauer, RR 1991, 'On the sensitivity of mean-variance-efficient portfolios to
changes in asset means: some analytical and computational results', Review of Financial
Studies, vol. 4, no. 2.
Best, MJ & Grauer, RR 1992, 'Positively weighted minimum-variance portfolios and the
structure of asset expected returns', Journal of Financial & Quantitative Analysis, vol. 27, no.
4.
Black, F & Litterman, R 1991, 'Asset allocation: combining investor views with market
equilibrium', The Journal of Fixed Income, vol. 1, no. 2.
Bodie, Z, Kane, A & Marcus, AJ 2011, Investments and Portfolio Management, 9th edn,
McGraw-Hill/Irwin, New York.

PhD Thesis – Lujer Santacruz
83
Brandt, MW, Santa-Clara, P & Valkanov, R 2009, 'Parametric portfolio policies: exploiting
characteristics in the cross-section of equity returns', Review of Financial Studies, vol. 22, no.
9.
Brau, JC & Fawcett, SE 2006, 'Initial public offerings: an analysis of theory and practice',
Journal of Finance, vol. 61, no. 1.
Brennan, MJ & Schwartz, ES 1997, 'Strategic asset allocation', Journal of Economic Dynamics
& Control, vol. 21, no. 8/9.
Brinson, GP, Hood, LR & Beebower, GL 1986, 'Determinants of portfolio performance',
Financial Analysts Journal, vol. 42, no. 4.
Brounen, D, de Jong, A & Koedijk, K 2006, 'Capital structure policies in Europe: survey
evidence', Journal of Banking & Finance, vol. 30, no. 5.
Brown, DB & Sim, M 2009, 'Satisficing measures for analysis of risky positions',
Management Science, vol. 55, no. 1.
Byrne, P & Lee, S 1997, 'Real estate portfolio analysis under conditions of non-normality: the
case of NCREIF', Journal of Real Estate Portfolio Management, vol. 3, no. 1.
Campbell, JY, Chan, YL & Viceira, LM 2003, 'A multivariate model of strategic asset
allocation', Journal of Financial Economics, vol. 67, no. 1.
Campbell, R, Huisman, R & Koedijk, K 2001, 'Optimal portfolio selection in a Value-at-Risk
framework', Journal of Banking and Finance, vol. 25, no. 9.
Canner, N, Mankiw, NG & Weil, DN 1997, 'An asset allocation puzzle', American Economic
Review, vol. 87, no. 1.
Carter, RB & Van Auken, HE 1990, 'Security analysis and portfolio management: a survey
and analysis', Journal of Portfolio Management, vol. 16, no. 3.
Cass, D & Stiglitz, JE 1970, 'The structure of investor preferences and asset returns, and
separability in portfolio allocation', Journal of Economic Theory, vol. 2, no. 2.
Çelikyurt, U & Özekici, S 2007, 'Multiperiod portfolio optimization models in stochastic
markets using the mean–variance approach', European Journal of Operational Research, vol.
179, no. 1.
Ceria, S & Stubbs, RA 2006, 'Incorporating estimation errors into portfolio selection: robust
portfolio construction', Journal of Asset Management, vol. 7, no. 2.
Chan, LKC, Karceski, J & Lakonishok, J 1999, 'On portfolio optimization: forecasting
covariances and choosing the risk model', Review of Financial Studies, vol. 12, no. 5.
Chang, C-H, DuPoyet, B & Prakash, A 2008, 'Optimum allocation of weights to assets in a
portfolio: the case of nominal annualization versus effective annualization of returns', Applied
Financial Economics, vol. 18, no. 19-21.

PhD Thesis – Lujer Santacruz
84
Chen, H-H 2008, 'Value-at-Risk efficient portfolio selection using goal programming', Review
of Pacific Basin Financial Markets and Policies, vol. 11, no. 2.
Chen, S & Liu, X 2011, 'Utilizing the Theory of Planned Behaviour to lead change in
manufacturing organizations', in International Conference on E-business Management and
Economics, Singapore.
Cheng, HC & Chiung, CT 2012, 'Optimal portfolios under a Conditional Value-at-Risk
constraint', International Research Journal of Finance & Economics, no. 89.
Chopra, VK 1993, 'Improving optimization', The Journal of Investing, vol. 2, no. 3.
Chopra, VK & Ziemba, WT 1993, 'The effect of errors in means, variances, and covariances
on optimal portfolio choice', Journal of Portfolio Management, vol. 19, no. 2.
Chow, G, Jacquier, E, Kitzman, M & Lowry, K 1999, 'Optimal portfolios in good times and
bad', Financial Analysts Journal, vol. 55, no. 3.
Christie, S 2005, 'Strategic and tactical asset allocation in the presence of sampling error',
MAFC Research Papers, vol. 30.
Clarke, RG, de Silva, H & Murdock, R 2005, 'A factor approach to asset allocation: exposure
to global market factors', Journal of Portfolio Management, vol. 32, no. 1.
Clarkson, GP & Meltzer, AH 1960, 'Portfolio selection: a heuristic approach', Journal of
Finance, vol. 15, no. 4.
Coakes, SJ, Steed, L & Dzidic, P 2006, SPSS: Analysis Without Anguish: Version 13.0 for
Windows, Version 13.0. edn, John Wiley & Sons Australia, Milton.
Coleman, L 2007, 'Applying modern portfolio techniques to agriculture', JASSA, no. 4.
Coleman, L 2013, 'Why finance theory fails to survive contact with the real world: a fund
manager perspective', Critical Perspectives on Accounting, no. 0.
Coleman, MS & Mansour, A 2005, 'Real estate in the real world: dealing with non-normality
and risk in an asset allocation model', Journal of Real Estate Portfolio Management, vol. 11,
no. 1.
Consigli, G 2002, 'Tail estimation and Mean-VaR portfolio selection in markets subject to
financial instability', Journal of Banking and Finance, vol. 26, no. 7.
Cremers, J-H, Kritzman, M & Page, S 2005, 'Optimal hedge fund allocations: do higher
moments matter?', Journal of Portfolio Management, vol. 31, no. 3.
Crowe, K & Parker, W 2008, 'Using portfolio theory to guide reforestation and restoration
under climate change scenarios', Climatic Change, vol. 89, no. 3-4.
Cvitanic, J, Polimenis, V & Zapatero, F 2008, 'Optimal portfolio allocation with higher
moments', Annals of Finance, vol. 4, no. 1.

PhD Thesis – Lujer Santacruz
85
D'Antonio, L & Johnsen, T 2011, 'Equity collars as an alternative to debt in traditional asset
allocation', Journal of Financial Service Professionals, vol. 65, no. 4.
Davies, GB & Satchell, SE 2004, Continuous cumulative Prospect Theory and individual asset
allocation, University of Cambridge.
Davis, FD 1989, 'Perceived usefulness, perceived ease of use, and user acceptance of
information technology', MIS Quarterly, vol. 13, no. 3.
de Athayde, GM & Flores, RG 2004, 'Finding a maximum skewness portfolio - a general
solution to three-moments portfolio choice', Journal of Economic Dynamics and Control, vol.
28, no. 7.
De Giorgi, E, Hens, T & Mayer, J 2007, 'Computational aspects of Prospect Theory with asset
pricing applications', Computational Economics, vol. 29, no. 3-4.
DeMiguel, V & Nogales, FJ 2009, 'Portfolio selection with robust estimation', Operations
Research, vol. 57, no. 3.
DeMiguel, V, Garlappi, L & Uppal, R 2009, 'Optimal versus naive diversification: how
inefficient is the 1/N portfolio strategy?', Review of Financial Studies, vol. 22, no. 5.
Diekhoff, G 1992, Statistics for the Social and Behavioral Sciences: Univariate, Bivariate,
Multivariate, Wm. C. Brown Publishers, Dubuque.
Dillman, DA 2000, Mail and Internet Surveys : The Tailored Design Method, 2nd edn, John
Wiley, New York ; Chichester.
Durand, RB, Gould, J & Maller, R 2011, 'On the performance of the minimum VaR portfolio',
European Journal of Finance, vol. 17, no. 7-8.
East, R 1993, 'Investment decisions and the Theory of Planned Behaviour', Journal of
Economic Psychology, vol. 14, no. 2.
Elton, EJ & Gruber, MJ 2000, 'The rationality of asset allocation recommendations', Journal
of Financial & Quantitative Analysis, vol. 35, no. 1.
Engel, C, Frankel, JA, Froot, KA & Rodrigues, AP 1995, 'Tests of conditional mean-variance
efficiency of the U.S. stock market', Journal of Empirical Finance, vol. 2, no. 1.
Engle, R 2004, 'Risk and volatility: econometric models and financial practice', American
Economic Review, vol. 94, no. 3.
Fabozzi, FJ, Huang, D & Zhou, G 2010, 'Robust portfolios: contributions from operations
research and finance', Annals of Operations Research, vol. 176, no. 1.
Fabozzi, FJ, Ortobelli, S, Rachev, ST, Stoyanov, S & Biglova, A 2005, 'The proper use of risk
measures in portfolio theory', International Journal of Theoretical and Applied Finance, vol.
8, no. 8.
PhD Thesis – Lujer Santacruz
86
Fabozzi, FJ, Rachev, S, Ortobelli, S, Stoyanov, S & Biglova, A 2008, 'Desirable properties of
an ideal risk measure in portfolio theory', International Journal of Theoretical and Applied
Finance, vol. 11, no. 1.
Fama, EF 1965, 'The behavior of stock market prices', Journal of Business, vol. 38, no. 1.
Faulhaber, GR & Baumol, WJ 1988, 'Economists as innovators: practical products of
theoretical research', Journal of Economic Literature, vol. 26, no. 2.
Feldstein, MS 1969, 'Mean-variance analysis in the theory of liquidity preference and portfolio
selection', Review of Economic Studies, vol. 36, no. 105.
Fishburn, PC 1977, 'Mean-risk analysis with risk associated with below-target returns',
American Economic Review, vol. 67, no. 2.
Friedman, M & Savage, LJ 1948, 'The utility analysis of choices involving risk', Journal of
Political Economy, vol. 56, no. 4.
Frost, PA & Savarino, JE 1986, 'An empirical Bayes approach to efficient portfolio selection',
Journal of Financial and Quantitative Analysis, vol. 21, no. 3.
Frost, PA & Savarino, JE 1988, 'For better performance: constrain portfolio weights', Journal
of Portfolio Management, vol. 15, no. 1.
Garlappi, L, Uppal, R & Tan, W 2007, 'Portfolio selection with parameter and model
uncertainty: a multi-prior approach', Review of Financial Studies, vol. 20, no. 1.
Gaydon, DS, Meinke, H, Rodriguez, D & McGrath, DJ 2012, 'Comparing water options for
irrigation farmers using Modern Portfolio Theory', Agricultural Water Management, vol. 115.
Goldfarb, D & Iyengar, G 2003, 'Robust portfolio selection problems', Mathematics of
Operations Research, vol. 28, no. 1.
Graham, JR & Harvey, CR 2001, 'The theory and practice of corporate finance: evidence from
the field', Journal of Financial Economics, vol. 60, no. 2/3.
Green, RC & Hollifield, B 1992, 'When will mean-variance efficient portfolios be well
diversified?', Journal of Finance, vol. 47, no. 5.
Guidolin, M & Timmermann, A 2007, 'Asset allocation under multivariate regime switching',
Journal of Economic Dynamics and Control, vol. 31, no. 11.
Hair, JF, Black, WC, Babin, BJ, Anderson, RE & Tatham, RL 2006, Multivariate Data
Analysis, 6th edn, Pearson Prentice Hall, Upper Saddle River.
Hanqing, J, Markowitz, H & Xun Yu, Z 2006, 'A note on semivariance', Mathematical
Finance, vol. 16, no. 1.
Harlow, WV 1991, 'Asset allocation in a downside-risk framework', Financial Analysts
Journal, vol. 47, no. 5.

PhD Thesis – Lujer Santacruz
87
Harvey, CR & Siddique, A 2000, 'Conditional skewness in asset pricing tests', Journal of
Finance, vol. 55, no. 3.
Harvey, CR, Liechty, JC, Liechty, MW & Muller, P 2010, 'Portfolio selection with higher
moments', Quantitative Finance, vol. 10, no. 5.
Hirsch, JE 2005, 'An index to quantify an individual's scientific research output', in
Proceedings of the National Academy of Sciences of the USA: proceedings of theProceedings
of the National Academy of Sciences of the USA.
Ho, L-c, Cadle, J & Theobald, M 2008, 'Portfolio selection in an Expected Shortfall
framework during the recent 'credit crunch' period', Journal of Asset Management, vol. 9, no.
2.
Hogan, WW & Warren, JM 1972, 'Computation of the efficient boundary in the E-S portfolio
selection model', Journal of Financial & Quantitative Analysis, vol. 7, no. 4.
Holton, GA 2004, 'Defining risk', Financial Analysts Journal, vol. 60, no. 6.
Hsiu-Fen Lin, E & Lee, G-G 2004, 'Perceptions of senior managers toward knowledge-sharing
behaviour', Management Decision, vol. 42, no. 1.
Huang, X 2008, 'Portfolio selection with a new definition of risk', European Journal of
Operational Research, vol. 186, no. 1.
Huber, C & Kaiser, H 2003, 'Asset allocation recommendations of financial advisors: are they
risk/return optimal?', Journal of Wealth Management, vol. 6, no. 2.
Hussein, A 2009, 'The use of triangulation in social sciences research: can qualitative and
quantitative methods be combined', Journal of Comparative Social Work.
Ibbotson, RG & Fall, CL 1979, 'The United States market wealth portfolio', Journal of
Portfolio Management, vol. 6, no. 1.
Ibbotson, RG & Kaplan, PD 2000, 'Does asset allocation policy explain 40, 90, or 100 percent
of performance?', Financial Analysts Journal, vol. 56, no. 1.
Idzorek, TM & Kowara, M 2013, 'Factor-based asset allocation vs. asset-class-based asset
allocation', Financial Analysts Journal, vol. 69, no. 3.
Ilhan, A, Jonsson, M & Sircar, R 2004, Portfolio optimization with derivatives and
indifference pricing, Princeton University.
Jacquier, E & Marcus, AJ 2001, 'Asset allocation models and market volatility', Financial
Analysts Journal, vol. 57, no. 2.
Jaeger, RA, Rausch, MA & Foley, M 2010, 'Multi-horizon investing: a new paradigm for
endowments and other long-term investors', Journal of Wealth Management, vol. 13, no. 1.
Jagannathan, R & Ma, T 2003, 'Risk reduction in large portfolios: why imposing the wrong
constraints helps', Journal of Finance, vol. 58, no. 4.

PhD Thesis – Lujer Santacruz
88
Jean, WH 1971, 'The extension of portfolio analysis to three or more parameters', Journal of
Financial and Quantitative Analysis, vol. 6, no. 1.
Jobson, JD, Korkie, B & Ratti, V 1979, 'Improved estimation for Markowitz portfolios using
James-Stein type estimators', Proceedings of the American Statistical Association.
Johnson, M 2003, 'Prediction of Baby-Boomer Intentions to Seek Financial Planning Advice',
The University of Queensland, Brisbane, QLD, Australia.
Jondeau, E & Rockinger, M 2006, 'Optimal portfolio allocation under higher moments',
European Financial Management, vol. 12, no. 1.
Jorion, P 1991, 'Bayesian and CAPM estimators of the means: implications for portfolio
selection', Journal of Banking and Finance, vol. 15, no. 3.
Juravle, C & Lewis, A 2008, 'Identifying impediments to SRI in Europe: a review of the
practitioner and academic literature', Business Ethics: A European Review, vol. 17, no. 3.
Jurczenko, E & Maillet, B 2006, Multi-moment asset allocation and pricing models, John
Wiley & Sons, Inc., Chichester, England ; Hoboken, NJ.
Kahneman, D & Tversky, A 1979, 'Prospect Theory: an analysis of decision under risk',
Econometrica, vol. 47, no. 2.
Kan, R & Zhou, G 2007, 'Optimal portfolio choice with parameter uncertainty', Journal of
Financial & Quantitative Analysis, vol. 42, no. 3.
Kane, A 1982, 'Skewness preference and portfolio choice', Journal of Financial &
Quantitative Analysis, vol. 17, no. 1.
Keasey, K & Hudson, R 2007, 'Finance theory: a house without windows', Critical
Perspectives on Accounting, vol. 18, no. 8.
King, WR & He, J 2006, 'A meta-analysis of the Technology Acceptance Model', Information
& Management, vol. 43, no. 6.
Klein, RW & Bawa, VS 1976, 'The effect of estimation risk on optimal portfolio choice',
Journal of Financial Economics, vol. 3, no. 3.
Knight, FH 1921, Risk, Uncertainty and Profit, Hart, Schaffner and Marx, Boston.
Kon, SJ 1984, 'Models of stock returns - a comparison', Journal of Finance, vol. 39, no. 1.
Kong, L 2006, 'The UPM/LPM Framework on Portfolio Performance Measurement and
Optimization', Uppsala University.
Konno, H & Koshizuka, T 2005, 'Mean-absolute deviation model', IIE Transactions, vol. 37,
no. 10.
Konno, H, Shirakawa, H & Yamazaki, H 1993, 'A mean-absolute deviation-skewness portfolio
optimization model', Annals of Operations Research, vol. 45, no. 1-4.

PhD Thesis – Lujer Santacruz
89
Kroll, Y, Levy, H & Markowitz, HM 1984, 'Mean-variance versus direct utility maximization',
Journal of Finance, vol. 39, no. 1.
Kroll, Y, Levy, H & Rapoport, A 1988a, 'Experimental tests of the Separation Theorem and
the Capital Asset Pricing Model', American Economic Review, vol. 78, no. 3.
Kroll, Y, Levy, H & Rapoport, A 1988b, 'Experimental tests of the mean-variance model for
portfolio selection', Organizational Behavior & Human Decision Processes, vol. 42, no. 3.
Kuosmanen, T 2004, 'Efficient diversification according to Stochastic Dominance criteria',
Management Science, vol. 50, no. 10.
Lai, T-Y 1991, 'Portfolio selection with skewness: a multiple-objective approach', Review of
Quantitative Finance & Accounting, vol. 1, no. 3.
Ledoit, O & Wolf, M 2003, 'Improved estimation of the covariance matrix of stock returns
with an application to portfolio selection', Journal of Empirical Finance, vol. 10, no. 5.
Leedy, PD & Ormrod, JE 2005, Practical Research: Planning and Design, 8th edn,
Pearson/Merrill Prentice Hall, Upper Saddle River.
Levy, H 1973, 'Stochastic dominance, efficiency criteria, and efficient portfolios: the multi-
period case', American Economic Review, vol. 63, no. 5.
Levy, H 1992, 'Stochastic dominance and expected utility: survey and analysis', Management
Science, vol. 38, no. 4.
Levy, H & Markowitz, HM 1979, 'Approximating expected utility by a function of mean and
variance', American Economic Review, vol. 69, no. 3.
Levy, H & Levy, M 2004, 'Prospect Theory and mean-variance analysis', Review of Financial
Studies, vol. 17, no. 4.
Lin, P-C & Ko, P-C 2009, 'Portfolio value-at-risk forecasting with GA-based extreme value
theory', Expert Systems with Applications, vol. 36, no. 2.
Lintner, J 1956, 'Distribution of incomes of corporations among dividends, retained earnings
and taxes', American Economic Review, vol. 46.
Lintner, J 1965, 'Security prices, risk and maximal gains from diversification', Journal of
Finance, vol. 20, no. 4.
Lioui, A 2007, 'The asset allocation puzzle is still a puzzle', Journal of Economic Dynamics &
Control, vol. 31, no. 4.
Low, C, Pachamanova, D & Sim, M 2012, 'Skewness-aware asset allocation: a new theoretical
framework and empirical evidence', Mathematical Finance, vol. 22, no. 2.
LSE, 2014, 'Key Measures of Academic Influence',
<http://blogs.lse.ac.uk/impactofsocialsciences/the-handbook/chapter-3-key-measures-of-
academic-influence/>.
PhD Thesis – Lujer Santacruz
90
Lucey, BM, Poti, V & Tully, E 2006, 'International portfolio formation, skewness and the role
of gold', Frontiers in Finance and Economics, vol. 3, no. 1.
Lutgens, F & Schotman, PC 2010, 'Robust portfolio optimisation with multiple experts',
Review of Finance, vol. 14, no. 2.
Maillet, B & Merlin, P 2009, Robust higher-order moments and efficient portfolio selection, 5
May 2014.
Manstead, ASR 2011, 'The benefits of a critical stance: a reflection on past papers on the
theories of reasoned action and planned behaviour', British Journal of Social Psychology, vol.
50, no. 3.
Mao, JCT 1970a, 'Survey of capital budgeting: theory and practice', Journal of Finance, vol.
25, no. 2.
Mao, JCT 1970b, 'Models of capital budgeting, E-V vs E-S', Journal of Financial &
Quantitative Analysis, vol. 4, no. 5.
Mao, JCT & Helliwell, JF 1969, 'Investment decision under uncertainty: theory and practice',
Journal of Finance, vol. 24, no. 2.
Marinoni, O, Adkins, P & Hajkowicz, S 2011, 'Water planning in a changing climate: joint
application of cost utility analysis and Modern Portfolio Theory', Environmental Modelling &
Software, vol. 26, no. 1.
Markowitz, H 1952, 'Portfolio selection', Journal of Finance, vol. 7, no. 1.
Markowitz, H 1956, 'The optimization of a quadratic function subject to linear constraints',
Naval Research Logistics Quarterly, vol. 3, no. 1-2.
Markowitz, H 1959, Portfolio Selection, Efficient Diversification of Investments, Wiley, New
York,.
Markowitz, H & Nilufer, U 1996, 'The likelihood of various stock market return distributions,
part 2: empirical results', Journal of Risk & Uncertainty, vol. 13, no. 3.
Markowitz, H, Todd, P, Ganlin, X & Yamane, Y 1993, 'Computation of mean-semivariance
efficient sets by the Critical Line Algorithm', Annals of Operations Research, vol. 45, no. 1-4.
Mencia, J & Sentana, E 2009, 'Multivariate location-scale mixtures of normals and mean-
variance-skewness portfolio allocation', Journal of Econometrics, vol. 153, no. 2.
Merton, RC 1969, 'Lifetime portfolio selection under uncertainty: the continuous-time case',
The Review of Economics and Statistics, vol. 51, no. 3.
Merton, RC 1972, 'An analytic derivation of the efficient portfolio frontier', Journal of
Financial and Quantitative Analysis, vol. 7, no. 4.
Merton, RC 2003, 'Thoughts on the future: theory and practice in investment management',
Financial Analysts Journal, vol. 59, no. 1.

PhD Thesis – Lujer Santacruz
91
Miccolis, JA & Goodman, M 2012a, 'Next generation investment risk management: putting
the 'modern' back in Modern Portfolio Theory', Journal of Financial Planning, vol. 25, no. 1.
Miccolis, JA & Goodman, M 2012b, 'Dynamic asset allocation: using momentum to enhance
portfolio risk management', Journal of Financial Planning, vol. 25, no. 2.
Michaud, RO 1989, 'The Markowitz optimization enigma: is ‘optimized’ optimal?', Financial
Analysts Journal, vol. 45, no. 1.
Michaud, RO 1998, Efficient Asset Management, Harvard Business School Press, Boston,
Mass.
Michaud, RO, Esch, DN & Michaud, RO 2012, 'Portfolio monitoring in theory and practice',
Journal of Investment Management, vol. 10, no. 4.
Morone, A 2008, 'Comparison of mean-variance theory and expected-utility theory through a
laboratory experiment', Economics Bulletin, vol. 3, no. 40.
Morrison, DG & Gluck, DJ 1970, 'Spurious correlations that result from 'awareness vs. usage'
type regressions', Journal of Marketing Research, vol. 7, no. 3.
Mossin, J 1966, 'Equilibrium in a capital asset market', Econometrica, vol. 34, no. 4.
Mueller, AG & Mueller, GR 2003, 'Public and private real estate in a mixed-asset portfolio',
Journal of Real Estate Portfolio Management, vol. 9, no. 3.
Nawrocki, DN 1991, 'Optimal algorithms and lower partial moment: ex post results', Applied
Economics, vol. 23, no. 3.
Nawrocki, DN 1999, 'A brief history of downside risk measures', Journal of Investing, vol. 8,
no. 3.
Neuhauser, K 2007, 'Survey research in finance', International Journal of Managerial
Finance, vol. 3, no. 1.
Neuman, WL 2011, Social Research Methods: Qualitative and Quantitative Approaches, 7th
edition. edn, Boston, Mass.
Neuner, S, Beinhofer, B & Knoke, T 2013, 'The optimal tree species composition for a private
forest enterprise – applying the theory of portfolio selection', Scandinavian Journal of Forest
Research, vol. 28, no. 1.
Nobel Prize 2013, The Sveriges Riksbank Prize in Economic Sciences 1990, viewed 25 March
2013, <http://www.nobelprize.org/nobel_prizes/economics/laureates/1990/index.html>.
Nocetti, D 2006, 'Markowitz meets Kahneman: portfolio selection under divided attention',
Finance Research Letters, vol. 3, no. 2.
Norkin, V & Boyko, S 2012, 'Safety-First portfolio selection', Cybernetics & Systems
Analysis, vol. 48, no. 2.

PhD Thesis – Lujer Santacruz
92
Notani, AS 1998, 'Moderators of perceived behavioral control's predictiveness in the Theory
of Planned Behavior: a meta-analysis', Journal of Consumer Psychology, vol. 7, no. 3.
Patton, AJ 2004, 'On the out-of-sample importance of skewness and asymmetric dependence
for asset allocation', Journal of Financial Econometrics, vol. 2, no. 1.
Peat, M & Wright, D 2012, 'The impact of residential property investment on portfolio
performance', JASSA: The Finsia Journal of Applied Finance, no. 2.
Pedersen, N, Page, S & Fei, H 2014, 'Asset allocation: risk models for alternative investments',
Financial Analysts Journal, vol. 70, no. 3.
Peiro, A 1999, 'Skewness in financial returns', Journal of Banking and Finance, vol. 23, no. 6.
Percival, J 1993, 'Why don't we just ask them?', Financial Practice & Education, vol. 3, no. 2.
Perold, AF & Sharpe, WF 1988, 'Dynamic strategies for asset allocation', Financial Analysts
Journal, vol. 44, no. 1.
Phillips, PJ 2009, 'Applying Modern Portfolio Theory to the analysis of terrorism', Defence
and Peace Economics, vol. 20, no. 3.
Pidun, U, Rubner, H, Krühler, M, Untiedt, R & Nippa, M 2011, 'Corporate portfolio
management: theory and practice', Journal of Applied Corporate Finance, vol. 23, no. 1.
Pınar, M 2007, 'Robust scenario optimization based on downside-risk measure for multi-
period portfolio selection', OR Spectrum, vol. 29, no. 2.
Polson, NG & Tew, BV 2000, 'Bayesian portfolio selection: an empirical analysis of the S&P
500 index 1970-1996', Journal of Business and Economic Statistics, vol. 18, no. 2.
Popescu, I 2007, 'Robust mean-covariance solutions for stochastic optimization', Operations
Research, vol. 55, no. 1.
Prigent, J-L 2007, Portfolio Optimization and Performance Analysis, Chapman & Hall/CRC,
Boca Raton.
Prigent, J-L 2010, 'Portfolio optimization and rank dependent expected utility', in World
Congress of the Econometric Society, Shanghai.
Qingxiong Ma, T & Liping, L 2004, 'The Technology Acceptance Model: a meta-analysis of
empirical findings', Journal of Organizational & End User Computing, vol. 16, no. 1.
Quaranta, AG & Zaffaroni, A 2008, 'Robust optimization of Conditional Value at Risk and
portfolio selection', Journal of Banking and Finance, vol. 32, no. 10.
Rengifo, E & Rombouts, J 2004, Dynamic optimal portfolio selection in a VAR framework,
Universite catholique de Louvain, Center for Operations Research and Econometrics (CORE),
CORE Discussion Papers: 2004057.
PhD Thesis – Lujer Santacruz
93
Rockafellar, RT & Uryasev, S 2000, 'Optimization of Conditional Value-at-Risk', Journal of
Risk, vol. 2, no. 3.
Rogers, EM 2003, Diffusion of Innovations, 5th edn, Free Press, New York.
Roy, AD 1952, 'Safety First and the holding of assets', Econometrica, vol. 20.
Rubinstein, M 2006, A History of the Theory of Investments: My Annotated Bibliography,
John Wiley & Sons, Hoboken.
Saade, R, Tan, W & Kira, D 2008, 'Is usage predictable using belief-attitude-intention
paradigm?', Issues in Informing Science and Information Technology, vol. 5.
Samuelson, PA 1969, 'Lifetime portfolio selection by dynamic stochastic programming', The
Review of Economics and Statistics, vol. 51, no. 3.
Santacruz, L 2013, 'The importance of strategic asset allocation', Journal of Business and
Economics, vol. 4, no. 3.
Santacruz, L & Phillips, PJ 2009, 'Are benchmark asset allocations for Australian private
investors optimal?', Journal of Wealth Management, vol. 12, no. 2.
Scherer, B 2002, 'Portfolio resampling: review and critique', Financial Analysts Journal, vol.
58, no. 6.
Scherer, B 2007, 'Can robust portfolio optimisation help to build better portfolios?', Journal of
Asset Management, vol. 7, no. 6.
Schyns, M, Crama, Y & Hübner, G 2010, 'Optimal selection of a portfolio of options under
Value-at-Risk constraints: a scenario approach', Annals of Operations Research, vol. 181, no.
1.
Sghaier, N & Boubaker, H 2013, 'Portfolio optimization in the presence of dependent financial
returns with long memory: a copula based approach', Journal of Banking and Finance, vol. 37,
no. 2.
Shadwick, W & Keating, C 2002, 'A universal performance measure', Journal of Performance
Measurement, vol. 6.
Sharpe, WF 1963, 'A simplified model for portfolio analysis', Management Science, vol. 9, no.
2.
Sharpe, WF 1964, 'Capital asset prices: a theory of market equilibrium under conditions of
risk', Journal of Finance, vol. 19, no. 3.
Sharpe, WF 2007, 'Expected utility asset allocation', Financial Analysts Journal, vol. 63, no.
5.
Sharpe, WF 2010, 'Adaptive asset allocation policies', Financial Analysts Journal, vol. 66, no.
3.

PhD Thesis – Lujer Santacruz
94
Sheeran, P 2002, 'Intention behavior relations: a conceptual and empirical review', European
Review of Social Psychology, vol. 12, no. 1.
Sheikh, AZ & Hongtao, Q 2009, 'Non-normality of market returns: a framework for asset
allocation decision making', Journal of Alternative Investments, vol. 12, no. 3.
Simkowitz, MA & Beedles, WL 1978, 'Diversification in a three-moment world', Journal of
Financial and Quantitative Analysis, vol. 13, no. 5.
Simon, HA 1959, 'Theories of decision-making in economics and behavioral science',
American Economic Review, vol. 49, no. 3.
Sortino, F & Price, L 1994, 'Performance measurement in a downside risk framework', The
Journal of Investing, vol. 3, no. 3.
Stabile, D 2005, Forerunners of Modern Financial Economics: a Random Walk in the History
of Economic Thought, Edward Elgar, Cheltenham Northampton.
Steinbach, MC 2001, 'Markowitz revisited: mean-variance models in financial portfolio
analysis', SIAM Review, vol. 43, no. 1.
Stevenson, S 2000, 'Bayes Stein estimators and international real estate allocation', in Pacific
Rim Real Estate Society Conference, Sydney.
Sutton, S 1998, 'Predicting and explaining intentions and behavior: how well are we doing?',
Journal of Applied Social Psychology, vol. 28, no. 15.
Tobin, J 1958, 'Liquidity preference as behavior towards risk', The Review of Economic
Studies, vol. 25, no. 2.
Tsagaris, T, Jasra, A & Adams, N 2012, 'Robust and adaptive algorithms for online portfolio
selection', Quantitative Finance, vol. 12, no. 11.
Tsao, C-Y 2010, 'Portfolio selection based on the mean-VAR efficient frontier', Quantitative
Finance, vol. 10, no. 8.
Tütüncü, RH & Koenig, M 2004, 'Robust asset allocation', Annals of Operations Research,
vol. 132, no. 1-4.
Unser, M 2000, 'Lower partial moments as measures of perceived risk: an experimental study',
Journal of Economic Psychology, vol. 21, no. 3.
Venkatesh, V, Morris, MG, Davis, GB & Davis, FD 2003, 'User acceptance of information
technology: toward a unified view', MIS Quarterly, vol. 27, no. 3.
Von Neumann, J & Morgenstern, O 1947, Theory of Games and Economic Behavior, 2d edn,
Princeton University Press, Princeton.
Wang, C-P, Shyu, D, Liao, YC, Chen, M-C & Chen, M-L 2003, 'A model of optimal dynamic
asset allocation in a Value-at-Risk framework', International Journal of Risk Assessment and
Management, vol. 4, no. 4.

PhD Thesis – Lujer Santacruz
95
Weaver, SC 1993, 'Why don't we just ask them?', Financial Practice and Education, vol. 3,
no. 2.
Wojt, A 2010, 'Portfolio Selection and Lower Partial Moments', Royal Institute of
Technology, Stockholm, Sweden.
Xiong, JX, Sullivan, RN & Wang, P 2013, 'Liquidity-driven dynamic asset allocation', Journal
of Portfolio Management, vol. 39, no. 3.
Xiong, JX, Ibbotson, RG, Idzorek, TM & Chen, P 2010, 'The equal importance of asset
allocation and active management', Financial Analysts Journal, vol. 66, no. 2.
Yao, H, Li, Z & Lai, Y 2013, 'Mean–CVaR portfolio selection: a nonparametric estimation
framework', Computers & Operations Research, vol. 40, no. 4.
Ye, J & Li, T 2012, 'The optimal mean-variance investment strategy under Value-at-Risk
constraints', Insurance: Mathematics and Economics, vol. 51, no. 2.
Yu, J-R & Lee, W-Y 2011, 'Portfolio rebalancing model using multiple criteria', European
Journal of Operational Research, vol. 209, no. 2.
Zhang, B, Yang, S & Bi, J 2013, 'Enterprises’ willingness to adopt/develop cleaner production
technologies: an empirical study in Changshu, China', Journal of Cleaner Production, vol. 40.