assessment, used as its point of departure damage and ... · 4. social/demographic profile of the...
TRANSCRIPT

1
THE COMMONWEALTH OF
DOMINICA: SOCIAL AND
LIVELIHOOD ASSESSMENT
FOLLOWING
TROPICAL STORM ERIKA Government of the Commonwealth of Dominica with the
Technical Assistance of the UNDP, Barbados and the OECS
ABSTRACT The Social and Livelihoods Assessment
following the Impact of TS Erika situates
itself within the framework of social
vulnerability and disaster risk reduction. In
keeping with the PDNA methodology which
undertakes assessments using both a
sectoral approach and a bottom up
approach, this Social and Livelihoods
Assessment, used as its point of departure
the data sets and outputs of the Rapid
Damage and Impact Assessment (September
2015). Its analysis occurs through a focus on
the affected population, the social sector –
housing, education, health with specific
examination of the social protection
measures; and the productive sector,
particularly agriculture, tourism and
commerce.
Asha Kambon, Vincent Little, Lancelot Busby, Marlene Johnson, Nigel Mitchell

2

3
Acronyms and Abbreviations
CARICOM Caribbean Community
CBO Community-Based Organization
CCA Climate Change Adaptation
CEDAW Convention on the Elimination of All Forms of
Discrimination against Women
CPA Country Poverty Assessment
CSO Central Statistical Office
DFID Department for International Development, United
Kingdom
DRR/DRM Disaster Risk Reduction/Disaster Risk Management
EC Eastern Caribbean
EU European Union
FY Fiscal Year
GDP Gross Domestic Product
GFP Gender Focal Point
GOCD Government of the Commonwealth of Dominica
GSPS Growth and Social Protection Strategy
IADB Inter-American Development Bank
IICA Inter-American Institute for Cooperation on Agriculture
ILO International Labour Organization
MDGs Millennium Development Goals
MSMEs Micro Small and medium Enterprises
NGO Non-Governmental Organization
OECS Organization of Eastern Caribbean States
PAHO Pan American Health Organization
PDNA Post Disaster Needs Assessment
TSE Tropical Storm Erika/ TS Erika
UN United Nations
UNDP United Nations Development Programme
UNECLAC United Nations Economic Commission for Latin America
and the Caribbean
UN Women United Nations Entity for Gender Equality and the
Empowerment of Women
WB The World Bank – The International Bank for
Reconstruction and Development

4
Table of Contents Executive Summary ..................................................................................................................................................... 8
Justification for the Study and its Methodology ..................................................................................................... 13
a. Justification ................................................................................................................................... 13
b. Methodology .................................................................................................................................. 15
Section One: The Affected Population .................................................................................................................... 16
A. A Social Perspective of Dominica in the Wake of TSE ................................................................... 16
1.Description of Storm and its Effects ............................................................................................................. 16
2. Dominica and its Vulnerability to Natural Disasters ................................................................................ 18
B. TSE: Its Effects on the Population .................................................................................................. 19
1. Social and Demographic Characteristics ................................................................................................... 19
2. Socio Economic Status of the Affected Population ................................................................................ 24
3. Livelihoods of Affected Population ......................................................................................................... 27
4. Effects on the Quality of Life .................................................................................................................. 28
Section Two: Detailed Social and Livelihoods Analysis by Areas of Focus ......................................................... 31
A. Agriculture ....................................................................................................................................... 31
1. Introduction .............................................................................................................................................. 31
2. Sectoral Context ....................................................................................................................................... 31
3. Identifying Vulnerable Livelihoods ........................................................................................................ 32
4. The Vulnerable Livelihoods .................................................................................................................... 33
5. Assets of Farmers ..................................................................................................................................... 35
6. Livelihood Activities and Outcomes ....................................................................................................... 35
7. Fisheries: Description of the Livelihood ................................................................................................. 37
8. Social and Livelihood Impact of Erika on Agriculture ......................................................................... 38
9. Recovery Interventions ............................................................................................................................ 39
B. Tourism .......................................................................................................................................... 40
1. Background............................................................................................................................................... 40
2. The Effects of Tropical Storm Erika ...................................................................................................... 41
3. The Pre Disaster Situation ....................................................................................................................... 42
4. Vulnerability Assessment of the Tourism Sector in Dominica ................................................................. 43
5. Details of the Effects of TS Erika on the Tourism Sector ..................................................................... 43
C. Commerce ...................................................................................................................................... 45
1. Overview ................................................................................................................................................... 45
2. Formal Market Sector ............................................................................................................................. 46
3. Informal Market Sector ........................................................................................................................... 50

5
D. Social Sector .................................................................................................................................................. 54
1. Housing .......................................................................................................................................... 54
2. Education ....................................................................................................................................... 59
3. Health ............................................................................................................................................. 60
4. Social Protection ............................................................................................................................ 62
a. Overview of the Social Programmes ....................................................................................................... 63
b. Response to TS Erika ............................................................................................................................... 64
c. Assessment of Social Protection Programmes ....................................................................................... 66
D. Livelihoods and Social Protection Mechanisms Before and After the Event ...................................... 68
Section Three: Recommendations for Sustainable Livelihoods ............................................................................. 70
Recovery................................................................................................................................................. 70
Sustainable Livelihoods ........................................................................................................................ 70
Livelihoods and Women ....................................................................................................................... 72
Livelihoods and Social Capital............................................................................................................. 73
MATRIX – INITIATIVES FOR SUSTAINABLE LIVELIHOODS ...................................................................................... 74
Annex 1. References .................................................................................................................................................. 87
Annex 2. List of Persons Consulted............................................................................................................................ 90
Annex 3. Tables ........................................................................................................................................................... 91
6
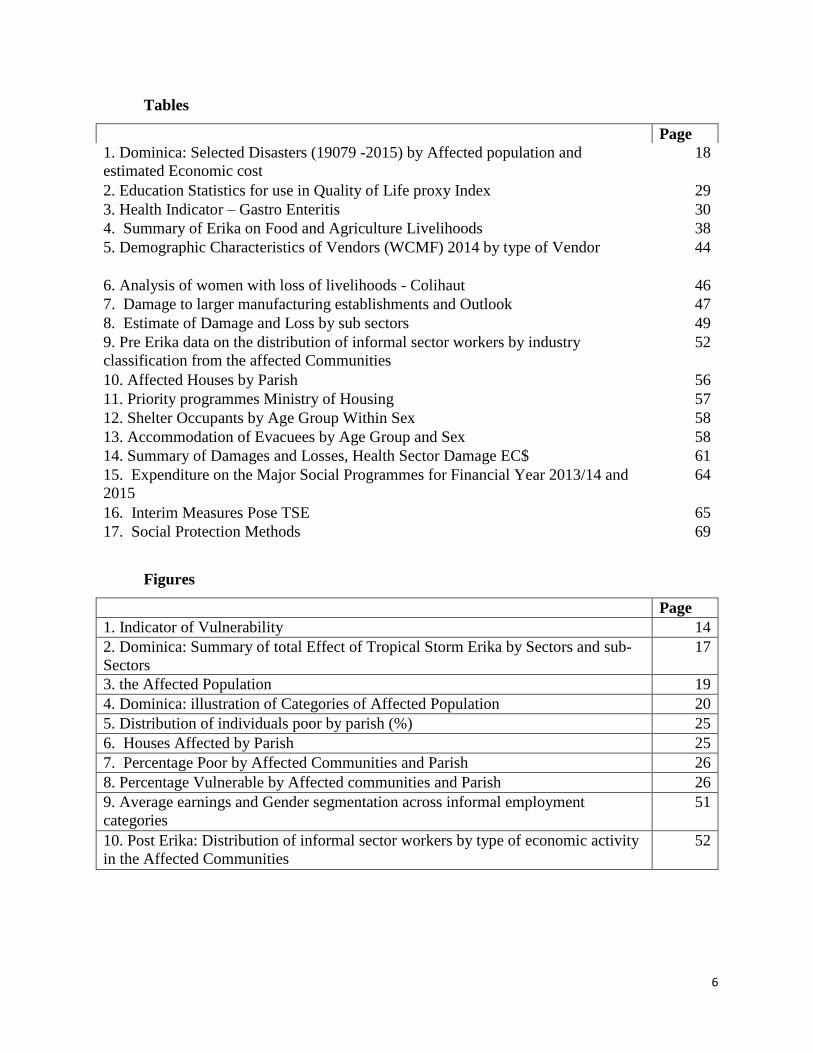
Tables
Page
1. Dominica: Selected Disasters (19079 -2015) by Affected population and
estimated Economic cost
18
2. Education Statistics for use in Quality of Life proxy Index 29
3. Health Indicator – Gastro Enteritis 30
4. Summary of Erika on Food and Agriculture Livelihoods 38
5. Demographic Characteristics of Vendors (WCMF) 2014 by type of Vendor 44
6. Analysis of women with loss of livelihoods - Colihaut 46
7. Damage to larger manufacturing establishments and Outlook 47
8. Estimate of Damage and Loss by sub sectors 49
9. Pre Erika data on the distribution of informal sector workers by industry
classification from the affected Communities
52
10. Affected Houses by Parish 56
11. Priority programmes Ministry of Housing 57
12. Shelter Occupants by Age Group Within Sex 58
13. Accommodation of Evacuees by Age Group and Sex 58
14. Summary of Damages and Losses, Health Sector Damage EC$ 61
15. Expenditure on the Major Social Programmes for Financial Year 2013/14 and
2015
64
16. Interim Measures Pose TSE 65
17. Social Protection Methods 69
Figures
Page
1. Indicator of Vulnerability 14
2. Dominica: Summary of total Effect of Tropical Storm Erika by Sectors and sub-
Sectors
17
3. the Affected Population 19
4. Dominica: illustration of Categories of Affected Population 20
5. Distribution of individuals poor by parish (%) 25
6. Houses Affected by Parish 25
7. Percentage Poor by Affected Communities and Parish 26
8. Percentage Vulnerable by Affected communities and Parish 26
9. Average earnings and Gender segmentation across informal employment
categories
51
10. Post Erika: Distribution of informal sector workers by type of economic activity
in the Affected Communities
52

7
Boxes
Page
1. Key Findings 9
2. Key Recommendations 10
3. Profiles of Affected Communities 22
4. Social/Demographic profile of the Affected population 24
5. livelihood Profile of Affected Population 27
6. Selected Indicators for measuring a change in the quality of life following a disaster
28
7. Livelihoods most vulnerable to food insecurity in Dominica 33
8. Summary of Farmer livelihood Profile 36
9. Summary of Fisher folk Livelihood Profile 37
10. Time Phasing of the Extended Programme of House Construction 55
11. Actions to reduce Vulnerability 62
12. Status on the Achievements of the MDGs 63
13. Post Tropical Strom Erika: Social protection Measures 65
14. Strengths and Challenges Associated with Post TSE Measures 67
15. Livelihoods and Assets 71

8
Executive Summary
On the morning of Thursday August 27th, 2015, Dominica was hit by Tropical Storm Erika (TS Erika),
which bombarded the island with rainfall for approximately nine hours.
Torrential rain triggered massive landslides and flooding. Rivers and streams surged carrying boulders and
debris destroying villages, homes, roads, bridges and land. Lives were lost and many people continue to be
displaced due to loss of property, personal effects and livelihoods. TS Erika has been regarded as the most
devastating weather event since Hurricane David in 1979.
A team of Assessors was commissioned by the UNDP on behalf of the Government of the Commonwealth
of Dominica (GCOD), in January 2016, to undertake a Social and Livelihoods assessment of the impact of
TS Erika. The team arrived in Dominica for a two week period (January 18-29) in order to conduct its
investigations and presents its findings through this report. A preliminary report of findings was presented
before the team left island to senior Government officials.
The social and livelihoods assessment in the Commonwealth of Dominica situates itself within the
framework of Social Vulnerability and Disaster Risk Reduction. In keeping with the PDNA (Post Disaster
Needs Assessment) methodology which undertakes assessments using both a sectoral approach and a
bottom up approach, this Social and Livelihoods Assessment, used as its point of departure the data sets
collected as part of the Rapid Damage and Impact Assessment.
Sector experts undertook the social and livelihoods analysis through a focus on the affected population; the
social sector – housing, health and education, with a specific examination of the social protection measures;
the productive sector, particularly agriculture, tourism and commerce. Infrastructure had been thoroughly
examined by the Rapid Assessment undertaken earlier, and so was not included as part of this examination.
Like most of its Caribbean neighbours, Dominica is very vulnerable to multiple hazards, some of which
could occur simultaneously. The country has nine live volcanoes and experiences frequent seismic and
geothermal activity. Dominica’s terrain renders damage to physical infrastructure greater than in other
countries of the Region and the cost of rehabilitation higher.
In light of Dominica’s vulnerabilities, there is an expectation that the economic impact of disasters would
be large, resulting in the disruption of economic activity, loss of income, fiscal and external account
imbalances and increased poverty. And indeed the effects of TS Erika were in keeping with those
expectations. TS Erika resulted in damage and loss of EC 1.3billion (US$483 million), equivalent to
approximately 90% of the Dominica’s Gross Domestic Product (GDP). It has been estimated that as a result
of TS Erika, some 15,900 persons or 23% of the national population was directly affected. Of the population
that resided in the Affected Parishes, some 32% were affected. Almost 43% of the affected population were
among the primary affected, experiencing, death, injury, psycho-social trauma, loss of material assets,
livelihoods and income. Another 46% were among the secondary affected who suffered losses in
production, and income and access to services.
It was evident that despite the very localised nature of the effects of TSE, the entire population of Dominica
was affected if not directly by having family or friends affected, then indirectly by the ensuing disruption
caused by the effects to the island’s infrastructure. Still yet others experienced the psycho-social trauma.
Dominicans together, will have to face the direct and indirect challenges of recovery presented by TS Erika.
The data analysed for this Report, suggested that the poorest Parish, St Joseph was also among the Parishes
that were severely affected by TS Erika with the loss of over 200 houses. The Parishes of St. Patrick and St
David which contained between 40 and 42 percent poor, and over 50 percent of its population deemed

9
vulnerable had by far ( 41%), the largest proportion of households affected including destroyed, partially
destroyed and at risk. The highest number of homes totally destroyed were found in St Patrick (250)
followed by St. Joseph (50). The data further suggests that the Parish of St. George, which was among those
Parishes identified with the second highest level of vulnerable households, had the largest number of
affected communities, as a result of TS Erika.
The Report noted that one would expect that a significant portion of the population which had been living
above the poverty line but below the vulnerability line, may now have succumbed to their vulnerability and
have been pushed into poverty. The Report also notes that the quality of life of the affected population has
changed for the worse.
The key findings are presented in Box 1 and the key recommendations in Box 2.
Box 1. Key Findings
Building Blocks for Sustainable Livelihoods
The Report notes that there are two key building blocks to sustainable livelihoods. One is diversification
of livelihoods and the other is people’s participation in the decision making processes regarding their
livelihoods.
The literature suggests that over reliance on certain assets, particularly natural and physical livelihood
assets, as often occurs in agriculture, can mean greater vulnerability to shocks. Insurance is seen as an
alternative strategy for coping with risk. But for many who are unable to afford insurance, the strategy of
choice is livelihood diversification. The greater the diversity of income, the greater is the resilience of
livelihoods to disruption from particular shocks.
For most of the Affected population, who were among the working poor and vulnerable, one means of
livelihoods was not an option. Affected persons, if they were women reported that they worked their
farms or backyard gardens and then sought a day’s pay, bundling bay leaves to make a ‘batch’ or doing a
little domestic work, weeding a garden or providing services in the tourism sector or elsewhere. Men
undertook their fishing or farming and then worked construction, carpentry or security.
The World Bank suggests that participatory decision-making processes can improve the diversification of
coping strategies for disasters and help address the causes of different vulnerabilities, rather than just their
consequences. The Assessors, were of the view that greater inclusion of the poor in governance and in the
Key Findings: Within the Affected population -
1. Many who would have been classified as vulnerable, have fallen into poverty as a result of TS
Erika
2. Many who were food secure are at risk of food insecurity.
3. The Social Protection Measures which have absorbed the affected population, are safeguarding
many from outright indigence.
4. Many of the ‘working poor’ are now without an avenue for economic activity, through
displacement, land loss, or destruction of other means of livelihoods.
5. Women who head households are particularly vulnerable due to large family size, low skills set
and loss of asset base.
6. Social capital is strong but under threat due to dislocation.
10
decision- making process, around recovery and livelihood options, would strengthen the implementation
process and result in a timely delivery of initiatives.
Box 2. Key Recommendations
Social Protection Measures
The Report noted that Government’s response to the effects of TS Erika had been immediate and
comprehensive.
The early social protection measures put in place by the Government and delivered through its various inter-
Ministerial clusters have been effective in halting the transition of many families living in states of transient
poverty, from descending into indigence.
The more recent initiatives which are seeking to scale up Social Protection Measures for livelihoods support
approved by Cabinet in early January 2016, are geared to get people back up on their feet and enable some
restoration of livelihoods. It is still too early to ascertain the livelihood outcomes of these measures. They
include fiscal allocations to meet the needs of the livelihoods of fisher folk; payments to address stock
and equipment damage, which may impact on the livelihood of self-employed/ business owners; support
for repair of structural damage to houses which should impact positively on home-based business
particularly relevant to women; and the waiver of import duties for vehicle owners for a period of 6 months
which should impact favourably on business persons, mainly males, involved in the tourism and transport
services industry.
Building in greater participatory processes into the programmes would ensure greater success and
effectiveness.
Key Recommendations:
1. Introduce improved watershed management systems – crop rotation, construction of terrace, contour strip
cropping, selective planting and reforestation.
2. Improve the skills base needed for participation in tourism livelihoods activities.
3. Train women in the non-traditional skills, such as tiling, masonry and electrical works to facilitate their
employment in the construction sector
4. Prioritise community tourism initiatives to reduce the livelihood impacts of TS Erika
5. Utilise the potential for expansion which exists in the Fisheries sub sector of Agriculture
6. Develop community services i.e. community care for children of single mothers and community care for
elderly, as a source of employment and to facilitate women’s mobility into the labour market.
7. Strengthen the adult education programmes for small farmers, fisher folk, small manufacturers particularly
in the agro-industrial production of coconut oil and bay oil, cocoa sticks, castor oil, etc.
8. Establish within the State College a “Centre of Excellence for Agro-Eco Tourism”
9. Establish an Agricultural Health and Food Safety Agency with related capacity and capability, to guide
small and medium size food processors anxious to reach markets.
10. Safeguard social capital through strengthened local government mechanisms and efforts at participatory
approaches during resettlement programmes.

11
Agriculture
The Assessment concluded that the working poor (wage and salary workers) constitute a livelihood in
Dominica that is vulnerable to food insecurity.
These included farmers, fisher folk and those engaged in non-agricultural economic activities. Despite
accounting for only about 10.4% in real terms of Dominica's GDP, agriculture makes a significant
contribution to the livelihoods of about 40% of the population who are engaged in varying degrees of
farming and related activities. Approximately 4,343 farmers and fisher-folk and related inter-sectoral
linked livelihoods were impacted by Tropical Storm Erika, representing household membership of 13,593
persons. This affected food and agriculture sector population represents approximately 46.8% of the
population vulnerable to food insecurity.
The Report noted that human capital among farmers and fisher folk in Dominica is variable. The level of
education of the farmers based on the 1995 Agricultural Census, shows that only 13.1% of all farmers have
achieved the secondary school and higher educational levels. Older farmers and fisher folk generally
completed primary education while some of their younger counterparts have completed some secondary
education and beyond. However, farmers generally have good skills in farming and are in fair health. Both
farmers and fisher folk nevertheless, are being threatened by the nutrition-related/life-style chronic diseases
(mainly diabetes and hypertension) and obesity.
Social cohesion within this livelihood appears to be strong with frequent support given by the community to
persons who may be in need. Some households in this livelihood do receive support (remittances, barrels, etc.)
from relatives living abroad, although this has declined significantly in recent years following the recession in
the developed countries.
Tourism
Tourism and related services are the largest income earners in the economy of the Commonwealth of Dominica
to date. At an average of $275 million over the last three years, tourism revenues now account for an increasing
percentage of annual GDP. The Report indicates that one out of every eight employed persons in the country
work in tourism and related activities and concludes that decline of the sector would significantly impact the
economy, as witnessed by the sudden visitor arrival down turn after the passage of Tropical Storm Erika in
August of 2015. A little over 250 persons lost employment in the sector as a result of the effects of TS Erika.
The projected decline of 5.6% in tourism activity was estimated at $45.9million or 3.3% of GDP. Signs of
recovery were expected as early as 2016, but not all those who lost jobs would regain them in the recovery
efforts.
The Report is well aware that the private sector will take advantage of the opportunities to participate in the
development of the Tourism Sector, initiatives which should be encouraged, and as such the sector will absorb
some persons from the labour market. However, it will be left for Government initiatives to ensure that the
working poor of Dominica, have opportunities to participate in the sector and reap benefits from the expected
growth.
The Report concluded that Community tourism affords the best opportunities for sustainable livelihoods in
the industry. Community Tourism has long been recognised as an important part of the tourism industry in
Dominica and as a programme has received external funding in the past. Additionally, the Tourism Master
Plan has articulated a clear subsector development strategy. The report concludes that in the recovery and
reconstruction period prioritising community tourism initiatives remain the most sustainable initiative to
reduce the livelihood impacts of TS Erika.

12
Commerce and Non-Agricultural Economic Activities
The Report explored economic activities in the formal and informal sectors.
In the Formal labour market, the Report noted that 5 large manufacturing establishments were severely
affected and some 196 Micro, Small and Medium Sized Enterprises (MSME) were hard hit as a result of
TS Erika. Of the MSMEs many had limited or no insurance coverage, some suffered temporary or
permanent closure of business due to damage to structures, flooding of premises and loss of stock and
equipment. Others suffered total loss of income and livelihood. Significant damage was done to the small
manufacturing sector. Five of the 71 manufacturers contacted by the Ministry reported damage resulting
in the loss of livelihoods amounting to over 500 workers who were displaced.
Data on the informal sector was scarce however, some preliminary data collected suggested that there were
a wide range of informal economic activities being undertaken in the affected communities prior to Tropical
Storm Erika. As was expected, many of the activities were home based or formed the ‘backyard economy’.
The data suggested that some 40% of those existing informal economic activities had been disrupted and
that women were engaged in approximately 55% of those activities.
Women predominated in the wholesale and retail trade sub-sector but there were a few in the manufacturing
subsector producing agro industrial products such as cocoa sticks and castor oil. Others could be found
manufacturing clothing. The services sector which is captured in the ‘Other’ category found a number of
women involved in provision of services for the tourism industry. Men predominated in the repair of motor
vehicles and motor cycles and the manufacturing of agro industrial products particularly with regard to the
Bay Oil (essential oils) industry.
Of significance, the Report noted that in addition to engaging in formal or informal economic activities,
almost all affected households reported being engaged to some degree in agricultural activity.
Financing for Recovery – Sustainable Livelihoods
Although lying outside of the remit of the Team, the Assessors were of the view that in light of the public
debt burden of the country which as of end-FY 2014/15, was estimated to be around 80 percent of GDP1,
financing of the recovery would be better serviced if in addition to Government’s fiscal and budgetary
allocations, debt relief could be obtained, grant aid be provided and low interest loans be facilitated.
Report Structure
Following the Executive Summary, the Report provides a justification for undertaking the Social and
Livelihoods Assessment and a description of its Methodology. It is then divided into three sections, the
first, provides information about the Affected Population, the second a detailed social and livelihoods
analysis by four areas of focus: The Productive Sectors of Agriculture, Tourism and Commerce and non-
agricultural economic activities; and the Social sectors (of Housing, Education and Health) and Social
Protection Measures. Section three of the report presents the Recommendations for Sustainable
Livelihoods with detailed matrices for each area of focus. The Report is followed by Annexes containing
references, lists of persons consulted and tables.
1 Dominica: Request for disbursement under the Rapid Credit Facility. 2015

13
Justification for the Study and its Methodology
a. Justification
The Justification for undertaking the Social and livelihood Assessment is threefold: (a) Dominica’s
vulnerability to disasters, the effects of TS Erika on its infrastructure and its underlying economic
fundamentals , its high degree of vulnerability which puts Dominica at risk for future events of a similar
or greater magnitude in light of its own hazards and the expectations of climate change and variability; (b)
the Government’s desire to have the best information necessary to meet the social needs of the population
, increase the resilience of existing livelihoods, strengthen livelihood possibilities and reduce the burden
of the state; and (c) the Rapid Damage and Impact Assessment which in the main had as its focus the
effects of the event on the island’s infrastructure.
The assessment of livelihoods in the Commonwealth of Dominica situates itself within the framework of
Social Vulnerability and Disaster Risk Reduction. Vulnerability is defined as “the characteristics and
circumstances of a community, system or asset that make it susceptible to the damaging effects of a
hazard”.2 Although DIFID3 notes that vulnerability is not the same as poverty and should not be equated
with marginalization, or other notions that identify sections of the population who are deemed to be
disadvantaged, at risk, or in other ways in need, poverty and vulnerability are closely linked.
The CPA of 2008/9, 4 sought to addresses vulnerability by setting a vulnerability line at 25% above the
poverty line. It argued that households consuming at levels below the vulnerability line are deemed to be
‘vulnerable’ and at risk of falling into poverty should any adverse economic shock or natural disaster occur.5
It concluded that 11% of the population was vulnerable.
St. Bernard (2007) argued that social vulnerability is the “inability of human units (individuals, households
or families) or communities to cope with and recover from stresses and shocks, their inability to adopt to
and exploit changes in physical, social and economic environments and their inability to maintain and
enhance future generations”.6 The opposite of social vulnerability is sustainability. Important to the notion
Social sustainability is the ability to maintain desired social values, traditions, institutions, cultures and
other social characteristics.
The difference between poverty and vulnerability it has been argued is that poverty is a measure of current
status while vulnerability should involve a predictive quality. Vulnerability should assist us in
conceptualising what may happen to an identifiable population under conditions of particular risks and
hazards.
2 UNSIRD. https://www.unisdr.org/we/inform/terminology 3 Social Vulnerability, Sustainable Livelihoods and Disasters. Report to DFID Conflict and Humanitarian Assistance Department (CHAD) and Sustainable Livelihoods Support Office Source 22/01/2016: ipcc-wg2.gov/njlite_download.php? id=6377 4 Country Poverty Assessment – Dominica. Final Report Vol.1 Main Report Section 1.2 pg 2 5 CPA pg 42 6 MEASURING SOCIAL VULNERABILITY IN CARIBBEAN STATES. A Paper prepared by Dr Godfrey St. Bernard, ISER, U.W.I. March, 2007 Source: https://sta.uwi.edu/conferences/salises/documents/St%20Bernard%20%20G.pdf

14
A fresh approach which links vulnerability to livelihoods analysis7 is one which investigates the extent to
which livelihood diversification could reduce vulnerability. The investigation concludes that resilience
improves with the increased diversification of the livelihoods of the poor. It further notes that the factors
which improves the chances for livelihood diversification are the educational attainment of the head of the
household, the dependency ratio of the household i.e. the house hold size commensurate with the number
of working age members and the age of the head of the household, suggesting where the heads of
households are young their capacity for diversification of their livelihoods may be weak. Figure 1 illustrates
the manner in which livelihoods diversification responds to vulnerability.
Figure 1. Indicator of vulnerability
Vulnerability is usually explored in its three dimensions: environmental (physical), economic and social.
Although this paper has as its focus the issue of social vulnerability and its converse social sustainability,
it will touch on the other two dimensions of vulnerability as the notion is a tightly integrated concept.
7 Gender, Ethnicity and Climate Change in Mexico: An analysis of vulnerability and resilience based on household surveys. Lykke E. Andersen, Anna Sophia Doyle, Dorte Verner and Manfred Wiebelt http://www.inesad.edu.bo/pdf/wp2014/wp07_2014.pdf

15
b. Methodology
In keeping with the PDNA methodology which undertakes assessments using both a sectoral approach and
a bottom up approach, this Social and livelihoods Assessment, used as its point of departure the data sets
collected as part of the Rapid Damage and Impact Assessment.8 The team updated data sets where necessary
and where gaps existed sought to fill those, both through the production of pre and post data sets, in order
to better undertake the gap analysis and understand the situation as it pertained to the social conditions and
the livelihood choices and possibilities of the Affected Population as a result of Tropical Storm Erika.
The study used a combination of literature review, data collection and analysis, key informant interviews
and focus group discussions to ensure a rich analysis. Sector experts undertook a livelihoods analysis
through a focus on the affected population; the social sector – housing, health and education, including the
social protection measures; and the productive sector particularly agriculture, tourism and commerce.
Infrastructure had been thoroughly examined by the Rapid Assessment undertaken earlier, so this material
formed part of the literature reviewed. Through an examination of the effects of the event on these sectors,
the Experts sought to identify recommendations for sustainable livelihoods.
The process of this examination allowed for previously unidentified issues to emerge. Key among these
was the psycho social dimension of the impact of the event on the population and the significance of social
capital in the processes of resettlement.
8 Rapid Damage and impact Assessment. Tropical Storm Erika – August 27th 2015. A Report by the Government of the Commonwealth of Dominica September 25, 2015.

16
Section One: The Affected Population
A. A Social Perspective of Dominica in the Wake of TSE
1. Description of Storm and its Effects
On the morning of Thursday August 27th, 2015, Dominica was affected by Tropical Storm Erika, which
bombarded the island with rainfall for approximately nine hours.
At the conclusion, Dominica was left with a trail of destruction and devastation leaving dead, injured, and
missing particularly in the south eastern community of Petite Savanne. The Ministry of Planning,
Economic Development and Investment reported that there have been 14 confirmed deaths and 18 persons
missing.9 Over 800 households were left homeless. The community of Petite Savanne was voluntarily
evacuated due to the severity of damage and catastrophic impact resulting from landslides. Communication
broke down within and among various communities around the island, a consequence of extensive damage
to roads, bridges, telecommunications, ports both air and sea and almost all major infrastructure.
The Rapid Damage and Impact Assessment10 reported that “gauge readings taken at Canefield Airport
indicated the rain event started at approximately 7:00am local time and continued through 6:00pm. As
recorded at Canefield, the heaviest accumulation occurred between 7:00am and 12 noon with an
accumulation of approximately 200 mm (nearly 8 inches over the 5 hour period). Data recorded from the
Gleau Gormmier station, located in the mountains near the center of the island, indicated that rainfall
accumulation on the 27th between 1:00am and 5:00pm was 17.08 inches or 434mm of which 14.1 inches
(359.7mm) accumulated from 4:00am to 9:00am which was higher than the Canefield data. As a result of
the intense rainfall in combination with steep topography and relative short distance from the centre
mountain ridge to the coastal areas (6 miles or so), flash flooding rapidly ensued with little warning to the
population.”
The Report concluded that the “combination of intense rainfall, unusual dry season and cracking of clay
soils contributed to slope failures and debris generation which resulted in major damages and fatalities
throughout Dominica.”
“Torrential rain triggered massive flooding, rivers and streams surged thus carrying boulders and debris
destroying homes, roads, bridges and land. Heavy rains also caused major landslides which engulfed homes
and in some cases entire villages. Many people continue to be displaced due to loss of property, personal
effects and livelihoods”.11
The Government of Dominica declared nine (9) special disaster areas namely Petite Savanne, Pichelin,
Good Hope, Bath Estate (Paradise Valley), Dubique, Coulibistrie, San Sauveur, Petite Soufriere and
Campbell. The entire villages of Petite Savanne and Dubique are both uninhabitable. A total of 557
persons were evacuated as follows: Petite Savanne (515 persons by sea, 36 persons by air); Delices (6
persons by air).
9 Ministry of Health and Environment. Health Sector Report 10/21/2015, initially reported injured, numbering 20. Page 8. The number has been reassessed to 62. 10 Rapid Damage and impact Assessment, Tropical Storm Erika – August 27th, 2015. A Report by the Government of the Commonwealth of Dominica. 11 Post Tropical Storm Erika: Health Sector Report. Ministry of Health and Environment. 10/21/2015

17
It has been concluded that TS Erika resulted in damage and loss of EC 1.3billion (US$483 million),
equivalent to approximately 90% of the Dominica’s Gross Domestic Product (GDP).12 The greatest effect
of the event was felt in the transport sector (60%), followed by housing (11%) and agriculture (10%), as
illustrated in Figure 2.
Figure 2.
Dominica: Summary of Total Effect of Tropical Storm Erika
by Sectors and sub-sectors
Source: Table 1, Rapid Damage and Impact Assessment Tropical Storm Erika – August 27, 2015.
12 Dominica GDP (2014 – in Current US$) $537.8 million. World Development Indicators, the World Bank , 2015
0 200 400 600 800 1000
Agriculture,Fisheries and Forestry
Tourism
Industry and Commerce
Wate and SANITATION
Air and Sea ports
Roads and bridges
Electricity
Telecomm
Housing
Education
Health
sectors
(millions EC$)
18
2. Dominica and its Vulnerability to Natural Disasters
The events surrounding TS Erika, although extreme, were not outside of the known hazards to which
Dominica is exposed. Aside from hurricanes and volcanic eruptions, Dominica is prone to earthquakes,
landslides, river floods, and heavy seas that often cause damage to the transportation network and cause
environmental degradation. It has been concluded that Dominica is extremely vulnerable to disasters,
ranking 12 in the Composite Vulnerability Index, produced by the Commonwealth Secretariat and the
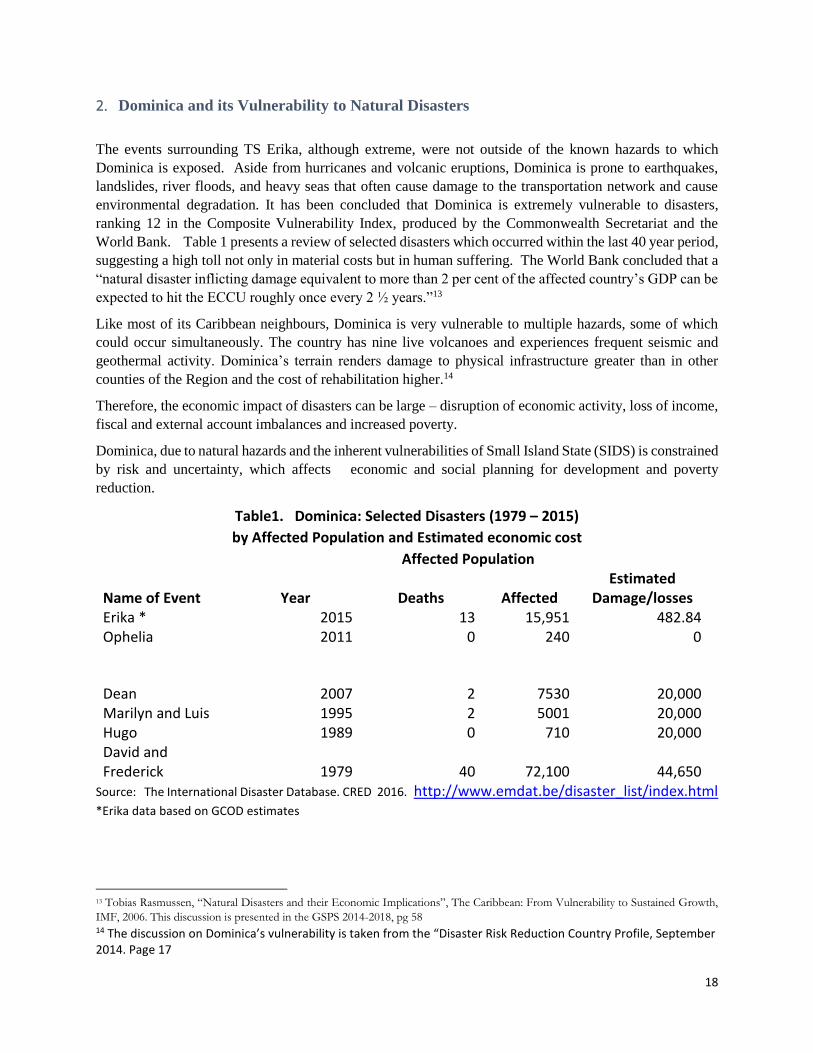
World Bank. Table 1 presents a review of selected disasters which occurred within the last 40 year period,
suggesting a high toll not only in material costs but in human suffering. The World Bank concluded that a
“natural disaster inflicting damage equivalent to more than 2 per cent of the affected country’s GDP can be
expected to hit the ECCU roughly once every 2 ½ years.”13
Like most of its Caribbean neighbours, Dominica is very vulnerable to multiple hazards, some of which
could occur simultaneously. The country has nine live volcanoes and experiences frequent seismic and
geothermal activity. Dominica’s terrain renders damage to physical infrastructure greater than in other
counties of the Region and the cost of rehabilitation higher.14
Therefore, the economic impact of disasters can be large – disruption of economic activity, loss of income,
fiscal and external account imbalances and increased poverty.
Dominica, due to natural hazards and the inherent vulnerabilities of Small Island State (SIDS) is constrained
by risk and uncertainty, which affects economic and social planning for development and poverty
reduction.
Table1. Dominica: Selected Disasters (1979 – 2015)
by Affected Population and Estimated economic cost
Affected Population
Name of Event Year Deaths Affected Estimated
Damage/losses Erika * 2015 13 15,951 482.84 Ophelia 2011 0 240 0
Dean 2007 2 7530 20,000 Marilyn and Luis 1995 2 5001 20,000 Hugo 1989 0 710 20,000 David and Frederick 1979 40 72,100 44,650
Source: The International Disaster Database. CRED 2016. http://www.emdat.be/disaster_list/index.html *Erika data based on GCOD estimates
13 Tobias Rasmussen, “Natural Disasters and their Economic Implications”, The Caribbean: From Vulnerability to Sustained Growth,
IMF, 2006. This discussion is presented in the GSPS 2014-2018, pg 58 14 The discussion on Dominica’s vulnerability is taken from the “Disaster Risk Reduction Country Profile, September 2014. Page 17
19
B. TSE: Its Effects on the Population
1. Social and Demographic Characteristics
According to Dominica’s 2011 Population and Housing Census Report, the total population of Dominica
numbered 71,293, of which 49 % are male and 51% female. The population registered a net decrease of
0.6% over the last census of 2001, suggesting that population movement in Dominica is not uncommon.
Dominica, compared to its sister Caribbean countries, has a comparatively low density rate of 96 per square
klm.15 The population is distributed among 10 Parishes with the Parish of St. Georges, of which the city of
Roseau forms a part, accounting for some 29% of the total population. St. Andrew accounts for 14% of
the population while another 24% of the population is distributed evenly between and St Patrick and St.
Paul. St. Joseph accounts for 8%, while St David accounts for 10%. St Luke, St Mark and St Peter each
account for approximately 2% of the population. Dominica has a growing young population with children
below 14 years accounting for slightly more than a quarter of the population, and approximately 41.9% of
the population comprising children and youth below 25 years. The elderly population (60 years and above)
in Dominica accounted for 14.8%, and the majority of this population is female.16
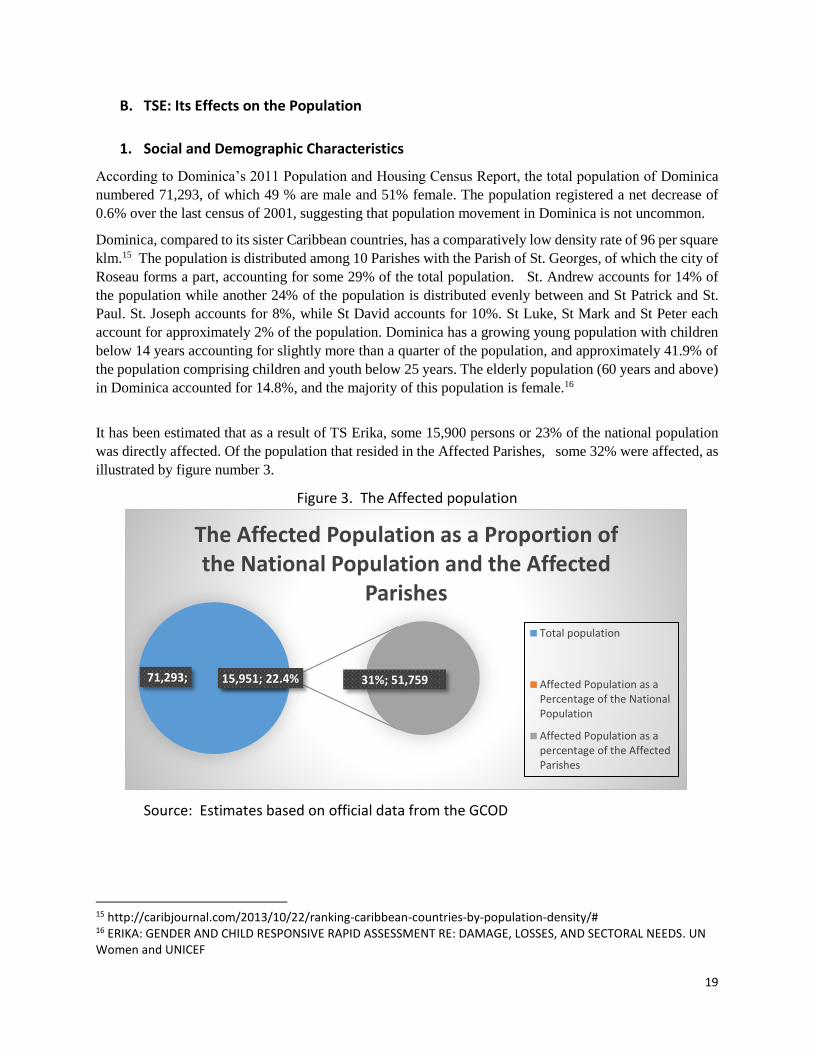
It has been estimated that as a result of TS Erika, some 15,900 persons or 23% of the national population
was directly affected. Of the population that resided in the Affected Parishes, some 32% were affected, as
illustrated by figure number 3.
Figure 3. The Affected population
Source: Estimates based on official data from the GCOD
15 http://caribjournal.com/2013/10/22/ranking-caribbean-countries-by-population-density/# 16 ERIKA: GENDER AND CHILD RESPONSIVE RAPID ASSESSMENT RE: DAMAGE, LOSSES, AND SECTORAL NEEDS. UN Women and UNICEF
71,293; 22.4%; 0% 31%; 51,75915,951; 22.4%
The Affected Population as a Proportion of the National Population and the Affected
Parishes
Total population
Affected Population as aPercentage of the NationalPopulation
Affected Population as apercentage of the AffectedParishes

20
The recognised methodology for post disaster assessment,17 suggests a categorisation of the population
affected by a disaster, into, primary, secondary and tertiary. It is expected that through the differentiation
of the effects of the event on the population, a more nuanced approach to their needs for recovery can be
articulated by the policy makers.
The effects have been categorized into the following groups: Primary affected describing those persons
living in the affected areas who have lost their lives, who suffer injury or illness as a result of the event and
those whose assets have been destroyed. Secondary affected refers to those persons living in the affected
area or outside of the affected area that have sustained losses in production and income. The Tertiary
affected group refers to persons living outside of the affected areas that are sustaining higher costs of
services (transport, water, sanitation and electricity) as a result of the event.
Figure 4. Dominica: Illustration of Categories of Affected Population
Source: Estimates based on official data from the GCOD
Each type of person affected will have different kinds of needs to achieve recovery and reconstruction
following the disaster. Figure 4 illustrates the distribution of the affected population as a result of TS Erika.
17 Handbook for estimating the socio-economic and environmental effects of disasters. ECLAC 2003; and Jamaica Handbook. 2013 http://www.pioj.gov.jm/Portals/0/Sustainable_Development/Final%20DaLA%20Handbook_Jamaica_Feb11_2013.pdf

21
Such a distribution suggests that some 6,834 can be described as primary, 7, 362 as secondary and 1,755 as
tertiary18.
Dominica exhibits many of the characteristics of Small Island Developing States (SIDS), particularly with
regard to its closely knit population. It was evident that despite the very localised nature of the effects of TSE, the entire population of Dominica was affected if not directly by having family or friends affected,
then by the ensuing disruption caused by the effects to the island’s infrastructure. Still yet others
experienced the psychological trauma of the effects of the tropical storm despite not having been personally
affected. In addition, the devastation caused by the event, has left almost no one untouched, as Dominicans
together face the direct and indirect challenges of recovery presented by TS Erika. The literature agrees
that, Dominica as other SIDS because of their small size, may have events such as disasters affect a greater
proportion of the population and have a significantly larger economic impact.
There were some effects in all of the ten Parishes of Dominica, but seven were seriously affected as a result
of TS Erika. These were St. David, St. George, St. Joseph, St. Patrick, St. Paul and St. Peter. On August
29th the Prime Minister declared the following communities within those parishes ‘special disaster’ areas:
Petite Savane, Pichelin, Good Hope, Bath Estate (Paradise Valley), Dubique, Campbell, Coulibistrie, San
Sauveur, Petite Soufriere. Brief profiles of the affected communities are presented in Box 3. Of all the
affected communities only Bath estate and possibly Coulibistre can be described as suburban. All else were
rural communities.
In addition to the hazards themselves, there are a number of socio demographic characteristics that make
people more vulnerable when considering the impact of a disaster. Factors affecting vulnerability include
socioeconomic status, available resources, health, age, sex, family dynamics, gender and ethnicity. It has
also been argued that strong explanatory factors of vulnerability, include educational attainment levels,
dependency ratios and the age of the head of household.19
Selected social and demographic characteristics of the affected population, drawn from the data sets of the
Population and Housing Census 2010, presented in Box 4, allows for a deeper understanding of the affected
population.
18 Estimates of increased costs of transport and other basic services were unavailable, a conservative estimate was identified for this group. 19 Gender, Ethnicity and Climate Change in Mexico: An analysis of vulnerability and resilience based on household surveys. Lykke E. Andersen, Anna Sophia Doyle, Dorte Verner and Manfred Wiebelt http://www.inesad.edu.bo/pdf/wp2014/wp07_2014.pdf

22
Box 3. Profiles of Affected Communities Source: Based on Official GOCD data
Petite Savanne is a village on the southeast side of Dominica in the Parish of St. Patrick. It is
characterized by the steepest terrain in Dominica and has a population of approximately 781 (748 at
last census). Some 109 people (25 males, 38 females and 46 children) were taken by boat to Roseau
and accommodated by relatives or were housed at the Dominica Grammar School. Death toll and the
missing was highest in this village.
Petit Soufrière is a small village in the Saint David Parish on the east coast of Dominica. It overlooks
the Petite Soufrière Bay. Located on the steep, rugged slopes of Morne Aux Delices, it is one of the
most isolated villages in Dominica. Petit Soufrière had never been part of a large estate because of the
rough terrain, and is therefore a peasant farming settlement with a population of 561.
San Sauveur is also in the Parish of St David. San Sauveur to Dominica's capital Roseau (Roseau) is
approximately 17 km / 11 miles. An estimate of the population of this village in the absence of a firm
estimate is 800.
Coulibistrie is a village on the west coast of Dominica, to the north in the Parish of Saint Joseph. It
lies between the villages of Colihaut to the north and Morne Rachette to the south. It extends inland
from the coast within a deep valley, along both banks of the Coulibistrie River. It is primarily residential
with few businesses. Many of the houses are built directly atop or adjoining the numerous large boulders
that litter the valley along its base.. The people earn a living through agriculture, fishing and vending
selling locally made food and produce along the main road leading south to the city of Roseau and north
to the town of Portsmouth. There are 163 households with an average size of 2.6 individuals. An
estimate of the population is 423 (213 males and 206 females).
Campbell is next to Sylvania Estate and is located in Saint Paul. Its population is estimated to be 538.
Pichelin sparsely populated. As of last census population stood at 520 persons.
Dubique in Saint Patrick is about 7 miles (11 km) South-East of Roseau, the country's capital city. And
has an estimated population of 216. In July 2006, the Caribbean Development Bank and the
Government of Dominica compiled a report named, “Poverty and Inequality Mapping in the
Commonwealth of Dominica” and reported that “The intensity of poverty is particularly pronounced in
the village of Dubique/Stowe, where the severity of poverty also reaches one of the highest values in
the country”. In this village, the equivalent consumption is not very low, but is distributed very
unequally among the households, so that “the Gini concentration index reaches the value of 52.76, well
above the Parish and country average”. Dubique continues to be a very resilient. Given its limited
natural resource base, capacity building and sustainability is critical to the maintenance of household
income and personal development. The population is 150 (79 males; 71 females)
Bath Estate has a population of 700 and may be described as a suburb of Roseau.
Good Hope is a small fishing farming community located on the east coast of Dominica. There is a
variety of economic, cultural and social activities within the community which benefits from the
attention of a Resource Centre Management Committee. The community has about 500
residents. In the absence of data for this village a description of loss of livelihoods of a similar
village is provided here. This analysis can be instructive in identifying the challenge of
restoration and creation of new livelihoods to women.

23
The data suggests that the proportion of women who are the heads of households is high. The
average across all the communities was 35% but some communities had a proportion as high as
of 47% (found in Pichelin), well above the national average of 39%. Only one community had a
low of 23% (Boetica). Examination of Headship is useful as the literature suggests that female
headed households are more vulnerable to shocks and the downside risks than households
headed by men. They have greater difficulty with regard to access to labour markets, may find
themselves in the lowest wage segments of the market and most significantly carry a ‘double
day burden’ if as heads they have to handle domestic work and the role of main earner
simultaneously, or put differently are responsible for reproductive and productive roles. The
consequence is that such heads of households suffer from more pronounced time and mobility
constraints than their male counterparts. 20 Over 87% of Heads of households in the affected
areas were above 35 years. However 11.5% of affected households were headed by youth ages
25 – 34 years.
When the issue of family size is considered, Dominica has a relatively small family size (2.7),
however the communities which were affected had larger household sizes that the average.
Many of the affected were farmers and fisher folk whose family comprised of as many as four (4)
or more persons. Single female headed households located in shelters, often reported family
sizes ranging from the low of 3 to the high of ten to thirteen. Family size is a function of the
dependency burden which the head of the household has to bear. Be that head male or female.
Unfortunately female headed households usually have one income earner thus increasing the
burden of care on main breadwinner, whereas the male headed household usually has the
support of an additional income earner, his spouse, thus reducing the burden of care on the main
breadwinner.
The size of poor female headed households should not be seen as unlikely as the CPA (2010)
suggested that the poor tended to have larger number of children than the non-poor. 21 The
Report also noted that children (0-14) and youth (15-24) comprised some 52% of all poor
individuals.
20 What about the Women? Female headship, poverty and vulnerability in Thailand and Vietnam. 2011 http://www.oecd.org/dev/pgd/46982877.pdf 21 Country Poverty Assessment 2008/2009

24
Box 4. Social/Demographic Profile of the Affected population
Source: Estimates based on official GCOD data
2. Socio Economic Status of the Affected Population
The country’s most recent poverty assessment study detailed the socio economic status of the population.
Using this data and matching it with the geographic areas that were affected by TS Erika, it is possible to
ascertain the position of people living in the affected communities with regard to their level of indigence,
poverty and vulnerability which has implications for the recommended initiatives for recovery. Since the
level of indigence had fallen from 10% in 2003 to 3.1% in 2009, this section will focus on the poor and
vulnerable. Figure 5 illustrates the headcount of the poor by Parish. It suggests that the parishes of St.
Joseph (47.1%), St. Paul (32.5%), St. Patrick 42.6%), St. David (43%) and St. Andrew (38%) had poverty
headcount indices that were higher than the national average of 28.8%.
According to the CPA, vulnerability was set at 25% above the poverty line which was estimated at EC
7,788 per annum. Households consuming at levels below the vulnerability line were deemed to be
‘vulnerable’. Persons living in households who did not fall below the poverty line (that is they were not
poor) but who fell under the vulnerability line were deemed to be at risk of falling into poverty should any
adverse economic shock or natural disaster occur.
Women Headed Households
a. Average 35%
b. Max 47%
c. Min 23%
Average Family Size
- The national average is 2.7
- Farmers and Fisher folk – 4.275
- Female headed households in Shelter range from 2 to as many as - 8 to 10 children
Age Structure
- Over 80 – 4%
- Four and Under on average 7%
- Five to 19 – 23%
Average Highest level of Education attained by Head of Household
Degree 2%
GCE O’Level 7%
School Leaving 15%
High School Diploma 6%
Junior Secondary Programme 6%
Other Diplomas and Certificates 8%
Professional Certificate 4%
No Certificate 68%

25
Figure 5. Distribution of Individuals Poor by Parish
Source: Dominica CPA 2010, table 5.5
Figure 6. Houses Affected by Parish
Source: Estimates based on Official GCOD data
0
100
200
300
400
500
600
700
St. John St.Peter
St.Andrew
St.Joseph
St. Paul St.David
St.George
St.Patrick
St. Luke St.Mark
Houses Affected by Parish

26
Figure seven suggests that the poorest Parish, St Joseph was also among the Parishes that were severely
affected by TS Erika with the loss of over 200 houses.
See figure 6 which presents the houses affected by Parish. The Parishes of St. Patrick and St David which
contained between 40 and 42 percent poor, and over 50 percent of its population deemed vulnerable ( figure
eight) had by far ( 41%) the largest proportion of households affected including destroyed, partially
destroyed and at risk. The highest number of homes totally destroyed were found in St Patrick (250)
followed by St. Joseph (50). St Joseph although the poorest parish had four communities affected while St
Patrick had the highest number of communities affected (7) and St David had 3 communities affected. It
should also be noted that it was in St. Patrick that the highest number of lives were lost.
Figure eight suggests that the Parish of St. George, which was among those Parishes identified with the
second highest level of vulnerable households, had the largest number of affected communities as a result
of TS Erika. If this were so then one would expect that a significant portion of the population which had
been living above the poverty line but below the vulnerability line, may now have succumbed to their
vulnerability and have been pushed below the poverty line. As we explore the livelihoods of the affected
population we should be able to arrive at a more definitive answer.
Figure 8. Dominica percentage
vulnerable by Affected Community and
Parish
Figure 7. Dominica: Percentage Poor by
Affected Community and Parish

27
3. Livelihoods of Affected Population
Livelihoods can be affected by a number of factors: the political and economic environment; the security
environment in which disasters or disturbances such as disruption to the supply chain or markets can occur;
and the ecosystem in which changes that cause damage or destruction to the environment can take place.
The literature suggests that over reliance on certain assets, particularly natural and physical livelihood
assets, as often occurs in agriculture, can mean greater vulnerability to shocks. Insurance is seen as an
alternative strategy for risk reduction. But for many who are unable to afford insurance, the strategy of
choice is livelihood diversification. The greater the diversity of income, the greater is the resilience of
livelihoods to disruption from particular shocks.22 Many low income earners engage themselves in
multiple income earning strategies in order to reduce risk and build resilience to future shocks. For the poor,
securing a resilient livelihood is often the most direct route out of poverty.23
For most of the affected population, one means of livelihoods was not an option. Affected persons, if they
were women reported that they worked their farms or backyard gardens and then sought a day’s pay,
bundling bay leaves to make a ‘batch’; doing a little domestic work; weeding a garden or providing
janitorial services. Men undertook their fishing or farming and then worked construction, carpentry or
security. Box number 5 provides a view of the work profile of the affected population before TS Erika
struck. The data suggested that the sex composition of the informal workers was the opposite of that of
those working in the formal sector. In the aftermath of the storm many were now without a means to earn
an income, either formal or informal.
Box 5. Livelihood Profile of Affected Population
Source: Estimates based on official GOCD pre and post disaster data sets.
22 Gender, Ethnicity and Climate Change in Mexico: An analysis of vulnerability and resilience based on household surveys. Lykke E. Andersen, Anna Sophia Doyle, Dorte Verner and Manfred Wiebelt http://www.inesad.edu.bo/pdf/wp2014/wp07_2014.pdf 23 Investing in resilience. Ensuring a Disaster-Resistant Future. Asian Development Bank. 2013
Livelihood Profile of the Affected Population• Informal Sector Workers:
• 45% male
• 55% Female
• Areas of Work:• 39% Wholesale and Retail Trade; Repair of
Motor vehicles and Motor cycles
• 24% in Manufacturing
• 9% in Agriculture , Forestry and Fisheries
• Formal Sector• 55% male
• 45% Female
• Areas of Work • 26% Wholesale and Retail Trade; and repair of
Motor Vehicles and motor Cycles
• 30% Agriculture, Forestry and Fisheries
• 21% Services

28
4. Effects on the Quality of Life
Disaster specialists have been seeking to arrive at an index (or measure) that would represent the change in
the quality of life of a population as a result of a disaster. 24
There is recognition that the quality of life is a concept not directly measurable in itself, but which can be
approached through the use of indicators carefully selected. The United Nations through its work on the
Human Development Index (HDI) which is a tool developed to measure and rank countries' levels of social
and economic development based on four criteria: life expectancy at birth, mean years of schooling,
expected years of schooling and gross national income per capita, led the way in seeking to measure the
quality of life.
With regard to a Post Disaster Quality of Life measure, the idea was to not only arrive at a number of indices
that could be used as a measure for change in the quality of life, but to be able to produce a composite index
that could also be used as a monitoring tool in the recovery process.
Box number 6 presents a number of indicators which have been recommended for use in the elaboration
of a change in the quality of life index, as a result of a disaster.
Box 6.
Selected Indicators for measuring a change in the quality of life following a disaster
.
Source: Kambon A. “ Development of Standardized PDNA Methodology for India”. (unpublished April 2015)
24 UNDP initially sought to use changes in the Human Development Index, as a measure of change in quality of life following a disaster. This was soon recognised to be a very difficult task as the HDI was a static measure, and many of its sub indices were not sensitive to disasters nor were they based on current data sets. Jovel and Kambon working on developing a methodology for Government of India as part of an ADPC project proposed that at the macro level “the team should consider the utilization of a selected number of indicators available at the national or sub-national level that would be sensitive to disasters for use in measuring the impact of the disaster on the quality of life of the members of the community”. They went on to suggest that “Indicators that may be sensitive to define the macro-social impact, would be those whose data sets have been used in sectorial assessments and where a marked change is measureable “.
Indicators at the Macro level
1. Student Attendance at School a. Change in the number of education days provided to students
in the year 2. Access to Potable Water
a. Change in household access to potable water 3. Health Conditions
a. Change in the number of persons treated for particular disease ( relevant to disaster under examination)
4. Housing Conditions a. Change in selected aspects of housing conditions
i. Materials used in the construction of walls ii. Materials used in the construction of roofs iii. Access to direct connection to electricity grid
5. Food Security a. Change in the number of persons facing food insecurity b. Change in the number of persons facing mal nutrition

29
A change in the retail price index is another measure that can be used to indicate the change in the price
level, which affects the quality of life after a disaster.
Due to the constraints of time and availability of data, only a few indicators have been used to provide an
idea of the change of quality of life following TS Erika . No composite index was produced as the Assessors
were of the opinion that the data sets were not strong enough. Instead separate indices were calculated for
consideration.
The present index or relative calculations presented below merely point in the direction and general
magnitude of change. This calculation does not use a weighting diagram to put the components of the Index
into their relative importance but calls attention to the movement of the indicators being used. 25
For Education, as presented in table 2, the attendance at school was selected as a rough indicator. For
Health, the statistics on Gastroenteritis for the final quarter of the years 2013 to 2015 were compared and
converted to indices of an aspect of health that would impact the “quality of life”. Data available for housing
were not robust enough to admit of measurement for the purpose of suggesting an index to be considered
in the calculations.
The consideration of such a concept has allowed the team to make the following measurements.
Table 2
EDUCATION STATISTICS FOR USE IN QUALITY OF LIFE PROXY INDEX
AREA TERM1
AVERAGE
2013/2014
TERM1
AVERAGE
2014/2015
TERM1
AVERAGE
2013/14 TO
2013/2015
TERM 1
AVERAGE
2015/2016
RELATIVE
2015-
2016/2013
TO 2015
INDEX
2015-
2016/2013
TO 2015
INCREASE/DEC
REASE - IN
ATTENDANCE
RATE %
North 100 94 97 88 0.907 90.7 -9.3
South 90 87 93.5 83 0.874 87.4 -12.6
East 91 91 91 92 1.011 101.1 +1.1
West 92 99 95.5 88 0.921 92.1 -7.9
TOTAL 93.168 92.647 94.229 87.692 0.9268 92.7 -7.3
The conclusion from the above table is that there was an overall drop of 7.3 percent in school attendance
after TS Erika as compared with the average attendance rate for the period 2013 to 2015 (term 1 Sept to
December attendance). Only one area showed an increase in attendance rates (East) and this could have
25 The team did not consider producing a composite index or any weighting of indices as much analysis of responses to surveys will have to be done before one derives a weighting diagram and time did not permit.

30
been the effect of bussing children to school. The relocation to shelters may have assisted the performance
in this area.
The Health indicator, presented in table 3, selected is a fairly strong one for the measurement of the effect
of TS Erika on the health of the population. Cases of gastroenteritis occurrences, reported were used as the
indicator. The calculations were as follows:
TABLE
HEALTH INDICATOR – GASTRO ENTERITIS
Epiweek 2013 2014 2015 2014/2013
Relative 2015/2014 Relative
39 31 21 60 67.74 285.7
40 27 29 40 107.41 137.93
41 24 22 14 91.67 63.63
42 13 42 20 323.08 47.62
43 17 24 24 141.18 100.0
44 23 23 38 100.0 165.22
45 24 29 39 120.83 134.5
46 25 23 54 92.0 234.78
47 15 36 46 240.00 127.77
48 19 20 45 105.26 225.00
49 10 36 33 360.00 91.67
50 19 28 36 147.37 128.57
51 5 31 25 620.00 80.64
52 5 34 27 680.00 79.41
TOTAL 248
379
501
152.82
634.18 Source: Derived from Data provided by Ministry of Health
In the Housing Sector, the total of the housing stock was 25,000. The Tropical Storm destroyed or
significantly compromised 1445 houses, reducing the stock by 1445 to a figure of 23555. A simple relative
of the new housing stock as compared with the pre-Erika total yields a relative of 94.22 percent, indicating
a 5.78 percent drop in available housing and indicating a drop in the quality of life as measured by the loss
of the houses reported.
The three computations above suggest that the quality of life as measured by the rough indicators used
was adversely affected by the Tropical Storm Erika in August of 2015

31
Section Two: Detailed Social and Livelihoods Analysis by Areas of Focus
In order to arrive at the best recommendations for policies that create jobs and make livelihoods more
resilient, the paper focussed on the following areas for examination: the Social Sectors of Health, Education
and Housing including Social Protection Measures; the Productive sector including Agriculture, Tourism
and Commerce. Infrastructure was adequately covered by the Rapid Damage and Impact Assessment and
was therefore not included for examination in this study.
A. Agriculture
1. Introduction
This document presents the findings and recommendations emanating from a Social and Livelihoods Impact
Assessment of Tropical Storm Erika on the agricultural sector crops and livestock, forestry and fisheries of
Dominica26. The general context is that Tropical Storm Erika, moving at a very low speed from the Atlantic
poured approximately twelve (12) inches of rain on the Commonwealth of Dominica from the early
morning of August 26th 2015, causing vast destruction and substantial damage to infrastructure,
communications, transportation and agriculture, as well as loss of human life. The Storm has been regarded
as one of the most devastating weather events to impact the Commonwealth of Dominica since Hurricane
David in 1979.
The impact on the agricultural sector was significant, with estimated effects on agriculture, fisheries and
forestry estimated at EC$ 122,832,078; EC$ 2, 949,324 and EC$ 1, 546,960, respectively.
2. Sectoral Context
The agricultural sector, although fluctuating in growth over the last five years (2006 - 2015) with a
downward tendency, continues to play an important part in the economic life of the Dominica. The sector
contributes to the Gross Domestic Product (GDP) through employment, foreign exchange earnings and
more recently and importantly, through its linkages and impacts on the health and tourism sectors and the
achievement of food and nutrition security for the population. Real agriculture growth rate in 2015 was
estimated at negative -20.19%, compared 1.24% in 2006. However, the agricultural sector is expected to
recover by 2016, with growth rates projected to be 2.2% and 2.1%, in 2016 and 2017 respectively (Table
Annex 3).
In 2015 the contribution of the agricultural sector (including forestry and fisheries) to National GDP was
estimated at only 10.39%, compared to its contribution of 12.53% in 2006. During the period under review,
the contribution of the banana industry to Total GDP declined significantly, from 2.07% of GDP in 2006
to 0.60% of GDP in 2015. Declines were also recorded in the contribution of other crops, livestock, forestry
and fisheries subsectors to GDP for the same period (See Table Annex 3). The distribution of Agricultural
GDP by the various subsectors is presented in Annex 3.
Private sector development in the agriculture/agri-business (and tourism/eco-tourism sectors) is an
important driver of enterprise development, economic growth and poverty reduction. However, men’s and
women’s unequal participation in agriculture and tourism is linked to gender-based access to land, credit
and other productive assets, and gendered occupational segregation and differential wages. The 2011
Population Census indicates that males comprise 85% of skilled agricultural and fishery workers,
compared to 15% of females (GOCD, 2014). Men generally own larger parcels of land, are involved in
26 Full report is available as an addendum to this document. Excerpts of this report are presented for consideration.

32
larger scale agricultural production for export, and the rearing of large livestock. Individual women
generally have access to smaller plots of land, are more involved in household food production, small scale
vegetable production and the rearing of small livestock, with subsistence production and food security
being the main outcomes27.
Agriculture in Dominica is focused both on crop and livestock production, and in the majority of farming
operations mixed farming is the dominant production strategy used. Crops grown include bananas,
plantains, coffee, cocoa, citrus, coconuts, dasheen and other root and tuber crops, vegetables and bay leaf
and its by-products. Livestock include cattle, sheep, goats, pigs and chicken. Together, these crops and
livestock enterprises earn significant foreign exchange and are collectively the mainstay of the
socioeconomic fabric of the country.
Dominica is in a crucial period of development. Having weathered the early challenges of a post-colonial
economy, the country has had to address several financial, economic, political and other factors, including
natural forces, which have adversely affected its quest to improve the welfare of its citizens. Indeed, these
challenges have significantly impacted on agricultural growth and development and may be categorized
under five broad headings:
Low general economic growth rates and high debt to GDP ratios;
Loss of export markets for the main agricultural sector product (bananas), and loss of domestic
markets to rising food imports;
Rising rural unemployment and the decline of rural agricultural industry;
Rising health care costs due to changing consumption habits and demographics; and
Increased vulnerability to climate change and external shocks that require more Government
resources to be devoted to social programs to protect food security.
The negative impacts of climate change and the country’s increased vulnerability to natural disasters have
caused Dominica to put measures in place to respond more effectively to these challenges. Notwithstanding,
the current dynamic changes taking place in the international economy, present the country with a great
opportunity to confront these challenges with bold, decisive, well-ordered strategic interventions.
3. Identifying Vulnerable Livelihoods
A review of secondary data sources was conducted as a first step towards identifying vulnerable livelihoods
in Dominica. In this regard, the Dominica Country Poverty Assessment (CPA) 2008/09 provided a good
insight into the poverty and social and living conditions of the country’s population. A summary of this
information is presented in this section.
The 2000/09 CPA reported that nationally 3.1% of the population was indigent (food poor), with the cost,
at the prevailing prices, for an average adult to purchase the minimum acceptable food required to maintain
good, bodily health (Indigence line), estimated at EC$ 2,435 per adult, per year. The poverty rate
(individuals below the poverty line and unable to meet both their food and non-food needs) was estimated
at 28.8% and the annualized Poverty Line was estimated at EC$ 6, 230. The vulnerability rate (individuals
that are below the vulnerability line, but above the poverty line) was estimated at 11.5% and the annualized
vulnerability line was estimated at EC $7,788. Individuals in the vulnerable group were at risk of falling
below the poverty threshold28 should an unanticipated event such as a natural disaster or economic shock
27 Country Gender Assessment-Dominica. Caribbean Development Bank 28 The poverty threshold (or poverty line) is the amount of consumption expenditure that is required to meet a
households’ or individuals’ food and non-food needs. Households/individuals below this poverty line are considered
“poor” (often referred to as absolutely poor).

33
occur. In effect, 40.3% of the population were at risk of being vulnerable, poor or indigent. In this report
the population at risk is used as a proxy of vulnerability to food insecurity.
The Gini Coefficient of inequality was 0.44%. The richest 10% of the population accounted for 37.2% of
consumption expenditure, while the poorest 10% of the population accounted for only 2.0% of total
consumption expenditure.
4. The Vulnerable Livelihoods
The meetings conducted, discussions held and visits made to major sites impacted by Tropical Storm Erika
were also used to identify the vulnerable livelihoods in Dominica where they are located. Data from the
Dominica CPA (2008/09), the Dominica Agricultural Census (1995), and the Dominica Fisheries Industry
Census (2011) were used to estimate the number of persons who are vulnerable to food insecurity.
Table in Annex 3 indicates that the working poor (wage and salary workers) constitute a livelihood in
Dominica that is vulnerable to food insecurity. Further investigation of the data reported in the Dominica
CPA (2008/09), revealed that of all persons employed in Dominica at the time when the survey was taken,
20.2% were poor. Moreover, among all the poor, 74.1% were employed and 25.9% were unemployed,
higher than the then national unemployment rate of 14.0%. Taken together, these two statistics characterize
these persons as the “working poor” in Dominica, a phenomenon that based on meetings and discussions
seems currently applicable in the country. This high employment rate among the poor does not translate
into an escape from poverty. Rather, the poor could not afford to be unemployed and were left with little
option but to take low-paying jobs, and where possible, seek additional jobs to support their livelihoods. In
this Report, wage and salary workers within the poorest income quintile will constitute the Working Poor
Livelihood. Against these observations and other information in Box 7 provides a summary view of the
most vulnerable livelihoods to food insecurity in Dominica
. Box 7: Livelihoods Most Vulnerable to Food Insecurity in Dominica
Vulnerable Livelihoods
Location How Many? Remarks
Farmers Located in all parishes 10,100 holders/farms based on the 1995 Dominica Agricultural Census
Within each of the livelihoods there are “at risk” groups that are vulnerable to food insecurity. These groups include: Children Youth Single mothers The elderly The handicap Pensioners Vagrants The FIVIMS methodology assumes that “at risk” groups belong to livelihoods and focusing on them runs the risk of double-counting.
Fisher Folks Along the coastline of all parishes.
Predominantly in St. Andrew (150 fishers), St. John (115), St. Peter (113), and St. Joseph (100).
740 (Dominica Fisheries Census, 2011) involved in multiple roles. Fishermen (718) Vendors (365) Boat Owners (351) Gear builder/repairer (86) Boat builder/repairer
(73).
Working Poor Spread throughout the country Estimated at approximately 5,670: Sales and Services (1170) Agriculture, forestry and
fisheries (1570) Craft and related trades (1140) Elementary workers (995) Others (1790)
34
Source: Dominica Country Poverty Assessment (CPA) 2008/09; 1995 Dominica Agricultural Census; and
Dominica Fisheries Census, 2011

35
5. Assets of Farmers
The human capital among farmers in Dominica varies. Table in annex 1 , which presents the level of education
of the farmers based on the 1995 Agricultural Census, shows that only 13.1% of all farmers have achieved the
secondary school and higher educational levels. Older farmers generally completed primary education while
some of their younger counterparts have completed some secondary education and beyond.
However, farmers generally have good skills in farming and are in fair health, although information gleaned
from WHO statistics indicate that nutrition-related/life-style chronic diseases (mainly diabetes and
hypertension) are the main public health problems in this livelihood. It should also be noted that Dominica is
rated in the top 14 countries in the world with respect to high levels of obesity.
Gender analysis of the loan portfolios of banks and credit institutions indicates the availability of loans for
persons to engage in small and medium enterprises, but these resources are allocated based on an individual’s
collateral and ability to pay back loans obtained. Since women own less land and property and occupy lower
paid sectors of the economy than men, this affects their ability to access loans for enterprise development on
an equal basis with men. Ultimately, this has a negative effect on the country’s economic growth. There are
comparatively low numbers of women accessing credit for agriculture and enterprises. More men than women
also accessed credit for service enterprises and transportation enterprises. With regard to personal loans,
greater numbers of women are accessing credit facilities, although equity has not been achieved.
Women are mostly accessing loans for micro-, small and medium enterprises in relatively equitable numbers
with men. In August 2006, the Bureau of Gender Affairs established a revolving loan fund at the National
Development Foundation of Dominica (NDFD) to assist women’s small enterprise development. Women’s
groups were initiated through assistance provided by the Bureau included. Some of these groups are now well
established, have received financial and skills-building support from other agencies, and are producing agro-
processed products such as cassava flour and bread, seasonings, and other products for the local market. These
enterprises would benefit from further support from the Government, banks and credit agencies, and CDB to
contribute to export trade29.
Social cohesion within this livelihood appears to be strong with frequent support given by the community to
persons who may be in need. Some households in this livelihood do receive support (remittances, barrels, etc.)
from relatives living abroad, although this has declined significantly in recent years following the recession in
the developed countries.
6. Livelihood Activities and Outcomes
Despite accounting for only about 10.4% in real terms of Dominica's GDP, agriculture makes a significant
contribution to the livelihoods of about 40% of the population who are engaged in varying degrees of farming
and related activities. This is realised through linkages with tourism, manufacturing, trade, health and the
environment. The sector provides important dietary staples including dasheen, sweet potato, cassava, yam,
carrot, cabbage, banana and plantains.
Dominica’s agriculture is highly defined between export and domestic agriculture. Based on data provided by
the Customs and Exercise Division, agricultural exports recorded a total value of approximately EC$4, 122,880
for the period January to September, 2015. Of this total, the records indicate that only EC $15, 410 was exported
in the months of August and September 2015 (EC $5, 192 and EC $10, 218, respectively). The main items
exported during the January – September period were sweet potatoes, dasheen, bananas, plantains, yams,
29 Country Gender Assessment-Dominica. Caribbean Development Bank

36
avocados, oranges and grapefruits. The Dominica Export Import Agency (DEXIA) is the main export-import
agency for agricultural produce in Dominica
Banana production, once a major export crop, has been significantly scaled down following the dismantling of
preferential trade arrangements with the European Union in the 1990s; damage caused by several hurricanes
and losses due to the Black Sigatoga and yellow banana leaf spot diseases. Farmers also grow a wide range of
crops that are used for home consumption and sell mostly in the local markets. Roots and tubers are grown
mostly by medium and small-scale farmers largely because these are staples in their diets, can be grown on a
wide range of crop soils and terrains and suffer less damage from hurricanes, compared to bananas and
plantains. The seasonality of crop production coupled with very limited market information produces gluts and
low prices for produce. In such circumstances, farmers prefer not to reap their crops for market sales. In addition
to growing crops for the market, large and medium-scale farmers rear chicken and small ruminants.
The main constraints to farmers’ livelihood activities include: praedial larceny, lack of own capital, poor farm
roads, access to credit, risk from forces of change (especially natural disasters), and lack of market stability for
produce. Coping strategies to sustain their livelihood include: use savings, borrow from friends/relatives, and
sell stocks or other personal property.
Overall, the information gathered indicates strongly that the asset-base of medium and small-scale farmers is
relatively weak. The main economic activity that supports this livelihood, viz. farming, is insufficient to sustain
these two categories of farmers and they therefore have to engage in a range of other livelihood activities for
support, including: general day labourer (with other farmers or wherever wage employment may be available),
construction, security guards, operating a small village tuck-shop, and generally any activity that is available for
which a wage is paid. The larger-scale farmers have hired-day labours, a solid asset base and are less vulnerable
to food insecurity. Box 8 summarises the farmers’ livelihood profile.
Box 8: Summary of Farmer Livelihood Profile
FARMERS
Vulnerability to Shocks, Seasonality and Trends
Asset base: Human capital
o Some primary education o Agri-related and other skills
Private capital o Very little savings
Natural capital o Make use of forests, communal lands
and rivers Physical capital
o Tree crops, roots and tubers, vegetables, livestock and farming tools
o Poor farm roads o Limited irrigation infrastructure
Social capital o Best during crisis o Some remittances.
Mediating factors Most take advantage of Government
programmes Negatively impacted by taxes/ regulations Water catchments and farm roads in poor
conditions Forces of change
Highly vulnerable to shocks and trends Affected by seasonality
Livelihood activities Engage in a wide range of other income earning
activities Highly vulnerable to food and nutrition
insecurity Livelihood Outcome
Fairly wide fluctuations in livelihood status Smaller-scale and quasi-subsistence farmers
most vulnerable to food and nutrition insecurity.
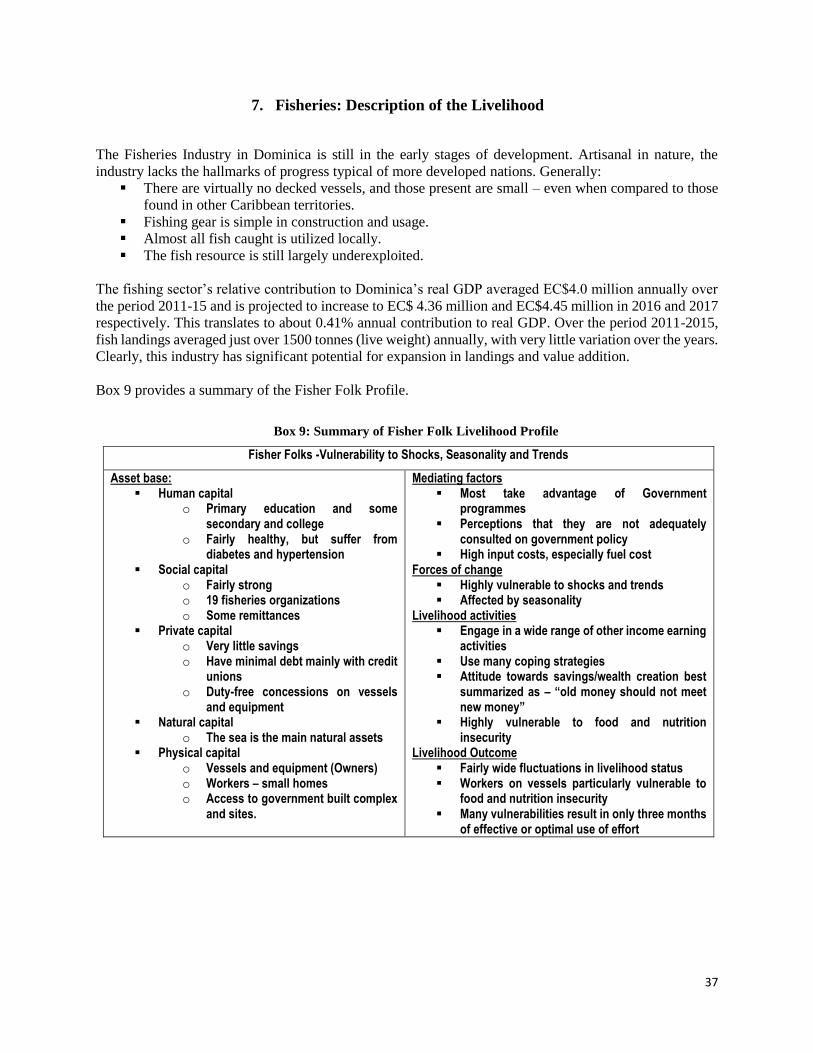
37
7. Fisheries: Description of the Livelihood
The Fisheries Industry in Dominica is still in the early stages of development. Artisanal in nature, the
industry lacks the hallmarks of progress typical of more developed nations. Generally:
There are virtually no decked vessels, and those present are small – even when compared to those
found in other Caribbean territories.
Fishing gear is simple in construction and usage.
Almost all fish caught is utilized locally.
The fish resource is still largely underexploited.
The fishing sector’s relative contribution to Dominica’s real GDP averaged EC$4.0 million annually over
the period 2011-15 and is projected to increase to EC$ 4.36 million and EC$4.45 million in 2016 and 2017
respectively. This translates to about 0.41% annual contribution to real GDP. Over the period 2011-2015,
fish landings averaged just over 1500 tonnes (live weight) annually, with very little variation over the years.
Clearly, this industry has significant potential for expansion in landings and value addition.
Box 9 provides a summary of the Fisher Folk Profile.
Box 9: Summary of Fisher Folk Livelihood Profile
Fisher Folks -Vulnerability to Shocks, Seasonality and Trends
Asset base: Human capital
o Primary education and some secondary and college
o Fairly healthy, but suffer from diabetes and hypertension
Social capital o Fairly strong o 19 fisheries organizations o Some remittances
Private capital o Very little savings o Have minimal debt mainly with credit
unions o Duty-free concessions on vessels
and equipment Natural capital
o The sea is the main natural assets Physical capital
o Vessels and equipment (Owners) o Workers – small homes o Access to government built complex
and sites.
Mediating factors Most take advantage of Government
programmes Perceptions that they are not adequately
consulted on government policy High input costs, especially fuel cost
Forces of change Highly vulnerable to shocks and trends Affected by seasonality
Livelihood activities Engage in a wide range of other income earning
activities Use many coping strategies Attitude towards savings/wealth creation best
summarized as – “old money should not meet new money”
Highly vulnerable to food and nutrition insecurity
Livelihood Outcome Fairly wide fluctuations in livelihood status Workers on vessels particularly vulnerable to
food and nutrition insecurity Many vulnerabilities result in only three months
of effective or optimal use of effort

38
8. Social and Livelihood Impact of Erika on Agriculture
The consequences of storm Erika have resulted in major dysfunction and displacement of large
proportions of Dominica’s farming /fishing population (Table 14). Approximately 4,343 farmers and
fisher-folk and related inter-sectoral linked livelihoods were impacted by Tropical Storm Erika,
representing household membership of 13,593 persons. This affected food and agriculture sector
population represents approximately 46.8% of the population vulnerable to food insecurity. The impacts
of Tropical Storm Erika have certainly exacerbated the situation.
Table 4: Summary of Erika on Food and Agriculture Livelihoods
Description Number of Farmers /
Fisher folks
Estimated Household
Members30
Impact on Farmers crops 956 2,992
Impact on Farmers Livestock 105 329
Less Combined Operations (Crops and
Livestock)
(33)
(103)
Total Crop/Livestock 1,028 3,218
Impact on Farm Assets 134 419
Impact on Inter-sectoral Assets (plants,
feeder roads, etc)
3,032
9,490
Impact on Fisheries 149 466
Grand Total 4,343 13,593
There are few key messages and conclusions critical to the development of the food and agriculture sector
of Dominica that can be gleaned from the social and livelihoods impact analysis of tropical Storm Erika
on the sector. These include:
Dominica is faced with the major challenge of reducing the vulnerability of over 40% of its
population to food insecurity;
This can be achieved to a large extent through the development and implementation of a food and
agriculture agenda that contributes to improving the living standards of all, especially the poor, in
an economically, socially and environmentally sustainable manner.
The country must therefore undergo a significant transformation in order to meet the related
challenges of food security, natural disasters and other climate change related events.
At the centre of the transformation process must be the desire to eradicate hunger, poverty and
malnutrition by:
o Stimulating sustainable economic expansion and diversification of the food and agriculture
sector;
o Increased production and productivity in the food and agriculture sector for increased growth,
foreign exchange earnings/savings and employment;
30 Average Farmer/Fisher Household Size is 3.13.

39
o Promoting sustainable management and utilization of natural resources; and
o Promoting rural development.
Food security and disaster risk management can be addressed together by transforming
agriculture and adopting practices that are "climate-smart".
Farmers in Dominica are under the greatest threat from climate change, but they could also play a
major role in addressing it. Climate-smart farming techniques would increase farm productivity
and incomes, and make agriculture more resilient to climate change, while also contributing to
mitigation.
Effective climate-smart practices already exist and could be implemented in agricultural systems.
Adopting an ecosystem approach, working at the landscape scale and ensuring inter-sectoral
coordination and cooperation is crucial for effective responses to climate change induced natural
disasters.
Considerable investment is required in filling data and knowledge gaps and in research and
development of technologies, methodologies, as well as the conservation and production of
suitable varieties and breeds. This could be developed and implemented at the regional level.
Institutional and financial support will be required to enable resource poor smallholders to make
the transition to climate-smart agriculture.
Strengthened institutional capacity will be needed to improve dissemination of climate-smart
information and coordinate over the entire country and the large numbers of farmers.
Greater consistency between agriculture, food security, disaster risk management and climate
change policy-making must be achieved.
Available financing, current and projected, are substantially insufficient to meet food security,
disaster risk management and climate change challenges faced by the agriculture sector.
Synergistically combining financing from public and private sources, as well as those earmarked
by the international community for climate change and food security are innovative options to
meet the investment requirements of the agricultural sector.
9. Recovery Interventions
The implications of the disaster for the livelihoods of the affected farmers/fishers, given the drastic losses of
livelihood assets are significant. A strategic approach to recovery, rehabilitation and development has been
taken by the Government of Dominica. As the first step in the recovery process, the Ministry of Agriculture
has launched a programme with four main components:
Humanitarian needs
Immediate farmer/fisher needs
Food sovereignty production
Long term strategic plan in response to the Tropical Storm Erika
Component 1: Humanitarian Needs
Assistance is being provided through the following mechanisms:
Cash support for farm/fisher families
Cash for work in community clearing (farmers and fishers)
Cash for work in community for removal of trees/logs in rivers, ravines and beaches
Tools and equipment to facilitate work at the community level
Component 2: Immediate Farmer/Fisher Needs
The programme focuses on assistance for the following:
Farm access
Supply of feed, minerals, vitamins, antibiotics and water for livestock
Replacement hives
Response to coping mechanisms which include:

40
o Purchase of livestock, crops or fish on hand for which marketing is problematic due to
prevailing conditions
o Supply of wire and materials for fish pots and other fishing gear
Component 3: Food Sovereignty Production
The food sovereignty component is focused on rapid food crop production by small farmers targeting domestic
needs. The programme is providing support through the following mechanisms:
The supply of inputs (fertilizer, soil ameliorants, herbicides)
Cash for work incentive for crop establishment
Cash incentive for inclusion of disaster risk reduction practices on farm.
Component 4: Long Term Strategic Plan for Agriculture
A long term strategic plan in response to the Tropical Storm Erika was drafted based on a Dialogue on
Agriculture held at the Atlantic View Resort and Spa on October 13th, 2015. The focus was on five pillars of
development:
o Coffee and cocoa
o Bananas and plantain
o Root crops and vegetables
o Pork and poultry
o Bay oil development
B. Tourism
1. Background
Tourism and related services are the largest income earners in the economy of the Commonwealth of
Dominica to date31. At an average of $275 million over the last three years, tourism revenues now account
for an increasing percentage of annual GDP. Information from the Discover Dominica Authority (DDA)
indicates that one out of every eight employed person in the country work in tourism and related activities32.
Furthermore, men predominate as taxi and bus drivers (of 400+ members in the Taxi Association, less than
5 are women), tour guides, park wardens, security personnel and gardeners, and they also include chefs
and bartenders. Women comprise the majority of craft and roadside vendors, and cooks, hospitality staff,
waitresses, housekeepers, administrative staff, etc. in the hotel/guest house industry. Men and women play
complementary roles in the sector. However, women tend to predominate in the lower-waged
occupations33. Loss or decline of the sector would significantly impact on the economy, as witnessed by
the sudden visitor arrival down turn after the passage of Tropical Storm Erika in August of 2015.
31 Current account balances rose to 14.9 percent of GDP in 2015 and project to be wider in 2016 and 2017,
incorporating the decline in tourism which was less than the sustained decline in exports of banana and
other crops as projected decline in the agriculture sector. 32 estimated at about 24,000. Of those employed,
about 5% (1,200) are employed in hotels and restaurants. Between 400 and 600 employed in the other sub-
sectors of the tourism industry (tour operators, dive shops, tour guides, etc.) is estimated at 1,800 jobs are
directly dependent on tourism while some 1200 jobs are in travel and other related areas. Source 2011
Census and WTTC statistics 33 Country Gender Assessment-Dominica. Caribbean Development Bank
41
The sector grew from approximately $252.82 million in visitor spend in 2010 to $343.46 million in 2014
($310.228 million in 2015) as the result of a modest but targeted marketing campaign to highlight
Dominica’s pristine natural environment.
Tourism activities strongly contribute to the observed growth in GDP for the construction sector as well as
for the primary sector (for example livestock, fish, fruits and vegetables). As a major contributor to the
country’s GDP, tourism activities provide significant revenues to the government through VAT and import
duties.
Tourism’s economic impact derives from the spending by visitors and the sector’s value is the national
economy can be measured in terms of:
- Contribution to national output (GDP) (14% of GDP in 2015)
- employment generation
- tax revenues to government
- income generation at community level
- foreign exchange earnings, helping to offset the Balance of Trade deficit
- Linkages with other sectors of the economy.
2. The Effects of Tropical Storm Erika
Tropical Storm Erika has severely affected the tourism sector, with estimated (preliminary) damage to the
Tourism hospitality sector (damage to plant and property and loss of business) as being in excess of EC$
45,899,104.3434.
Assessments35 put the overall damage to the Accommodation sub-sector at EC$33million with 50% of
properties registering damage and 10% of which were uninsured. A full assessment of cancellations is not
available. At the time of the assessment, 124 room nights had been cancelled.
The estimates for damage include $35 Million in insurance claims for two major hotels that remain closed,
as well as an additional estimate of $40million in uninsured damage and loss.
The overall damage assessment figure for the Dive sector is EC$2.4 million with 91% of operators within
that sector, reporting damage.
There are no values assigned to the assessments of non-infrastructural damage to the natural environment
(forests, natural attractions, reefs and dive sites) on which the tourism product is premised.
The Discover Dominica Authority (DDA) projected a 5.6% decline in tourism activity in the aftermath of
TS Erika, due to reduced access to the country and the damage to hotel infrastructure (estimated at
$45.9million or 3.3% of GDP36. Signs of recovery are expected as early as 2016.37
Given the economic importance of tourism to Dominica, a revival of the tourism industry is vital. It not
only provides employment and investment opportunities, but the industry’s recovery can help stimulate
trade, business and construction activities. In the aftermath of TS Erika, the provision of immediate
34 Socio-Economic Impact Assessment of the Impact of Tropical Storm Erika – Min of Planning, Economic Development and Investment (2015) 35 Socio-Economic Impact Assessment of the Impact of Tropical Storm Erika and the Rapid Damage and Impact 36 2014 nominal GDP, US$543 million. 37 Letter of Intent – Appendix II Dominica Request for Disbursement from the Rapid Credit Facility of the International Monetary Fund – October 2015.

42
emergency relief, the restoration of basic services and the rebuilding of damaged infrastructure in
destination communities were of paramount importance.
That said, it is not enough to respond to the immediate disaster. Given that much of the GDP contribution
is generated in the peak travel months of October to April, cancellations and loss of future business represent
a great risks to recovery. It is therefore imperative that such a fallout be mitigated against with appropriate
promotions in the source markets and among the targeted visitors.
As the immediate needs of the affected communities are tended to, attention must be redirected toward
longer-term preparedness strategies that aim to reduce vulnerability and increase capacities to cope and
respond to future shocks.
The greatest challenges to the tourism sector in Dominica stem from the urgent need to reconstruct and re-
establish damaged and destroyed room stock, recapture lost air access, while complementing reconstruction
with marketing fund allocations to restore consumer confidence so that visitors honour plans to visit/return
to the country.
The proposed Recovery and Reconstruction Strategy contained in the Rapid Damage and Impact
Assessment addresses these key concerns38.
3. The Pre Disaster Situation
Visitor arrivals in 2014 were at the highest levels since 2011, with approximately three quarter of arrivals
coming by cruise ship and one-quarter by air. Over the last five years, cruise ship passenger arrivals have
shrunk by approximately 45% -falling from to 517,979 in 2010, to 378,812 in 201439. Cruise ship visitation
is in the form of day visits, and 67% of passengers patronise tours to sites and attractions.
Tourism arrivals by air have grown inconsistently to 8% between 2010 and 2014. The figures do not show
patterns of consistent growth and the anomalies warrant further published explanation,
Limited marketing funds have constrained further arrivals growth, with the DDA budget of XCD$4 million
is considerably lower than competitors’, the norm for Caribbean destinations is a budget representing
between 2% and 3% of total visitor spending. On this basis, the DDA’s budget would have to be doubled.
Dominica’s source markets are the short-haul regional markets of (Martinique, Guadeloupe) and US,
Canada, UK, France, Germany, the French West Indies is by far the largest market (53%), followed by US
(20.3%) and UK (6.2%). The average length of stay is eight nights.
38 Annex A: Summary Table of Recovery and Reconstruction by Sector
Sector Short Term (6-12 months) Medium Term (12-24 months) Long Term (24 months+)
Tourism - Ensure Douglas-Charles airport is
fully operational
- Ensure access to main touristic
sites before the tourist seasons
starts
- Invest more in promoting tourism
and Dominica to make up for
potential losses
- Assess the location and zoning of
hotel sites. The recommendation
falls in line with the issues facing the
housing sector overall.
- Prepare a comprehensive plan for
evacuation of hotels, tailored to
the uniqueness of each property’s
location.
- Create the economic
environment to increase the
penetration of small and
medium enterprise insurance
- Develop a business continuity
plan to ensure that service
interruptions do not have long
term effect on the economy
Source: Rapid Damage and Impact Assessment - Tropical Storm Erika 39 Discover Dominica, ECCB http://www.eccb-centralbank.org/Statistics/index.asp#tourismdata
43
4. Vulnerability Assessment of the Tourism Sector in Dominica
A tourism sector is vulnerable to a multitude of external forces and influences that, usually temporarily,
serve to reduce tourist flows and, hence, impact negatively on income, foreign exchange earnings,
tourism-related duties and taxation, employment and so on. Collectively, these influences represent crises
which the tourism sector experiences and to which they must respond. To address issues of vulnerability
is thus a precursor to addressing resilience and responsivity if a Tourism sector is to remain viable.
Apart from the vulnerability of Dominica’s Tourism sector to extreme weather events (Hazard exposure)
such as TS Erika the following suggest other situations which compromise the impact of the sector on the
local economy.
1. In general, performance of operators in tourism industry remains weak40. Insufficient resources and
limited access to funding lead to low quality of service and facilitation provided. Lack of experience
and limited professional skills are other weaknesses of current tourism industry.
2. Although there are 1,067 rooms registered as part of the product offering only 480 (45%) are
reputed to be of market ready quality.41 Such a situation fragments the destination and presents a
marketing challenge
3. Infrastructure in some places are rudimentary and existing service modes are not attractive for
visitors. “Limited places for visitors to meet and mingle”. Additionally Infrastructure development
remains limited (road network, directional signage, maps, GPS capabilities), access and
connectivity between Dominica and neighbouring countries, thus reducing the array of the
experience.
4. Poor reviews of the Destination product42 offering
5. Unevenness between growth of tourism industry and that of the destination management
framework, especially technical capacities in destination marketing and sustainable product
development, could lead this sector to develop in a disorganized manner.
6. Inadequate maintenance of tourism sites.
7. In parallel to integration and cooperation, regional competition in tourism industry is also high and
intensifying. Each country has used sort to upgrade their standards and services quality, while
offering lower service charges to attract more tourists. Thus presenting additional challenges for
Dominica’s tourism sector.
8. Low level of awareness of the destination in source markets.
International political turmoil, international terrorism, pandemic outbreaks, and prolonged and unresolved
economic crises in many countries could be an obstacle for development of Dominica tourism in the
future.
5. Details of the Effects of TS Erika on the Tourism Sector
Dominica is an island facing several natural disaster risks – extreme climatic events of wind and rain and
heretofore unexperienced volcanic eruption. Emergency preparedness and planning is therefore essential.
Based on information collected from accommodation and tour operators, it is estimated that TS Erika has
produced damage of $35million in the south west region - which straddles the St David and St Patrick
parishes (between Rosalie Point and Petite Savanne) - were the most affected by damage and losses overall
40 Average occupancy levels are about 50% 41 Commonwealth of Dominica Tourism Master Plan 2013 42 BREA 2015 Economic Contribution Of Cruise Tourism To The Destination Economies reports extremely poor reviews of the Cruise Product

44
to the tourism sector (97% of total effects). The economic impact of these losses is mirrored by a significant
social impact, including employment repercussions, especially for female employees who are also heads of
households. The description of Damage and Losses for the Tourism Sector – by Location and Sub Sector.
The details are presented in Annex 3.
Accommodation
Damage from the cyclone varied from minor repairs to major structural damage to buildings, facilities, and
land caused by siltation, rock, mixed debris and water deluge. While most operators are functioning, two
major operators were closed for longer periods to assess and repair damage, Jungle Bay a larger resort
operator (35 rooms - 4th largest hotel on the island 8% of market ready hotel room stock) has not reopened.
Because of this, 65 people were displaced.
Tour operators were also significantly damaged, with initial reports from the Ministry of Tourism indicating
that reported damage was values at XCD$978,000.0043
Dive Sector
There are eleven (11) dive businesses registered, nine (9) of which been affected by TS Erika, of which
seven (7) are operational.
Tour Operators
There are twenty-eight (28) tour operators registered, seven (7) are reported as affected. The damage
reported was mainly to equipment and vehicles.
Community Based Tourism
World Creole Music Festivals
The WCMF was cancelled as a result of TS Erika has an estimated impact which is included in the
cancellation of bookings and the reduction in overall expenditure. However the micro impact to the
community because of loss of income to vendors must be emphasized.
Information from the Dominica Festivals Commission estimated vendor sales at venues at about
XCD$750,000.00. In 2014, 19 vendors’ permits were issued with the demography as presented in table 5.
Table 5. Demographic Characteristics of Vendors (WCMF) 2014 by type of Vendor Vendor Type Parish Male Female Business/
Organisation
Food & Beverage St George 4 7 3
St Peter 1
St Mark 1
Craft/Promotion St George 1
Popcorn/Patties/Coconut St George 1 1
Total 5 10 4
Initial anecdotal reports indicate that 15%of the accommodation and tour subsectors do not have adequate
insurance cover to claim on the damage and losses caused by the cyclone. The delay in trade and repairs
has both revenue and financial costs. Additional financial costs are incurred by the need for additional credit
to carry out repairs that are not covered by insurance.
43 Socio Economic Assessment of the Impact of Tropical Storm Erika - Ministry of Planning, Economic Development and
Investment
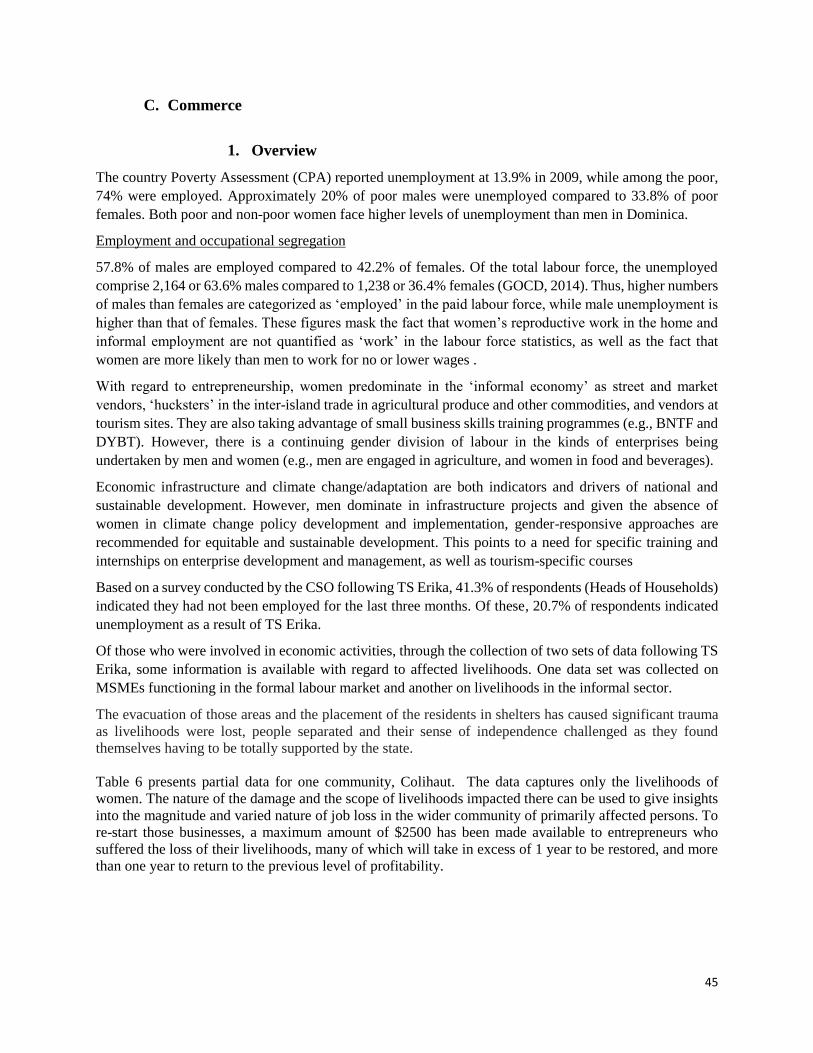
45
C. Commerce
1. Overview
The country Poverty Assessment (CPA) reported unemployment at 13.9% in 2009, while among the poor,
74% were employed. Approximately 20% of poor males were unemployed compared to 33.8% of poor
females. Both poor and non-poor women face higher levels of unemployment than men in Dominica.
Employment and occupational segregation
57.8% of males are employed compared to 42.2% of females. Of the total labour force, the unemployed
comprise 2,164 or 63.6% males compared to 1,238 or 36.4% females (GOCD, 2014). Thus, higher numbers
of males than females are categorized as ‘employed’ in the paid labour force, while male unemployment is
higher than that of females. These figures mask the fact that women’s reproductive work in the home and
informal employment are not quantified as ‘work’ in the labour force statistics, as well as the fact that
women are more likely than men to work for no or lower wages .
With regard to entrepreneurship, women predominate in the ‘informal economy’ as street and market
vendors, ‘hucksters’ in the inter-island trade in agricultural produce and other commodities, and vendors at
tourism sites. They are also taking advantage of small business skills training programmes (e.g., BNTF and
DYBT). However, there is a continuing gender division of labour in the kinds of enterprises being
undertaken by men and women (e.g., men are engaged in agriculture, and women in food and beverages).
Economic infrastructure and climate change/adaptation are both indicators and drivers of national and
sustainable development. However, men dominate in infrastructure projects and given the absence of
women in climate change policy development and implementation, gender-responsive approaches are
recommended for equitable and sustainable development. This points to a need for specific training and
internships on enterprise development and management, as well as tourism-specific courses
Based on a survey conducted by the CSO following TS Erika, 41.3% of respondents (Heads of Households)
indicated they had not been employed for the last three months. Of these, 20.7% of respondents indicated
unemployment as a result of TS Erika.
Of those who were involved in economic activities, through the collection of two sets of data following TS
Erika, some information is available with regard to affected livelihoods. One data set was collected on
MSMEs functioning in the formal labour market and another on livelihoods in the informal sector.
The evacuation of those areas and the placement of the residents in shelters has caused significant trauma
as livelihoods were lost, people separated and their sense of independence challenged as they found
themselves having to be totally supported by the state.
Table 6 presents partial data for one community, Colihaut. The data captures only the livelihoods of
women. The nature of the damage and the scope of livelihoods impacted there can be used to give insights
into the magnitude and varied nature of job loss in the wider community of primarily affected persons. To
re-start those businesses, a maximum amount of $2500 has been made available to entrepreneurs who
suffered the loss of their livelihoods, many of which will take in excess of 1 year to be restored, and more
than one year to return to the previous level of profitability.

46
Table 644
Analysis of women with loss of livelihoods - Colihaut
Name of
livelihood activity Duration of impact of
disaster on livelihood
Suggested viable
livelihood options
Priority ranking of
viable livelihood
option
What assets are essential for viable livelihood
option
What types of training are needed for
viable livelihood
option Grocery Shop Out of business
since 27/8/15 Same Refrigerators (2), stock,
air condition Management of income and book keeping
Bread bakery Out of business since 27/8/15
Same Entire building, machinery(mixer), tables, stock, baskets
Grocery shop Has reopened with limitations
Same Deep fridge and stock
Production of cocoa sticks
Out of business since 27/8/15
Same Cocoa mill
Crocheting Out of business since 27/8/15
Same Crochet thread
Unisex Hair Salon Out of business since 27/8/15
Same Ovens, products, curling irons, all was lost
Management
Shop Out of business since 27/8/15
Not sure she wants to reopen
Outdoor restaurant
Has reopened with limitations
Same Freezers, chillers, coolers, stove, pots, deep fryer, baskets, cutleries, blender
Cocoa stick and Castor Oil Production
Out of business since 27/8/15
Same Pots, cocoa mil, cocoa beans
Trade man/handyman
Out of business since 27/8/15
Same Concrete mixer, generator, swiper, chainsaw, shovel, pix axe, wheel barrows, buckets, electrical tools(entire storeroom was washed away)
2. Formal Market Sector
Workers in the formal labour market usually suffer less harm than those in the informal sector following a
disaster. The reason being that formal labourers are usually salaried workers. However Own Account
workers and those in their employ may suffer some effects depending on the level of insurance and the
extent of the damage received as a result of the event.
Reports received by the Ministry of Finance noted that the Micro, Small and Medium Sized Enterprises
(MSMEs) functioning in the formal sector, had limited or no insurance coverage, some suffered temporary
or permanent closure of business due to damage to structures , flooding of premises and loss of stock and
equipment. Others suffered total loss of income and livelihood.
44 Source: Ministry of Social Services

47
Significant damage was done to the small manufacturing sector. Five of the 71 manufacturers contacted
by the Ministry reported damage. Table 7 presents damage suffered by larger manufacturing
establishments.
Table7
Damage to larger Manufacturing establishments and Outlook Manufacturers Remarks Present Status
Dominica Coconut Products
(DCP) Colgate Palmolive
Usually contributes 50% of exports
of mfd. Goods. Suffered damage of
EC$26 million
Not operational until mid-2016
Dominica Essential Oils and
Spices Coop Ltd
Export value lost for 2015
=EC$150,000
Not operational until mid-2016
Shillingford Estates Ltd Damage of EC#5 million Not operational until late 2016
P.H. Williams & Co. Ltd.
Export value lost for 2015
=EC$400,000
Colihaut plant will not be
operational for at least 2 years
Belfast Estate Damage to warehouse
estimated at EC$800,000.00 Source: Estimates based on Oficial GCOD data
The above description of damage to the Manufacturing Sector indicates the loss of livelihoods. Reports
indicate that approximately 673 of individuals have been laid off, at least on a temporary basis, likely to
last a number of months. The effect of these layoffs is felt by the entire family of the affected workers,
bringing the total number affected as a result of disruption to this sector alone to some 1,400 persons.
In addition, several small and medium-sized enterprises (SMEs) suffered losses. In summary, the loss of
manufacturing capacity has placed supply constraints on demand, has curtailed some exports and has
created the reason for a larger negative Balance of Trade contributed to from both sides of the account.
Some 196 small and medium-sized enterprises were affected. Government has been able to date to give
assistance to 170 of the 196 affected establishments. Flooded shops resulted in the loss of stock and a
reduction in the quantum of food available for purchase. The need to restore livelihoods is a top priority.
Some EC$ 8.2 million is estimated to be spent on the re-establishment of MSMEs. Small enterprises whose
values were EC$ 15,000 or less were supported to the extent of EC$ 2,500 for the re-purchase of equipment
without the burden of taxation. Whereas the EC$8.2 million, may refer to physical damage, at least an
equal amount mat be estimated for loss of income and livelihood from September to December 2015 to
small farmers and other households in the affected areas
A number of the small and medium-sized enterprises are traders involved in the wholesale or retail trade.
They earn a little value added by packaging their produce, mostly in a rudimentary manner, for sale or for
transport to a neighbouring country in exchange for money with which they purchase goods to return with
and sell in Dominica. An estimate of their loss per month following TS Erika is of the order of EC$8000
to year end 2015 for each small farmer of informal sector worker. The hucksters have been known to have
built their homes from the proceeds of their trade.
Data on 140 small business that were affected as a result of TS Erika suggests that the largest proportion of
business , 27% were engaged in Retail Trade, followed by Agriculture 22%- if we include , Horticulture,

48
farming and fishing. The Services Sector accounted for 22%, and Agro Processing 9%. The lowest areas
of economic activity were found in Tourism and Entertainment.
Four Cabinet appointed committees are working together to address a strategy and process for
reconstruction in the areas of Tourism, Agriculture, Trade, Commerce and Kalinago Affairs.
Assessments made by those committees revealed:
A loss of income/livelihood in Petit Savanne, Dubique and Coulibistrie
The closure of businesses damaged structurally, damaged by flooding and compromised by
loss of stock and equipment. Some of these will not re-open.
For the most part, no insurance for small businesses
Data received showed that in the nine disaster areas loss was sustained in agro-processing, Retail Trade,
Services, Manufacturing and a number of services that were within the reach of the residents of those areas.
These constituted the livelihoods of the people in those areas. The following table supplied to the team is
reproduced here for its comprehensiveness in communicating the damage. The valuation of the damage is
given in terms of replacement cost, pursuant to the objective of building back better and catering for
increases in the price of building materials and plant. The assessment of that committee appears in table 8.
The Committee was careful not to introduce duplication and therefore excluded activities such as Fishing
and Farming in Agriculture.
Data from the Customs and Excise Division reveal a significant drop in exports. The August and September
export figures were EC$5, 192.25 and EC$10,218.22 respectively, in contrast to EC$64,052.00 in July.
This performance speaks to the loss of crops that has led to the loss of livelihoods.
Exports of manufactured products to a value of EC$14.4 million were recorded for the period January to
September, with the September figure being $EC1.0 million

49
Table 8
Estimate of Damage and Loss by Sector Sector Special Disaster Area Replacement Cost
Agro-processing Coulibistrie $222,330.00
Retail Coulibistrie $23,168.00
Services Coulibistrie $704,700.00
Manufacturing Coulibistrie $377,160.00
Trucking Coulibistrie $75,000.00
Services Colihaut $154,000.00
Retail Colihaut 9$77,300.00
Retail/Services Dublanc $119,200.00
Retail Bioche $7,100.00
Retail Bath Estate (P/Valley) $17,000.00
Manufacturing Bath Estate (P/Valley) $18,000.00
Tourism Copthall $20,000.00
Mfg/Services Savanne Park $234,000.00
Services Canefield $8,000.00
Services Jimmit $9,500.00
Retail Mahaut $12,000.00
Retail Marigot $12,000.00
Services/Retail Petite Savanne $403,500.00
Manufacturing Petite Savanne $90,000.00
Agro-processing Bagatelle $12,875.00
Manufacturing Roseau $65,000.00
Agro-processing Layou Valley $11,920.00
Agro-processing Cockrane $32,500.00
Agro-processing Riviere Cyrique $1,100.00
GRAND TOTAL Ec$3,025,763.00
Source: Data provided to Mission

50
3. Informal Market Sector
Contrary to the notions that the informal employment would disappear with economic development, the
ILO suggests that informal employment remains important, persistent and, in some regions of the world, is
even rising45
Informal employment, includes (1) own-account workers and employers employed in their own informal
sector enterprises; (2) family workers; (3) employees in informal jobs, whether employed in formal sector
enterprises, informal sector enterprises, or households; (4) members of informal producers’ cooperatives;
and (5) own-account workers engaged in production of goods exclusively for own final use.
Yet the paucity of labour market data in developing countries makes quantifying its extent difficult, The
ILO estimates that during the 1990s, informal work in the non-agricultural sector constituted 43% of
employment in North Africa, 75% in sub-Saharan Africa, 57% in Latin America and 63% in Asia (Beneria,
2001).46
What is known about the wage structure in the informal sector, as illustrated by figure 9, is that even within
the informal sector the gender segmentation leaves women at the lowest levels on the scale of economic
earnings.
The struggle for achieving sustainable livelihoods is to upgrade the capacity of workers, women and men
to that of the level of own account workers so as to increase their income earning capacity.
45 The Role of Employment and Labour Markets ion the fight against poverty. Christoph Ernst and Janine Berg, ILO.
2009. http://www.oecd.org/dac/povertyreduction/43280231.pdf
46 ibid
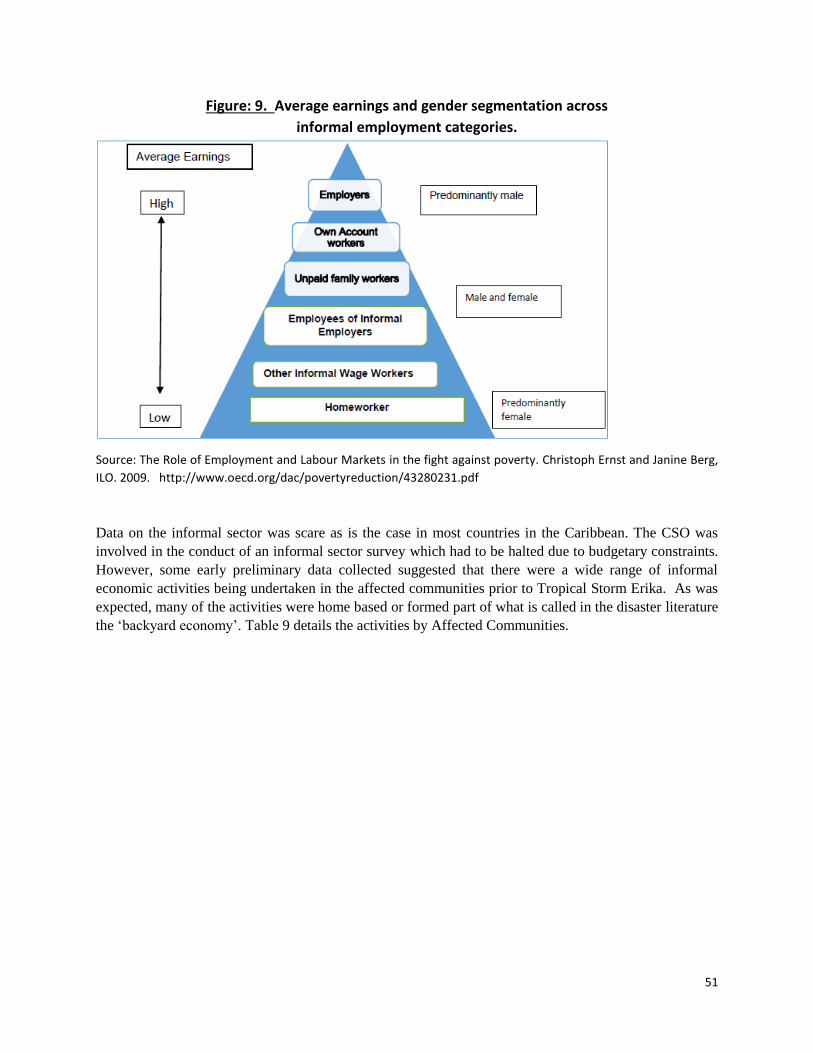
51
Figure: 9. Average earnings and gender segmentation across
informal employment categories.
Source: The Role of Employment and Labour Markets in the fight against poverty. Christoph Ernst and Janine Berg,
ILO. 2009. http://www.oecd.org/dac/povertyreduction/43280231.pdf
Data on the informal sector was scare as is the case in most countries in the Caribbean. The CSO was
involved in the conduct of an informal sector survey which had to be halted due to budgetary constraints.
However, some early preliminary data collected suggested that there were a wide range of informal
economic activities being undertaken in the affected communities prior to Tropical Storm Erika. As was
expected, many of the activities were home based or formed part of what is called in the disaster literature
the ‘backyard economy’. Table 9 details the activities by Affected Communities.

52
Table 9 . Pre Erika data on the distribution of Informal sector workers
by Industry Classification from the Affected Districts
Activities
Wholesale and Retail Trade; Repair of Motor vehicles and Motor cycles Manufacturing
Agriculture , Forestry and Fishery Other Total
Affected Communities
Petit Savanne 2 2 0 0 4
Fond St. Jean 11 0 3 0 14
San Sauveur 2 0 1 3
Good Hope 10 0 40 1 51
Campbell 5 0 0 1 6
Petite Soufriere 2 1 3
Grand Fond 1 1
Dubique 1 1
Totals 30 4 43 6 83
Source : CSO Preliminary data from the Informal Sector Survey
Preliminary data collected in the post TSE period, suggested that some 40% of those existing informal
economic activities had been disrupted, and that women were engaged in approximately 55% of those
activities.47 The distribution of economic activities is illustrated in figure 10.
Figure 10. Post Erika Distribution of informal sector workers by type of economic activity
in the Affected Communities48
Source: Estimates based on Official GCOD data
47 As self reported to the Ministry of Social Services 48 Based on self reported data

53
Women predominated in the wholesale and retail trade sub-sector but there were a few in the manufacturing
subsector producing agro industrial products such as cooca sticks and castor oil. Others could be found
manufacturing clothing. The services sector which is captured in the ‘Other’ category found a number of
women involved in provision of services for the tourism industry. Men predominated in the repair of motor
vehicles and motor cycles and the manufacturing of agro industrial products particularly with regard to the
Bay Oil (essential oils) industry.
What should be noted is that in addition to engaging in these informal economic activities, almost all
affected households reported being engaged in some degree of agricultural activity.
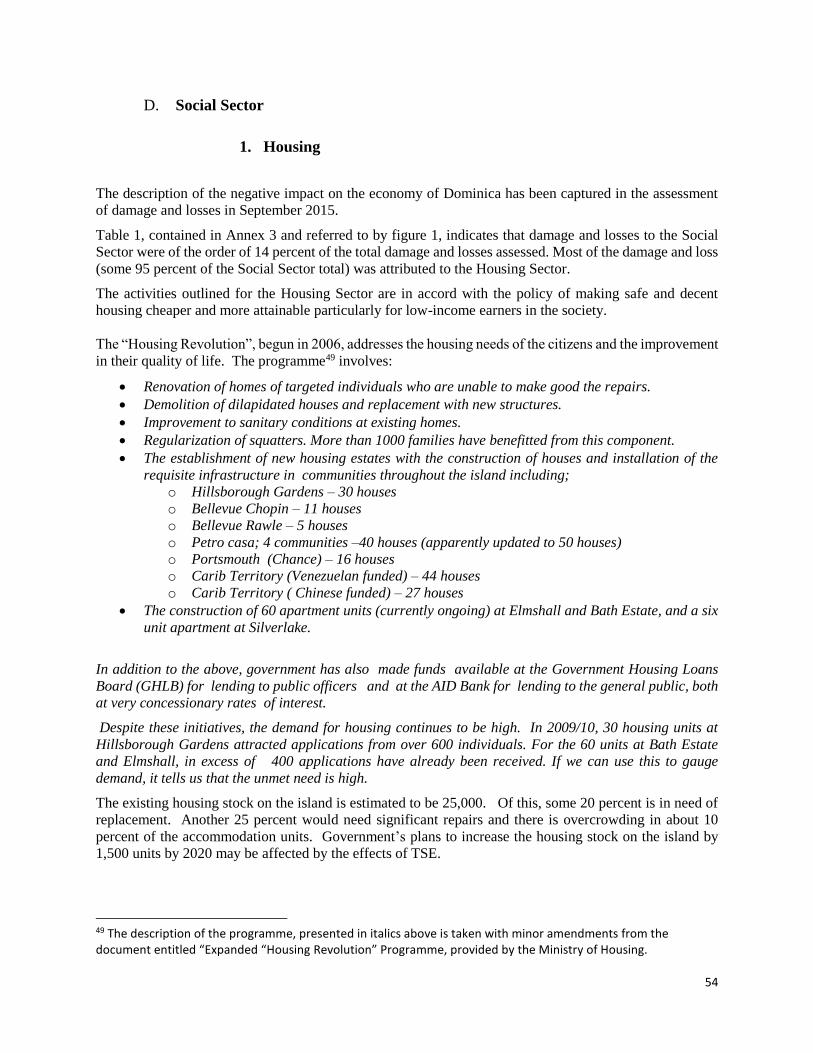
54
D. Social Sector
1. Housing
The description of the negative impact on the economy of Dominica has been captured in the assessment
of damage and losses in September 2015.
Table 1, contained in Annex 3 and referred to by figure 1, indicates that damage and losses to the Social
Sector were of the order of 14 percent of the total damage and losses assessed. Most of the damage and loss
(some 95 percent of the Social Sector total) was attributed to the Housing Sector.
The activities outlined for the Housing Sector are in accord with the policy of making safe and decent
housing cheaper and more attainable particularly for low-income earners in the society.
The “Housing Revolution”, begun in 2006, addresses the housing needs of the citizens and the improvement
in their quality of life. The programme49 involves:
Renovation of homes of targeted individuals who are unable to make good the repairs.
Demolition of dilapidated houses and replacement with new structures.
Improvement to sanitary conditions at existing homes.
Regularization of squatters. More than 1000 families have benefitted from this component.
The establishment of new housing estates with the construction of houses and installation of the
requisite infrastructure in communities throughout the island including;
o Hillsborough Gardens – 30 houses
o Bellevue Chopin – 11 houses
o Bellevue Rawle – 5 houses
o Petro casa; 4 communities –40 houses (apparently updated to 50 houses)
o Portsmouth (Chance) – 16 houses
o Carib Territory (Venezuelan funded) – 44 houses
o Carib Territory ( Chinese funded) – 27 houses
The construction of 60 apartment units (currently ongoing) at Elmshall and Bath Estate, and a six
unit apartment at Silverlake.
In addition to the above, government has also made funds available at the Government Housing Loans
Board (GHLB) for lending to public officers and at the AID Bank for lending to the general public, both
at very concessionary rates of interest.
Despite these initiatives, the demand for housing continues to be high. In 2009/10, 30 housing units at
Hillsborough Gardens attracted applications from over 600 individuals. For the 60 units at Bath Estate
and Elmshall, in excess of 400 applications have already been received. If we can use this to gauge
demand, it tells us that the unmet need is high.
The existing housing stock on the island is estimated to be 25,000. Of this, some 20 percent is in need of
replacement. Another 25 percent would need significant repairs and there is overcrowding in about 10
percent of the accommodation units. Government’s plans to increase the housing stock on the island by
1,500 units by 2020 may be affected by the effects of TSE.
49 The description of the programme, presented in italics above is taken with minor amendments from the document entitled “Expanded “Housing Revolution” Programme, provided by the Ministry of Housing.

55
To make inroads into the unmet demand for housing, the Government of Dominica has identified an
expanded programme that will be accomplished on a phased basis over the five year time horizon. The
time phasing is presented in box 10.
Box 10.
Time phasing of the Extended Programme of house construction
YEAR 1 Seven apartment buildings, (60 units), at Elmshall and Bath Estate.
10 units at San Sauveur with funds from the People’s Republic of China.
15 units on the West coast to relocate victims of Tropical Storm Ophelia.
10 units at Castle Bruce.
2 apartment buildings (12) units at Silverlake.
Replacement of 150 houses in selected communities island-wide.
43 new houses island wide on lots owned by individuals/ individuals assisted with credit to build.
YEAR 2
Rehabilitation of Pound, next to Financial Centre - 3 apartment buildings (18 units)
6 Duplex houses (12 units) to house individuals who previously occupied houses at the Roseau River bank along the Goodwill Link Road and squatters who currently occupy houses on the Roseau River bank near the Bath Estate bridge
Apartments /duplexes at Cotton Hill for the relocation of the Lagoon residents (40 units).
15 - 2 bedroom units at Dubique
Replacement of 160 houses in selected communities around the island
50 new houses island wide on lots owned by individuals/ individuals assisted with credit to build
1 apartment building at Silverlake (6 units)
YEAR 3
Replacement of housing at ‘Fomiko’ - Virgin Lane. 3 apartment buildings (18 units)
Replacement of 200 houses in selected communities around the island
82 new houses island wide on lots owned by individuals / individuals assisted with credit to build.
YEAR 4
Replacement of housing units in Roseau - 3 apartments (18 units).
Replacement of 200 houses in selected communities around the island.
82 new houses island wide on lots owned by individuals/ individuals assisted with credit to build.
YEAR 5
Replacement of housing units in Roseau- 3 apartment (18 units )
Replacement of 200 houses in selected communities around the island
82 new houses island wide on lots owned by individuals/ individuals assisted with credit to build.
Source: Data provided by Ministry of Housing
The expanded plan has implications for the construction industry as the demand for construction workers
is expected to increase. Some element of prior training of construction workers is therefore necessary to
input into the expected surge in construction.
The effect of the expanded plan will be to create livelihoods in the construction sector for numerous young
people, male and female, who have been displaced, beginning 2016. This calls for training in a variety of
skills such as electrician, plumber, welder and the gamut of skills related to house construction and
maintenance. This will help to confront the poverty configuration of the population.
The extent of damage to Housing in the affected areas caused official attention as a matter of priority to
bring a measure of relief to the people who suffered loss or substantial damage to their houses. The estimate

56
of total damage and losses was put at $EC 122,125,72550. Cabinet resolved to take a number of decisions
that in its view were the best at the time. The decision to mandatorily evacuate persons from the disaster
areas was made at a time of emergency and did not admit of dialogue with the residents to be affected by
the mandatory evacuation. This decision was made on the basis of the areas being on unstable land or
surrounded by precarious slopes. At the same time, the gift of 50 houses from the Government of Venezuela
is an opportunity to resettle a community in a less vulnerable area with improved planning that is poised to
organize economic activity and education with empowerment of the residents to acquire skills and choose
a livelihood that would be complementary instead of in competition with similar livelihood choices already
made by other residents.
Table 10 presents the most current information on the extent of damage to the housing sector. It suggests
that now that fuller access to previously inaccessible sites, the situation is even more grave than earlier
information had suggested. Also informative is the fact that most of the persons affected reported that
their houses and possessions were not insured.
Table 10. Affected Houses by Parish
Parish Houses Fully
Destroyed
Houses Partially
Destroyed Houses at risk
Total Houses
Affected
St. John 5 50 10 65
St. Peter 30 50 15 95
St. Andrew 5 50 10 65
St. Joseph 50 100 60 210
St. Paul 10 70 10 90
St. David 15 45 10 70
St. George 15 75 40 130
St. Patrick 250 100 250 600
St. Luke 10 50 10 70
St. Mark 10 50 10 70
Totals 400 640 425 1465
Source: Estimates based on Official GCOD data.
Government has outlined a number of priority programmes that involve the following activities as outlined
in table 11.
50 Rapid Damage and Impact Assessment - Tropical Storm Erika – August 27, 2015

57
Table 11
Priority Programmes Ministry of Housing
Measure 1 Continue to source concessionary and innovative terms and means to adequately assist build their homes public and private sector workers
Measure 2 Begin the construction of 1,500 affordable house from late 2014;
Measure 3 Assist retired persons with finance to maintain their homes
Measure 4 Complete the process of refurbishing or rebuilding all dilapidated houses;
Measure 5 To improve the sanitary standards and conditions of needy families especially in the rural districts for better health, wellness and desired environmental state. To include replacing of all pit latrines by 2020
Measure 6 Focus on the acquisition of building and construction skills at the new Polytechnic
Source: Ministry of Housing
The achievement rate on the above programmes is highly dependent on the availability of financing – either
from the Government Budget or from extra budgetary sources.
Overall objective of the housing strategy
Within the context of resettling people and (re)building communities in safe and sustainable environments,
enabling people to resume their normal lives with better opportunities for individual, family and community
development, the Government acted. The evacuated persons were accommodated in 13 shelters. The initial
count of persons in shelters for the first two or three days was approximately 800. This number has
progressively declined to some 302 after 5 months, with the prospect of this number continuing to be in
shelters until June 2016. Many of the shelters still accommodating the displaced persons are located in
Grand Bay and Roseau.
The numbers in shelters, even immediately after the event, do not adequately speak to the total number of
primarily affected people as some sought accommodation elsewhere and some chose to remain in the
devastated areas. An insight into the alternative accommodation leads to an image of the secondarily
affected population. Table 12 presents an age and sex profile of the shelter occupants a number of days
after the opening of the shelters.

58
Table 12 SHELTER OCCUPANTS BY AGE GROUP WITHIN SEX
AGE GROUP
Sex
Total Male Female
1-14
15-24
25-34
35-99
69 74 143
53 43 96
48 37 85
124 109 233
Total 294 263 557
Source: Estimates based on Official GCOD data
The table above shows the number of persons between the ages of 15 and 34 whose livelihoods have been
interrupted and who are in shelters. The figure is greater as the count has not been exhaustive, given the
method of collection of the data. Some are fishermen whose boats have been lost, who are now located far
from their former places of work and, even if they returned to their work in the area where they formerly
lived, do not have a market there for their catch. The figures of shelter (table 13) occupants show energy
that cannot now find an expression in employment. These people are at risk to turning to unacceptable
means of earning an income.
Table 13 ACCOMMODATION OF EVACUEES BY AGE GROUP AND SEX
Source: Ministry of Social Services
Age group Home Shelter Roseau
Out of
State
Elsewher
e locally
Roaming
homeless Not stated Total
Male 1-14 3 38 0 0 18 0 3 62
15-24 4 19 1 0 23 0 1 48
25-34 1 12 3 0 31 0 0 47
35-99 6 37 2 2 61 1 1 110
Total Male 14 106 6 2 133 1 5 267
Female 1-14 5 35 3 2 24 0 69
15-24 3 11 3 0 22 0 39
25-34 2 21 2 2 8 0 35
35-99 9 35 4 4 44 1 97
Total Female 19 102 12 8 98 1 240
TOTAL 33 208 18 10 231 1 6 507

59
Whereas the numbers in the above tables may vary with estimates that may have been made within 2 days
of the evacuation, they give an indication of the magnitude of the numbers, the age groupings, sex
breakdown and the decisions of the persons who sought shelter to go elsewhere.
The accommodation in the shelters, mainly in the schools and Community Centres, was open in nature – a
factor that might have triggered conflicts between some of the residents. Government has been providing
food materials for the displaced and has been providing them with modest amounts of financial support.
Government has in addition given income support to small farmers up to an amount of $2500. A number
of the farmers had crops on their lands but could not bring them to market as most of the access roads were
impassable. The financial implication of this support to date has not been ascertained.
It would be difficult for Government to continue to provide this level of support. Observations made by
some of those in shelters speak of a supply of foodstuff that is not as forthcoming as in previous weeks.
This may indicate difficulties in procurement stemming from one or more reasons including the dwindling
of funds to procure foodstuffs to continue the supply to the people accommodated in shelters.
From the above table 13, those who stayed elsewhere in Dominica have impacted the estimate of those who
fall into the category of tertiary affected, as the accommodation of friends or family members has caused
some discomfort to the households that accommodate them. The analysis of the affected population has
been discussed elsewhere in this report.
2. Education
Dominica’s education targets are set in conformance with the Millennium Development Goals (MDGs).
Dominica has already achieved universal primary and secondary education as well as universal access to
early childhood education in 2012. At the tertiary level, gender differentials persist in favour of females,
who account for two thirds of the student enrolment (MDG, 2010). Dominica’s Growth and Social
Protection Strategy (GSPS) papers for 2012-2014 and 2014-2018 include the role of the education sector
in combating poverty. One action is to increase the provision of Technical and Vocational Education and
Training (TVET) in schools, with a focus on Caribbean Vocational Qualifications (CVQs) from 2016
onwards to build skills required by employers as well as to help address issues of male underachievement.
Non-formal education programmes offered by the adult education division are developing life skills,
including literacy and numeracy training, for adults wishing to continue their education and extend their
employment options. The social transformation and empowerment project (step) seeks to enhance and
sustain the living standards of the under privileged in Dominica as indicated by the country poverty
assessment (cpa, 2008/2009). This project will be implemented through the ministry of social services,
community development and gender affairs
The Ministry of Education responded to the event by re-ordering its planned activities to bring an
effective response to the event. The re-opening of schools was staggered in accordance with the rapidity
with which the schools could be made ready for operation. The supply of water factored into the date of
reopening. Thirteen of the seventy-five schools on the island were damaged but by 28 September all
schools had been re-opened. In the affected areas, many of the damaged schools were located close to

60
rivers and suffered flooding. Government is considering the relocation of at least three schools located
near to rivers that flooded significantly. These were Primary Schools located in Coulibistrie, Colihaut
and Pichelin. Children from the affected areas were bussed to schools in areas that were operating and
that could accommodate them albeit on a shift system. The urgent work of the Ministry of Education
resulted in no disruption in the attendance pattern of the children as absenteeism did not present itself.
Some two weeks of school were lost but the Ministry has made moves to recover that lost time by
adjusting its calendar through the addition of 1 week of school beyond the planned end of term in July
2016. In addition it has foregone special time that was to be devoted to Professional Development. The
Return to Happiness Programme has contributed to the resilience of the Ministry to the event. Much
work was done in the area of psycho-social counselling to both children and teachers. Excellent
networking saw teams of counsellors coming in from St. Lucia and Trinidad to assist in the effort.
Instances in which more counselling should be given to affected children and teachers have been noted
and remedial work is being planned. In view of the exposure of schools to the hurricane season at the
time of opening of the term, attention is being given to the proposal for changing the vacation period to
address this seasonal characteristic.
Some funds in the Budget of the Ministry have had to be diverted in favour of carrying out unforeseen
remedial work of the nature described above.
Table 10 below presents the social protection methods as articulated by the Government of Dominica.
These methods were the following:
Maintain Government pro-poor education assistance programs
Increase provision of vocational technical education in primary and secondary schools.
Maintain funding of projects dealing with troubled children and dropouts.
The methods listed above are adequate in broad terms to confront the present needs for education in schools.
3. Health
The estimate of damage to the Health Sector made in September 2015, put the damage and losses to the
Health Sector at EC$ 5,229,682, as presented in table 14.
Government delivers health care services through 50 primary health care facilities and one secondary health
care facility which is the Princess Margaret Hospital in Roseau. Public health services such as water quality
monitoring and the monitoring of solid and liquid waste in the community are also delivered through the
Type 3 facilities which serve as the administrative centres for the seven health districts. These facilities
serve the entire population through the provision of access to basic health care services such as
immunization, pre-natal and childcare as well as management of non-communicable diseases. Public health
services such as water quality monitoring and the monitoring of solid and liquid waste in the community
are also delivered. The Ministry of Health set up its Emergency Operations Centre – the Health EOC, to
organize, coordinate and inform policy makers and the general public on its response to the event.
Nine of the primary health care facilities suffered flood damage and as a result were not operational for at
least two days. Two of the facilities that were flooded also suffered relatively minor damage to structure
and to fencing. Equipment loss was restricted to weighing equipment, step down transformers and other
small monitoring equipment. Several of the facilities were not accessible from the outside by roads. All
forms of telephone and cellular contact were disrupted for some time, preventing the transmission of

61
information on the status of the facilities to the Emergency Operations Centre. Several patients were
airlifted to the Princess Margaret Hospital since access was not possible by road.
Table 14
Summary of Damages and Losses, Health Sector Damages EC$ COMPONENTS OF DAMAGE AND LOSS EC DOLLARS Facilities fully destroyed $5,239,000 Facilities partially destroyed $625,000 Equipment, furniture, medications destroyed $1,102,900 Total Damages $1,727,900 Treatment of injured $2,154,556 Vector control, surveillance, information campaigns $260,187 Demolition and rubble removal $24,500 Other losses $1,06,539 Total Losses 3,501,782 Total Damages and Losses $5,229,682
Source: Estimates on official GCOD data
The Ministry moved to repair the damaged Health Centres to perform the intensified role that they should
play and mobilized vehicles to travel to areas in need of ministerial intervention. In areas where the water
supply was compromised, the harvesting of rain water was advocated and demonstrated to the affected
population. The experience of damage to the health centres such as those at Roseau and Fond Cole has
revealed their vulnerability and signalled the need to address it.
A vulnerability profile of the Health Sector reveals the following:
Financial Vulnerability in Health Ministry
The high cost of health financing at both the individual and State levels may be cited as a source of
vulnerability. In that regard, the identification of options for health financing is of great importance.
Government is requesting the assistance of the Pan American Health Organization (PAHO) to identify
options that could work for Dominica. Government’s immunization program was intensified in the
aftermath of the event to control the expected increase in water and dust borne diseases and to prevent rat-
borne diseases that derive from the failure to dispose of garbage.
Health Environmental Vulnerability
The actions in Health are determined by the environmental activity that includes the physical as well as the
social environment, hence the attention to reducing the effect of behaviours of people that give rise to the
HIV/AIDS challenge as well as other communicable and non-communicable diseases. The Budget of the
Central Government and any extra-budgetary source in the form of a project funded by an external agency
fuel the activities in Health. The increase in insect vector control and spraying/fogging activities has been
financed by a reallocation of Budget funds in view of the urgency of meeting the challenges. Government
activity continues to reduce vulnerability of this type by encouraging improved life styles while reducing
non-communicable diseases. The challenge remains to reduce poverty through health services backed by
education as other sectoral and social protection strategies are put in place.

62
The Ministry of Health has signalled a number of actions to be undertaken with a view to reducing
vulnerability in the Health sector. These are presented below in box number 11.
Box 11. Actions to reduce vulnerability
A hydrological survey should be carried out on the water courses that are close to our health facilities.
This will guide the mitigation measures that will be required for facilities including Coulibistrie, Pichelin,
Massacre, Dublanc, etc.
Facilities such as Mahaut and Newtown should be relocated
Water of all facilities should be increased and improved as a matter of urgency
Also important to the Vulnerability Reduction Strategy, accessibility immediately after the event and the
focus on Build Back Better, many of the facilities should be equipped with standby generators
58 increased storage capacity (some climate controlled –Refrigeration Units) in order to increase the
quantity of supplies there
The Ministry of Health has observed the need to intensify its efforts to keep in check the outbreak or high
incidence of water-borne diseases such as gastroenteritis and vector-borne diseases such as dengue and
leptospirosis. The Ministry’s programme of solid and liquid waste disposal requires more attention. The
elimination of pit latrines would be of great help in this endeavour. While many of these prevention efforts
are planned at central level, implementation at the local level through the primary health care system is
critical to success.
The Health Ministry has stressed the point that the reduction of vulnerability in the Sector is dependent on
the collaboration of other Ministries such as the Ministry of Works, the Ministry of Housing and the actions
of home owners to reduce risk to their houses through adhering to Building Codes and/or retrofitting their
houses for greater resilience to natural events, especially wind and water events. Its submission is presented
in a comprehensive report.
The link between poverty and health is well recognized. The Ministry of Health advocates that high quality
primary health care services remain accessible and affordable for all Dominicans. The reconstruction of all
facilities that have been damaged or lost in locations that make the facilities readily accessible is advocated.
This will include health facilities for the residents of Petite Savanne who have been evacuated from their
village and will be resettled in a new site.
4. Social Protection
In the face of a disaster, relatively wealthier households, will rely on savings to assist and market insurance
can provide them with efficient protection for larger losses. However, for the poorest households, savings
are often not an option and the high costs make private insurance outside of their reach. The poor often
need the support of the state because, besides suffering from larger immediate shocks than the wealthier,
poor people also tend to be more alone in the struggle to cope and recover. The World Bank (WB)51 argues
that the ability to manage risk depends on the “support systems” available to poor households.
The WB suggests therefore that for the poorest households—and to cover the largest shocks—well-targeted
and easily scalable social safety nets are needed.
51 Shock Waves. Managing the impacts of climate change on poverty. World Bank Group 2016
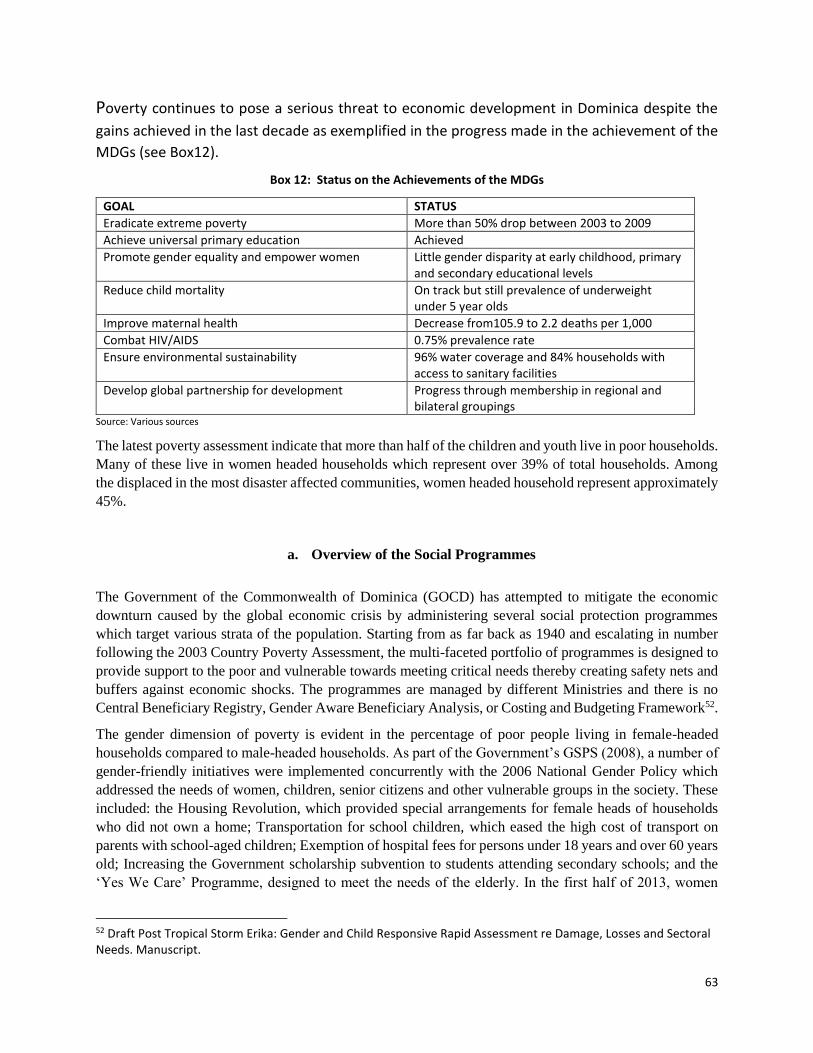
63
Poverty continues to pose a serious threat to economic development in Dominica despite the
gains achieved in the last decade as exemplified in the progress made in the achievement of the
MDGs (see Box12).
Box 12: Status on the Achievements of the MDGs
GOAL STATUS
Eradicate extreme poverty More than 50% drop between 2003 to 2009
Achieve universal primary education Achieved
Promote gender equality and empower women Little gender disparity at early childhood, primary and secondary educational levels
Reduce child mortality On track but still prevalence of underweight under 5 year olds
Improve maternal health Decrease from105.9 to 2.2 deaths per 1,000
Combat HIV/AIDS 0.75% prevalence rate
Ensure environmental sustainability 96% water coverage and 84% households with access to sanitary facilities
Develop global partnership for development Progress through membership in regional and bilateral groupings
Source: Various sources
The latest poverty assessment indicate that more than half of the children and youth live in poor households.
Many of these live in women headed households which represent over 39% of total households. Among
the displaced in the most disaster affected communities, women headed household represent approximately
45%.
a. Overview of the Social Programmes
The Government of the Commonwealth of Dominica (GOCD) has attempted to mitigate the economic
downturn caused by the global economic crisis by administering several social protection programmes
which target various strata of the population. Starting from as far back as 1940 and escalating in number
following the 2003 Country Poverty Assessment, the multi-faceted portfolio of programmes is designed to
provide support to the poor and vulnerable towards meeting critical needs thereby creating safety nets and
buffers against economic shocks. The programmes are managed by different Ministries and there is no
Central Beneficiary Registry, Gender Aware Beneficiary Analysis, or Costing and Budgeting Framework52.
The gender dimension of poverty is evident in the percentage of poor people living in female-headed
households compared to male-headed households. As part of the Government’s GSPS (2008), a number of
gender-friendly initiatives were implemented concurrently with the 2006 National Gender Policy which
addressed the needs of women, children, senior citizens and other vulnerable groups in the society. These
included: the Housing Revolution, which provided special arrangements for female heads of households
who did not own a home; Transportation for school children, which eased the high cost of transport on
parents with school-aged children; Exemption of hospital fees for persons under 18 years and over 60 years
old; Increasing the Government scholarship subvention to students attending secondary schools; and the
‘Yes We Care’ Programme, designed to meet the needs of the elderly. In the first half of 2013, women
52 Draft Post Tropical Storm Erika: Gender and Child Responsive Rapid Assessment re Damage, Losses and Sectoral Needs. Manuscript.

64
accounted for 53.8% of the total number of clients, with males accounting for 46.2% (Bureau of Gender
Affairs, 2009).
A Community Empowerment Initiative with an allocation of 7Mn which was introduced in 2009 involved
the execution of small community projects utilizing local authorities and community group to improve
community infrastructure and living conditions using local labour. The targets include 20 persons employed
per constituency (or 420 short-term jobs).
Public-funded finance institutions which support livelihoods are: AID Bank, Dominica Youth Business
Trust (DYBT), National Development Foundation of Dominica (NDFD), Small Business Support Unit, and
the Housing Loans Board.
Government’s expenditure on the programmes has been leveraged by external grant resources. An overview
of the major initiatives and levels of expenditure is shown at Table 15. (See Appendix 1 for detailed list of
programmes and Appendix 2 for budget allocations to the relevant Ministries/Departments).
Table 15: Expenditure on the Major Social Programmes for Financial Year 2013/14 and 2015
Source: Ministry of Finance
b. Response to TS Erika
Dominica has an integrated mechanism for disaster management, in keeping with its draft National
Emergency Management Plan which is under the remit of the Dominica Emergency Management
Organisation. The reaction of the GOCD to the natural disaster on August 27, 2015 was immediate and
comprehensive. Emergency relief was provided to the most severely affected households to survive in the
first stages post TSE. Physical access was the most defining factor in hindering rehabilitation, however,
there was little or no disruption in governance.
The first measure was to relocate affected persons to shelters. Initially as many as 13 shelters were opened.
Presently the shelter services and stipends are detailed in table 16.
PROGRAMME EXPENDITURE (XCD)
2013/2014 Expenditure as at May 2015
Housing 5,536,715
Public Assistance 6,148,853
Public Support 2,616,624 3,765,721
Schools Transfer Grant 400,000 2,173,694
Grants to Primary School 1,204,388
Grants to Secondary Schools 5,234,565
Education Trust Fund 2,457,716 2,173,694
Child Welfare 700,755
CHANCES 650,913
School Feeding 139,578
Yes We Care 966,267

65
Table 16: Interim Measures post TSE
Guest House No residents Cost
Springfield Guest House 53 27,595 for period of 3 mths
Mr. Clean’s Bed and breakfast 20 17,250 monthly
Kent Anthony’s Guest House 17 20,000 monthly
St. Aimie’s Guest House 43 30,000
Roseau Youth Centre
Mt. Carmel
Total 133
Source: Ministry of Planning
The other social protection measures post TSE are presented in Box 13 (with provisions for
support to livelihoods highlighted).
Box 13. Post Tropical Storm Erika: Social protection Measures
Measures Description
Rental assistance A maximum of $1,000 per family who were moved into government identified guest houses with private homeowners who provided temporary accommodation also qualifying for period of 6 months. With an estimated 484 households displaced following complete loss of homes, significant structural damage and/or voluntary evacuation the total expenditure for temporary accommodation was given at $484,000
Assistance to shelters Assistance to Our Lady of Mount Caramel Retirement Home affected by TSE including monthly payments to staff $7,700); food and general supplies ($4,000); insurance ($320); transportation ($1,500); utilities/taxes; maintenance ($900); and a lump sum of 5,000 for refurbishment of kitchen
Loss of personal items Persons who experienced loss of personal items received financial contribution up to maximum of $5,000 per family for complete loss of household contents and $3,000 per family for partial loss. The estimated number of household eligible for financial assistance was 140 for partial loss giving a total of $420,000
Assistance to fishermen
$300,000 allocation to Ministry of Fisheries which can impact on the livelihood of fisherfolk
Replacement of capital stock
Payment of 60% of estimated value of stock damage, equipment up to a maximum of $2,500 which can impact on the livelihood of self-employed/ business owners
Home repairs Maximum of $20,000 for significant structural damage to house. With approximately 119 houses eligible island wide the total estimated cost is $38 Mn. Maximum of $15,000 for home repairs for partial damage to house. With approximately 126 houses eligible island wide the total estimated cost was $1.89 Mn. For households earning income less than 10,000 qualify for 100% assistance; those with income between 10,000 – 20,000 qualify for 80%; and those with income 20,000 – 30,000 qualify for 60% This can impact on home-based business particularly relevant to females.
Displacement allowance
Stipend for a period of 6 mths is follows: 223 households (1-3 individuals) - 78,050/mth 114 households (4 – 6 individuals) – 86,400/mth 20 households (7 individuals and above) – 15,000/mth
Vehicle replacement Waiver of import duties for vehicle owners for a period of 6 months commencing November 25, 2015 which can impact upon business persons involved in the tourism and transport services industry

66
To implement these measures, applications are subjected to review by the Chairperson of the Technical
Committee for Social Services and approval by the Chairperson of the Cabinet Sub-committee for Social
Services. The actual processing was overseen by the Permanent Secretary, Ministry of Social Services
Family and Gender Affairs or by the Permanent Secretary, Ministry of Justice Immigration and National
Security. The individual ministries have been directed to redirect significant development resources towards
compensation, short-term relief, rehabilitation of infrastructure, and stimulation of economic activity.
The Country Gender Assessment research indicates that employers (including the Government and private
sector) do not provide childcare facilities, although some workplaces allow parents (often single mothers)
to bring their children to the workplace after school. Further, persons, predominantly women, engaged in
unpaid domestic and agricultural work, are ineligible for work-related or retirement benefits.
c. Assessment of Social Protection Programmes
The estimate of persons directly and indirectly impacted by TSE is approximately 15,900 persons. The
extent to which these compensation measures address the full or partial impact of the disaster on the
population and create a buffer from the worst effects of the disaster or to buffer from the likely long term
impact is difficult to ascertain. It is more than likely that the measures have temporarily halted the transition
of several families from transient poverty descending into indigence, however most remain vulnerable. The
GOCD responded to the most pressing immediate needs: rebuilding access, the need for alternative housing
which was alleviated by placement in shelters and providing psychosocial support. Not everyone suffered
total destruction of their homes or absolute loss of household item, but due to the voluntary evacuation, all
residents of Petite Savanne and Dubique and some in Bath Estate now require long-terms housing solutions.
According to the preliminary 2011 Census, there were 217 households in Petite Savanne with 3.5 persons
per household made up of 40% males; and 46 households in Dubique with 3.3 persons per household (72%
women among the displaced).
There are some observable strengths and challenges associated with the post TSE measures as outlined in
Box 14.
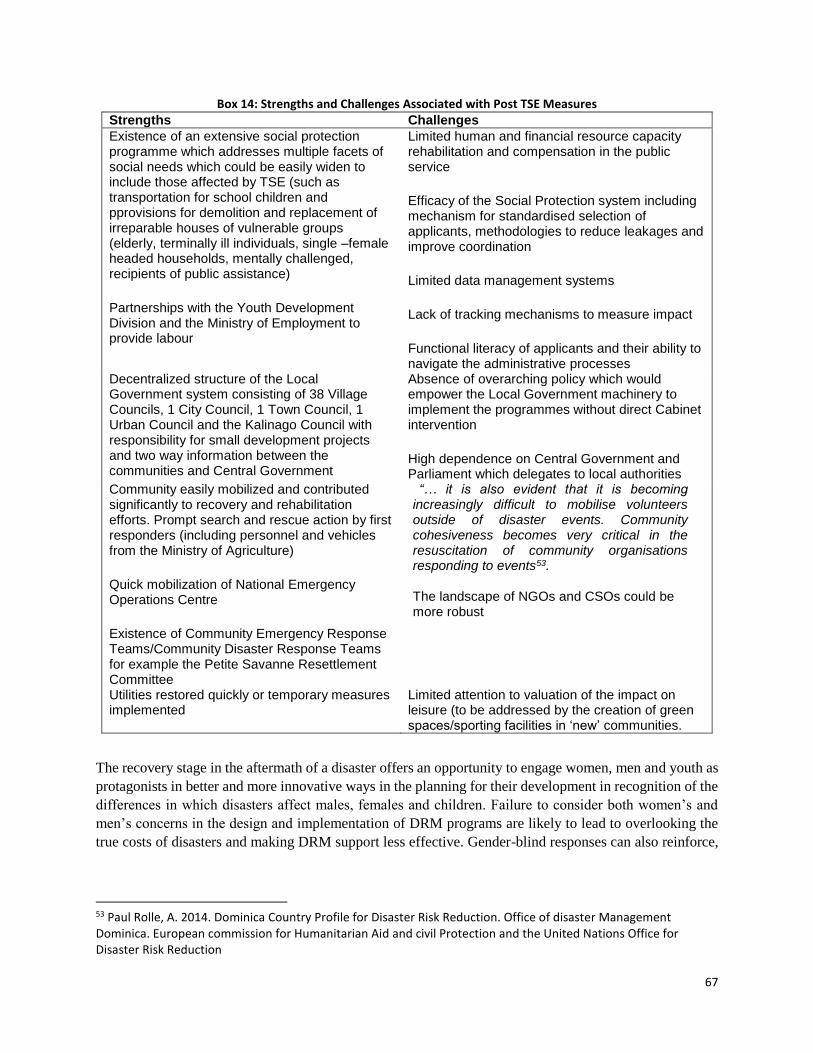
67
Box 14: Strengths and Challenges Associated with Post TSE Measures Strengths Challenges
Existence of an extensive social protection programme which addresses multiple facets of social needs which could be easily widen to include those affected by TSE (such as transportation for school children and pprovisions for demolition and replacement of irreparable houses of vulnerable groups (elderly, terminally ill individuals, single –female headed households, mentally challenged, recipients of public assistance)
Partnerships with the Youth Development Division and the Ministry of Employment to provide labour
Limited human and financial resource capacity rehabilitation and compensation in the public service
Efficacy of the Social Protection system including mechanism for standardised selection of applicants, methodologies to reduce leakages and improve coordination
Limited data management systems
Lack of tracking mechanisms to measure impact
Functional literacy of applicants and their ability to navigate the administrative processes
Decentralized structure of the Local Government system consisting of 38 Village Councils, 1 City Council, 1 Town Council, 1 Urban Council and the Kalinago Council with responsibility for small development projects and two way information between the communities and Central Government
Absence of overarching policy which would empower the Local Government machinery to implement the programmes without direct Cabinet intervention
High dependence on Central Government and Parliament which delegates to local authorities
Community easily mobilized and contributed significantly to recovery and rehabilitation efforts. Prompt search and rescue action by first responders (including personnel and vehicles from the Ministry of Agriculture)
Quick mobilization of National Emergency Operations Centre
Existence of Community Emergency Response Teams/Community Disaster Response Teams for example the Petite Savanne Resettlement Committee
“… it is also evident that it is becoming increasingly difficult to mobilise volunteers outside of disaster events. Community cohesiveness becomes very critical in the resuscitation of community organisations responding to events53.
The landscape of NGOs and CSOs could be more robust
Utilities restored quickly or temporary measures implemented
Limited attention to valuation of the impact on leisure (to be addressed by the creation of green spaces/sporting facilities in ‘new’ communities.
The recovery stage in the aftermath of a disaster offers an opportunity to engage women, men and youth as
protagonists in better and more innovative ways in the planning for their development in recognition of the
differences in which disasters affect males, females and children. Failure to consider both women’s and
men’s concerns in the design and implementation of DRM programs are likely to lead to overlooking the
true costs of disasters and making DRM support less effective. Gender-blind responses can also reinforce,
53 Paul Rolle, A. 2014. Dominica Country Profile for Disaster Risk Reduction. Office of disaster Management Dominica. European commission for Humanitarian Aid and civil Protection and the United Nations Office for Disaster Risk Reduction

68
perpetuate and increase existing gender inequalities, making situations worse for women and other
vulnerable groups.
Although there are no formal legislative barriers to women’s access to resources, titles to land are generally
in the name of male relatives. Lack of title is a barrier to credit and would also limit access to assistance
with housing in the post-TSE scheme which seeks to construct 2-bedroom prototypes housing units on lands
already owned by individuals who have difficulty accessing credit. Immediately following the natural
disaster women retain main responsibility for reproductive care thereby experiencing the brunt of disaster-
related impact such as accompanying family members to access health services, care for the elderly and for
children in situations where access to water and electricity is curtailed and disruptions to schooling. Many
had to wash cooking utensils and laundry in the rivers with a fear of a repeat of the possibility of rivers
overflowing. In the clean-up and rehabilitation works there was an absence of temporary employment for
women. There is also a direct loss of livelihoods for many women with traditional home-based business
and commercial and subsistence farming in the spaces directly around their homes. Within the shelters,
there is the loss of privacy for both males and females with the added risk of increased gender-based
violence. In confined and shared living quarters, reproductive duties become especially onerous. Women
and men also display different coping mechanisms post disaster. With women generally engaging in
mobilizing social networks while some men resort to more risky behaviours. Among young men, the shock
of loss of property, especially cars, has reduced their capability of participating in the response and
recovery. The elderly also have challenges in adapting to unfamiliar environments and changes in daily
routines.
D. Livelihoods and Social Protection Mechanisms Before and After
the Event
The social protection mechanisms have been geared to the empowerment of people as an avenue to the
reduction of poverty and dependence on the state. A number of the mechanisms include the teaching of a
number of skills to predominantly young people to assist them to choose a livelihood that they can pursue.
In addition, the Social Investment Fund has paid attention to all activities that help to reduce poverty and
elevate the quality of life, especially for the poor whose improvement will add significantly to the overall
quality of life in Dominica while equipping them to be more focused on self-development that will result
in poverty reduction and enable a greater Domestic Product. The following table presents social protection
methods.
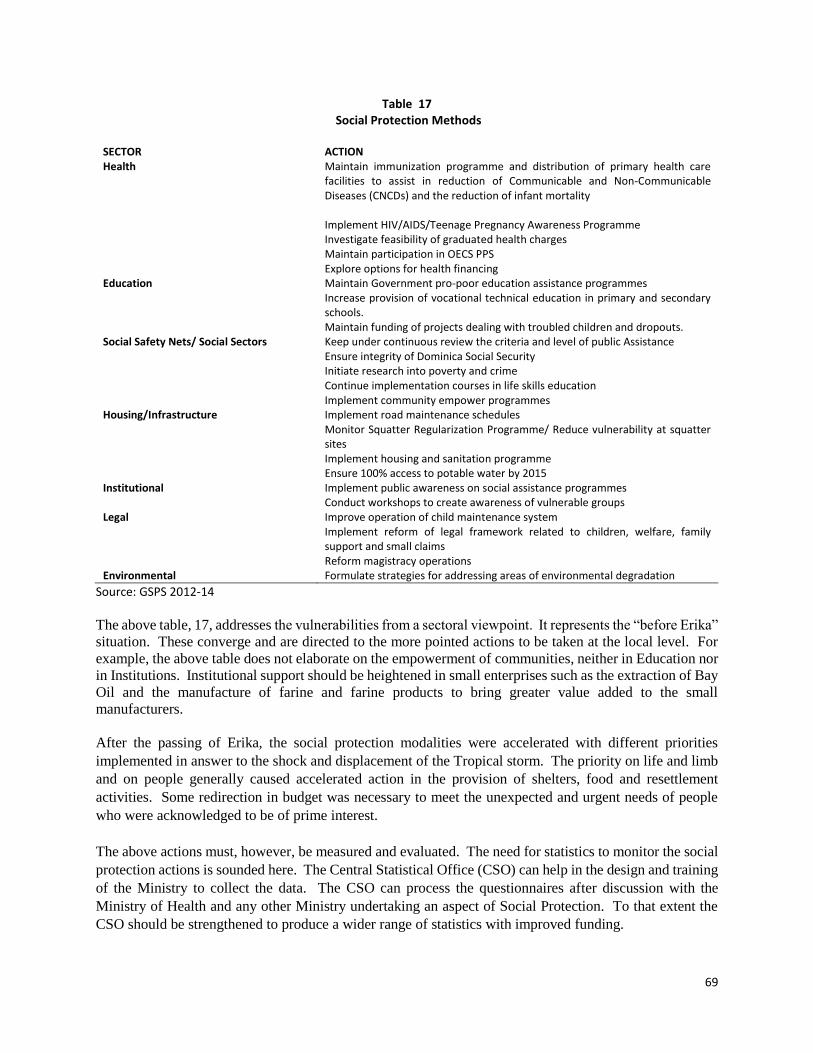
69
Table 17 Social Protection Methods
SECTOR ACTION Health Maintain immunization programme and distribution of primary health care
facilities to assist in reduction of Communicable and Non-Communicable Diseases (CNCDs) and the reduction of infant mortality Implement HIV/AIDS/Teenage Pregnancy Awareness Programme Investigate feasibility of graduated health charges Maintain participation in OECS PPS Explore options for health financing
Education Maintain Government pro-poor education assistance programmes Increase provision of vocational technical education in primary and secondary schools. Maintain funding of projects dealing with troubled children and dropouts.
Social Safety Nets/ Social Sectors Keep under continuous review the criteria and level of public Assistance Ensure integrity of Dominica Social Security Initiate research into poverty and crime Continue implementation courses in life skills education Implement community empower programmes
Housing/Infrastructure Implement road maintenance schedules Monitor Squatter Regularization Programme/ Reduce vulnerability at squatter sites Implement housing and sanitation programme Ensure 100% access to potable water by 2015
Institutional Implement public awareness on social assistance programmes Conduct workshops to create awareness of vulnerable groups
Legal Improve operation of child maintenance system Implement reform of legal framework related to children, welfare, family support and small claims Reform magistracy operations
Environmental Formulate strategies for addressing areas of environmental degradation
Source: GSPS 2012-14
The above table, 17, addresses the vulnerabilities from a sectoral viewpoint. It represents the “before Erika”
situation. These converge and are directed to the more pointed actions to be taken at the local level. For
example, the above table does not elaborate on the empowerment of communities, neither in Education nor
in Institutions. Institutional support should be heightened in small enterprises such as the extraction of Bay
Oil and the manufacture of farine and farine products to bring greater value added to the small
manufacturers.
After the passing of Erika, the social protection modalities were accelerated with different priorities
implemented in answer to the shock and displacement of the Tropical storm. The priority on life and limb
and on people generally caused accelerated action in the provision of shelters, food and resettlement
activities. Some redirection in budget was necessary to meet the unexpected and urgent needs of people
who were acknowledged to be of prime interest.
The above actions must, however, be measured and evaluated. The need for statistics to monitor the social
protection actions is sounded here. The Central Statistical Office (CSO) can help in the design and training
of the Ministry to collect the data. The CSO can process the questionnaires after discussion with the
Ministry of Health and any other Ministry undertaking an aspect of Social Protection. To that extent the
CSO should be strengthened to produce a wider range of statistics with improved funding.

70
Section Three: Recommendations for Sustainable Livelihoods
There is little doubt that TS Erika has resulted in increased challenges for segments of the population
engaged in livelihood activities both in the formal and informal sector. The preceding sections sought to
elaborate with some degree of detail the extent to which the event has negatively impacted households and
individuals, men and women, and sought to identify their geographic location, their social and economic
characteristics and the differentiated challenges which they face.
This section seeks to provide a way forward. It sets out recommendations based on the analysis of the
effects of the event in the four areas of investigation: the social sector, including social protection measures
and the productive sector - agriculture, tourism, and commerce. The investigation treated infrastructure as
an enabling factor. The Report commends the government for its recovery approach which at the time of
this study has been based on an inter-Ministerial Cluster approach. It is the view that such an approach can,
through the synergy achieved, extend the effectiveness of the budgetary allocations across Ministries and
Government-funded organizations.
The recommendations for sustainable livelihoods are meant to strengthen resilience of the population.
Initiatives should be taken on an ongoing basis to reduce the negative psycho social impacts resulting from
the event, that may act as a constraint to meeting the development challenges.
Recovery
In view of huge recovery needs, it is expected that the GOCD will be required to undertake a sustained
effort to mobilise financial resources. As is the case in most recovery programmes, the resources would be
pooled through several windows of funding: the government’s own resource mobilisation including
budgetary reallocations, loans from IFIs, grants from multilateral and bilateral agencies, contributions from
the private sector and citizens (which would include the remittance income from the diaspora), and
reallocations from existing project portfolios. These resources should complement the efforts for self-
recovery which are already underway.
The Report recommends that the resources be pooled in such way that would keep the ratio of debt within
manageable levels, and utilise grant assistance to the extent possible. It is expected that the implementation
of the recovery programmes would require considerable technical and management support, such support
may be provided by out sourcing technical skills and expertise from the OECS and wider Caribbean.
The Report further recommends that discussions should be opened with key development partners on the
issues of debt relief and/or restructure as a means of meeting the resource requirements for recovery.
Sustainable Livelihoods
The recommendations for Sustainable Livelihoods are made acknowledging certain assumptions about
livelihoods. Most importantly, that livelihoods are a means to support an existence and as such comprises
the assets, capabilities and activities required for a means of living. The recommendations also

71
acknowledge that livelihoods are complex systems that are non-sector specific and are influenced by
multiple actors, strategies and outcomes. Significantly for the TS Erika outcomes, is the notion that
livelihoods build on families and their communities’ inherent potential.
Working through these multiple dimensions make livelihood systems resilient through four primary
stakeholders: the livelihood owners, the community, with its formal and informal groups and organisations;
the private sector (both formal and informal) and the government.54
Box 15. Livelihoods and Assets
Source: Investing in Resilience
With this understanding in mind, of the combination of assets, detailed in box 15 and the work of
stakeholders, the recommendations for restoration of livelihoods and the creation of sustainable livelihoods
are grounded in a number of principles.
First, that for livelihoods to be sustainable it is key that actions lead to the empowering of the livelihood
owners, the affected population so that they can take advantage of new situations and opportunities–
allowing them greater flexibility in the livelihood choices they make. Secondly, for livelihoods to be
sustainable there must be a reduction of dependence on the state or any other agencies, but not reduction of
support from the state and other agencies. Thirdly, there is need for upscaling existing processes of
production and distribution that provide livelihoods, for modernising others; and upgrading the skills set of
the population with an eye to seizing opportunities for delivering community services. Lastly for livelihoods
to be sustainable the burden of care which women carry in their productive and reproductive roles must be
recognised and processes put in place to reduce this burden and allow women to make their full contribution
to their households, the development of their country and to enable them to fulfil their own potential. This
particularly so, as a significant proportion of the affected population are households headed by women.
An example of an empowerment approach to an affected group would be the provision of assistance to agro
processors not only in health and safety requirements, marketing, or product standards, but general financial
management (and financing) assistance. As well, small and micro entrepreneurs may require technical
assistance which would help them, reap the benefits of ‘value added’ to increase their income. An
integrated approach provided to farmers, fisher folk and small and micro entrepreneurs, therefore would
include: adult education, skills training, and financing, and child care where necessary for the working
mothers. Such action, would surely result in more sustainable livelihoods.
54 Investing in Resilience. Asian Development Bank. 2013
Livelihoods are built on Assets:
Physical – access to infrastructure, service, tools and technology
Social – access to support, advice and assistance from one’s community or networks
Financial – access to savings, credit, insurance and markets
Human – one’s own practicality, health, education and ambition
Natural – land, water, forests and biodiversity

72
The current social protection effort is challenged by the limited financial resources of the Government in
light of TS Erika and the pressing demands of infrastructure recovery. However the GCOD must do all in
its power to harness the strength of the social capital that is at the heart of Dominica, in this recovery effort.
If this were ignored or dismantled it would surely make the task of recovery much more difficult.
To make the best use of the social capital may require strengthening capacity for effective local governance
and incorporating the considerable talent and skills available through Dominica’s diaspora.
It is expected that the policy framework for recovery would also be guided by the notion that the gap
between rich and poor should be reduced, as a result of the recovery measures, instead of widened. In order
to achieve equitable results through recovery it would be important for a new round of poverty estimates to
be completed, including measures of inequality and vulnerability. Greater attention should be paid to the
management of national statistical data so that social conditions and quality of life can be closely monitored.
Given the economic importance of tourism to Dominica, a revival of the tourism industry is vital. It not
only provides employment and investment opportunities, but the industry’s recovery can help stimulate
trade, business and construction activities. In the aftermath of TS Erika, the provision of immediate
emergency relief, the restoration of basic services and the rebuilding of damaged infrastructure in
destination communities were of paramount importance.
The recommendations within the tourism sector therefor seek to identify longer term impacts and address
the drivers of vulnerability in the affected communities and build on existing capacity.
That said, it is not enough to respond to the immediate disaster. As the immediate needs of the affected
communities are tended to, attention must be redirected toward longer-term preparedness strategies that
aim to reduce vulnerability and increase capacities to cope and respond to future shocks. In addition,
Government should seek to mainstream DRR/DRM and CCA into its national and sectoral development
agendas.
Livelihoods and Women
The Recommendations the Sustainable Livelihoods presents an opportunity to reduce the vulnerability of
women and increase gender equality. This can be considered in a number of approaches. For example in
the resettlement process where homes have to be allocated, women could be given joint home ownership
in a legal sense, through the shelter programme. Their role as income earners as back yard gardeners and
micro entrepreneurs would be recognised in livelihood recovery interventions, with an emphasis on
training, cash support, and financial inclusion. Women could also be included in consultative fora at all
levels, and gender sensitiveness would be an important feature of all programming initiatives. Such
inclusive practices would be applied to people with disabilities.
In the tourism sector, women are mostly employed as housekeepers and waitresses, in the tourism sector,
while more men tended to hold technical (maintenance) and managerial posts. It is commonly observed that
in coping with post-disaster stress, the tourism sector often maintains managerial and ground staff such as
gardeners while laying off housekeepers. Thus women’s economic opportunities will probably suffer more
significantly as a result of TS Erika, as women will most likely be the first to lose their jobs from within
the tourism sector.
Recommendations for short and medium term livelihood support, must therefore address conceived so as
to meet women’s needs.
73
Livelihoods and Social Capital
It cannot be over emphasized that people who have been affected through the loss of homes and livelihoods
as a result of TS Erika, should be fully informed and consulted on resettlement and compensation options.
Where possible, the sites selected for relocation should be geographically close to the original homes, or at
least allow them to fulfil their livelihood activities. Where persons were farmers or fisher folk, efforts
should be made to resettle them where they can fulfil their livelihood activities. Urban settlements for such
persons may be unsuitable. Resettlement sites should be carefully selected in order to re-establish the
socioeconomic condition and cultural practices of those resettled.
The resettlement projects should be conceived and executed as part of a development program with resettled
persons who should be provided sufficient resources and opportunities to share in the livelihood benefits.
Work should be done to ensure that affected communities give their demonstrable acceptance to the
resettlement and the development program, and that any necessary displacement is done in the context of
negotiated settlements with affected communities.
Planning for the provision of economic and social services at the resettlement site must take into account
the needs of both the resettled and the host communities, in order to minimize conflicts and create a common
interest in the success of the resettlement project.
The details of the recommendations for sustainable livelihoods are presented in the following Matrix for
Sustainable Livelihoods.

74
MATRIX – INITIATIVES FOR SUSTAINABLE LIVELIHOODS
Disaster Risk Management
Agriculture Initiative Period
Existing Recovery Interventions
Short Term Medium Term Long Term
Continue the implementation of the four components of the Recovery interventions.
Strengthen the public policy framework to ensure increased private sector participation.
Introduce modern climate smart technologies that enhance productivity along the value chains.
Strengthen the implementation process to include – Targets and Phasing, Value Chain approach, Inclusion, Partnerships, Resource Mobilization and Monitoring and Evaluation to ensure accountability and to measure progress
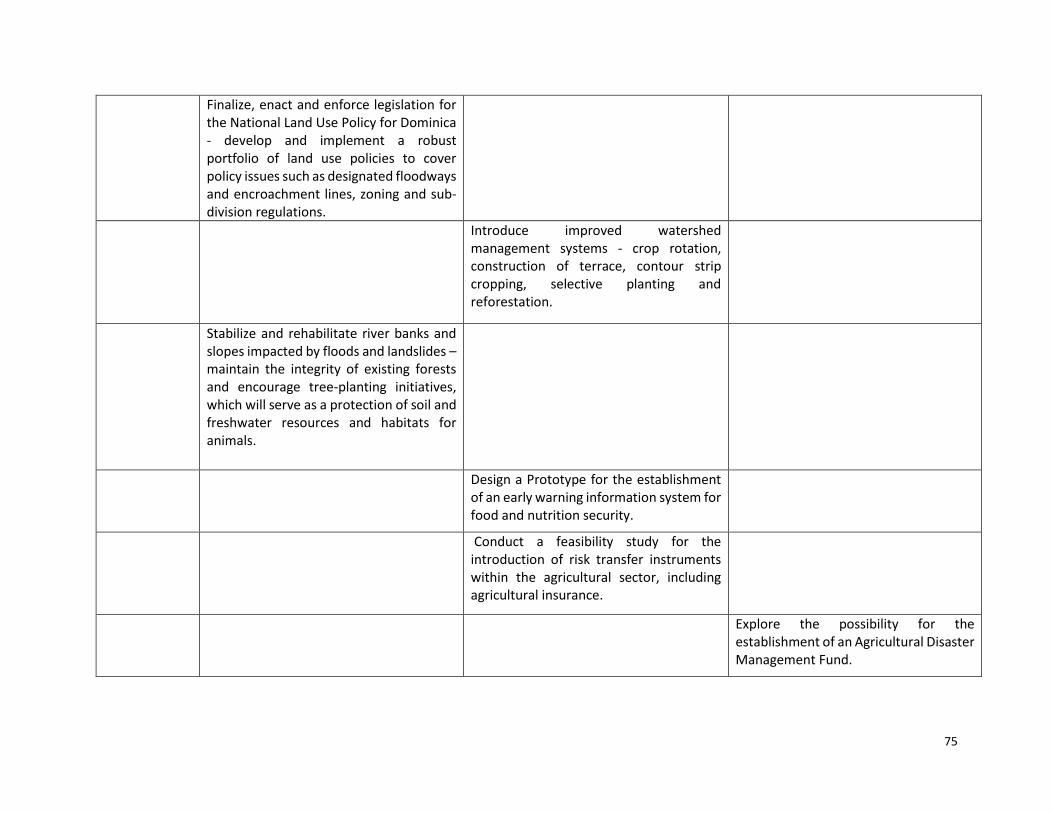
75
Finalize, enact and enforce legislation for the National Land Use Policy for Dominica - develop and implement a robust portfolio of land use policies to cover policy issues such as designated floodways and encroachment lines, zoning and sub-division regulations.
Introduce improved watershed management systems - crop rotation, construction of terrace, contour strip cropping, selective planting and reforestation.
Stabilize and rehabilitate river banks and slopes impacted by floods and landslides –maintain the integrity of existing forests and encourage tree-planting initiatives, which will serve as a protection of soil and freshwater resources and habitats for animals.
Design a Prototype for the establishment of an early warning information system for food and nutrition security.
Conduct a feasibility study for the introduction of risk transfer instruments within the agricultural sector, including agricultural insurance.
Explore the possibility for the establishment of an Agricultural Disaster Management Fund.

76
Dominica Designation as the “Nature Island of the Caribbean”
Establish within the State College a “Centre of Excellence for Agro-Eco-Tourism” in the Caribbean.
Strengthen the Dominica Organic Farming Programme, including the strengthening of the Dominica Organic Association Movement (DOAM).
Youth In Agriculture
Identify a portfolio of potential Youth Food, Agriculture and Linkages Business Enterprises and develop profitable Business Models
Enhance the training of young people around these identified business enterprises
Strengthen existing youth apprenticeship, mentoring and business incubator programs
Establish a centre for Youth Entrepreneurship, with an associated Youth Enterprise development Fund.
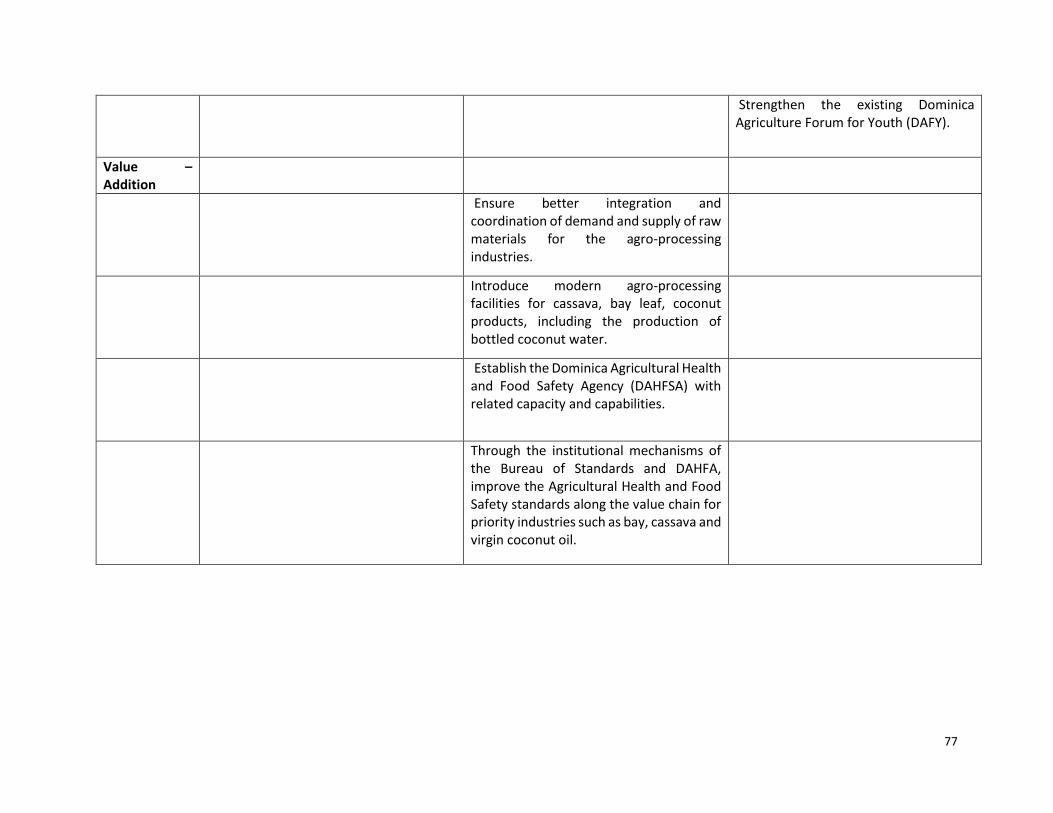
77
Strengthen the existing Dominica Agriculture Forum for Youth (DAFY).
Value – Addition
Ensure better integration and coordination of demand and supply of raw materials for the agro-processing industries.
Introduce modern agro-processing facilities for cassava, bay leaf, coconut products, including the production of bottled coconut water.
Establish the Dominica Agricultural Health and Food Safety Agency (DAHFSA) with related capacity and capabilities.
Through the institutional mechanisms of the Bureau of Standards and DAHFA, improve the Agricultural Health and Food Safety standards along the value chain for priority industries such as bay, cassava and virgin coconut oil.

78
Tourism Activity Period
Strengthen recovery of Sector
Short Medium Long Term
Reestablishment and repair to sites and natural attractions, operations, done to appropriate standards and capacities, with inspections for resilience by engineers
Restoration of consumer confidence (redefinition) in the Dominica brand
Research on insurance schemes to increase resilience to future shocks
Build Resilience
Establish enabling governance processes and structures that advance public-private interaction and engagement;
Improve (prioritise) equity, inclusion and downward accountability in the recovery mandate
Build targeted and gap-specific capacity at the local level;
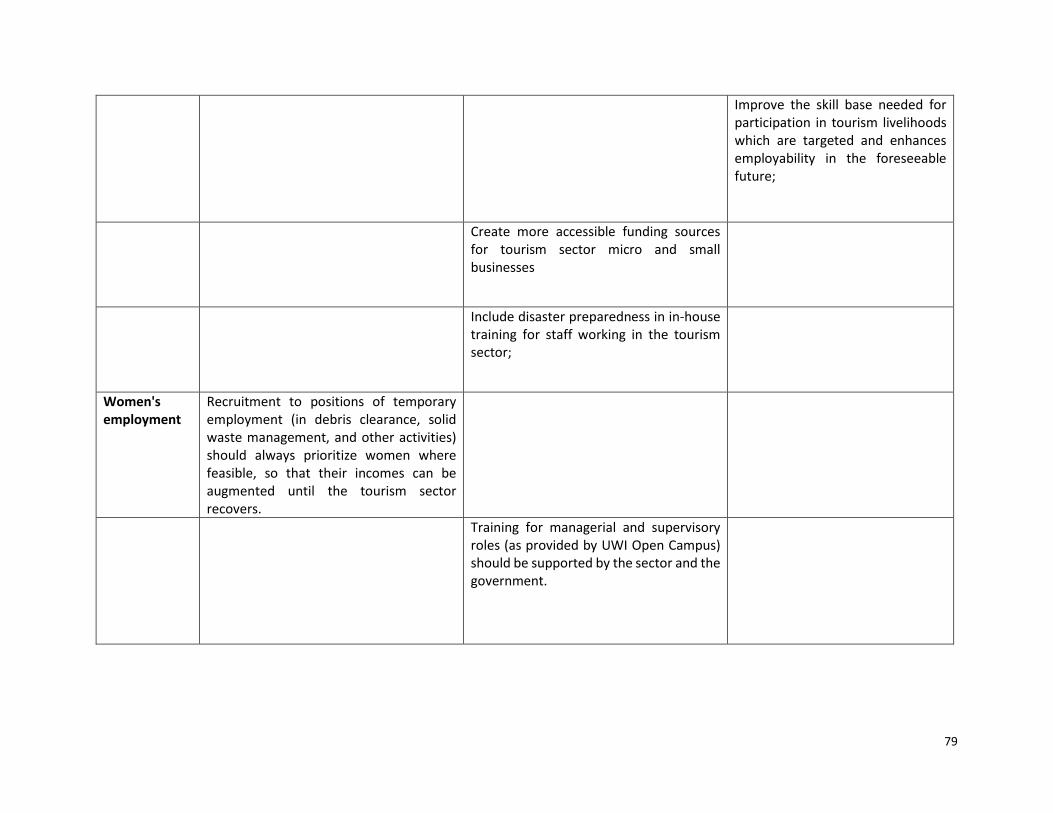
79
Improve the skill base needed for participation in tourism livelihoods which are targeted and enhances employability in the foreseeable future;
Create more accessible funding sources for tourism sector micro and small businesses
Include disaster preparedness in in-house training for staff working in the tourism sector;
Women's employment
Recruitment to positions of temporary employment (in debris clearance, solid waste management, and other activities) should always prioritize women where feasible, so that their incomes can be augmented until the tourism sector recovers.
Training for managerial and supervisory roles (as provided by UWI Open Campus) should be supported by the sector and the government.
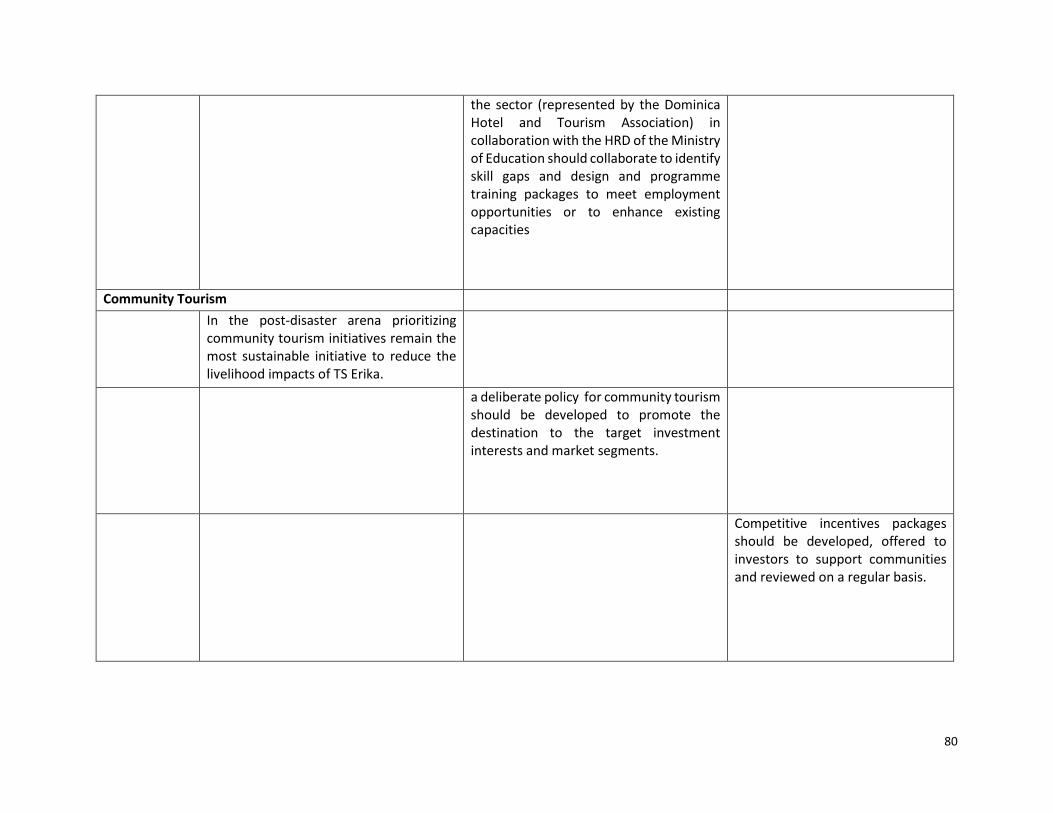
80
the sector (represented by the Dominica Hotel and Tourism Association) in collaboration with the HRD of the Ministry of Education should collaborate to identify skill gaps and design and programme training packages to meet employment opportunities or to enhance existing capacities
Community Tourism
In the post-disaster arena prioritizing community tourism initiatives remain the most sustainable initiative to reduce the livelihood impacts of TS Erika.
a deliberate policy for community tourism should be developed to promote the destination to the target investment interests and market segments.
Competitive incentives packages should be developed, offered to investors to support communities and reviewed on a regular basis.

81
Commerce and non-agricultural economic activity
Activity Period
Short Medium Long
Strengthen
contribution
to income
generation
and export
Build capacity of small actors in the market
Upscale /modernize plant and equipment
Strengthen Health/Safety Quality Standards
Strengthen the product base and access to raw material’s supply
from national sources
Provide incentives for the resuscitation of
manufacturing establishments in the interest
of the macro economy
Explore opportunities for creative use of stone boulders (e.g.
river and sea wall defenses)
Create opportunities for work in the
communities through the provision of regular
sanitation services and development of
aesthetics.
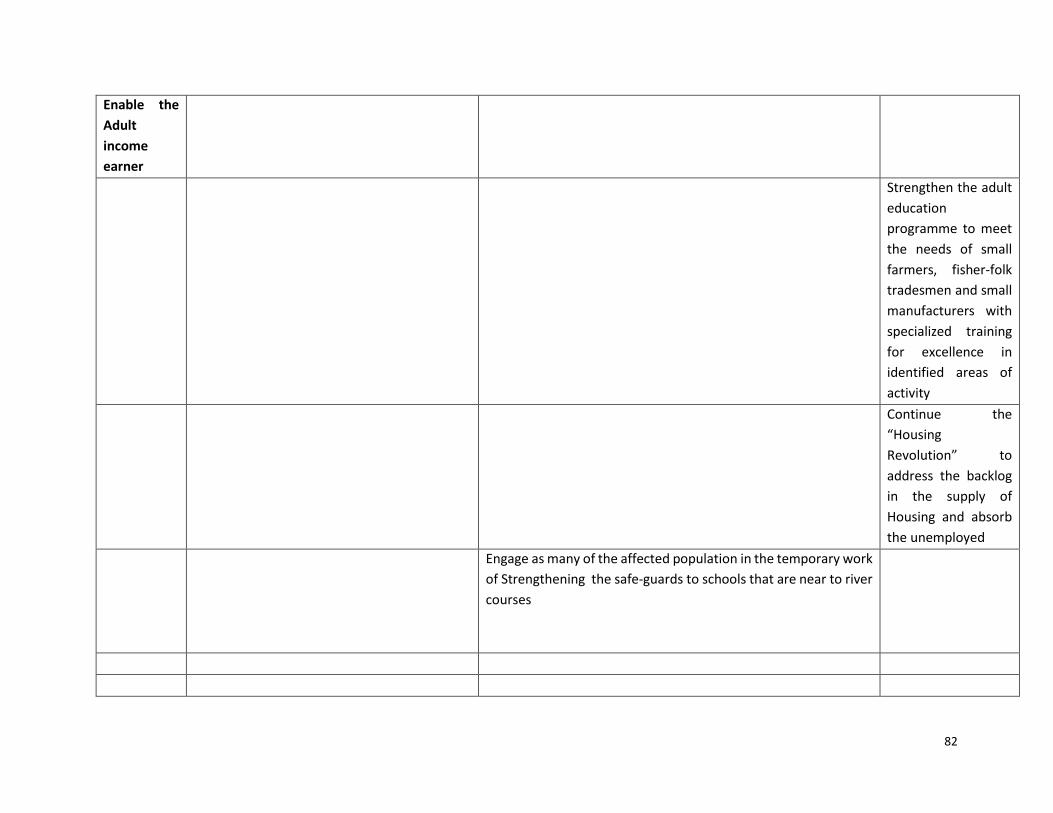
82
Enable the
Adult
income
earner
Strengthen the adult
education
programme to meet
the needs of small
farmers, fisher-folk
tradesmen and small
manufacturers with
specialized training
for excellence in
identified areas of
activity
Continue the
“Housing
Revolution” to
address the backlog
in the supply of
Housing and absorb
the unemployed
Engage as many of the affected population in the temporary work
of Strengthening the safe-guards to schools that are near to river
courses

83
Enable
Youth
income
earners
Child Care - Managed and serviced and
maintained by members of the community.
Provided in the community( particularly in new
settlements) allows the young parents (
particularly single mothers) to engage more
fully in the labor market;
Retraining of women in alternative skills to meet the demands of
the Construction Sector in the areas of electricals, tiling, ceiling,
and plumbing.
Art industry with focus on stone carving/sculptures and use of
drift wood.
Community contracting for maintenance of access roads
Expand Small engine repairs and boat
building/repair
Structure the Manufacture of fish pots to
involve affected population

84
SOCIAL PROTECTION MEASURES Activity Period
Short Medium Long
Strategic Recommendations
Build national capacity in the conduct of impact assessments with the CSO being an integral part of the assessment team.
Ensure that all data collected is sex and age disaggregated and also ensure the inclusion of gender-sensitive indicators as well as indicators for the elderly and persons with disabilities
Explore Mortgage Financing possibilities that are suitable for low income earners

85
Create opportunities to involve more women and youth, women’s organizations, state gender focal points, and other organizations working on gender issues as partners in the recovery work to act as agents of change. These groups can take leadership roles in disaster assessment and management, for example in designing livelihood recovery programs and/or determining housing reconstruction priorities.
Build on and implement the multi-sectoral Gender and Child Responsive considerations within the Strategic Program on Climate Resilience (SPCR) and the Low Carbon Climate Resilient Development Strategy
Strengthen capacity and resources for addressing the psycho social effects following events such as TS Erika
Examine and apply, as appropriate, the considerations for mainstreaming gender considerations in DRM being developed by CDEMA and other regional stakeholders

86
Practical Recommendations
Create more opportunities to involve more women and youth, women's organizations, state gender focal points and the organizations working on gender issues as partners in the recovery
Enhance the employment placement mechanisms under the remit of the Commissioner of Labor
Institute a comprehensive training programme in construction to address the needs and cost of technologies and practices to build resilient infrastructure
Develop a networked labor market information system especially in the various localities affected by the disaster, with participation of local government authorities, employers and NGOs.
Develop User-friendly dissemination techniques of information on the transfers or soft-credit allowances earmarked for repairs (of building or equipment), inventory replenishing, and monetary working capital (to pay daily wages and other similar financial needs)

87
Annex 1. References
1. Ministry of Health and the Environment. 10/21/2015. Post Tropical Storm Erika: Health Sector
Report 2015. Ministry of Health and the Environment
2. Kairi Consultants Limited. (2008/2009). 2010. Country Poverty Assessment. Dominica :
Reducing Poverty in the Face of Vulnerability. Vol. 1,2,3, Source:
http://www.caribank.org/uploads/publications-reports/economics-statistics/country-poverty-
assessment-reports/Dominica+CPA+-+Main+Report+Final+(Submitted).pdf
3. Data derived from the Population and Housing Census, 2011, on the Characteristics of the
Affected Population by Tropical Storm Erika. January 2016. Central Statistical Office, Ministry
of Finance and Planning. GCOD.
4. Data Derived from the Informal Sector Survey (2011) on the Affected Population by Tropical
Storm Erika, January, 2016. Central Statistical office, Ministry of Finance and Planning, GCOD.
5. UNICEF Area Office, Barbados. (Draft 2015). Unpublished. Situational Analysis of Children,
Commonwealth of Dominica.
6. Petite Savanne Resettlement Committee. (September, 2015?) Report on Petite Savanne, Post
Tropical Storm Erika (unpublished).
7. Ministry of National Security, Labour and Immigration. Dominica Country Profile. Disaster Risk
Reduction (CP-DRR). September 2014.
8. Report of the Private Sector and Agriculture Cabinet Sub-Committee. GCOD.01/ 2016.
Unpublished
9. Impact of Tropical Storm Erika on Employment. GCOD 01/2016. Unpublished
10. CGOD. September 25, 2015. Rapid Damage and Impact Assessment, Tropical Storm Erika –
August 27, 2015.
11. Dominica request for disbursement under the rapid credit facility—press release; staff report; for
Dominica. IMF Country Report No. 15/316
12. Dominica Resettlement Strategy. UNDP Consultants: Alfonso Calzadilla & Randall Viales,
January 2016
13. Sustainable livelihoods guidance sheets, DFID, April 1999
14. Fourth Medium-Term Growth and Social Protection Strategy (GSPS) 2014 – 2018. Government of
the Commonwealth of Dominica
15. The 2011 Dominica Fisheries Industry Census
16. The 1995 Dominica Agricultural Census
88
17. Investing in Resilience: Ensuring a Disaster Resistant Future. Asian Development Bank. 2013
18. Shock Waves: Managing the Impacts of Climate Change on Poverty. World bank Group 2016
19. Paul Rolle, A. (2014). Dominica Country Profile for Disaster Risk Reduction. Office of Disaster
Management Dominica; European Commission for Humanitarian Aid and Civil Protection; and the
United Nations Office for Disaster Risk Reduction
20. Nepal Earthquake 2015 Post Disaster Needs Assessment. Vol. A: Key Findings. Government of
Nepal, National planning commission, Kathmandu, 2015
21. Education Digest 2013/14. Ministry of Education and Human Resource Development-Education
Planning Unit
22. Commonwealth of Dominica Economic and Social Review for Fiscal year 2014/15
23. Third Medium-Term Growth and Social Protection Strategy -Redoubling the Effort Towards a
Sustainable Development Pathway 2012 – 2014
24. Estimates of the Commonwealth of Dominica –Budget Address for fiscal Year 2015/2016:
Keeping It Real. Ministry of Finance. July 2015
25. Estimates of the Commonwealth of Dominica –Budget Address for fiscal Year 2014/2015:
Towards Expansion of the Economy. Ministry of Finance. July 2014
26. Estimates of the Commonwealth of Dominica –Budget Address for fiscal Year 2013/2014:
Building on the Gains We have Made. Ministry of finance. July 2013
27. Draft Post Tropical Storm Erika: Gender and Child Responsive Rapid Assessment re. Damage,
Losses and Sectoral Needs. Manuscript. Undated
28. Personal Profiles of Affected Families and Individuals: Petite Savanne. Ministry of Social
Services Family and Gender Affairs-Department of Local Government and Community
Development. Manuscript. Undated
29. Personal Profiles of Affected Families and Individuals:Dubuque. Ministry of Social Services
Family and Gender Affairs-Department of Local Government and Community Development.
Manuscript. Undated
30. Initial Damage and Needs Assessment Survey Form. Ministry of Justice Immigration and
National Security-Office of Disaster Management: Manuscript. Undated
31. Socio Economic Assessment of the Impact of TSE. Ministry of Planning Economic Development
and Investment. Manuscript. Undated
32. BREA Economic Contribution Of Cruise Tourism To The Destination Economies of the Caribbean
2015

89
33. Calgaro: Emma, Dominey-Howes: Dale & Lloyd: Kate “Application of the Destination
Sustainability Framework to explore the drivers of vulnerability and resilience in Thailand following
the2004 Indian Ocean Tsunami” Journal of Sustainable Tourism May 2014
34. Compete Caribbean Dominica-Private Sector Assessment. 2014
35. Dominica Hotel and Tourism Association Post Tropical Storm Erika Requests from the DHTA.pdf"
36. Dominica Hotel and Tourism Association Three Months Post-Erika - Membership Update -
December 1, 2015.pdf"
37. Dominica Labour Party Manifesto 2014 - Labour ka Twavay.pdf"
38. Government of the Commonwealth of Dominica Commonwealth of Dominica Tourism Master Plan
2013
39. Government of the Commonwealth of Dominica National Tourism 2020 Policy - 2013
40. Government of the Commonwealth of Dominica Request for Disbursement under the Rapid Credit
Facility.
41. Government of the Commonwealth of Dominica Initial Guidelines for Legal and Entitlements
Approach in the Dominica Resettlement Programme.pdf"
42. Government of the Commonwealth of Dominica Letter to IDA re Fiscal Framework & Incentives
Regime - December 23, 2015.pdf"
43. Government of the Commonwealth of Dominica National Investment Strategy and Action Plan
2010.pdf"
44. Government of the Commonwealth of Dominica 2016_Budget_Address_Dominica_20150724
45. Patterson: Trista and Rodriguez: Luis “The Political Ecology of Tourism in the Commonwealth of
Dominica” - Tourism and Development in Tropical Islands: Political Ecology Perspectives by Stefan
Gossling (Editor) (January 2004) Publisher: Edward Elgar Pub
46. Sharpley: Richard Tourism and Vulnerability - A Case of Pessimism - Tourism Recreation
Research VOL. 37(3), 2012: 257–260
47. van Aalst: Maarten “Dominica Strategic Programme for Climate Resilience Independent
Review” - prepared for the Pilot Program for Climate Resilience (PPCR)April 2012

90
Annex 2. List of Persons Consulted
1. Ms. Rosamund Edwards , Financial Secretary, Ministry of Finance
2. Ms. Gloria Joseph, P.S., Ministry of Planning, Economic Development and Investment
3. Mr. Sammuel Carette Chief Development Planner
4. Ms Amonia Paul-Rolle, Social Development Planner
5. Mr. Anderson Parillion, Economist
6. Mr. Dwayne Dick, Central Statistics Office
7. Dr. Paul Ricketts, National Epidemiologist, Ministry of Health and Environment
8. Ms. Marva Smith Health Statistics Officer
9. Marcella Powell - PS Ministry of Health
10. Augustine Popo -Ministry of Health
11. Mr. Harold Guiste, PS Ministry of Agriculture and Fisheries
12. Mr. Matthew Le Blanc - Commissioner of Labour
13. Ms. Yvanette Baron-George - PS Housing
14. Hillman Jules - Manager, Housing Division
15. Ms. Esther M. Thomas PS, Ministry of Commerce, Enterprise and Small Business
Development
16. Ms. Careen Prevost, PS. Ministry of Trade, Energy and Employment
17. Ms. Portia Nicholas, Business Development Officer,
18. Mr Don Corriette, Disaster Corrdinator
19. Ms. Kyra Paul Director (Ag.) Bureau of Gender Affairs
20. Ms. Melena Fontaine, Chief Education Officer(Ag.) Ministry of Education
21. Mr. Weeferly Jules, Senior Planning Officer (Ag.)Ministry of Education
22. Mr. Nazarine William-Litre – Senior Education Officer (Ag.)
23. Mr. Jeffery Blaize, Assistant Chief Education Officer, Ministry of Education
24. Mr. Robert R. Guiste – Senior Education Officer, Curriculum and Measurement
25. Ms. Jemma Auille-Lewis, Coordinator, Child Abuse Prevention, Ministry of Social
Services family and Gender Affairs
26. Ms Nicole Toussaint Welfare Officer, Child Abuse Prevention
27. Leroy Morvan, chief Welfare Officer, Social Welfare Division
28. Mr. John Fontaine, Local Government Commissioner, DepaRTMENT OF Local
Government and Community Development
29. Oliver Wallace, Assistant Chief Welfare Officer (Ag), social Welfare Division
30. Selected groups of internally displaced persons
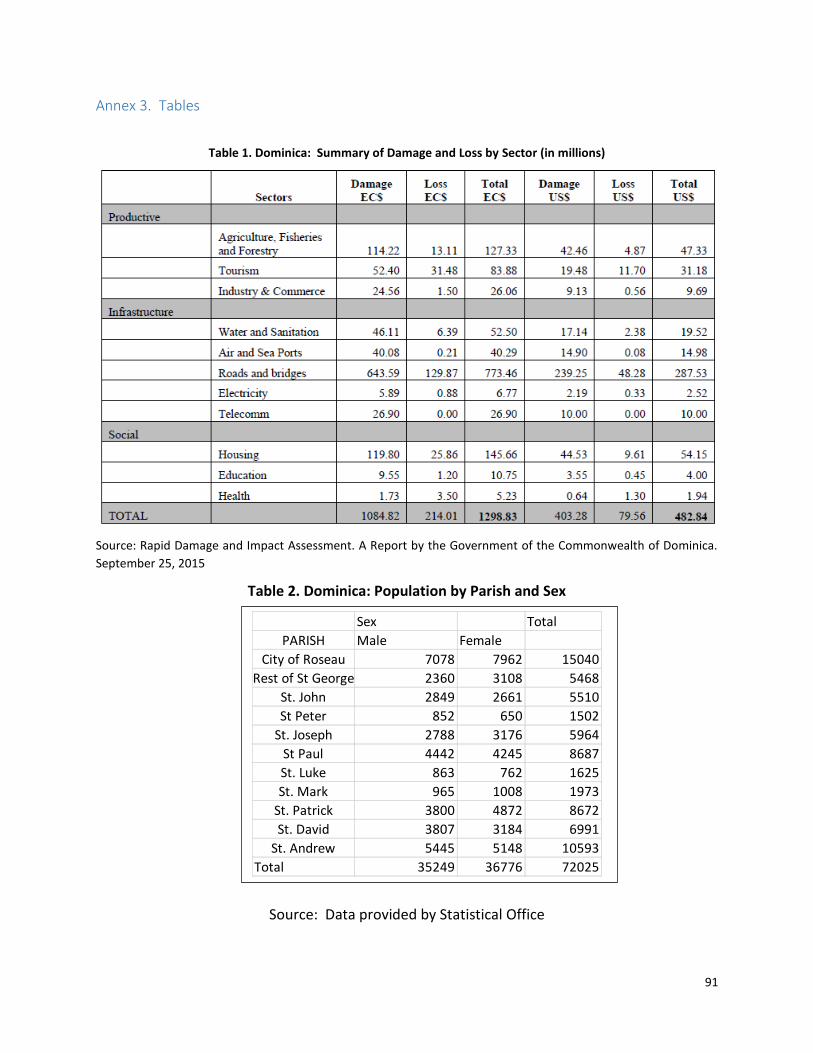
91
Annex 3. Tables
Table 1. Dominica: Summary of Damage and Loss by Sector (in millions)
Source: Rapid Damage and Impact Assessment. A Report by the Government of the Commonwealth of Dominica.
September 25, 2015
Table 2. Dominica: Population by Parish and Sex
Source: Data provided by Statistical Office
Sex Total
PARISH Male Female
City of Roseau 7078 7962 15040
Rest of St George 2360 3108 5468
St. John 2849 2661 5510
St Peter 852 650 1502
St. Joseph 2788 3176 5964
St Paul 4442 4245 8687
St. Luke 863 762 1625
St. Mark 965 1008 1973
St. Patrick 3800 4872 8672
St. David 3807 3184 6991
St. Andrew 5445 5148 10593
Total 35249 36776 72025
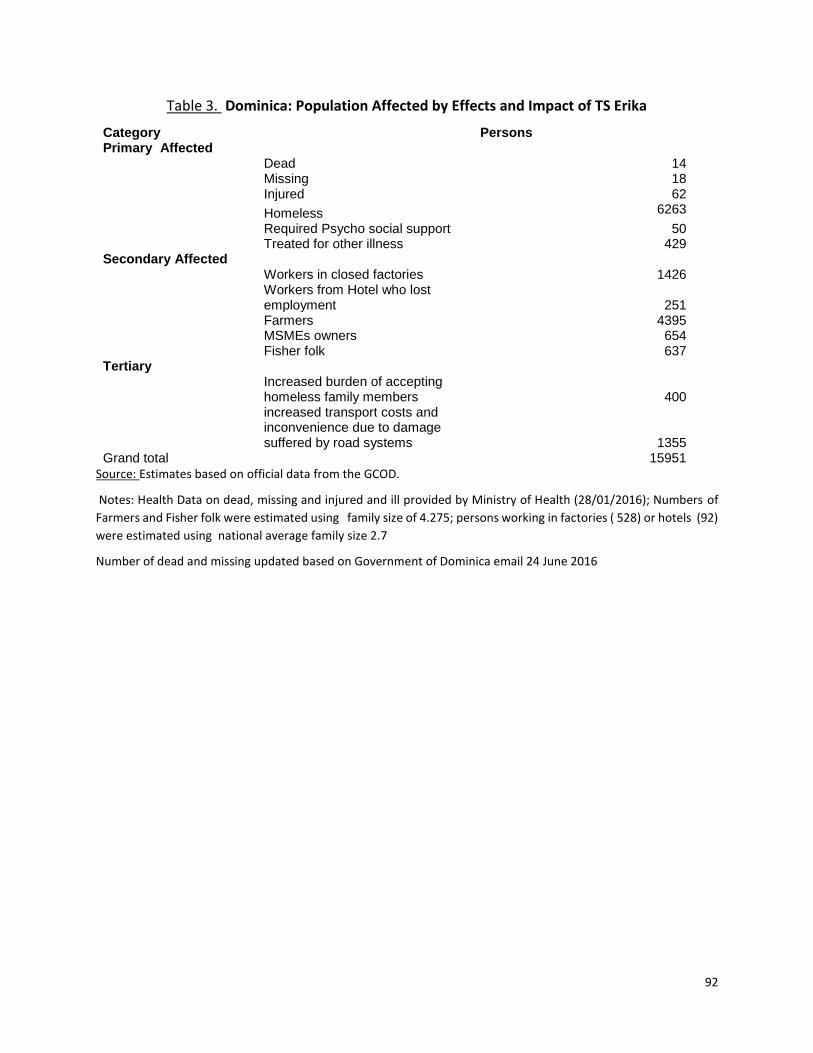
92
Table 3. Dominica: Population Affected by Effects and Impact of TS Erika
Category Persons Primary Affected Dead 14
Missing 18
Injured 62
Homeless 6263
Required Psycho social support 50
Treated for other illness 429 Secondary Affected Workers in closed factories 1426
Workers from Hotel who lost employment 251
Farmers 4395
MSMEs owners 654
Fisher folk 637 Tertiary
Increased burden of accepting homeless family members 400
increased transport costs and inconvenience due to damage suffered by road systems 1355
Grand total 15951
Source: Estimates based on official data from the GCOD.
Notes: Health Data on dead, missing and injured and ill provided by Ministry of Health (28/01/2016); Numbers of
Farmers and Fisher folk were estimated using family size of 4.275; persons working in factories ( 528) or hotels (92)
were estimated using national average family size 2.7
Number of dead and missing updated based on Government of Dominica email 24 June 2016

93
Table 4. Heads of Household in Selected Affected Parishes and Communities by Sex
Heads of households
Male Female Total
Parish Affected community St. George
Bath Estate/Paradise 109 56 165
Pichelin 315 277 592
St. Patrick
Fond St. Jean 76 31 107
Bagatelle/Point Carib 89 47 136
Boetica 37 11 48
Petite Savanne 148 65 213
Dubique 27 20 47
St. David
San Sauveur 24 13 37
Good Hope 159 71 230
Grandfond 116 71 187
Petit Soufrrierre 104 51 155
St. Paul
Campbell 142 58 200
St. Peter
Colihaut 228 157 385
St. Joseph
Coulibistrie 101 50 151 Source: Estimates based on official CGOD data
Table 5. Dominica: Mean Adult Equivalent Household Size and Minimum Cost Consumption Estimates, (EC$), 2009 Mean Adult Equivalent Household size
Indigence Line Per month per Adult
Poverty Line Per Month Per Adult
Minimum Required Per Month For an Average Household Size
Annual Poverty Line per Adult
Minimum Annual Required for an Average Household to be above poverty line
2.3 EC$203 EC$519 EC$1,194 EC$6,230 EC$14,329

94
Table 6 Poverty Status of Population
Category Households % Population %
Indigent / Very poor 11% 15%
Poor 18% 24%
ALL POOR 29% 39%
Vulnerable but not poor (percentage of individuals below the Vulnerability line but not poor)
12%
NON POOR (Including Vulnerable) 71% 61%
Source: The Social Investment Fund and the CPA 2010
Table 7: Dominica: Indigence, Poverty and Vulnerability Lines, 2009
Indigence line ( Annual in EC$) 2,435
Poverty line ( Annual in EC $) 6,230 Vulnerability Line ( Annual in EC$) 7,788
Source: Dominica CPA 2010

95
Table 8: Indicators of Poverty and Vulnerability to Food Insecurity – Dominica CPA (2009)
Parish Headcount
(%)
Poverty
Gap
(%)
Poverty
Severity
(%)
Population Pop.
Vulnerable to
Food
Insecurity55
(Within Parish)
Pop.
Vulnerable
to Food
Insecurity
(% Across
Parish) No. %
City of Roseau 12.78 2.67 0.97 15,040 3,652 24.3 12.6
Rest of St. George 16.32 4.33 1.90 5,468 1,521 27.8 5.2
St. John 10.23 1.55 0.33 5,511 1,198 21.7 4.1
St. Peter 23.71 5.87 1.88 1,502 529 35.2 1.8
St. Joseph 47.15 15.47 6.59 5,964 3,498 58.7 12.1
St. Paul 32.58 10.86 4.99 8,686 3,829 44.1 13.2
St. Luke 17.50 7.50 3.69 1,625 471 29.0 1.6
St. Mark 27.34 5.37 2.14 1,973 766 38.8 2.6
St. Patrick 42.70 12.99 6.22 8,672 4,700 54.2 16.2
St. David 40.38 11.45 5.07 6,991 3,627 51.9 12.5
St. Andrew 38.08 14.98 7.25 10,593 5,252 49.6 18.1
Total 28.82 8.91 4.01 72,025 29,043 40.3 100.0
Source: Dominica CPA (2008/09).
55 Estimated by taking the product of the headcount poverty and the respective parish population then increasing the result by 11.5% (the percentage of vulnerable population).

96
Table 9: Livelihoods that are the Most Vulnerable to Food Insecurity, Location and & How Many
Parish Vulnerable
Livelihoods1
Location of
Livelihoods1
District
Population2
Persons
Who are
Vulnerable
to Food
Insecurity2
City of
Roseau
Farmers
Fisher folks
Working poor Roseau
Newtown
Pottersville
15,040 3,652
Rest of St.
George
Fisher Folk
Farmers
Working poor
Roseau Valley
Fond Cole
5,468 1,521
St. John Fisher Folk
Farmers
Working poor
Portsmouth
Tanetane
Toucari
Capucin
Clifton
5,511 1,198
St. Peter Farmers
Fisher Folk
Working poor
Bioche
Calihaut
Dublanc
1,502 529
St. Joseph Farmers
Fisher Folk
Working poor
Batali
Coulibistri
Salisbury
Layou
Mero
St. Joseph
5,964 3,498
St. Paul Farmers
Fisher Folks
Working poor
Campbell
Cochrane
Canefield
Jimmit
Mahaut
Massacre
Tarou
8,686 3,829
St. Luke Fisher Folks
Farmers Pointe Michel
1,625 471
St. Mark Fisher Folks
Farmers Soufriere
Scotts Head
1,973 766
St. Patrick Fisher Folks
Farmers
Working poor
Bellevue Chopin
Delices
Pichelin
Grand Bay
Fond St. Jean
Stowe
Geneva
8,672 4,700
St. David Farmers
Fisher Folks
Working poor
Castle Bruce
Petite Soufriere
Good Hope
San Sauveur
Salybia
Sineku
6,991 3,627
St. Andrew Farmers
Fisher Folks
Working poor
Anse Du Me
Calibishie
Marigot
Woodford Hill
Wesley
10,593 5,252
Total 72,025 29,043
Notes: These estimates were derived from data in Dominica Country Poverty Assessment (2008/09), the Dominica Agricultural Census (1995), the Dominica Fisheries Industry Census (2011), meetings conducted and sites visited.

97
Table 10: Fish Categories and Vendor Prices
Fishery
Fish Label
Price per Pound (EC $)
Average Minimum Maximum
Coastal
Pelagics
Ballyhoo 1.83 1.00 6.00
Jacks 6.45 4.00 10.00
Mackerel scad 5.86 3.00 8.00
Round sardinella 2.58 1.00 7.00
Sardine 1.00 1.00 1.00
Demersals
Coney 6.38 5.00 7.00
Doctor fish 7.00 6.00 8.00
Grouper 7.72 5.00 15.00
Grunts 7.00 7.00 7.00
Lobster 14.02 3.00 30.00
Parrot fish 6.78 4.00 10.00
Red Hind 6.67 6.00 7.00
Snapper 7.75 5.00 15.00
Squirrel fish 6.50 5.00 7.00
Trigger fish 2.50 2.50 2.50
Yellow goatfish 6.96 3.00 10.00
Black tuna fish 6.17 4.00 9.00
Blue marlin 5.70 4.00 8.00
Dolphin fish 7.13 5.00 10.00
Offshore
Pelagics
Flying fish 3.37 1.00 8.00
King fish 8.00 8.00 8.00
Rainbow fish 7.00 6.00 8.00
Tuna 6.00 6.00 6.00
Whoo 6.96 4.00 10.00
Yellow fin tuna 6.41 5.00 9.00
Grand Total 6.78 1.00 30.00 Source: The 2011 Dominica Fisheries Industry Census

98
Table 11: Fishers by Age and Gender AGE (YEARS) FEMALE MALE TOTAL %
More than 80 - 6 6 0.8
71-80 - 40 40 5.4
61-70 5 91 96 13.0
51-60 7 143 150 20.3
41-50 6 185 191 25.8
31-40 4 131 135 18.2
20-30 6 93 99 13.4
Under 20 - 23 23 3.1
Total 28 712 740
% 3.8 96.2 100.0
Source: The 2011 Dominica Fisheries Industry Census
Table 12: Fishers Age and Marital Status AGE (Years) Marital Status TOTAL
Single Married Widow(er) Divorced Separated
< 20 23 - - - - 23
20-30 92 7 - - - 99
31-40 118 13 2 1 1 135
41-50 138 45 2 5 - 190
51-60 80 59 4 5 1 149
61-70 35 43 7 4 7 96
71-80 11 21 5 3 - 40
>80 2 3 1 - - 6
Total 499 191 21 18 9 738
% 67.6 25.9 2.9 2.4 1.2 100.0
Source: The 2011 Dominica Fisheries Industry Census

99
Table 13: Fishers Age and Educational Level
AGE
(Years)
Educational Level
TOTAL
% None Primary Secondary/
High
College University
< 20 - 3 20 - - 23 3.1
20-30 - 22 60 15 - 97 13.3
31-40 - 88 38 6 3 135 18.4
41-50 - 166 21 2 - 189 25.8
51-60 2 134 8 2 - 146 19.9
61-70 3 88 4 1 - 96 13.1
71-80 2 37 1 - - 40 5.5
>80 2 4 - - - 6 0.8
Total 9 542 152 26 - 732
% 1.2 74.0 20.8 3.6 0.4 100.0
Source: The 2011 Dominica Fisheries Industry Census
Table 14: Fishers Reasons for Fishing Reasons For Fishing %
Always wanted to be a fisher 65
There is a history of fishers in family 53
There was no other job available at the time 14
Not qualified for another job 8
Other 6
Financial support 5
Source: The 2011 Dominica Fisheries Industry Census

100
Table 15: Multiple Roles of Persons in the Industry Role Boat
Builder/
Repairer
Boat
Owner
Equipment
Supplier
Fisher Gear
Builder/
Repairer
Outboard
Engine
Mechanic
Retired
Fisher
Vendor
Boat
Builder/
Repairer
3
51
2
66
35
10
0
41
Boat Owner
51
0
2
351
61
16
2
221
Equipment
Supplier
2
2
4
2
1
3
0
2
Fisher 66 351 2 223 82 20 0 342
Gear
Builder/
Repairer
35
61
1
82
0
13
1
50
Outboard
Engine
Mechanic
10
16
3
20
13
3
0
15
Retired
Fisher
0
2
0
0
1
0
13
0
Vendor 41 221 2 342 15 0 22
Total 73 351 8 718 86 25 16 365
Source: The 2011 Dominica Fisheries Industry Census

101
Table 16: Distribution of Fishers by Landing Sites NORTH WEST SOUTH WEST SOUTH EAST
Landing
Site
Number
of Fishers
Landing
Site
Number
of
Fishers
Landing
Site
Number
of
Fishers
Landing
Site
Number
of
Fishers
Batali 8 Canefield 2 Fond St.
Jean
41 Anse Du
Me
41
Bioche 45 Fond Cole 18 Scotts
Head
45
Calibishie 24
Capucin 17 Jimmit 3 Soufriere 8 Castle
Bruce
1
Clifton 10 Layou 33 Stowe 15 Marigot 80
Colihaut 28 Mahaut 38 Petite
Soufriere
1
Coulibistri 4 Massacre 11 Saint
Sauveur
37
Dublanc 40 Mero 6 Salybia 1
Portsmouth 53 New Town 12 Sineku 3
Salisbury 17 Pointe
Michel
1
Wesley 2
Tanetane 14 Potterville 11 Woodford
Hill
3
Toucari 21 St. Joseph 32
Tarou 2
Total 257 169 109 193
Source: The 2011 Dominica Fisheries Industry Census
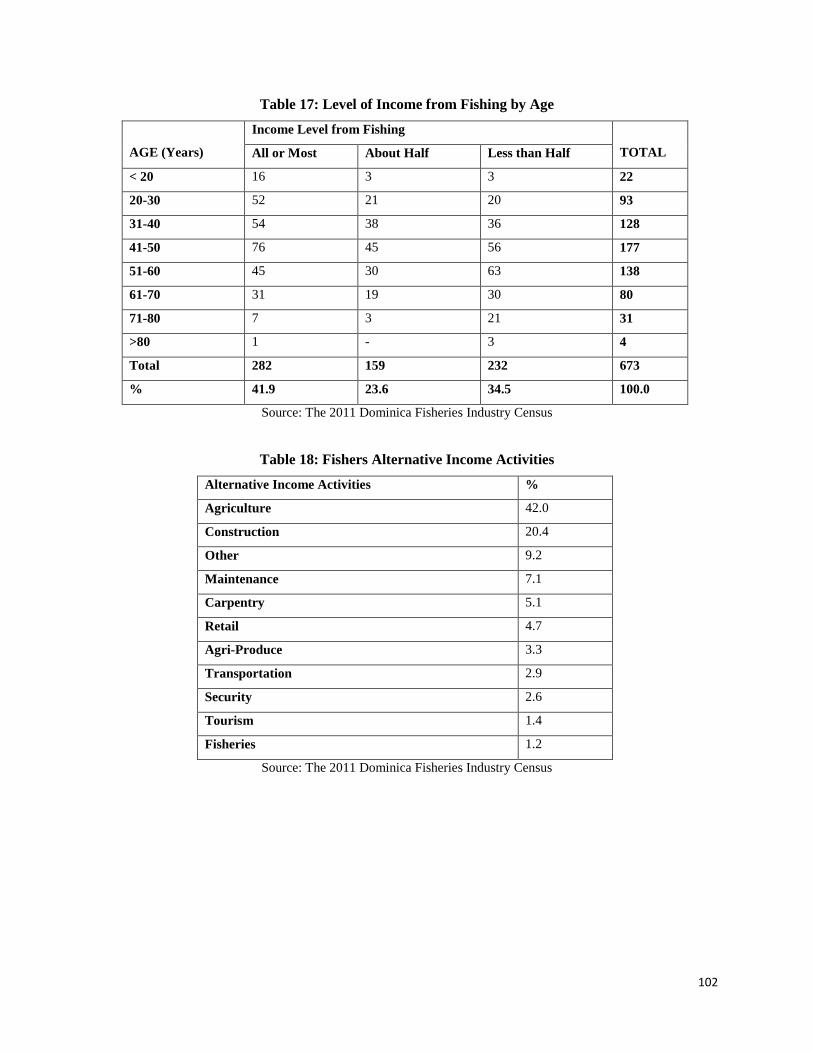
102
Table 17: Level of Income from Fishing by Age
AGE (Years)
Income Level from Fishing
TOTAL All or Most About Half Less than Half
< 20 16 3 3 22
20-30 52 21 20 93
31-40 54 38 36 128
41-50 76 45 56 177
51-60 45 30 63 138
61-70 31 19 30 80
71-80 7 3 21 31
>80 1 - 3 4
Total 282 159 232 673
% 41.9 23.6 34.5 100.0
Source: The 2011 Dominica Fisheries Industry Census
Table 18: Fishers Alternative Income Activities
Alternative Income Activities %
Agriculture 42.0
Construction 20.4
Other 9.2
Maintenance 7.1
Carpentry 5.1
Retail 4.7
Agri-Produce 3.3
Transportation 2.9
Security 2.6
Tourism 1.4
Fisheries 1.2
Source: The 2011 Dominica Fisheries Industry Census

103
Table 19: Summary of Damage and Losses to Agriculture
Description EC$
Damage
Destruction of agricultural lands $29,000,000
Damages Irrigation and drainage systems $1,900,000
Agricultural machinery and equipment $4,200,769
Damage to storage and farm related buildings $3,047,000
Plantation and production facilities damaged or
destroyed
$13,034,736
Livestock killed $851,000
Damage to road infrastructure $57,650,000
Total Damage $109,722,705
Losses (Aggregated losses)
Loses due to production changes $13,034,736
Losses due to increased production costs $74,637
Total Losses $13,109,373
Total Damage and Losses $122,832,078 Source: Division of Agriculture Report on Damage to the Agriculture Sector by Tropical Storm Erika
(September 9, 2015)

104
Table 20: Summary of Damage to the Fisheries Sector
Description EC$
Fishing pots 101,400
Engines 1,132,700
Boats 4,200,769
Fishing Tackle 44,806
Nets 39,000
Navigation & Safety 3,475
Containers/Coolers 24,180
Sheds 15,000
Fish attraction devices (FAD) 3,000
Misc Damages 96.763
Total Damage 2,949,324 Source: Division of Agriculture Report on Damage to the Agriculture Sector by Tropical Storm Erika
(September 9, 2015)
Table 21: Total damage to Forestry Sector
Description EC$
Lost land (30Ha) 600,000
Damage to forest roads 150,000
Reforestation of lost forest cover 56,960
Park infrastructure, trails and visitor facilities 740,000
Total Damage 1,546,960 Source: Division of Agriculture Report on Damage to the Agriculture Sector by Tropical Storm Erika
(September 9, 2015)
Table 22: Impact on Farmers crops and Livestock
Crops Acreage Number of
Farmers
Livestock Number of
Animals
Number of of
Farmers
Roots & Tubers 89.7 257 Cattle 112 14
Sugar Cane 53.0 1 Small Ruminants 137 27
Citrus 10.6 5 Pigs 42 6
Vegetables 6.5 13 Poultry (layers) 3,600 6
Plantains 37.0 98 Poultry (Broilers) 2,500 35
Bananas 23.5 46 Poultry (Chicks) 1,100 2
Tissue culture 220.3 11 Rabbits 30 4
Bay Leaf 400.0 447 Bee Hives 86 11
Passion fruits 17.0 13
Pineapple 4.5 12
Cocoa 22.0 11
Ginger 5.0 23

105
Seasoning Pepper 1.0 2
Pumpkins 2.2 6
Arrow Root 6.5 11
Total 898.8 956 7,521 105
Grand Total 1,061
Source: Division of Agriculture Report on Damage to the Agriculture Sector by Tropical Storm Erika
(September 9, 2015)
Table 23: Impact on Plant facilities and Infrastructure
Type of Infrastructure Type and damage Location No. of
Farmers
affected
Bay Oil Distillery (Equipment and Plant)
Washed away Pt Savanne 447
Other distillery Components Washed away Pt Savanne
Small Distillery Landslide Boetica 35
Distillery Equipment Washed away Delices 40
Virgin Oil Equipment Processed oil
Washed away Pichelin Coulibistrie
50
Rum Factory Flooding, equipment Machoucherie
Vauxhall Bridge Washed away Marigot 72
Other Bridges and river crossings Washed away, broken etc. Selected roads 47
Feeder Roads Slide clearing All locations 2,400 Surface damage,
undermining, Breakage All locations
Castle Bruce Irrigation Intake damage, 100 ft. lines washed away
Castle Bruce 39
Milton Irrigation system Lines along the river washed and intake damage
Milton 62
Total 3,479
Less Bay leaf producers 447
Grand Total 3,032 Source: Division of Agriculture Report on Damage to the Agriculture Sector by Tropical Storm Erika
(September 9, 2015)

106
Table 24: Impact on Farm Housing, Machinery and Equipment and Stock Type of Infrastructure Type and damage Location No. of Farmers
affected
Livestock Housing Flooded, slides,
undermined
foundation, Roseau
Valley
Geneva
North Region 16
Water Pumps Washed away Belles, Clarke Hall
Londonderry 8
Water Tanks Washed away,
damaged
Marigot, Belles, Clarkhall 7
Irrigation Lines Lost by run-off At specific farms 17
Greenhouses Twisted frames
through slides
All locations 14
Sheds Slides, flooded Southeast, South, Northeast,
Central and West 17
Fertilizers Flooded Northeast, Central and West 43
Livestock Feed Flooded Southeast, South, Northeast,
Central and West 6
Farm Vehicles Washing away West Region- Coulibistrie 6
Total 134
Source: Division of Agriculture Report on Damage to the Agriculture Sector by Tropical Storm Erika
(September 9, 2015)
Table 25: Summary of Erika on Food and Agriculture Livelihoods
Description Number of Farmers /
Fisher folks
Estimated Household
Members56
Impact on Farmers crops 956 2,992
Impact on Farmers Livestock 105 329
Less Combined Operations (Crops and
Livestock)
(33)
(103)
Total Crop/Livestock 1,028 3,218
Impact on Farm Assets 134 419
Impact on Inter-sectoral Assets (plants,
feeder roads, etc)
3,032
9,490
Impact on Fisheries 149 466
Grand Total 4,343 13,593
56 Average Farmer/Fisher Household Size is 3.13.

107
Table 26. The composite vulnerability index and other indices ordered according to vulnerability score for 111 developing countries ( States ranked 1-24 are presented)
Real Output Volatility Index
Composite Vulnerability Index
Population
per capita Rank Rank Rank
GDP
Vanuatu 161 2,500 53 3.61 90 13.295 1
Antigua and Barbuda
65 5,369 86 13.38 3 11.246 2
Tonga 93 3,740 73 13.18 4 10.439 3
Bahamas 268 16,180 110 7.37 25 10.433 4
Botswana 1,401 5,220 85 10.21 12 10.158 5
Swaziland 809 2,940 58 11.17 10 9.633 6
Gambia 1,042 1,190 27 7.67 22 9.331 7
Fiji 758 5,530 89 6.84 32 8.888 8
Maldives 236 2,200 47 2.97 97 8.654 9
Singapore 2,821 19,350 111 3.35 94 8.651 10
Solomon Islands
354 2,266 49 11.21 9 8.398 11
Dominica 71 3,810 76 6.12 41 8.122 12
Guyana 816 2,140 45 11.87 5 7.953 13
Djibouti 557 775 14 11.6 6 7.932 14
Grenada 92 3,118 61 6.89 31 7.848 15
Bahrain 535 15,500 109 5.22 61 7.748 16
Sao Tome 127 600 4 4.23 79 7.69 17
Jamaica 2,411 3,180 63 3.43 91 7.484 18
St Lucia 139 3,795 74 6.59 35 7.449 19
Samoa 167 3,000 59 6.92 30 7.371 20
Equatorial Guinea
379 1,800 39 11.26 8 7.029 21
Malta 361 11,570 106 2.36 107 6.857 22
Belize 204 4,610 82 9.63 15 6.652 23
St Vincent 11 3,552 69 6.08 43 6.563 24
Source: Table 2 Small states: a composite vulnerability index.
ctrc.sice.oas.org/geograph/caribbean/Vul_index.doc

108
Table 27 Admissions by type and Health District
Heath District
Gastro Enteritis
Acute Respiratory
Infection
Undifferenti-ated Fevers
Injury TOTAL
Roseau 113 48 26 3 190
Portsmouth 79 5 3 5 92
Grand Bay 28 8 6 15 57
St. Joseph 35 3 2 36 76
Marigot 43 0 3 0 46
La Plaine 6 3 1 1 11
Castle Bruce 12 4 1 2 19
TOTAL 316 71 42 62 491
Source: Estimates based on the Official GCOD data
Table 28 . Type of Injury by number of reported incidents
Type of injury Frequency Percent
Laceration 24 38.71%
Multiple abrasions 14 22.58%
Fracture 6 9.68%
Punctured wound 6 9.68%
Ankle sprain 1 1.61%
Non-specified injuries
11 17.74%
TOTAL 62 100.00%
Source: Ministry of Health

109
Table 29 . Selected Medium, Small and Micro Enterprises affected by TS Erika
by Affected communities and area of economic activity
Source: CSO
Total Bagatelle Colihaut Coulibistrie
Good
Hope
Paradise Valley,
Bath Estate
Petite
Savanne
Petite
Soufriere
Petite
Soufriere/Fond
Cole
San
Sauveur
Savanne
Park Total
2 0 0 0 1 0 0 0 0 0 0 3
Agriculture 0 0 0 0 13 0 0 0 0 1 0 14
Agro-
processing
0 1 0 6 1 0 0 0 0 0 0 12
Agro-
Processing
0 0 1 0 0 0 0 0 0 0 0 1
Entertainme
nt
0 0 0 0 0 0 0 1 0 0 0 1
Farming 0 0 0 5 0 0 0 1 0 0 0 6
Fishing 0 0 0 9 0 0 0 0 0 0 0 11
Horticulture 0 0 0 0 0 0 0 0 1 0 0 1
Manufacturi
ng
0 0 0 3 0 2 1 0 0 0 2 9
Retail 0 0 6 12 4 2 0 0 0 0 0 38
Retail/Servic
es
0 0 0 0 0 0 2 0 0 0 0 2
Sector 0 0 0 0 0 0 0 0 0 0 0 9
Services 0 0 4 15 1 0 4 1 0 0 1 32
Tourism 0 0 0 0 0 0 0 0 0 0 0 1
2 1 11 50 20 4 7 3 1 1 3 140

110
TOURISM
Sector Estimated Impact
Table 1. Damage and Loss to the Tourism Sector
Accommodation $40,350,000
Dive Operators 2,413,575
Tour Operators 971,248
Vehicle Rentals 745,000
Food & Beverage Establishments 10,000
Sites & Attractions 4,557,650
Loss of Business (est.) $2,000,000
Other Losses $31,490,000.0057
EC$83,891,200
PARISH PROPERTY DAMAGES AMOUNT
St Georges
Anchorage Hotel
1.Loss of to one boat , along with life vests and other seaworthy materials – EC$790,000
2. At least 10 rooms and flooding occurred in main lobby areas. EC$110,000
Castle Comfort Lodge & Dive Dominica Flooding from rains and river runoff. EC$15,000
Evergreen Hotel, Castle Comfort (Estimated by DDA) Flooding from rains and river runoff. EC$45,000
Fort Young Hotel, Roseau 1. Extensive damage to their dive boat.
EC$2,000,000 2. Damage to the jetty and boardwalk
St Patrick Jungle Bay Completely destroyed 27,000,000.00
St David Rosalie Bay
1. Extensive damage to grounds.
EC$4,000,000
2. A 150ft riverside wall destroyed.
3. A 30ft portion of a front wall destroyed.
4. Damage to multiple appliances.
5. Undermining of spa room
St Mark Hide Out Cottage
1. Clearance of debris and damage to landscaped property
EC$23,900 2. Assorted infrastructural damages
3. Solar energy equipment damaged.
4. Potable water infrastructure damage.
57 The Rapid Assessment included a loss estimate of EC$31,490,000.00 which were based on the projected variance
in visitor expenditure over parallel periods after allowing for a (2%) nominal annual increase and a projected 8%
decline due to TS Erika. It is assumed that loss of airlift from LIAT’s reduced schedule inclusive of night landings at
Douglas Charles airport, cancellation of the World Creole Music Festival etc. are included in this figure.

111
5. Approximately 30 ft of land was washed away by the river.
Table 2. Distribution of Damage and Loss in the Tourism Sector by Parish

112

113
Agricultural Tables
Table A1: Growth Rate of Agriculture and Total Gross Domestic Product (GDP)
Constant Prices (2006) Description YEAR
2006 2007 2008 2009 2010 2011 2012 2013 2014 2015 2016 2017
Crops, Livestock, Forestry
0.55
(9.19) 14.99 1.65
(7.92) 7.15 8.65
4.85
(1.36)
(20.58)
2.14
2.11
Crops
(0.31)
(11.65) 18.85 1.90
(9.06) 8.76 9.48
4.82
(1.03)
(21.21)
2.12
2.18
Bananas
1.15
(54.74) 66.87
(12.49)
(8.98) 26.07
(16.63)
(13.43)
(21.07)
(23.94)
(10.00
)
5.00
Other Crops
(0.66)
(1.18) 13.50 4.26
(9.07) 6.38 13.74
7.01
0.91
(21.00)
3.00
2.00
Livestock
6.50 13.31
(7.55)
(0.41) 0.68
(5.04) 2.98
6.44
(5.49)
(20.00)
3.00
2.00
Forestry
8.75
(6.77)
(5.96) 0.47 0.59 0.44 0.11
0.61
0.78
0.46
0.46
0.46
Fishing 23.90 25.83
(14.90) 3.88
(17.51) 11.78
(14.61)
(4.92)
38.73
(10.00)
4.00
2.00
Total Agriculture 1.24 (7.92) 13.49 2.6 (8.29) 7.30 7.82 4.58 (0.33) (20.19) 2.2 2.1
Total GDP 3.75 4.38 6.92
(0.82) 0.74 1.03
(1.08)
1.70
3.42
(3.46)
5.68
2.90
Source: Central Statistical Office, Dominic and the Eastern Caribbean Central Bank (ECCB)
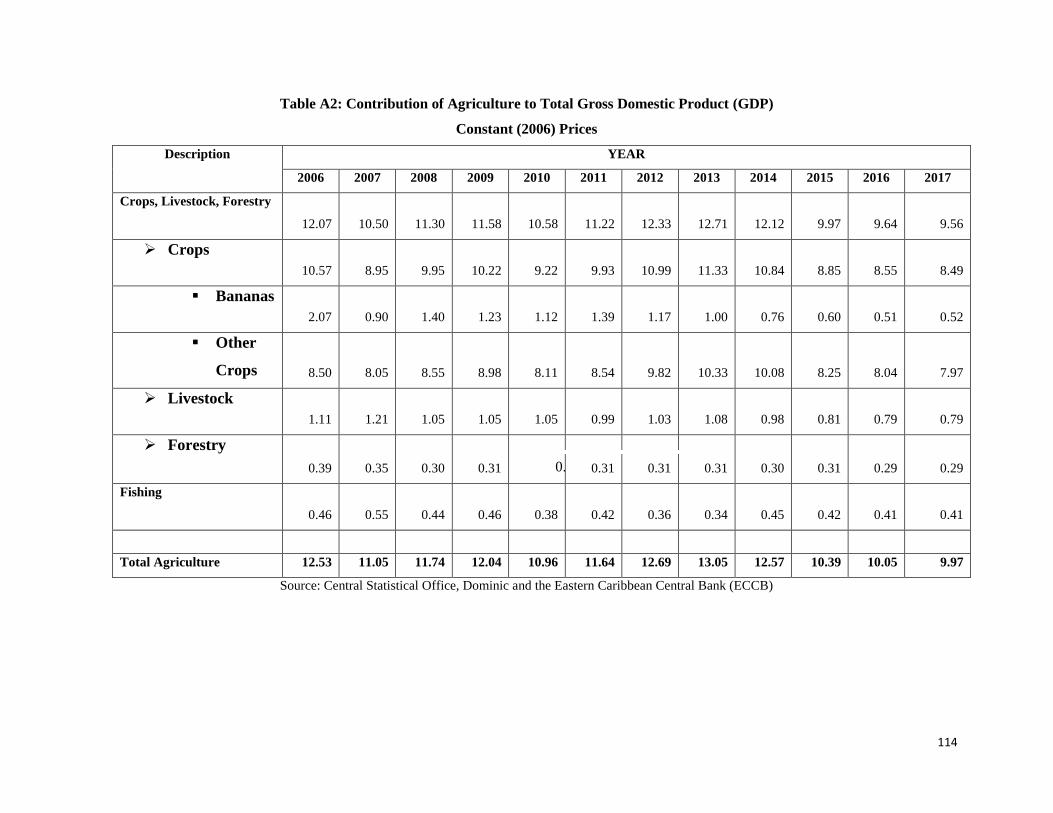
114
Table A2: Contribution of Agriculture to Total Gross Domestic Product (GDP)
Constant (2006) Prices
Description YEAR
2006 2007 2008 2009 2010 2011 2012 2013 2014 2015 2016 2017
Crops, Livestock, Forestry
12.07
10.50
11.30
11.58
10.58
11.22
12.33
12.71
12.12
9.97
9.64
9.56
Crops
10.57
8.95
9.95
10.22
9.22
9.93
10.99
11.33
10.84
8.85
8.55
8.49
Bananas
2.07
0.90
1.40
1.23
1.12
1.39
1.17
1.00
0.76
0.60
0.51
0.52
Other
Crops
8.50
8.05
8.55
8.98
8.11
8.54
9.82
10.33
10.08
8.25
8.04
7.97
Livestock
1.11
1.21
1.05
1.05
1.05
0.99
1.03
1.08
0.98
0.81
0.79
0.79
Forestry
0.39
0.35
0.30
0.31
0.31
0.31
0.31
0.31
0.30
0.31
0.29
0.29
Fishing
0.46
0.55
0.44
0.46
0.38
0.42
0.36
0.34
0.45
0.42
0.41
0.41
Total Agriculture 12.53 11.05 11.74 12.04 10.96 11.64 12.69 13.05 12.57 10.39 10.05 9.97
Source: Central Statistical Office, Dominic and the Eastern Caribbean Central Bank (ECCB)
Nominal GVA Growth Rate

115
Table A3 : Distribution of Agriculture Gross Domestic Product(GDP)
Constant (2006) Prices
Description YEAR
2006 2007 2008 2009 2010 2011 2012 2013 2014 2015 2016 2017
Crops, Livestock, Forestry
106.61 96.81 111.32 113.16 104.20 111.65 121.31
127.20
125.46
99.65
101.78
103.93
Crops
93.35 82.47 98.02 99.88 90.83 98.79 108.16
113.37
112.21
88.41
90.28
92.25
Bananas
18.26 8.27 13.79 12.07 10.99 13.85 11.55
10.00
7.89
6.00
5.40
5.67
Other Crops
75.09 74.21 84.23 87.81 79.85 84.94 96.61
103.38
104.32
82.41
84.88
86.58
Livestock
9.84 11.15 10.31 10.27 10.34 9.82 10.11
10.76
10.17
8.14
8.38
8.55
Forestry
3.42 3.18 2.99 3.01 3.03 3.04 3.04
3.06
3.09
3.10
3.11
3.13
Fishing 4.04 5.08 4.32 4.49 3.70 4.14 3.53 3.36 4.66 4.20 4.36 4.45
Total Agriculture 110.65 101.89 115.64 117.65 107.90 115.79 124.84 130.56 130.12 103.85 106.14 108.38
Source: Central Statistical Office, Dominic and the Eastern Caribbean Central Bank (ECCB)

116
Table A4: Educational Level of Farmers
Educational Level %
No Schooling 2.0
Primary School 84.9
Secondary School 9.3
College/University 3.8
Total 100.0
Source: Dominica Agricultural Census, 1995.
Table A5: Number and Land Under Farms
Farm Size (Acres) Number of Farms Land Under Farms (000 Acres)
1961 1995 1961 1995
Landless 442 824 0 0
0.01 – 4.9 6405 6696 10.1 13.7
5.0 – 49.9 2087 2448 20.3 24.1
50.0 – 99.9 78 61 5.1 4.0
100 and over 97 71 40.8 16.2
Total 9109 10100 76.3 58.0
Source: Dominica Agricultural Census, 1995.

117
Table A6: Land Use in 1961 and 1995 Agricultural Censuses
Source: Dominica
Agricultural Census,
1995.
Table A7:
Land Tenure in 1961 and 1995 Agricultural Censuses
Land Tenure
1961 1995
Acres (000) % Acres (000) %
Owned 72.8 95.5 37.8 65.1
Family Land 6.3 10.9
Rented 2.2 4.2 3.2 5.6
Squatted 1.0 1.7
Communal land 3.2 5.6
Other Tenures 0.2 0.3 0.8 1.3
Not Stated 5.7 9.8
Total 76.2 100.0 58.0 100.0
Source: Dominica Agricultural Census, 1995.
Census Year
Total Acreage Under
Farms (000)
Actual Land Use
Cultivated Forest Other
Acres % Acres % Acres %
1961 76.2 33.7 44.2 37.1 48.7 5.4 10.0
1995 58.0 35.8 61.7 16.4 28.3 5.8 7.1

118
Table A8: Comparison of Main Livestock in 1961 and 1995 Agricultural Censuses
Livestock
1961 1995 Ration
1995/1961 Number (000) Average Number (000) Average
Cattle 3.1 2.4 3.9 3.4 1.258
Goats 4.6 3.0 13.4 5.5 2.913
Sheep 2.5 2.4 4.1 4.6 1.640
Pigs 7.0 2.0 5.1 4.2 0.729
Chicken 43.4 9.5 74.2 24.0 1.710
Source: Dominica Agricultural Census, 1995.
Table A9: Composition of Farm holders in Dominica
Number of Individual Female Holders 1,937 19.2%
Number of Individual Male Holders 8,163 80.8%
Median Age of Individual Female Holders 52 years old
Median Age of Individual Male Holders 46 years old
Source: Dominica Agricultural Census, 1995.
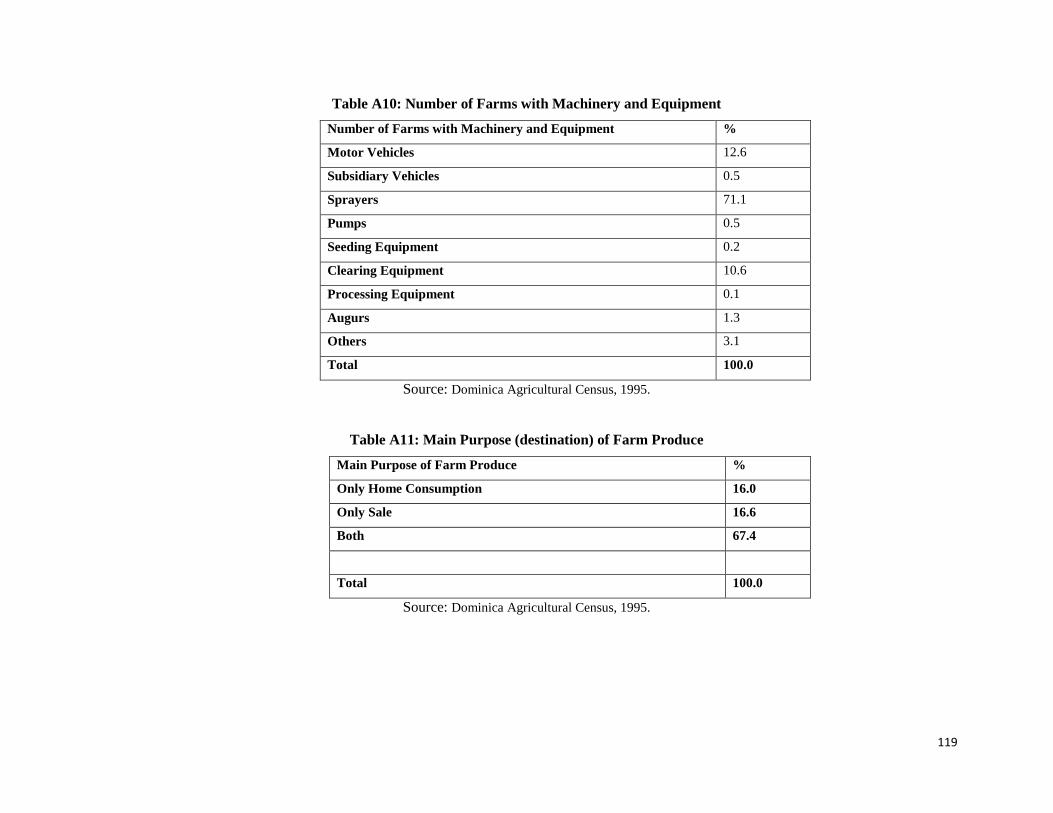
119
Table A10: Number of Farms with Machinery and Equipment
Number of Farms with Machinery and Equipment %
Motor Vehicles 12.6
Subsidiary Vehicles 0.5
Sprayers 71.1
Pumps 0.5
Seeding Equipment 0.2
Clearing Equipment 10.6
Processing Equipment 0.1
Augurs 1.3
Others 3.1
Total 100.0
Source: Dominica Agricultural Census, 1995.
Table A11: Main Purpose (destination) of Farm Produce
Main Purpose of Farm Produce %
Only Home Consumption 16.0
Only Sale 16.6
Both 67.4
Total 100.0
Source: Dominica Agricultural Census, 1995.

120
Table A12: Main Source of Farm Income
Main Source of Farm Income %
100 % from Farm 29.5
50-99% from Farm 27.5
1-49% from Farm 43.0
Total 100.0
Source: Dominica Agricultural Census, 1995.
Table A13: Farmer Use of Fertilizers and Agro-chemicals
Use of Fertilizers and Agro-chemicals %
Organic Manure Fertilizers 26.2
Inorganic Fertilizers 78.9
Agro-chemicals 73.2
Source: Dominica Agricultural Census, 1995.