assessment report analysis of groundwater pilot projects report... · les projets pilotes avaient...
TRANSCRIPT
FINAL REPORT
Assessment Report Analysis of Groundwater Pilot Projects
May 2013
Submitted to:
Water Management Committee Canadian Council of Ministers of the Environment
123 Main Street, Suite 360 Winnipeg, Manitoba R3C 1A3
Submitted by: WESA, a division of BluMetric Environmental Inc.
171 Victoria Street North Kitchener, ON N2H 5C5
WESA Project Number: W-B10671-00-00
PN 1571
This report contains information which has been prepared for, but not approved by, the Canadian Council of Ministers of the Environment (CCME). CCME is committed to reflect the highest standards of research and analysis in its publications, however it is not responsible for the accuracy of the data contained in this report and does not warrant the information herein. CCME or its member jurisdictions do not necessarily share or affirm, in any way, any opinions expressed herein.
© Canadian Council of Ministers of the Environment, 2017

Page i
EXECUTIVE SUMMARY
The Water Management Committee (WMC) of the Canadian Council of Ministers of the Environment (CCME) approved, in principle, the preliminary assessment approach for groundwater sustainability. This report, otherwise referenced as the Gordon Report, provided the framework for the completion of five pilot projects across Canada. The pilot projects were selected to ensure the proposed model and indicators are applicable at a range of scales and issues in a variety of regions across the country. These pilot projects were completed in early 2013.
WESA was tasked to “prepare a report which synthesizes the results of the jurisdictions’ pilot project outcomes and document key findings, and based on the findings to highlight recommendations on the applicability, use and/or refinement of the assessment approach.”
The assessment model, as outlined in the Gordon Report, was tested through five pilot projects across Canada. The proposed assessment approach intent was to provide a scientifically valid tool to inform decision makers and policy developers on the status of groundwater sustainability in their area. This includes development of key data requirements, policy approaches and technical methods to ensure implementation of sustainable practices. These pilot projects were selected based on their differences in scale and complexity. For example, the scale of the pilot projects ranged from a municipal setting in the Town of Gibsons, British Columbia to a significantly larger study area (5636 km2) within the provincial jurisdictional context of Prince Edward Island to a transboundary aquifer that spans across southwest British Columbia and northwest Washington State, United States of America (USA), which was completed within a federal jurisdictional context. The Canada-wide scope of this project is represented in the fact that the pilot project locations extend from the west coast in the Town of Gibsons in British Columbia to the east coast in the province of Prince Edward Island and include projects in the provinces of Alberta and Quebec. Similarly, the complexity of issues affecting groundwater sustainability that were targeted by the pilot studies range from the management of nitrate contamination associated with fertilizer use, to issues associated with stresses from rapid growth and aging infrastructure in the absence of a water governance structure being in place.
WESA concluded that the assessment approach process allowed for the successful communication of groundwater sustainability issues to water managers and the public. The assessment approach considered the review of the groundwater sustainability goals including an assessment of the groundwater sustainability issues with respect to the Driving-Force-Pressure-State-Impact-Response (DPSIR) Framework, and selection of indicators to determine
Overall, the assessment approach met the outlined project goals set by WMC. It provided a common method to discuss and communicate groundwater sustainability issues. Further work could be undertaken to create a guide for future users on how to use the assessment model. This
Page ii WESA
groundwater sustainability as outlined in the Gordon Report. The assessment approach also provided a common language to discuss groundwater sustainability and related evaluation tools. Each pilot project was tasked to discuss their groundwater issue with respect to their study area for each of the five sustainability goals. The issues covered most of the five goals of sustainable groundwater management. Each goal and issue were analysed within the DPSIR Framework which is used internationally as described in the Gordon Report for groundwater reporting. The DPSIR Framework provides a logical thought process to aid in the selection of indicators.
The indicators selected to determine groundwater sustainability were based on examples provided by the Gordon Report and those created by the pilot projects. The analysis of the pilot projects noted that it is important to ensure that indicators can be selected based on the groundwater issues. These indicators should reflect local conditions. Many of the pilot projects did not only use the indicators presented in the Gordon report (Bayegnak, 2013) (Department of Environment, Labour and Justice, 2013) (Environment Canada, 2013) (Martin, A., et al., 2013). The only common Gordon Report indicator used by all of the pilot projects was for groundwater quality (the assessment of groundwater quality problem relative to the total studied area). It was noted by the pilot project contacts and the reviews of the draft report that the development, maintenance, and commitment to collect and maintain the data required by some of the indicators may be onerous for some users of the assessment approach in the future.
In WESA’s review, the largest challenges faced by the pilot projects seemed to be the amount of time involved to complete this process (including staff resources), the ability to develop indicators with the information available and understanding the components of the assessment approach. The pilot projects submitted assessment reports and tables varied in format, complexity and detail. This is positive in the sense that the assessment approach was flexible enough to be adapted to the various jurisdictions and over a range of project scales. However, the non-uniform reporting formats limited the ability to create a comparison between pilot projects and conclusions that could be made for this analysis. Two of the five pilot projects developed an additional step which included a way to summarize the indicators evaluation and/or evaluate the indicators themselves. For example, Environment Canada (2013) completed a weight-of-evidence assessment for each of the sustainability goals. This approach was used to provide a summary of the goals, DPSIR Framework elements, and indicators used to determine an outcome. The weight-of-evidence approach provided a synthesis of the indicators within the assessment approach and aided in the communication of the study results.
Page iii
guide could include additional suggestions on the development of indicators by themes and provide additional example indicators to aid the user. Further information could also include guidelines on how to communicate the results of the studies to water managers and the public.
La firme WESA a conclu que la démarche d’évaluation a permis de communiquer efficacement les problématiques de la pérennité des eaux souterraines aux responsables de la gestion de l’eau et au public. La démarche prenait en compte l’examen des objectifs de la gestion durable des eaux souterraines (y compris une évaluation des problématiques de la pérennité des eaux souterraines fondée sur le cadre conceptuel forces motrices-pressions-état-impacts-réponses
Page iv WESA
RÉSUMÉ
Le Comité de gestion de l’eau (CGE) du Conseil canadien des ministres de l’environnement (CCME) a approuvé en principe la démarche proposée aux fins de l’évaluation de la pérennité des eaux souterraines dans le rapport Gordon. Ce rapport établissait un cadre de travail pour la réalisation de cinq projets pilotes au Canada. Les projets pilotes avaient été choisis pour leur capacité de proposer des modèles et des indicateurs qui s’appliqueraient à différentes échelles, à différentes problématiques et dans différentes régions du pays. Tous avaient été menés à terme au début de 2013.
La firme WESA a été mandatée pour produire une synthèse des résultats des projets pilotes des autorités compétentes, en exposer les principales conclusions et, à partir desdites conclusions, faire des recommandations sur l’applicabilité de la démarche d’évaluation, son utilisation ou les améliorations à y apporter.
Le modèle d’évaluation décrit dans le rapport Gordon a été mis à l’essai dans le cadre de cinq projets pilotes au Canada. La démarche d’évaluation proposée devait fournir un outil scientifiquement valable pour renseigner les décideurs et les responsables de l’élaboration des politiques sur la situation de la pérennité des eaux souterraines dans leur région. Il s’agissait notamment de déterminer les principales données, politiques et techniques nécessaires pour garantir l’adoption de pratiques durables. Les projets pilotes ont été sélectionnés en fonction de la diversité de leurs échelles et de leurs niveaux de complexité. Par exemple, on passe de l’échelle municipale dans la Ville de Gibsons, à l’échelle provinciale dans une zone beaucoup plus vaste (5636 km2) de l’Île-du-Prince-Édouard, puis à l’échelle fédérale dans un aquifère transfrontalier qui couvre le sud-ouest de la Colombie-Britannique et le nord-ouest de l’État de Washington. Ensemble, ces projets ont une portée nationale puisqu’ils vont de la côte Ouest avec la Ville de Gibsons en Colombie-Britannique jusqu’à la côte Est avec la province de l’Île-du-Prince-Édouard, en passant par l’Alberta et le Québec. La complexité des problématiques de la pérennité des eaux souterraines qui sont ciblées dans les études varie elle aussi : on se penche aussi bien sur la gestion de la contamination par les nitrates imputable à l’utilisation d’engrais que sur les pressions exercées par une croissance rapide et un vieillissement des infrastructures en l’absence de structure de gouvernance de l’eau.

Selon l’étude de la firme WESA, les principaux défis des projets pilotes semblaient être le temps nécessaire à la mise en œuvre complète de la démarche (y compris les ressources humaines), la capacité d’élaborer des indicateurs à partir de l’information disponible et la compréhension des composantes de la démarche. Les projets pilotes ont soumis des rapports d’évaluation et des tableaux dont la structure, la complexité et le niveau de détail varient. D’un côté, cela montre que la démarche d’évaluation est assez souple pour être utile à diverses autorités compétentes et pour s'appliquer à des projets d’envergure variable. Par contre, l’absence d’uniformité dans la structure des rapports complique l’établissement de comparaisons entre les projets pilotes et limite la capacité d’en tirer des conclusions pour la présente analyse. Deux des cinq projets pilotes ont intégré à leur démarche une étape supplémentaire qui devait permettre de résumer l’évaluation des indicateurs ou d’évaluer les indicateurs en tant que tels. Ainsi, Environnement Canada (2013) a procédé à une évaluation à l'aide d'une approche fondée sur le poids de la
Page v WESA
[FPEIR]) et la sélection d’indicateurs pour déterminer la pérennité des eaux souterraines conformément aux instructions énoncées dans le rapport Gordon. Enfin, la démarche a établi une terminologie commune pour discuter de la pérennité des eaux souterraines et des outils d’évaluation connexes. Chaque projet pilote devait analyser la problématique de l’eau souterraine dans la zone étudiée pour chacun des cinq objectifs de la gestion durable des eaux souterraines. Les problématiques abordées couvraient la plupart de ces cinq objectifs. Le cadre FPEIR, utilisé à l’échelle internationale, a servi à analyser chaque objectif et chaque problématique comme le décrit le rapport Gordon aux fins de la production de rapports sur les eaux souterraines. Le cadre FPEIR établit un processus de réflexion logique qui aide à la sélection des indicateurs.
Les indicateurs choisis pour déterminer la pérennité des eaux souterraines étaient fondés sur les exemples fournis par le rapport Gordon ou ont été créés par les équipes de projets pilotes. L’analyse des projets pilotes a révélé l'importance de faire en sorte que les indicateurs puissent être choisis en fonction des problématiques de la zone à l’étude. Ces indicateurs devraient refléter les conditions locales. Plusieurs des projets pilotes ne se sont pas limités aux indicateurs présentés dans le rapport Gordon (Bayegnak, 2013) (ministère de l’Environnement de l’Île-du-Prince-Édouard, 2013) (Environnement Canada, 2013) (Martin, A. et al., 2013). Le seul indicateur proposé dans le rapport Gordon qui a été retenu par tous les projets pilotes concernait la qualité de l’eau souterraine (évaluation d’un problème de qualité de l’eau souterraine par rapport à la superficie totale étudiée). Selon les personnes-ressources des projets pilotes et les commentaires reçus au sujet du rapport préliminaire, la détermination et la tenue des données requises pour certains des indicateurs, ainsi que l’engagement à recueillir et à tenir ces données, risquent de se révéler onéreux pour certains utilisateurs de la démarche d’évaluation dans l’avenir.
Page vi
preuve pour chacun des objectifs de gestion durable. Cette étape lui a permis de produire un résumé des objectifs, des éléments du cadre FPEIR et des indicateurs utilisés pour déterminer un résultat. L'approche fondée sur le poids de la preuve a fourni une synthèse des indicateurs dans le cadre de la démarche d’évaluation et a facilité la communication des résultats de l’étude. Dans l’ensemble, la démarche d’évaluation a permis d’atteindre les objectifs fixés par le CGE. Elle a fourni une méthode commune pour analyser et communiquer les problématiques de la pérennité des eaux souterraines. D’autres travaux pourraient être réalisés en vue de produire un guide d’utilisation du modèle d’évaluation à l’intention des futurs utilisateurs. Ce guide pourrait donner des suggestions additionnelles sur l’élaboration d’indicateurs par thèmes et présenter des exemples supplémentaires d’indicateurs pour aider l’utilisateur. On pourrait aussi y ajouter des lignes directrices sur la communication des résultats des études aux responsables de la gestion de l’eau et au public.

Page vii
TABLE OF CONTENTS
EXECUTIVE SUMMARY ........................................................................................................... I RÉSUMÉ ..................................................................................................................................... IV ACKNOWLEDGEMENT ........................................................................................................... .X 1. INTRODUCTION................................................................................................................... 1
1.1 PURPOSE ............................................................................................................................ 3 1.2 METHODOLOGY ................................................................................................................. 3
1.2.1 WESA Template .......................................................................................... 5 1.3 KEY TERMS AND CONCEPTS .............................................................................................. 6
2. PILOT PROJECTS SUMMARY .......................................................................................... 8
2.1 USE OF GROUNDWATER SUSTAINABILITY INDICATORS IN GROUNDWATER OUTREACH AND
MANAGEMENT FOR THE TOWN OF GIBSONS, BRITISH COLUMBIA, CANADA ..................... 8 2.2 SUSTAINABILITY INDICATOR ASSESSMENT FOR THE TRANSBOUNDARY ABBOTSFORD-
SUMAS AQUIFER, BRITISH COLUMBIA, CANADA ............................................................. 12 2.3 GROUNDWATER SUSTAINABILITY ASSESSMENT FOR THE LOWER ATHABASCA REGION,
ALBERTA: A COMPARATIVE ASSESSMENT OF THE LOWER ATHABASCA GROUNDWATER
MANAGEMENT FRAMEWORK AND THE CCME DPSIR APPROACH, ALBERTA, CANADA . 20 2.4 GROUNDWATER SUSTAINABILITY IN THE MONTÉRÉGIE EST REGION, PROVINCE OF
QUEBEC, CANADA ........................................................................................................... 27 2.5 SUSTAINABILITY OF GROUNDWATER RESOURCES IN SELECTED WATERSHED IN PRINCE
EDWARD ISLAND-QUANTITY, QUALITY AND ECOSYSTEM CONSIDERATIONS, PRINCE
EDWARD ISLAND, CANADA ............................................................................................. 33 2.6 SUMMARY OF PILOT PROJECT RESULTS ........................................................................... 40
2.6.1 DPSIR Framework Elements Reviewed ................................................... 40
3. ANALYSIS OF THE ASSESSMENT APPROACH ...........................................................46
3.1 GROUNDWATER SUSTAINABILITY GOALS .........................................................................46 3.2 DPSIR FRAMEWORK ....................................................................................................... 47 3.3 GROUNDWATER SUSTAINABILITY INDICATORS ............................................................... 50 3.4 LESSONS LEARNED BY THE PILOT PROJECTS ................................................................... 54 3.5 SUMMARY OF ANALYSIS OF THE ASSESSMENT APPROACH .............................................. 56
3.5.1 Data Considerations, Gaps and Uncertainty Provided by the Pilot Projects58
4. EVALUATION OF THE ASSESSMENT APPROACH .................................................. 60
2.6.2 Gordon Report Indicators .......................................................................... 42

Page viii
4.1 RECOMMENDATIONS ON THE STATED OBJECTIVES OF THE ASSESSMENT APPROACH ....... 64
5. CONCLUSION ..................................................................................................................... 676. WORKS CITED.................................................................................................................... 68
LIST OF TABLES
Table 1: Summary of Pilot Project Sustainability Goals and DPSIR Framework Elements Tested- Town of Gibsons (Gordon, 2013) ............................................ 9
Table 2: Summary of Pilot Project Sustainability Goals and DPSIR Framework Elements Tested- the Abbotsford-Sumas Aquifer (Canadian Portion Only) (Environment Canada, 2013) .......................................................................................................... 15
Table 3: Summary of Pilot Project Sustainability Goals and DPSIR Framework Elements Tested- The Lower Athabasca Region (Bayegnak, 2013) ....................................... 21
Table 4: Proposed NAOS DPSIR Indicators (Bayegnak, 2013) ........................................... 26 Table 5: Groundwater sustainability indicators using PACES projects data, Montérégie Est
Region, Québec ....................................................................................................... 29 Table 6: Development of indicators for the PACES program- Example .............................. 32 Table 7: Summary of Pilot Project Sustainability Goals and DPSIR Framework Elements
Tested- Prince Edward Island .................................................................................. 35 Table 8: Summary of DPSIR Framework Elements Reviewed by the Pilot Projects ............41 Table 9: Summary of the Example Gordon Report Indicators Used by at Least Three or
More of the Pilot Projects .........................................................................................43 Table 10: Theme for Indicators for the Groundwater Sustainability Goals- Examples .......... 61
LIST OF FIGURES IN TEXT
Figure 1: DPSIR Framework for CCA goal to Protect Groundwater Quality from Contamination for the Abbotsford-Sumas Aquifer (Environment Canada, 2013) ..... 14
Figure 2: DPSIR Framework for Groundwater Quantity issues caused by Urbanization and Agricultural Activity (Department of Environment, Labour and Justice, 2013) ......39
Page ix
LIST OF FIGURES FOLLOWING TEXT
Figure 1: Canada-wide location map of where the pilot projects are located Figure 2: Watershed scale map showing the Aquifer of Interest- Town of Gibsons Figure 3: Watershed scale map showing the Aquifer of Interest- Abbotsford- Sumas
Aquifer Figure 4: Watershed scale map showing the Aquifer of Interest- Lower Athabasca Figure 5: Watershed scale map showing the Aquifer of Interest- Montérégie Est Region Figure 6: Watershed scale map showing the Aquifer of Interest- Prince Edward Island
LIST OF APPENDICES
Appendix A: Project Synopsis Summary of the Pilot Projects Appendix B: Summary and Analysis of Indicators Provided by the Pilot Projects Appendix C: WESA Template Provided to Pilot Projects

Page x
ACKNOWLEDGEMENT
The authors of this Analysis of Groundwater Pilot Projects report wish to thank the Canadian Council of Ministers of the Environment (CCME) for funding this work. We would also like to thank members of the Groundwater Project Team including Mr. Andy Ridge, Water Management Committee (WMC) member and Project Authority for the support and input throughout the project. We wish to thank Ms. Jane Stewart and Ms. Laura Crawford, CCME Secretariat support to the project, for their ongoing coordination and communication efforts throughout the project, keeping the consulting team and pilot project participants informed of the project timeline, objectives and process. The authors also wish to thank the Pilot Project Contacts, for their input and participation at critical points during the project including their contributions through their detailed groundwater sustainability assessment reports. We would also like to thank all of the participating agencies for their assistance in reviewing the draft report and for their final edits and contributions which were incorporated into the final report. Finally, we would also like to thank members of the Water Management Committee (WMC) of the Canadian Council of Ministers of the Environment for their commitment to the protection of Canada’s groundwater resources.

Page 1
1.0 INTRODUCTION
In 2007 the Canadian Council of Ministers of the Environment (CCME) identified groundwater as a priority issue. Subsequently, in 2010, the CCME Water Management Committee (WMC) tasked their groundwater project team with developing an approach for assessing groundwater sustainability. The intent of the sustainability assessment is to provide:
• A standardized means by which jurisdictions can track the status of groundwaterresources and the effectiveness of their groundwater management strategies over time.
• Continuity and a common language when communicating the sustainability ofgroundwater resources at a local, region, provincial/territorial, Canada-wide orinternational scale.
• A platform for developing shared policy instruments and technical tools for groundwatersustainability.
• Assistance to jurisdictions in better informing their decision-makers and policy-developers on the status of groundwater sustainability and on key data requirements,policy approaches, time and resource commitments and technical methods required tohelp ensure that sustainably groundwater management practises are implemented.
In 2010, WMC retained Gordon Groundwater Consultancy to develop the Preliminary Approach for Assessing the Sustainability of Groundwater (Gordon, 2011), otherwise referenced in this document as the Gordon Report. The Gordon Report outlined an approach for assessing the sustainability of groundwater resources at a local, regional or Canada-wide scale which consisted of five goals, an assessment model and example indicators.
WESA, a division of BluMetric Environmental Inc., was retained by CCME in July 2012. WESA was tasked to help coordinate communication between the pilot projects and provide an analysis of the Preliminary Approach for Assessing the Sustainability of Groundwater (Gordon, 2011).
WMC approved, in principle, the following two goals for the assessment approach to seek to understand the approach’s applicability across the country. The goals for the pilot testing of the assessment approach were to:
• Determine whether the proposed model and indicators are applicable at a range of scales andissues and in a variety of regions across Canada; and
• Identify the need for revisions and refinement of the assessment approach.
Page 2
The assessment approach outlined in the Gordon Report was tested by five pilot projects across Canada. The proposed assessment approach intent was to provide a scientifically valid tool to inform decision makers and policy developers on the status of groundwater sustainability in their area. This includes development of key data requirements, policy approaches and technical methods to ensure implementation of sustainable practices. The five pilot projects are described in Appendix A.
These pilot projects were selected based on their differences in scale and complexity. For example, the scale of the pilot projects ranged from a municipal setting in the Town of Gibsons, British Columbia to a significantly larger study area (5636 km2) within the provincial jurisdictional context of Prince Edward Island to a transboundary aquifer located in southwest British Columbia and northwest Washington State, United States of America (USA) which was completed within a federal jurisdictional context. Figures presenting the location and aerial extent of the five pilot projects are presented on Figures 1 through 6, following this report. The Canada-wide scope of this project is represented in the fact that the pilot project locations extend from the west coast in the Town of Gibsons in British Columbia to the east coast in the province of Prince Edward Island and include projects in the provinces of Alberta and Quebec. Similarly the complexity of issues affecting groundwater sustainability range from the groundwater sustainability challenge of the management of nitrate contamination associated with fertilizer use (manure and synthetic sources) to groundwater sustainability issues as they relate to stresses from rapid growth and aging infrastructure in the absence of a water governance structure being in place.
The report is divided into five sections. Section 1 is intended to inform the reader of the purpose of this report, describe the methodology used to prepare the report including a description of the templates provided to the pilot projects to help synthesize the pilot project results. For clarity purposes, Section 1 also provides short descriptions of key terms used in the report. Finally Section 1 also gives an overview of the objective and goals of the project and provides an overview of the differences in scope and scale of the five pilot projects.
Section 2 provides a brief summary description of each pilot project including a brief background, their location, primary goals/challenges, which of the five sustainability goals and DPSIR Framework elements were used in their analysis and indicator selection criteria, where available. The tables in this section outline what the main sustainability issues were for each pilot project. This section also highlights which elements of the Driving-Force-Pressure-State-Impact-Response (DPSIR) Framework were used to develop the groundwater sustainability indicators described in Section 3 and Appendix B. This section also discusses the Gordon Report Indicators and provides a comparison on what was used by the pilot projects.
Page 3
Section 3 is the assessment of the pilot project study results. This section includes descriptions of the groundwater sustainability goals, the DPSIR Framework and the groundwater sustainability indicators. This section also compiles the lessons learned as provided by the pilot projects in the individual summary reports. Finally, this section provides a summary of the assessment approach including a description of data considerations, gaps and uncertainties as noted within the pilot project reports.
Section 4 presents an evaluation of the assessment approach and specifically seeks to address the Water Management Committee’s goals and objectives to determine whether the proposed model and indicators are applicable at a range of scales and issues and in a variety of regions across Canada and to identify the need for revisions and refinement of the assessment approach. This section also presents some recommendations on the stated objectives of the assessment approach by summarizing descriptions, as provided, of how the projects managed to meet these specific objectives.
Finally, Section 5 provides a brief summary of the main conclusions.
1.1. Purpose
WESA was tasked to, “prepare a report which synthesizes the results of the jurisdictions’ pilot project outcomes and document key findings, and based on the findings to highlight recommendations on the applicability, use and/or refinement of the assessment approach.”
This report provides an assessment of the findings from the pilot projects. The report identifies key lessons learned, issues and other items relevant to support the goals and objectives to this project to meet the requirements of Task 5 and 6 of the Request for Proposal (CCME, 2012).
1.2. Methodology
Five pilot projects locations were selected by CCME to test and provide an analysis of the assessment approach proposed within the Gordon Report. This final report assesses the findings of the pilot projects and provides an analysis of the key findings with respect to the assessment approach. This includes providing a review of the assessment approach, summary of indicators, identifying data gaps and lessons learned. This final report also reflects all comments received on the draft assessment approach report. This study is based on data collected through the review of the reports submitted by the pilot projects and review of the information provided by the pilot projects in the templates developed
Page 4
by WESA. The templates were provided to the Pilot Project Contacts and are presented in Appendix C. The aim of these templates was to capture the information required to complete this analysis of the assessment approach. They were developed through a series of conference calls and reviews completed by the pilot projects contacts and WESA. Overall, it was important that the templates still allowed for the flexibility for the pilots to modify them based on their needs. Further details are provided in Section 1.2.1
Throughout the process, WESA also participated in conference and one-on-one calls with the pilot project contacts. These conference calls allowed for additional insight into the pilot projects contacts assessment of groundwater sustainability as outlined by the Gordon Report.
The following pilot project reports and tables were reviewed:
• Draft Groundwater Sustainability Assessment for the NAOS Alberta. (Bayegnak, 2013)• Groundwater Sustainability in Prince Edward Island. (Department of Environment,
Labour and Justice, 2013)• Draft Groundwater Sustainability Assessment for the Abbotsford-Sumas Aquifer.
(Environment Canada, 2013)• Draft Pilot Testing of the Preliminary Approach for Assessing Groundwater
Sustainability- Town of Gibson Tables. (Gordon, 2013)• Draft Pilot Testing of the Preliminary Approach for Assessing Groundwater
Sustainability- Prince Edward Island Tables. (Li, 2013)• Évaluation d’indicateurs de gestion durable des eaux souterraines. Projet pilote du CCME
supporté par le MDDEFP. Version préliminarie transmise au CCME. (Martin, A., et al.,2013)
Once submitted, WESA reviewed all materials and developed the summary tables presented in this report, specifically Appendix B for the indicators used. This provided an ability to create an initial analysis of the indicators and capture the comments provided by the pilot project contacts and authors of the reports submitted. Further information was collected on the analysis of the groundwater sustainability goals and DPSIR Framework. If information gaps were noted, WESA attempted to contact the pilot projects contacts. A draft report was provided to the CCME Groundwater Project Team for review. Comments received have been incorporated into this final report.
Page 5
1.2.1. WESA Template
WESA developed a template to help collect information to aid in the analysis of the draft assessment approach as per Task 2 of the RFP (CCME, 2012). The template is provided in Appendix C and was used by each of the pilot projects in one way or another. It should be noted that this template was provided to the pilots before the completion of their individual pilots; therefore, in some cases the template was modified to accommodate the specific aspects of the pilot projects.
The information collected from Table 1 of the template provided a summary of the pilot projects. This included the title, lead contacts, location, aquifer and aquifer type, background information, scale, mapping and anticipated project completion data. This information was used to develop the pilot project summaries presented in Appendix A. Further, these tables allowed for a review of the pilots scale and complexity.
Table 2 of the WESA template provided the specific issue with respect to the groundwater sustainability goal and which elements of the DPSIR Framework indicators were developed. This table was used to populate the tables presented in Section 2 of this report. The pilot projects modified this table, where indicated in Section 2, to reflect their own groundwater sustainability assessments.
Table 3 of the WESA template provided an assessment of the example groundwater sustainability indicators as presented in the Gordon Report, where available. This table was modified to reflect which indicators were used by the pilot projects. The key information extracted from this table included the indicator used, data considerations (data gaps, uncertainty and assumptions), appropriateness of the indicators based on the DPSIR Framework and any additional comments.
Figure 1 of the template was developed based on the request from the pilots to provide a graphical method to present the DPSIR Framework. This was not used by any of the pilot projects.
Overall, the templates provided to the pilot projects were modified to reflect their needs, where applicable. They were flexible enough to do so in order to capture information for WESA to complete this assessment. Without these templates, a streamlining of information to complete this report would have been difficult; therefore, it was necessary to produce these in advance of submission of the pilot projects.
Page 6
Modifications could be made to the templates, if deemed necessary, to reflect the information presented in Section 2 of this report.
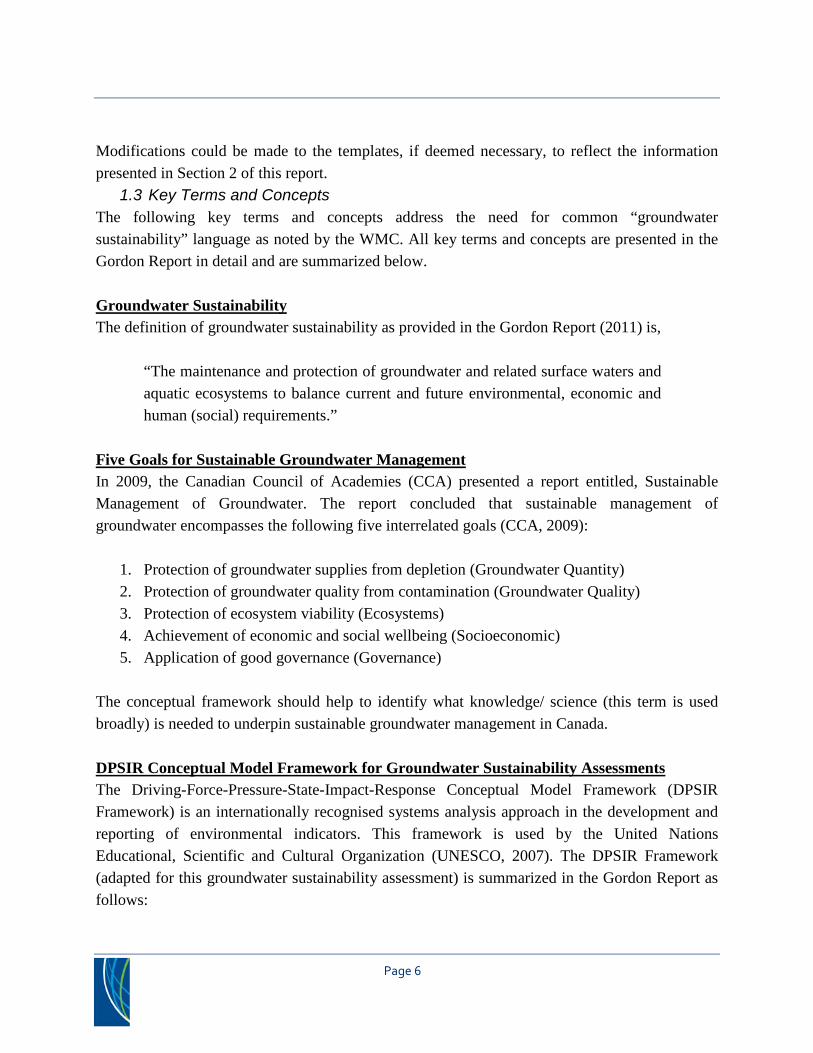
1.3 Key Terms and Concepts The following key terms and concepts address the need for common “groundwater sustainability” language as noted by the WMC. All key terms and concepts are presented in the Gordon Report in detail and are summarized below.
Groundwater Sustainability The definition of groundwater sustainability as provided in the Gordon Report (2011) is,
“The maintenance and protection of groundwater and related surface waters and aquatic ecosystems to balance current and future environmental, economic and human (social) requirements.”
Five Goals for Sustainable Groundwater Management In 2009, the Canadian Council of Academies (CCA) presented a report entitled, Sustainable Management of Groundwater. The report concluded that sustainable management of groundwater encompasses the following five interrelated goals (CCA, 2009):
1. Protection of groundwater supplies from depletion (Groundwater Quantity)2. Protection of groundwater quality from contamination (Groundwater Quality)3. Protection of ecosystem viability (Ecosystems)4. Achievement of economic and social wellbeing (Socioeconomic)5. Application of good governance (Governance)
The conceptual framework should help to identify what knowledge/ science (this term is used broadly) is needed to underpin sustainable groundwater management in Canada.
DPSIR Conceptual Model Framework for Groundwater Sustainability Assessments The Driving-Force-Pressure-State-Impact-Response Conceptual Model Framework (DPSIR Framework) is an internationally recognised systems analysis approach in the development and reporting of environmental indicators. This framework is used by the United Nations Educational, Scientific and Cultural Organization (UNESCO, 2007). The DPSIR Framework (adapted for this groundwater sustainability assessment) is summarized in the Gordon Report as follows:

Page 7
• Driving Force indicators describe the social, demographic and economic developmentsin societies and the corresponding changes in lifestyles, overall levels of consumptionand production patterns.
• Pressure indicators describe the developments by human activities that use groundwatersupplies and release contaminants into groundwater.
• State indicators describe the groundwater in terms of physical, biological, and chemicalphenomena in a certain area.
• Impact indicators that illustrate the effects of changes in the state of groundwatersystems.
• Response indicators refer to responses by groups (and individuals) in society, as well asgovernment efforts, to prevent, compensate, ameliorate or adapt to changes in the state ofgroundwater systems.
Groundwater Sustainability Indicators The selection of indicators with pre-determined criteria that are rigorous and transparent ensures the scientific credibility of the assessment approach. Groundwater sustainability indicators were defined in the Gordon Report (2011) as:
“Measurable parameters that represent relevant information on trends in groundwater systems in a readily understandable way.”
The indicators should address linkages which exist between environmental, social and economic dimensions. For the purpose of this analysis the groundwater sustainability indicators must be (Gordon, 2011):
• Scientifically credible and accepted by experts in the field.• Adapted from international recognized organisations for relevance in Canada.• Measurable, representative of the issue, sensitive in the relevant time scale and easy to
interpret.• Amenable to application at different geographic scales and comparable with other
indicators that describe similar area, sectors or activities.• Relevant to the needs of policy developers, water managers and enable individuals to
make meaningful decisions.• Able to encourage jurisdictions to adopt or adapt these indicators and ensuring
groundwater sustainability- regardless of the current state of their groundwater programs.

Page 8
Example indicators were provided for each of the groundwater sustainability goals and for selected elements of the DPSIR Framework. These examples are outlined in the Gordon Report.
2.0 PILOT PROJECTS SUMMARY
The following is a summary of the pilot projects. This summary outlines a brief background of each of the pilot projects, their location, primary goals/challenges, which of the five sustainability goals and DPSIR Framework elements were used in their analysis and indicator selection criteria, where available. Background information on each of the pilot projects is provided in Appendix A. The relative locations of the five pilot projects are presented in Figure 1 through 6, following this report. If required, the reader should contact the pilot project contact listed in Appendix A, or the CCME contacts for further information regarding their individual assessments.
2.1 USE OF GROUNDWATER SUSTAINABILITY INDICATORS IN GROUNDWATER OUTREACH AND MANAGEMENT FOR THE TOWN OF GIBSONS, BRITISH COLUMBIA, CANADA
The Town of Gibsons is located in the southern portion of British Columbia as presented in Figure 2. This pilot project represents the smallest aquifer studied (approximately 5 km2) and was completed within a municipal jurisdictional context. For review, this pilot project submitted the WESA template tables. No supplemental report was provided.
Within the Town of Gibsons, several groundwater studies have been completed. However, an integrated approach to management of the groundwater supply has yet to be established. Currently studies are being undertaken to map the aquifer and further define the structure and goals for specific actions within the Town of Gibsons groundwater management program.
Groundwater quality within the aquifer studied is unique as this small municipality. The municipality has good and ample quantity of water. The Town of Gibsons is facing stresses from rapid growth and aging infrastructure which has emphasised the importance of sustaining the groundwater resources and protecting the current supply. Currently, there is no water governance structure in place. Outreach, using the indicators selected in the groundwater assessment, is a tool to encourage sustainable groundwater management practices.
The primary groundwater sustainability goal for this aquifer is to ensure the quality of the existing groundwater supplies remains good and demand for the resource does not exceed the supply.

Page 9
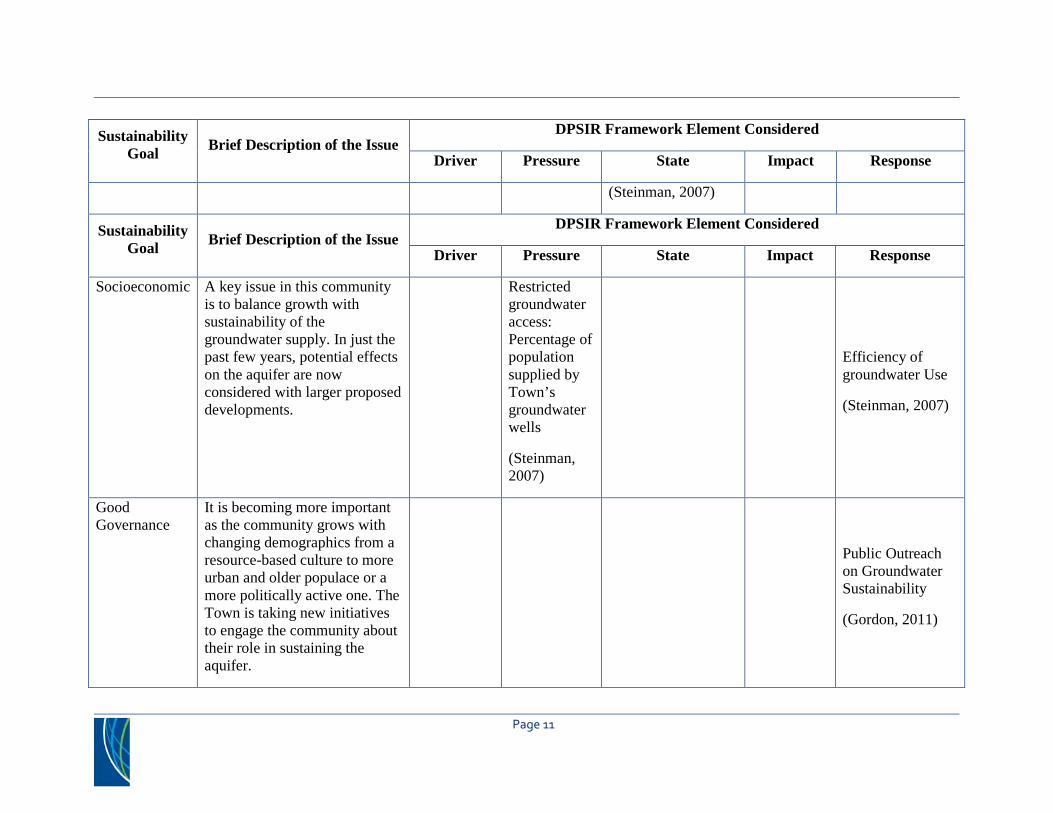
The following is a summary of the five sustainability goals, DPSIR Framework elements and the indicators selected for the assessment of groundwater sustainability in the Town of Gibsons. Indicators developed specifically for the Town of Gibsons are bolded. Table 1: Summary of Pilot Project Sustainability Goals and DPSIR Framework Elements Tested- Town of Gibsons (Gordon, 2013)

Page 10
Sustainability Goal Brief Description of the Issue
DPSIR Framework Element Considered
Driver Pressure State Impact Response
Groundwater Quantity
Town requires greater certainty in recharge (location, processes and rates) and availability in order to plan for future development and infrastructure. Conservation awareness is also rising as an issue because Town is now metered.
Renewable groundwater resources per capita m3/yr
(UNESCO, 2007)
(Total groundwater abstraction/recharge) x 100
(UNESCO, 2007)
(Σ Areas with groundwater depletion problem/ Total studied area) x100
(UNESCO, 2007)
Resource for Water Infrastructure Upgrades
Groundwater Quality
Town wants to continue with an untreated groundwater supply. It has completed numerous infrastructure upgrades to support the continuance of this design. Ongoing updates to land use and various subsurface disturbances bylaws and zoning controls provide additional protection.
(Σ Areas with specific class of groundwater vulnerability/ Total studied area) x100
(UNESCO, 2007)
(Σ Areas with groundwater quality problem/ Total studied area) x100
(UNESCO, 2007)
Number of contaminated sites
(Steinman et al., 2007)
Resource for Water Infrastructure Upgrades
Ecosystems Studies initiated, but are not the focus of this project.
Groundwater contribution to base flow (not determined at this time)
Page 11
Sustainability Goal Brief Description of the Issue
DPSIR Framework Element Considered
Driver Pressure State Impact Response
(Steinman, 2007)
Sustainability Goal Brief Description of the Issue
DPSIR Framework Element Considered
Driver Pressure State Impact Response
Socioeconomic A key issue in this community is to balance growth with sustainability of the groundwater supply. In just the past few years, potential effects on the aquifer are now considered with larger proposed developments.
Restricted groundwater access: Percentage of population supplied by Town’s groundwater wells
(Steinman, 2007)
Efficiency of groundwater Use
(Steinman, 2007)
Good Governance
It is becoming more important as the community grows with changing demographics from a resource-based culture to more urban and older populace or a more politically active one. The Town is taking new initiatives to engage the community about their role in sustaining the aquifer.
Public Outreach on Groundwater Sustainability
(Gordon, 2011)

Page 12
Indicators were selected to test each of the DPSIR Framework elements noted above. A final assessment of groundwater sustainability was not made available as this project is ongoing.
All of the example indicators as outlined in the Gordon Report were used for the analysis of groundwater sustainability in the Town of Gibsons with the exception of the following:
• Groundwater sustainability goal Governance- Indicator: Groundwater Program Resources• Groundwater sustainability goal Socioeconomic- Indicator: Dependence of agriculture
population on groundwater = (# farmers etc / population) x100
WESA assumes that these two indicators were not used in the assessment as they did not apply to the study as outlined in Appendix A. For example, there is no agricultural related groundwater issue in the Town of Gibsons. Further, no groundwater programs are in place currently, therefore an assessment could not be made.
The additional indicator bolded in Table 1 (resources for water infrastructure upgrades) was used by the pilot project due to the data available. This data included the amount spent on infrastructure planning, the ability to track water losses, and data which indicates if drinking water quality parameters are exceed.
This pilot project also noted the need for an additional indicator for response to test if the implementation of outreach programs is achieving their stated goals. For example, an indicator could be used to evaluate implemented public outreach programs.
2.2 SUSTAINABILITY INDICATOR ASSESSMENT FOR THE TRANSBOUNDARY ABBOTSFORD-SUMAS AQUIFER, BRITISH COLUMBIA, CANADA
The Abbotsford-Sumas Aquifer (ASA) is a transboundary aquifer located in southwest British Columbia and northwest Washington State, USA. This study focused on the Canadian portion of the aquifer only. The outline of the entire aquifer is presented in Figure 3. This pilot project represents a large transboundary aquifer (Canadian portion only) and was completed within a Federal jurisdictional context, as this pilot project was completed by Environment Canada. A detailed draft groundwater sustainability assessment report was provided by Environment Canada in addition to the completion of the WESA template tables.

Page 13
The study area is located within the Lower Fraser Valley and is extensively relied upon by agriculture. The main issue in this area is nitrate contamination associated with fertilizer use (manure and inorganic sources). This has resulted in concentrations of nitrate exceeding the Health Canada drinking water guidelines. Since groundwater in this transboundary aquifer is noted to flow towards the USA, this aquifer has significant environmental policy and management issues that need to be considered.
Despite efforts to reduce the impact of nitrate of the aquifer over the past few decades, overall nitrate levels do not appear to have improved significantly or worsened relative to the drinking water guideline (Environment Canada, 2013). Therefore, the primary sustainability goal is associated with the amelioration of nitrate concentrations and the development of policy and management mechanisms to attain that goal (Environment Canada, 2013). A broader goal of tracking sustainability was also noted by Environment Canada. For this pilot project, sustainability was assessed with consideration of all five sustainability goals. An evaluation was completed for most of the Gordon Report indicators as noted below.
The following is a summary of the five sustainability goals issues, DPSIR Framework, and the indicator selected for the assessment of groundwater sustainability. Indicators developed specifically for this assessment are bolded. This pilot project also provided a narrative description for each of the DPSIR Framework elements within a graphical format. An example of this is provided in Figure 1.

Page 14
Figure 1: DPSIR Framework for CCA goal to Protect Groundwater Quality from Contamination for the Abbotsford-Sumas Aquifer (Environment Canada, 2013)
Response State
PressuresDrivers
Impact
State:• Areal extent of nitrate
contamination• Number of wells with detected
pathogens• Areal extent of groundwater
vulnerability• Number of contaminated sites• Use of pesticides or herbicides
Impacts: • Human health hazards
associated with nitratecontamination or pathogencontamination
• Limitations to thedevelopment of additionalgroundwater supply wells
• Restrictions to use ofexisting municipalproduction wells
Pressures: • Intense agricultural development
or intensification of production• Management of overabundant
manure• Low biogeochemical
transformation of nitrate• Increased number of point
sources of contamination
Responses:• Stakeholder and industry
collaboration to identifysources and investigate bettermanagement practices
• Long term monitoring ofnitrate contaminationcoupled with studies todiscern trends and potentialimpacts of BMPs and othermanagement responses
• Provincial contaminated sitesregulations and federalfunding mechanisms for siteremediation
• Notifications to homeownersof well water quality results
• Existing acts and regulations
Drivers:• Climate and soil
conditions thatfavour agriculture
• Market demand forberries and poultry
• Close proximity totransportationcorridors
Indicators:• Pressure or State – (Σ Areas with a specific class of groundwater
vulnerability/ Total studied area) x100• State or Impact – (Σ Areas with groundwater quality problem/
Total studied area) x100• Response – # of contaminated sites
Page 15
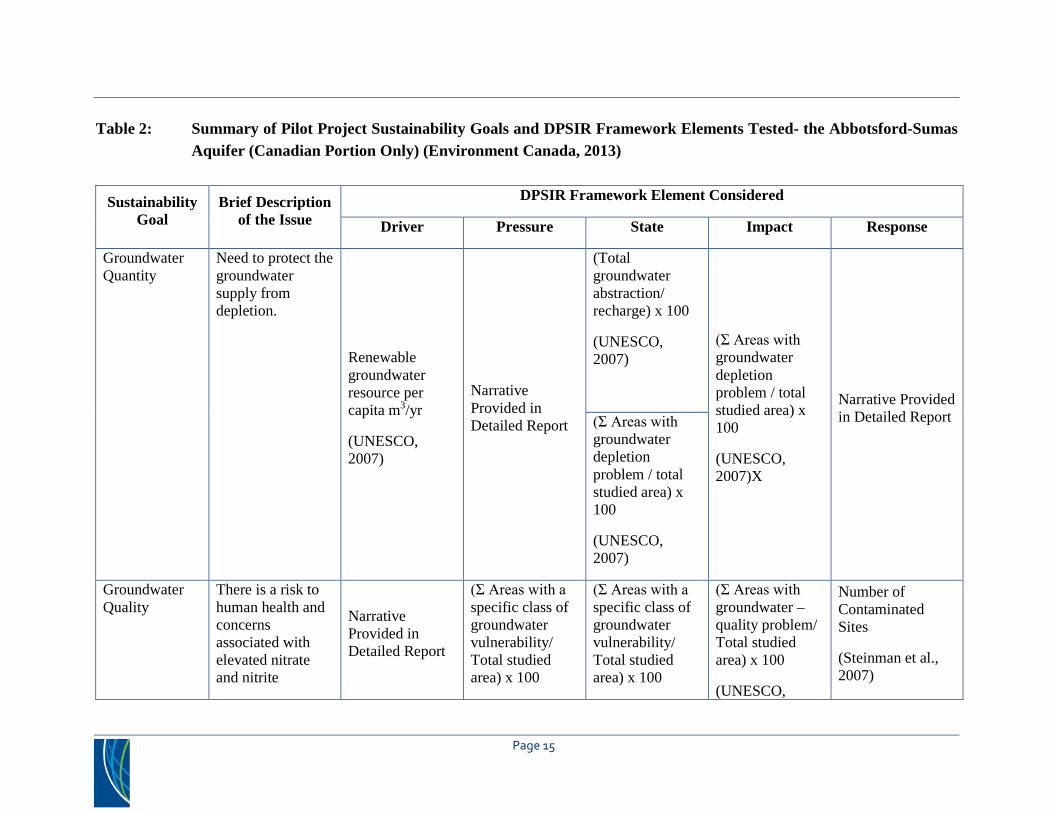
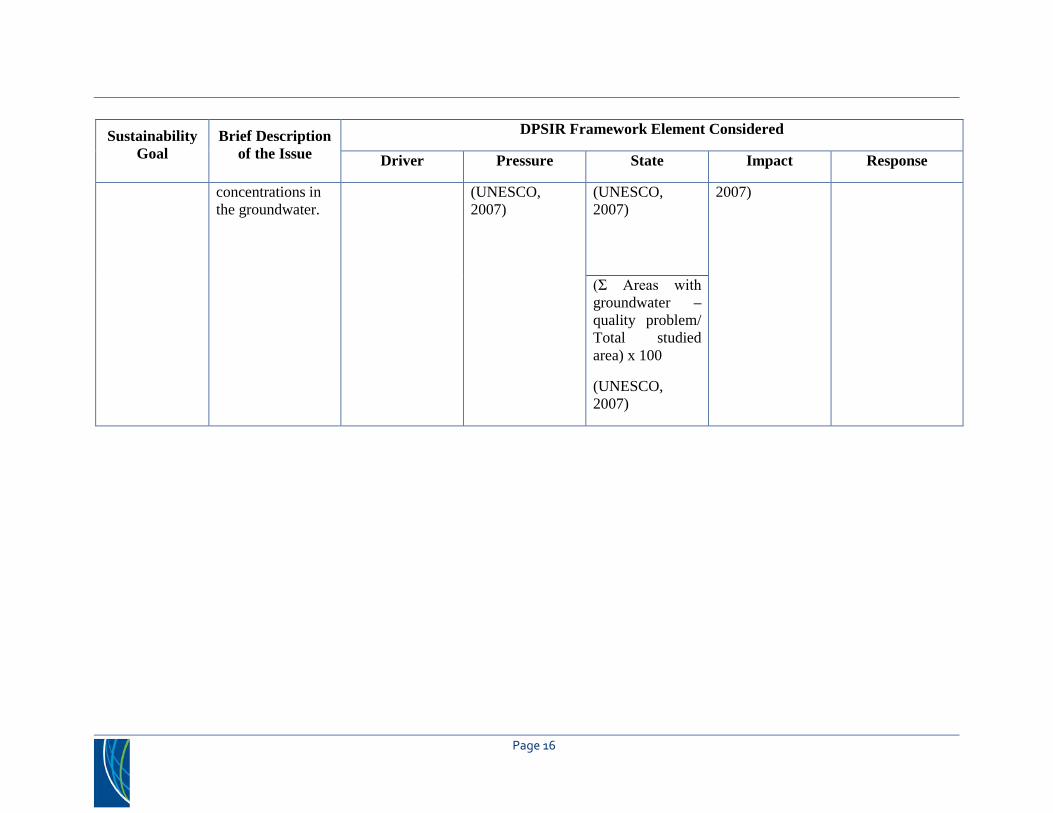
Table 2: Summary of Pilot Project Sustainability Goals and DPSIR Framework Elements Tested- the Abbotsford-Sumas Aquifer (Canadian Portion Only) (Environment Canada, 2013)
Sustainability Goal
Brief Description of the Issue
DPSIR Framework Element Considered
Driver Pressure State Impact Response
Groundwater Quantity
Need to protect the groundwater supply from depletion.
Renewable groundwater resource per capita m3/yr
(UNESCO, 2007)
Narrative Provided in Detailed Report
(Total groundwater abstraction/ recharge) x 100
(UNESCO, 2007)
(Σ Areas with groundwater depletion problem / total studied area) x 100
(UNESCO, 2007)X
Narrative Provided in Detailed Report (Σ Areas with
groundwater depletion problem / total studied area) x 100
(UNESCO, 2007)
Groundwater Quality
There is a risk to human health and concerns associated with elevated nitrate and nitrite
Narrative Provided in Detailed Report
(Σ Areas with a specific class of groundwater vulnerability/ Total studied area) x 100
(Σ Areas with a specific class of groundwater vulnerability/ Total studied area) x 100
(Σ Areas with groundwater – quality problem/ Total studied area) x 100
(UNESCO,
Number of Contaminated Sites
(Steinman et al., 2007)
Page 16
Sustainability Goal
Brief Description of the Issue
DPSIR Framework Element Considered
Driver Pressure State Impact Response
concentrations in the groundwater.
(UNESCO, 2007)
(UNESCO, 2007)
2007)
(Σ Areas with groundwater – quality problem/ Total studied area) x 100
(UNESCO, 2007)

Page 17
Sustainability Goal
Brief Description of the Issue
DPSIR Framework Element Considered
Driver Pressure State Impact Response
Ecosystems Address concerns over stream water quality and reduced seasonal baseflow.
Narrative Provided in Detailed Report
Number of species at risk associated with streams/ riparian habitat
(BC Species and Indicator Explorer)
Groundwater contribution to baseflow
(Steinman, 2007)
Groundwater Quality impacts on base flow
Narrative Provided in Detailed Report
Groundwater Quality impacts on base flow
Number of species at risk associated with streams/ riparian habitat
(BC Species and Indicator Explorer)
Socioeconomic There is a heavy reliance on groundwater for irrigation and domestic water supply. Also, transboundary regulatory concerns.
Dependence on groundwater supply = % of total water supply
(UNESCO, 2007)
*modified fromexample provided in the Gordon Report*
Agricultural Reliance
(BC Agriculture)
Groundwater Quality impacts on base flow
Restricted Groundwater Access
(Steinman, 2007)
Restricted Groundwater Access
(Steinman, 2007)
Price of Groundwater
(City of Abbotsford 2011 general use water utility rate)

Page 18
Sustainability Goal
Brief Description of the Issue
DPSIR Framework Element Considered
Driver Pressure State Impact Response
Good Governance
Creation of awareness of the issues and increased government action with respect to development and implementation of measures to promote infiltration and reduce water use.
Narrative Provided in Detailed Report
Narrative Provided in Detailed Report
Narrative Provided in Detailed Report
Narrative Provided in Detailed Report
Government Action
(various)
Levels of Government with interest in the Aquifer
(Golder 2011)
Identified Lead Agency
(various)
# Municipal supply wells/ # of monitoring wells
(various)
Page 19
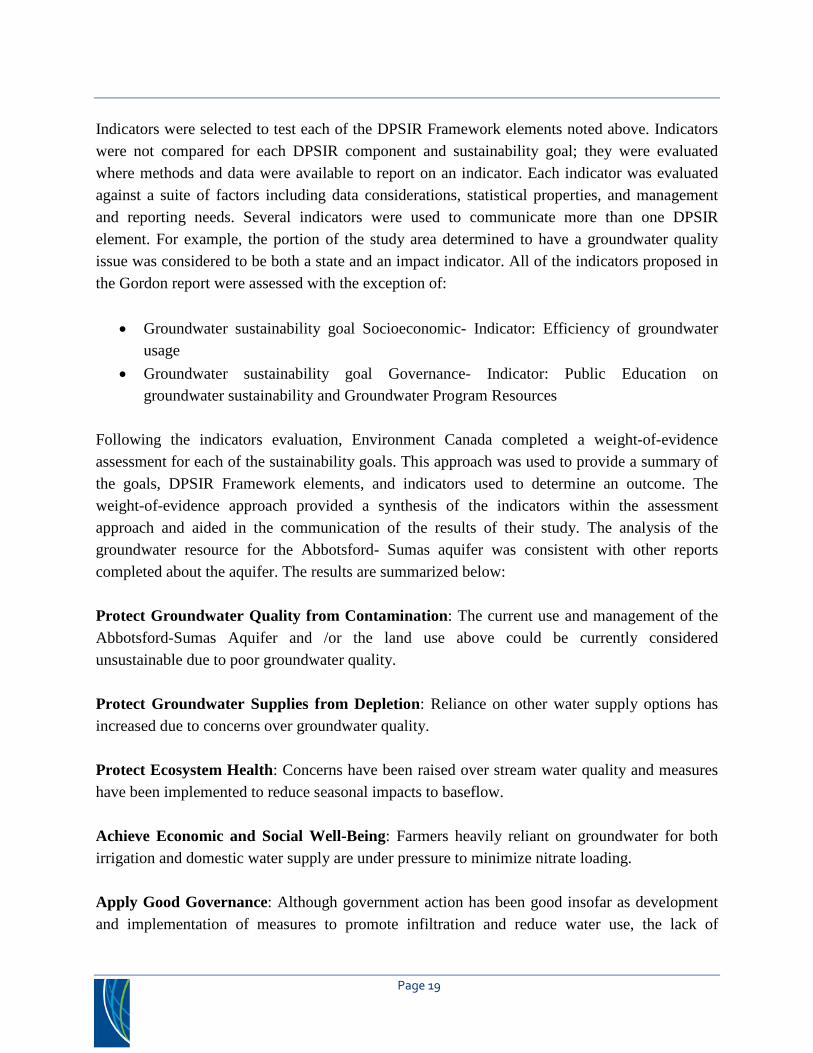
Indicators were selected to test each of the DPSIR Framework elements noted above. Indicators were not compared for each DPSIR component and sustainability goal; they were evaluated where methods and data were available to report on an indicator. Each indicator was evaluated against a suite of factors including data considerations, statistical properties, and management and reporting needs. Several indicators were used to communicate more than one DPSIR element. For example, the portion of the study area determined to have a groundwater quality issue was considered to be both a state and an impact indicator. All of the indicators proposed in the Gordon report were assessed with the exception of:
• Groundwater sustainability goal Socioeconomic- Indicator: Efficiency of groundwaterusage
• Groundwater sustainability goal Governance- Indicator: Public Education ongroundwater sustainability and Groundwater Program Resources
Following the indicators evaluation, Environment Canada completed a weight-of-evidence assessment for each of the sustainability goals. This approach was used to provide a summary of the goals, DPSIR Framework elements, and indicators used to determine an outcome. The weight-of-evidence approach provided a synthesis of the indicators within the assessment approach and aided in the communication of the results of their study. The analysis of the groundwater resource for the Abbotsford- Sumas aquifer was consistent with other reports completed about the aquifer. The results are summarized below:
Protect Groundwater Quality from Contamination: The current use and management of the Abbotsford-Sumas Aquifer and /or the land use above could be currently considered unsustainable due to poor groundwater quality.
Protect Groundwater Supplies from Depletion: Reliance on other water supply options has increased due to concerns over groundwater quality.
Protect Ecosystem Health: Concerns have been raised over stream water quality and measures have been implemented to reduce seasonal impacts to baseflow.
Achieve Economic and Social Well-Being: Farmers heavily reliant on groundwater for both irrigation and domestic water supply are under pressure to minimize nitrate loading.
Apply Good Governance: Although government action has been good insofar as development and implementation of measures to promote infiltration and reduce water use, the lack of
Page 20
governance tools to limit and measure groundwater extraction, and to effectively address non-point source contamination are sources of concern for aquifer sustainability. The completion of the pilot project identified a number of opportunities for additional study or assessment.
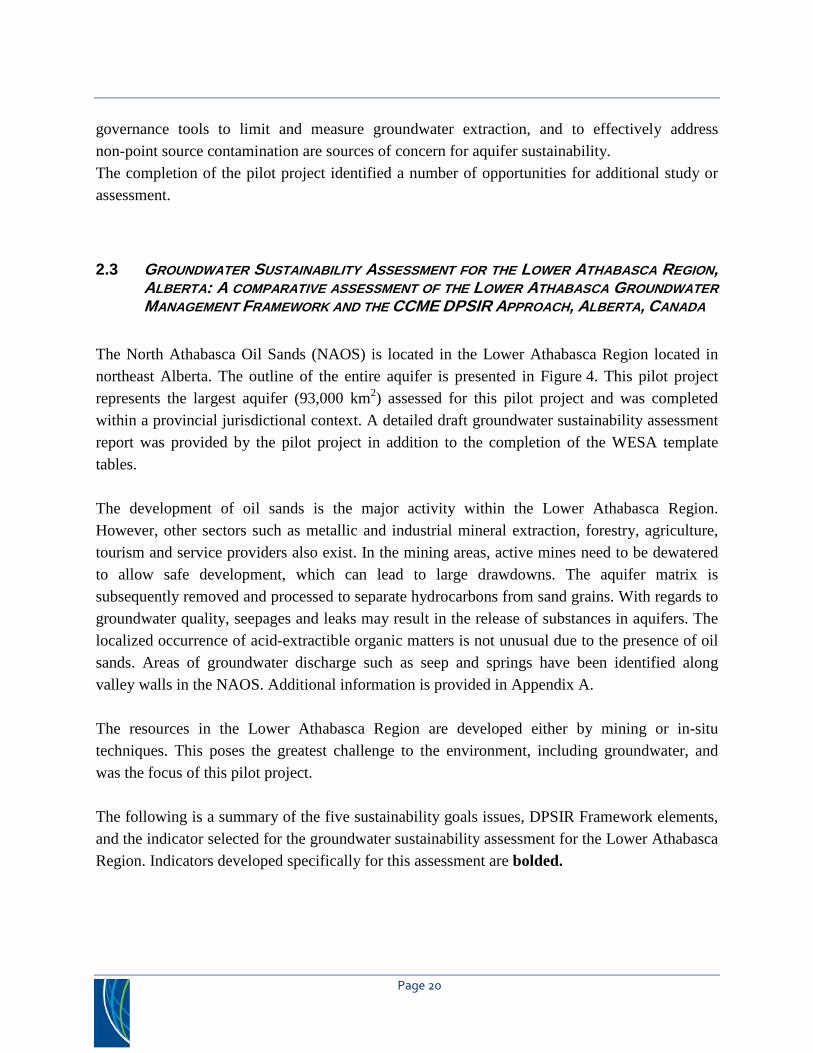
2.3 GROUNDWATER SUSTAINABILITY ASSESSMENT FOR THE LOWER ATHABASCA REGION, ALBERTA: A COMPARATIVE ASSESSMENT OF THE LOWER ATHABASCA GROUNDWATER MANAGEMENT FRAMEWORK AND THE CCME DPSIR APPROACH, ALBERTA, CANADA
The North Athabasca Oil Sands (NAOS) is located in the Lower Athabasca Region located in northeast Alberta. The outline of the entire aquifer is presented in Figure 4. This pilot project represents the largest aquifer (93,000 km2) assessed for this pilot project and was completed within a provincial jurisdictional context. A detailed draft groundwater sustainability assessment report was provided by the pilot project in addition to the completion of the WESA template tables.
The development of oil sands is the major activity within the Lower Athabasca Region. However, other sectors such as metallic and industrial mineral extraction, forestry, agriculture, tourism and service providers also exist. In the mining areas, active mines need to be dewatered to allow safe development, which can lead to large drawdowns. The aquifer matrix is subsequently removed and processed to separate hydrocarbons from sand grains. With regards to groundwater quality, seepages and leaks may result in the release of substances in aquifers. The localized occurrence of acid-extractible organic matters is not unusual due to the presence of oil sands. Areas of groundwater discharge such as seep and springs have been identified along valley walls in the NAOS. Additional information is provided in Appendix A.
The resources in the Lower Athabasca Region are developed either by mining or in-situ techniques. This poses the greatest challenge to the environment, including groundwater, and was the focus of this pilot project.
The following is a summary of the five sustainability goals issues, DPSIR Framework elements, and the indicator selected for the groundwater sustainability assessment for the Lower Athabasca Region. Indicators developed specifically for this assessment are bolded.

Page 21
Table 3: Summary of Pilot Project Sustainability Goals and DPSIR Framework Elements Tested- The Lower Athabasca Region (Bayegnak, 2013)
Sustainability Goal Brief Description of the Issue
DPSIR Framework Element Considered
Driver Pressure State Impact Response*
Groundwater Quantity
Groundwater quantity may be affected by dewatering and the removal of overburden, which increases the rate of leachate release. Further, affects may be noted by the “process” which may release chemicals into the aquifer.
Global Population Growth
Global Energy Demand
Oil Prices
Overall authorized groundwater extraction
Groundwater elevation
Cost of pumping water
*
Number of well damage/ reclaimed/ recompleted due to water level decline
Aquifer compaction
Regional Transmissivity
Land subsidence
Change in groundwater gradient

Page 22
Sustainability Goal Brief Description of the Issue
DPSIR Framework Element Considered
Driver Pressure State Impact Response*
Groundwater Quality
Groundwater quality may be affected by the release or increase of leachate from mining activities to the aquifer.
Number of ongoing development projects
Redox Potential Water suitability for use
Heteroaromatic compounds
Inventory of hypogean community structure
Hydrocarbon compounds
Changes in structure of invertebrates communities
Number of approved development projects
Metals
Decline in groundwater dwelling organism population
Free gas
Penetration of alien cosmopolitan epigean species
Ecosystems Ecosystems that depend on groundwater may be affected including the health of dependant species.
Ecosystem dependence on groundwater

Page 23
Sustainability Goal Brief Description of the Issue
DPSIR Framework Element Considered
Driver Pressure State Impact Response*
Socioeconomic Development within the oil sands generates revenues for the province and country, provides employment and has an impact on the lifestyle of local communities.
Lower Water Levels
Page 24
Sustainability Goal Brief Description of the Issue
DPSIR Framework Element Considered
Driver Pressure State Impact Response*
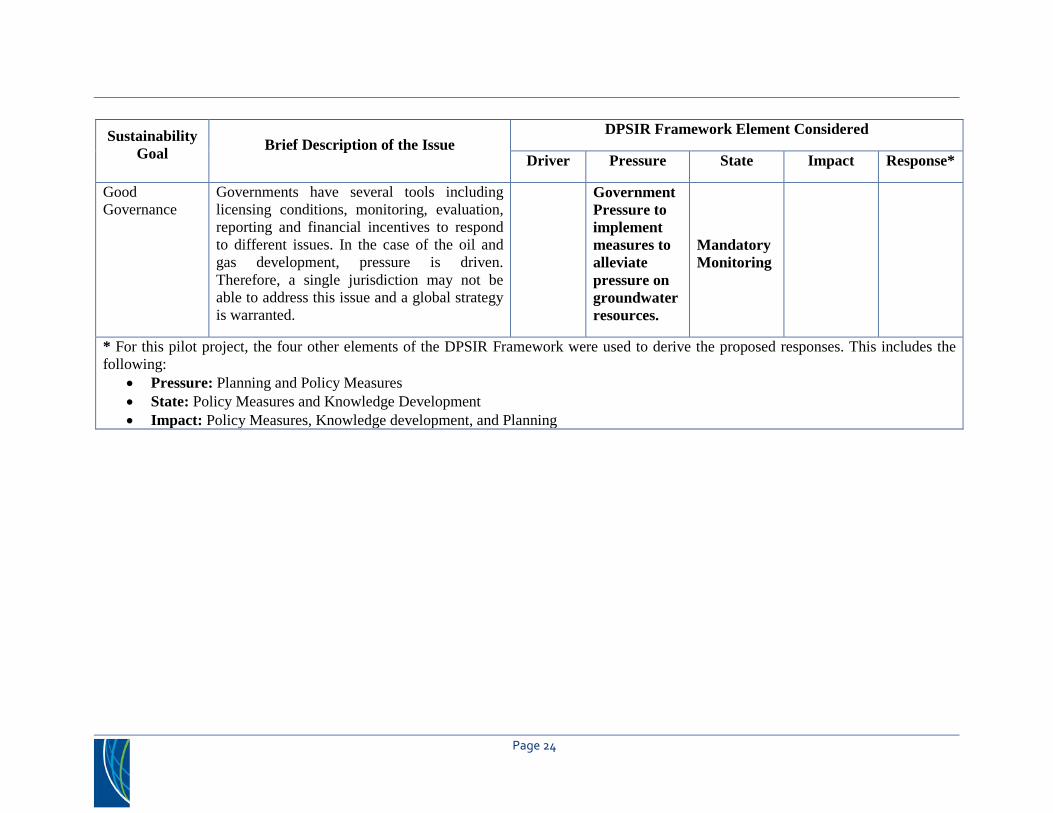
Good Governance
Governments have several tools including licensing conditions, monitoring, evaluation, reporting and financial incentives to respond to different issues. In the case of the oil and gas development, pressure is driven. Therefore, a single jurisdiction may not be able to address this issue and a global strategy is warranted.
Government Pressure to implement measures to alleviate pressure on groundwater resources.
Mandatory Monitoring
* For this pilot project, the four other elements of the DPSIR Framework were used to derive the proposed responses. This includes thefollowing:
• Pressure: Planning and Policy Measures• State: Policy Measures and Knowledge Development• Impact: Policy Measures, Knowledge development, and Planning

Page 25
The pilot project notes that in order to select appropriate indicators, it is important to understand the oil sands development process. This understanding includes how the resource is recovered extracted and processed with respect to groundwater resources. This understanding forms the basis for selecting the DPSIR indicators for the NAOS project.
The assessment provided by the pilot project discussed each element of the DPSIR Framework with respect to the overall issue (oil sands development). This approach allowed the pilot to identify indictors specific to the DPSIR Framework element and not specific to a groundwater sustainability goal. For example, a discussion was provided for the driving force element. After this discussion, a conclusion was made that the NAOS DPSIR Driving Force indicators would be global population growth, global energy consumption and oil prices. This is presented in Table 3 and detailed in Appendix B.
Therefore, this pilot project approached the assessment of the DPSIR Framework with the five sustainability goals differently than the other pilot projects. The five goals were used within the DPSIR Framework (i.e., socioeconomic and governance was discussed under the heading of driving force), and not completed as presented in Table 3. Table 3 was created to aid in the comparison between the pilot projects. This pilot project took advantage of the flexibility of the DPSIR Framework which allowed the assessment to meet the unique requirements of the pilot project. An example of the pilot projects analysis and modification of Table 3 is presented in Table 4.

Page 26
Table 4: Proposed NAOS DPSIR Indicators (Bayegnak, 2013)
Note: Text has been removed from this table in order to provide this example. The reader should contact the pilot project contact for additional information.
Indicators were selected to test each of the DPSIR Framework elements noted above. Indicators were not compared for each DPSIR Framework element and CCA goal; they were evaluated where methods and data were available to report on an indicator, and where an indicator was developed. Several indicators were used to communicate more than one DPSIR Framework element. None of the indicators proposed in the Gordon report were specifically used. Variations of the indicators presented in the Gordon Report and those developed are presented in detail in Appendix B.
DPSIR Framework Driving Force Pressure State Impact
Issue See Table 3 of this report
See Table 3 of this report
See Table 3 of this report
See Table 3 of this report
Indicators See Table 3 of this report
See Table 3 of this report
See Table 3 of this report
See Table 3 of this report
Related CCA Sustainability Goal
Socioeconomic Governance Groundwater Quantity
Governance
Socioeconomics
Groundwater quantity
Ecosystem
Governance Response(1) - Planning
Policy Measures:
Policy Measures Policy Measures
Knowledge development
Planning
Page 27
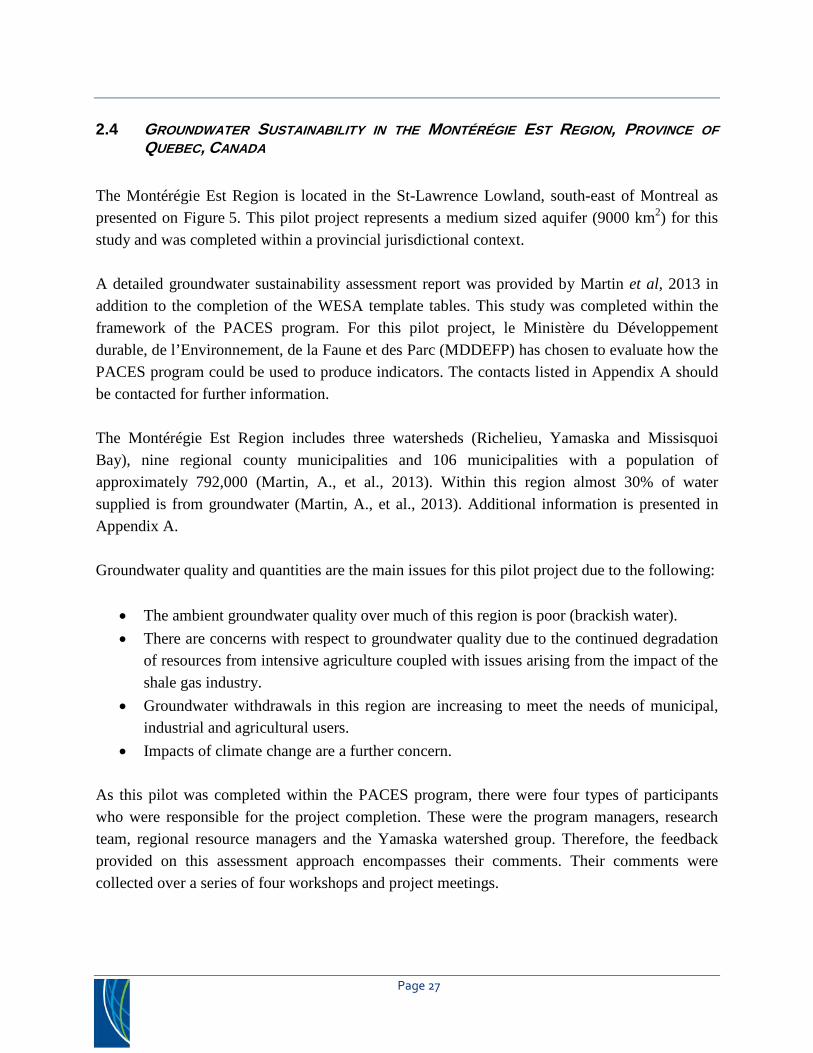
2.4 GROUNDWATER SUSTAINABILITY IN THE MONTÉRÉGIE EST REGION, PROVINCE OFQUEBEC, CANADA
The Montérégie Est Region is located in the St-Lawrence Lowland, south-east of Montreal as presented on Figure 5. This pilot project represents a medium sized aquifer (9000 km2) for this study and was completed within a provincial jurisdictional context.
A detailed groundwater sustainability assessment report was provided by Martin et al, 2013 in addition to the completion of the WESA template tables. This study was completed within the framework of the PACES program. For this pilot project, le Ministère du Développement durable, de l’Environnement, de la Faune et des Parc (MDDEFP) has chosen to evaluate how the PACES program could be used to produce indicators. The contacts listed in Appendix A should be contacted for further information.
The Montérégie Est Region includes three watersheds (Richelieu, Yamaska and Missisquoi Bay), nine regional county municipalities and 106 municipalities with a population of approximately 792,000 (Martin, A., et al., 2013). Within this region almost 30% of water supplied is from groundwater (Martin, A., et al., 2013). Additional information is presented in Appendix A.
Groundwater quality and quantities are the main issues for this pilot project due to the following:
• The ambient groundwater quality over much of this region is poor (brackish water).• There are concerns with respect to groundwater quality due to the continued degradation
of resources from intensive agriculture coupled with issues arising from the impact of theshale gas industry.
• Groundwater withdrawals in this region are increasing to meet the needs of municipal,industrial and agricultural users.
• Impacts of climate change are a further concern.
As this pilot was completed within the PACES program, there were four types of participants who were responsible for the project completion. These were the program managers, research team, regional resource managers and the Yamaska watershed group. Therefore, the feedback provided on this assessment approach encompasses their comments. Their comments were collected over a series of four workshops and project meetings.

Page 28
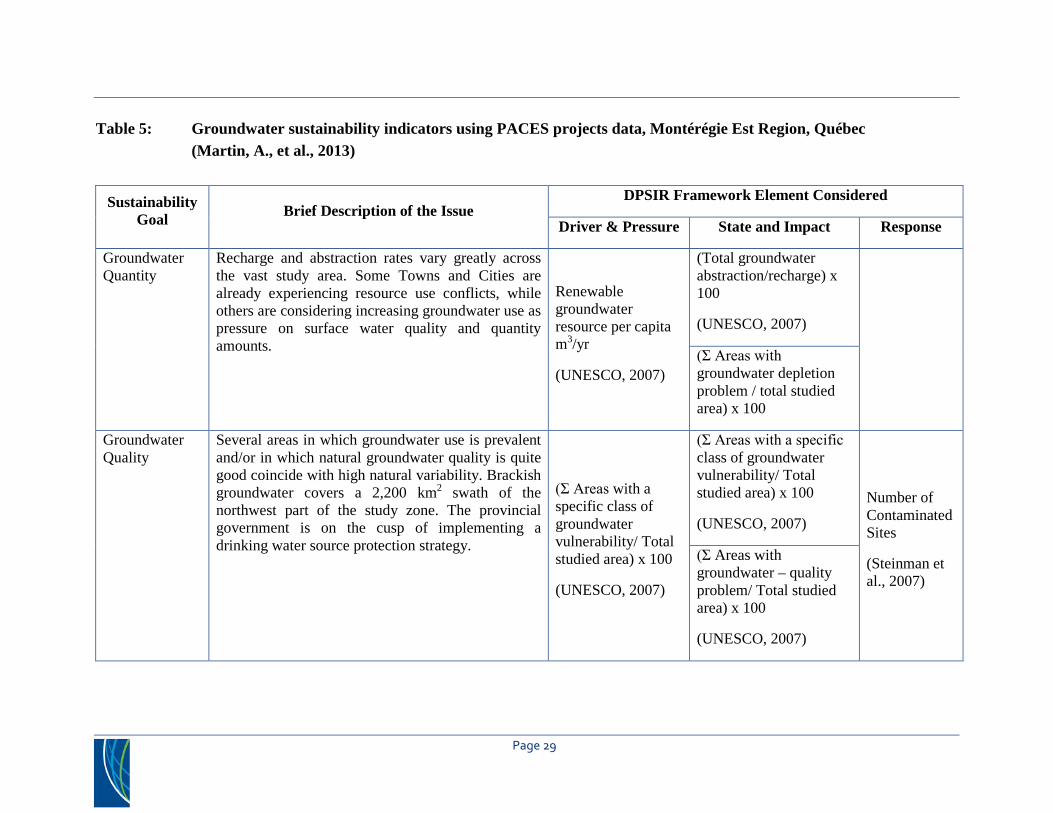
The following (Table 5) is a summary of the five sustainability goals issues, DPSIR Framework elements, and the indicators assessed by the Montérégie Est Region. For the pilot projects assessment, the Driving Force/Pressure, State/Impact DPSIR Framework elements were combined. Therefore, they used the flexibility of the DPSIR Framework to address their pilot projects needs and because the pilot project team thought that the indicators could be grouped to represent the two elements of the DPSIR Framework.
Page 29
Table 5: Groundwater sustainability indicators using PACES projects data, Montérégie Est Region, Québec (Martin, A., et al., 2013)
Sustainability Goal Brief Description of the Issue
DPSIR Framework Element Considered
Driver & Pressure State and Impact Response
Groundwater Quantity
Recharge and abstraction rates vary greatly across the vast study area. Some Towns and Cities are already experiencing resource use conflicts, while others are considering increasing groundwater use as pressure on surface water quality and quantity amounts.
Renewable groundwater resource per capita m3/yr
(UNESCO, 2007)
(Total groundwater abstraction/recharge) x 100
(UNESCO, 2007)
(Σ Areas with groundwater depletion problem / total studied area) x 100
Groundwater Quality
Several areas in which groundwater use is prevalent and/or in which natural groundwater quality is quite good coincide with high natural variability. Brackish groundwater covers a 2,200 km2 swath of the northwest part of the study zone. The provincial government is on the cusp of implementing a drinking water source protection strategy.
(Σ Areas with a specific class of groundwater vulnerability/ Total studied area) x 100
(UNESCO, 2007)
(Σ Areas with a specific class of groundwater vulnerability/ Total studied area) x 100
(UNESCO, 2007)
Number of Contaminated Sites
(Steinman et al., 2007)
(Σ Areas with groundwater – quality problem/ Total studied area) x 100
(UNESCO, 2007)

Page 30
Sustainability Goal Brief Description of the Issue
DPSIR Framework Element Considered
Driver & Pressure State and Impact Response
Ecosystems A complete groundwater flow model was created as part of the PACES. This model locates groundwater discharge zones and will allow resource planners and managers to consider the relationships between groundwater and surface water, and in some cases, groundwater and wetlands. It is expected to be challenging to make use of the indicator(s) associated with this goal, as it is often unclear what flow level is required to ensure ecosystem health and information about changes to base flow are not always readily available.
Groundwater contribution to baseflow
(Steinman, 2007)
Socioeconomic More than half the study zone area is dedicated to farming activities and almost all agricultural producers outside of the area affected by brackish groundwater depend solely or mostly on groundwater. Groundwater is also heavily used in the agri-food business and tourism industry. It is the main source of drinking water in 58% of the towns with a population of less than 5,000 people.
Dependence on groundwater
(UNESCO, 2007)
Efficiency of groundwater Use
(Steinman, 2007)
Restricted Groundwater Access
(Steinman, 2007)
Restricted Groundwater Access
(Steinman, 2007)
Good Governance
Jurisdiction over groundwater management is shared among local, regional, and provincial government bodies. Until recently, however, groundwater knowledge was insufficient to allow resource
Public outreach on groundwater sustainability

Page 31
Sustainability Goal Brief Description of the Issue
DPSIR Framework Element Considered
Driver & Pressure State and Impact Response
management decisions to be integrated into regional sustainable development planning. It is hoped that the PACES ME and the pilot project will create opportunities for education and awareness campaigns, the dissemination of decisions aid tools and heighted collaboration among researchers, managers and users.
(Gordon, 2011)
Groundwater Program Resources
(Gordon, 2011)

Page 32
As presented by the grouping of the DPSIR Framework elements, this pilot project approached the assessment of the DPSIR Framework with the five sustainability goals differently, then the template provided. An example of this analysis is presented in Table 6.
Table 6: Development of indicators for the PACES program- Example (Martin, A., et al., 2013)
Note: Text has been modified from this table in order to provide this example. The reader should contact the pilot project contact for additional information
The focus of the report submitted by the pilot project was a review of the indicators provided in the Gordon Report and not specifically on the DPSIR Framework or five groundwater sustainability goals. Therefore, an analysis of all the example indicators as provided in the Gordon Report was provided (Appendix B).
After their review, the pilot project suggested the development of the following new indicators. It was unclear from the pilot project report provided where they were to be placed within the DPSIR Framework, therefore they are listed below:
• Maximum Development Density- This indicator could assess the density of residentialdevelopment. This indicator could look at the relationship between the maximum densityand current density of an area. This indicator could assess the quantity and qualitysustainability goals.
• Water level- This indicator would provide a review in the change of groundwater levels.This was currently not possible in the region, as these monitors were only recentlyinstalled. This indicator may also aid to develop thresholds for water levels that are lowerthan usual.
• Wetlands and groundwater relationship- This indicator would highlight the impacts onboth from development activities, and may help to determine groundwater quality.
Goal of sustainable management and link with the pilot
project
Issue (s) PACES data linked to the
objective
Driving Force-
Pressure
State-Impact
Potential Responses
Quantity Use e.g. Total Water Use
Population Municipal supply problem
s
New sources of
supply
Page 33
Further recharge could also be determined from this indicator. Wetlands are very important to groundwater recharge and should be protected.
• Influence on climate change on groundwater- An indicator should be developed to flagthe effects to long-term climate change on the availability and quality of groundwater.
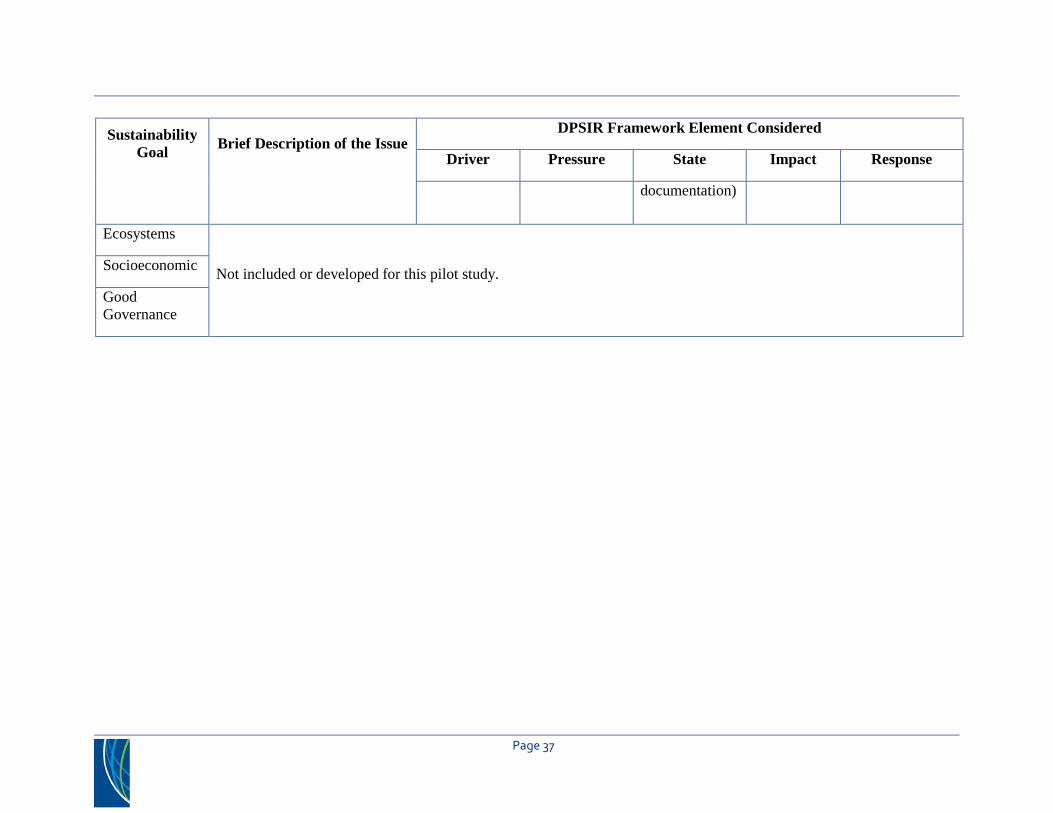
2.5 SUSTAINABILITY OF GROUNDWATER RESOURCES IN SELECTED WATERSHED IN PRINCE EDWARD ISLAND-QUANTITY, QUALITY AND ECOSYSTEM CONSIDERATIONS, PRINCE EDWARD ISLAND, CANADA
Prince Edward Island is located in eastern Atlantic Canada. The province is divided into three counties and approximately 240 different watersheds as presented in Figure 6. This pilot project represents a larger study area (5636 km2) and was completed within a provincial jurisdictional context.
For the purposes of the pilot project, an evaluation was completed for the entire Province and for three selected watershed (Winter River, Wilmot River and Mill River watersheds) across Prince Edward Island. These watersheds represent areas under different quantity and quality stresses. Prince Edward Island has a very thin overburden with an underlying fractured sandstone bedrock aquifer. Therefore, this aquifer is very susceptible to contamination (Department of Environment, Labour and Justice, 2013).
Groundwater quantity and quality are of great importance to the Province. The groundwater users’ rely on this resource as their primary source of fresh water for domestic, municipal and industrial supply. Groundwater supplies almost two thirds of the water flowing in the province’s streams and estuaries (Department of Environment, Labour and Justice, 2013). Therefore, the protection of this resource in important to maintain their health and ensure the survival of aquatic life. An analysis of groundwater sustainability will help to ensure that groundwater can continue to form the basis for healthy islanders, a healthy environment and a productive economy (Department of Environment, Labour and Justice, 2013). As noted by the pilot project, although it is clear that groundwater resources are very important to the province, there is a lack of methodology for measuring, at a high level, the heath of this resource. Therefore, the goal of this project is to complete a groundwater sustainability assessment which has not previously been undertaken in the province. A detailed groundwater sustainability assessment report was provided by The Department of Environment, Labour and Justice in addition to the completion of the WESA template tables.

Page 34
The following is a summary of the five sustainability goals issues, DPSIR Framework elements, and the indicators selected for the assessment. Indicators developed specifically for this assessment are bolded.

Page 35
Table 7: Summary of Pilot Project Sustainability Goals and DPSIR Framework Elements Tested- Prince Edward Island (Department of Environment, Labour and Justice, 2013) (Li, 2013)
Sustainability Goal Brief Description of the Issue
DPSIR Framework Element Considered
Driver Pressure State Impact Response
Groundwater Quantity
Water stress was noted in some of the watersheds due to intensive extraction
Population Increase
(Published statistics data)
Water Use per Capita
(Environment Canada, Municipal Survey)
Water level trend/ change
(provincial long-term monitoring well data)
(Σ Areas with groundwater – qualityproblem/ Total studied area) x 100
(UNESCO, 2007)
Regulations on water use/disposal
(Federal or provincial government)
Urbanization: Urban vs. Rural
(provincial civic address data and others)
Irrigation trend/ irrigation withdrawal
(groundwater extraction permit data)
Percentage of Available water utilized
(extraction data estimated from permitted data and household number/consumption)
Potato crop Trend/ Potato crop acreage
(estimation of
Renewable groundwater resources
(estimated from stream

Page 36
Sustainability Goal Brief Description of the Issue
DPSIR Framework Element Considered
Driver Pressure State Impact Response
crop acreage) baseflow data)
Percentage of areas with stream flow below maintenance flow
Indicators with respect to monitoring of contaminates (e.g., pesticides and Ecolab)
Groundwater Quality
Nitrate contamination in the groundwater supply due to the high acreage of potato farming and nutrient loading.
Potato crop Trend/ Potato crop acreage
(estimation of crop acreage)
Fertilizer Use per acre
(estimation of crop acreage)
(Σ Areas with groundwater – quality problem/ Total studied area) x 100
(UNESCO, 2007)
Salt use on roads
(Provincial, Municipal Data)
Salt concentration in stream base flow
(Federal or provincial
Page 37
Sustainability Goal Brief Description of the Issue
DPSIR Framework Element Considered
Driver Pressure State Impact Response
documentation)
Ecosystems
Not included or developed for this pilot study. Socioeconomic
Good Governance

Not all five sustainability goals were assessed by Prince Edward Island. As noted above, this was the first attempt to analyse groundwater sustainability. This pilot project, in their submitted supplemental report, described their selection of indicators, as presented above, for each element of the DPSIR Framework. A summary is provided below.
As noted by the pilot project, in Prince Edward Island, there are two main driving forces which result in common environmental issues: agricultural activity and urbanization (Department of Environment, Labour and Justice, 2013).
• Pressure indicators were selected to describe activities that use groundwater supplies oractivities which may release contaminants into groundwater (Department ofEnvironment, Labour and Justice, 2013).
• State indicators were selected to describe groundwater in terms of current conditions forboth quantity and quality (Department of Environment, Labour and Justice, 2013).
• Impact indicators were selected to illustrate the effects of changes in groundwatersystems on usage of the groundwater (Department of Environment, Labour and Justice,2013). For example, in Prince Edward Island, nitrate contamination has become a majorconcern for drinking water quality and causes eutrophication in estuaries (Department ofEnvironment, Labour and Justice, 2013).
• Response indicators were selected to capture the responses by groups and individuals insociety. This included a review of government efforts to prevent, compensate, ameliorateor adapt to changes in the state of groundwater (Department of Environment, Labour andJustice, 2013).
In the pilot project, this selection of indicators was completed differently when compared to the other projects. An example of the thought process in which the groundwater sustainability goal quantity was assessed using the DPSIR Framework is presented below.
Page 38

Figure 2: DPSIR Framework for Groundwater Quantity issues caused by Urbanization and Agricultural Activity (Department of Environment, Labour and Justice, 2013)
Therefore, the indicators selected were very specific to the issue of groundwater quality and quantity in Prince Edward Island. The indicators selected did not reflect the examples provided in the Gordon Report. In the review of the pilot, it was assumed by WESA that the indicator (Σ Areas with groundwater – quality problem/ Total studied area) x 100 (UNESCO, 2007) was modified to suit the needs of the project.
Overall, the Prince Edward Island pilot project noted that the DPSIR Framework was found to be well suited for the assessment of groundwater sustainability in Prince Edward Island.
Page 39
2.6 SUMMARY OF PILOT PROJECT RESULTS
Each pilot project presented their assessment of groundwater sustainability and assessment of the proposed approach outlined in the Gordon Report in slightly different ways. Four out of the five pilot projects submitted draft/ final reports to supplement the WESA template tables provided as described in Section 1. This provided a narrative description of the project to help WESA with the collection of data for this analysis.
Although each of the pilots presented their method of assessment in different ways, WESA does not consider one method better than the other. This observation is made based on the review of what was submitted. This includes only three of the five pilot projects presenting a draft or final summary report of their completed groundwater assessment. One of the five pilots only submitted a report based on the review of example indicators. In all three cases where a report was submitted, the pilots were able to determine if the aquifer of interest was sustainable.
Further analysis methods specific to their jurisdiction beyond what was provided in the Gordon Report were used to make an overall conclusion. For example, the Abbotsford- Sumas pilot used a weight-of-evidence approach using the indicators as specific lines of evidence to prove an overall statement of sustainability for the study area (Environment Canada, 2013). This requirement should be further reviewed by WMC.
2.6.1 DPSIR framework elements reviewed
A summary of the DPSIR Framework Elements reviewed by the pilot projects with respect to the groundwater sustainability goals is presented below. A summary of the specific indictors used by the pilot projects is presented in Appendix B.
Page 40

Table 8: Summary of DPSIR Framework Elements Reviewed by the Pilot Projects
DPSIR Framework Element Sustainability
Goal Driving Force Pressure State Impact Response*
Quantity • All pilotprojects
• PrinceEdwardIsland
• MontérégieEst Region
• All pilotprojects
• LowerAthabasca
• Town ofGibsons
• Abbotsford-Sumas
• Town ofGibsons
Quality • PrinceEdwardIsland
• LowerAthabasca
• Town ofGibsons
• Abbotsford-Sumas
• MontérégieEst Region
• PrinceEdwardIsland
• All pilotprojects
• All pilotprojects
• Town ofGibsons
• Abbotsford-Sumas
• MontérégieEst Region
• PrinceEdwardIsland
Ecosystem • LowerAthabasca
• Abbotsford-Sumas
• Town ofGibsons
• Abbotsford-Sumas
• MontérégieEst Region
• Abbotsford-Sumas
• MontérégieEst Region
• LowerAthabasca
*
Socioeconomic • Abbotsford- Sumas
• MontérégieEst Region
• LowerAthabasca
• Abbotsford-Sumas
• MontérégieEst Region
• Town ofGibsons
• LowerAthabasca
• Abbotsford-Sumas
• Abbotsford-Sumas
• LowerAthabasca
• Abbotsford-Sumas
• MontérégieEst Region
Governance • LowerAthabasca
• LowerAthabasca
• LowerAthabasca
• Noindicatordeveloped
• Town ofGibsons
• Abbotsford-Sumas
• MontérégieEst Region
• LowerAthabasca
*The response indicator was assessed by the pilot projects, but not easily formatted into this table.See the assessment completed in Section 2 and 3.2 for additional information.
All of the pilot projects used indicators were developed by the pilot projects and/or presented in the Gordon Report for the following sustainability goals and DPSIR Framework Elements:
Page 41
• Groundwater sustainability goal Quantity- DPSIR Framework elements: Driving Forceand State
• Groundwater sustainability goal Quality- DPSIR Framework elements: State and ImpactNote, that indicators for response were developed outside of this matrix. This assessment was completed for either each of the groundwater sustainability goals or was found to be in a relationship with each of the remaining elements of the DPSIR Framework. Examples of this are presented in Table 4 and Figure 2.
It is assumed that if no indicator was developed for each element of the DPSIR Framework, thought was still given to this process. An example of this thought process was provided by the Environment Canada (2013) pilot project as presented in Figure 1. WESA notes that this lack of the development of the indicators could be a function of the data available, the issue focus of the pilot project or time available to complete the assessment. Further assessment is provided in Section 3.3.
2.6.2 Gordon Report Indicators
All of the Gordon Report example indicators were assessed by at least one pilot project. The following example indicators provided in Table 9 were used by three or more pilot projects in their assessment. A summary of all of the indicators and comments provided by the pilot project contacts is presented in Appendix B. This may be due to the amount of data available for the example indicators or the pilots desire to test them. This is unclear and should be taken into account when reviewing the analysis.
Page 42

Table 9: Summary of the Example Gordon Report Indicators Used by at Least Three or More of the Pilot Projects
Sustainability Goal
DPSIR Framework Element (# of pilots who used this
indicator) Indicator
Quantity
Driving Force (3) Renewable groundwater resource per capita m3/yr (UNESCO, 2007)
State (3) (Total groundwater abstraction/recharge) x 100 (UNESCO, 2007)
Quality
Pressure (3)
(Σ Areas with a specific class of groundwater vulnerability/ Total studied area) x 100 (UNESCO, 2007)
State (3) (Σ Areas with groundwater – quality problem/ Total studied area) x 100 (UNESCO, 2007)
Impact (4) (Σ Areas with groundwater – quality problem/ Total studied area) x 100 (UNESCO, 2007)
Response (3) Number of Contaminated Sites (Steinman et al., 2007)
Ecosystem State (3) Groundwater contribution to baseflow (Steinman, 2007)
Socioeconomic Pressure (3) Restricted Groundwater Access (Steinman, 2007)
Governance No Gordon Report example indicators were selected by three or more pilot projects.
There was not one specific indicator used by all of the pilot projects. However, for the groundwater sustainability goal quality, DPSIR Framework Element State, several of the Gordon Report indicators discussing the areas with a groundwater quality problem was used. This included using the Gordon Report indicator exactly as presented and/or modifying it slightly (e.g., using water quality data to determine application rates and concentrations in base flow) based on the needs of the pilot project’s specific groundwater issue.
Specific comments were made on the above noted indicators as presented in Appendix B. The following is a summary of what was noted by the pilot projects:
Groundwater Quantity- Driving Force Indicator (Renewable groundwater resource per capita m3/year): This indicator is very useful to communicate the important groundwater
Page 43
concerns for future decision makers (Gordon, 2013). Environment Canada (2013) noted that although an interesting indicator, it may not be of interest to Canadian users due to the dependence on alternative drinking water sources. Further, this indicator should take into account the area of usable groundwater as a resource (Martin, A., et al., 2013).
Therefore, WESA concludes that this indicator was not very challenging to quantify and could be useful for future assessments where groundwater is the primary source of drinking water. This indicator should take into account areas, such as the Montérégie Est Region, where brackish water limits the available groundwater for use.
Sustainability Goal Groundwater Quantity- State Indicator ((Total groundwater abstraction/ recharge) x100)): This indicator is useful to help communicate the need to conserve groundwater resources and is helpful to decision makers (Gordon, 2013). This indicator lacks the ability to link groundwater quality with water use (Environment Canada, 2013) (Martin, A., et al., 2013). This comment is similar to the one made above for the Driving Force indicator, where it should be taken into account how much of the aquifer is actually of suitable quality for use. This aspect of the indicator may be hard to determine.
Therefore, WESA concludes that this indicator could be used for further assessments if it is taken into account how much of the aquifer is actually suitable for use.
Sustainability Goal Groundwater Quality- Pressure Indicator ((Σ Areas with a specific class of groundwater vulnerability/ Total studied area) x 100): This indicator provides a communication tool to better inform the public about protecting the aquifer. It could lead to informing planning decisions based on where higher risk activates should be located (Gordon, 2013). It was further noted that aquifer vulnerability is a relative and non-measurable dimensionless property of the aquifer (Environment Canada, 2013). Concerns were raised over the issue of the assessment of vulnerable areas from the perspective of integrated water resource management (Martin, A., et al., 2013).
Therefore, WESA concludes based on the assessment and previous experience that this is a good indictor in order to help with planning decisions based on “science”. For example, this type of assessment has been the main driver for policy development in the Ontario Source Water Protection Program (OMOE, 2011). The pilot’s analysis indicates that there could be concerns with integrated water management. This should be assessed further.
Sustainability Goal Groundwater Quality- State and Impact Indicator ((Σ Areas with groundwater quality problem/ Total studied area) x 100): The Environment Canada (2013) pilot notes that “groundwater quality problem” should be defined. This would allow for
Page 44

comparison between aquifers. This indicator is often easily understood by the public, government and can create public awareness (Department of Environment, Labour and Justice, 2013). Concerns were raised on how this indictor would fit into an integrated water resource management model (Martin, A., et al., 2013). Further, this indicator may not reflect subtle changes in one monitoring location (Gordon, 2013).
Although only three of the five pilot projects used this indicator directly, indirectly four of the five pilots used this indictor by modifying it slightly. The only case where this indicator was not used was in the Town of Gibson’s pilot project for the state element of DPSIR, as groundwater quality in this area is not a concern to date. Therefore, WESA concludes this is a good indicator to determine the state of groundwater quality and should be used in future assessments.
Sustainability Goal Groundwater Quality- Response Indicator (Number of Contaminated Sites): This indicator may not be useful in locations where the municipality (or user of the assessment approach) does not have the jurisdiction over contaminated sites (Gordon, 2013). If this indicator was to be used in the future, it should be represented as a fraction of the total area (e.g., areal extent of the aquifer) (Environment Canada, 2013). This indictor could incorporate potentially polluting activities and assess these based on the potential for contamination (Martin, A., et al., 2013).
From the assessment provided, WESA was unable to determine if this was a good indicator or not for the state of groundwater quality. The largest factor would be the availability of information if the sites exist, as well as, being able to access future information if the sites have been remediated.
Sustainability Goal Ecosystems- State Indicator (Groundwater contribution to baseflow): Baseflow is critically important to species that rely on it in groundwater fed streams (Environment Canada, 2013) (Gordon, 2013). Limitations exist with the availability of data and could be presented as an average of the total flow, therefore allowing comparisons to be made (Martin, A., et al., 2013).
WESA agrees that this information is critical to determine if species in groundwater fed streams and rivers are affected. If the data is available, this would be a good indicator to pursue.
Sustainability Goal Socioeconomic- Pressure Indicator (Restricted Groundwater Access): Of the three pilots who used this indicator, only one provided any specific analysis. The analysis noted that restrictions would indicate problems in the protection, use and management of groundwater resources (Environment Canada, 2013).
Page 45

There was not enough information presented for WESA to draw any conclusions.
For the remaining Gordon Report example indicators, there was not enough information presented by the pilot projects for WESA to provide a comparison. Therefore, it was not possible for WESA to draw out any further conclusions specific to the Gordon Report indicators.
A general analysis of the groundwater sustainability goals, DPSIR Framework and indicators are presented in Sections 3 and 4. A compilation of the indicator analysis provided by the pilot projects contacts is presented in Appendix B.
3.0 ANALYSIS OF THE ASSESSMENT APPROACH
All pilot projects were challenged with more than one groundwater sustainability issue. These issues provided the driver necessary to complete the thought process framed by the DPSIR Framework. The DPSIR Framework then allowed for the development of indicators that were in most cases specific to the groundwater issue. With the exception of one pilot project, the example indicators were used in some capacity to complete this assessment. The assessment approach provided each of the pilot projects with a common framework to assess the sustainability of the groundwater resource.
WESA provided the pilot projects with a template to aid in the collection of data for this assessment. Aspects of the template were used by the all of pilot projects and, in some cases, were modified to meet their specific needs as presented in Section 2. The tables provided in Section 2 of this report reflect one of the templates provided to the pilot projects for the collection of data. During discussions with the pilot projects contacts, it was noted that the DPSIR Framework could be presented graphically. Appendix B provides three examples. Both the tables and graphics included in this report are potential tools to support jurisdictional use of the assessment approach.
The following is an analysis of each of the three main elements of the assessment approach as outlined in the Gordon Report.
3.1 Groundwater Sustainability Goals
The groundwater sustainability goals outlined in the Gordon Report were selected from the Council of Canadian Academies 2009 report. The goals provided a method to identify the science needed to evaluate groundwater sustainability (CCA, 2009). Further, an evaluation against these goals helped to facilitate the identification of science needs. For example, the
Page 46
Abbotsford-Sumas pilot project assessed environmental conditions relative to each sustainability goal.
The five groundwater sustainably goals were analysed by each of the pilot projects. A written assessment of each of the groundwater sustainability goals was completed by each of the pilot projects with the exception of Prince Edward Island. This was not completed for Prince Edward Island as the last three sustainability goals (ecosystems, socioeconomic and governance) was not the current focus of their studies, however they may be assessed at a later date. Where complete, each pilot was able to identify a key issue for each of the goals. This suggests that the five groundwater sustainability goals are relatable to a variety of groundwater management issues in Canada and provide a framework for the analysis of groundwater sustainability.
The Gordon Report notes that the five sustainability goals should be considered as a whole in order to fully understand groundwater sustainability. It is worthwhile to use some of the goals for those jurisdictions that do not have the capacity or resources to assess all five goals. For example, for Prince Edward Island, is a partial assessment still useful or will it influence the overall result? Or, is this a governance issue, meaning, that current groundwater management is not complete and sustainable. In the case of Prince Edward Island, it was noted by the pilot project contact that this was the first time this type of assessment has been undertaken and was very useful to determine what next steps are required. Therefore, WESA concludes that even if a groundwater assessment has never been initiated before, a review of the groundwater suitability goals is a useful exercise.
For the pilot projects that completed their assessment (i.e. provided a written report), all five sustainability goals were addressed and were important in their final analysis of groundwater sustainability. The pilot projects were selected due to the range of scales across a variety of jurisdictions to test this aspect of the assessment approach. For example, the pilot project was completed for the smaller aquifer located in the Town of Gibsons, a transboundary aquifer in Alberta and the entire province of Prince Edward Island. From the completion of the pilot projects it can be concluded that the goals can be applied across Canada at a different range of scales.
3.2 DPSIR Framework
The DPSIR Framework contains five elements (as described in Section 1). These elements create a feedback management loop to describe and analyze environmental concerns (Gordon, 2011). A summary of which elements of the DPSIR Framework was assessed by each of the pilots is presented in Section 2.
Page 47
The DPSIR Framework itself provides a logical method to select indicators by describing the groundwater system with respect to a specific issue. This model is a method to organize information in a way that describes the relationships between causes and consequences of sustainable groundwater management challenges (Environment Canada, 2013). Further, the DPSIR Framework allows the development of scientifically credible indicators to help decision makers evaluate the potential stress on a groundwater system (Bayegnak, 2013).This analysis could be presented in a narrative, tabular or graphical format. Examples of graphical formats are presented in Figure 1 (Environment Canada Example), Figure 2 (Prince Edward Island Example) and Appendix C (WESA template).
The analysis helps to identify where efforts should be focused and how to communicate the issues to water managers. The benefit of the DPSIR Framework is that aids in the simplification of complex issues and ensures the user reflect on a variety of issues. It could also be argued that a more holistic, systems-based approach is needed rather than focusing on one element in particular. As the sustainable management of groundwater is very complex, it was noted by the pilot projects that the DPSIR Framework alone does not clearly answer the groundwater sustainability question and cannot be used as the only tool for evaluating groundwater sustainability. It was noted by Abbotsford- Sumas pilot project contact in their review of WESA’s draft assessment report that the response element of the DPSIR Framework was a challenge for all pilot projects to assess, especially quantitatively.
The pilot projects noted that framing the groundwater issues/ indicators into the DPSIR Framework itself can be complex and challenging (Department of Environment, Labour and Justice, 2013) (Environment Canada, 2013) (Martin, A., et al., 2013). For example, more than one indicator can be used for more than one DPSIR element and some indicators do not seem to always belong where they may be intuitively assigned.
Also, the placement of indicators was subjective even with the definitions provided. This was pointed out by the review of the draft assessment report where pilot project contacts noted that in some cases the indicators presented did not follow their interpretation of the definitions of each DPSIR Framework element. This is presented in Appendix B. This could be influenced by a variety of indicators which are affecting each other and contributing to sustainable groundwater management as a whole. Further the selection of indicators can be influenced by the user’s interpretation of the DPSIR Framework element definitions. For example, the Prince Edward Island pilot project noted,
“… the assignment of the indicators for the number of wells with E. coli and the number of wells with nitrate above 10 mg N/L. Both of these first appear to be a
Page 48
state indicator as they are directly related to water quality. Upon reflection, E. coli detection in wells requires the knowledge of the causes to understand that it is a result of infrastructure status and thus a response indicator for infrastructure. Likewise, the number of wells with nitrate above 10 mg N/L is better utilized as a reflection of the well owners that must adapt to nitrate concentration in some way. Therefore, it is better considered an impact indicator instead of a state indicator. These examples illustrate that care must be taken when choosing indicators for the components of the DPSIR [Framework]. (Department of Environment, Labour and Justice, 2013)”
Therefore, WESA concludes that where the DPSIR Framework is not well understood, time did not allow for the full assessment of the DPSIR Framework, or there was no perceived need to review each element of the DPSIR Framework, there could be issues with assigning indicators for each of the five DPSIR elements. The Montérégie Est Region pilot project noted that taking into account the sustainability goals, DPSIR Framework, and indicators seemed to complicate the approach (Martin, A., et al., 2013).
When the DPSIR Framework is coupled with indicators, the method becomes hard for the user to understand and correlate the necessary data requirements. This could be a function of the indicators presented in the Gordon Report. Also, it could be function of the understanding of the relationships between the five DPSIR elements, and/or the many factors contributing to sustainable groundwater management as a whole. For example, pilot projects modified the approach to better reflect this relationship within the groundwater sustainability goals (Bayegnak, 2013) (Department of Environment, Labour and Justice, 2013) (Martin, A., et al., 2013).
One pilot project noted that the DPSIR Framework should be complimented with a way to identify baseline conditions and policy targets/objectives (Bayegnak, 2013). It was suggested to include statistical tools to distinguish between variation in process resulting from common causes and variation resulting from special causes. Further, trend analysis would provide an assessment in the direction and rate of indicator change.
Overall, using the DPSIR Framework is complementary to the groundwater sustainability goals and can be useful in the development of sustainability indicators. It is a method to facilitate the wide assessment of issues covering aspects of human activity that have an impact on groundwater resources, the impacts that cause the issue, and determines whether there are measures in place to guard against further impacts or restore damages that have taken place (Department of Environment, Labour and Justice, 2013). It provides a method to communicate
Page 49
the issue to water managers. For example, it could be used as a consistent method to prepare for an assessment of groundwater sustainability but not the sustainability analysis itself.
There was not one groundwater sustainability goal where the DPSIR Framework was well presented. WESA concludes that this maybe a function of the users understanding of the sustainability goal/ model or that the Framework was not relevant for the pilot project. For example, if the user of the assessment approach is not familiar with indicators for Governance, it may be difficult for them to assess this groundwater sustainability goal using the DPSIR Framework.
Therefore, the DPSIR Framework is a method to understand how different elements/issues/factors are inter-related and can support the assessment of sustainable groundwater management. It was difficult for the pilot projects to determine a single response indicator that is relevant, available and acceptable for all elements of the DPSIR Framework.
3.3 Groundwater Sustainability Indicators
The summary of indicators used in the assessment of groundwater sustainability and the analysis of these indicators completed by the pilot projects are presented in Appendix B.
The pilot projects used a variety of the indicators; both proposed by the Gordon Report and/or developed ones based on the needs of their projects. Incorporation of additional indicators was necessary to reflect the local issues.
The only common Gordon Report indicator used by all of the pilot projects was for groundwater quality (the assessment of groundwater quality problem/ the total studied area). No indicators were presented in the Gordon Report or produced by the pilot projects for the DPSIR Framework Elements noted in Table 8. It should be noted that although no specific indicator was identified, a narrative was provided by the Abbotsford-Sumas pilot project. Further, WESA assumes that these elements of the DPSIR Framework were discussed during the completion of the pilot project. For example, once pressure is applied to a groundwater system, it can also be applied to the ecosystem. If this groundwater is contaminated then the dependant ecosystem would maybe also be contaminated. This could be determined by indicators that assess the state of an ecosystem. Therefore, even though the indicators were not specifically developed for the DPSIR Framework element, there is still a relationship between the indicators and may not need to be explicitly presented.
WESA concludes that in some cases, indicators were not developed as they were not necessary for completion of the analysis of groundwater sustainability, not a priority item of discussion, or
Page 50
the data did not exist for the development of specific indicators. Further, this may be because there was no reason to have indicators for all the groundwater sustainability goals and DPSIR Framework elements. This should be discussed further with the pilot projects.
Further, it was noted by the Montérégie Est Region pilot project that a discussion of groundwater management issues with stakeholders and the public often allows for a clear description of which indicators could be selected with a specific set of reference conditions and targets in mind. This is emphasized by the lessons learned from the Abbotsford Sumas pilot project discussed in Section 3.4.
WESA determined that there are two main issues noted in the pilot projects analysis of indicators. WESA notes that it would be challenging for one agency to collect, analyze, and maintain the data necessary for the completion of a scientific analysis To determine groundwater sustainability, it is important to have historical data, or the ability to compare data over time to assess sustainability. For example, one pilot project argues that the indicators themselves are not a measure of sustainability and that indicators must be pre-defined based on a set of relative baseline conditions or other policy target values (Bayegnak, 2013). These policy target values can be developed using a variety of statistical tools including control charting (a statistical tool to distinguish between various in process resulting from common causes and various resulting from special causes) (Bayegnak, 2013).
The use of baseline conditions would then allow for comparison of the data over time. This would require maintenance of the data and continual updates when new data is made available, if it is assumed that this assessment is not a “snapshot in time” but should be updated as new information is available. Therefore, the ability to report on groundwater sustainability through indicators depends strongly on the degree of available methods and data (Environment Canada, 2013). For example, the Prince Edward Island project noted that an indicator could be envisaged for a DPSIR Framework element; however there is inadequate data to utilize it at this time (Department of Environment, Labour and Justice, 2013). This was noted by the pilot project as a flaw with the model. However, it seems that there are still a sufficient number of situations where data is available.
The Gordon Report cautioned that the dependence on data for indicator development can lead to situations where data availability directs the selection of indicators and in turn reinforces the collection of the same data (UNESCO, 2007) (Gordon, 2011).
Further, the Prince Edward Island pilot noted that the implementation of the model requires a significant understanding of the jurisdiction and issues (Department of Environment, Labour and
Page 51

Justice, 2013). Environment Canada (2013) notes that the ability to report on groundwater sustainability using the indicators depends strongly on the availability of data and methods to complete this assessment. This will allow for the user to develop indicators that are relevant to the groundwater situation in the specific jurisdiction. Also, this would provide the necessary information to assess all aspects of the DPSIR Framework.
To overcome this challenge, WESA determines there is a greater need for the sharing of groundwater data among parties who have an interest in aquifer sustainability. This was also highlighted in the comments provided on the draft assessment report by the Abbotsford-Sumas pilot project contacts. Further, to assess all five groundwater sustainability goals, it may be necessary to develop a team or network of experts to provide the necessary input for this assessment. This may help to elevate some of the financial and staffing stresses. WESA’s past experience with groundwater sustainability assessments and water resources management strategies has indicated that this collaboration of effort often is successful in overcoming some of the outlined challenges.
WESA concludes that the example indicators, as outlined in the Gordon Report, could not be used alone to assess groundwater sustainability Stakeholder input is required to address local issues and should drive the selection of indicators used for the assessment of groundwater sustainability. For example, if nitrate concentrations or oil sands development are the main issue and driver of the issue then the indicators selected would reflect this issue. The examples provided by the Gordon Report could be modified to allow for this flexibility and be supplemented with additional indicators which reflect local conditions. This modification was completed by all of the pilot projects.
Further, indicators should be selected based on the project framework and/or policy target goals and/or outcomes in addition to those presented in the Gordon Report. This would allow for the development of indicators which would reflect the direction of the project and provide meaningful data to all stakeholders involved. The majority of the pilot projects did this by developing their own indicators as summarized in Appendix B. The indictors that were developed addressed local issues based on the appropriate scale of the investigation. An important aspect to remember in the selection of indicators is to ensure that the results can be communicated to stakeholders, water managers and the public. If the indicators are based on the local issue(s), the results become more meaningful and easier to communicate.
The indicators developed through the DPSIR Framework are dependent on the groundwater sustainability goals and which components of the study are being addressed. Therefore, there may be indicator gaps. The Abbotsford-Sumas pilot suggests that these gaps be filled with
Page 52

narrative descriptions and supplementary data. In their assessment, this was completed by the creation of a supplemental report and graphical flow model of the process (Figure 1).
The examples indicators provided in the Gordon Report provided a solid basis for the preliminary assessment. This was noted by the project completed in PEI, where this was in essence the first time they have completed this type of assessment. Therefore, it can be concluded that they provide a good starting point. However, an in-depth analysis is required if more details are required.
Appendix B provides a review and comments on each of the Gordon Report example indicators. There were varying degrees of comments provided. No one indicator was presumed to be inappropriate for this assessment; however, a few were noted to be more appropriate for different elements of the DPSIR Framework as highlighted in Section 2.6.
The following key comments were provided by the pilot projects regarding the indicators or noted while completing the review of the submitted reports. Additional comments are provided in Appendix B.
• Environment Canada (2013) notes that the state indicator (number of contaminated sites)as proposed in the Gordon Report provides no insight into the areal extent or the volumeof contaminated soil or groundwater in relation to the aquifer as a whole. This indicator isokay to be used for a “first cut” screening tool. It is recommended that this indicator bemodified to include the overall areal extend of the aquifer (i.e., number of contaminatedsites/areal extent of the aquifer= #.## site/km2).
• Environment Canada (2013) notes that the state and impact indicator with respect to areaswith groundwater depletion should be assessed using long-term monitoring data to ensurethat temporal and climatic variability is accounted for.
• Prince Edward Island in their assessment used the indicator, (Σ Areas with groundwater –quality problem/ Total studied area) x 100 (UNESCO, 2007) for both sustainability goalsQuantity and Quality.
• It was noted by Prince Edward Island that it was difficult to find an indicator for theDPSIR Framework element of impact due to the current data limitations of the pilotproject. In groundwater quantity, the same challenge was encountered; it was difficult tofind an indicator for the DPSIR Framework pressure element (Li, 2013).
• The Lower Athabasca project chose the “SMART” criteria to evaluate the indicators inconjunction with using the DPSIR Framework to derive credible indicators.
Page 53
• The Montérégie Est Region pilot project noted that several of the indicators provided inthe Gordon Report could be considered as an indicator for more than one element of theDPSIR Framework (Martin, A., et al., 2013).
WESA notes that the response element of the DPSIR framework was often developed by the indicators themselves. This was noted in three of the five pilots completed, where the development of this indicator did not fit exactly into the template and was modified to suit the needs of the project.
3.4 Lessons Learned by the Pilot Projects
The pilot projects were asked by WESA to provide lessons learned. A summary is provided below based on the information submitted to WESA and the review completed of the submitted reports by the pilot projects. No comments were received from the Town of Gibsons pilot project contacts.
Abbotsford- Sumas (personal communication A, 2013) • Interagency Cooperation Supports Data Access – To meet mandates and responsibilities,
many agencies collect and manage data related to groundwater management. Therefore,information sharing and communication between these agencies is necessary to enablethe assessment of groundwater indicators. This process could be defined with broad,long-term information sharing agreements that could improve groundwater management.Accessing the data for each of the indicators required a good understanding of thegovernance structure for groundwater management and healthy cooperative interagencyrelationships.
• Integrating the Information – In the presentation of indicators, the DPSIR framework ishelpful in identifying opportunities for responses to a specific set of drivers andpressures. However, it should be noted that the DPSIR framework is intended toconceptualize causal linkages. Often correlative rather than causal relationships aredescribed in this study’s application of DPSIR as the complex mechanisms betweenDPSIR components are not well understood. For instance, the relative influences ofintense agriculture, manure management practices and low biogeochemicaltransformation of nitrate on the areal extent of nitrate contamination are unknown and thebalance of responses rather than separate actions are expected to contribute to sustainablegroundwater management overall. Organizing the DPSIR information according togroundwater sustainability goals increases focus on the specific issue challengingsustainability. Further communication of indicators through a weight of evidence
Page 54
approach on the primary challenges to groundwater sustainability supports a more direct consideration of the issues than disparate streams of data.
• Supplemental Information and Data Gaps – Indicators are reported among all DPSIRcomponents in this study. However, depending on the groundwater sustainability goal towhich they are relevant, there are indicator gaps that are filled by narrative descriptionsand supplementary data. The importance of continued data availability to characterize theprimary issue of nitrate contamination in the Abbotsford-Sumas Aquifer must beunderscored. The value of indicators increases with the time span over which they aremaintained because it is difficult to detect and interpret trends in components of theenvironment and to know whether variations fall outside the “normal” range withoutlong-term data. Data gaps can contribute to higher levels of uncertainty for riskmanagement decisions.
Lower Athabasca (personal communication B, 2013) • The notion of groundwater sustainability is a place-based issue.• The DPSIR Framework provides a very good high level functional scheme to describe
cause-effect relationship between various sector of human activity and the environmentas a causal chain of links. It helps think logically, however, the DPSIR Framework initself does not or may not help identify or select indicators.
• Every single component of the DPSIR Framework needed a complementary approach,rooted in science and stakeholders’ involvement, to help select the appropriate indicators.
• The DPSIR Framework was not conceived specifically for groundwater sustainability,and therefore has to be (re)adapted to fit groundwater/aquifer environment.
• It appears that initiating the DSPSIR Framework based on the sustainability goals wasnot a logical start. However, the sustainability goals were a good way to classifysustainability components affected at various stage of the DPSIR Framework. Therefore,this pilot project arrived at the conclusion that, in ideal circumstances, the groundwaterissues, and specific set of desired conditions must be established first, taking into accountthe social, economic, environmental, and possible tradeoff local reality. This was referredto this as policy target value (PTV).
• Groundwater may be affected by systemic (global) causes upon which affectedjurisdictions may have little control. Such causes require concerted effort to address.
• Typically it has been difficult to land on a single response (thus response indicator) that isaltogether relevant, available and acceptable. More often than not, societal responses area combination of more than one application.
Page 55
Montérégie Est Region (Martin, A., et al., 2013) • The DPSIR Framework was useful for developing the approach and could be used in the
future as a method to prepare for a uniform method of the assessment of groundwatersustainability, but not part of the method presented to local managers.
Prince Edward Island (Department of Environment, Labour and Justice, 2013). • Some of the example indicators presented in the Gordon Report do not always belong
where they might first be intuitively assigned with respect to the DPSIR Frameworkelement and/ or sustainability goal.
• There are a number of cases where an indicator is envisaged but there is inadequate datato utilize it. However, there seems to be a sufficient number of situations where data isavailable that the assessment model can largely be implemented. In addition, there are afew cases where gathering data may be feasible for future iterations of this assessmentapproach.
• A significant observation of the assessment approach is that it requires the user to selectindicators that are relevant to the groundwater situation in the location being assessed. Inorder to implement the assessment approach, a significant understanding of thegroundwater situation in a jurisdiction is required.
• A key feature of the DPSIR Framework is that it facilitates a wide assessment of issuescovering aspects of human activity that degrade or over utilize groundwater resources,the impacts that they cause and whether there are measures in place to guard againstfuture contamination, as well as, restore already degraded situations. The DPSIRFramework can help to identify problems, and analyze the extent of natural processes andhuman impacts on groundwater system in space and time, and also help in assessment ofthe effectiveness of the responses to improve groundwater resource quantity and quality.
Overall, WESA observed that the greater lessons learned about the groundwater sustainability of the aquifer studied were found for the pilot projects that did not have a history of this type of analysis. For example the Town of Gibsons, Prince Edward Island and Montérégie Est Region found that this process will aid in determining the focus of future studies and assessments.
3.5 Summary of Analysis of the Assessment Approach
The following is a summary of the analysis of the assessment completed above. Specific recommendations are presented in Section 4 of this report.
• The five sustainability goals provide the framework necessary for the assessment ofgroundwater sustainability. In all cases but one, all five goals were assessed by the pilot
Page 56
projects. The goals provide a common framework for the comparison of projects and can be applied in a variety of situations across a variety of different scales. This was indicated by the completion of the pilot projects selected to test this aspect of the approach.
• The Lower Athabasca pilot project noted that caution should be taken that the notion ofsustainability is a societal issue. Therefore, what one region may consider sustainablemay not be considered suitable in another region (Bayegnak, 2013).
• The DPSIR Framework is an easy concept to understand and follows a logical approach.This was an important step for each of the pilot projects and it forced the pilot projects tolink policy and socioeconomics to traditional science. However, by itself the DPSIRFramework is not an evaluation of groundwater sustainability (Bayegnak, 2013) (Martin,A., et al., 2013). Therefore, it could be used in the preparation of a uniform method forassessing groundwater sustainability.
• The indicators suggested in the Gordon Report were applicable to many of the pilotprojects but could not be used entirely on their own for the assessment of groundwatersustainability. The pilot projects discussed the need for indicators to reflect localconditions, requirements, issues and access to data. These indicators should be developedwithin the outlined project framework and/or project goals. Consultation withstakeholders is important to the development process as it will ensure that the indicatorsselected are able to communicate the results to the public.
• The cost of developing, implementing, obtaining and maintaining the data required forthe indicators is a barrier to the approach. Therefore, data management requirements arenot operationally simple (Environment Canada, 2013). Before indicators are selected, it isimportant to ensure that there is capacity to maintain the data over time to meet theindividual sustainability management needs. This could include developing relationshipswith stakeholders to improved data sharing methods.
• Indicator gaps maybe filled with narrative descriptions and supplementary data aspresented in the Environment Canada example in Figure 1.
• The Gordon Report suggested indicators for each of the Groundwater Sustainabilitygoals. However, indicators were not presented for each element of the DPSIR Frameworkelements. In order to help guide this process for future users it would be useful to haveexample indicators for each DPSIR Framework element or allow for a qualitativeassessment to be included as part of the process.
• No specific indicator was developed for the groundwater sustainability goal goodgovernance, DPSIR Framework element impact. However, it was discussed as part of theoverall assessment approach by selected pilot projects (Bayegnak, 2013) (EnvironmentCanada, 2013).
• The pilot projects provided an assessment of the Gordon Report indicators. WESAreviewed the indicators where three or more pilots provided comment. In this review it
Page 57

was determined that where three or more pilots used a common indicator that these should be provided to future users to aid in their assessment approach. It should be noted, that the remainder of the indicators could still be used, however, there was insufficient detail provided to WESA to provide an analysis.
• The preliminary assessment approach was applied by all five pilot projects. Each took aslightly different approach to their analysis, thereby adapting the approach to theirindividual needs. This flexibility is an important observation as it indicates theassessment approach can be applied across Canada on a variety of different scales. Ifpursed further, it will be important to provide direction on how to complete the analysisand provide the necessary tools/ direction to do so.
• There was not one groundwater sustainability goal where the DPSIR Framework waswell presented. WESA assumes that this is more of a function of the users understandingof the sustainability goal, time allotted for the completion of this assessment, or desire toinvestigate/ discuss each of the sustainability goals.
• Further analysis methods specific to their jurisdiction beyond what was provided in theGordon Report were used to make an overall conclusion. This requirement should befurther reviewed by the WMC.
3.5.1 Data Considerations, Gaps and Uncertainty Provided by the Pilot Projects
The pilot projects were asked to provide information on their data considerations, gaps and uncertainty while completing their analysis. The following information was extracted from the WESA template completed by the pilot projects. Where data gaps exist, this can contribute to higher levels of uncertainty in making risk management decisions (Environment Canada, 2013). The following is a summary of their comments, with respect to data gaps noted within their studies, and not directly related to the overall assessment approach.
Town of Gibsons (Gordon, 2013) • Uncertainties were noted with respect to vulnerability mapping and assessment. These
would be discussed in a report. This assessment may include recommended actions toreduce them.
• The values calculated by the indicators are dependent on the adequacy of the monitoringprogram.
Abbotsford- Sumas Aquifer (Environment Canada, 2013) • As the indicators were assessed for current circumstances, they would not reflect temporal
changes. These temporal changes may provide an improved assessment of groundwatersustainability.
Page 58

• Considerations could be made to include the various layers of an aquifer. For example,assessments of the nitrate concentrations in this study were completed regardless of welldepth. Further, it may be necessary to determine impacts from upstream and surface waterrunoff.
• Groundwater- surface water interaction monitoring would help to complete an assessmentof impacts to ecosystems.
• Improved estimate of water use and economic evaluations would aid in further defininggroundwater sustainability.
• It is important to ensure that the method of analysis is repeatable and can be updated.• Cost effectiveness may reflect the value of decisions made based on the indicator.• Indicator selection should be relevant to management needs.
Lower Athabasca (Bayegnak, 2013) • The main assumption made was that data was reliable because it was generated by
creditable and competent organizations with appropriate resources devoted to collectingand processing data.
• There was some effort required to process the information to be used in the selectedindicators based on what was available.
• Most of the existing data for the state indicators is privately owned. Therefore, to obtainthis data and consolidate it to provide a larger picture required effort. These efforts wouldinclude integration of data through numerical modelling or hydraulic tomography.
• The existing information is not designed specifically for the completion of an impactassessment. It was noted that converting this data may not be too onerous.
• The pilot project noted that it was typically difficult to determine a single responseindicator that was relevant, available and acceptable. More often than not, societalresponses are a combination of more than one indicator. The split between availability andacceptability recognizes that an operational response may exist, but may not be practice ina given situation than one application.
Montérégie Est Région (Martin, A., et al., 2013) • Indicators specific to groundwater use do not take into account accessibility and quality of
the groundwater for use.• Water level data contains estimates, therefore creates a level of uncertainty.• Indicators will evolve over time which will reduce the overall uncertainty.• Groundwater quality issues are not always related to an impact. This is particularly the
case with respect to brackish water. A distinction in natural groundwater quality andcontamination is necessary.
• The groundwater resources program indicator would be relevant on a Canadian scale todemonstration the importance of groundwater governance in different regions.
Page 59
Prince Edward Island (Department of Environment, Labour and Justice, 2013) (Li, 2013) • In some cases there may be inadequate data to use a specific indicator. This was not a
major hindrance to this pilot project, but could be an overall limitation.• Generally, it was noted that for the indicators selected there is, in some cases, a lack of
detailed data, a data lag, or data that is not specific enough.• Uncertainty is created based on data quality.
4.0 EVALUATION OF THE ASSESSMENT APPROACH
WMC approved, in principle, the following two goals for the assessment approach to seek to understand the approach’s applicability across the country. The goals for the pilot testing of the assessment approach were to:
• Determine whether the proposed model and indicators are applicable at a range of scales andissues and in a variety of regions across Canada; and
• Identify the need for revisions and refinement of the assessment approach.
These two goals provided the outline for the ultimate evaluation of the completed pilot projects submitted to WESA for review and analysis.
1. Determine whether the proposed model and indicators are applicable at a range ofscales and issues in a variety of regions across Canada
The proposed model and indicators outlined in the Gordon Report were applicable at a range of scales and issues for the selected pilot project locations. As noted by Environment Canada (2013), the advantage to applying the assessment approach is that it guides the synthesis of information within each of the five groundwater sustainability goals. As indicated by the pilot projects, the five sustainability goals, DPSIR framework and indicators provided a method to communicate groundwater sustainability. The approach also allowed for the flexibility to adapt to their local conditions, needs, and policy targets. Once specific indicators were developed for the project, it became an effective way to communicate groundwater sustainability issues.
2. Identify the need for revisions and refinement of the assessment approach
As presented, the assessment approach is very detailed and requires a great deal of effort to complete. This may limit the ability for water managers to complete the assessment due to organizational capacity or limited access to data. Environment Canada (2013) noted in their assessment that the indicators within the groundwater sustainability goals provided a more
Page 60
deliberate assessment of sustainability as a whole than reporting solely within the DPSIR Framework.
The DPSIR Framework is a good way to conceptualize a groundwater suitability issue. However, when coupled with the challenge of defining specific indicators it becomes hard for the user to understand and potentially correlate the necessary data as described in Section 3.2. The DPSIR Framework allowed for a consistent method to select indicators. WESA noted that the pilot project’s found it challenging to develop/ select indicators for each of the DPSIR Framework elements, where appropriate. This was due to some indicators being able to be used for two or more DPSIR elements. This could be a function of training or understanding of the assessment approach, time restrictions, or the users need/want to complete a full sustainability analysis. WESA concludes that it then would be necessary to ensure that “experts” are consulted for each of the groundwater sustainability goals to help develop specific indicators. For example, the Montérégie Est Region consulted stakeholders in their review of the indicators, and in this process had additional indicators suggested to be included in their analysis. As noted by the pilot projects, allowing for the selection of indicators that relate specifically to their specific issue and project goal, allowed the assessment approach to work more easily. This is an important point to note if this approach is pursued further.
The difficulty with allowing the pilot projects to select their own indicators is that this will limit the ability to compare the indicators directly between assessments. For example, it would be difficult to compare two assessments if the indicators for the elements of the DPSIR Framework were completely different. This could be compensated with the development of “themes” of indicators for each one of the groundwater sustainability goals. These “themes” would provide additional guidance for the selection of indicators and may help to frame commonality in the assessment of sustainability. It would be important that these “themes” be as simple/ basic as possible in order to allow for the use of indicators in jurisdictions where data availability may be limited. The following “themes” are based on the indicators developed by the pilot projects. A brief example of what could be developed is provided below.
Table 10: Theme for Indicators for the Groundwater Sustainability Goals- Examples
Groundwater Sustainability Goal
Potential Themes for Indicator Development Discussion
Water Quantity Assessment of water levels and water use
Water level data is usually accessible by many organisations. This is an easy and effective way to communicate changes due to water use activities. This indicator was used by two of the pilot projects. This indicator “theme” may only be able to relate to the driving force, pressure,
Page 61

Groundwater Sustainability Goal
Potential Themes for Indicator Development Discussion
state and impact elements of the DPSIR Framework.
Water Quality Assessment of groundwater quality
This indicator could be framed to a specific groundwater quality issue. For example this could be nitrate levels within monitoring wells or drinking water wells within the study area. This was completed by all of the pilot projects, as well as suggested by the Gordon Report. Indicators can be developed within the theme for many of the DPSIR Framework elements.
Ecosystems Ecosystem dependence on groundwater including groundwater contribution to baseflow
These indicators were used by the majority of pilot projects. If data was available, baseflow calculations were able to assess stream quality as well. Ecosystem dependence on groundwater allows for a logical connection to all elements of the DPSIR Framework. This is an important aspect to consider when looking at the health of an ecosystem that relies on groundwater.
Socioeconomic Dependence and restriction to groundwater
For this sustainability goal, the majority of the pilot projects used the example indicators provided in the Gordon Report. The additional indicators recommended would fall into this “theme” by looking at specific species dependence on the groundwater systems, including human dependence (e.g., price of water).
Governance Government action and public outreach
The “theme” for these indicators would be an assessment of the level of government action/ involvement in groundwater programs as well as public outreach programs. In some cases this might be more of a qualitative assessment.
Where the Gordon Report indicators were used in the pilot projects, this information is comparable. If this is a priority for the WMC, this aspect of the assessment approach should be evaluated. However, as noted by the pilot project, depending on data availability, understanding of the groundwater system, and issues noted, this may not be achievable. The determination of groundwater sustainability can be very specific and locally driven.
The Lower Athabasca pilot project recommended specifically that, “a response framing attribute process allowing stakeholders’ inputs be adopted to complement the DPSIR, and that control
Page 62
charting and trend analysis be used to define baseline conditions and policy target values (Bayegnak, 2013).”
In order to provide a final synthesis of the assessment approach goals, indicators and DPSIR elements, the Abbotsford- Sumas pilot project used a weight-of-evidence approach. This provided a synthesis of the indicators within the assessment approach and aided in the communication of the results of their study. This concept should be discussed further by the WMC.
An outline on how to complete the assessment approach would help future users. The five pilot projects submitted five very different reports. If the WMC wishes to create a common assessment approach then the creation of a “how to” guide would help other water managers. An important aspect of this guide would be to provide methods on how to effectively engage and communicate the results to stakeholders and the public.
This guide could include information on the importance of seeking “experts” to aid in the analysis of the DPSIR Framework for each of the sustainability goals. Further it could provide information on the importance of engaging stakeholders, if appropriate, in the thought process of the DPSIR Framework and review of the indicators selected.
The following are examples of information that could be included in a “how to” guide to assess groundwater sustainability. The level of detail in this guide should be assessed based on the desire to ensure that this process is still flexible.
• Information on the importance of the creation/ development of a groundwatersustainability assessment team. This team would aid in the review of the assessmentapproach and indicator development.
• Information on the assessment process as outlined by the Gordon Report.• Key concepts and definitions for each aspect of the assessment approach. This could
include example indicators for all elements of the DPSIR Framework for eachgroundwater sustainability goal, and/or the development of themes to aid the user.
• A draft outline for reporting on groundwater sustainability to provide guidance of whatshould be included. This may include examples, such as the weight evidence approach, tomake an overall statement of groundwater sustainability for the aquifer of interest.
• Elements of an effective communication strategy to provide the key information to watermanagers and the public.
• Discussion on the importance of stakeholder input, if available.
Page 63
Overall, the assessment approach piloted did provide the information/steps necessary to complete an assessment of groundwater sustainability. This was regardless of the scale and jurisdiction where the pilot project was located. The groundwater sustainability goals and DPSIR Framework helped to frame the thought process for the selection of indicators. Indicators presented in the Gordon Report were used by at least one of the pilot projects, but not used by all of them to complete their assessments.
4.1 Recommendations on the Stated Objectives of the Assessment Approach
WMC outlined specific objectives for the testing of the assessment approach. This has been summarized below with a description of how the pilot projects managed to meet these specific objectives.
A standardized means by which jurisdictions can track the status of groundwater resources and the effectiveness of their groundwater management strategies over time
The assessment approach as outlined in the Gordon Report provided the pilot projects with the framework to track the status of their groundwater resources and the effectiveness of their water management strategies over time. However, the ability to track this was only available if baseline conditions existed. Where baseline conditions did not exist, the approach allowed for the pilot project to develop these parameters for future use.
It is important for the user of this assessment approach to determine the project goals within the specific groundwater sustainability goal. Therefore, it may be difficult for the users to “retrofit” old data into this process if specific indicators are selected for the assessment approach.
Lastly, organizational capacity to complete ongoing assessments was raised as a concern. Ongoing commitments would be required by the organisation completing the assessment to track the status of groundwater sustainability over time.
Continuity and common language when communicating the sustainability of groundwater resources at a local, regional, provincial/territorial, Canada-wide or international scale
Based on the results of the pilot projects and feedback received, the common language presented in the Gordon Report was easily adopted and understood. It is recommended that specific examples be provided to future users, such as outlined in the Gordon Report, on how each of the DPSIR Framework elements are defined and how they relate to each other. This information should be carried forward to any further documents produced.
Page 64

A platform for developing shared policy instruments and technical tools for groundwater sustainability
The assessment approach allows for a common discussion framework for groundwater sustainability issues.
The indicators used were developed in many cases specifically for the issues outlined by the pilot project. This limits the ability to directly compare the developed indicators. However, this process still allows for the sharing of policy instruments and technical tools as some of the indicators could be used in other jurisdictions. For example, some of the indicators developed could be modified to allow for this sharing to occur. The WMC should consider suggesting common indicators, beyond those presented in the Gordon Report that could be used for the assessment of groundwater sustainability to facilitate the comparison of projects.
A platform could be developed to provide users with the necessary tools to successfully complete their projects. This would provide information on the assessment approach, methods to complete the assessment, sample indicators and tools for communicating the results to water managers.
Assistance to jurisdictions to better inform their decision makers and policy-developers on the status of groundwater sustainability and on the key data requirements, policy approaches, time and resource commitments and technical methods required to help ensure that sustainable groundwater management practise are implemented
The assessment approach provides a method to better inform decision makers and policy developers on the status of groundwater sustainability. The sustainability goals, DPSIR Framework and indicators provide the tools necessary to complete an assessment of groundwater sustainability. It ensures the users include key data requirements and policy approaches.
The development of indicators specific to the jurisdictional groundwater sustainability issue will allow involvement of stakeholders and the public.
To complete and maintain the assessment requires a certain level of organizational capacity that may not be available in all jurisdictions. The main limitation of the proposed approach is that the resources or technical methods required by the indictors may not be accessible or may be beyond the scope of the user to develop and/or use.
Page 65
In order to assess groundwater sustainability it is important to have baseline conditions to allow for the comparison of data over time. Without this baseline data, an assessment might be difficult to achieve.
Page 66

5.0 CONCLUSION
Overall, the assessment approach outlined in the Gordon Report was applied successfully by the pilot projects. This indicates that the approach has the flexibility required for it to be modified and used on a variety of scales and in different jurisdictions across Canada.
In order to ensure the success for future users, the WMC may consider the development of guidelines on how to complete the assessment of groundwater sustainability and provide specific examples on what tools could be used to convey this information to water managers, stakeholders and the public.
It is important to note that future projects should be framed with the goals and issues of the local community/ watershed in mind. This will ease the process of developing indicators and help communicate the results.
Respectfully submitted,
WESA, a division of BluMetric Environmental Inc.
Electronic signatures used
Ian Macdonald, M.Sc., P.Geo., EP(CEA) Tiffany Svensson, M.Sc., P.Geo. Project Manager /Senior Hydrogeologist Branch Manager/Senior Hydrogeologist
François Richard, PhD. géo., P.Geo. Emily Stahl, B.Sc., P.Geo. Senior Hydrogeologist Intermediate Hydrogeologist
Page 67
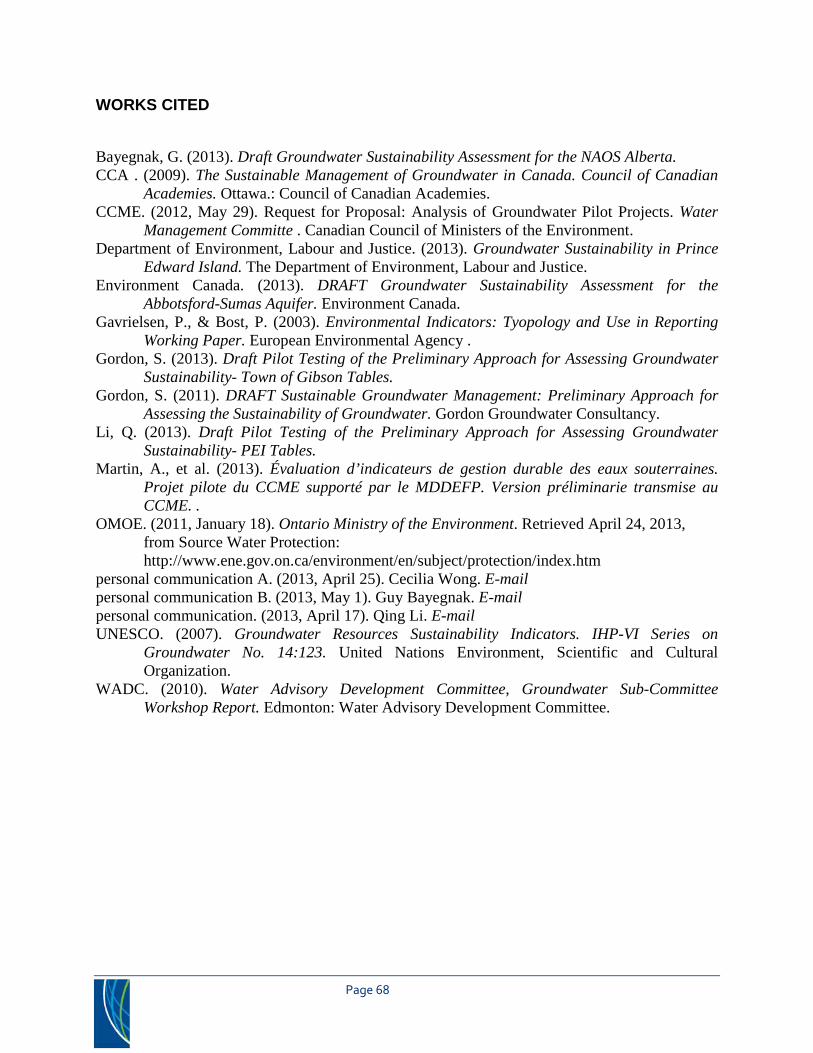
WORKS CITED
Bayegnak, G. (2013). Draft Groundwater Sustainability Assessment for the NAOS Alberta. CCA . (2009). The Sustainable Management of Groundwater in Canada. Council of Canadian
Academies. Ottawa.: Council of Canadian Academies. CCME. (2012, May 29). Request for Proposal: Analysis of Groundwater Pilot Projects. Water
Management Committe . Canadian Council of Ministers of the Environment. Department of Environment, Labour and Justice. (2013). Groundwater Sustainability in Prince
Edward Island. The Department of Environment, Labour and Justice. Environment Canada. (2013). DRAFT Groundwater Sustainability Assessment for the
Abbotsford-Sumas Aquifer. Environment Canada. Gavrielsen, P., & Bost, P. (2003). Environmental Indicators: Tyopology and Use in Reporting
Working Paper. European Environmental Agency . Gordon, S. (2013). Draft Pilot Testing of the Preliminary Approach for Assessing Groundwater
Sustainability- Town of Gibson Tables. Gordon, S. (2011). DRAFT Sustainable Groundwater Management: Preliminary Approach for
Assessing the Sustainability of Groundwater. Gordon Groundwater Consultancy. Li, Q. (2013). Draft Pilot Testing of the Preliminary Approach for Assessing Groundwater
Sustainability- PEI Tables. Martin, A., et al. (2013). Évaluation d’indicateurs de gestion durable des eaux souterraines.
Projet pilote du CCME supporté par le MDDEFP. Version préliminarie transmise au CCME. .
OMOE. (2011, January 18). Ontario Ministry of the Environment. Retrieved April 24, 2013, from Source Water Protection: http://www.ene.gov.on.ca/environment/en/subject/protection/index.htm
personal communication A. (2013, April 25). Cecilia Wong. E-mail personal communication B. (2013, May 1). Guy Bayegnak. E-mail personal communication. (2013, April 17). Qing Li. E-mail UNESCO. (2007). Groundwater Resources Sustainability Indicators. IHP-VI Series on
Groundwater No. 14:123. United Nations Environment, Scientific and Cultural Organization.
WADC. (2010). Water Advisory Development Committee, Groundwater Sub-Committee Workshop Report. Edmonton: Water Advisory Development Committee.
Page 68

FIGURES
Page 69

Athabasca Oil Sands !
Town of Gibsons ● ! Abbotsford-Sumas
Prince Edward Island Montérégie Est Region !
!
LEGEND
● Pilot Project Locations
1
REV. DESCRIPTION YY/MM/DD BY CHK
REFERENCES PROPRIETARY INFORMATI ON MAY NOT BE REPRODUC ED OR DIVULGED
WITHOUT PRIOR WRITTEN CONSENT OF BLUMETRIC ENVIRONMENTAL INC.
®DO NOT SCALE DRAWING. THIS DRAWING MAY HAVE BEEN REDUCED. ALL SCALE NOTATIONS INDIC ATED ARE BASED ON 8 .5" x11 " FORMAT DRAWINGS.
0 500 1,000 Kilometers
CLIENT
Water Management Committee: Canadian Council of Ministers of the Environment
PROJECT
Analysis of Groundwater Pilot Projects
TITLE
Groundwater Pilot Project Locations
WESA, a division of BluMetric Environmental Inc.
171 Victoria St. N., Kitchener, Ontario, N2H 5 C5 TEL: (519) 742-6685 FAX: (519) 742-9810 Email: info@ blumetric.ca Web: http://www.blumetric.ca
Blu Metric includes W ESA, Seprotech, WESAtech, Envir- Eau, OEL- HydrosSys, WESAtechnologias
PROJECT #
W-B10671-00-00 DATE
April 17, 2013 DRAWN
YL CHECKED
ES FIG NO.
01 REV
0
Page 70

LEGEND
● Pilot Project Location
!
1
REV. DESCRIPTION YY/MM/DD BY CHK
REFERENCES PROPRIETARY INFORMATI ON MAY NOT BE REPRODUC ED OR DIVULGED WITHOUT PRIOR WRITTEN CONSENT OF BLUMETRIC ENVIRONMENTAL INC. DO NOT SCALE DRAWING. THIS DRAWING MAY HAVE BEEN REDUCED. ALL SCALE NOTATIONS
INDIC ATED ARE BASED ON 8 .5" x11 " FORMAT DRAWINGS.
0 750 1,500 Meters
CLIENT
Water Management Committee: Canadian Council of Ministers of the Environment
PROJECT
Analysis of Groundwater Pilot Projects
TITLE
Town of Gibsons Study Area British Columbia, Canada
WESA, a division of BluMetric Environmental Inc.
171 Victoria St. N., Kitchener, Ontario, N2H 5 C5 TEL: (519) 742-6685 FAX: (519) 742-9810 Email: info@ blumetric.ca Web: http://www.blumetric.ca
Blu Metric includes W ESA, Seprotech, WESAtech, Envir- Eau, OEL- HydrosSys, WESAtechnologias
PROJECT #
W-B10671-00-00 DATE
April 17, 2013 DRAWN
YL CHECKED
ES FIG NO.
02 REV
0
Upper Gibsons
Lower Gibsons
®
Page 69
Page 71

!
LEGEND
● Pilot Project Location
Abbotsford-Suma Aquifer
1
REV. DESCRIPTION YY/MM/DD BY CHK
REFERENCES PROPRIETARY INFORMATI ON MAY NOT BE REPRODUC ED OR DIVULGED
WITHOUT PRIOR WRITTEN CONSENT OF BLUMETRIC ENVIRONMENTAL INC.
®DO NOT SCALE DRAWING. THIS DRAWING MAY HAVE BEEN REDUCED. ALL SCALE NOTATIONS INDIC ATED ARE BASED ON 8 .5" x11 " FORMAT DRAWINGS. -Aldridge, J. and Wong, C., 2013 . Dr aft Groundwater Sustainability Assessment for the Abbotsford- Sumas Aquifer (ASA). February 2013. Source "Groundwater Sustainability Assessment for the Abbotsford- Sumas Aquifer", Environment Canada, 2013 .
0 2.5 5 Kilometers
CLIENT
Water Management Committee: Canadian Council of Ministers of the Environment
PROJECT
Analysis of Groundwater Pilot Projects
TITLE
Transboundary Abbotsford-Sumas Aquifer British Columbia, Canada (Canadian portion only)
WESA, a division of BluMetric Environmental Inc.
171 Victoria St. N., Kitchener, Ontario, N2H 5 C5 TEL: (519) 742-6685 FAX: (519) 742-9810 Email: info@ blumetric.ca Web: http://www.blumetric.ca
Blu Metric includes W ESA, Seprotech, WESAtech, Envir- Eau, OEL- HydrosSys, WESAtechnologias
PROJECT #
W-B10671-00-00 DATE
March 13-13 DRAWN CHECKED
YL ES FIG NO.
03 REV
0
Page 72
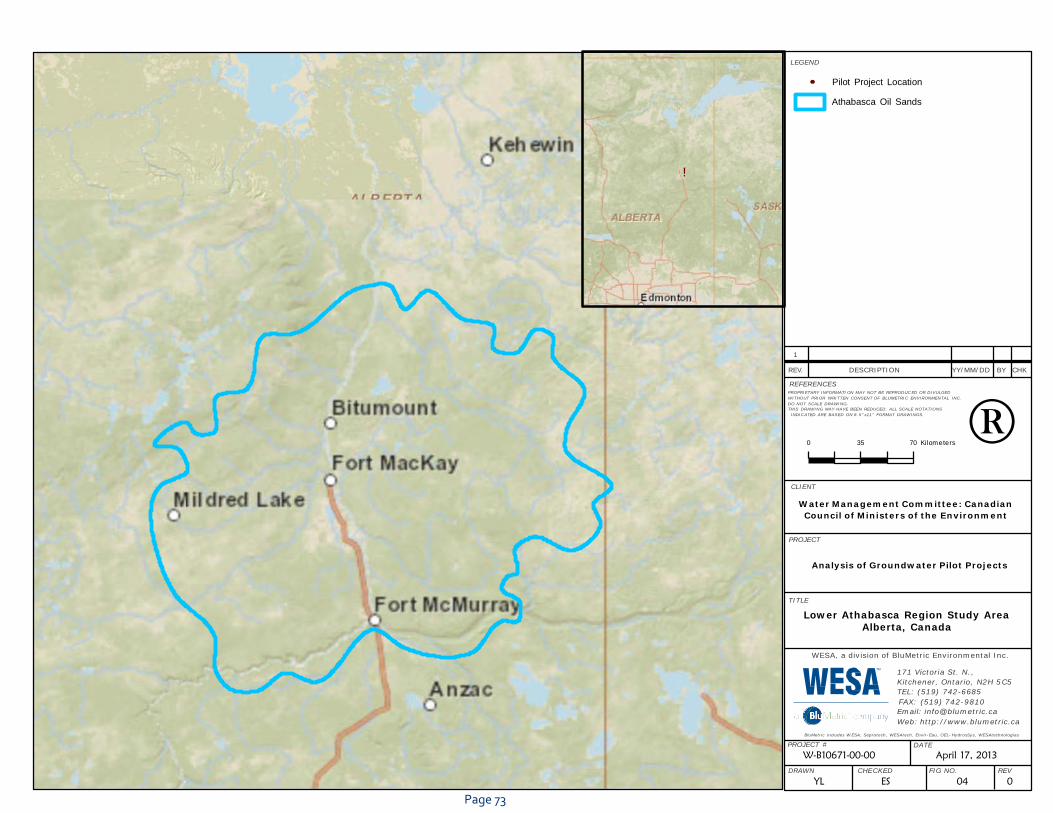
LEGEND
● Pilot Project Location
Athabasca Oil Sands
!
1
REV. DESCRIPTION YY/MM/DD BY CHK
REFERENCES PROPRIETARY INFORMATI ON MAY NOT BE REPRODUC ED OR DIVULGED WITHOUT PRIOR WRITTEN CONSENT OF BLUMETRIC ENVIRONMENTAL INC. DO NOT SCALE DRAWING. THIS DRAWING MAY HAVE BEEN REDUCED. ALL SCALE NOTATIONS INDIC ATED ARE BASED ON 8 .5" x11 " FORMAT DRAWINGS.
0 35 70 Kilometers
CLIENT
Water Management Committee: Canadian Council of Ministers of the Environment
PROJECT
Analysis of Groundwater Pilot Projects
TITLE
Lower Athabasca Region Study Area Alberta, Canada
WESA, a division of BluMetric Environmental Inc.
171 Victoria St. N., Kitchener, Ontario, N2H 5 C5 TEL: (519) 742-6685 FAX: (519) 742-9810 Email: info@ blumetric.ca Web: http://www.blumetric.ca
Blu Metric includes W ESA, Seprotech, WESAtech, Envir- Eau, OEL- HydrosSys, WESAtechnologias
PROJECT #
W-B10671-00-00 DATE
April 17, 2013 DRAWN
YL CHECKED
ES FIG NO.
04 REV
0
®
Page 73
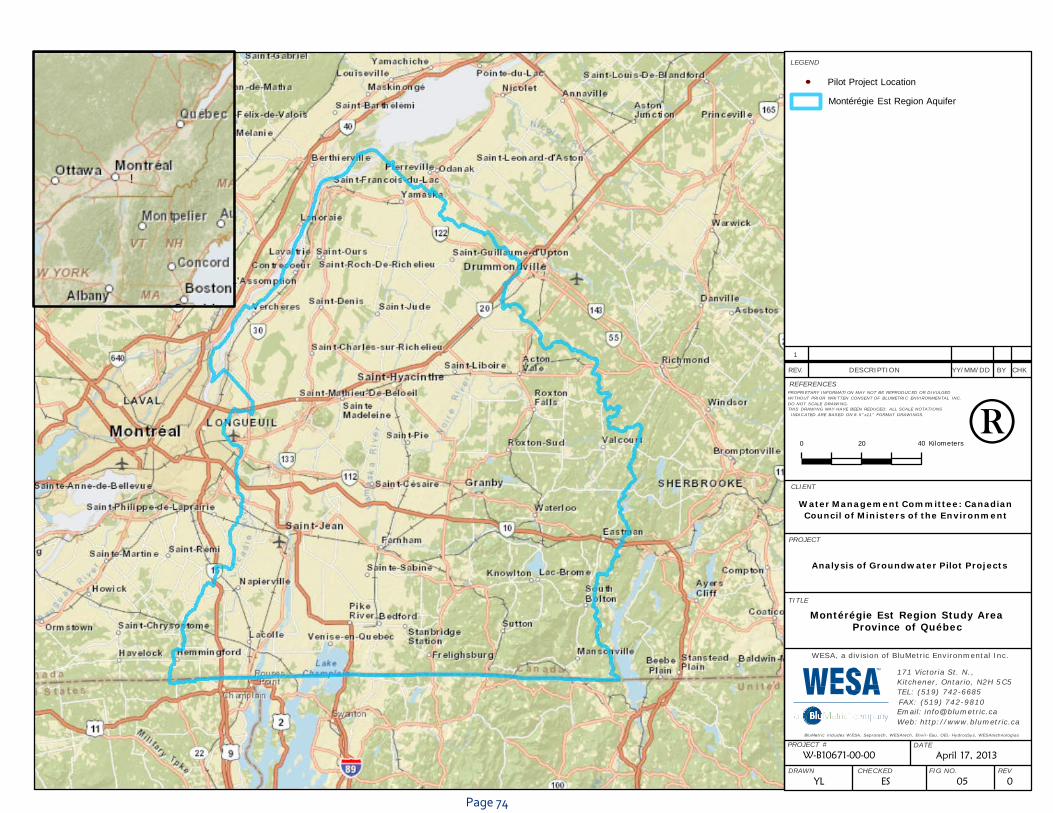
LEGEND
● Pilot Project Location
Montérégie Est Region Aquifer
!
1
REV. DESCRIPTION YY/MM/DD BY CHK
REFERENCES PROPRIETARY INFORMATI ON MAY NOT BE REPRODUC ED OR DIVULGED WITHOUT PRIOR WRITTEN CONSENT OF BLUMETRIC ENVIRONMENTAL INC. DO NOT SCALE DRAWING. THIS DRAWING MAY HAVE BEEN REDUCED. ALL SCALE NOTATIONS INDIC ATED ARE BASED ON 8 .5" x11 " FORMAT DRAWINGS.
0 20 40 Kilometers
CLIENT
Water Management Committee: Canadian Council of Ministers of the Environment
PROJECT
Analysis of Groundwater Pilot Projects
TITLE
Montérégie Est Region Study Area Province of Québec
WESA, a division of BluMetric Environmental Inc.
171 Victoria St. N., Kitchener, Ontario, N2H 5 C5 TEL: (519) 742-6685 FAX: (519) 742-9810 Email: info@ blumetric.ca Web: http://www.blumetric.ca
Blu Metric includes W ESA, Seprotech, WESAtech, Envir- Eau, OEL- HydrosSys, WESAtechnologias
PROJECT #
W-B10671-00-00 DATE
April 17, 2013 DRAWN
YL CHECKED
ES FIG NO.
05 REV
0
®
Page 74
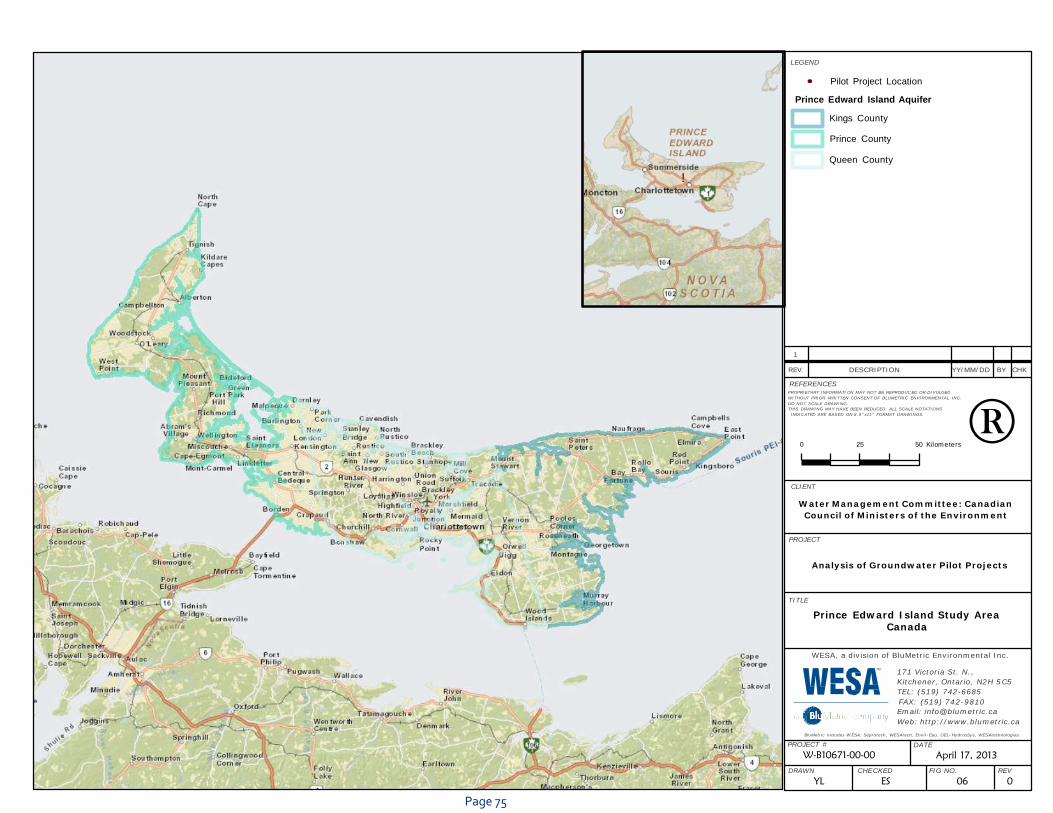
LEGEND
● Pilot Project Location
Prince Edward Island Aquifer
Kings County
Prince County
Queen County
!
1
REV. DESCRIPTION YY/MM/DD BY CHK
REFERENCES PROPRIETARY INFORMATI ON MAY NOT BE REPRODUC ED OR DIVULGED WITHOUT PRIOR WRITTEN CONSENT OF BLUMETRIC ENVIRONMENTAL INC. DO NOT SCALE DRAWING. THIS DRAWING MAY HAVE BEEN REDUCED. ALL SCALE NOTATIONS INDIC ATED ARE BASED ON 8 .5" x11 " FORMAT DRAWINGS.
0 25 50 Kilometers
CLIENT
Water Management Committee: Canadian Council of Ministers of the Environment
PROJECT
Analysis of Groundwater Pilot Projects
TITLE
Prince Edward Island Study Area Canada
WESA, a division of BluMetric Environmental Inc.
171 Victoria St. N., Kitchener, Ontario, N2H 5 C5 TEL: (519) 742-6685 FAX: (519) 742-9810 Email: info@ blumetric.ca Web: http://www.blumetric.ca
Blu Metric includes W ESA, Seprotech, WESAtech, Envir- Eau, OEL- HydrosSys, WESAtechnologias
PROJECT #
W-B10671-00-00 DATE
April 17, 2013 DRAWN
YL CHECKED
ES FIG NO.
06 REV
0
®
Page 75
APPENDIX A
Project Synopsis Summary of the Pilot Projects
Page 76

Pilot Project Title: Use of Groundwater Sustainability Indicators in Groundwater Outreach and Management for the Town of Gibsons, British Columbia, Canada
Lead Contact (s): Sue Gordon, Ph.D., P.Geo., Gordon Groundwater Consultancy (GGC), Location: Town of Gibson, British Columbia Aquifer: The Gibsons Aquifer is a Pre-Vashon (proglacial) marine sand and gravel deposit that is covered by the Vashon
Till. The Town of Gibson production wells utilize this confined aquifer in Lower Gibsons at depths of 20-25 metres below sea level. A shallower unconfined marine/glacio-marine sand and gravel aquifer overlays the till deposits and had been the main source of water prior to the installation of the municipal supply (1950 era).
Aquifer Type: Gibsons Aquifer: Proglacial marine sand and gravel deposit.
Background Information: The confined Gibsons Aquifer lies beneath the Town of Gibson and extends up into the base of Mt. Elphinstone and likely below the ocean. The east and west boundaries are currently assumed to be delineated by a creek draining into the ocean and large bedrock outcrops, respectively. Gibsons is recognized internationally for its very good quality of drinking water as evidenced by its Berkley Springs International Water Tasting Award “Gold Medal Winner” in 2005. The local community equally values their ample, high quality, untreated groundwater supply. Currently, there is no specific groundwater governance structure in place to encourage the leaders and the broader community to actively engage in activities or behaviours that will help ensure a sustained and protected aquifer into the future. Indicators will be incorporated into the Town’s groundwater communication, management and conservation plans to raise awareness of the decision makers and the broader community about the science and engineering aspects related to groundwater sustainability.
Scale of Project: Most of aquifer mapping project is within the Town’s approximately 5 km2 boundaries. Components of the study do extend towards Mt. Elphinstone covering an area of approximately a 10 km2 study area.
Page 77
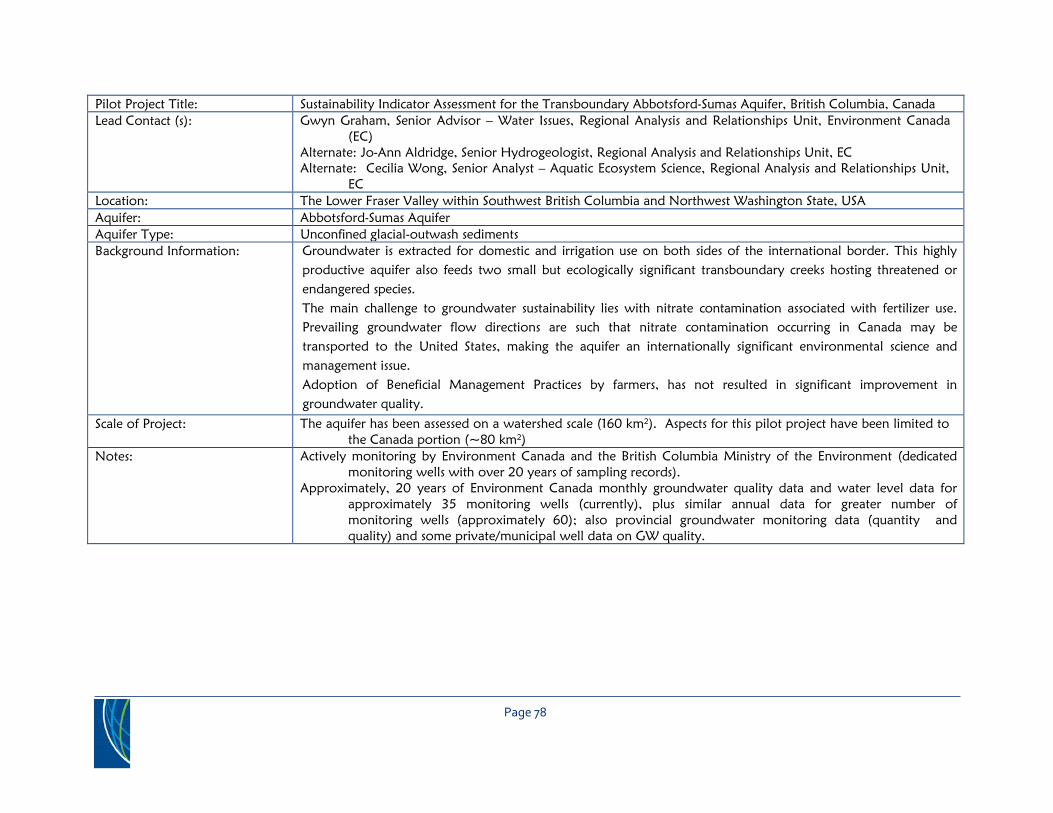
Pilot Project Title: Sustainability Indicator Assessment for the Transboundary Abbotsford-Sumas Aquifer, British Columbia, Canada Lead Contact (s): Gwyn Graham, Senior Advisor – Water Issues, Regional Analysis and Relationships Unit, Environment Canada
(EC) Alternate: Jo-Ann Aldridge, Senior Hydrogeologist, Regional Analysis and Relationships Unit, EC Alternate: Cecilia Wong, Senior Analyst – Aquatic Ecosystem Science, Regional Analysis and Relationships Unit,
EC Location: The Lower Fraser Valley within Southwest British Columbia and Northwest Washington State, USA Aquifer: Abbotsford-Sumas Aquifer Aquifer Type: Unconfined glacial-outwash sediments Background Information: Groundwater is extracted for domestic and irrigation use on both sides of the international border. This highly
productive aquifer also feeds two small but ecologically significant transboundary creeks hosting threatened or endangered species. The main challenge to groundwater sustainability lies with nitrate contamination associated with fertilizer use. Prevailing groundwater flow directions are such that nitrate contamination occurring in Canada may be transported to the United States, making the aquifer an internationally significant environmental science and management issue. Adoption of Beneficial Management Practices by farmers, has not resulted in significant improvement in groundwater quality.
Scale of Project: The aquifer has been assessed on a watershed scale (160 km2). Aspects for this pilot project have been limited to the Canada portion (~80 km2)
Notes: Actively monitoring by Environment Canada and the British Columbia Ministry of the Environment (dedicated monitoring wells with over 20 years of sampling records).
Approximately, 20 years of Environment Canada monthly groundwater quality data and water level data for approximately 35 monitoring wells (currently), plus similar annual data for greater number of monitoring wells (approximately 60); also provincial groundwater monitoring data (quantity and quality) and some private/municipal well data on GW quality.
Page 78
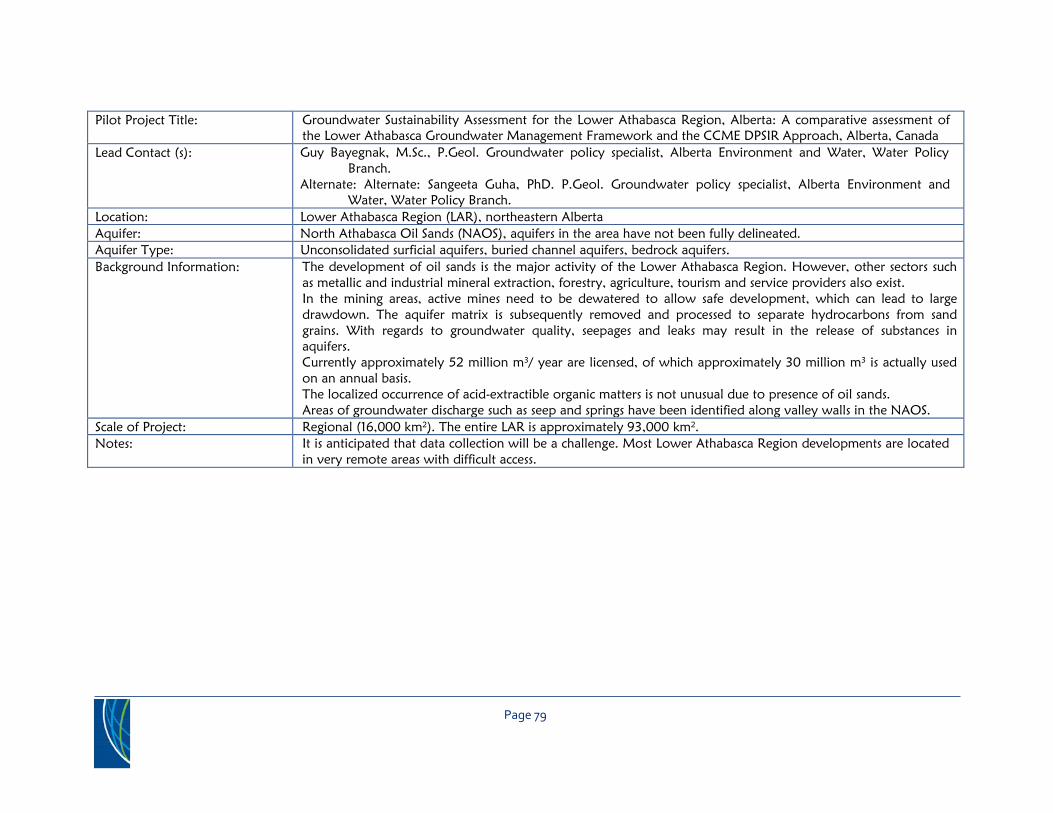
Pilot Project Title: Groundwater Sustainability Assessment for the Lower Athabasca Region, Alberta: A comparative assessment of the Lower Athabasca Groundwater Management Framework and the CCME DPSIR Approach, Alberta, Canada
Lead Contact (s): Guy Bayegnak, M.Sc., P.Geol. Groundwater policy specialist, Alberta Environment and Water, Water Policy Branch.
Alternate: Alternate: Sangeeta Guha, PhD. P.Geol. Groundwater policy specialist, Alberta Environment and Water, Water Policy Branch.
Location: Lower Athabasca Region (LAR), northeastern Alberta Aquifer: North Athabasca Oil Sands (NAOS), aquifers in the area have not been fully delineated. Aquifer Type: Unconsolidated surficial aquifers, buried channel aquifers, bedrock aquifers. Background Information: The development of oil sands is the major activity of the Lower Athabasca Region. However, other sectors such
as metallic and industrial mineral extraction, forestry, agriculture, tourism and service providers also exist. In the mining areas, active mines need to be dewatered to allow safe development, which can lead to large drawdown. The aquifer matrix is subsequently removed and processed to separate hydrocarbons from sand grains. With regards to groundwater quality, seepages and leaks may result in the release of substances in aquifers. Currently approximately 52 million m3/ year are licensed, of which approximately 30 million m3 is actually used on an annual basis. The localized occurrence of acid-extractible organic matters is not unusual due to presence of oil sands. Areas of groundwater discharge such as seep and springs have been identified along valley walls in the NAOS.
Scale of Project: Regional (16,000 km2). The entire LAR is approximately 93,000 km2. Notes: It is anticipated that data collection will be a challenge. Most Lower Athabasca Region developments are located
in very remote areas with difficult access.
Page 79

Pilot Project Title: Groundwater sustainability indicators using PACES projects data, Montérégie Est, Québec Lead Contact (s): Édith Bourque (MDDEP), Joshua Bleser (OBV Yamaska), René Lefebvre (INRS) Location: Montérégie Est, South-western Québec, Richelieu / Yamaska / Missisquoi Bay watersheds Aquifer: Regional aquifer system Aquifer Type: Mostly fractured sedimentary and metamorphic rock aquifers, Locally granular aquifers Background Information: The study area is a mostly rural area with intense agriculture. The Montérégie Est region straddles the St-
Lawrence Lowlands and Appalachians. The study area covers 9,200 km2 and includes more than 500,000 inhabitants. In Montérégie Est groundwater is used for drinking water purposes for 25 % of the population (147,000 residents). Municipalities are turning more to groundwater. Groundwater geochemistry is quite variable, and the area includes a 2,000 km2 area with brackish groundwater. The presence of natural contaminants such as saline waters, fluorine and manganese are of concern. Groundwater supplies rural areas and a growing number of municipalities. Intense farming represents a pressure on the resource and the new shale gas industry is locally viewed as adding pressure on quantity and quality. In Montérégie Est, there are groundwater supply issues mostly for municipalities in the Appalachians. Surface water quality of the Yamaska River is the worst in Quebec. There are concerns that intense agriculture, which contributes to the degradation of surface water, is also having an impact on groundwater. There are also new concerns about the potential impact of the shale gas industry on groundwater quality and quantity. Information pertaining to groundwater is lacking. The impact of agriculture is a concern but newly acquired data can shed better light on this issue.
Scale of Project: About 9 000 km2 Notes: Transboundary aquifer – Part of ISARM
Page 80

Pilot Project Title: Sustainability of Groundwater Resources in Selected Watershed in Prince Edward Island-Quantity, Quality and Ecosystem Considerations, Prince Edward Island, Canada.
Lead Contact (s): Qing Li, PEI Department of Environment, Labour & Justice, Location: Entire Prince Edward Island, and three selected watersheds Winter River, Wilmot River, and Mill River
watershed. Aquifer: Groundwater from the upper Carboniferous to Lower-Middle Permian red sandstone that underlies the entire
province of PEI. Aquifer Type: Unconfined, dual porosity, fractured sandstone. The aquifer responds like a leaky confined aquifer due to very
strong anisotropy. Background Information: Regional geographical setting – Island with land area of approximately 5636 km2, subdivided into approximately
240 watersheds or areas, with drainage (and groundwater flow) in all cases to the ocean either directly or via estuarine environments.
Watersheds represent local groundwater flow regimes due to similar underlie geology, delineated by surface topography.
Groundwater extraction ranges from very low (a few percent of annual recharge) to approximately 40% of annual recharge, depending on watershed area.
Groundwater issues related to elevated nitrate concentrations, as well as groundwater baseflow contributions of Nitrate to streams and estuaries. Groundwater baseflow constitutes approximately two thirds of total stream flow on an annual basis, but close to 100% during late summer/early fall.
Groundwater is also believed to be a key pathway for agriculturally derived nitrate entering estuarine environments (either directly or via fresh water stream flow) and has been linked to problems of anoxia and eutrophication in a growing number of estuaries.
Scale of Project: 5636 km2
Page 81

APPENDIX B
Summary and Analysis of Indicators Provided by the Pilot Projects
Page 82

The following Tables have been created based on the information provided by the pilot projects as referenced in the Report.
Table 1: Summary of Indicators Used by Pilot Projects Goal 1- Quantity ........................................................................................... 2 Table 2: Summary of Indicators Used by Pilot Projects Goal 2- Quality ............................................................................................. 6 Table 3: Summary of Indicators Used by Pilot Projects Goal 3- Ecosystems ....................................................................................... 11 Table 4: Summary of Indicators Used by Pilot Projects Goal 4- Socioeconomic ................................................................................. 13 Table 5: Summary of Indicators Used by Pilot Projects Goal 5- Governance ..................................................................................... 15
For the assessment presented in the tables below, the indicators not identified as example indicators in the Gordon Report have been bolded. Boxes that are highlighted in green reflect where a Gordon Report example indicator for a DPSIR Framework element outside of where suggested by the Gordon report. Boxes highlighted in orange indicate where three or more pilot project used the same indicator for their analysis.
Page 83
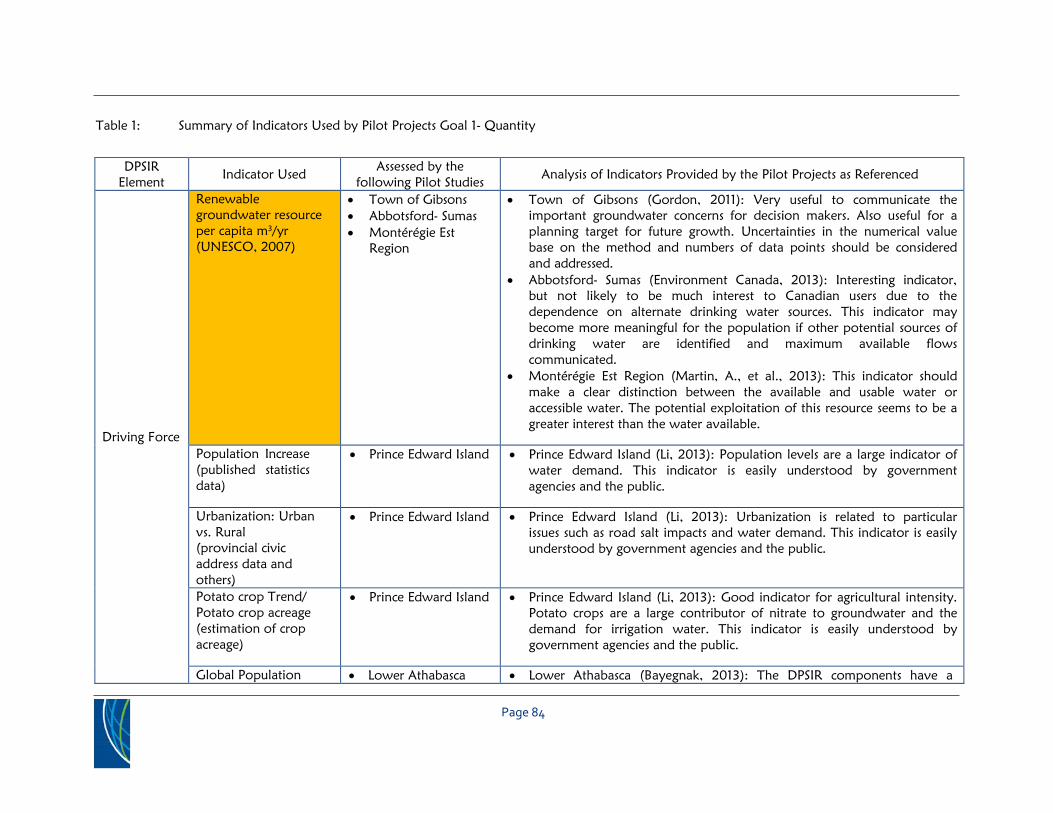
Table 1: Summary of Indicators Used by Pilot Projects Goal 1- Quantity
DPSIR Element
Indicator Used Assessed by the
following Pilot Studies Analysis of Indicators Provided by the Pilot Projects as Referenced
Driving Force
Renewable groundwater resource per capita m3/yr (UNESCO, 2007)
• Town of Gibsons• Abbotsford- Sumas• Montérégie Est
Region
• Town of Gibsons (Gordon, 2011): Very useful to communicate theimportant groundwater concerns for decision makers. Also useful for aplanning target for future growth. Uncertainties in the numerical valuebase on the method and numbers of data points should be consideredand addressed.
• Abbotsford- Sumas (Environment Canada, 2013): Interesting indicator,but not likely to be much interest to Canadian users due to thedependence on alternate drinking water sources. This indicator maybecome more meaningful for the population if other potential sources ofdrinking water are identified and maximum available flowscommunicated.
• Montérégie Est Region (Martin, A., et al., 2013): This indicator shouldmake a clear distinction between the available and usable water oraccessible water. The potential exploitation of this resource seems to be agreater interest than the water available.
Population Increase (published statistics data)
• Prince Edward Island • Prince Edward Island (Li, 2013): Population levels are a large indicator ofwater demand. This indicator is easily understood by governmentagencies and the public.
Urbanization: Urban vs. Rural (provincial civic address data and others)
• Prince Edward Island • Prince Edward Island (Li, 2013): Urbanization is related to particularissues such as road salt impacts and water demand. This indicator is easilyunderstood by government agencies and the public.
Potato crop Trend/ Potato crop acreage (estimation of crop acreage)
• Prince Edward Island • Prince Edward Island (Li, 2013): Good indicator for agricultural intensity.Potato crops are a large contributor of nitrate to groundwater and thedemand for irrigation water. This indicator is easily understood bygovernment agencies and the public.
Global Population • Lower Athabasca • Lower Athabasca (Bayegnak, 2013): The DPSIR components have a
Page 84
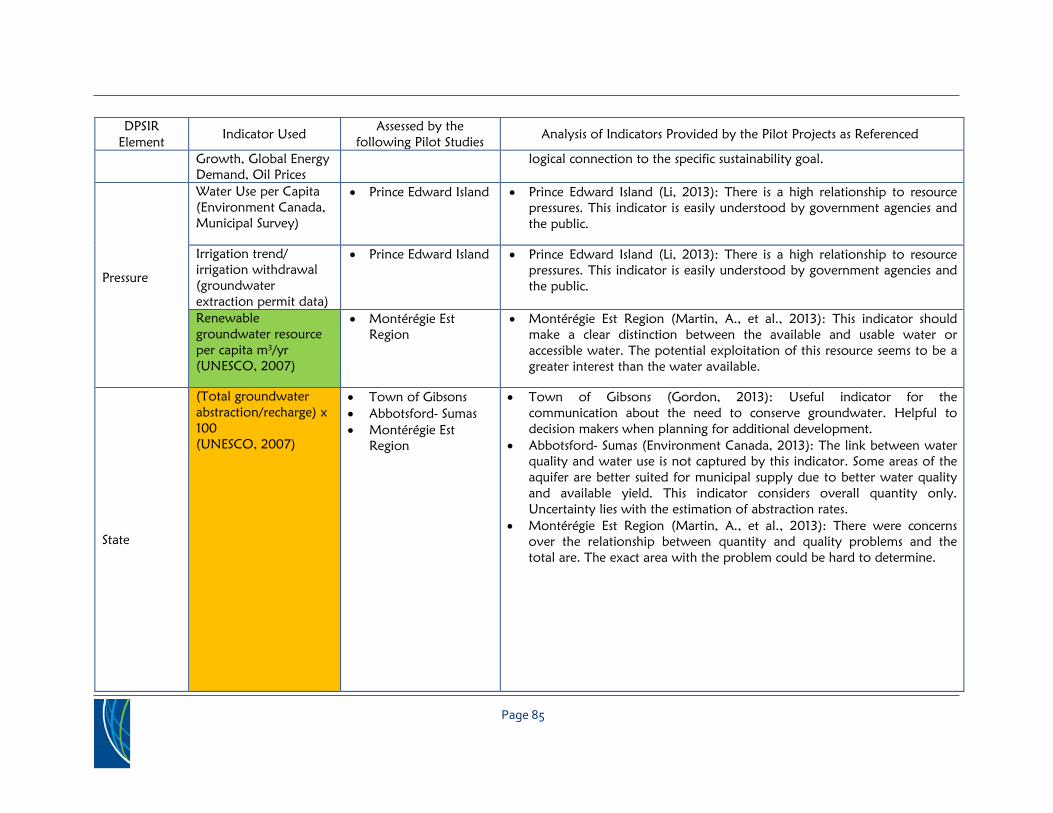
DPSIR Element
Indicator Used Assessed by the
following Pilot Studies Analysis of Indicators Provided by the Pilot Projects as Referenced
Growth, Global Energy Demand, Oil Prices
logical connection to the specific sustainability goal.
Pressure
Water Use per Capita (Environment Canada, Municipal Survey)
• Prince Edward Island • Prince Edward Island (Li, 2013): There is a high relationship to resourcepressures. This indicator is easily understood by government agencies andthe public.
Irrigation trend/ irrigation withdrawal (groundwater extraction permit data)
• Prince Edward Island • Prince Edward Island (Li, 2013): There is a high relationship to resourcepressures. This indicator is easily understood by government agencies andthe public.
Renewable groundwater resource per capita m3/yr (UNESCO, 2007)
• Montérégie EstRegion
• Montérégie Est Region (Martin, A., et al., 2013): This indicator shouldmake a clear distinction between the available and usable water oraccessible water. The potential exploitation of this resource seems to be agreater interest than the water available.
State
(Total groundwater abstraction/recharge) x 100 (UNESCO, 2007)
• Town of Gibsons• Abbotsford- Sumas• Montérégie Est
Region
• Town of Gibsons (Gordon, 2013): Useful indicator for thecommunication about the need to conserve groundwater. Helpful todecision makers when planning for additional development.
• Abbotsford- Sumas (Environment Canada, 2013): The link between waterquality and water use is not captured by this indicator. Some areas of theaquifer are better suited for municipal supply due to better water qualityand available yield. This indicator considers overall quantity only.Uncertainty lies with the estimation of abstraction rates.
• Montérégie Est Region (Martin, A., et al., 2013): There were concernsover the relationship between quantity and quality problems and thetotal are. The exact area with the problem could be hard to determine.
Page 85

DPSIR Element
Indicator Used Assessed by the
following Pilot Studies Analysis of Indicators Provided by the Pilot Projects as Referenced
State
(Σ Areas with groundwater depletion problem / total studied area) x 100 (UNESCO, 2007)
• Abbotsford- Sumas• Montérégie Est
Region
• Abbotsford-Sumas (Environment Canada, 2013): Good indicator tomonitor long-term sustainability. Long-term monitoring is recommendedwhen assessing this indicator to ensure that variability associated withtemporal and climatic changes is distinguished from regional depletion.
• Montérégie Est Region (Martin, A., et al., 2013): There were concernsover the relationship between quantity and quality problems and thetotal are. The exact area with the problem could be hard to determine.This indicator better reflects the pressure applied to the resource ratherthan the state.
Water level trend/ change (provincial long-term monitoring well data)
• Prince Edward Island• Lower Athabasca
• Prince Edward Island (Li, 2013): This indicator is easily understood bygovernment agencies and the public.
• Lower Athabasca (Bayegnak, 2013) The DPSIR components have a logicalconnection to the specific sustainability goal.
Regional Transmissivity • Lower Athabasca • Lower Athabasca (Bayegnak, 2013) The DPSIR components have a logicalconnection to the specific sustainability goal.
Percentage of Available water utilized (extraction data estimated from permitted data and household number/consumption)
• Prince Edward Island • Prince Edward Island (Li, 2013): This indicator is easily understood bygovernment agencies and the public. It provides information on theimpact to stream baseflow. It is an effective state indicator for evaluatinggroundwater resource sustainability at the watershed scale, and goodindicator for evaluation of groundwater resource for permit issuing.
Renewable groundwater resources (estimated from stream baseflow data)
• Prince Edward Island • Prince Edward Island (Li, 2013): This indicator is easily understood bygovernment agencies and the public. It supports the groundwatersustainability process.
Percentage of areas with stream flow below maintenance
• Prince Edward Island • Prince Edward Island (Li, 2013): This indicator is difficult to estimate. Maybe focused on areas with higher groundwater pumping rates.
Page 86
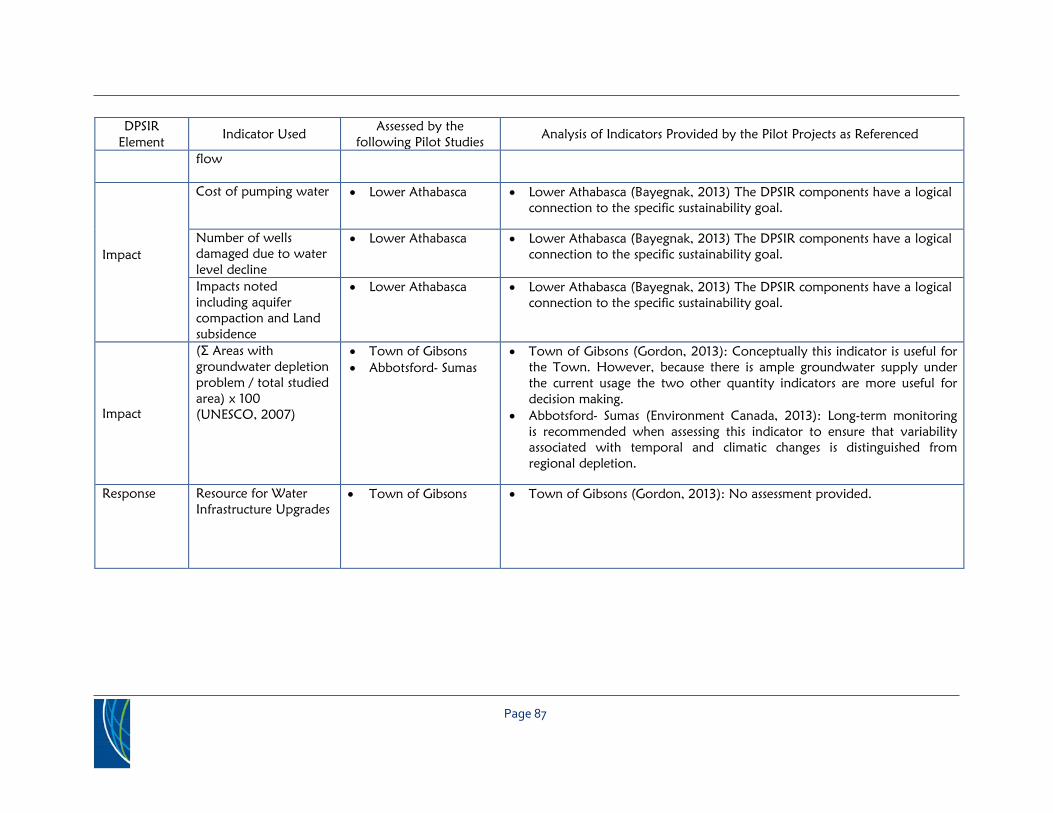
DPSIR Element
Indicator Used Assessed by the
following Pilot Studies Analysis of Indicators Provided by the Pilot Projects as Referenced
flow
Impact
Cost of pumping water • Lower Athabasca • Lower Athabasca (Bayegnak, 2013) The DPSIR components have a logicalconnection to the specific sustainability goal.
Number of wells damaged due to water level decline
• Lower Athabasca • Lower Athabasca (Bayegnak, 2013) The DPSIR components have a logicalconnection to the specific sustainability goal.
Impacts noted including aquifer compaction and Land subsidence
• Lower Athabasca • Lower Athabasca (Bayegnak, 2013) The DPSIR components have a logicalconnection to the specific sustainability goal.
Impact
(Σ Areas with groundwater depletion problem / total studied area) x 100 (UNESCO, 2007)
• Town of Gibsons• Abbotsford- Sumas
• Town of Gibsons (Gordon, 2013): Conceptually this indicator is useful forthe Town. However, because there is ample groundwater supply underthe current usage the two other quantity indicators are more useful fordecision making.
• Abbotsford- Sumas (Environment Canada, 2013): Long-term monitoringis recommended when assessing this indicator to ensure that variabilityassociated with temporal and climatic changes is distinguished fromregional depletion.
Response Resource for Water Infrastructure Upgrades
• Town of Gibsons • Town of Gibsons (Gordon, 2013): No assessment provided.
Page 87

Table 2: Summary of Indicators Used by Pilot Projects Goal 2- Quality
DPSIR Element Indicator Used
Assessed by the following Pilot Studies
Analysis of Indicators Provided by the Pilot Projects as Referenced
Driving Force
Potato crop Trend/ Potato crop acreage (estimation of crop acreage)
• Prince Edward Island • Prince Edward Island (Li, 2013): Good indicator for agricultural intensity.Potato crops are a large contributor of nitrate to groundwater and thedemand for irrigation water. This indicator is easily understood bygovernment agencies and the public.
Global Population Growth Global Energy Demand Oil Prices
• Lower Athabasca • Lower Athabasca (Bayegnak, 2013) The DPSIR components have a logicalconnection to the specific sustainability goal.
Pressure
(Σ Areas with a specific class of groundwater vulnerability/ Total studied area) x 100 (UNESCO, 2007)
• Town of Gibsons• Abbotsford- Sumas• Montérégie Est Region
• Town of Gibsons (Gordon, 2013): Provides a communication tool toinform the community and business about protecting the aquifer. Myguide various land use and by-laws. The assessment maybe completedusing an indexing method and could be completed in the future toinclude land use. Inform the town on where high risks maybe withrespect to higher risk activities (e.g. existing shallow groundwater wellsnot being abandoned properly)
• Abbotsford- Sumas (Environment Canada, 2013): Aquifer vulnerability isa relative non-measurable dimensionless property.
• Montérégie Est Region (Martin, A., et al., 2013): There was concerns thatthe assessment of vulnerable areas seems problematic from theperspective of integrated water resource management.
Fertilizer Use per acre (estimation of crop acreage)
• Prince Edward Island • Prince Edward Island (Li, 2013): Good indicator for agricultural nitrateinput. This indicator is easily understood by government agencies and thepublic.
Salt use on roads (Provincial, Municipal Data)
• Prince Edward Island • Prince Edward Island (Li, 2013): This indicator requires better datareporting.
Page 88
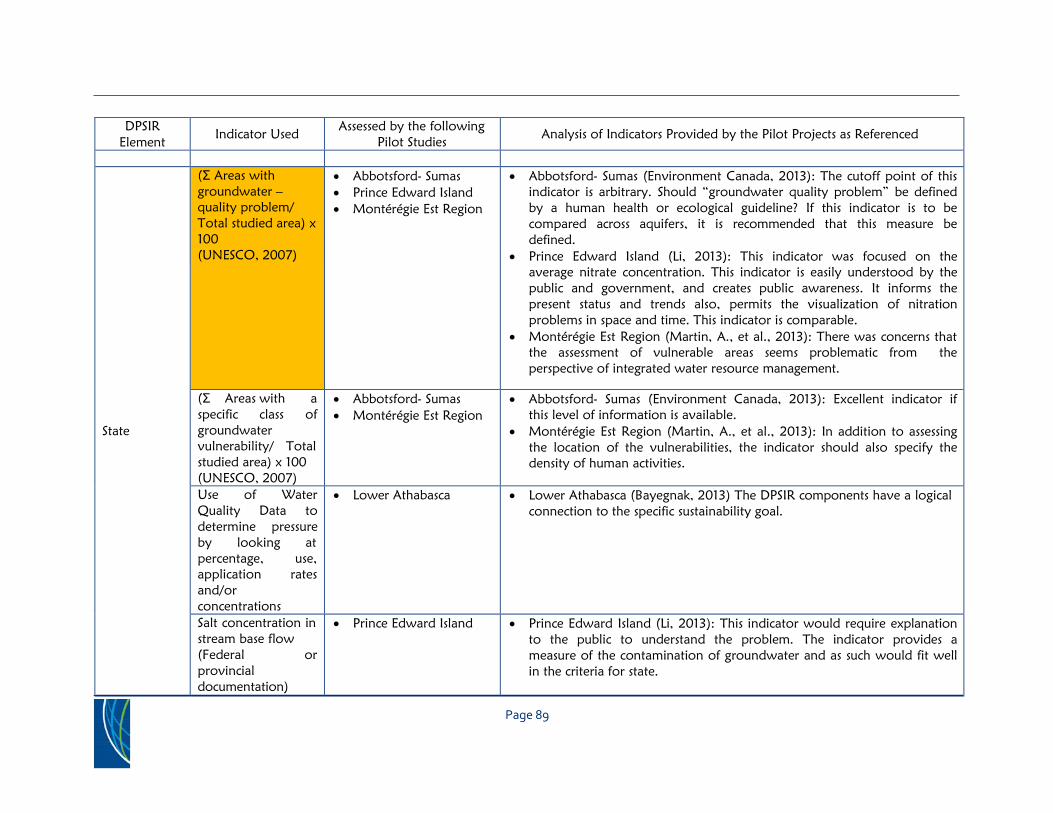
DPSIR Element
Indicator Used Assessed by the following
Pilot Studies Analysis of Indicators Provided by the Pilot Projects as Referenced
State
(Σ Areas with groundwater – quality problem/ Total studied area) x 100 (UNESCO, 2007)
• Abbotsford- Sumas• Prince Edward Island• Montérégie Est Region
• Abbotsford- Sumas (Environment Canada, 2013): The cutoff point of thisindicator is arbitrary. Should “groundwater quality problem” be definedby a human health or ecological guideline? If this indicator is to becompared across aquifers, it is recommended that this measure bedefined.
• Prince Edward Island (Li, 2013): This indicator was focused on theaverage nitrate concentration. This indicator is easily understood by thepublic and government, and creates public awareness. It informs thepresent status and trends also, permits the visualization of nitrationproblems in space and time. This indicator is comparable.
• Montérégie Est Region (Martin, A., et al., 2013): There was concerns thatthe assessment of vulnerable areas seems problematic from theperspective of integrated water resource management.
(Σ Areas with a specific class of groundwater vulnerability/ Total studied area) x 100 (UNESCO, 2007)
• Abbotsford- Sumas• Montérégie Est Region
• Abbotsford- Sumas (Environment Canada, 2013): Excellent indicator ifthis level of information is available.
• Montérégie Est Region (Martin, A., et al., 2013): In addition to assessingthe location of the vulnerabilities, the indicator should also specify thedensity of human activities.
Use of Water Quality Data to determine pressure by looking at percentage, use, application rates and/or concentrations
• Lower Athabasca • Lower Athabasca (Bayegnak, 2013) The DPSIR components have a logicalconnection to the specific sustainability goal.
Salt concentration in stream base flow (Federal or provincial documentation)
• Prince Edward Island • Prince Edward Island (Li, 2013): This indicator would require explanationto the public to understand the problem. The indicator provides ameasure of the contamination of groundwater and as such would fit wellin the criteria for state.
Page 89

DPSIR Element
Indicator Used Assessed by the following
Pilot Studies Analysis of Indicators Provided by the Pilot Projects as Referenced
State
Number of contaminated sites (Steinman et al., 2007)
• Abbotsford-Sumas• Montérégie Est Region
• Abbotsford-Sumas (Environment Canada, 2013): Although this indicatorwas not used for State, the pilot projects noted that as proposed itprovides no insight into the areal extent of volume of contaminated soilor groundwater in relation to the aquifer as a whole. It may be used as a“first cut” screening tool.
• Montérégie Est Region (Martin, A., et al., 2013): The number ofcontaminated sites does not reflect the state of groundwater,
Impact (Σ Areas with groundwater – quality problem/ Total studied area) x 100
(UNESCO, 2007)
• Town of Gibsons• Abbotsford- Sumas• Prince Edward Island• Montérégie Est Region
• Town of Gibson (Gordon, 2013)s: This indicator is useful as long as waterquality results do not indicate any problems as subtle changes in onemonitoring location are not reflected. It appears that this indicator is wellsuited for regional water quality issues or contaminated site of a relativelylarge scale in comparison to the overall project area.
• Abbotsford- Sumas (Environment Canada, 2013): The cutoff point of thisindicator is arbitrary. Should “groundwater quality problem” be definedby a human health or ecological guideline? If this indicator is to becompared across aquifers, it is recommended that this measure bedefined.
• Prince Edward Island (Li, 2013): This indicator was focused on theaverage nitrate concentration. This indicator is easily understood by thepublic and government, and creates public awareness. It informs the useron the present status and trends also, permits the visualization ofnitration problems in space and time. This indicator is comparable.
• Montérégie Est Region (Martin, A., et al., 2013): In addition to assessingthe location of the vulnerabilities, the indicator should also specify thedensity of human activities.
Suitability of water quality for its intended purposes
• Lower Athabasca • Lower Athabasca (Bayegnak, 2013) The DPSIR components have a logicalconnection to the specific sustainability goal.
Inventory of hypogean community structure
Page 90

DPSIR Element
Indicator Used Assessed by the following
Pilot Studies Analysis of Indicators Provided by the Pilot Projects as Referenced
Impact
Changes in structure of invertebrates
communities Decline in
groundwater dwelling organism
population Penetration of alien
cosmopolitan epigean species
Response
Number of Contaminated Sites (Steinman et al., 2007)
• Town of Gibsons• Abbotsford- Sumas• Montérégie Est Region
• Town of Gibsons: This indicator was not useful to the Town as the clean- up of contaminated sites is not under their jurisdiction.
• Abbotsford- Sumas: Degradation of groundwater quality can lead toenvironmental degradation, decreases in water use efficiently and wateruse conflicts. The number of contaminated sites should stabilize and thendecline as more suitable practices are implemented. If this indicator is tobe compared across aquifers it is recommended that the number of sitesbe shown as a fraction of the total area (areal extent of the aquifer).
• Montérégie Est Region (Martin, A., et al., 2013): Rather than using thedensity of contaminated land, they suggest using the potentially pollutingactivities to assess the potential for contamination. The number ofcontaminated sites does not reflect the state of groundwater,
Indicators with respect to monitoring of contaminates (eg, pesticides and Ecoli)
• Prince Edward Island • Prince Edward Island (Li, 2013): These indicators may not be easilyunderstood depending on the parameters looked at. It will help tomonitoring infrastructure upgrades and indicate if farm practices areadequate.
Page 91
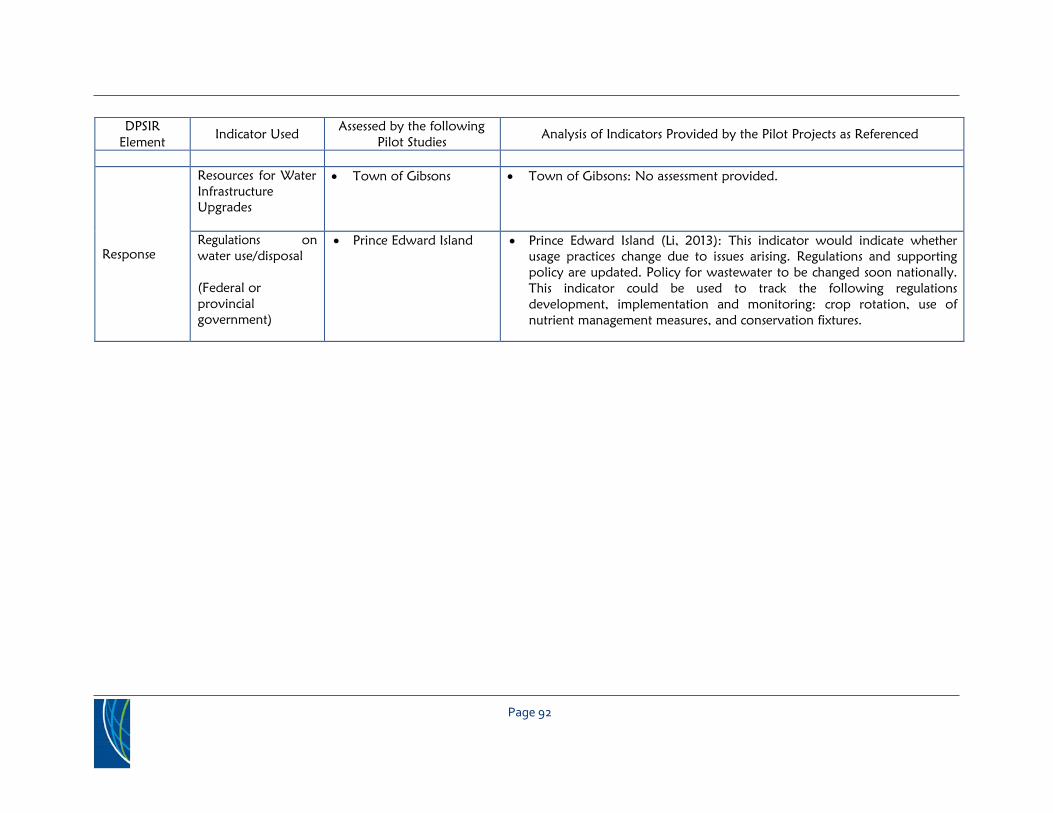
DPSIR Element
Indicator Used Assessed by the following
Pilot Studies Analysis of Indicators Provided by the Pilot Projects as Referenced
Response
Resources for Water Infrastructure Upgrades
• Town of Gibsons • Town of Gibsons: No assessment provided.
Regulations on water use/disposal
(Federal or provincial government)
• Prince Edward Island • Prince Edward Island (Li, 2013): This indicator would indicate whetherusage practices change due to issues arising. Regulations and supportingpolicy are updated. Policy for wastewater to be changed soon nationally.This indicator could be used to track the following regulationsdevelopment, implementation and monitoring: crop rotation, use ofnutrient management measures, and conservation fixtures.
Page 92

Table 3: Summary of Indicators Used by Pilot Projects Goal 3- Ecosystems
DPSIR Element
Indicator Used Assessed by the following
Pilot Studies Analysis of Indicators Provided by the Pilot Projects as Referenced
Driving Force Global Population Growth Global Energy Demand Oil Prices
• Lower Athabasca • Lower Athabasca (Bayegnak, 2013): The DPSIR components have alogical connection to the specific sustainability goal.
Pressure Number of species at risk associated with streams/ riparian habitat (BC Species and Indicator Explorer)
• Abbotsford- Sumas • Abbotsford- Sumas (Environment Canada, 2013): This proposed indicatoris to assess the pressure to species at risk dwelling within streams orriparian areas which may be impacted by groundwater baseflow qualityor changes to quantity. Changes to the number of identified species at riskand their status may provide some indicator of ecosystem health.
State
Groundwater contribution to baseflow (Steinman, 2007)
• Town of Gibsons• Abbotsford- Sumas• Montérégie Est Region
• Town of Gibsons (Gordon, 2013): Important indicator within the Townboundaries due to the presence of groundwater fed salmon in the creek.Data sourcing limitations exist.
• Abbotsford- Sumas (Environment Canada, 2013): This indicator could becritically important for aquifers with surface water receiving bodiessupporting endangered or threatened species, or supporting speciesimportant from a resource perspective.
• Montérégie Est Region (Martin, A., et al., 2013): This should beformulated as an average of the total flow. Therefore, allowing forcomparisons to be made.
Groundwater quality impacts on baseflow (Environment Canada stream water quality monitoring)
• Abbotsford- Sumas • Abbotsford- Sumas (Environment Canada, 2013): This indicator wasproposed to address potential impacts to stream water quality frombaseflow. If surface water quality does not meet the applicable guidelinesthen aquatic life may be affected. This indicator is important if there areany species at risk noted in the area.
Page 93

DPSIR Element
Indicator Used Assessed by the following
Pilot Studies Analysis of Indicators Provided by the Pilot Projects as Referenced
Impact
Groundwater quality impacts on baseflow (Environment Canada stream water quality monitoring)
• Abbotsford- Sumas • Abbotsford- Sumas (Environment Canada, 2013): This indicator wasproposed to address potential impacts to stream water quality frombaseflow. If surface water quality does not meet the applicable guidelinesthen aquatic life may be affected. This indicator is important if there areany species at risk noted in the area.
Groundwater contribution to baseflow (Steinman, 2007)
• Montérégie Est Region • Montérégie Est Region (Martin, A., et al., 2013): This should beformulated as a average of the total flow. Therefore, allowing forcomparisons to be made.
Impact Number of species at risk associated with streams/ riparian habitat (BC Species and Indicator Explorer)
• Abbotsford- Sumas • Abbotsford- Sumas (Environment Canada, 2013): This proposed indicatoris to assess the impacts to species at risk dwelling within streams orriparian areas which may be impacted by groundwater baseflow qualityor changes to quantity. Changes to the number of identified species at riskand their status may provide some indicator of ecosystem health.
Ecosystem dependence on groundwater
• Lower Athabasca • Lower Athabasca (Bayegnak, 2013) The DPSIR components have a logicalconnection to the specific sustainability goal.
Response No indicators were presented in the Gordon Report. No specific indicators were developed by the Pilot Projects. Narrative provided by Abbotsford- Sumas and Lower Athabasca pilot projects. WESA assumes that all pilots considered this DPSIR Framework element in their assessment.
Page 94
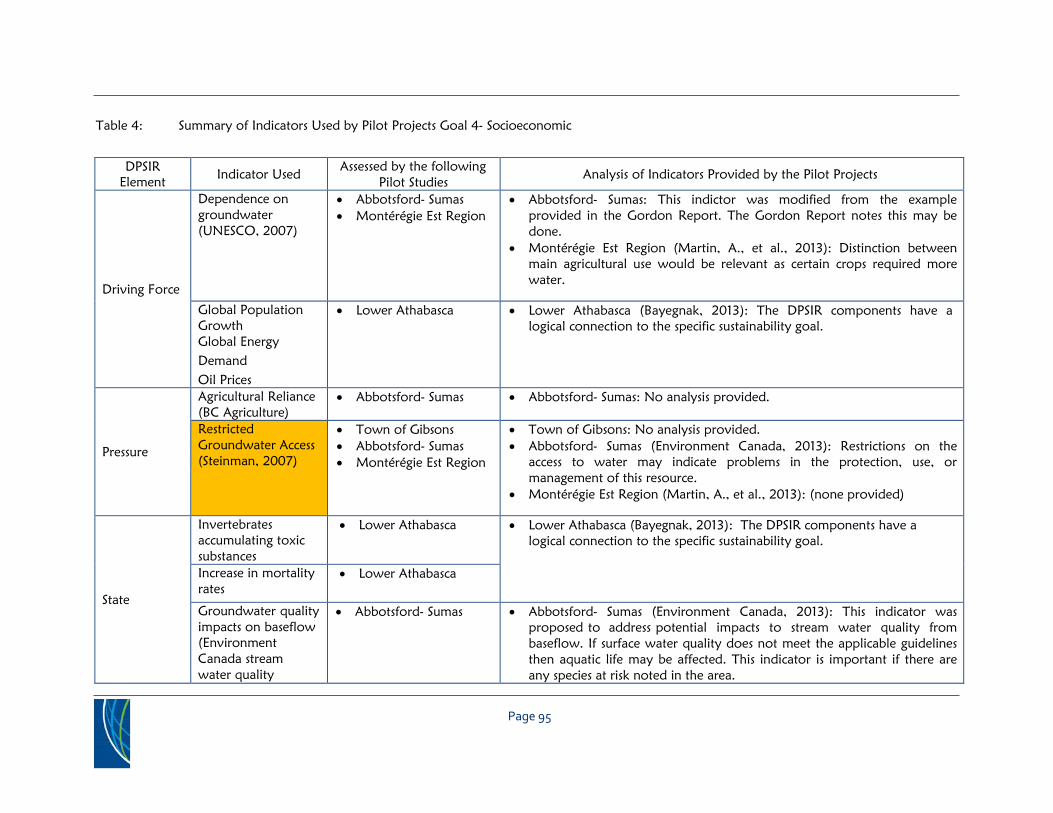
Table 4: Summary of Indicators Used by Pilot Projects Goal 4- Socioeconomic
DPSIR Element Indicator Used
Assessed by the following Pilot Studies
Analysis of Indicators Provided by the Pilot Projects
Driving Force
Dependence on groundwater (UNESCO, 2007)
• Abbotsford- Sumas• Montérégie Est Region
• Abbotsford- Sumas: This indictor was modified from the exampleprovided in the Gordon Report. The Gordon Report notes this may bedone.
• Montérégie Est Region (Martin, A., et al., 2013): Distinction betweenmain agricultural use would be relevant as certain crops required morewater.
Global Population Growth Global Energy Demand Oil Prices
• Lower Athabasca • Lower Athabasca (Bayegnak, 2013): The DPSIR components have alogical connection to the specific sustainability goal.
Pressure
Agricultural Reliance (BC Agriculture)
• Abbotsford- Sumas • Abbotsford- Sumas: No analysis provided.
Restricted Groundwater Access (Steinman, 2007)
• Town of Gibsons• Abbotsford- Sumas• Montérégie Est Region
• Town of Gibsons: No analysis provided.• Abbotsford- Sumas (Environment Canada, 2013): Restrictions on the
access to water may indicate problems in the protection, use, ormanagement of this resource.
• Montérégie Est Region (Martin, A., et al., 2013): (none provided)
State
Invertebrates accumulating toxic substances
• Lower Athabasca • Lower Athabasca (Bayegnak, 2013): The DPSIR components have alogical connection to the specific sustainability goal.
Increase in mortality rates
• Lower Athabasca
Groundwater quality impacts on baseflow (Environment Canada stream water quality
• Abbotsford- Sumas • Abbotsford- Sumas (Environment Canada, 2013): This indicator wasproposed to address potential impacts to stream water quality frombaseflow. If surface water quality does not meet the applicable guidelinesthen aquatic life may be affected. This indicator is important if there areany species at risk noted in the area.
Page 95

DPSIR Element
Indicator Used Assessed by the following
Pilot Studies Analysis of Indicators Provided by the Pilot Projects
monitoring)
Impact
Restricted Groundwater Access (Steinman, 2007)
• Abbotsford-Sumas • Abbotsford- Sumas (Environment Canada, 2013): Restrictions on theaccess to water may indicate problems in the protection, use, ormanagement of this resource.
Lower Water Levels • Lower Athabasca • Lower Athabasca (Bayegnak, 2013): The DPSIR components have alogical connection to the specific sustainability goal.
Response
Price of Water
(City of Abbotsford 2011 general use water utility rate)
• Abbotsford- Sumas • Abbotsford- Sumas (Environment Canada, 2013): Lack of cost ormonetary value could have an impact on groundwater sustainability. Thisis especially true for the quantity goal.
Restricted Groundwater Access (Steinman, 2007)
• Abbotsford- Sumas• Montérégie Est Region
• Abbotsford- Sumas (Environment Canada, 2013): Restrictions on theaccess to water may indicate problems in the protection, use, ormanagement of this resource.
• Montérégie Est Region (Martin, A., et al., 2013): (none provided)
Efficiency of groundwater Use (Steinman, 2007)
• Town of Gibsons• Montérégie Est Region
• Town of Gibsons (Gordon, 2013): This response indicator is very usefulto the Town because managing of their water infrastructure is one oftheir key municipal functions.
• Montérégie Est Region (Martin, A., et al., 2013): (none provided)
Page 96

Table 5: Summary of Indicators Used by Pilot Projects Goal 5- Governance
DPSIR Element Indicator Used
Assessed by the following Pilot Studies
Analysis of Indicators Provided by the Pilot Projects as Referenced
Driving Force
Global Population Growth Global Energy Demand Oil Prices
• Lower Athabasca • Lower Athabasca (Bayegnak, 2013): The DPSIR components have alogical connection to the specific sustainability goal.
Pressure
Government Pressure to implement measures to alleviate pressure on groundwater resources.
• Lower Athabasca • Lower Athabasca (Bayegnak, 2013): The DPSIR components have alogical connection to the specific sustainability goal.
State
Mandatory Monitoring
• Lower Athabasca • Lower Athabasca (Bayegnak, 2013): The DPSIR components have alogical connection to the specific sustainability goal.
Impact No indicators were presented in the Gordon Report. No specific indicators were developed by the Pilot Projects. Narrative provided by Abbotsford- Sumas pilot project. WESA assumes that all pilots considered this DPSIR Framework element in their assessment.
Response
Government Action/ Groundwater Program Resources (various)
• Abbotsford- Sumas• Montérégie Est Region
• Abbotsford- Sumas (Environment Canada, 2013): The lack ofgroundwater licensing and/or permitting of use is considered a gap and apotential pressure towards unsuitable use of groundwater resources. Thisincludes the lack of requirements to report.
• Montérégie Est Region (Martin, A., et al., 2013): Questions were raisedabout using the governance of human resources as in indicator. In allcases it is not appropriate to sue an indicator. This indicator should takeinto account the distinction between management and governance.
Levels of Government with interest in the Aquifer (Golder 2011)
• Abbotsford- Sumas • Abbotsford- Sumas (Environment Canada, 2013): The lack ofgroundwater licensing and/or permitting of use is considered a gap and apotential pressure towards unsuitable use of groundwater resources. Thisincludes the lack of requirements to report.
Page 97
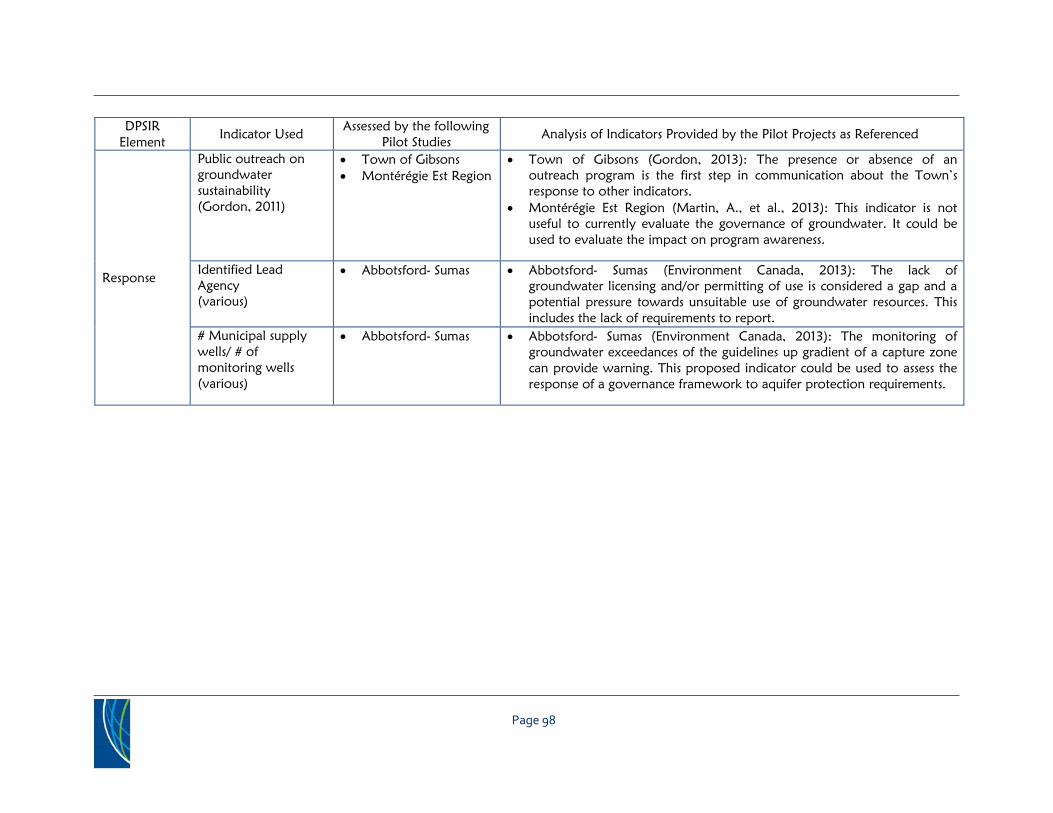
DPSIR Element
Indicator Used Assessed by the following
Pilot Studies Analysis of Indicators Provided by the Pilot Projects as Referenced
Response
Public outreach on groundwater sustainability (Gordon, 2011)
• Town of Gibsons• Montérégie Est Region
• Town of Gibsons (Gordon, 2013): The presence or absence of anoutreach program is the first step in communication about the Town’sresponse to other indicators.
• Montérégie Est Region (Martin, A., et al., 2013): This indicator is notuseful to currently evaluate the governance of groundwater. It could beused to evaluate the impact on program awareness.
Identified Lead Agency (various)
• Abbotsford- Sumas • Abbotsford- Sumas (Environment Canada, 2013): The lack ofgroundwater licensing and/or permitting of use is considered a gap and apotential pressure towards unsuitable use of groundwater resources. Thisincludes the lack of requirements to report.
# Municipal supply wells/ # of monitoring wells (various)
• Abbotsford- Sumas • Abbotsford- Sumas (Environment Canada, 2013): The monitoring ofgroundwater exceedances of the guidelines up gradient of a capture zonecan provide warning. This proposed indicator could be used to assess theresponse of a governance framework to aquifer protection requirements.
Page 98

APPENDIX C
WESA Template Provided to the Pilot Projects
Page 99
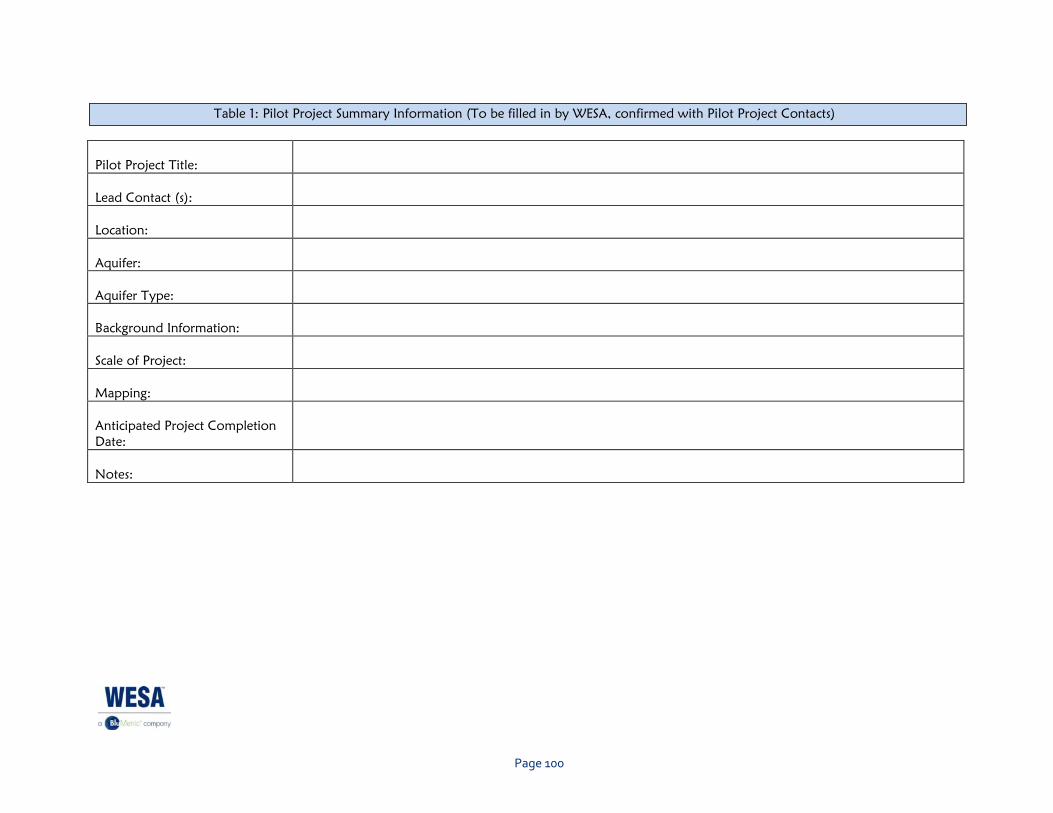
Pilot Project Title:
Lead Contact (s):
Location:
Aquifer:
Aquifer Type:
Background Information:
Scale of Project:
Mapping:
Anticipated Project Completion Date:
Notes:
Table 1: Pilot Project Summary Information (To be filled in by WESA, confirmed with Pilot Project Contacts)
Page 100
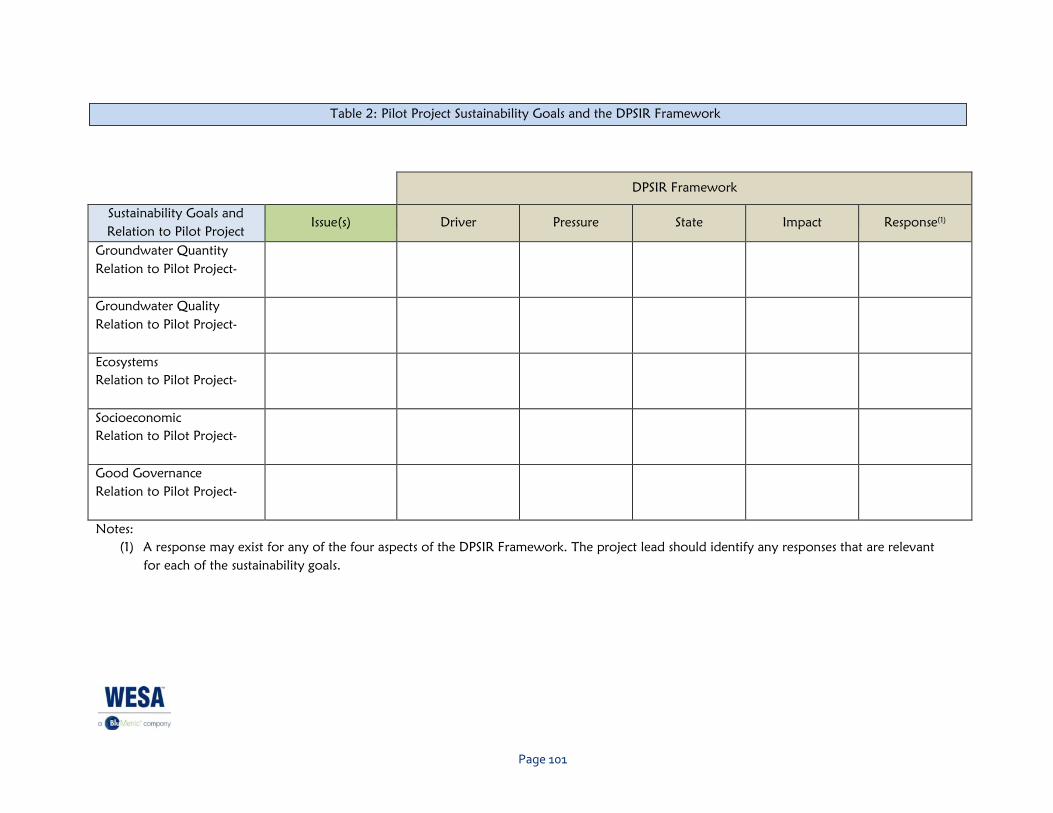
DPSIR Framework
Sustainability Goals and Relation to Pilot Project
Issue(s) Driver Pressure State Impact Response(1)
Groundwater Quantity Relation to Pilot Project-
Groundwater Quality Relation to Pilot Project-
Ecosystems Relation to Pilot Project-
Socioeconomic Relation to Pilot Project-
Good Governance Relation to Pilot Project-
Notes: (1) A response may exist for any of the four aspects of the DPSIR Framework. The project lead should identify any responses that are relevant
for each of the sustainability goals.
Table 2: Pilot Project Sustainability Goals and the DPSIR Framework
Page 101

DPSIR Framework
Indicator Assessment Criteria
Data Used and Source
Data Considerations (Data Gaps, Uncertainty,
Assumptions)
Statistical Properties Management and Reporting Appropriateness of indicators based on DPSIR framework
Comments
Driver – Quantity: Renewable groundwater resources per capita (m3/yr)
Socioeconomic- Example: Dependence of agricultural population on groundwater= (number of farmers etc./ population) x100
Pressure – Quality- Groundwater vulnerability= (Σ Areas with a specific class of groundwater vulnerability/ Total studied area) x100
Socioeconomic- restricted groundwater access
State – Quantity- total groundwater (abstraction/ recharge) x 100
Quantity- (Σ Areas with groundwater depletion problem/ Total studied area) x100
Quality- (Σ Areas with groundwater quality problem/ Total studied area) x100
Quality- Groundwater vulnerability= (Σ Areas with a specific class of groundwater vulnerability/ Total studied area) x100
Ecosystems- Groundwater contribution to base flow
Table 3: Groundwater Sustainability Indicator Evaluation using the DPSIR Framework
Page 102
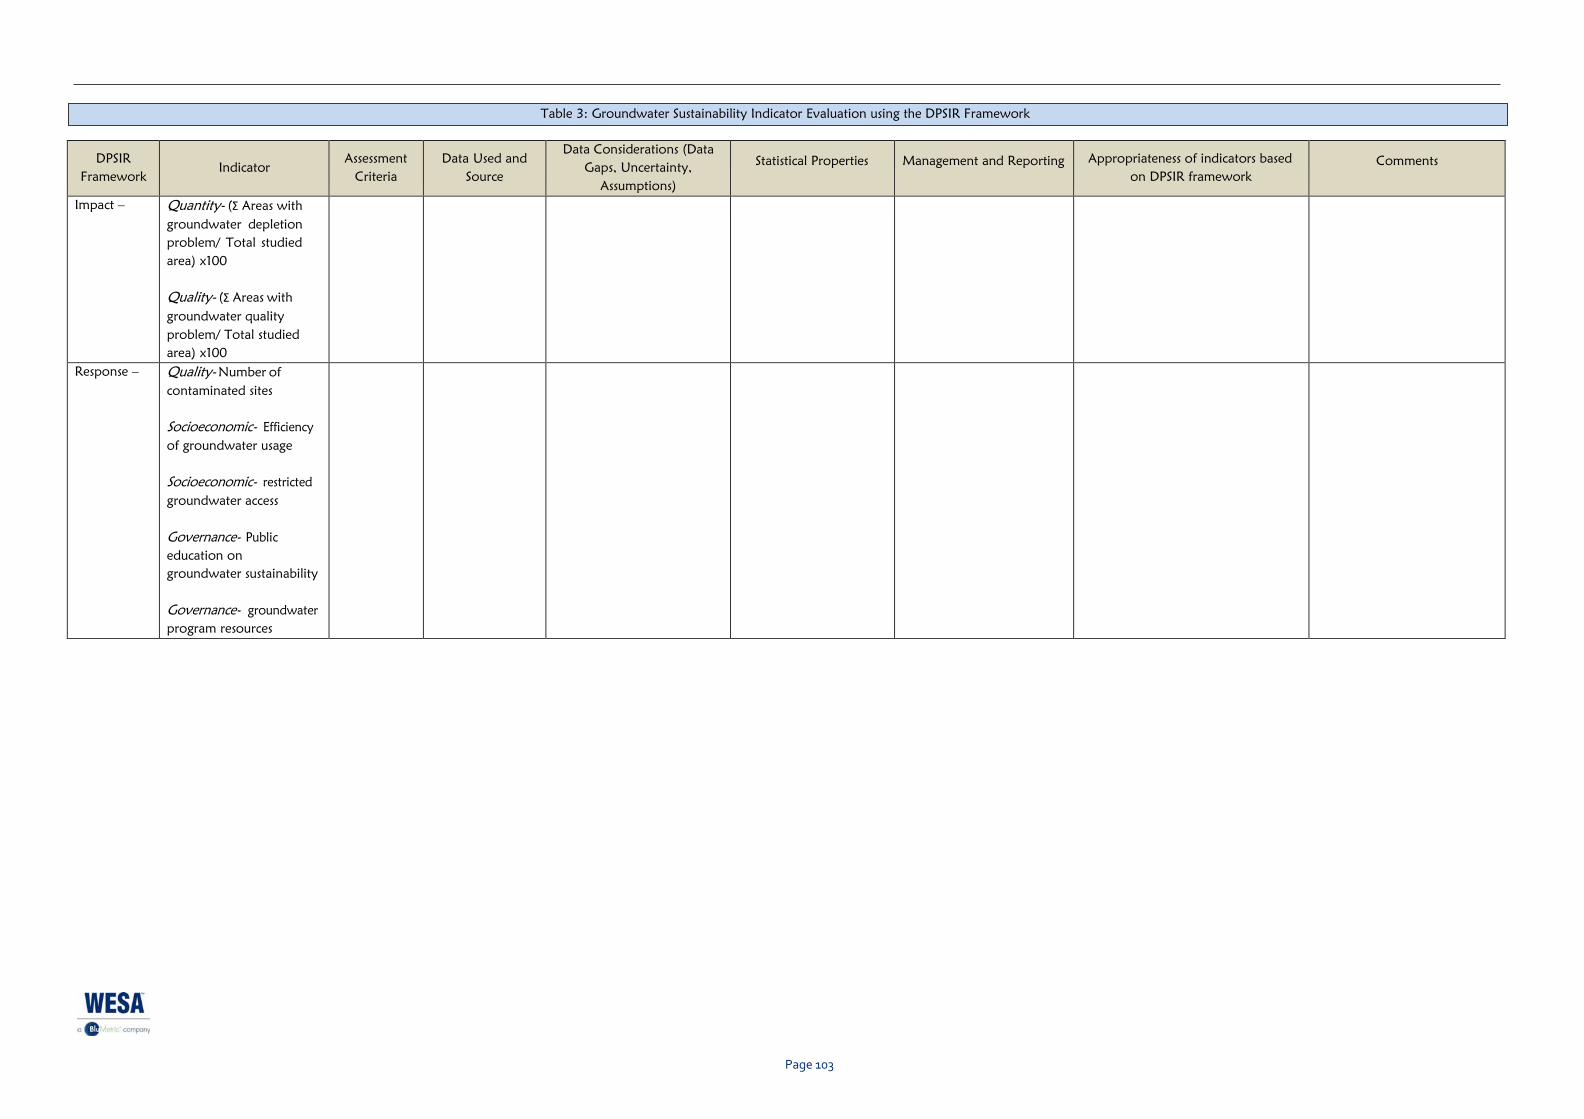
DPSIR Framework
Indicator Assessment
Criteria Data Used and
Source
Data Considerations (Data Gaps, Uncertainty,
Assumptions)
Statistical Properties Management and Reporting Appropriateness of indicators based on DPSIR framework
Comments
Impact – Quantity- (Σ Areas with groundwater depletion problem/ Total studied area) x100
Quality- (Σ Areas with groundwater quality problem/ Total studied area) x100
Response – Quality- Number of contaminated sites
Socioeconomic- Efficiency of groundwater usage
Socioeconomic- restricted groundwater access
Governance- Public education on groundwater sustainability
Governance- groundwater program resources
Table 3: Groundwater Sustainability Indicator Evaluation using the DPSIR Framework
Page 103
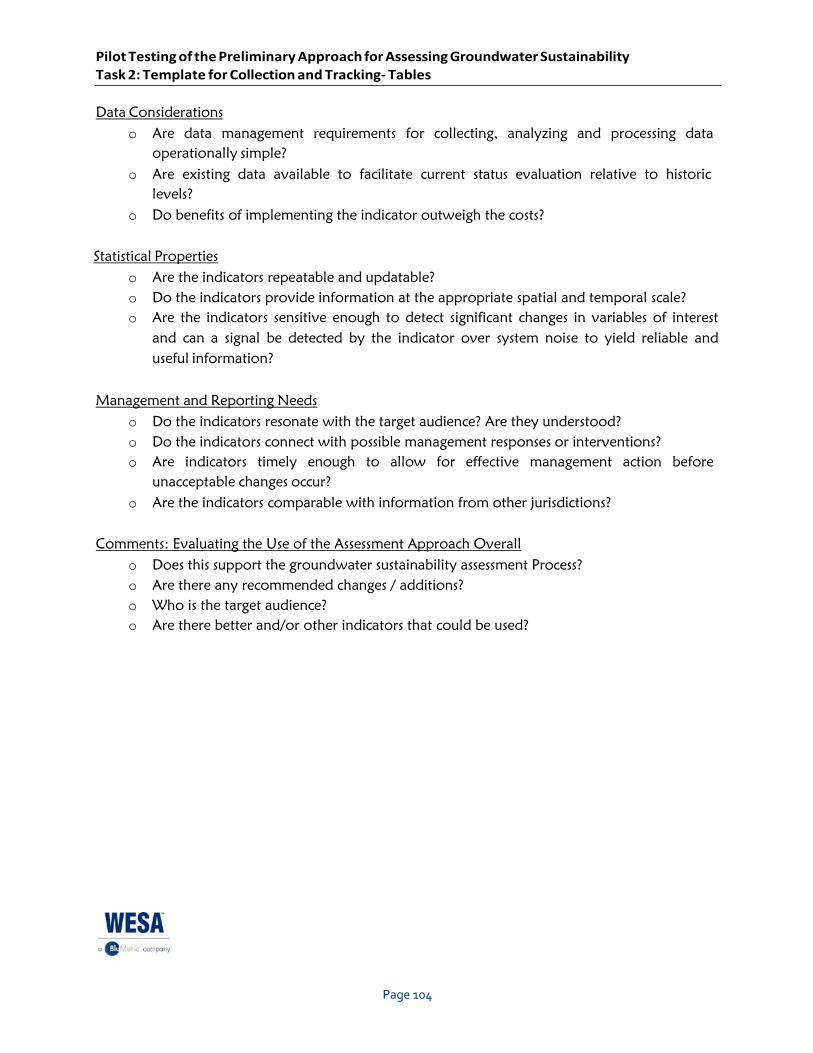
Pilot Testing of the Preliminary Approach for Assessing Groundwater Sustainability Task 2: Template for Collection and Tracking- Tables
Data Considerations o Are data management requirements for collecting, analyzing and processing data
operationally simple?o Are existing data available to facilitate current status evaluation relative to historic
levels?o Do benefits of implementing the indicator outweigh the costs?
Statistical Properties o Are the indicators repeatable and updatable?o Do the indicators provide information at the appropriate spatial and temporal scale?o Are the indicators sensitive enough to detect significant changes in variables of interest
and can a signal be detected by the indicator over system noise to yield reliable anduseful information?
Management and Reporting Needs o Do the indicators resonate with the target audience? Are they understood?o Do the indicators connect with possible management responses or interventions?o Are indicators timely enough to allow for effective management action before
unacceptable changes occur?o Are the indicators comparable with information from other jurisdictions?
Comments: Evaluating the Use of the Assessment Approach Overall o Does this support the groundwater sustainability assessment Process?o Are there any recommended changes / additions?o Who is the target audience?o Are there better and/or other indicators that could be used?
Page 104

Groundwater Sustainability Goal
Driving Force
Pressure Impact
Human Pressures Economic and Social
Responses
Natural Pressures Ecosystem
State
Page 105