assessment of value creation in private equity: the
TRANSCRIPT
!
I
!
FUNDAÇÃO!GETULIO!VARGAS!ESCOLA BRASILEIRA DE ADMINISTRAÇÃO PÚBLICA E DE EMPRESAS MESTRADO EXECUTIVO EM GESTÃO EMPRESARIAL
!
ASSESSMENT OF VALUE CREATION IN PRIVATE EQUITY: THE ACQUISITION OF BURGER KING BY
3G CAPITAL
DISSERTAÇÃO APRESENTADA À ESCOLA BRASILEIRA DE ADMINISTRAÇÃO PÚBLICA E DE EMPRESAS PARA OBTENÇÃO DO GRAU DE MESTRE
DANIEL!JOBST!ELMAR!HOENE!Rio de Janeiro - 2016

Ficha&catalográfica&&elaborada&pela&Biblioteca&Mario&Henrique&Simonsen/FGV&
&&&Hoene,&Daniel&Jobst&Elmar&&&&&&Assessment&of&value&creation&in&private&equity:&the&acquisition&of&Burger&King&&by&3G&Capital&/&Daniel&Jobst&Elmar&Hoene.&J&2016.&&&&&82&f.&& &&Dissertação&(mestrado)&J&Escola&Brasileira&de&Administração&Pública&e&de&Empresas,&Centro&de&Formação&Acadêmica&e&Pesquisa.&&&Orientador:&Ronaldo&Couto&Parente.&&&Inclui&bibliografia.&&
&&1.&Private&equity&(Finanças)&–&Estudo&de&casos.&2.&Valor&(Economia)&–&Estudo&de&casos.&3.&Investimentos&–&Estudo&de&casos.&I.&Parente,&Ronaldo&Couto.&&II.&Escola&Brasileira&de&Administração&Pública&e&de&Empresas.&Centro&de&Formação&Acadêmica&e&Pesquisa.&III.&Título.&&
&&&&&&&&&&&&&&&&&&&&&&&&&&&&&&&&&&&&&&&&&&&&&&&&&&&&&&&&&&&&&&&&&&&&&&&&&&&&&&&&&&&&CDD&–&658.15224&&

!
II
Abstract This thesis elaborates the creation of value in private equity and in particular analyzes value
creation in 3G Capital’s acquisition of Burger King. In this sense, a specific model is applied
that composes value creation into several drivers, in order to answer the question of how value
creation can be addressed in private equity investments. Although previous research by
Achleitner et al. (2010) introduced a specific model that addresses value creation in private
equity, the respective model was neither applied to an individual company, nor linked to
indirect drivers that explain the dynamics and rationales for the creation of value. In turn this
paper applies the quantitative model to an ongoing private equity investment and thereby
provides different extensions to turn the model into a better forecasting model for ongoing
investments, instead of only analyzing a deal that has already been divested from an ex post
perspective. The chosen research approach is a case study about the Burger King buyout that
first includes an extensive review about the current status of academic literature, second a
quantitative calculation and qualitative interpretation of different direct value drivers, third a
qualitative breakdown of indirect drivers, and lastly a recapitulating discussion about value
creation and value drivers. Presenting a very successful private equity investment and
elaborately demonstrating the dynamics and mechanisms that drive value creation in this case,
provides important implications for other private equity firms as well as public firms in order
to develop their proprietary approach towards value creation.

!
III
List of Abbreviations APV Adjusted Present Value CAPEX Capital Expenditures CEO Chief Executive Officer DCF Discounted Cash-Flow D/E Debt to equity ratio EBITDA Earnings Before Interest Taxes Depreciation and Appreciation EBITDAEntry EBITDA at the entry point (acquisition stage) EBITDAExit EBITDA at the exit point (divestment stage) ESOP Employee Stock Ownership Plans EV Enterprise value EV/EBITDA EV/EBITDA Multiple FTE Full time equivalent GP General partner IRR Internal Rate of Return LBO Leveraged buyout LP Limited partner MBI Management Buy-In MBO Management Buy-Out MultipleEntry EV/EBITDA multiple at the entry point (acquisition stage) MultipleExit EV/EBITDA multiple at the exit point (divestment stage) NWC Net working capital (P&L) Profit & Loss statement. RL Levered return RU Unlevered return SBO Secondary buyout S&P 500 Standard & Poor’s 500 Index t Average corporate tax rate WC Working capital

!
IV
List of Figures FIGURE 1: PROFIT & LOSS STATEMENT OF BURGER KING WORLDWIDE BASED ON OWN CALCULATIONS ............... 39 FIGURE 2: DCF VALUATION METHHOD RESULTS OF BURGER KING, BASED ON OWN CALCULATIONS. .................... 40 FIGURE 3: MONEY MULTIPLE CONTRIBUTION OF EACH VALUE DRIVER, INCLUDING ENTRY EQUITY VALUE ............ 46 FIGURE 4 COMPOSITION OF IRR: DIFFERENT PERCENTAGE CONTRIBUTION OF VALUE DRIVERS ............................. 46 FIGURE 5: RELATIVE VALUE CONTRIBUTION OF VALUE DRIVERS (BURGER KING VS. ACHLEITNER 2010) .............. 54

!
V
List of Appendices APPENDIX 1: STRUCTURE OF THE PAPER, SOURCE: OWN ILLUSTRATION ................................................................. 68
APPENDIX 2: STRUCTURE OF THE LITERATURE REVIEW AND THE SUBSEQUENT ANALYSIS ...................................... 69
APPENDIX 3: OVERVIEW OF THE MAIN STEPS IN A BUYOUT PROCESS ........................................................................... 69
APPENDIX 4: VALUE GENERATION IN LBOS AFTER BERG & GOTTSCHALG (2005) ................................................. 70
APPENDIX 5: DIMENSIONS OF CORPORATE GOVERNANCE ........................................................................................ 71
APPENDIX 6: REPRESENTATION OF THE MAIN RESULTS OF THE STUDY OF ACHLEITNER ET AL. (2010) ................... 72
APPENDIX 7: HIGHLIGHT OF THE DRIVERS THAT ARE COVERED BY THE ACHLEITNER MODEL ...................................... 72
APPENDIX 8: PEER GROUP SELECTION, MULTIPLES AND BETA CALCULATION ......................................................... 72
APPENDIX 9: SALES FORECAST AS THE BASIS FOR THE DCF VALUATION ................................................................ 73
APPENDIX 10: COST OF EQUITY AND WACC CALCULATION ................................................................................... 73
APPENDIX 11: ENTERPRISE VALUE OF BURGER KING BETWEEN 2009 AND 2013 .................................................... 74
APPENDIX 12: SUBDRIVERS OF THE OPERATIONAL IMPROVEMENT EFFECT ............................................................. 74
APPENDIX 13: PROPOSITION OF ALTERNATIVE METHODS TO ASSESS THE CASH FLOW EFFECT ................................ 74
APPENDIX 14: TIMES MONEY MULTIPLE OF BURGER KING AND MCDONALD’S ...................................................... 75
APPENDIX 15: EXTENSION TO THE MULTIPLE EFFECT APPLIED TO BURGER KING AND MCDONALDS’S, ................. 75
APPENDIX 16: TIMES MONEY MULTIPLE OF BURGER KING VS. ACHLEITNER ET AL. (2010) .......................................... 76
APPENDIX 17: INTERVIEW WITH TIM BRUGGEMANN, CONDUCTED VIA SKYPE ON NOVEMBER 29TH 2015 ............... 77

!
VI
Table of Contents 1 INTRODUCTION .............................................................................................................................. 7
1.1 CONTEXTUALIZATION AND RELEVANCE OF THE PROBLEM .......................................................... 7 1.2 JUSTIFICATION OF THE THEME SELECTION ................................................................................... 9 1.3 STRUCTURING OF THE PAPER ...................................................................................................... 10
2 LITERATURE REVIEW AND THEORETICAL DEVELOPMENT ........................................ 11 2.1 UNDERSTANDING PRIVATE EQUITY ............................................................................................. 11 2.2 THE BURGER KING BUYOUT ........................................................................................................ 13
2.2.1 Burger King Holdings Inc. before the buyout ...................................................................... 13 2.2.2 3G Capital - a global investment firm .................................................................................. 14 2.2.3 The course of the Burger King buyout ................................................................................. 14 2.2.4 The post-acquisition phase ................................................................................................... 15
2.3 VALUE CREATION IN PRIVATE EQUITY INVESTMENTS (LBOS) .................................................. 16 2.4 DIRECT DRIVERS OF VALUE CREATION ........................................................................................ 19
2.4.1 Value through leverage ........................................................................................................ 19 2.4.2 Value through the multiple effect ......................................................................................... 21 2.4.3 Value through operational improvement ............................................................................. 22
2.5 INDIRECT DRIVERS OF VALUE CREATION ..................................................................................... 26 2.5.1 Corporate governance ......................................................................................................... 26 2.5.2 Incentives .............................................................................................................................. 28
3 PROPOSITIONS AND EXPECTED RESULTS ........................................................................... 30 4 METHODOLOGY ........................................................................................................................... 33
4.1 PRESENTATION AND DESCRIPTION OF THE METHOD TO BE USED ............................................... 33 4.2 BASIC ASSUMPTIONS ADOPTED AND LIMITATIONS OF THE METHOD .......................................... 36
5 QUANTITATIVE ANALYSIS OF DIRECT DRIVERS .............................................................. 38 5.1 VALUATION AND CALCULATION OF IRR ..................................................................................... 38
5.1.1 Using market multiples ........................................................................................................ 38 5.1.2 Discounted Cash-flow approach (DCF) .............................................................................. 38 5.1.3 Using market capitalization ................................................................................................. 40 5.1.4 Calculation of the IRR .......................................................................................................... 41
5.2 ANALYSIS OF DIRECT DRIVERS (COMPOSITION OF IRR FROM THE ACHLEITNER MODEL) .......... 41 5.2.1 The effect of leverage ........................................................................................................... 42 5.2.2 The multiple effect ................................................................................................................ 42 5.2.3 The effect of operational improvement ................................................................................ 44 5.2.4 Relative importance of value drivers ................................................................................... 45
6 QUALITATIVE ANALYSIS OF INDIRECT DRIVERS ............................................................ 48 6.1 CORPORATE GOVERNANCE .......................................................................................................... 48 6.2 INCENTIVES .................................................................................................................................. 51
7 DISCUSSION AND CONCLUSION .............................................................................................. 53 7.1 VALUE CREATION IN THE BURGER KING BUYOUT ...................................................................... 53 7.2 DISCUSSION OF DIRECT DRIVERS ................................................................................................. 54 7.3 DISCUSSION OF INDIRECT DRIVERS .............................................................................................. 59 7.4 CONCLUDING REMARKS ............................................................................................................... 61
8 BIBLIOGRAPHY ............................................................................................................................. 63 8.1 ACADEMIC REFERENCES .............................................................................................................. 63 8.2 OTHER REFERENCES ..................................................................................................................... 66
9 APPENDICES ................................................................................................................................... 68
!
7
1 Introduction
1.1 Contextualization and Relevance of the Problem
In line with the current peak in worldwide mergers and acquisitions activity, the volume of
private equity investments dramatically surged in the first half of the year 2015. The Global
M&A deal making totaled US$2.2 trillion after the first two quarters in 2015, whereas, financial
sponsor1 deal volume reached US$413 billion in the same time period, which accounts for
approximately 18,5% of total M&A deal volume. Mainly driven by a boost in deals with a
volume of over $5 billion, this respectively equals a 40% increase for global M&A deal volume,
and beyond that a 49% increase in financial sponsor activity compared to the previous year
20142. Not only due to the absolute growth rates of private equity investments, but also given
the relative proportion to overall M&A volume, it appears as private equity is back on track.
After tumbling in the post- financial crisis era, the year 2014 was the strongest year since the
all-time record year of private equity in 20073.
Yet, despite the recent and former success story of private equity, the question if LBOs create
value and achieve superior returns is discussed contradictorily within existing academic
research. Recent papers by Achleitner et al. (2011) and Acharya et al. (2012) found that private
equity houses achieve higher financial risk-adjusted returns for their portfolio companies,
compared to their public peers. In contrast, a previous study by Kaplan & Schoar (2005) found,
that average buyout fund’s returns, net of fees, are not substantially exceeding the average S&P
500 returns. However, results are reported to be highly heterogeneous, as fund size and maturity
are reported to be contributing factors to positive fund performance.
The past twenty-five years have seen increasingly rapid and diverse advances in the field of
value creation and sources of value in leveraged buyouts. On the one hand, Jensen (1989) shows
how substantial leverage can be a valid explanation for value creation in LBOs. On the other
hand, parallel research by Kaplan (1989b) and Lichtenberg & Siegel (1990) reports that
operating performance and productivity are predominant explanations for value creation in
private equity investments. More recent developments in the field of leveraged buyouts and
private equity, have led to a renewed interest in creation of value as well as it’s different drivers.
As increased regulation derogates outrageous leverage ratios in today’s LBO transactions,
1 Note that LBO or private equity firms are frequently named as financial sponsors. 2 Thomson Reuters (2015): Mergers & Acquisitions Review – First Half 2015. 3 Thomson Reuters (2014): Mergers & Acquisitions Review – Full Year 2014.

!
8
operational performance improvement is becoming increasingly relevant, in both, academic
papers and practitioner’s reviews4 (Guo et al. 2011; Acharya et al. 2012).
The following paper, will analyze the question of how value creation can be assessed in private
equity investments and what are thereby the main drivers of value creation. Hence, the
following research question is formulated:
RQ1: How to assess value creation in private equity investments
The primary relevance of this paper is to apply the value creation model of Achleitner et al.
(2010) on a single company. By analyzing the research question by means of the Burger King
example, it will be shown that value creation is not purely a matter of tax benefits due to high
leverage ratios, but rather a more complex construct that includes many different drivers on
different levels. The problem of former models that analyze value creation in the private equity
context is that operational and financial risk are not separately analyzed. Applying the value
creation model of (Achleitner et al. 2010; Achleitner & Capital Dynamics 2009), allows to
separate returns that are attributable to leverage, from unlevered returns. Additionally, the direct
drivers are complemented by an analysis of indirect drivers that seek to explain the resulting
direct drivers.
Moreover, as Shimizu et al. (2004) already suggested years ago that learning from successful
mergers can be a relevant source of competitive advantage, the aim of this paper is to show how
a successful private equity transaction can create value. On this note managerial
recommendation will be inferred that might also be transferable and applicable in other cases.
The relevance of this paper is first of all to correctly apply the Achleitner et al. (2010) model
on one specific deal and thereby showing different drivers of value creation. Moreover, it will
be complemented by analyzing and interpreting “indirect drivers” (Loos, 2005) that seek to
explain how value can be created from an operational perspective.
4 Morgan Stanley (2009): Operational improvement: The key to value creation in private equity.

!
9
1.2 Justification of the Theme Selection
To the author’s knowledge, the acquisition of Burger King had not yet been subject to any form
of analysis in academia. Alongside, the selection of 3G Capital’s acquisition of Burger King as
a demonstrating example for value creation and the related drivers has several other
justifications, as follows.
Firstly, due to the private equity firm, 3G Capital, which is based in Rio de Janeiro and was
amongst others founded by Brazil’s richest businessman Jorge Paulo Lemann. The past
acquisitions of Burger King and H.J. Heinz Company, already helped to elevate the name of
3G Capital across the front pages of global business news. Yet, the recent add-on acquisitions
of Kraft Foods and Tim Hortons and the subsequent mergers that were completed in
cooperation with Warren Buffets Berkshire Hathaway, forming respectively, the Kraft Heinz
Company and Restaurant Brands International, left no doubts that 3G Capital is one of the big
players in today’s world of private equity. Besides the aforementioned deals, associates of 3G
Capital are also major shareholders in the world’s largest beer brewer, Anheuser-Busch InBev,
and highly involved in the ongoing take-over of SABMiller5.
Second, the acquisition of Burger King was chosen due to the time frame, data availability and
structure of the acquisition. As the acquisition was completed in October 2010, roughly five
years ago, it seems to be a good point in time to draw an intermediate conclusion about the
value that was created through the previous buyout. Moreover, the deal offers wide access to
publicly available data, since 3G Capital, reoffered parts of Burger King on the stock exchange,
only a few years after its delisting. Also the structure of the deal is favorable to analyze the
different levers of value creation, on the one hand due to the usage of a significant amount of
leverage. The company was acquired for about US$ 4 billion in 2010 including debt, whereas
an estimated 70% of the purchase price was financed by debt6. On the other hand, due to 3G
Capital’s reputation of substantially restructuring and improving the operations of its portfolio
companies7.
In 2014, Burger King acquired the Canadian company Tim Hortons, mainly financed by 3G
Capital and Warren Buffet’s Berkshire Hathaway. After the announcement of the acquisition,
but before the completion, Burger King’s stock closed with a total market capitalization of
almost US$11 billion, which compared to the initial offer price, indicates a substantial amount
5 Bloomberg Business (2015): Ab InBev Buys SABMiller for $107 Billion as U.S. Deal Agreed. 6 Reuters (2010): Burger King agrees to $3.3 billion sale to 3G Capital. 7 Fortune (2015): Here’s what happens when 3G Capital buys your company.
!
10
of value that may have been created. Despite, the vast synergy potential that arose due to the
formation of Restaurant Brands International, an entity that combines Burger King and Tim
Hortons, the following paper will only analyze the value creation of Burger King on a stand-
alone basis.
1.3 Structuring of the Paper
After the introduction, this paper begins by visualizing the most important theoretical concepts
that are relevant for this work. This includes a general overview about private equity, followed
by an introduction to the Burger King acquisition, including the most important actors, namely
Burger King and 3G Capital. The main part of the literature review examines different value
drivers in private equity that are either direct or indirect. Going on, the four main propositions
are illustrated, including their respective expected results. In addition, the methodology part
explains the used method, the quantitative method that is used to assess individual value drivers
is particularly explained in detail.
Moreover, the main part and contribution of this paper is the next part that analyses direct as
well as indirect value drivers. On the one hand, direct drivers are not only qualitatively
explained for the Burger King deal, but also quantitatively processed. Indirect drivers on the
other hand are rather difficult to quantify. Since they are only indirectly creating value and
thereby most likely have a positive impact on one or several direct drivers itself, they will be
qualitatively assessed based on the Burger King deal (Loos 2005; Berg & Gottschalg 2005).
Finally, the paper is completed with a final discussion that debates value creation and its
assessment in the Burger King deal. For a comprehensive structure of the paper, please refer to
Appendix 1, at the end of this document.

!
11
2 Literature review and theoretical development The theoretical and literature section of this paper, begins with an overview about terms and
dynamics within the field of private equity. Besides, an overview about the participants,
background and course of the Burger King deal is provided. Thereafter, this section is structured
as depicted in Appendix 2, which constitutes the different levels of value drivers that are
subsequently analyzed.
2.1 Understanding private equity
The intrinsic denotation of the term private equity is equity capital that is not publicly listed on
a stock exchange8. Whereas this might also include investments in young companies, as Start-
ups, through venture capital firms or angel investors, this paper will solely focus on private
equity firms that invest in mature businesses and typically acquire a controlling stake or the
majority of shares in a company (Loos 2005). The term private equity is often analogously used
in line with leveraged buyout, which represents the traditional form of private equity9, where
the investment firm acquires a company or division that is formerly publicly traded.
Subsequently, the firm is then taking private, by redeeming the outstanding shares from the
public market (Kaplan and Strömberg 2009). Since the buyout is usually financed by a high
proportion of debt, this form of transactions is called leveraged buyout. Going forward, we will
adapt the view of Kaplan & Strömberg (2009), by using the terms leveraged buyout and private
equity compatibly.
The organizational form of private equity firms, is typically a limited liability corporation or
partnership (Kaplan & Strömberg 2009). In line with the partnership designation, investment
professionals within a private equity firm are often called general partners (GP). The general
partners, set up the private equity fund and raise equity from investors, the so called limited
partners (LP) (Sorensen et al. 2014). Private equity funds are ordinarily closed-end10, with a
time horizon of around 10 to 12 years, meaning that investors normally cannot withdraw their
initial funds before the maturity date. The GPs subsequently invest the raised funds, during the
first five years of the fund’s life time, by acquiring a controlling majority position in several
8 Investopedia (2015), accessible at http://www.investopedia.com/terms/p/privateequity.asp. 9 Buyouts concern the most mature form of private equity investments. Other possible areas of private equity investments are in increasing maturity order: Seed, Start-Up, Expansion, Replacement Capital and lastly buyouts (Loos 2005). 10 For a discussion of closed-end versus open-end funds please refer to Stein (2005).
!
12
companies, which they on average hold for around 5 years in their portfolio (Kaplan and Schoar
2005). Appendix 3 depicts the main steps in a typical buyout process.
Leveraged buyouts, are further contextualized between Management Buy-outs (MBO) and
Management Buy-Ins (MBI). In the context of a MBO, the current management of a public
firm, initiates the process of raising capital from external providers, usually private equity firms,
to achieve a change of ownership. Correspondingly in the case of a MBI, an external
management takes over control, by acquiring a majority stake of the target company, with the
support of a private equity firm11. In order to acquire a company and obtaining a controlling
majority stake, LBO firms have to pay a premium to the former public target shareholders. A
study by Bargeron et al. (2008) found that the average premium paid by private equity firms, is
28,5% above the target market price. This is substantially lower, compared to the premium of
46,5% that is on average paid by public firms, who engage in strategic acquisitions. A possible
explanation for this might be that corporate buyers buy different types of firms compared to
LBO firms (Bargeron et al. 2008). This might be related to the different rationales of both types
of buyers. Whereas corporate buyers are often aiming towards the realization of synergies, for
instance through market power or economies of scale and scope (Seth 1990), financial sponsors
rather look for established firms with “strong, non-cyclical and stable cash-flows with
significant unused borrowing capacity” (Loos 2005, p.11).
Depending on the investment strategy, private equity firms hire different kinds of professionals.
Commonly, they hire professionals with significant investment as well as operational know-
how and industry expertise. On the one hand, if the buyout firm is pursuing a value or organic
growth strategy, general partners, who previously worked as industry managers or consultants
are likely to play a significant role in the value creation process. On the other hand, if the firm
is adopting a buy-and-build12 strategy, the LBO firm might rather rely on professionals that
were formerly working as bankers or accountants. Buy-and-build strategies might thereby
involve a less active management approach, then a value or organic growth strategy (Cf.
Acharya et al. 2012; Achleitner, Betzer & Gider 2010; Loos 2005).
Moreover, private equity can be categorized to the alternative investment class that for instance
also includes hedge funds (Jurek & Stafford 2015). The compensation structure of general
11 Note that in both, MBOs as well as MBIs, the majority of capital is usually provided by the private equity fund. The managers usually solely contribute a fraction of the capital. 12 A “buy-and-build strategy” is generally pursued through inorganic growth, thereby “financing expansion through multiple acquisitions”, after the completion of the initial buyout (Loos 2005, p. 11).

!
13
partners in private equity is thereby equal to hedge fund managers, which typically charge a
fixed management fee of 1,5% to 2% of the total invested capital as well as a 20% profit sharing
fee, also called incentive fee or carried interest (Sorensen et al. 2014; Jurek & Stafford 2015).
The carried interest (carry) is often related to the compensation of a call option, as it gives the
general partner the right to participate in potential value increases in the future13 (Sorensen et
al. 2014). Given the call option like compensation of general partners14, and the associated
limited risk of losses in the case of default, critics charge that this might cause another principal
agent problem between limited partners and investors, as “GPs are prone to overinvestment,
and potentially will be willing to gamble by taking large levered stakes in portfolio firms”
(Axelson et al. 2013, p. 2229).
The aforementioned principal agent problem has been especially critical in the 1980s, when
leverage ratios surged towards as much as 90% (Guo et al. 2011). As a consequence, many
leveraged buyouts resulted in bankruptcy, which consequently lead to an intensive slowdown
in private equity investments during the 1990s. With the beginning of the 21st century, private
equity accelerated once more, and reached its peak in 2007. Yet, one year later, as a
consequence of the financial crisis, the private equity market tumbled once more, primarily due
to the slump of debt markets (Kaplan & Strömberg 2009). However, this time the industry
recovered rather fast, and seems to be back on track, with 2014 being the strongest year after
the record year of private equity in 200715.
2.2 The Burger King buyout
On October 19th 2010, both 3G Capital as well as Burger King Holdings, Inc. confirmed the
completion of the transaction, whereby an affiliate of 3G Capital acquired Burger King,
including its outstanding debt for around $4 billion16. The following paragraphs will introduce
both of the involved parties, and present the most important occurrences during the pre-
acquisition as well as the post-acquisition stage.
2.2.1 Burger King Holdings Inc. before the buyout
Burger King, which is today the second largest fast food chain in the world, was founded in
1954, when James McLamore and David Edgerton acquired a small burger franchise in Miami.
13 pwc (2012): How US private equity compensates management through the investment lifecycle, available at: https://www.pwc.com/us/en/hr-management/assets/pwc-how-us-private-equaty-compansates-management.pdf. 14 General partners usually contribute a small fraction of capital from their own pockets to favorable terms- this is called sweet equity. 15 Thomson Reuters (2014): Mergers & Acquisitions Review – Full Year 2014. 16 Burger King (2010): Press Release - 3G Capital Completes Acquisition of Burger King Holdings, Inc.
!
14
The company’s growth across the United States was primarily spurred by the success of Burger
King’s signature burger, called the Whopper17. After many changes of ownership with various
diverse corporate owners during Burger King’s history, the company was sold in a leveraged
buyout in 2002, to a consortium of private equity investors, from its previous owner Diageo,
which is mainly known for its alcoholic beverages. The private equity consortium, including
well-known firms as TPG Capital, Bain Capital and Goldman Sachs Capital Partners acquired
Burger King, for $1,5 billion18 . In 2006, the joined acquisition consortium that involved
multiple private equity firms, which academic literature names “club bidding” (Marquez &
Singh 2013), took the firm public in an IPO with an offering share price of $17, whereas only
69% of the shares were floated to the public and the remaining 31% were kept by the
consortium19.
2.2.2 3G Capital - a global investment firm
3G Capital is a private equity firm that was founded in 2004 amongst others by three of
Brazilian’s most successful businessmen and investors, namely Jorge Paulo Lemann,
Alexandre Behring and Marcel Herrmann Telles20. The investment firm is headquartered in
New York City, and has another office in Rio de Janeiro, Brazil21. According to it’s own
records, the firm focuses on “long-term value, with a particular emphasis on maximizing the
potential of brands and businesses”22. The investment firm is nowadays especially known for
its acquisitions of Burger King and H.J Heinz Company. At the latest, after acquiring and
combining Kraft Foods with Heinz, thereby founding the Kraft Heinz Company, the name 3G
Capital resounded throughout the world23 . The transaction was financed and executed in
cooperation with Berkshire Hathaway’s Warren Buffet.
2.2.3 The course of the Burger King buyout
The former CEO and Chairman of Burger King, John Chidsey, referred to 3G Capital’s offer
to take over Burger King’s outstanding shares, as a “call out of the blue”. The investment firm
has beforehand offered a price of $24 per share, which equals a 46% premium on Burger King’s
market price. Whereas the equity investment is worth $3,26 billion, the overall deal including
17 About money (2010): History of Burger King. 18 Altassets (2010): TPG, Bain, Goldman exit Burger King as 3G pays $4bn. 19 Reuters (2010): Burger King agrees to $3.3 billion sale to 3G Capital. 20 Note that the other founding partners are Carlos Alberto da Veiga Sicupira and Roberto Moses Thompson Motta. 21 Bloomberg (2015): http://www.bloomberg.com/research/stocks/private/snapshot.asp?privcapId=23471434. 22 Heinz Group (2015): http://news.heinz.com/press-release/finance/hj-heinz-company-and-kraft-foods-group-sign-definitive-merger-agreement-form-k. 23 Reuters (2015): http://www.reuters.com/article/2015/07/02/us-kraft-heinz-idUSKCN0PC2K520150702.

!
15
debt is estimated to be worth $4 billion. An analyst from the Telsey Advisory Group
commented that the offered price seems to be a good deal for Burger King’s shareholders.
According to other market experts the valuation seemed to be very high, yet, it was noted that
there might exist the potential to significantly improve Burger King, while being a private
company24. At the time of the acquisition Burger King was experiencing difficulties, not only
due to the impact of the financial crisis, but also since as some critics commented, the previous
investment consortium, exploited Burger King as a “cash cow”25. This might in parts explain
the market price before the announcement of the acquisition, when shares were short around
31% compared to the end of the year 2008. In comparison, the shares of Burger King’s biggest
rival, McDonalds, were up by around 18%26. Since Burger King, was previously controlled by
another PE firm, or rather a small pool of firms, the buyout can be further specified as a
secondary buyout (SBO)27.
2.2.4 The post-acquisition phase
After the completion of the merger, the managing partner of 3G Capital stated: “We are excited
to work together with the company’s employees and franchises to continue to invest in the
brand for the benefit of all its guests, employees and franchises”28. With the holding of 3G
Capital, many things changed in the following years. The most obvious change was the sale of
around 1.300 company owned restaurants between 2010 and 2013. Thereby, the overall number
of restaurants declined from 1.344 to only 52 proprietary restaurants. The total number of
restaurants in 2013 counted 13.667, with 52 company restaurants and the remainder of 13.615
restaurants owned by franchises. These previous sell-offs were part of the global “refranchising
initiative”, which was finalized in 201329. In parallel to making the overall business model
leaner, with less restaurants directly owned and substantially more franchising, many personal
changes were effective at Burger King’s corporate offices. In Burger King’s headquarter in
Miami-Dade County, Florida, the total FTE headcount shrank from around 800 to less than 300
people30. Besides, none of the former directors of Burger King Holdings, was in office at the
24 Reuters (2010): http://www.reuters.com/article/2010/09/02/us-burgerking-idUSTRE6801CB20100902. 25 NY Times (2012): http://www.nytimes.com/2012/06/23/opinion/nocera-burger-king-the-cash-cow.html?_r=0. 26 Reuters (2010): http://www.reuters.com/article/2010/09/02/us-burgerking-idUSTRE6801CB20100902. 27 See Arcot et al. (2015) for a detailed analysis of the general mechanisms of value creation in secondary buyouts. 28 3G Capital company website (2015), accessible at: http://www.3g-capital.com/bkw.html. 29 Burger King Worldwide Reports: Fourth Quarter and Full Year 2013 Results. 30 Interview: Tim Brueggemann (2015).

!
16
end of the analyzed holding period, whereas the majority was directly brought in by 3G
Capital31.
Another major highlight in the post-acquisition phase was Burger King’s return to the public
stock markets in 2012, only shortly after going private in 2010. However, the company did not
choose to go public via a traditional IPO, instead used a “reverse merger” with Justice
Holdings32. The firm is closely linked to hedge fund manager Bill Ackman and its only purpose
was to find another business to acquire. In the reverse merger, Justice Holdings bought a
minority stake (29%) of Burger King from 3G Capital for around $1,4 billion in cash. In turn,
Justice Holding was delisted in London and in turn again listed at the New York Stock
Exchange under the name of Burger King with the ticker “BKW”33. Until the end of the
considered holding period, 3G Capital remained the main and controlling shareholder with
71%, followed by the hedge fund Pershing Square Capital Management again from Bill
Ackman, owning approximately 10% of the equity34.
Given the aforementioned “refranchising initiative”, total revenues were declining during the
first three years of 3G Capital ownership. This is simply explainable since revenue per company
restaurant is higher compared to the revenue that is achieved from franchise and property
payments 35 . The future prospects of the company appear to be good. Due to positive
comparable sales growth in the last years and system sales growth expected to grow again the
company is expected to improve the top-line results going forward36.
2.3 Value creation in Private Equity Investments (LBOs)
Until today, many attempts have been made to analyze value creation in private equity
investments. In general, academia differentiates between value creation on the fund level and
value creation on the transaction level (Achleitner et al. 2010). Several studies have addressed
fund performance and compared it to public market indices, as for instance Kaplan & Schoar
(2005), who found that average fund performance is not significantly higher compared to the
average returns of the S&P 500. More recently published studies, as Phalippou & Gottschalg
31 Burger King Worldwide: Annual report (2013) and Burger King Holdings: Annual report (2010). 32 The Wall Street Journal (2012): Burger King Returns to Public Market on NYSE. 33 Business Insider (2012): Bill Ackman’s Special Purpose Entity Finally Makes Its Move. 34 TheStreet (2014): How Burger King’s Brilliant Brazilian Billionaire Turned $1.2B 35 Burger King evaluates sales according to system sales growth and comparable sales growth: “System sales growth refers to the change in sales at all company-owned and franchise restaurants in one period from the same period in the prior year. Comparable sales growth refers to the change in restaurant sales in one period from the same prior year period for restaurants that have been open for thirteen months or longer.” (Burger King Worldwide Reports: Fourth Quarter and Full Year 2013 Results, p.10). 36 Interview

!
17
(2009) and Harris et al. (2014) revealed mixed results for fund performance. From a critical
perspective, Phalippou & Gottschalg (2009) propose that private equity funds returns after
accounting for fees, are round 3% below the market returns. Contrary, Harris et al. (2014)
provide supporting evidence for the hypothesis that private equity funds outperform the S&P
500 index in turn by 3% annually, whereas Sorensen et al. (2014, p. 1977) remain critical, “if
this outperformance is sufficient to compensate investors (LPs) for the cost of risk and long-
term illiquidity”. Other scholars, as Kaplan (1989b), Nikoskelainen & Wright (2007),
Achleitner et al. (2010), Guo et al. (2011), Achleitner et al. (2011), Acharya et al. (2012) and
Achleitner & Figge (2014) are rather focused on value creation on the transaction level, by
examining different samples of buyouts. In contrast to academics, who analyze returns on the
fund level, these authors often seek to understand and explain the drivers of value creation in
private equity investments.
Generally speaking, academic literature in the field of buyouts, views the concept of value
creation from two different perspectives, namely, enterprise value (EV) and equity value.
Whereas, Nikoskelainen & Wright (2007), measure returns on both dimensions, Achleitner et
al. (2011) examine value creation from the perspective of the shareholders, therefore measure
the impact on equity value. This differentiation between equity value and enterprise value is
important, due to the variety of finance instruments that are used in leveraged buyouts. Thus, a
buyout might significantly increase the equity value, without enhancing the enterprise value
(Nikoskelainen & Wright 2007). As general partners in private equity ordinarily try to
maximize the initial investment of the limited partners, in order to maximize their own carried
interest, this thesis adapts the view of Achleitner et al. (2011) by focusing on the return on
equity, when for instance calculating the IRR.
Empirical academic publications often highlight the importance of individual drivers of value,
as Muscarella & Vetsuypens (1990), who analyze the value creating impact of operational
improvements, and Kaplan (1989a), who on the other side explains value creation through tax
benefits resulting from tax shields when financing a firm with debt. Contrary, academic papers
exist that offer a broader and holistic spectrum of drivers of value creation (i.e. Acharya et al.
2010; Achleitner et al. 2010). Besides, Loos (2005) is one of the authors who also offers a
holistic perspective and condensates value creation in leveraged buyouts between direct and
indirect drivers. In addition, the author finds that only direct operational drivers actually create
value, by improving the cash flows of the buyout firm, whereas indirect drivers rather indirectly
contribute to value creation, since they are not directly quantifiable. (Loos 2005, p. 21).
!
18
Furthermore, the Ph.D. dissertation of Pindur (2009) decomposes value creation in LBOs into
five dimensions, which can be categorized into an internal and an external perspective. On this
note, Pindur (2009) emphasizes that different dimensions are usually interrelated and not
necessarily mutually exclusive.
Additionally, Berg & Gottschalg (2005) provide a comprehensive framework that views value
generation in buyouts from three different dimensions. The first dimension concerns the phase
where value creation takes place during the buyout. Thereby value creation can already take
place during the acquisition phase and last through the holding period to the divestment phase.
In addition, the second dimension analyzes the causes of value generation in buyouts, whereas
value generation is equated with an increase in equity value during all phases of the buyout.
Hence, the equity value is calculated as follows:
!"#$%&'(&)*$+,-& = !"#$",+'/&0$#,+1#% ∗ 3%4%/$%5 ∗ 6"78+/ − :%,&;%<,
According to the authors, Berg & Gottschalg (2005), the valuation multiple, described as
financial arbitrage is conceptualized as a special form of value generation cause. In opposition
to the other levers that are characterized as value creation levers, the valuation multiple is
defined as being value capturing, since it is not affecting the financial performance of the
company. Furthermore, value creation levers are differentiated according to primary levers and
secondary levers, comparably to the traditional value chain (Porter 1985; Stabell & Fjeldstad
1998). Whereas the primary levers, i.e. financial engineering in Appendix 4, have a direct effect
on financial performance, secondary levers only indirectly affect financial performance through
one or multiple direct drivers37. To sum up, Appendix 4 shows a comprehensive summary that
includes all levers of the second dimension and how they can be explained. Lastly, the third
dimension views the sources of value generation in buyouts. Thereby it is important to
distinguish between intrinsic and extrinsic generation of value38. On the one hand, intrinsic
value generation, is a form of value that takes place within the portfolio company, without
specific influence of the buyout firm. Thus, this kind of value generation would appear in any
PE investment and does not reflect specific capabilities of the private equity firm, as for instance
expertise or network. Extrinsic value generation, on the other hand, is attributable to the
37 The definition of primary levers and secondary levers is in line with respectively direct drivers and indirect drivers, defined by Loos (2005). In the following both terms are applied interchangeable. 38 Extrinsic and intrinsic value generation of Berg & Gottschalg (2005) are comparable to the internal and external perspective that is explained in Pindur (2009).

!
19
capabilities of the buyout firm, and would without the participation of the private equity firm
not appear in the portfolio firm (Berg & Gottschalg 2005).
2.4 Direct drivers of value creation
According to Guo et al. (2011), Acharya et al. (2012) and Achleitner et al. (2011) the most
common explanations of value in the form of increased returns are: (i) operational performance
improvement, (ii) higher sector valuation multiples and (iii) the usage of leverage. In line with
this, Achleitner et al. (2010) provide a comprehensive framework, that allows for a clear
identification and interpretation of different value drivers. Their model separates the leverage
effect, from other value drivers, as the effect of operational improvement and the multiple
effect. This is especially relevant, as previous models did not explicitly differentiate between
operational and financial risk (Achleitner et al. 2010). In this paper, the following levers are
normally denominated as direct drivers, yet the terminology might vary in other papers, for
instance in Berg & Gottschalg (2005), who categorize these drivers in their framework as
primary levers39.
2.4.1 Value through leverage
Leverage as a direct driver of value, is traditionally defined as interest payment deductions or
“tax benefits from the perspective of the buyout company” Kaplan (1989a, p. 613). These
benefits occur to the equity holder through tax shields, that increase the return to investors in
the firm. Higher returns are justified by an increased financial risk that comes with the issuance
of larger amounts of debt that, help to finance the transaction (Modigliani & Miller 1958). Since
tax shields, increase free cash flow that is available to equity holders, leverage is likely tohave
a positive effect on firm value. Whereas no universally accepted ideal level of leverage exists,
many different theories exist, that conceptualize the ideal capital structure. Tradeoff theory is
one of the fundamental theories, which suggests that firms need to balance the benefits of tax
advantages, with the disadvantage of financial distress costs, also known as bankruptcy costs
(Myers 2001). Contrary, free cash flow theory, another important concept, argues that costs of
financial distress are negligible, as long as a firm generates significant operating cash flows,
39 Berg & Gottschalk (2005) designate the effect of leverage as “financial engineering” and the effect of operational improvement as “increasing operational effectiveness”. Both former drivers are categorized as primary levers, which will be used interchangeably in this paper with the term “direct driver”. Yet, the framework of Berg & Gottschalg (2005) classifies the multiple effect as a “value capturing” driver instead of a value creating primary lever.40 These tax payments might for instance favor for instance the respective government. Amongst others, this can include, taxes of capital gain, paid by the former pre LBO shareholders and capital gain taxes of the LBO firm due to the sale of assets after the LBO transaction (Jensen 1989).

!
20
after financing future investment opportunities with a substantially positive net present value.
Therefore, free cash flow theory is likely to suggest higher levels of leverage than tradeoff
theory, especially for mature firms (Myers 2001). However, evidence by Axelson et al. (2013)
suggests that capital structure in buyouts, is rather influenced by the conditions of the debt
market, depending on the “price and availability of debt” (Axelson et al. 2013, p. 2264). With
this in mind, buyouts are more levered when credits are easily available and interest rates are
in turn low (Axelson et al. 2013). Moreover, Achleitner et al. (2010) suggest that private equity
firms seem to be able to apply higher leverage ratios, due to their experience and standing in
the market. Typically, debt to equity ratios decrease in the years after the completion of the
buyouts, as private equity sponsors use large portions of the generated free cash flow to pay
back debt (Kaplan 1989a).
Leverage is certainly the most controversially discussed driver of LBO value creation in
academic literature. Especially the question if higher leverage ratios create value is subject to
considerable discussions within academia. In line with Kaplan (1989a), Achleitner et al (2010)
show that financial engineering on average contributes to about one third of the created value
in a sample of 206 European buyouts between 1991 and 2005. In addition, more recent work
by Guo et al. (2011) finds, that increased leverage yields higher tax shields, which in turn result
in increased cash flows. Additionally, they state, that in general targets with a low debt ratio
have higher potential for improvements in tax shields, since the higher the increase in leverage,
the higher the improvements in cash flows, which is comparable to the findings of Renneboog
et al. (2007). Yet, the magnitude of the effect also highly depends on the maintenance of the
higher debt ratio after the PE firm exited the investment (Guo et al. 2011).
On the contrary, Bergström et al. (2007) claim that leverage can from a societal perspective not
be regarded as a driver for value creation. Thus, according to the authors leverage is rather
redistributing wealth through the creation of tax shields instead of creating new value. As some
even argue that the aforementioned tax payments come at the expense of society, Jensen (1989)
argues that apart from the potential tax deductions, realized by interest tax shields, through
financial engineering of private equity firms, LBO transactions also come along with the
creation of new sources of tax40. Finally, it is important to note, that next to the discussed
financial engineering related benefit of leverage, that is rather mechanical, another rather
40 These tax payments might for instance favor for instance the respective government. Amongst others, this can include, taxes of capital gain, paid by the former pre LBO shareholders and capital gain taxes of the LBO firm due to the sale of assets after the LBO transaction (Jensen 1989).

!
21
behavioral finance related effect exists. This topic is mainly attributable to Jensen (1986) and
Jensen (1989) who discuss the positive effect of debt on agency costs as well as the motivational
efficiency impact of debt.
2.4.2 Value through the multiple effect
The second main lever of value creation is the multiple effect. The mechanisms behind this
driver are changes in valuation multiples between the point of entry and exit, keeping all other
effects constant (Achleitner et al. 2011). Pragmatically formulated, value is created by buying
cheap and selling more expensive. The multiple effect, also referred to pricing in buyouts, is
usually analyzed according to the EBITDA/EV multiple, as for instance in Acharya et al.
(2012). According to Achleitner et al. (2011), EBITDA/EV is the most commonly used multiple
in private equity. It is measured by the difference in enterprise value through changes in entry
and exit EBITDA/EV multiples between the entry and the exit date, both respectively
multiplied with the initial EBITDA value at the entry point. In case the EBITDA/EV multiple
is higher at the exit of the investment, it appears that value had been created, measured by
increased returns to equity holders when divesting the asset (Achleitner et al. 2011).
Academic papers seem to agree that the multiple effect is a justifiable dimension of value
creation, yet there has been little agreement on the question if improvements are attributable to
the private equity firm or the overall market conditions (Achleitner at al. 2011). Research by
Cumming et al. (2007) classifies pre buyout undervaluation of target companies as one of the
“chief sources of shareholder wealth gains” (Cumming et al. 2007, p. 440). Therefore, spotting
undervalued targets and as a result paying lower entry multiples, is value creating, presupposed
that the PE firm achieves a higher exit multiple. More recent evidence by Acharya et al. (2012),
has examined that the improvement of multiples is higher for PE sponsor’s portfolio companies
in comparison to publicly traded peers. They classify the multiple effect as one of the main
“explanatory factors for abnormal performance” (Acharya et al. 2012, p. 371). In accordance,
Bargeron et al. (2008) show that private equity firms pay substantially lower premiums for their
acquisitions compared to mergers or acquisitions of public companies.
Finally, Guo et al. (2011), show that around 20% of buyout returns, in a sample of 192 large
leveraged buyouts, are attributable to to the increase in valuation multiples during the holding
period. Kaplan and Strömberg (2009) interpret these findings as the ability of private equity
firms, to buy firms cheaper compared to strategic bidders. However, higher multiples might not
only be achieved by the general partner’s negotiation skill or ability to spot attractive

!
22
undervalued targets, but are also influenced by credit market conditions. Thus, in times of cheap
borrowing, valuation multiples are likely to be higher than in times of high interest rates (Guo
et al. 2011).
2.4.3 Value through operational improvement
Value creation on the operational dimension, is generally characterized as the improvement of
operational performance through the active participation of the private equity firm41 (Achleitner
et al. 2014). Increasing equity returns through the operational improvement of the acquired
target after the completion of the LBO is one of the most common sources of value creation in
the field of private equity (Acharya et al. 2012; Bergström 2007). It is comprised of EBITDA
and/or cash flow enhancing measures as (i) increased revenue, (ii) reduced cost and (iii)
optimized working capital as well as capital expenditures (Kaplan 1989b, cited after Achleitner
& Figge 2014). The former two (i) increased revenue and (ii) reduced costs are categorized as
EBITDA margin improvements42, whereas (iii) working capital and CAPEX optimization is
classified as a cash flow enhancing driver43.
A study conducted by Muscarella & Vetsuypens (1990), analyzed 72 LBOs, that were again
divested by going public between 1983 and 1990. The results show, that these companies on
average achieved significantly stronger improvements in profitability, compared to publicly
traded peers that have previously not gone through a leveraged buyout. Cost reduction, were
particularly mentioned to be the main performance improving measure, within the sample of
the study, whereas measures as sales growth and streamlining of asset utilization played a minor
role. Since, LBOs at this time used very high levels of leverage, returns on equity used to be
very high. Yet, the paper could not show, that LBOs obtain increased returns for their investors
(Muscarella & Vetsuypens 1990).
Moreover, Kaplan (1989b) examined a sample of 76 large buyouts, completed in the 1980s,
that showed positive results of increased market value through operational improvements. The
study presents significant improvements in operating income and net cash flow, as well as
decreases in CAPEX, evidently achieved by aligned incentive structures in the post buyout
41 This active management or ownership approach is often referred to as “hands-on approach”. 42 Note that (i) increased revenue and (ii) reduced costs ceteris paribus also increase cash flow through higher EBITDA. 43 In the following, this section differentiates between direct drivers of operational improvement that either create value by improving EBITDA itself, usually through reduced costs or higher revenues, or by enhancing and generating free cash flow, for instance by improving asset utilization.

!
23
period (Kaplan 1989b). Nevertheless, Guo et al. (2011) relativized the aforementioned results,
in a more recent study with a sample of buyouts, that were executed between 1990 and 2006.
Even though, their results showed that operating performance in LBOs was equal or slightly
higher as compared to their respective peer group, the magnitude of improvements was
substantially smaller than the previously presented results by Kaplan (1989b). Despite the weak
evidence for performance improvement, Guo et al. (2011) suggest, that value creation may be
possible through a more efficient utilization of firm assets. For instance, by selling of non-
productive assets, return on assets can be increased, provided that the EBITDA remain stable.
Furthermore, Achleitner et al. (2011), amongst other, confirm that operational improvements,
in terms of EBITDA margin improvements and sales growth, create value for equity holders,
while analyzing a comprehensive dataset of 1980 buyouts between 1986 and 2010. Even
though, the authors could not confirm that PE sponsors were able to achieve superior sales
growth compared to their publicly traded peers, they found that increased sales can positively
influence the exit multiple at the end of the holding period (Achleitner et al. 2011). Accordingly,
research of Acharya et al. (2012) explored empirical evidence for the operational performance
improvement by private equity firms. The authors explored a sample of 110 transactions from
14 different traditional private equity firms, between 1995 and 2005. They found that margin
improvement and sales growth are linked to superior performance during PE ownership. Yet,
only the EBITDA margin was improved above the related sector level, whereas they could not
show that sales growth is significantly improved compared to peers. Ultimately, Acharya et al
(2012) conclude that operational performance improvements can explain superior returns and
lead to the creation of financial value. As naturally not all transactions create value, the
realization of performance improvement often distinguishes successful from unsuccessful
deals.
2.4.3.1 EBITDA improvements
EBITDA is typically used as the foundation for the financial valuation of companies in the field
of private equity and one of the most used multiples. The fraction of operational value creation,
that has been achieved through improvements in EBITDA, is conceptualized as the
improvements in EBITDA within the holding period. As previously mentioned, this can be
achieved through both higher revenues as well as higher EBITDA margins, by reduced
operating costs. In practice, EBITDA improvements are typically achieved through a
combination of both, lower costs as well as higher revenues (Achleitner & Capital Dynamics
2009).

!
24
The model provided by Achleitner & Capital Dynamics (2009), which is subsequently used to
analyze the creation of value in the Burger King deal, measures value added by changes in
EBITDA during the holding period of the private equity firm. Generally speaking, operating
profits can be increased through cost reductions and sales growth, either organically by growing
internally or inorganically through external growth. Loos (2005) sees external growth through
acquisitions as “a key strategy of LBO firms” (Loos 2005, p. 205).
From an internal growth perspective, private equity firms often rely on industry knowledge and
operational experience. Thus, most of the leading private equity firms are positioned and
structured according to key industries (Kaplan & Strömberg 2009). The Carlyle Group, one of
the largest private equity firms in the world is only one example for a private equity firm that
is organized around its core industries. The firm specifies its specialization approach according
to industries as “central to the firm’s ability to create value”. Their “valuing depth over breadth”
approach includes 11 core industries 44 , from aerospace over financial services to
transportation45. Moreover, by hiring investment professionals with operational experience and
industry know-how, or by cooperating with external consulting groups, private equity firms,
might be able to further improve the operating value of their portfolio companies (Kaplan and
Strömberg 2009). The private equity firm Clayton, Dubilier & Rice, for instance, closely works
in cooperation with former industry experts, as Jack Welch, former CEO of General Electrics
or Sir Terry Leahy, former CEO of Tesco, who both support the firm’s by improving their
operational engineering46.
According to Acharya et al. (2012), human capital factors are a dominant feature to explain
operating profit improvements in private equity investments. They argue that the experience
and the background of general partners in private equity firms, have an impact on the direction
and success of value creation. When the partners are former consultants or previous industry
managers, they are more likely to contribute to positive EBITDA growth of the portfolio
company through internal improvement programs. By leveraging their skills and industry
know-how, partners might contribute towards improving sales, by exploring further markets or
through cost cutting programs. In opposition to partners with operational know-how, general
44 The full list of core industries: Aerospace & Defense, Commodities, Consumer & Retail, Energy & Power, Financial Services, Healthcare, Industrial, Real Estate, Technology, Telecom & Media, Transportation. 45 Carlyle Group – our business – industry expertise, viewed at https://www.carlyle.com/our-business/industry-expertise. 46 Clayton, Dubilier & Rice (2015) – Firm profile, viewed at http://www.cdr-inc.com/about/firm_history.php.

!
25
partners with former experience in banking and corporate finance, are more likely to follow an
external growth strategy, by acquiring further companies.
2.4.3.2 Cash Flow improvements
The effect created by improvements in free cash flow is an operational driver of value creation
and called the free cash flow effect. Free cash flow can on the firm level be used to pay back
debt or to distribute to shareholders through dividends and share buybacks. The real lever of
value creation here is the creation of cash flow, not as often mistakenly stated, the process of
paying back debt, which is denominated as deleveraging (Achleitner & Capital Dynamics
2009). Previous research by Lehn & Poulsen (1989) show that there is evidence for higher cash
flows of firms that have gone private through a leveraged buyout, in comparison to a benchmark
of firms that stayed public.
In accordance to the the Achleitner & Capital Dynamics (2009) model, enhanced cash flows
can be composed of increases in EBITDA, working capital effects, changes in investments and
depreciation and payment of interest and taxes. Since the mechanisms of EBITDA and leverage
were already presented previously, this section will illustrate the impact of improved asset
utilization on cash flows. Achleitner & Figge (2014, p.409) call this “streamlining of capital
expenditures and working capital. Existing research recognizes the critical role of improved
asset utilization. Thereafter, cash flows can be improved, by increasing the productivity of
assets, despite a constant level of profitability, for instance by using working capital more
efficiently (Guo et al. 2011). Thus, private equity firms reduce working capital of portfolio
companies during the holding period, primarily by lowering inventory levels and collecting
receivables more quickly (Easterwood et al. 1989). Correspondingly, Holthausen & Larcker
(1996) show that firms that have gone through LBOs on average maintain significantly lower
levels of working capital in comparison to publicly traded peers.
A much debated question is whether and to what extent the reduction of capital expenditures
contributes to value creation. While some argue that lower CAPEX increase cash flows, others
pledge that private equity firms need to guarantee the long run profitability of their investments,
whereas reductions in capital expenditures can be counter productive and harm the firms in the
medium- to long-term (Loos 2005). Yet, former research provides evidence for reduced
investment activities in the post acquisition stage of private equity investments (Cf. Kaplan
1989b; Smith 1990). Moreover, firms might eliminate “non-productive assets” which may not
only generate one time payments through the sale of these assets, but also increases returns on

!
26
assets (Guo et al. 2011, p. 497). The nature of these asset sales is usually driven by efficiency
considerations (Seth et al. 1993).
2.5 Indirect drivers of value creation
As previously introduced by Loos (2005), indirect drivers are less directly enhancing value,
since they are not visibly increasing cash flows or EBITDA, which makes it very difficult to
measure them. Yet, they play a major role in the entire value creation process of LBOs, due to
their likely interdependence with direct drivers and ability to impact direct drivers, which in
turn enhance operational performance. This is in line with Berg & Gottschalg (2005) who
explain, that indirect drivers, which they define as secondary levers, do not have a direct impact
on financial performance, yet they contribute to value creation through direct levers and
therefore help to explain value creation in LBOs.
Typically, academic literature, views the following indirect drivers as (i) changes in corporate
governance, (ii) alignment of management incentives, (iii) leverage as a form of controlling
managerial behavior and (iv) culture and form of communication (Kaplan & Strömberg 2009;
Loos 2005; Achleitner & Figge 2004). This paper will mainly discuss the former two, corporate
governance and management incentivizing, as they are likely to have the biggest impact in the
case of Burger Kings acquisition.
2.5.1 Corporate governance
Due to different corporate governance practices around the world, various different definitions
and conceptualizations of corporate governance exist. Desender et al. (2013, p. 823) describe
corporate governance as “a system of interrelated practices having strategic or institutional
complementarities, where governance practices will be effective only in certain combinations”,
based on various authors that previously defined the concept of corporate governance. In line
with these findings, Rediker & Seth (1995) claim that effective control through monitoring is
very likely attributable to a simultaneous combination of governance mechanisms, instead of
only a single one. Moreover, Capron & Guillén (2009, p. 805) conceptualize corporate
governance as “the allocation of rights and obligations among the firm’s stakeholders, including
shareholders, managers, workers, and others with a stake in the corporation.”
Furthermore, the concept of corporate governance is closely related to the principal-agent
theory. This theory describes the situation where a principal contracts an agent to perform a
certain task, thereby delegating the right to make certain decisions to the agent. Under the
assumption, that the agent also tries to maximize his own utility, it is likely that he will

!
27
sometimes diverge from the best interest of the principal (Jensen & Meckling 1976). This
phenomenon of agency conflicts is especially applicable in public firms, where interests
between the shareholders (principal) and managers (agents) are often divergent. Amongst
others, corporate governance is one of the most frequently discussed theories, that antagonizes
the agency conflict. Thereby, the corporate governance mechanisms assist to reduce the agency
problem by supervising management, as for instance through board control, direct shareholder
supervision and external auditors (Watts and Zimmerman 1990; Adams 2010; Desender et al.
2013). However, limiting the agency problem by supervising managers comes with a cost, that
academic literature calls, agency cost. Agency costs thereby comprise the sum of the cost of
counteracting measures as well as the loss, that is caused by managers deviating behavior,
which can not be prevented by the aforementioned measures (Jensen and Meckling 1976).
The dynamics of corporate governance and the associated agency costs are very different in
LBOs and going private transactions. Kaplan & Strömberg (2009) denote private equity firms
more active involvement in corporate governance and stricter control of the board as
“governance engineering”. Former research by Jensen (1989) already criticized the operating
inefficiency in public corporations, due to the failure of being effectively able to monitor
management. The engagement of active investors, such as private equity firms, might thereby
“recapture the lost value (…) using debt and high equity ownership to force effective self
monitoring” (Jensen 1989, p. 8). Next to the “control function of debt” (Jensen 1986, p.325),
private equity firms often, replace the top management of the acquired companies and even
staff seats of the board with their own people. Guo et al. (2011) analyze a sample of 192 LBOs
between 1990 and 2006 and detect, that the former CEO is replaced in more than one third of
the analyzed transactions. Besides, they identified that on average more than 50% of the board
seats are occupied by affiliates of the PE firm (Guo et al. 2011). These changes in the corporate
governance structure of portfolio companies are therefore likely to lower the agency costs of
the portfolio company (Kaplan 1989b). Yet, most of previous studies do not engage with
another form of agency problem, that concerns the choice of capital structure in leveraged
buyouts. Axelson et al. (2013) suggest, that due to their option like compensation, general
partners of private equity firms might use leverage ratios that exceed the amount of debt that is
in the best interest of people that invested in the fund (LPs). The relative importance of both
effects might be an interesting field for future academic research.
Edgerton (2012) analyzes the hypothesis that managers are self-interested, and might engage in
excessive compensation and spending of corporate resources. By analyzing the usage of
!
28
corporate jets, he finds that firms that have previously gone private in a LBO have significantly
smaller jet fleets, whilst many public firms seem to engage in excessive use of corporate jets.
Since the analyzed firms where very large, the excessive usage of jets, may have a relatively
small impact on operating financial performance, but “could represent the tip of a larger iceberg
of excessive compensation and other agency costs” (Edgerton 2012, p. 2188). Therefore, the
author proposes that increased monitoring through corporate governance mechanisms in LBOs
might lead to higher shareholder value through a reduction in agency costs.
Furthermore, if and how changes in governance in the private equity context, create value seems
difficult to measure, yet, Guo et al. (2011, p. 503) state, that “governance activities appear
important in explaining operating gains”. Also Nikoskelainen & Wright (2007) provide
empirical evidence for a value increasing effect due to changes in corporate governance, in the
context of leveraged buyouts. Nevertheless, regressing governance variables on operational
performance measures gives mixed results. While changes in management appear to positively
contribute towards increased cash flows, contrarily, a higher board involvement of PE firms
appears to be negatively related to profitability (Guo et al. 2011).
Finally, a theoretical model, developed by Aguilera & Jackson (2003) is subsequently (in the
analysis part) used to describe the dynamic changes within the different dimensions of corporate
governance, that emerged from the acquisition of Burger King by 3G Capital. A condensed
summary of the main framework is depicted in Appendix 5.
2.5.2 Incentives
According to Smith (1990) another possibility that seeks to reduce the agency problem is the
alignment of management incentives with the interests of shareholders. Thus, both, corporate
governance mechanisms, and management incentives are ways that can contribute to reduce
agency costs (Smith 1990). Going one step further, some authors, as Cornelli et al. (2013) even
classify incentives as a component of corporate governance, due to their statement, that “much
of the empirical literature on corporate governance and boards studies the provision of
incentives and pays less attention to monitoring” (Cornelli et al. 2013, p. 432).
Whereas the previously introduced option like or profit sharing fee of the general partner can
also be seen as a form of incentivizing, this part is rather concerned with another form of
incentives, namely, management incentives (Cf. Axelson et al. 2010; Sorensen et al. 2014;
Jensen 1989). The difference between management incentives in public corporations and
private firms, which are controlled by a private equity firm is that in the latter, “management
!
29
incentives are built around a strong relationship between pay and performance” (Jensen 1989,
p.15). Accordingly, Easterwood et al. (1989) also recognize the change that is subject to
incentive systems after a buyout, which generally lead to a stronger convergence of pay and
employee performance. They argue that incentive systems are “important to develop
motivational systems for employees to achieve the key tasks” (Easterwood et al. 1989 p. 41).
Furthermore, incentives do not only mean that a fraction of the yearly salary is variable and
linked to performance, but also include the participation in equity financing of management. It
is thereby common that management contributes a fraction of the upfront equity capital to
finance the deal. Guo et al. (2011) explored a sample of 94 deals, whereby 58 out of 94 deals
included equity contributions from management. They propose that the more equity
management owns, the greater the alignment between shareholders and management, thus, the
lower the agency costs. Nikoskelainen & Wright (2007) even regard the equity ownership of
management as one of the main explanations to value enhancement in buyouts. While also
pronouncing the close link between incentives and governance, the authors claim that equity
ownership creates “self-monitoring effects”, which in combination with incentives contributes
to an increase in firm value (Nikoskelainen & Wright 2007, p. 26). In addition, participation in
the financing of the firm’s equity might not only affect management, but also a broad base of
the staff in the portfolio firm, through Employee Stock Ownership Plans (ESOP) (Easterwood
et al. 1989).

!
30
3 Propositions and expected results Traditionally, leverage had played an important role in private equity, whereas some authors
even identify leverage as the main driver for value creation in private equity (Cf. Kaplan 1989a).
Despite the controversy and missing unanimity in academia about the effect and ideal level of
leverage, this paper acknowledges the marginal tax savings that come along with an increased
amount of debt (Modigliani & Miller 1958). However, outrageous debt levels, also bear an
increased risk of default, which creates bankruptcy costs. Deals during the 1980s, were
commonly levered with a debt ratio of up to 90% (Guo et al. 2011). As the acquisition of Burger
King was substantially financed by debt, which accounted for approximately 70% of the
acquisition price, but not overly, compared to deals in the 80’s, there seems to be a potential
for value creation through substantial interest tax shields. Thus, the following proposition is
suggested:
Proposition 1: Value in the Burger King deal is created through higher debt ratios,
the effect of leverage
Next, as previously shown, market multiples seem to be correlated with the level of interest
rates in the market. Taking this for granted, indicates that in times of very low interest rates
multiples are higher. This could on the one hand be due to pure luck, but as shown also partly
through skills, as investment timing. Given the long investment horizon of 3G Capital and the
assumed diligent planning and screening process prior to its acquisitions, the investment firm
does not have the pressure to close its funds and divest at a specific point in time. Compared to
other private equity firms, they are not maintaining a closed-end fun, which makes them more
flexible (Cf. Kaplan & Strömberg 2009). In this case since the global and U.S. economy
strongly improved between 2010 to 2013, the analyzed horizon, we propose that increased
valuation multiples also play a role in creating value. Therefore, proposition 2 is formulated:
Proposition 2: Value is created through variations in market prices, the multiple effect
According to the literature review, operational improvement, can be seen as the most up to date
and most frequently discussed topic in recent academic works. Complementary, 3G Capital’s
history has illustrated their capacity and ability to create value through operational excellence.
A first initial look at the profit & loss and cash flow statement, shows that both EBITDA as
well as cash flow have significantly improved during the first years of the holding period.
Whereas, EBITDA increased with a compounded annual growth rate (CAGR) of around 10%,
cash flow from operations expanded from approximately $206 million in 2010 to around $525

!
31
million in 2013, which equals an average annual growth rate of roughly 37%. It appears as these
two measures are in alignment with the initial assumption that the Burger King deal created
value by operational improvements, which is the rationale for stating proposition 3:
Proposition 3: Value is created through improved operations, the operational
improvement effect, which can be split into
3.1!Value creation through EBITDA improvements
3.1.1! Increased revenue
3.1.2! Improved margin
3.2!Value creation through cash flow improvements
It is expected that operational improvement is the most important source or driver of value
creation in the Burger King deal. This hypothesis is on the one hand adapted from research,
conducted by Achleitner et al. (2010), on the other hand preliminary confirmed by initial
qualitative research about 3G Capital’s value creation approach. By comparing the results of
the analysis with a benchmark of other PE deals, it is expected that the deal created more value
through operational improvement, than the average PE deals of the same dimension.
Whilst, the former propositions are rather concerned with explaining the dimensions and direct
drivers of value creation, lastly factors are analyzed that may positively contribute towards
value creation, and contribute to explain how value is created, foremost on the operational level.
Since public firms also make use of leverage, improve their operations and occasionally engage
in mergers & acquisitions, where they might be exposed to the multiple effect, we want to
analyze what really differentiates value creation in private equity from the creation of value in
public firms. As shown in the literature review, corporate governance and incentives are two
management tools, which are described as indirect drivers of value creation. Besides, their
underlying mechanisms often change in the context of buyouts. The case of 3G Capital’s
acquisition of Burger King suggests that both the dynamics of governance and incentives
changed due to the context of the acquisition, since Burger King incentivizes not only senior
management, but also less senior people, i.e. the analyst level. Moreover, the corporate
governance environment changed on a great deal, as for instance top management and the board
of Burger King was replaced by affiliates of the 3G Capital network. Corporate governance is
often strongly in line with incentives, and not strictly separable. Both together might be
powerful to contribute to value creation, where governance might give direction and incentives
contribute towards alignment. Hence, we proposition 4 is stated and going forward qualitatively
analyzed:

!
32
Proposition 4: Indirect drivers play a role in explaining value creation in leveraged
buyouts, especially on the level of operational improvements:
4.1 Corporate governance is an indirect driver of value
4.2 Incentive alignment is an indirect driver of value:
Finally, it is expected that corporate governance and incentives are a key differentiation criteria
compared to other funds, which might be related to the fact that 3G Capital does not have the
pressure to divest at a certain point in time, in contrast to many closed-end funds. It is thereby
anticipated that it will not be possible to correctly quantify all drivers of value. All the more it
is expected that 3G creates value through a consolidation of many different factors, which are
often interdependent and not mutually exclusive.
!
33
4 Methodology
4.1 Presentation and Description of the Method to be used
This thesis uses quantitative and qualitative analyses. Thereby it is important to mention that
there is no stringent approach, which has been used throughout this thesis. Two research papers,
namely Achleitner et al. (2010) and Acharya et al. (2012) were especially important during the
course of the quantitative part that seeks to present an answer to the question of what are the
main drivers of value in the Burger King buyout. It has to be clarified that this thesis seeks to
apply and consequently interpret the results, using the previously introduced theories, instead
of validating them. Amongst others, the previously introduced framework of Berg & Gottschalg
(2005) is used to qualitatively supplement and explain the quantitative findings, whereas the
focus will be set on the drivers, which are analyzed through the Achleitner et al. (2010) model.
In addition, a corporate governance framework of Aguilera & Jackson (2003) is used to
understand the dynamics of corporate governance.
As a basis for applying the model, provided by Achleitner & Capital Dynamics (2009) and
Achleitner et al. (2010), we first of all need to identify the firm value, respectively the value of
Burger King’s equity at the determined exit date. Therefore, several established methods are
used, as (i) market multiples, (ii) the discounted cash flow approach and (iii) market
capitalization. Based on the results of the previous valuation results, we can calculate the
internal rate of return (IRR), a method that is commonly used especially in private equity
investments. When calculating the internal rate of return of a project, not only the initial upfront
investment has to be regarded, but also all the cash flows during the life time of the project
(Damodaran 2012).
Achleitner et al. (2010) argue that previous approaches that seek to measure value creation in
LBOs do not separate operational and financial risk. Therefore, they provide an alternative
method, which is in line with the approach of Achary et al. (2012). Both approaches have in
common that they differentiate returns, which are attributable to leverage from returns that have
been achieved on an unlevered basis. Hence, Achleitner et al. (2010) go a step further by
offering a framework that allows to differentiate the unlevered returns by different levers of
value creation. Applying this framework subsequently facilitates the interpretation and
comparison of the results. This is why Achleitner et al. (2010) is chosen as the main framework
in the quantitative part of this thesis. Appendix 6 summarizes the respective summary of results
of the Achleitner et al. (2010) study, which found that on average, approximately one third of

!
34
the created value stems from leverage, whereas the other two thirds come from the operational
and multiple effect (Achleitner et al. 2010). These drivers are also covered in the previous
structure of the literature review, as depicted in Appendix 7.
The explained returns by Achleitner et al. (2010) attributable to operational improvement or
from the risk perspective operational risk, are composed of (i) increased EBITDA margin47,
streamlining working capital and CAPEX48, and the multiple effect. Lastly a combination factor
is added that represents combined changes in EBITDA growth and EBITDA Multiples
(Achleitner et al. 2010). In the previously proposed value creation structure, EBITDA margin
and free cash flow improvement are situated on the second level of value generation, as
respective measures or drivers of operational performance improvement that is situated on the
first level. The multiple effect and the leverage effect are both levers at the first level. Appendix
6 summarizes and highlights the dimensions and measures that are explicitly derived through
the application of the model, developed by Achleitner et al. (2010) and Capital Dynamics49.
In order to derive the effect of leverage, we can apply the formula provided by, Achary et al.
(2012), who in their paper examine excess returns generated by private equity firms. All the
more, they differentiate between excess returns that are attributable to financial leverage in
comparison to other levers. In order to derive the excess returns, which are associated to the
generated interest tax shields, it is proceeded as follows. First, the Internal Rate of Return (IRR)
of a certain deal is calculated, also characterized as the levered return (RL). Second, the
unlevered return (RU) is derived, by un-levering the IRR (RL) with the following slightly
simplified formula50:
3= = &>?@&>A∗ BCD ∗&
AE
B@AE
whereas: , = "4%7"8%&F'71'7",%&,"G&; HI= "4%7"8%&#%4%7"8%&7",+'
Following, we subtract the unlevered return from the levered return and therefore derive the
difference in the IRR between the levered and unlevered firm. By dividing the difference in
IRR by the levered return (RL), the fraction of IRR that is attributable to the leverage effect is
47 Some authors further split this into the effect of increased sales and operating cost reduction, e.g. Muscarella & Vetsuypens (1990). 48 Achleitner et al. (2010) call this free cash flow effect. 49 First published in an article, written by Prof. Dr. Dr. Ann-Kristin Achleitner (TU Munich) and Dr. Katharina Lichtner and Dr. Christian Diller (both Capital Dynamics). 50 Slightly simplified from Acharya et al. (2012).
!
35
derived51. Going forward, we want to explain the increase in equity through the remaining other
effects, thus, all but the leverage effect.
The multiple effect is operationalized by subtracting the entry multiple multiplied by the entry
EBITDA (MultipleEntry * EBITDAEntry) from the respective exit multiple that was previously
also multiplied with the entry EBITDA (MultipleExit * EBITDAEntry) (Achleitner et al. 2010). In
addition, the model provided by Achleitner & Capital Dynamics (2009), measures value added
by changes in EBITDA as follows. To begin with, EBITDA at the entry point is subtracted
from the EBITDA value at the end of the holding period. Following, the resulting difference is
multiplied by the entry EBITDA multiple. The outcome of this is the absolute value, attributable
to improvements in EBITDA. The free cash flow lever, is derived by summing up the free cash
flows that a firm generates in the prospective holding period. These cash flows can for example
be distributed to shareholders through dividend payments or share buybacks, or can also used
to repay debt and therefore in turn possibly decreasing the cost of debt. As Burger King’s total
debt did not decrease during the holding period, but rather slightly increased, we assume the
cost of debt to be constant. As usually both multiples and EBITDA change over the holding
period, there has to be a correction factor that accounts for this effect. The correction factor is
calculated by multiplying the change in EBITDA with the change in the multiple, as follows:
(MultipleExit - MultipleEntry) * (EBITDAExit - EBITDAEntry). In some cases, the correction factor
is negative, as for instance EBITDA increased, while simultaneously the multiple decreased
over the holding period52.
Furthermore, the time frame of the analysis has to be defined. Since the acquisition took place
on October 19, 201053, which lies in the middle of the fourth quarter, the analysis in the
quantitative part will for simplicity purposes only include cash flows starting from January 1,
201154. When calculating the IRR for Burger King’s shareholders, we assume that the initial
investment took place on December 31, 2010. On the other side, the time frame for the holding
period is closed with the assumed exit date on December 31st 2013, including all the cash flows
that accrued in the fiscal year 2013. The closing date, is on the one hand determined by the
availability of data, but foremost by the combination of Tim Hortons and Burger King as
Restaurant Brands International in August 26, 201455. This acquisition changes many of the
51 Wertsteigerungshebel in Private Equity-Transaktionen (Zürich, November 2009). 52 Wertsteigerungshebel in Private Equity-Transaktionen (Zürich, November 2009). 53 Burger King Worldwide (2013): Annual report 2013. 54 Including the cash flows of the fourth quarter would also only marginally impact the results. 55 Burger King Worldwide (2014): Press release.

!
36
previous circumstances and brings new sources for operational improvement through the
potential realization of synergies, but also further tax improvements that might be feasible
through tax inversions56. Thus, the chosen time frame for the financial analysis ranges from the
fiscal year 2011, starting on January 1st, 2011 to the fiscal year 2013, ending on December 31st
2013 under Burger King Worldwide. However, for comparison purposes we will also look at
prior annual reports that lie before the acquisition of Burger King by 3G Capital in October
2010, in order to better forecast financial data.
In parallel to the quantitative analysis of value drivers, the case is systematically analyzed on a
qualitative basis and contemporaneously related to prevalent academic literature. The chosen
structure is thereby top-down, starting from the examination of value creation and the
composition into it’s main drivers in Chapter 5: Quantitative analysis of direct drivers. After
the disaggregation of the main value drivers into 5.2.1 The effect of leverage, 5.2.2 The multiple
effect and 5.2.3 The effect of operational improvements, the obtained results are critically
discussed in 4.2.4. Lastly, indirect drivers of operational improvement are analyzed in Chapter
6, which might also partially affect the aforementioned direct drivers. The qualitative analysis
of these indirect drivers is mainly based on publicly available information as well as the result
of one qualitative interview with Tim Brueggemann, a divisional Vice President at Burger King.
Since Mr. Brueggemann is based in Miami, Florida, the semi-structured interview was
conducted via telephone. The interview guideline and the respective results can be found in
Appendix 17.
4.2 Basic Assumptions Adopted and limitations of the method
This paper adopts some of the main assumptions from Achleitner et al. (2010). First of all, it is
assumed that debt availability is restricted, which is likely to be increasingly relevant in the
future. Besides, by unlevering the IRR, and thereby separating operational from financial risk,
it is assumed that the returns to equity are better comparable across different transactions (Cf.
Achleitner et al. 2010). Finally, equity returns are calculated gross of fees, paid to the private
equity firm, which means that the equity returns to the final investors are lower as they are still
subject to the fees that are charged by the private equity firm. The paper focuses on value
creation and the individual drivers, without regarding on how value is distributed among the
different groups of investors. This is why we did not include the $1,4 billion proceeds to 3G
Capital, after the reverse merger in 2012, as this is regarded as a wealth transfer between
56 Derived from: http://www.corpgov.net/2015/01/corporate-inversions/#more-21549.

!
37
different investors of Burger King, instead of creating value. Alternatively, when only including
the returns to 3G Capital one could add the $1,4 billion in the calculation of the IRR, but from
this point weighing future cash flows (for instance dividends and the overall equity at the exit
date) with 71%. Thereby, one can calculate the returns that are exclusively attributable to 3G
Capital.
In this research there are several sources for limitations. The main limitation is that this thesis
views value creation, by focusing on the perspective of the investors. Beyond that value creation
could also view other perspectives and for example consider the consequences and potential
value losses through downsizing of jobs. As the literature review is mainly based on traditional
private equity funds, which are usually closed-end, it is important to state that the firm 3G
Capital differs in some of these aspects, for instance due to the long-term investment horizon.
Furthermore, it is important to state that this is not a valuation thesis. The main focus lies on
identifying the composition of value creation and the related qualitative interpretations.
Additionally, there are some constraints in data collection, between the point of the acquisition,
where Burger King went private and the renewed relisting of parts of Burger King shares at the
New York Stock Exchange on June 20, 201257. This is why the ratio of debt to equity is not
available throughout the whole period. Since the debt levels were only slightly varying during
the holding period, the D/E ratio at the exit point was applied to calculate the effect of leverage.
The model introduced by Achleitner et al. (2010) suggested to apply an average rate. Moreover,
not including parts of the last quarter in 2010, might pose further restrictions on the derived
results, which are however not expected to adversely change the final results of this paper.
Finally, this thesis used a holistic case study approach and not an empirical analysis that can be
generalized and applied to other firms and scenarios. The analysis is also purely based on the
Burger King deal, therefore analyses the deal on the transaction instead of the the fund level.
Accordingly, many of the results are not necessarily transferable and may not be easily imitable
in other deals.
57 Restaurant Brands International (2014) press release: World’s third largest quick service restaurant company launched with two iconic and independent brands: Tim Hortons and Burger King.

!
38
5 Quantitative analysis of direct drivers This part of the thesis is depicting the value that was created at Burger King in the given time
period. In a first step the value of the enterprise, respectively the value of the equity at the
divestment stage is calculated. Based on this value and the entry value the resulting IRR is
derived. Thereafter the achieved IRR is split into several components, the direct value drivers,
which are at the same time qualitatively interpreted.
5.1 Valuation and calculation of IRR
In the following several approaches are used to estimate the value of Burger King. The most
appropriate method is used to derive the respective IRR for the investors of Burger King.
5.1.1 Market multiples approach
The multiple valuation is based on a selected peer group of mostly American fast-food
restaurant chains, as for instance the McDonald’s Corporation or Sonic Corporation as well as
fast food holdings as for example Yum! Brands58. The average Enterprise Value/EBITDA
multiple (EV/EBITDA) of the peer group to date equals 13,16 59 , which is illustrated in
Appendix 8. As some of these competitors have a strong focus only on the American market
the peer group might not completely accurately represent an appropriate multiple for Burger
King, yet as Burger King’s self-appointed biggest global competitor McDonald’s Corp., is
evaluated on a 13,53 EV/EBITDA multiple, the value of 13,16 seems to be representative.
Multiplying the aforementioned multiple with Burger King’s EBITDA of $588 million in 2013,
yields an enterprise value of $7.737,84 million.
5.1.2 Discounted Cash-flow approach (DCF)
In order to evaluate Burger King based on its discounted future cash flows, the P&L and other
financial measures such as changes in NWC are forecasted. These forecasts have to be carefully
considered, as they rely on many different assumptions. First of all, total future revenue
development was estimated by analyzing franchise and property revenues and company
restaurants revenues separately. Whereas the number of company restaurants is assumed to
stay constant going forward, the number of franchises is expected to grow by 3,5% annually60.
58 Yum! Brands, Inc. is a global firm that manages licensed brands as Pizza Hut, Taco Bell and Kentucky Fried Chicken (KFC), http://www.yum.com/. 59 It is acknowledged that a more accurate result would have been achieved by taking the respective multiple at the artificial exit date of Burger King on (31.12.13). 60 In 2014 the increase in new franchises was 5,2%, the estimated 3,5% is slightly lower than the value of 2014 and in line with forecasts in the annual report of Burger King.

!
39
In addition to the increase in the number of franchises, a volume increase in franchise revenues
of 0,5% was applied for each individual franchise restaurant as well as the proprietary company
restaurants61. Appendix 9 summarizes the sales forecasts for 2014 until 2018 and depicts all
individual forecasts that were contributing to the overall calculation. Based on the previous
years and the interview results with Tim Brueggemann, Vice President at Burger King,
operating expenses are further reduced by annually 5%. However, in order to get more cautious
and slightly more conservative results, this was only applied for the years 2014 and 2015,
whereas expenses are assumed to stay constant between 2016 and 2018. Applying the
previously mentioned assumptions with the forecasts for depreciation62, interests63 and taxes64,
results in a net income of $316,4 million in 2014. The complete forecasts of Burger King’s
P&L are depicted in Figure 1.
Figure 1: Profit & Loss statement of Burger King Worldwide based on own calculations
The cost of debt is always a very critical factor in LBOs. In general, a high proportion of
generated cash flows is used to pay back debt, which suggests that another valuation could be
more appropriate, as for instance the Adjusted Present Value method (APV). The APV method
first discounts the unlevered cash flows with the unlevered cost of capital and second discounts
the interest tax shield of each year respectively with a different cost of debt, whereas the
discount rate is usually lower in the last years of the explicit period. Yet, when looking at the
61 This is attributable to the “comparable sales increase“ in existing restaurants, mainly attributable to improved marketing efforts and optimized menu offering. 62 The rationales for the other forecasts are as follows, starting with Depreciation: (Damodaran 2012) suggests to calculate depreciation based on the percentage of depreciation to sales in the previous year, hence the year 2013 and for example not the average of five years since depreciations are less affected by fluctuations. 63 With the debt level at the end of 2013, a cost of debt of 6,11% was calculated (weighted average of the current outstanding debt in 2013 yields an average interest rate of 6,11%), This is also in line with the high yield bond that has been issued in 2014 (Terms on the B-/Caa1 transaction were finalized at 6%) (http://www.highyieldbond.com/burger-king-2-25b-7-5-year-high-yield-bonds-b-caa1-price-to-yield-6/). 64 The assumed tax rate is 25%, which is fairly in line with the tax rate in 2012 and 2013. Because of internationally dispersed operations the tax rate is slightly below the US-tax rate.
P&L$%$Burger$King$Worldwide$(in$$$million)2013A 2014F 2015F 2016F 2017F 2018F
Revenue 1.146,3 1.200,1 1.240,4 1.282,4 1.325,9 1.371,2Franchise*and*property*revenues 923,6 976,3 1.015,5 1.056,3 1.098,7 1.142,9YoY 15% 5,70% 4,02% 4,02% 4,02% 4,02%
Company*restaurant*revenues 222,7 223,8 224,9 226,1 227,2 228,3YoY A0,8 0,50% 0,50% 0,50% 0,50% 0,50%
A Operating*expenses 558 530,4 503,9 503,9 503,9 503,9= Income$from$operations($EBITDA) 588,0 669,7 736,6 778,5 822,1 867,3Operating,margin 51,3% 55,8% 59,4% 60,7% 62,0% 63,3%
A Depreciation 65,8 68,9 71,3 73,6 76,1 78,7EBIT 522,2 600,8 665,3 704,9 745,9 788,6
A Interest*expenses,*net 200 179 179 179 179 179A Loss*on*early*extinguishment*of*debt 0 0 0 0 0 0= Income$before$income$taxes$(EBT) 322,2 421,9 486,4 525,9 567,0 609,7A Taxes 89 105 122 131 142 152Tax,Rate,on,EBT 27% 25% 25% 25% 25% 25%
= Net$Income 233,7 316,4 364,8 394,5 425,3 457,3Source:,Annual,report,2013,,Bloomberg,2015,,Own,calculations

!
40
last financial years at Burger King (2010 until 2013), illustrated in Appendix 11, one can see
that there were no major extraordinary debt repayments and that the debt level is relatively
stable (in absolute terms). This is why in this case, APV was considered as a possible valuation
method but in the end given the mentioned rationales not chosen as a valuation method.
Moreover, in order to run the DCF valuation, CAPEX and changes in NWC65 were forecasted.
As a benchmark for future investments, the ratio of CAPEX/Sales in 2013, which equals 2,22%
is applied to the future year66. Finally, a weighted cost of capital of 6,29% was used to discount
the respective free cash flows, yielding an enterprise value of $12.647 million. It is important
to note that a high proportion, approximately 81%, of the EV is constituted of the terminal
value. The calculation of the WACC is depicted in the aforementioned Appendix 10, whereas
the DCF valuation is shown in Figure 2.
Figure 2: DCF valuation methhod results of Burger King, based on own calculations.
5.1.3 Market capitalization approach
A first indication for positive returns is visible when comparing Burger King’s enterprise value,
based on market capitalization and total debt. It is thereby apparent that Burger King’s
enterprise value significantly increased from the end of 2010, a few months after the
acquisition, to December 31st 2013. According to this data, the enterprise value increased by
more than 3,5 times to around $10,3 billion. This enterprise value is composed of the market
capitalization of $8.050 million in addition to the total debt of $3.037 million, subtracted by
cash & equivalents in the amount of $787 million. The development of market capitalization
and total debt between 2009 and 2013 is depicted in Appendix 1167.
65 As no reliable data about working capital levels are available, the increase in working capital as a percentage of increase in revenue is used (from the year 2013). This is fairly in line with Damodaran (2012) who suggests to look at the peer group average for increase in working capital as a percentage of increase in revenue. 66 CAPEX were significantly reduced mainly due to the “global refranchising initiative” (Burger King Annual Report 2013). 67 Note that there is no available public information for market capitalization at the end of 2010 and 2011, as the company was taken private by 3G Capital.
DCF$%$valuation$(in$$$million)$2013A 2014F 2015F 2016F 2017F 2018F TV
EBIT 522,2 601 665 705 746 789! Tax%on%EBIT%(T%x%EBIT) 131 150 166 176 186 197= NOPLAT 392 451 499 529 559 591+ Depreciation 66 69 71 74 76 79! d%Investment%in%Working%Capital !93 6 5 5 5 5! Capital%Expenditures 26 27 28 29 29 31= Free$Cash$Flow$From$Operations 525 487 538 569 601 635+ Cash%Flow%from%Investing%activities% 43 0 0 0 0 0= Free$Cash$Flow$To$The$Firm 482 487 538 569 601 635 13.973PV$FCFF 458 476 474 471 468PV$Terminal$value 10.300 81%Enterprise$Value 12.647
Percentage%of%EV:

!
41
The enterprise value of around $10.305 million, which was calculated using market
capitalization and net debt was ultimately used to calculate internal rate of return. Compared to
the other two methods, it seems to be the most appropriate approach as it is specific to Burger
King and not dependent on a variety of assumptions. The multiple valuation method for instance
is based on competitor’s valuations and includes many other factors that are neither specific to
Burger King, nor to a buyout context. In turn, the DCF valuation depends on many different
assumptions that highly vary according to the analysts partly subjective assessment.
Additionally, the DCF method values the equity based on future cash flows, which may
overstate the value creation until a specific date. The DCF might therefore be more relevant in
an attempt to calculate and decompose the IRR before the completion of a deal for instance in
order to forecast value creation in the acquisition stage of a deal.
5.1.4 Calculation of the IRR
In order to calculate the IRR, equity value at the point of exit is needed, which is previously
defined to be December 31st 2013. Besides, the derived the free cash flows that were available
during the holding period and distributed through dividends and debt repayments, are included.
It is important, to also include these cash flows to the equity holders, since according to
Damodaran (2012), we cannot only use the entry and exit equity value to derive the correct
IRR. Besides, the IRR is calculated on a cross-basis without accounting for fees that were
charged by the management of 3G Capital.
The IRR is then calculated on the basis of three components. Firstly, the initial equity
investment of $1.200 million on December 31st, 2010. Secondly, cash flows accrued to equity
holders through dividend payments of around $393, $14 and $84 million respectively at the end
of 2011, 2012 and 2013. Thirdly, the previously derived equity value of $8.050,42 million, at
the point of exit on December 31st, 2013. Finally, based on these cash flows, an Internal Rate
of Return (IRR) of 113,18% is calculated68.
5.2 Analysis and composition of direct drivers
As formerly mentioned, one big advantage of the model provided by Achleitner et al. (2010) is
the intuitive application. Thereafter, we can assess value creation in the acquisition of Burger
King, by breaking down the Internal Rate of Return of 101,91%, into different levers.
68 Note that if we wrongly had ignored the cash flows that were distributed to investors during the holding period, the IRR would have been substantially lower (88,60%).

!
42
5.2.1 The effect of leverage
In order to derive the value that can be attributable to leverage, the value of the unlevered firm
was calculated. This was done with the unlevered IRR of 70,23%, which was derived, using
the previously introduced formula in the methodology part69. Applying the IRR of 70,23% as
yearly growth on the initial investment of $1.200 million, during the respective holding period,
results in an equity value of the unlevered firm of $5.919,58 million. Subtracting the previously
derived value from the exit equity value of the levered firm ($8.050,42 million) delivers the
effect that is attributable to leverage, which is equal to $2.130,84 million in value increase.
Most likely, value through leverage is to a large part attributable to the PE firm and therefore
extrinsic to Burger King. It is unlikely that Burger King would have issued a similar proportion
of debt without the influence and control of a financial sponsor. Moreover, it is possible that
Burger King, through the help of 3G Capital, was able to reduce the capital cost of debt, since
3G Capital is most likely a “repeat player” on debt markets (Berg & Gottschalg 2005). The
effect of leverage is visible through tax savings during the holding period and depends on the
relation of debt to equity that is maintained during this period70. Yet, it is also largely dependent
on the initial financing structure, which is set during the acquisition phase.
5.2.2 The multiple effect
Going forward, the marginal creation of value will be examined that is attributable to all other
drivers except leverage. It is important to note that the value explained by the following drivers,
is in total slightly higher than the value of the unlevered firm of $5.919,58 million, as we also
have to add up the dividends that have been paid out before the exit date. Adding the sum of
dividends, which have been paid out during the holding period ($491,7 million), yields an
overall value of gross cash flow through non financial levers of $6.411,28 million.
As the exit multiple is not known, it had to be calculated by dividing the enterprise value at the
exit date (m$8.169,68), which is comprised of the sum of the unlevered equity value at exit
(m$5.919,58) and net debt (m$2.250,1), with the EBITDA at the point of exit. The difference
of the resulting exit EV/EBITDA multiple (13,89) and the entry EV/EBITDA multiple (8,53)
69 Note that we calculated the unlevered IRR using the debt/equity ratio at the divestment point instead of an average during the holding period. This is done since market capitalization is not applicable for the years 2010 and 2011. Moreover, note that we calculated the unlevered IRR from the basis of the levered IRR that does only include the entry and exit equity values. Since we are interested in calculating the value of the unlevered firm, with help of the IRR, we are not including past cash flows that were already distributed to investors. 70 Private equity firms usually do not keep the capital structure of portfolio firms constant. The capital structure is generally dynamic as explained in Fischer et al. (1989).
!
43
is then multiplied with the EBITDA value at the point of entry (m$444,6). The calculation
yields $2.384,28 million, the marginal increase of value through the multiple effect.
Since the Burger King deal has in reality not yet reached the divestment stage, the used
EV/EBITDA multiple was calculated based on the unlevered equity value. When using the
market capitalization approach, to determine the firm value of Burger King, the increased
multiple might therefore in parts be explainable through investors expectations on future
performance, i.e. higher future cash flows. This can be extrinsic to Burger King, whereas
investors have positive expectations in the future prospects of Burger King as a portfolio
company of 3G Capital. In accordance with Berg & Gottschalg (2005), the multiple is likely to
be positively affected by improved operating performance 71 . Increasing Burger King’s
EBITDA from $444,6 million in 2010 to $558,0 million in 2013, might have therefore had a
positive effect on increasing the multiple, next to other reasons, as for instance improvement in
public market valuations in the fast food industry. Other explaining factors from the Berg &
Gottschalg (2005) framework that influence the multiple effect, as private information, are
likely to play a minor role, since they are more relevant in MBOs.
Superior market information and deal-making capabilities could also have played a role, as 3G
Capital possesses a strong network around the world72 and usually directly approaches its
targets, thereby surpassing structured bidding processes that involve more competition due to
multiple bidders, which usually drives up the price that the acquirer pays (Barney 1988).
Thereby they potentially pay a smaller multiple at entry or detect an undervaluation, thus
creating value already during the acquisition phase. Finally, the optimization of corporate scope
most likely played a role in increasing the multiple that would have been reached through a
divestment at the end of December 2013. By selling off assets, which are potentially
undervalued, as for instance, Burger King’s action of selling 1.292 company-owned restaurants
between 2010 and 2013, might not only have freed cash flows, but also increased the average
value of assets (Berg & Gottschalg 2005).
All of the aforementioned causes for the multiple effect are extrinsic to the private equity firm
(Cf. Berg & Gottschalg). Most of these causes are likely to have appeared during the acquisition
and divestment phase, whereas the optimization of corporate scope appeared during the holding
period. Moreover, it is suggested that the multiple effect in the Burger King example is closely
71 Compare this also to Achleitner et al. (2011), who found that higher sales are positively contributing to higher exit multiples. 72 Interview: Tim Brueggemann (2015).
!
44
related to the operational improvement that has been taken place during the holding period as
well as the future expected improvements in EBITDA and cash flows that are anticipated.
5.2.3 The effect of operational improvement
The two main drivers of operational improvement are the effect of EBITDA enhancement and
the cash flow effect. First, the result of the EBITDA improvement effect is $1.223,38 million,
which solely reflects the changes in EBITDA within the three years of the holding period.
Within this time, the EBITDA increased by 32,25% from m$444,6 at the end of 2010 to m$588
in December 201373. The EBITDA effect can further be broken down into the effect of sales
improvement, margin improvement and a correction factor. Appendix 12 summarizes the
results comprehensively. Given the change in the Burger King business model that included
selling most of the proprietary restaurants, sales were constantly decreasing within the
considered time frame. Hence, the growth in EBITDA was only generated through margin
expansion, with at the same time a significant decline on the top-line. Therefore, the overall
development in sales theoretically contributed negatively towards the overall EBITDA effect.
Thus, the correction factor of around $3.878 million accounts for simultaneous changes in both
drivers (negative sales growth and improved EBITDA margin). Breaking down the sales
development in franchise and property revenues and company restaurant revenues helps to
understand the dynamics behind the decrease in sales and to make implications about future
developments. Contrariwise to the declining revenues through company restaurants, franchise
and property revenues were constantly growing, on average at 11,8% during the holding period.
As by the end of 2013 all restaurants were sold74, going forward the EBITDA effect is expected
to be considerably stronger, as top-line growth is added next to the further likely margin
improvements. It cannot be ruled out that parts of these future improvements are already
factored into the multiple effect, as previously discussed.
Additionally, the cash flow effect, leads to an absolute value increase of $834,6 million. This
effect is composed of the dividend payouts during the holding period (m$491,7) and the
reduction in net debt of $342,9 million between the entry and the exit point. The reduction in
net debt is often also known as de-leverage effect. The cash flow effect measures the cash flows
that were generated throughout the holding period (Capital Dynamics & Achleitner 2009). In
this case cash both debt repayments and dividend payments were considered for the cash flow
effect. Lastly, as suggested in the Achleitner et al. (2010) framework, a combination effect of
73 The effect is calculated by multiplying the difference of m$588 and m$444,6 by the entry multiple (8,53). 74 Except of the 52 restaurants in Florida that are kept as company owned restaurants

!
45
$769,02 million is added, which measures simultaneous changes in EBITDA and multiple
during the holding period.
Comparing the different levers of the operational improvement effect, with the framework
provided by Berg & Gottschalg (2005) it appears as on the one extreme the margin
improvements are rather related to increasing operational effectiveness, whereas on the other
extreme the decline in sales is related to increasing strategic distinctiveness in Berg &
Gottschalg (2005). The cash flow effect, is also strongly related to the reducing capital
requirements lever, which is a sub-lever of increasing operational effectiveness, in the given
Berg & Gottschalg (2005) framework. However, given the strong influence of EBITDA
towards free cash flow it remains questionable if the Achleitner et al. (2005) model accounts
for this lever correctly. Therefore this paper suggests an alternative method to derive the impact
of the cash flow effect. Two approaches might be feasible to only regard the capital
requirements elements and ignoring operating profits, in the cash flow effect. As depicted in
Appendix 13, two methods are suggested, one forward looking and one backwards looking
method. The first method that accounts for the past perspective adds up the sum of free cash
flows that are attributable to depreciation, NWC and CAPEX. It functions similar as the method
proposed by Capital Dynamics & Achleitner (2009), but the hereby proposed method ignores
the effect of operating profits, which result in a much smaller cash flow effect75. Using this
method, the absolute impact of the cash flow effect would be only $256 million. The second
proposed method, forecasts depreciation, NWC and CAPEX and calculates the enterprise value,
only based on these three elements. Discounting with the appropriate cost of capital leads to an
enterprise value of approximately $198 million, which is attributable to the impact of the cash
flow effect or changes in capital requirements.
5.2.4 Relative importance of value drivers
Consequently, it is useful to look at the absolute effect of value creation and the relative effects
of the different value drivers. Achleitner et al. (2010) present their results with the help of the
money multiplier76, which is defined as the “ratio of all positive and negative cash proceeds”
75 Note that the previous calculation included all dividend payments and the final reduction in net debt. In theory, this should equal the free cash flow available to the firm, during the holding period. However, since not all free cash flows to the equity are directly distributed to the shareholders, and for instance in 2011 the dividend payment was higher than the generated free cash flows to the equity, the sum of the free cash flows is different from the sum of payments to shareholders and principal payments and debt push downs to creditors. For the former calculation of the free cash flow effect, this paper used the sum of dividends and reduction in net debt, as suggested in Capital Dynamics & Achleitner et al. (2009). 76 Acharya et al. (2012) define this as the “cash-in/cash-out multiple”.

!
46
(Achleitner et al. 2014, p. 430). Applying the money multiplier to each of the individual drivers,
shows the contribution of value as depicted in Figure 3.
Figure 3: Money multiple contribution of each value driver, including entry equity value
Moreover, since we are interested in the overall value increase, or the net cash flow, without
the initial investment, overall times money, is calculated by subtracting 1 from the money
multiple (Achleitner et al. 2010). The money multiple77 is the ratio of positive cash flows to the
initial investment 78 . The overall times money multiple of 6,12 can furthermore be fully
explained by the individual measures. Dividing each individual money multiplier by the overall
times money, uncovers the relative effect of each individual driver. Figure 4 illustrates the
relative percentage contribution of each driver.
Figure 4 Composition of IRR: Different percentage contribution of value drivers
Finally, the previous approach was applied to Burger King’s biggest competitor, the
McDonald’s Corporation. The publicly available market capitalization was used for the
respective holding period of Burger King. The respective IRR for McDonald’s shareholders
77 Multiplying the initial investment by the money multiple yields the overall cash proceeds. 78 Note that cash proceeds include the exit value as well as formerly distributed cash flows. If further investments are made during the holding period a better definition of the money multiple might be “the ratio of all positive to negative cash proceeds” (Achleitner & Figge 2014, p. 430).
7,12 1,78
5,34 1,99
1,02
0,640,7
1,000,001,002,003,004,005,006,007,008,00
Value1levered1firm
Leverage Value1unlevered1 firm
Multiple EBITDA Combination FCF Equity1value1at1entry
Money1m
ultip
le
100% 29%
71% 32%
17%
10%11%
0%10%20%30%40%50%60%70%80%90%100%
Value1levered1firm
Leverage Value1unlevered1firm
Multiple EBITDA Combination FCF
Percentage1of1value1creation
!
47
equals 5,92%, without dividend payments79. The most striking result of the analyzed data is not
only the substantially smaller IRR, but also the composition of individual drivers that constitute
the returns. Appendix 14 presents and compares the breakdown of value drivers for
McDonald’s and Burger King according to the money multiple. These results suggest that the
EBITDA effect was the only relevant effect for the public peer, which was on a relative basis
still lower than Burger King’s improvement in EBITDA80.
79 Whereas the same tax rate and cost of debt was assumed. McDonald’s cost of debt is expected to be less, amongst others due to the lower leverage ratio. 80 Burger King’s EBITDA increased by approximately 32% between 2010 and 2013 whereas McDonald’s only increased EBITDA by 18% in the respective period.

!
48
6 Qualitative Analysis of indirect drivers The formerly analyzed drivers have shown that the Burger King buyout has created a
remarkable amount of value. However, it remains questionable why Burger King was only able
to take advantage of these drivers in the context of the acquisition of 3G Capital. Would they
also have been able to pull the aforementioned drivers on a stand-alone basis? As many of the
elements of the value drivers are extrinsic to Burger King, it seems as this question can be
answered with: rather not, at least not in the amount that has been shown81. In the following we
will analyze the indirect or secondary drivers that will partly explain why value generation is
different in the context of leveraged buyouts Berg & Gottschalg (2005).
6.1 Corporate governance
In line with incentives, corporate governance is one of the most frequently mentioned indirect
drivers in academia. Both indirect drivers are frequently associated to the agency problem and
are possible solutions to reduce agency costs (Berg & Gottschalg 2005). The Aguilera &
Jackson (2003) corporate governance framework is in this case especially suitable as it views
corporate governance from the perspective of the three most important stakeholder groups in
the Burger King buyout, namely capital providers (shareholders as well as creditors),
management and employees. By using the Aguilera & Jackson (2003) framework, which is
depicted in Appendix 5, it is dispensable to analyze other secondary value drivers as (iii)
leverage as a form of controlling managerial behavior and (iv) culture and form of
communication separately, since they are already indirectly included in the corporate
governance framework.
The capital perspective of corporate governance, views the capital structure, interests of capital
and the maturity of capital. The capital structure in the Burger King deal changed significantly
during the holding period. Whilst 3G Capital’s initial investment was financed by
approximately 70% debt, the total debt ratio was strongly decreasing to around 29% at the
divestment stage82. Creditors, who are assumed to be risk averse, generally receive a steady
income through interest rates, but do not have control rights in the firm. Control rights for
creditors usually only come into play when the company is not able to pay its debt or expulses
against certain covenants (Aguilera & Jackson (2003). As Burger King seemingly did not
violate any of these terms, the control right remained at the side of the equity investors, which
81 Whereas it is acknowledged that a certain fraction of value generation would and could have appeared without being acquired by 3G Capital. 82 The net debt to EV ratio was even lower with approximately 22%.

!
49
are mainly represented by 3G Capital. The increased debt ratios, especially during the beginning
of the holding period, might have in line with (Jensen 1986) further reduced the flexibility of
management, due to the pressure of serving payments to debt-holders. This in turn is likely to
have an efficiency increasing effect on the operational results of Burger King83. Looking at the
concentration of equity ownership (La Porta et al. 1999) of Burger King it gets apparent that
ownership is very concentrated84. Whereas 3G Capital owned around 70% of the stock’s at the
end of 2013, a large proportion of the remaining fraction belongs to people that are associated
with 3G Capital85, as for instance the hedge fund Pershing Square Capital Management founded
by Bill Ackman, which owns around 10% of the outstanding equity86. In the annual report 2013,
Burger King states that “the concentration of ownership by 3G Capital may prevent other
shareholders from influencing significant corporate decisions”87. In contrast to other public
firms where ownership is usually rather fragmented, concentrated ownership leads to higher
influence of shareholders on management (Aguilera & Jackson 2003). Moreover, comparing
financial versus strategic interests of capital (Aguilera & Jackson (2003), it is likely that 3G
Capital on the one extreme has financial interests but on the other extreme also possesses
strategic interests. The strategic interests as for instance the assurance of control rights, might
thereby be a method to serve the financial interests, which is most likely the achievement of a
high IRR. Lastly, regarding the maturity, 3G Capital’s capital can be regarded as committed,
not only due to the high stake of ownership, but also given their long-term investment strategy.
The second perspective on corporate governance is focused on labor, and analyzes the degree
of employee influence as well as employee retention at Burger King. The degree of employee’s
influence is defined as the “ability to influence corporate decision making and to control firm’s
resources”. The principle of the 3G Capital governance system and culture is build around
participation. Since the take over, every employee within the corporate headquarter possesses
great responsibility, whereas roles are usually not double occupied. Besides, each department
and employee is responsible for sticking to its own budgets. This allows each employee to
participate in the overall company goals and to have a direct impact. Moreover, due to the open
office culture, every employee has theoretically access to the top management and can raise
new ideas or potential for improvement. The flat hierarchy level might even be compared to a
83 This reflects the indirect driver: Leverage as a form of controlling managerial behavior. 84 3G Capital owns approximately 70% of the equity. 85 Interview: Tim Brueggemann (2015). 86 TheStreet (2014): http://www.thestreet.com/story/12856055/1/how-burger-kings-brilliant-brazilian-billionaire-turned-12b-into-22b.html. 87 Burger King: Annual report (2013).

!
50
“Start-Up feeling”88. This way employees at Burger King can influence corporate decision
making. Yet, employee influence and liberty are only given as long as employees perform
according to their targets. When they reach their proprietary KPIs, control only plays a minor
role. However, if these goals are not reached, the environment might also get tougher and
subject to stricter external control89. The fact that employees in the Burger King headquarter
are usually trained as generalists, possibly negatively contributes towards employee retention,
as employees might also be able to leverage their skill set in other firms. Yet, employee
retention is partially secured by the given bonus structure and compensation scheme. Since a
significant portion of the salary is variable and paid out at the end of the year, employees have
strong incentives to stay at least until the end of the year90. This will further be discussed in the
next section that deals with incentives. Furthermore, due to the direct responsibilities and
accountability for tasks, employees also have a virtual stake in the firm, which is firm specific
and fosters employee retention (Aguilera & Jackson 2003).
Thirdly, corporate governance is viewed from the management perspective. The management
works in close cooperation with 3G Capital, and many of Burger King’s top executives have
formerly worked for either 3G Capital directly or firms that are associated with the firm. Burger
King’s CEO for example, Daniel Schwartz, is next to his CEO position at Burger King also a
director at 3G Capital91. Due to these links, agency conflicts are automatically minimized, as
management and shareholders are both working for the same firm. Comparing autonomy versus
commitment, we can say that management is very committed to 3G Capital, whereas the
relationship towards employees shows mixed results. Due to the less hierarchical culture, the
relationship is rather committed, yet, regarding personal decisions, management can act very
autonomous, especially in the beginning of the holding period, where overall FTE headcount
was reduced from around 800 to nowadays around 300 people in the corporate headquarter in
Miami92. Moreover, looking at the orientation of managers from the Aguilera & Jackson (2003)
model, it is clear that Burger King management is strongly working financially oriented. Even
though the functional area is also important, all types of management jobs, but also less senior
positions are linked to financial metrics. In this sense Burger King is rather organized as a Start-
Up, instead of a globally operating fast-food giant93. Rather than specializing on tasks, jobs are
88 Interview: Tim Brueggemann (2015). 89 Interview: Tim Brueggemann (2015). 90 Interview: Tim Brueggemann (2015). 91 Burger King: Annual Report (2013). 92 Interview: Tim Brueggemann (2015). 93 Bloomberg (2014): http://www.bloomberg.com/news/articles/2014-07-24/burger-king-is-run-by-children.

!
51
frequently rotated, which helps to question old patterns and steadily improve things. Next to
the strong learning curve for young managers, this also comes with the downside that errors are
committed. The culture of Burger King also allows these errors, yet it is expected that young
managers learn fast and not commit the same error for a second time94.
6.2 Incentives
An important part of the 3G Capital management culture is the component of variable pay. A
known Brazilian businessman and former billionaire Eike Batista, noted in an interview in 2012
that the management style of 3G Capital’s founding partner Jorge Lemann is unique as “he
motivated employees by letting them share the profits –aggressive, but that leads to results”95.
Assuming that incentives are an element of overall corporate governance (Cf. Cornelli et al.
2013) and applying the former corporate governance framework from Aguilera & Jackson
(2003), incentives appear several times in the context of the corporate governance equation.
Each employee at Burger King96, gets a substantial amount of his salary as a performance based
variable part that is paid at the end of the year in the form of a bonus. The percentage share
depends on the level of seniority and can reach from around 15% on the analyst level to up to
100-200% at the top management level. Middle management positions as “Manager”,
“Director” and “Vice President” receive up to respectively 30%, 40% and 70%, as a variable
fraction in addition to their base salary97.
Firstly, as an element of the stewardship ship theory, financial incentives might provide a
certain degree of autonomy to managers. In relation to the financial orientation of managers,
this might facilitate to sometimes “make tough decisions”, for instance regarding personnel
matters (Aguilera & Jackson 2003, p. 457). In the Burger King context, new managers that
entered Burger King in the post-acquisition phase were likely less committed and attached to
employees, as they were not “dependent on firm-specific relationships” (Aguilera & Jackson
2003, p. 458). Since monetary incentives are attached to corporate global goals, they might
facilitate making unpopular decisions in order to stick to the budget. On this note, the given
bonus structure is strongly related to the financial orientation of managers. Through the
application of “management by objectives”, each person is evaluated according to around 10
different Key Performance Indicators (KPIs), which are very specific to the respective area and
94 Interview: Tim Brueggemann (2015). 95 http://www.businessinsider.com/3g-capital-jorge-lemann-2015-8. 96 The information is specific to employees in the corporate headquarter in Miami. It is likely that the compensation does not apply for support functions in the HQ as well as restaurant personnel. 97 Interview: Tim Brueggemann (2015).

!
52
role of the job. These KPIs are tremendously important for the bonus payment, as the
compliance to reaching these objectives in the end defines the amount of bonus that is paid out.
In turn, there are so called global targets, whereas each individual contributes, by reaching his
or her individual KPIs. This way, each individual accounts for a valuable piece of the overall
value creation puzzle. Therefore, the bonus has a significant motivational effect on everyone in
the firm, even on lower management positions98. As the bonus is already paid for entry positions
as for instance analysts, the former effects do not only apply for management positions, but also
include the labor dimension of Aguilera & Jackson’s (2003) model. As previously noted it
might turn employee retention less portable and more firm specific, as bonuses are usually paid
out only once a year.
Lastly, it is worth looking at an element that is not explicitly included in the governance
framework of Aguilera & Jackson’s (2003), namely the board of directors. Cornelli et al. (2013)
investigate boards monitoring activity on CEOs and whether this leads to improved
performance. The authors regard incentivizing and monitoring of management, as the main
tasks of the board99. By having a majority stake in the portfolio company, thereby actively
controlling the board, and having access to soft information about board performance and being
able to leverage that information, is likely to be an important factor in the context of 3G
Capital’s acquisition of Burger King.
98 Interview: Tim Brueggemann (2015). 99 Whereas it shoud not be forgotten that board members at Burger King are also incentivized.

!
53
7 Discussion and conclusion
7.1 Value creation in the Burger King buyout
Comparing the generated IRR of the Burger King investment (101,06%) with the typical IRR
goal for successful deals of private equity firms, which lie between 40% and 50%, is a first
strong indicator for value creation in the Burger King deal. A current empirical study by Lopez-
de-Silianes et al. (2015), which analyzes round 7.500 private equity investments worldwide,
shows that these claims are in praxis rather wishful thinking, and only represent a minority,
since only 1 out of 4 deals achieved an IRR exceeding 50%. Besides, comparing the derived
results, with the original model of Achleitner et al. (2010), shows that the created value in the
Burger King deal is substantially larger than the average in the respective sample. Whereas the
money multiple, adds up to 3,5 in the original study, Burger King already achieved a money
multiple of 7,12 during the first three years of the 3G Capital ownership. By going one step
further and comparing the generated IRR in the Burger King buyout of 101,06% with the IRR
that the McDonald’s Corporation (5,92%), Burger King’s biggest competitor, achieved in the
same time period, further emphasizes the strong financial results that have been achieved at
Burger King. There is a strong possibility that these results are different when comparing the
IRR and different value levers with a broader peer group100.
The presented Burger King buyout, is an example for positive value creation and is in line with
most authors of the literature review, who claim that private equity investments create value.
In this sense, the previously presented numbers, support the initial assumption that the Burger
King deal created significant value for its shareholders, and therefore serves as a good example
to assess the individual levers that were driving the creation of value101. Yet, further research is
necessary to fully grasp the creation of value on the level of investors (LPs), who provide capital
for private equity funds. An extension of the model provided by Achleitner et al. (2010) that
accounts for the fees that are paid to GPs is thereby desirable in future research102 . The
following discussion will further critically discuss the dynamics behind the primary levers and
subsequently debate the two most important secondary levers in the Burger King deal.
100 Future research in this field is desirable, that possibly accounts for a larger set/sample of competitors. 101This paper does not provide empirical support for the general hypothesis, that private equity creates value. By applying the previously introduced methodology, it is solely shown how value can be assessed and how this can be composed into several drivers. 102 Note that this is not an easy task, as most private equity firms do not have the obligation nor incentives to fully reveal their encountered fees.

!
54
7.2 Discussion of direct drivers
Looking at Figure 3103, which depicts the composition of the IRR, gives a first indication that
value creation in private equity might hardly be explainable through only one driver.
Comparing the effect of the value drivers relatively, shows that there is not one driver that
explains the absolute majority of created value. In contrast to (Achleitner et al. 2010) who
explain 32% by leverage104, this paper found a slightly lower proportion in the Burger King
deal, where the effect of leverage accounts for roughly 29%. Instead, in the example of Burger
King, the most dominant driver on a relative basis, is the multiple effect, which accounts for
32,47%. This is 14,47 percentage points higher than in the original model. Surprisingly, the two
operational improvement drivers in the previous analysis are both relatively lower, compared
to the average findings of the Achleitner et al. (2010) model. Whereas, the original framework
found that EBITDA improvements were the second strongest driver, accounting for almost
31%, the case of Burger King explained only around 17% with the enhancement of EBITDA
within the three years holding period. To sum up, Figure 5 summarizes the differences between
the respective relative value contribution of each driver, between Burger King and the sample
average of Achleitner et al. (2010).
Figure 5: Relative value contribution of value drivers (Burger King vs. Achleitner 2010)
Despite the concerns of some authors, who only regard the improvement in operating
performance as a driver of value creation (Bergström et al. 2007), the formerly analyzed case
study, gives an indication that the effect of leverage contributed to an increase in equity value
and firm value respectively. Controversially to common literature on secondary buyouts (SBO),
as for example Achleitner & Figge (2014), who propose that value creation in SBOs is mainly
103 In chapter 5.2.4 Relative importance of drivers. 104 Note that leverage accounts for an even larger proportion in large transactions (>100 m€). The relative effect of leverage in comparison to other drivers is approximately 38% of the overall value creation (Capital Dynamics & Achleitner 2009).
100,0%
29,0%
71,0%
32,5%
16,7%10,5% 11,4%
32%
67,7%
18%
30,76%
4%
14,90%
0,0%10,0%20,0%30,0%40,0%50,0%60,0%70,0%80,0%90,0%100,0%
Value2levered2firm
Leverage Value2unlevered2firm
Multiple EBITDA Combination FCFPercentage2of2value2contributio
n
Burger2King2 Empirical2results
!
55
driven by leverage, here leverage seems to play an important, yet secondary role, as it accounts
for only 29% of the IRR. Furthermore, it is important to note that these results only measure
the impact of tax shields on firm value, while neglecting the potential importance that derive
from managerial objectives of debt, which lower the flexibility of management and therefore
potentially increase the organizational efficiency (Jensen 1986). Even though debt might lead
to a more efficient use of cash flows, thereby lowering potential agency costs, the optimal
choice of capital105 might create another potential agency problem, whereas an overly levered
capital structure could adversely affect the investors of the fund (LPs). Ignoring the
aforementioned factors might pose a possible limitation on the quantitative model.
Nevertheless, this paper discusses the behavioral effect in the context of secondary levers as a
part of corporate governance. To sum up, it can be referred back to the first proposition and
said that leverage is an important direct value driver in the Burger King buyout. The argument,
higher interest tax shields are neutralized by higher costs of debt, which some authors pose on
leverage (e.g. Long and Ravenscraft (1993) and Samdani, Butler et al. (2001), cited after Loos
2005), can therefore be neglected for the Burger King buyout106.
On a relative basis, the multiple effect has the strongest impact on value creation. This is partly
contradicting the initial expectation that the operational improvement effect has the strongest
impact on value creation. However, given the various possible explanations for the multiple
effect107, it is unclear which of the explaining factors have higher weight. Besides, it is likely
that the multiple effect already includes future improvements in operating performance. The
comparison with McDonald’s suggests that the contribution of increased market multiples is
rather low, since the multiple effect for Burger King’s major competitor only accounts for
approximately 1% of value creation. It is therefore likely that as previously supposed, optimized
corporate scope and higher future expected cash flows108 play a major role in explaining the
multiple effect. This in turn might pronounce the added value that 3G Capital contributed as a
private equity investor109.
105 Note that the capital structure is assumed to vary within the holding period of the private equity firm. 106 This can be related to several factors, as for instance financial engineering skills of 3G Capital, in order to finding the best debt/equity ratio. Or also favorable terms and conditions that PE firms receive on the debt market as they are repeat buyers (Berg & Gottschalg 2005). 107 As depicted in Appendix 4, i.e. market valuation, deal-making capabilities, optimized corporate scope, etc. 108 Cf. Achleitner et al. (2010, p. 21) who propose that “the higher multiple at exit could be an indication oft he improved future prospects fort he company”. 109 It has to be noted that the former analysis does not show that the multiple effect is significantly higher in private equity investments compared to public firms (due to the simple comparison with McDonald’s).

!
56
Moreover, it is suggested that future research splits the multiple effect into extrinsic and
intrinsic factors. Extrinsic factors are according to the definition of Berg & Gottschalg (2005)
attributable to the influence of the PE firm, whereas intrinsic factors would have also appeared
in the firm, without the investment of the buyout firm. Changes in market valuations are for
instance intrinsic, as they would have also appeared without the active participation of the
private equity firm110. A suggested modification to the Achleitner et al. (2010) model is to
calculate a second version of the multiple effect, using the multiple of the peer group111. On the
one hand, the difference of the EV increase from the unlevered Burger King multiple (13,86)
to the unlevered peer group or competitor multiple (McDonald’s: 10,34) is then illustrating the
value that is attributable to specific skills or competences of Burger King and 3G Capital. On
the other hand, applying the unlevered peer group multiple, depicts the part of the multiple
effect that it is attributable to changes in market multiples. Applying these changes might turn
the quantitative model into a better forecast model instead of “only” analyzing past
performance. When applying this amendment, 33,75% of the multiple effect are attributable to
changes in market valuation, whereas 66,25% are subject to all other changes, as illustrated in
Appendix 15112. Increased future prospects of Burger King seem to be the strongest factors for
the higher multiple of Burger King. Yet, future research is necessary to verify these
hypotheses113.
Henceforth, this paper views the multiple effect as a direct driver, since the improvements do
not seem to be purely luck but in parts are attributable to skill and competence of the private
equity firm. Consequently, Proposition 2 can be confirmed as the multiple effect generates
value. An extension to the model of Berg & Gottschalk (2005) is the suggestion that financial
arbitrage (the multiple effect) can be in parts regarded as a value creating driver. Thereby the
question if financial arbitrage should be denoted as value capturing or creating is subject to
individual definition, whereas the contextualization of Berg & Gottschalg (2005) that the
multiple effect does not directly increase the financial results of a firm, is acknowledged114.
110 A synonymous but reverse argumentation would be that a change in market valuation is an exogenous factors, whereas an optimized corporate scope is endogenous and subject to the skill and know-how in the portfolio company, that has probably partially been transferred from the buyout firm. 111 It hast o be taken into account, that this also has to be the unlevered EV/EBITDA multiple. In the McDonald example the EV/EBITDA multiple is 10,34 for the unlevered firm and 13,53 for the levered firm. 112 Here the market multiple is only calculated by taking the unlevered EV/EBITDA multiple of McDonald’s. Further improvements of this suggestion should rather consider a wider peer group. 113 This is for instance feasible when applying the Achleitner et al. (2010) model to the whole peer group. Comparing these results to Burger King might present more representative results. 114 For instance, in opposition to the operational improvement effect.

!
57
Comparing the operational improvement effect of Burger King to the empirical results, derived
by Achleitner et al. (2010) showed that operational improvement was relatively smaller in the
Burger King deal, whereas it strongly exceeded the average empirical results of the study, as
depicted in Appendix 16. Besides, the results were compared to Burger King’s strongest
competitor, McDonald’s, where both operational improvement effects, were lower in terms of
money multiple as depicted in Appendix 14. The comparison with McDonald’s supports the
results of Cressy et al. (2007), who found that “operating profitability of companies backed by
PE firms was greater than that of comparable non-buyout companies” (Cressy et al. 2007, p.19).
The authors also found that industry specialization is a differential factor in private equity
investments that constitutes a competitive advantage. 3G Capital’s sector expertise in the food
& beverage industry, as well as it’s focus on operational excellence115 can be a possible
explanation for a competitive advantage that constitutes the superior results compared to other
transactions (Cf. Cressy et al. 2007).
Both, the comparison with McDonald’s as well as benchmarking the operating profitability
results with the empirical results of Achleitner et al. (2010), indicate that the operational results
at Burger King are not random and attributable to certain skills or capabilities that 3G Capital
transferred to the firm. Based on the indirect drivers that support the direct ones, this thesis
qualitatively showed that these results are to a certain degree attributable to the participation
and support of 3G Capital. Therefore, it can be concluded that the results seem to be extrinsic
to Burger King (cf. Berg & Gottschalg 2005). Moreover, Loos (2005, p.20) defines support
from the private equity investor as improving “resource efficiency” or “resource
redeployment”. By contributing knowledge and expertise, 3G Capital contributed to the
positive development of it’s portfolio company. Yet, only based on the Burger King example
and comparing it to one competitor and other PE transactions it cannot be statistically proven
that the superior results are only attributable to 3G Capital116. In order to make a more accurate
statement, future research might address the operational improvement approach of 3G Capital,
by analyzing a broader set of portfolio companies and comparing them respectively with their
peer group.
Opposed to the findings of Bonini (2012), who provide statistical evidence that SBOs do not
significantly improve operational performance, this paper showed that the Burger King deal
115 3G Capital (2015): Company website. 116 The qualitative analysis of Burger King before the buyout suggest that Burger King did not possess any sustainable competitive advantage over it’s competitors.
!
58
generated substantial amount of value through operational improvement and other levers that
are not related to leverage. Therefore Proposition 3: Value is created through improved
operations is confirmed, through both EBITDA improvements and the cash flow effect,
whereas EBITDA improvements are solely achieved through an enhanced EBITDA margin.
Although, future enhancements through revenue are likely, so far in the considered holding
period, sales were declining and therefore not positively contributing to value creation. In turn,
the cash flow effect also contributed to operational value creation, first of all through dividend
payments and second of all through debt repayments. These debt repayments do not increase
the enterprise value, but rather increase the relative weight of equity. Since the cash flow is
derived and dependent from different factors as EBITDA, working capital, CAPEX and also
tax and interest payments, the effect measured through the Achleitner et al. (2010) model can
not purely be attributable to improved asset utilization and is therefore not mutually exclusive
to other factors. In the ideal case it would only include changes to the FCF, after the EBITDA
in the Profit & Loss (P&L) statement. To correctly measure the effect that was previously
described in the literature review it should in theory only rely on asset related measures as
changes in working capital, depreciation and CAPEX. Therefore, this paper proposed two
alternative ways to measure the cash flow effect. Further research might account for the
applicability and validity of these two alternatives.
Another interesting field for future research is the analysis of the investment strategy of 3G
Capital, which would have extended the scope of this paper. It is thereby interesting to
investigate if 3G Capital with the follow-up acquisition of Tim Horton’s intended to pursue a
so-called “buy-and-build” strategy (Cf. Loos 2005). After analyzing the Burger King deal it is
assumed that the long-term approach of 3G Capital includes future acquisitions117. These
acquisitions enable the realization of synergies after improvements through first further cost
reductions and second organic top-line growth are already utilized and not able to provide the
demanded future improvements on a stand-alone basis118.
Finally, once more it has to be stressed that the aforementioned different drivers are not
mutually exclusive, but rather interrelated. Since this paper only analyzes the first three years
of 3G Capital’s involvement at Burger King it is very likely that the whole operational
117 Future research might address this approach and analyze it from a strategic perspective. My assumption is that 3G Capital is optimizing its portfolio companies first internally and as further improvements are not feasible anymore, they continue buying related firms, in order to improving the new company and to aim for synergies. 118 Note that the acquisition of Heinz provides a similar pattern where first costs were reduced, second sales were spurred and third Kraft was acquired and merged with Heinz. A similar strategy is visible at ABInbev which is partly controlled by affiliates of 3G Capital.

!
59
improvement potential has not yet been exploited. Therefore, it is likely that the multiple effect
already accounts for and anticipates future improvements in EBITDA and cash flows.
Moreover, referring back to Jensen (1986) leverage is likely to have a positive behavioral effect
on operating performance.
7.3 Discussion of indirect drivers
The two identified main indirect drivers, corporate governance and management incentives, are
both important to explain value creation in the Burger King deal. Whereas they are not
quantitatively verifiable, their existence is in parts likely to explain the results of the former
direct drivers. The analysis of these drivers are consistent with former research, which found
that corporate governance and incentives are a possible explanation for success in private equity
investments. The fact that shareholders of Burger King are at the same time the ones that are
responsible for managing the company, provides strong incentives to aim for maximizing firm
value, which is why Proposition 4: Indirect drivers play a role in explaining value creation in
leveraged buyouts, is supported (Cf. Cornelli & Karakas 2008). Both incentives, as well as
corporate governance are thereby relevant to explain value creation. On the one hand since both
reduce agency cost. On the other hand, incentives may increase employee motivation and
changes in corporate governance may support active board involvement (Cf. Kaplan &
Strömberg 2009).
As formerly stated in the literature review, private equity firms often redesign the structure of
corporate governance, which may change the dynamics of agency costs (Kaplan 1989b). Since
3G Capital owns more than 70% of the stocks, Burger King is a “controlled company”
constituted under the rules of the New York Stock Exchange, which exempts the firm from a
variety of corporate governance requirements. Therefore, the majority of the board members
does not consist of independent directors. Besides the company does neither have to have a
“corporate governance and nominating committee” nor a “compensation committee”, which
provides more freedom and flexibility to both Burger King’s board and management as well as
it’s controlling shareholder 3G Capital119. In accordance with Cornelli & Karakaş (2008) one
might therefore question if firms as Burger King, which are controlled by private equity firms
actually need a board of directors. This claim gets even more relevant while questioning the
main task of the board of directors, which is to ensure that management acts in the best interest
of it’s shareholders (Cornelli et al. 2013). The question if less necessity for board control on
119 Burger King: Annual report (2013).

!
60
management frees capacities of directors to focus on strategic topics (for instance, future
follow-up acquisitions) is left for future research.
In general, and especially in the case of Burger King, the private equity fund 3G Capital is
providing the majority of the board members and has completely changed the composition of
the board, starting after the successful acquisition. Daniel Schwartz is therefore not only the
CEO of the company, but also a director at the controlling shareholder 3G Capital. Due to the
affiliation of management and ownership 120 , concentrated ownership but also powerful
incentives, the supervision role of the board to make sure that management acts is the best
interest is becoming obsolete. Yet, this does not mean that the board is redundant, but rather
the opposite as the board of Burger King becomes an advisor instead of a supervisor, which is
comparable to the thoughts of Cornelli & Karakas (2008). Other papers argue that an
“unsufficient representation of independent directors” can be dangerous and lead to failure of
monitoring management sufficiently (Desender et al. 2013, p. 824). This may jeopardize the
anticipated positive effect of private equity firms on governance. Yet, as management and
shareholders are closely affiliated at Burger King, control plays a less important role. In turn
the concerns of Desender et al. (2013) can be disregarded.
Ultimately it is the corporate governance framework that provides the direction for the
company, whereas incentives impact the alignment of interests between management and
shareholders. Both of the indirect drivers contribute to reduce the loss of value through agency
costs. Beyond that, incentives also positively contribute to value creation by motivating
management and employees (Cf. Easterwood et al. 1989). As incentives allow the distribution
of profits between shareholders and management, the negative “wealth consequences of
managerial decisions” are internalized, which “can enhance the productivity of the firm” (Lehn
& Poulsen 1989, p. 773). Although, the motivational aspect of incentives is not quantitatively
provable, the interview with one of Burger King’s employees revealed that the bonus provides
strong incentives to stick to individual budgets, which contributes to overall cost reduction and
value creation at the firm level. Finally, Loos (2005) compares the corporate governance
transformation in buyouts to start-up firms, as management is incentivized with shares. In the
Burger King example governance does not only change the remuneration and equity
120 3G Capital uses an internal talent pool to occupy management positions. Management and board positions are usually staffed with either direct partners of 3G Capital or other people that have proven themselves in current or former portfolio companies (Interview with Tim Brueggemann 2015). Before Daniel Schwartz, another partner of 3G Capital, Bernardo Hees, was the CEO of Burger King. He left Burger King in 2013 to pursue the CEO position at Heinz.

!
61
participation of managers and employees, but also changes the organizational culture, for
example through the reduced spending behavior of employees121. This might also be related to
the motivational efficiency impact of high debt levels (Cf. Jensen 1986).
7.4$Concluding$remarks$The first contribution of this paper towards existing theory of value creation in private equity
is the provision of a comprehensive and well structured literature review. The literature review
summarizes empirical and qualitative findings and includes traditional as well as up-to-date
papers that deal with the respective topic. Furthermore, this paper contributes to academic
literature by applying a specific empirical value creation model to a single firm. Whereas the
direct drivers show how value has been created, the following debate about indirect drivers
allows to understand the specific dynamics that are changing in the buyout context. Thereafter
both incentives and corporate governance appear to strongly contribute towards value creation.
Furthermore, this thesis clears the way to use the analyzed model as a forecasting tool, whereas
the original model only analyzed a sample of transactions that were previously already divested.
An opportunity for future research is to apply the model on a wider selection of companies, as
this paper only analyzed one company and one single industry. The analysis of the acquisition
of Burger King in particular, reveals several new areas for future research. On a general basis
it raises the question if private equity can be seen as a superior organizational form, in the sense
of a “corporate headquarters” as presumed many years ago by Jensen (1889). A suggestion for
future research is to revisit the past statement of Jensen (1989) in today’s business context.
Moreover, future research might address the applicability and function of individual
management tools that are leveraged at Burger King, as for instance zero-based-budgeting as a
budgeting tool and pay-for-performance remuneration schemes.
Next to the contribution to academia, the thesis also contributes valuable insights to managerial
practices. Given the substantial value creation in the Burger King deal across all kinds of direct
drivers, 3G Capital’s acquisition of Burger King is a useful case to analyze value creation in
private equity. It is thereby especially interesting how other private equity firms but also public
firms can learn from the given value improvements at Burger King. Even though, Lopez-de-
Silanes et al. (2015) state that actions and competences of private equity firms do not appear to
be easily repeatable or scalable, the detailed analysis of indirect drivers facilitates to understand
how value can be created. These findings might therefore allow also public firms to apply some
121 Interview: Tim Brueggemann (2015).

!
62
of the previously mentioned corporate governance and incentive concepts, and therefore also
accelerate value creation in other firms. Finally, private equity firms may apply the provided
extension of the Achleitner et al. (2010) model and therefore more accurately forecast and
assess value creation in their investments.
!
63
8 Bibliography
8.1$Academic$references$Acharya, V. V., Gottschalg, O. F., Hahn, M., & Kehoe, C. (2013). Corporate governance and
value creation: Evidence from private equity. Review of Financial Studies, 26(2), 368-
402.
Achleitner, A., Betzer, A., & Gider, J. (2010). Do Corporate Governance Motives Drive Hedge Fund and Private Equity Fund Activities? Ann-Kristin Achleitner, André Betzer and Jasmin Gider Corporate Governance Motives. European Financial Management, 16(5), 805-828.
Achleitner, A. K., Braun, R., Engel, N., Figge, C., & Tappeiner, F. (2010). Value creation drivers in private equity buyouts: Empirical evidence from Europe. The Journal of Private Equity, 13(2), 17-27.
Achleitner, A. K., Braun, R., & Engel, N. (2011). Value creation and pricing in buyouts: Empirical evidence from Europe and North America. Review of Financial Economics, 20(4), 146-161.
Achleitner, A. K., & Figge, C. (2014). Private equity lemons? Evidence on value creation in secondary buyouts. European Financial Management, 20(2), 406-433.
Adams, R. B., Hermalin, B. E., & Weisbach, M. S. (2010). The Role of Boards of Directors in Corporate Governance: A Conceptual Framework and Survey. Journal Of Economic Literature, 48(1), 58-107.
Aguilera, R. V., & Jackson, G. (2003). THE CROSS-NATIONAL DIVERSITY OF CORPORATE GOVERNANCE: DIMENSIONS AND DETERMINANTS. Academy Of Management Review, 28(3), 447-465
Arcot, S., Fluck, Z., Gaspar, J. M., & Hege, U. (2015). Fund managers under pressure: Rationale and determinants of secondary buyouts. Journal of Financial Economics, 115(1), 102-135.
AXELSON, U, JENKINSON, T, STRÖMBERG, P, & WEISBACH, M 2013, 'Borrow Cheap, Buy High? The Determinants of Leverage and Pricing in Buyouts', Journal Of Finance, 68, 6, pp. 2223-2267, Business Source Complete, EBSCOhost, viewed 23 October 2015.
Bargeron, L. L., Schlingemann, F. P., Stulz, R. M., & Zutter, C. J. (2008). Why do private acquirers pay so little compared to public acquirers?. Journal of Financial Economics, 89(3), 375-390.
Berg, A., & Gottschalg, O. F. (2005). Understanding value generation in buyouts. Journal of Restructuring Finance, 2(01), 9-37.
Bergström, C., Grubb, M., & Jonsson, S. (2007). The operating impact of buyouts in Sweden: A study of value creation. The journal of Private equity, 11(1), 22-39.
Capron, L., & Guillén, M. (2009). National corporate governance institutions and post-acquisition target reorganization. Strategic Management Journal, 30(8), 803-833.
Cornelli, F., & Karakaş, O. (2008, March). Private equity and corporate governance: Do

!
64
LBOs have more effective boards? In AFA 2009 San Francisco Meetings Paper.
Cressy, R., Munari, F., & Malipiero, A. (2007). Playing to their strengths? Evidence that specialization in the private equity industry confers competitive advantage. Journal of Corporate Finance, 13(4), 647-669.
Cumming, D., Siegel, D. S., & Wright, M. (2007). Private equity, leveraged buyouts and governance. Journal of Corporate Finance, 13(4), 439-460.
Damodaran, A. (2012). Investment valuation: Tools and techniques for determining the value of any asset (Vol. 666). John Wiley & Sons.
Desender, K. A., Aguilera, R. V., Crespi, R., & GarcÍa-cestona, M. (2013). When does ownership matter? Board characteristics and behavior. Strategic Management Journal, 34(7), 823-842. doi:10.1002/smj.2046
Easterwood, J. C., Seth, A., & Singer, R. F. (1989). The Impact of Leveraged Buyouts on Strategic Direction. California Management Review, 32(1), 30-43.
EDGERTON, J 2012, 'Agency Problems in Public Firms: Evidence from Corporate Jets in Leveraged Buyouts', Journal Of Finance, 67, 6, pp. 2187-2213, Business Source Complete, EBSCOhost, viewed 23 October 2015.
Guo, S., Hotchkiss, E. S., & Song, W. (2011). Do buyouts (still) create value?. The Journal of Finance, 66(2), 479-517.
Harris, R. S., Jenkinson, T., & Kaplan, S. N. (2014). Private equity performance: What do we know?. The Journal of Finance, 69(5), 1851-1882.
Holthausen, R. W., & Larcker, D. F. (1996). The financial performance of reverse leveraged buyouts. Journal of Financial Economics, 42(3), 293-332.
Jensen, M. C. (1986). Agency Costs of Free Cash Flow, Corporate Finance, and Takeovers. American Economic Review, 76(2), 323.
Jensen, M. C. (1997). Eclipse of the public corporation. Harvard Business Review (Sept.-Oct. 1989), revised.
Jensen, M. C., & Meckling, W. H. (1976). Theory of the firm: Managerial behavior, agency costs and ownership structure. Journal of financial economics, 3(4), 305-360.
JUREK, J. W., & STAFFORD, E. (2015). The Cost of Capital for Alternative Investments. Journal of Finance, 70(5), 2185-2226. doi:10.1111/jofi.12269
Kaplan, S. (1989). Management buyouts: Evidence on taxes as a source of value. Journal of Finance, 611-632.
Kaplan, S. (1989). The effects of management buyouts on operating performance and value. Journal of financial economics, 24(2), 217-254.
Kaplan, S. N., & Schoar, A. (2005). Private equity performance: Returns, persistence, and capital flows. The Journal of Finance, 60(4), 1791-1823.
Lehn, K., & Poulsen, A. (1989). Free Cash Flow and Stockholder Gains in Going Private Transactions. Journal of Finance, 771-787.
Lichtenberg, F. R., & Siegel, D. (1990). The effects of leveraged buyouts on productivity and related aspects of firm behavior. Journal of Financial Economics, 27(1), 165-194.
Loos, N., Hilb, M., Bernet, B., Gottschalg, O., & Zollo, M. (2007). Value creation in

!
65
leveraged buyouts: analysis of factors driving private equity investment performance. Springer Science & Business Media.
Lopez-de-Silanes, F., Phalippou, L., & Gottschalg, O. (2015). Giants at the Gate: Investment Returns and Diseconomies of Scale in Private Equity. Journal of Financial & Quantitative Analysis, 50(3), 377-411. doi:10.1017/S0022109015000113
Masulis, R. W., & Thomas, R. S. (2009). Does Private Equity Create Wealth? The Effects of Private Equity and Derivatives on Corporate Governance. University of Chicago Law Review, 76(1), 219-259.
Modigliani, F., & Miller, M. H. (1958). The cost of capital, corporation finance and the theory of investment. The American economic review, 261-297.
Muscarella, C. J., & Vetsuypens, M. R. (1990). Efficiency and organizational structure: a study of reverse LBOs. The Journal of Finance, 45(5), 1389-1413.
Myers, S. C. (2001). Capital structure. Journal of Economic perspectives, 81-102.
Nikoskelainen, E., & Wright, M. (2007). The impact of corporate governance mechanisms on value increase in leveraged buyouts. Journal of Corporate Finance, 13(4), 511-537.
Phalippou, L., & Gottschalg, O. (2009). The performance of private equity funds. Review of Financial Studies, 22(4), 1747-1776.
Pindur, D. (2009). Value creation in successful LBOs. Springer Science & Business Media.
Ravenscraft, D. J., & Scherer, F. M. (2011). Mergers, sell-offs, and economic efficiency. Brookings Institution Press.
Rediker, K. J., & Seth, A. (1995). Boards of directors and substitution effects of alternative governance mechanisms. Strategic Management Journal, 16(2), 85-99.
Samdani, G. S., Butler, P., & McNish, R. (2001). The alchemy of leveraged buyouts. Value Creation: Strategies for the Chemical Industry, 93-107.
Seth, A., & Easterwood, J. (1993). Strategic redirection in large management buyouts: The evidence from post-buyout restructuring activity. Strategic Management Journal, 14(4), 251-273.
Shimizu, K., Hitt, M. A., Vaidyanath, D., & Pisano, V. (2004). Theoretical foundations of cross-border mergers and acquisitions: A review of current research and recommendations for the future. Journal of International Management, 10(3), 307-353.
Smith, A. J. (1990). Corporate ownership structure and performance: The case of management buyouts. Journal of financial Economics, 27(1), 143-164.
Sorensen, M., Wang, N., & Yang, J. (2014). Valuing Private Equity. Review of Financial Studies, 27(7), 1977-2021.
Stein, J. C. (2005). Why are Most Funds Open-End? Competition and the Limits of Arbitrage. The Quarterly journal of economics, 120(1), 247-272.
Watts, R. L., & Zimmerman, J. L. (1990). Positive Accounting Theory: A Ten Year Perspective. Accounting Review, 65(1), 131-156.
Williamson, O. E. (1988). Corporate finance and corporate governance. The Journal of Finance, 43(3), 567-591.
!
66
8.2$Other$references$3G Capital. (2015). About the company, accessible at: http://www.3g-capital.com/bkw.html.
About money. (2010). History of Burger King, accessible at: http://franchises.about.com/od/mostpopularfranchises/a/history-of-burger-king.html.
Achleitner & Capital Dynamics. (2009). Wertsteigerungshebel in Private Equity-Transaktionen (Zürich, November 2009), available at: http://www.seca.ch/items/14665/1032/1597436185/Wertsteigerungshebel_in_PE_zurich.pdf.
Achleitner & Capital Dynamics. (2009). Value Creation in Private Equity, available at: https://www.altassets.net/pdfs/capitaldynamics_valuecreationinpe.pdf.
Altassets. (2010). TPG, Bain, Goldman exit Burger King as 3G pays $4bn, accessible at: http://franchises.about.com/od/mostpopularfranchises/a/history-of-burger-king.html.
Bloomberg. (2015). Company Overview of 3G Capital, Inc. accessible at: http://www.bloomberg.com/research/stocks/private/snapshot.asp?privcapId=23471434.
Bloomberg. (2015). Financial Statement Analysis of Burger King and peer group, accessible via Bloomberg terminal.
Burger King. (2010). Press Release - 3G Capital Completes Acquisition of Burger King Holdings, Inc.
Burger King. (2013). Burger King Worldwide Annual Report (2013).
Burger King. (2013). Burger King Worldwide Reports: Fourth Quarter and Full Year 2013 Results.
Business Insider. (2012). Bill Ackman’s Special Purpose Entity Finally Makes Its Move, accessible at: http://www.businessinsider.com/a-publicly-traded-company-started-by-hedge-fund-titan-bill-ackman-bought-a-huge-stake-in-burger-king-2012-4.
Carlyle Group. (2015). Company website: Our business – industry expertise, viewed at https://www.carlyle.com/our-business/industry-expertise.
Clayton, Dubilier & Rice. (2015). Company website: Firm profile, viewed at http://www.cdr-inc.com/about/firm_history.php.
Heinz Group. (2015). Press release, accessible at: http://news.heinz.com/press-release/finance/hj-heinz-company-and-kraft-foods-group-sign-definitive-merger-agreement-form-k.
Investopedia. (2015). Accessible at: http://www.investopedia.com/terms/p/privateequity.asp
Morgan Stanley. (2009). Operational improvement: The key to value creation in private equity
NY Times. (2012). Accessible at: http://www.nytimes.com/2012/06/23/opinion/nocera-burger-king-the-cash-cow.html?_r=0.
Pwc. (2012). How US private equity compensates management through the investment lifecycle, available at: https://www.pwc.com/us/en/hr-management/assets/pwc-how-us-private-equaty-compansates-management.pdf.
Reuters. (2010). Burger King agrees to $3.3 billion sale to 3G Capital, accessible at:

!
67
http://www.reuters.com/article/2010/09/02/us-burgerking-idUSTRE6801CB20100902.
Reuters (2015). Avaliable at: http://www.reuters.com/article/2015/07/02/us-kraft-heinz-idUSKCN0PC2K520150702.
The Street. (2014). http://www.thestreet.com/story/12856055/1/how-burger-kings-brilliant-brazilian-billionaire-turned-12b-into-22b.html.
The Wall Street Journal. (2012). Burger King Returns to Public Market on NYSE, accessible at: http://www.wsj.com/articles/SB10001424052702304898704577478421173743002.
Thomson Reuters (2014): Mergers & Acquisitions Review – Full Year 2014.
Thomson Reuters (2015). Mergers & Acquisitions Review – First Half 2015.

!
68
9 Appendices Appendix 1: Structure of the paper, Source: Own illustration
Literature(review(and(theoretical(developmentUnderstanding+Private+Equity,+The+Burger+King+Buyout,+Value+
Creation+in+Private+Equity
Analysis(of(direct(driversValuation+and+calculation+of+IRR,+Quantitative+analysis+and+composition+of+IRR,+Qualitative+analysis+of+direct+drivers
The(leverage(effect((financial+engineering)
Tax+savings+due+to+debt+
The(multiple(effectChanges+between+entry+and+exit+
multiple
The(effect(of(operational(improvement
EBITDA+and+cash+flow+effect
Analysis(of((indirect(driversPossible+explanation+for+different+circumstances+for+value+creation+
in+Burger+King+buyout
Corporate(governance(Capital,+Labor+&+Management
Incentivesxx
Discussion(and(conclusion
IntroductionContextualization+and+relevance,+Justification+of+the+theme,+
Structuring
Proposition(and(expected(results Methodology
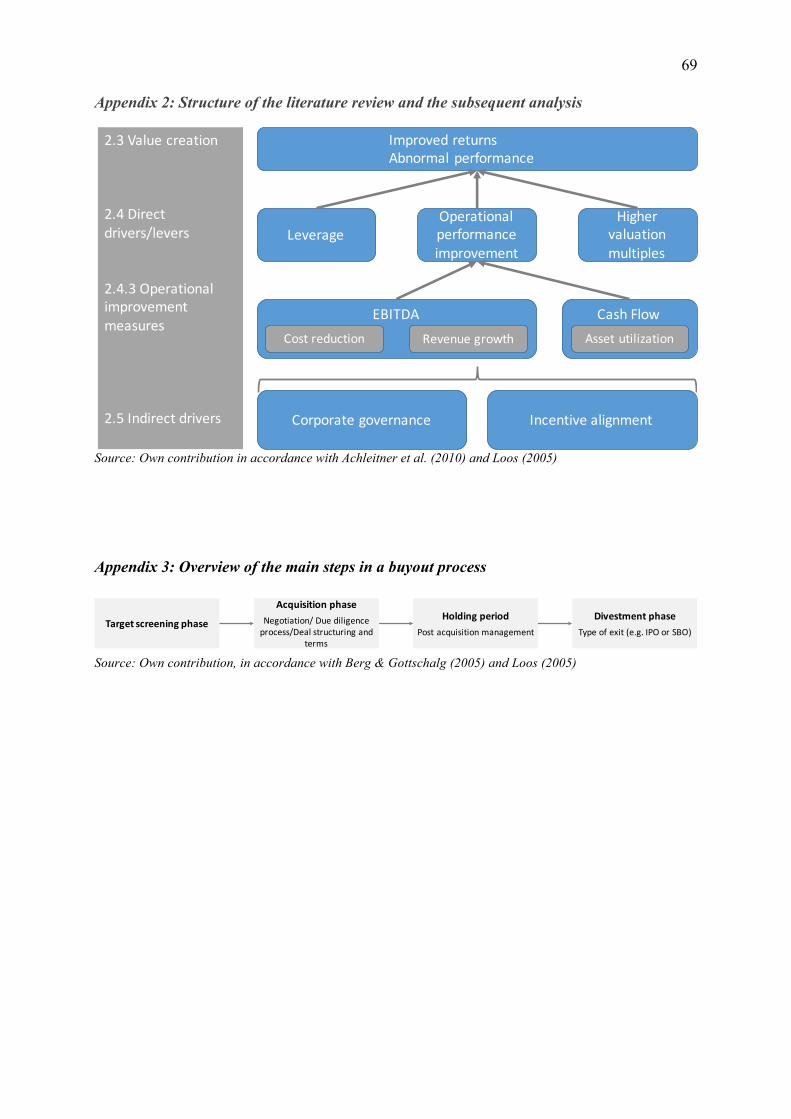
!
69
Appendix 2: Structure of the literature review and the subsequent analysis
Source: Own contribution in accordance with Achleitner et al. (2010) and Loos (2005) Appendix 3: Overview of the main steps in a buyout process
Source: Own contribution, in accordance with Berg & Gottschalg (2005) and Loos (2005)
2.3$Value$creation
2.4$Direct$drivers/levers
2.4.3$Operational$improvement$measures$
2.5$Indirect$drivers
Improved$returnsAbnormal$performance
LeverageOperational$performance$improvement
Higher$valuation$multiples
EBITDA Cash$FlowCost$reduction Revenue$growth Asset$utilization
Corporate$governance Incentive$alignment
Target'screening'phase
Acquisition'phaseNegotiation/*Due*diligence*process/Deal*structuring*and*
terms
Holding'periodPost*acquisition*management
Divestment'phaseType*of*exit*(e.g.*IPO*or*SBO)

!
70
Appendix 4: Value generation in LBOs after Berg & Gottschalg (2005)
Source: Own contribution according to Berg & Gottschalg (2005)
Direct'drivers'(Primary' levers)'
• Market'valuation• Private'information• Superior'market'
information• Dealmaking
capabilities''• Optimized'corporate'
scope
Financial'arbitrage'(Multiple'effect)
• Optimizing'the'capital'structure
• Reducing'corporate'tax
Financial'engineering'(Leverage'effect)
• Cost'cutting'and'margin'improvements
• Reducing'capital'requirements
• Removing'managerial'efficiencies
• Corporate'refocusing
• Buy'and'build'strategy
Increased'operational'effectiveness
Strategic'distinctiveness
Indirect'drivers'(Secondary' levers)'
Reducing'of'agency'cost Parenting'effect
• Reducing'agency'cost'of'FCF• Improving'incentive'alignment• Improving'monitoring'and'controlling
• Restoring'entrepreneurial'spirit• Advising'and'enabling
Value'generation
Legend: ='value'capturing; ='value'creation'
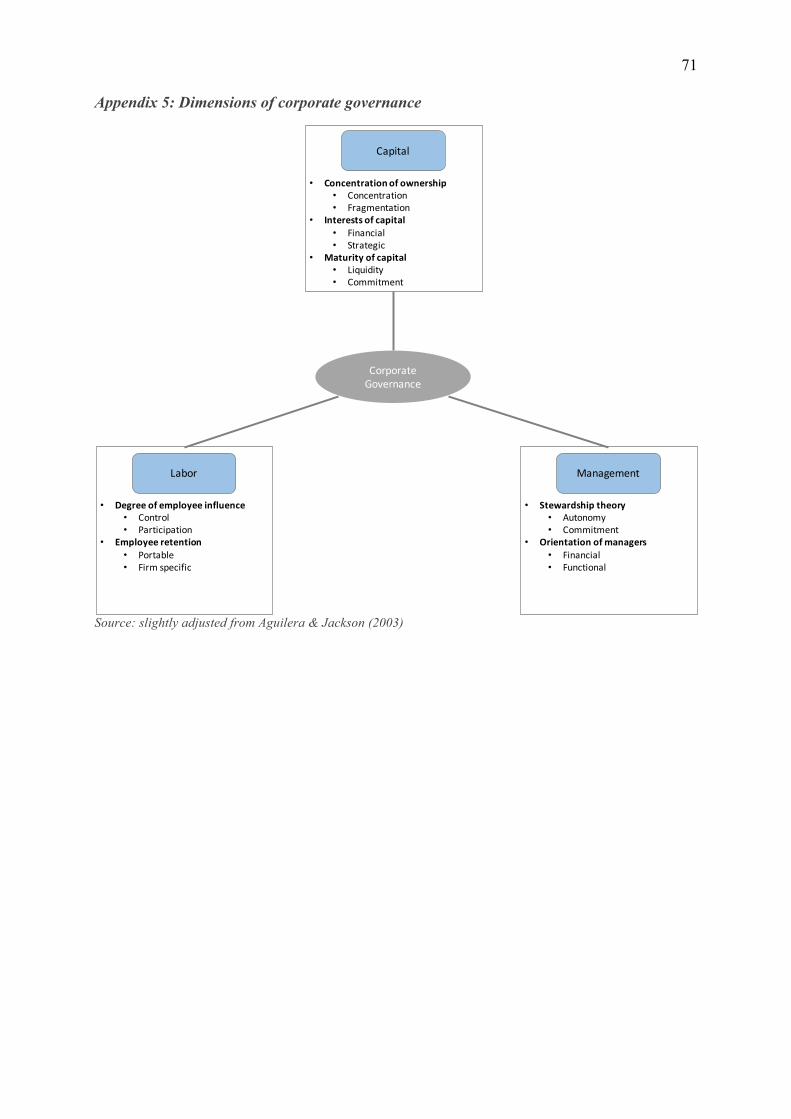
!
71
Appendix 5: Dimensions of corporate governance
Source: slightly adjusted from Aguilera & Jackson (2003)
Corporate(Governance
• Concentration*of*ownership• Concentration• Fragmentation
• Interests*of*capital• Financial• Strategic
• Maturity*of*capital• Liquidity• Commitment
Capital
• Degree*of*employee*influence• Control• Participation
• Employee*retention• Portable• Firm(specific
Labor
• Stewardship*theory• Autonomy• Commitment
• Orientation*of*managers*• Financial(• Functional
Management

!
72
Appendix 6: Representation of the main results of the study of Achleitner et al. (2010)
Appendix 7: Highlight of the drivers that are covered by the Achleitner model
Appendix 8: Peer group selection, multiples and Beta calculation
Value&creation
LeverageOperational&performance&improvement
Higher&valuation&multiples
EBITDA Cash&FlowCost&reduction Revenue&growth Asset&utilization
Beta%calculation%through%peer%group%and%multiplesEV/EBITDA Raw%beta Adj%Beta COMMENTS
YUM!%BRANDS%INC 12,17 0,78 0,85
WENDY'S%CO/THE 9,95 0,74 0,83
JACK%IN%THE%BOX%INC 11,80 0,53 0,69
POPEYES%LOUISIANA%KITCHEN%IN 16,41 0,53 0,69
MCDONALD'S%CORP 13,53 0,51 0,68
SONIC%CORP 10,59 0,82 0,88
PAPA%JOHN'S%INTL%INC 14,15 0,55 0,70
DOMINO'S%PIZZA%INC 16,68 0,63 0,75
Average 13,16 0,64 0,76Source:(Bloomberg(2015
Adjusted%Beta%=%(2/3*Raw%Beta%+%(1/3)%*1)

!
73
Appendix 9: Sales forecast as the basis for the DCF valuation
Appendix 10: Cost of equity and WACC calculation
Since the peer group Beta is based on a value from November 2015, market risk premium and risk-free rate are also 2015 values
Sales&forecast
Sales&(in&$&million)2009A 2010A 2011A 2012A 2013A 2014F 2015F 2016F 2017F 2018F
Total&revenue 2.537 2.502 2.340 1.971 1.146 1.200,1 1.240,4 1.282,4 1.325,9 1.371,2YoY#growth C1,4% C6,5% C15,8% C41,8% 4,69% 3,36% 3,38% 3,40% 3,41%
Franchise&and&property&revenues 657 663 701 802 923,6 976,3 1.015,5 1.056,3 1.098,7 1.142,9YoY#growth 1% 6% 14% 15% 5,70% 4,02% 4,02% 4,02% 4,02%
Company&restaurant&revenues 1.881 1.839 1.639 1.169 222,7 223,8 224,9 226,1 227,2 228,3YoY .2% .11% .29% .81% 0,50% 0,50% 0,50% 0,50% 0,50%
Source:#Annual#report#2013,#Bloomberg#2015
Number&of&restaurants&forecast2009A 2010A 2011A 2012A 2013A 2014F 2015F 2016F 2017F 2018F
Number&of&restaurants 12.078 12.251 12.512 12.997 13.667 14.372,0 14.873,2 15.391,9 15.928,8 16.484,5YoY#growth 1,4% 2,1% 3,9% 5,2% 5,2% 3,5% 3,5% 3,5% 3,5%
Franchise&&owned 10.656 10.907 11.217 12.579 13.615,0 14.320,0 14.821,2 15.339,9 15.876,8 16.432,5YoY#growth 2% 3% 12% 8% 5,2% 3,5% 3,5% 3,5% 3,5%
Company&rowned 1.422 1.344 1.295 418 52,0 52,0 52,0 52,0 52,0 52,0YoY#growth .5% .4% .68% .88% 0,0% 0,0% 0,0% 0,0% 0,0%
Source:#Statista#2015
Volume5forecastVolume&forecast
2009A 2010A 2011A 2012A 2013A 2014F 2015F 2016F 2017F 2018FTotal
YoY#growth 0,5% 0,5% 0,5% 0,5% 0,5%Franchise&&ownedYoY#growth 0,5% 0,5% 0,5% 0,5% 0,5%
Company&rownedYoY#growth 0,5% 0,5% 0,5% 0,5% 0,5%
CC>&Past&sales&growth¬&representative,&as&business&model&changed&significantly&after&the&3G&Capital&take&over
Cost%of%equity%and%WACC%calculation
Values Notesrf 2,331% US1Treasury5105years5November52015Beta 0,76 Peer5group5BetaMRP% 6,12% Damodaran5valueRe 6,97% value5used
Value Comment
D/V 0,273920135is5used,5V5is5different5as5is5we5are5here5adding5E+D,5ignoring5excess5cash
E/V 0,726120135is5used,5V5is5different5as5is5we5are5here5adding5E+D,5ignoring5excess5cash
Rd 6,00% Terms5on5the5B1/Caa15transaction5were5finalized5at56%5(1)Rd_levered 4,50%
Re 6,97% see5Damoraran5approachWACC 6,29% WACC5Includes5interest5tax5shield
(1)$Source:$http://www.highyieldbond.com/burger:king:2:25b:7:5:year:high:yield:bonds:b:caa1:price:to:yield:6/

!
74
Appendix 11: Enterprise Value of Burger King between 2009 and 2013
The enterprise value us calculated by using market capitalization, debt and excess cash Appendix 12: Subdrivers of the operational improvement effect
Calculation of the split between sales, margin and combination effect
Appendix 13: Proposition of alternative methods to assess the cash flow effect
Enterprise)Value)of)Burger)King)Holdings)Inc.)&)Burger)King)Worldwide)Inc.In)$US)million FY)2009 FY)10)(Half) FY)2010 FY)2011 FY)2012 FY)2013
30/06/09 30/06/10 2010J12J31 2011J12J31 2012J12J31 2013J12J31Market)Capitalization 2.327,9 2.287,1 n/a n/a 5.757,9 8.050,4!!"!Cash!&!Equivalents 121,7 187,6 207,0 459,0 546,7 786,9
!!+!Preferred!Equity 0,0 0,0 0,0 0,0 0,0 0,0
!!+!Minority!Interest 0,0 0,0 0,0 0,0 0,0 0,0
!!+!Total!Debt 888,9 826,3 2.792,1 3.139,2 3.049,3 3.037,0
Enterprise)Value 3.095,1 2.925,8 n/a n/a 8.260,5 10.300,5Source:(Bloomberg(2015
Entry Exit Difference Effect
Sales 2.502 1146,3 *1.356 *2.055,36Margin2 18% 51% 34% 7.157,01Combination *3.878,26
EBITDA 444,60 588,00 143 1.223,38
DCF$%$valuationCash%Flow%statement
2010A 2011A 2012A 2013A 2014F 2015F 2016F 2017F 2018F TVEBIT 333 362,5 417,7 522,2 606 672 713 755 799
! Tax%on%EBIT%(T%x%EBIT) 83 91 104 131 151 168 178 189 200= NOPLAT 250 272 313 392 454 504 535 567 600+ Depreciation 49 136 114 66 69 72 74 77 79! d%Investment%in%Working%Capital !58 127 !151 !93 7 5 5 5 5! Capital%Expenditures 150 82 70 26 56 58 60 62 65
Cash$flow$to$the$firm$(1)$ %73 195 133 6 9 9 9 10 211PV$FCFF 6 8 7 7 7PV$Terminal$value 155Enterprise$Value 198(1):%only%accounting%for%depreciation,%NWC%and%CAPEX
Method%1%(Past%perspective) 256Method%2%(Future%perspective) 198
Sum%of%realized%cash%flows%during%holding%periodCalculating%the%EV%(1)

!
75
Appendix 14: Times money multiple of Burger King and McDonald’s
Burger King value creation drivers (Money multiple)
Source: own calculation McDonald’s value creation drivers (Money multiple)
Source: own calculation Appendix 15: Extension to the multiple effect applied to Burger King and McDonalds’s,
Source: Own contribution
7,12 1,78
5,34 1,99
1,02
0,640,7
1,000,001,002,003,004,005,006,007,008,00
Value1levered1firm
Leverage Value1unlevered1 firm
Multiple EBITDA Combination FCF Equity1value1at1entry
Money1m
ultip
le
1,19 0,01 1,18 0,01 0,2
0,0017 (0,03 1,00
0,00
0,20
0,40
0,60
0,80
1,00
1,20
1,40
Value1levered1firm
Leverage Value1unlevered1 firm
Multiple EBITDA Combination FCF Equity1value1at1entry
Money1m
ultip
le
Burger&KingEBITDA'at'entry 444,60 EBITDA'at'exit'2013 588,00EV'AT'entry 3.793 EV'at'exit 8.169,68EV/EBITDA 8,53 EV/EBITDA 13,89
McDonald'sEV/EBITDA 10,34
OverallEV&increase&total 2384,28 EV&increase&total 804,61
Other Market&changes%&of&Multiple&effect 66,25% 33,75%

!
76
Appendix 16: Times money multiple of Burger King vs. Achleitner et al. (2010) Burger King value creation drivers (Times money multiple)
Source: own calculation The rationale behind the times money multiple is the following. Overall cash flows at the divestment stage are accounting for around $8.542 million which also includes the initial investment of $1.200 million. The times money multiple reflects the added value that is achieved, therefore calculating the difference of $8.542 million and $1.200 million yields in $7.342 million. This can be calculated with the times money multiple (6,12 * 1200). Achleitner et al (2010): Value creation drivers across the entire sample
Source: Achleitner et al. (2010)
6,12 1,78
4,34 1,99
1,02
0,640,70
0,00
1,00
2,00
3,00
4,00
5,00
6,00
7,00
Value1levered1firm
Leverage Value1unlevered1firm
Multiple EBITDA Combination FCF
Times1money1m
ultip
le
2,47 0,78
1,69 0,45
0,76
0,11 0,37
0,00
0,50
1,00
1,50
2,00
2,50
3,00
Value1levered1firm
Leverage Value1unlevered1firm
Multiple EBITDA Combination FCF
Times1money1m
ultip
le

!
77
Appendix 17: Interview with Tim Bruggemann, conducted via skype on November 29th 2015
Qualitative interpretation of direct drivers 1)$ As previously explained, this thesis assesses different drivers of value creation. Which of
the following drivers is likely to have a role in the Burger King buyout?
•$ I am not an expert with the effect of leverage and multiple effect •$ Operational improvement is very likely to have the strongest impact. One major
contribution towards the improvement at the operational level is ZBB (Zero based budgeting). Therefore, Burger King saves millions of dollars annually und can thereby annually achieve an EBITDA growth of around 12% to 15% next to the top line revenue growth
2)$ How can you increase value through EBITDA improvements? What are the relevant
factors? •$ First of all, the culture and human capital factor at Burger King. People are from the
same sort and are generally very motivated, it is a fast pace environment •$ You are not stopped by internal walls or hit your head on walls like in other big
corporations, through hierarchic structures •$ The working is not even as in consulting but more likely comparable to a Start-Up, we
have very flat hierarchies, even as an analyst when you have an idea you can get directly go to the board and bring up your idea directly without any barriers
•$ Communication and the structure is very open, and this is also meant like this, there are no barriers like you have to ask for an appointment, you just walk to the C-suite (CFO, CEO, etc), they also have a open desk, and you can directly talk to them in the open space or in an extra room
•$ Yet, the people that are working there are similar to people who work in management consultancies with many “all-rounders”
•$ My fear of leaving consulting and moving towards corporate was accompanied by the fear of hitting against walls, but this is not at all the case at Burger King, everything is directed towards efficiency
•$ The people are very young and flexible, also older employees who were there before the take over are keeping up and motivated for change
3)$ You said that the EBITDA margin was growing by 10-12% annually on average. My
question now is if the cost saving potential is already “harvested” until 2013 or are there still further improvements possible? •$ No I wouldn’t say that the saving potential is already over. There is still further
potential, not only with the synergy potential that emerges with the merger with Tim Hortons, but also on a stand-alone basis. Not only through cost savings but also through growth on the top line.
•$ The difference here to other PE firms, is the careful consideration to do both, to grow on the top line, but also to exploit on the cost side, but by no means on a short sided way
•$ In terms of cost cutting, Burger King and 3G thereby put a lot of effort on long-term sustainability. We can not only save cost or skip investment since they do not just want to cut cost and keep revenue constant. Instead the plan is to do both simultaneously in
!
78
a sustainable way, and therefore you can achieve the EBITDA growth that we can currently see in the financials of Burger King
Explanation for value creation and indirect drivers 4)$ Is there a 3G method that might also be comparable to other deals? In the Kraft & Heinz
deal there seems to be a similar approach? •$ Yes, there is a similar pattern, in the first years they saved costs through ZBB both with
Burger King as well as with Heinz, and in the following years they try to further increase revenue in a sustainable long-term form
•$ The long term investment horizon allows a culture that is promoting to act in the best interest for the company instead of aiming at short-term earnings
•$ Everything that helps in short-term and harms in long-term will be avoided 5)$ How does Zero based budgeting work at Burger King?
•$ Zero based budgeting at Burger King is less a budgeting tool but more a philosophy •$ If you look at zero based budgeting it is not the budgeting process that is behind it. You
rather have to look at the philosophy behind it and everything that comes along with it •$ What comes along with it is for example the compliance to the budgets, the economy in
employee’s mindset •$ Each year each department or cost center has to define from 0 what kind of expenses it
will have, thereby everyone has to plan in detail what he will spend, for example for travelling. On this basis the budgets are defined, relatively independent from the former year
•$ Then it is important that everyone is responsible for sticking to its own budget •$ IF you do not stick to it, it will reduce your bonus •$ There is also a global budget, which is the sum of all the individual budgets and the
global goal is to reduce the global budget year by year, for instance it was $100 million in the former year, then in the next year it is cut by $10 million, so everyone needs to deal with 10% less. Thereby everyone has to see how to cut its budget
•$ It is not only how you build this budget and on what it is composed of, at Burger King it is rather a culture and way of thinking to treat money as if it were your own money
•$ So if you are for example travelling, you might take a hotel that is a bit cheaper, or just do a trip if you actually think it adds value. Thereby it prevents situations where an employee wants to reach his frequent traveler status at the end of the year and is therefore doing more trips
•$ With ZBB this does not happen, since it is a culture, the other employees also see when you “waste money”, and this might have a negative tone
6)$ How are incentives used, do they play a role in compensating employees at Burger King?
•$ It depends on the level for instance as analyst (15%), manager (30%), director (40%) vice president (70%). So you get your basis salary and then up to 15 , 30 or 70 as variable pay
•$ This can get up to 100% to 200% for the management level, •$ I would say that the variable pay/bonus has a huge motivational effect on everyone, also
on the lower levels, when you get 30% as a manager on top of your salary this is still huge
•$ You can thereby incentivize and motivate the people
!
79
•$ In this sense our MBOs (Management by Objective) come in play •$ Thereby we have firm wide objectives, which then are broke down to the different
management levels and functions. •$ You have goals in your area that you can directly influence, which are then rolled up to
the global goals. •$ For your bonus structure you thereby have your 10 own KPIs, that are important for
the area where you work, this can for instance be projects or other simple measures •$ So everyone is working towards this individual goals, and have responsibility •$ In general, I would say that everyone has a critical function in the overall system, there
is no function that is redundant •$ With the variable pay you make sure that everyone is aiming at reaching their own goals
and thereby contributing to the overall goals, the overall goal is in general a firm wide EBITDA,
•$ To reach this EBITDA there are many different elevating screws •$ Depending on the function, a finance guy might have goals that are more directed
towards cost reduction, whereas a sales person is more responsible for increasing the top line
•$ All these different parts have to come together to reach the overall goal, everyone and everything is thereby important
7)$ Academic research has shown that private equity has an impact on the principal agent
theory, whereas governance and incentives come into play. How are both concepts applied at Burger King? •$ We have to be careful here, the governance does not mean that you are all the time
controlled •$ You are responsible for what you do and people assume that you know what you are
doing and that you work responsibly. At the end of the year the results count, if you do not reach your goal at the end of the year, we have to understand what went wrong
•$ But here also comes recruiting into play, since it is important for us to hire the right people, and talent management is a high priority you cannot forget the governance but you don’t need a governance function since everyone is looking for himself and his environment and therefore make sure to do the right thing
•$ But this is also possible here since we are very lean and slim structured, so that we do not have 100 thousands of people.
•$ In Miami we are not even 300 people, inclusive the support functions, this is not a “corporate beast “, where you need a whole institution to control the people
•$ Since everyone has his clear tasks and own responsibility you are rather controlled by the person you are reporting to
8)$ Did many people directly come from 3G or were rather external people hired after the
acquisition in 2010?
•$ Some people are actually directly coming from 3G, as for example our CEO Daniel Schwartz
•$ But the most of the people come from the 3G Capital network, which means that they are not directly 3G Capital employees but rather people from their network
•$ Since many young people came and a lot of “fresh blood” came into the company there is an incredible dynamic, however there was also a lot of specific know-how that is lost

!
80
•$ We have a very steep learning curve, which means that after 2 years you can by far not reach the full potential that is achievable on the operational improvement side
•$ In year 1 you start cutting costs, but in the coming years when the new staff build their own know-how, then everything is getting even better and more efficient
•$ The continuous improvement is also achieved by the goal setting structure, where Management by Objectives is used. This means that your goals are higher each year. Even if the goals seem initially not reachable, you have to find a creative way to reach them
•$ Basically the goals are way to high and in the beginning of the year it really seems impossible
•$ So you have to think deeply how to achieve those goals. Therefore, we guarantee continuous improvement while always challenging the “Status-quo”. The aforementioned MBO also guarantee that each employee is challenging himself continuously, and the current status
•$ On this note we try to avoid routine and always develop. Everything what we do is aiming towards creating value
•$ Due to the flat hierarchies and many personal changes we create permanent change •$ If you arrive at the point where you perfectly know your role you will be promoted to a
new role. Often you are even promoted before, if you are ready. The idea here is that you are promoted when you have the potential to do the new role, not when you are are ready to do the role. This means that you are always growing into your role. When you have a new role, you have to grow there again, (this not necessarily always comes with a promotion, roles are also changed without)
•$ This means in the new role that you do new mistakes and have to learn. But this is done on purpose to make sure that no routines are build. What stays are best practices of a role that are then distributed to the new person that is taking the role. Therefore we avoid the formation of bad habits
•$ Part of the culture is that you have many generalists, of course also some specialists, whom we urgently need in some functions, but the most part are generalists
•$ Due to the different backgrounds of the people, often completely different industries new opportunities emerge, as for instance in a situation where people find: “Look we did this before in another project, lets see if this is also applicable here”.
•$ This in a sense is related to the Start-Up culture that we have •$ I am at Burger King since approximately 2,5 years and already in my third role, which
always came along with a promotion (yet this might not be the case for everyone) 9)$ What is the recruiting scheme of 3G Capital, is this specific?
•$ Our idea is that we generally do not hire people with knowledge, but rather people with potential
•$ This way we hire people that we can form and that are dynamic and aiming for change, instead of always just following old processes and habits
10)$What is the background of the people? Are many like you coming from consulting
companies?
•$ No, most of the people are not direct hires like me. The biggest part of people is coming to us through our undergraduate or MBA programs

!
81
•$ It is a pyramid, you have many fast promotions, but up there the air is getting thinner, that is why we need to fill the pyramid at the analyst level
11)$Regarding corporate governance, what do you think is the impact of the board at Burger
King? Does the fact that most of the board members are from 3G Capital or affiliates play a role? •$ Of course it helps that 3G Capital is the main investor, therefore we have a lot of
freedom •$ Also given that the other investors are mainly affiliates of 3G or at least people that
believe in the 3G culture and philosophy •$ This is why you have a lot of freedom and not the corporate governance claw that means
you always have to justify things •$ A lot of freedom is given to employees, and it is okey if it doesn’t work immediately. •$ However, this does not mean we have a free pass. If the results are not there, this can
be an absolutely tough environment. If results are not there, pressure on managers and employees is very high
•$ This pressure can for example come from the board, especially, Alex Behring, an extreme clever guy, who is also managing partner at 3G. He is the one that is setting the tone. Moreover, he is extremely demanding and when there is need for change he sets the tone. For example when we had a good year, he is coming to say “ good guys, this year was a great year, but lets not rest on these results and further go on, next year your targets are 50% higher.
•$ Alex Behring is the one that is bringing the pressure from top to down through the organization
•$ Since the board is very 3G heavy, you have more the pressure to live this 3G culture. But it is not the case that the board is questioned or something like this. Everyone that is behind the board is “board in” – they believe in this culture and philosophy
•$ Alex Behring has for example the “C suite” below him and that report to him. But you can say that he is always informed and knows what is going on
•$ He is also involved in other 3G Capital owned firms, but he is spending a lot of time, with the individual companies and also the respective markets.
•$ He is the one that is setting the tone in the board, and that directly influences our “C suite. He has a big interest to see that the company is running well, and for example Daniel Schwartz is one of his direct protégés. Behring also took Daniel to Burger King, first as a CFO and later made him CEO after the former CEO Bernardo went to Heinz.
•$ But$ this$ is$ part$ of$ the$ game,$ that$ talents$ that$ proved$ themselves$ to$ be$ are$ in$ an$emergency$promoted122$to$ leading$positions,$but$this$way$ it$ is$ensured$that$things$work$as$it$is$intended$by$3G$Capital$
122 This comes from the German translation and is inspired by the former comment that people with potential are promoted before they are ready, which is why they are frequently overwhelmed