assessment of thermal comfort and passive design
TRANSCRIPT

This work is licensed under a Creative Commons Attribution-NonCommercial 3.0 Unported License
Newcastle University ePrints - eprint.ncl.ac.uk
Ledisma G, Hamza N.
Assessment of thermal comfort and passive design strategies in Millennium
Schools in Ecuador.
In: 33rd International Conference Passive Low Energy Architecture PLEA 2017.
2017, Edinburgh, UK: Network for comfort and Energy Use in Buildings
(NCEUB).
Copyright:
This is the author’s manuscript of a paper that was presented at the 33rd International Conference on
Passive Low Energy Architecture PLEA 2017, 3-5 July 2017, Edinburgh, UK
URL to conference website:
https://plea2017.net/
Date deposited:
12/10/2017

Assessment of thermal comfort an passive design strategies in Millennium Schools in Ecuador
Abstract: The Ecuadorian government embarked on the Millennium Schools programme (UEM) to benefit the poorest areas of the country, providing them free access to education. The program is underpinned by intentions to promote healthier educational environments. Disregarding the three variations of climatic regions in the country, prototype designs are adopted for the ease of using off-site prefabricated elements, optimizing construction time, and lowering construction costs. This study uses subjective surveys to determine the desired conditions in classrooms before implementing passive strategies; and, aims to increase thermal comfort hours while decreasing energy consumption. The surveys interestingly show that perceptions of thermal comfort differ from published standards and can be influenced by other perceptions regarding the space quality. Two UEMs located in Babahoyo and Quito, Coast and Andean region respectively, were selected for conducting the surveys and monitoring indoor conditions to validate a simulation model. Building dynamic simulation modelling is used to test the thermal performance and the efficiency of architectural passive strategies. The prototype buildings are capable of maintaining thermal comfort conditions on an average 70% in Quito, and 64% in Babahoyo of occupancy hours respectively. Using optimum architectural parameters, thermal comfort can increase to 95% in Quito and 80% in Babahoyo. Keywords: Thermal comfort, Passive strategies, Educational Buildings, Climate responsive, Adaptive comfort
Introduction:
The Ecuadorian government, over the last eight years, has embarked on the construction and refurbishment of school buildings to promote healthier educational environments. Prototype designs are adopted for the ease of using off-site prefabricated elements, optimizing construction times, limiting material waste and lowering construction costs and human workforce (Ministerio de Educación, 2014). Millennium Schools programme (UEM) is based on the construction of prototype school buildings to provide free access to education throughout the country.
The UEM program started in 2008 with the conceptual idea to reallocate students of small schools into an infrastructure that houses all the levels of education and has all the necessary facilities. The UEM design was replicated all over the country without further considerations to the local climate or people adaptations and expectations.
Ecuador has three natural regions with different climatic conditions. The Coast and Amazon regions have an average temperature of 25°C and humidity of 90%. The Andean
THIS IS A BLIND SUBMISSION DO NOT OCCUPY THIS SPACE To be used later for Authors’ Names and Affiliations

region average temperature is 16°C and humidity of 75% (Cedeño & Donoso, 2010). UEM’s design for the temperate climate does not include any active system to regulate indoor conditions; in warm climates, the design incorporates ceiling fans. Thermal comfort has been defined as “the state of mind that expresses satisfaction with the surrounding environment” (ASHRAE, 2013).This definition highlights the social and psychological dimensions involved as well as the physical parameters. Thermal comfort in classrooms needs to be assessed carefully due to the high occupant density, the impact of discomfort on learning performance and the limited opportunity for children to adapt to the indoor conditions. Humphreys (Humphreys, 1977) concluded children are less sensitive to temperature changes than adults.
Thermal comfort studies in classrooms have been conducted under two methodologies: objective surveys (PMV/PPD) and subjective surveys, based on thermal sensation votes (TSV) and thermal preference votes (TPV). Using subjective surveys the neutral temperature in classrooms has been found to be 4°C lower than the prediction using the PMV/PPD model and 2°C lower than the adaptive model equations. (Zomorodian, et al., 2016)
Since 900 UEM schools are still in planning stage it is necessary to evaluate student’s expectations of the indoor environment. Furthermore, as current standards neglect the use of passive architectural strategies, there is a need to evaluate the thermal performance of the buildings and the possibility of improvement based on architectural parameters. Not many studies have been made on the influence of passive strategies over indoor comfort conditions based on thermal requirements of students (Zomorodian, et al., 2016) (Zahiri, et al., 2016). These studies use subjective surveys to determine the desired conditions before implementing passive strategies; and, aim to increase thermal comfort hours rather than to diminish energy consumption.
The objectives of this study are as follow:
To investigate student’s perception of thermal comfort in classrooms, their acceptability
and preferences using subjective surveys
To determine the boundaries for comfortable thermal sensations, the neutral and
preferred temperatures.
To test the efficiency of architectural passive strategies for improving indoor thermal
comfort in classrooms.
Methodology:
Two UEMs located in Babahoyo and Quito, Coast and Andean region respectively, were selected for conducting the surveys and monitoring indoor conditions to validate a simulation model. Building dynamic simulation modelling is used to test the thermal performance and the efficiency of architectural passive strategies. The UEM in Quito houses 2280 students, while the one in Babahoyo houses 2086. Figure 1 displays the site plan for both schools.
The design is based on a modular grid classroom that can be replicated and extended to house the different facilities required. The modular classroom serves 35 students with an area of 1.63 m2 per student (Ministerio de Educación, 2014). The 12-classroom block houses classrooms distributed on two-stories around a central covered courtyard. The modular windows allow natural cross ventilation with a window to wall ratio (WWR) of 34% in external

façade and 15% in the internal. The building has an S/V of 0.27 and an infiltration rate of 5.7 air exchanges per hour (CITEC UBB, 2011).
Figure 2 shows the classroom configuration with the position of the monitoring equipment and the school floorplan showing the surveyed classrooms.
Field measurements:
The sample size for Quito was of 83 people, conducted in three classrooms on the 21st of June. A larger sample size was collected for Babahoyo involving 210 subjects. The surveys were done on the 22nd of June and 6th of July in four and three classrooms respectively.
The subjective questionnaire consisted of 10 questions divided into three parts. The first section collected demographic information and the second section referred to thermal perception and preferences. For thermal sensation, two 7-point scales were used (ASHRAE and Bedford), the 3-point McIntyre scale served to determine the thermal preference. Acceptability was assessed through direct votes and the overall satisfaction with the environment was measured on a 7-point scale. The third section related to students concentration and sleepiness.
Data Analysis:
The classrooms’ indoor conditions were evaluated against two methods: (1) the PMV/PPD method in ASHRAE 55 and (2) the Adaptive method in EN-15251. The PMV/PPD determines
Figure 1. Siteplans of both UEMs with environmental parameters
Figure 2. Classroom design and school floorplan

the mean value for the thermal sensation votes (MTSV) of a group of people, which can range between -3 (cold) and +3 (hot) on the 7-point thermal scales. The adaptive method relies on the mean outdoor temperature to establish thermal comfort charts. The indoor conditions were contrasted against student’s responses in order to stablish the actual thermal comfort ranges, neutral and preferred temperatures.
The prototype model for the UEM was created in IES Virtual Environment Software and were validated according to ASHRAE Guide 14 using two indexes of error the MBE and cv(RMSE). The model calibration for Quito gave an MBE value of +3% and a cvRMSE of 7.2% while for Babahoyo the MBE is +2%, and the cv(RMSE) is 4.5%.
Thermal comfort in classrooms in UEMs:
PMV/PPD in ASHRAE 55:
This method predicts the thermal sensation of a group of people based on six input values: air temperature, mean radiant temperature, relative humidity, air velocity, clothing level and metabolic rate. Air temperature and relative humidity were measured in each classroom, the clothing levels were determined using tables in ASHRAE 55, and the metabolic rate was taken from the research conducted by Teli, et al (2014).
Table 1 displays the results for Quito and Babahoyo. The PMV in the city of Quito is -0.58 (slightly cool) and the PPD is 13.6% which is slightly outside the comfort limits (10% dissatisfaction). In Babahoyo the PMV and PPD are +2.04 (warm) and 72.7%
Table 1. PMV/PPD Analysis
UEM Quito UEM Babahoyo Class °C Hum MTSV PMV PPD Class °C Hum MTSV PMV PPD
A.1 17.3 68.0 -1.0 -0.8 18.0 C.5 28.4 77 -0.2 1.5 49.0 A.2 17.7 61.0 -0.7 -0.7 17.0 C.6 28.8 74 0.0 1.4 47.0 A.3 20.3 51.0 -0.4 -0.2 6.0 C.7 29.8 74 0.7 1.8 68.0
Mean: -0.7 -0.6 13.7 C.1 30.0 73 0.4 1.7 61.0 Met: 1.2
0.9 15.9
C.4 32.5 57 0.6 2.6 94.0 Clo: C.2 33.0 53 0.9 2.5 91.0 Mean Out Temp: C.3 34.5 51 1.0 2.9 99.0
Mean: 0.5 2.0 72.7 Met: 1.2 Clo: 0.6 Mean Out Temp: 26.3
Adaptive method in EN-15251
The adaptive comfort was calculated using CBE tool to generate adaptive charts in compliance with EN-15251 Standard. Figure 3 shows the adaptive comfort range for both cities. The comfort zone is defined between 22 and 26°C for Quito and 25.5 and 30.3°C for Babahoyo. The measured temperatures were plotted against the adaptive charts for each region. In Quito the inside temperature is always below limits indicating occupants always feel cold, while in Babahoyo the indoor conditions are within comfort limits during morning hours.
Thermal sensation votes:
Figure 4 shows the TSV distribution in each classroom; the bold lines represent the average vote, the boxes the range of the majority of votes, and the vertical lines the total range of votes.

The MTSVs for Quito were -1.28 (cold) in ASHRAE scale and -0.63 (comfortably cold) in Bedford scale, showing that people voting on cold thermal sensations still evaluated them as comfortable. For Babahoyo the values were 0.67 (slightly warm) and 0.44 (comfortably warm), reflecting that people voting on warm thermal sensations evaluated them as less severe in Bedford scale.
Neutral temperature and thermal comfort range:
Neutral temperatures were calculated using linear regressions of the MTSV against indoor temperatures. An ONEWAY ANOVA with Turkey-b test were used to analyse if the data had a significant variance between the MTSV that could be attributed to temperature. The equations relating TSV and temperature are:
𝑀𝑇𝑆𝑉 = 0.1626𝑇𝑎 − 3.7032 Equation 1 – Linear regression TSV Bedford Quito
𝑀𝑇𝑆𝑉 = 0.1626𝑇𝑎 − 4.5496 Equation 2 - Linear regression TSV Bedford in Babahoyo
The neutral temperatures are those at which the MTSV is equal to zero. Using Equations 1 and 2 the neutral temperature are 22.30°C and 27.9°C respectively. Since for Quito, only three classrooms were involved, the comfort range was calculated using equation (1) to determine the temperatures at which the MTSV were +-0.5 (90% acceptability). The comfort range for Quito is 19.7°C to 25.8°C. In Babahoyo it was calculated using a fitted quadratic equation between the percentage of acceptability and the indoor temperature. The intersections between the quadratic regression and the 90% acceptability axes gave a comfort range of 25.4°C to 32.2°C.
Figure 4. Adaptive Comfort charts for both UEMs
Figure 3. Thermal sensation votes for both UEMs

Preferred temperature:
Zomorodian (Zomorodian, et al., 2016) found that the preferred temperature differs from the neutral on an average 1.5 to 4°C. To obtain the preferred temperature two probit regression lines were used relating the people voting for warmer sensations against the people voting for colder sensations. Figure 5 shows the probit regression analysis for Quito and Babahoyo.
In Quito, the preferred temperature is 22.7°C, equal to the neutral temperature; in Babahoyo the preferred temperature is 3.5°C lower than the neutral one showing students favour colder temperatures. Thermal sensation and preferences differ since in Quito, 65.8% of the students in thermal comfort voted for warmer temperatures and in Babahoyo 59.23% voted for cooler temperatures.
Thermal performance and the efficiency of architectural passive strategies:
The current school infrastructure in Quito has 70.6% of occupancy hours within comfort (19.7-25.8°C); while in Babahoyo, including the influence of ceiling fans, it has 67.8% of hours in comfort (25.4-32.2°C); by removing the fans, the percentage of hours in comfort drops to 63.8%. Zomorodian (Zomorodian & Nasrollahi, 2013) determined that the main architectural parameters influencing thermal performance are: infiltration rate, window to wall ratio, and orientation.
Infiltration rate:
In Quito infiltration is the major cause of coldness, by increasing the air tightness of the fabric to 0.5ach the percentage of hours in thermal comfort increases to 94.1%. Similar results were obtained in schools in Iran (Zomorodian & Nasrollahi, 2013) and Chile (Trebilcock, 2014).
In warm climates, a higher ventilation rate will result in greater heat transfer from the inside to the outside, thus cooling the space. Nonetheless, if the outside temperature is higher than the comfort zone it will increase the indoor temperature. In Babahoyo 4.0ach was calculated as the optimum rate. Figure 6 shows the impact of infiltration on thermal comfort on each UEM.
Orientation:
The optimum orientation was tested for the cardinal and ordinal directions. The results indicate that the best orientation for schools in Quito is with its main axis in North-South direction and the courtyard open to the south as to receive the highest amount of solar radiation; while in Babahoyo is with its central axis oriented opposite to the prevailing winds. The wind coming from the southwest cools down the classrooms, reaching 69.2% of occupancy hours in thermal comfort.
Figure 5. Probit regressions to determine Neutral temperatures

Window to wall ratio (WWR):
In Quito thermal comfort increase parallel to the increment in window’s area. A WWR in external facades of 65% and 15% WWR in internal façade got the best performance. The increment in glazing’s area makes the daylight factor increase an average of 1.7 points; therefore, the use of shading elements is recommended to control the intake of daylight.
The best results in Babahoyo were achieved with a WWR of 26% for outer façades and 15% for inner façades. By decreasing the original WWR from 34 to 26%, thermal comfort increases 1.9 points as solar radiation entering the space is limited.
Building fabric:
Thermal insulation is not used in the country and, as such, there are no regulations or recommendations on its use. Indoor thermal fluctuations are dependent on thermal mass and material densities. In Quito, the best thermal performance is obtained using 300mm thick medium density concrete blocks and by insulating all external walls; insulation improves thermal comfort on 1.8%.
In warm climates, the most efficient passive strategies were increasing the thermal mass to 677kg/m2 (4.3% improvement), using ventilated roofs to prevent heat absorption (1.2% increase), and to provide shading in the central courtyard area (2.5% improvement). Insulating the building is not recommended as it increases the air tightness of the building.
Recommendations for each climatic region:
As Quito has primordially a cold-temperate climate, reducing the uncontrolled intake of cold air becomes essential to improve thermal comfort. Aditionally, by increasing the window’s size and orienting them towards the sun spaces are heated passively. The combined approach improves thermal comfort to 95.2% of occupancy hours, representing an increment of 24.6% from the original design.
In warm climates ventilation is detrimental in controlling temperature, and as such, night time ventilation is recommended to expel the accumulated heat. Thermal comfort in Babahoyo increases from 63.8% of occupancy hours to 80.6% with the combined strategies. Table 2 shows the optimum values of each architectural parameter in both climates.
Table 2. Optimum architectural passive strategies
Strategy Optimum Value in Quito Optimum Value in Babahoyo
Infiltration rate 0.5 ach 4.0 ach – night time vent Orientation NS NW – SE WWR external facade 65% 26% WWR internal facade 15% 15% Windows openable area 30% external 90% external
Figure 6. Infiltration rate influence on thermal comfort
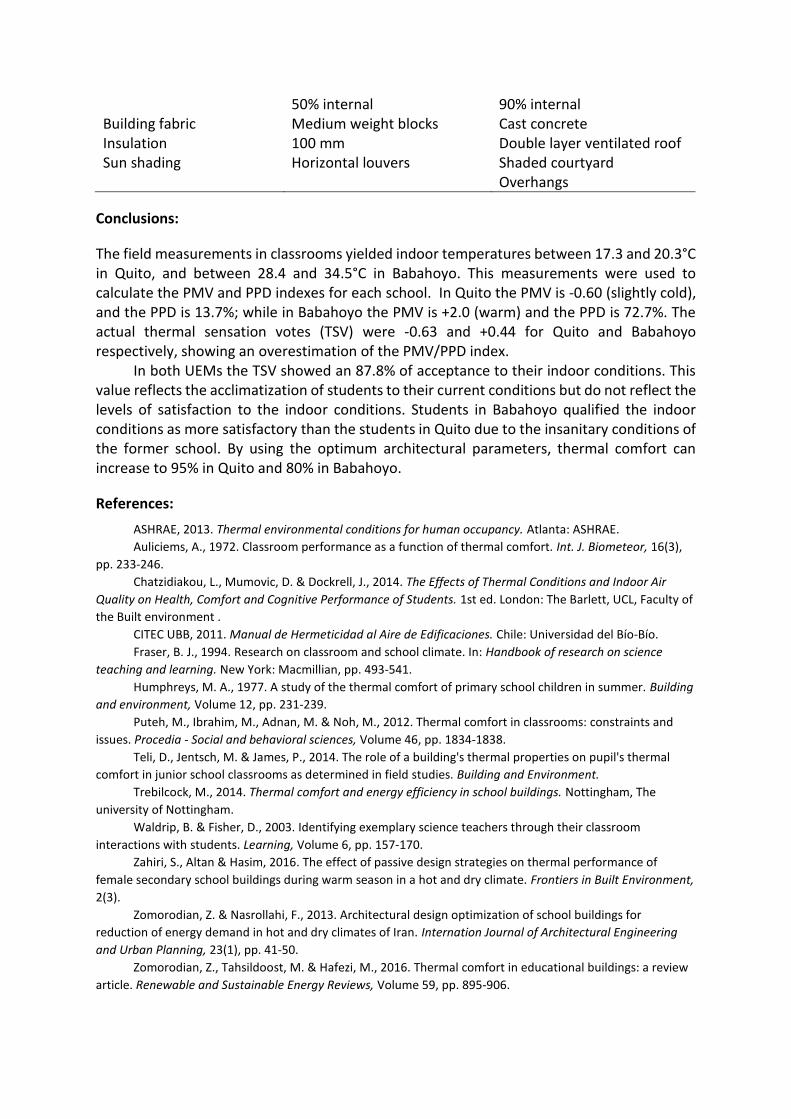
50% internal 90% internal Building fabric Medium weight blocks Cast concrete Insulation 100 mm Double layer ventilated roof Sun shading Horizontal louvers Shaded courtyard
Overhangs
Conclusions:
The field measurements in classrooms yielded indoor temperatures between 17.3 and 20.3°C in Quito, and between 28.4 and 34.5°C in Babahoyo. This measurements were used to calculate the PMV and PPD indexes for each school. In Quito the PMV is -0.60 (slightly cold), and the PPD is 13.7%; while in Babahoyo the PMV is +2.0 (warm) and the PPD is 72.7%. The actual thermal sensation votes (TSV) were -0.63 and +0.44 for Quito and Babahoyo respectively, showing an overestimation of the PMV/PPD index.
In both UEMs the TSV showed an 87.8% of acceptance to their indoor conditions. This value reflects the acclimatization of students to their current conditions but do not reflect the levels of satisfaction to the indoor conditions. Students in Babahoyo qualified the indoor conditions as more satisfactory than the students in Quito due to the insanitary conditions of the former school. By using the optimum architectural parameters, thermal comfort can increase to 95% in Quito and 80% in Babahoyo.
References:
ASHRAE, 2013. Thermal environmental conditions for human occupancy. Atlanta: ASHRAE.
Auliciems, A., 1972. Classroom performance as a function of thermal comfort. Int. J. Biometeor, 16(3),
pp. 233-246.
Chatzidiakou, L., Mumovic, D. & Dockrell, J., 2014. The Effects of Thermal Conditions and Indoor Air
Quality on Health, Comfort and Cognitive Performance of Students. 1st ed. London: The Barlett, UCL, Faculty of
the Built environment .
CITEC UBB, 2011. Manual de Hermeticidad al Aire de Edificaciones. Chile: Universidad del Bío-Bío.
Fraser, B. J., 1994. Research on classroom and school climate. In: Handbook of research on science
teaching and learning. New York: Macmillian, pp. 493-541.
Humphreys, M. A., 1977. A study of the thermal comfort of primary school children in summer. Building
and environment, Volume 12, pp. 231-239.
Puteh, M., Ibrahim, M., Adnan, M. & Noh, M., 2012. Thermal comfort in classrooms: constraints and
issues. Procedia - Social and behavioral sciences, Volume 46, pp. 1834-1838.
Teli, D., Jentsch, M. & James, P., 2014. The role of a building's thermal properties on pupil's thermal
comfort in junior school classrooms as determined in field studies. Building and Environment.
Trebilcock, M., 2014. Thermal comfort and energy efficiency in school buildings. Nottingham, The
university of Nottingham.
Waldrip, B. & Fisher, D., 2003. Identifying exemplary science teachers through their classroom
interactions with students. Learning, Volume 6, pp. 157-170.
Zahiri, S., Altan & Hasim, 2016. The effect of passive design strategies on thermal performance of
female secondary school buildings during warm season in a hot and dry climate. Frontiers in Built Environment,
2(3).
Zomorodian, Z. & Nasrollahi, F., 2013. Architectural design optimization of school buildings for
reduction of energy demand in hot and dry climates of Iran. Internation Journal of Architectural Engineering
and Urban Planning, 23(1), pp. 41-50.
Zomorodian, Z., Tahsildoost, M. & Hafezi, M., 2016. Thermal comfort in educational buildings: a review
article. Renewable and Sustainable Energy Reviews, Volume 59, pp. 895-906.